Article

The Effect of Air, Ar and O2 Plasmas on the Electrical Resistivity and Hand-Feel Properties of Polyester/Cotton Blend Fabric

1
Ethiopian Institute of Textile and Fashion Technology [EiTEX], Bahir Dar University, Bahir Dar 644, Ethiopia
2
Material and Process Engineering [MPE], Albstadt-Sigmaringen University, 72458 Albstadt, Germany
*
Author to whom correspondence should be addressed.
Fibers 2020, 8(2), 17; https://doi.org/10.3390/fib8020017
Submission received: 20 December 2019 / Revised: 12 February 2020 / Accepted: 13 February 2020 / Published: 24 February 2020

Abstract

:
The conventional chemical-based antistatic agents possess ecological and technological drawbacks, such as altering the bulk characteristics, flammability, and toxicity, but not the cost effective process. Recently, using conductive metal fibers in the woven structure also affects the mechanical properties of the fabric. To overcome these challenges, plasma treatment needs to be quite an effective method. In this study, polyester/cotton (P/C), 65/35%, blend fabric was treated in a vacuum-plasma-chamber using air, argon and oxygen. The electro-physical property of the samples were evaluated by measuring the surface and volume resistivities (ρs, ρv) using textile electrode Tera Ohmmeter (TO-3). Textile Softness Analyzer (TSA) has also been used to investigate hand-feel properties of the fabric. After treatment, the results revealed that the surface resistivity was reduced by 35.5% in the case of O2, 27.3% for air and 18.4% for Ar, and also volume resistivity was decreased by 40.9%, 20.3% and 20% after O2, air and Ar-plasma, respectively, whereas hand-feel properties are slightly affected at a higher power level and treatment time. Out of the three gases, oxygen had less effect on hand-feel properties and highly reduced the fabric resistivity. In addition, the SEM images showed that the surface morphology of the fibers changed to being rough due to the plasma.

1. Introduction

The polyester/cotton (P/C) blend, in the textile industry, covers 58.45% of market share worldwide [1]. These blends have attracted more attention in home, furnishing and apparel applications due to their user friendly performance, aesthetic value and low cost [2]. Nowadays, the demand for P/C blend fabric in the apparel industry has increased significantly due to the desired properties of functional performance and aesthetic value, which are more difficult to obtain altogether in both polyester (PET) or cotton fabric products. Despite the outstanding P/C fabric properties, its PET surface hydrophobic character hinders its comfort properties when it is used as an apparel fabric [3]. As is already known, the hydrophobic nature of PET fiber has the potential to develop electrical resistivity in the fabric, which is due to the tendency of synthetic fibers to static electrification [4]. The build-up static charge, under low humidity conditions, does not dissipate for a long time because of the low conductivity of textile fibers. Consequently, accumulated static charges adversely affect the comfort properties of the garments when it rubs against the wearer’s body, and at the same time, dust particles are more attracted towards the fabric surfaces. The term “resistivity (ρ)” refers to the phenomena associated with the incapacity of a material to conduct an electrical current; it is an intrinsic property of a material. Resistivity is used as an indicator of the static propensity of a textile fabric [5,6,7]. The relationship between the fabric resistivity and its potential to build-up electrostatic charges is not always a clear-cut point; nevertheless, it is widely agreed that the most static-electrical problems emerging from the use of textile substrate can be reduced to manageable levels if the surface resistivity (ρs) and the volume resistivity (ρv) are dropped to 1011–1012 Ω/square and 107–108 Ω⋅m, respectively. However, PET fibers are insulators and have a volume resistivity of 1014 Ω⋅m [8].
Thus, the surface treatment of P/C blend fabric is necessary to reduce its electrical resistivity and to enhance comfort properties, while retaining its outstanding fabric properties. In that regard, several techniques have been applied to fabric surface modification, focusing on the improvement of its static charge dissipation or to eliminate the generation of static electricity. These includes introducing conductive meatal/organic fibers into woven structures [9], radioactive static eliminators [10] and antistatic agents [11]. However, the conventional chemical-based antistatic agents have ecological and technological drawbacks such as altering the bulk characteristics, toxicity and not being cost effective [12]. In addition, introducing conductive metal fibers into the woven structure also affects the mechanical properties of the fabric. To overcome these challenges, plasma treatment has to be quite an effective method [13]. Plasma technology offers numerous advantages over other conventional wet-chemical surface modification techniques. It does not need the consumption of water and chemicals, and therefore is a more ecological and economical process. Moreover, plasma treatment has a unique potential to modify the outermost surface of the fibers, limited to several nanometers in depth, by retaining the bulk properties of a material; it has also been widely used in the area of textile surface modification. In particular, the low-pressure plasma system is usually between 0.01 and 10 mbar, which is more preferred due to the high concentration of reactive species, the uniformity of a large surface area, high controllability, and the superior chemical selectivity and reproducibility of the results [14,15].
Previously, some researchers have used antistatic agents for grafting or coating along with plasma technology on PET [4,16,17,18,19] and cotton [4,20,21] fibers to reduce their static charge generation. Additionally, a few studies have been done on PET fibers by using atmospheric pressure plasma alone [12,22]. However, in regards to their static properties by applying plasma treatment, the P/C blend fibers have not been investigated yet. In addition, the fabric hand properties of the plasma treated fabric surface have not been explored to the best of our knowledge so far.
In this study, low-pressure plasma (LPP) treatment has been used to enhance the antistatic properties of P/C blend fabric by using air, Ar and O2 gases without the use of antistatic chemicals. The change in surface and volume resistivity (ρs, ρv), with respect to plasma power and exposure time, has been measured by the Tera Ohmmeter. The Textile Softness Analyzer (TSA) has also been used to investigate the hand-feel (HF) properties of P/C blend fabric, including softness, stiffness and smoothness.

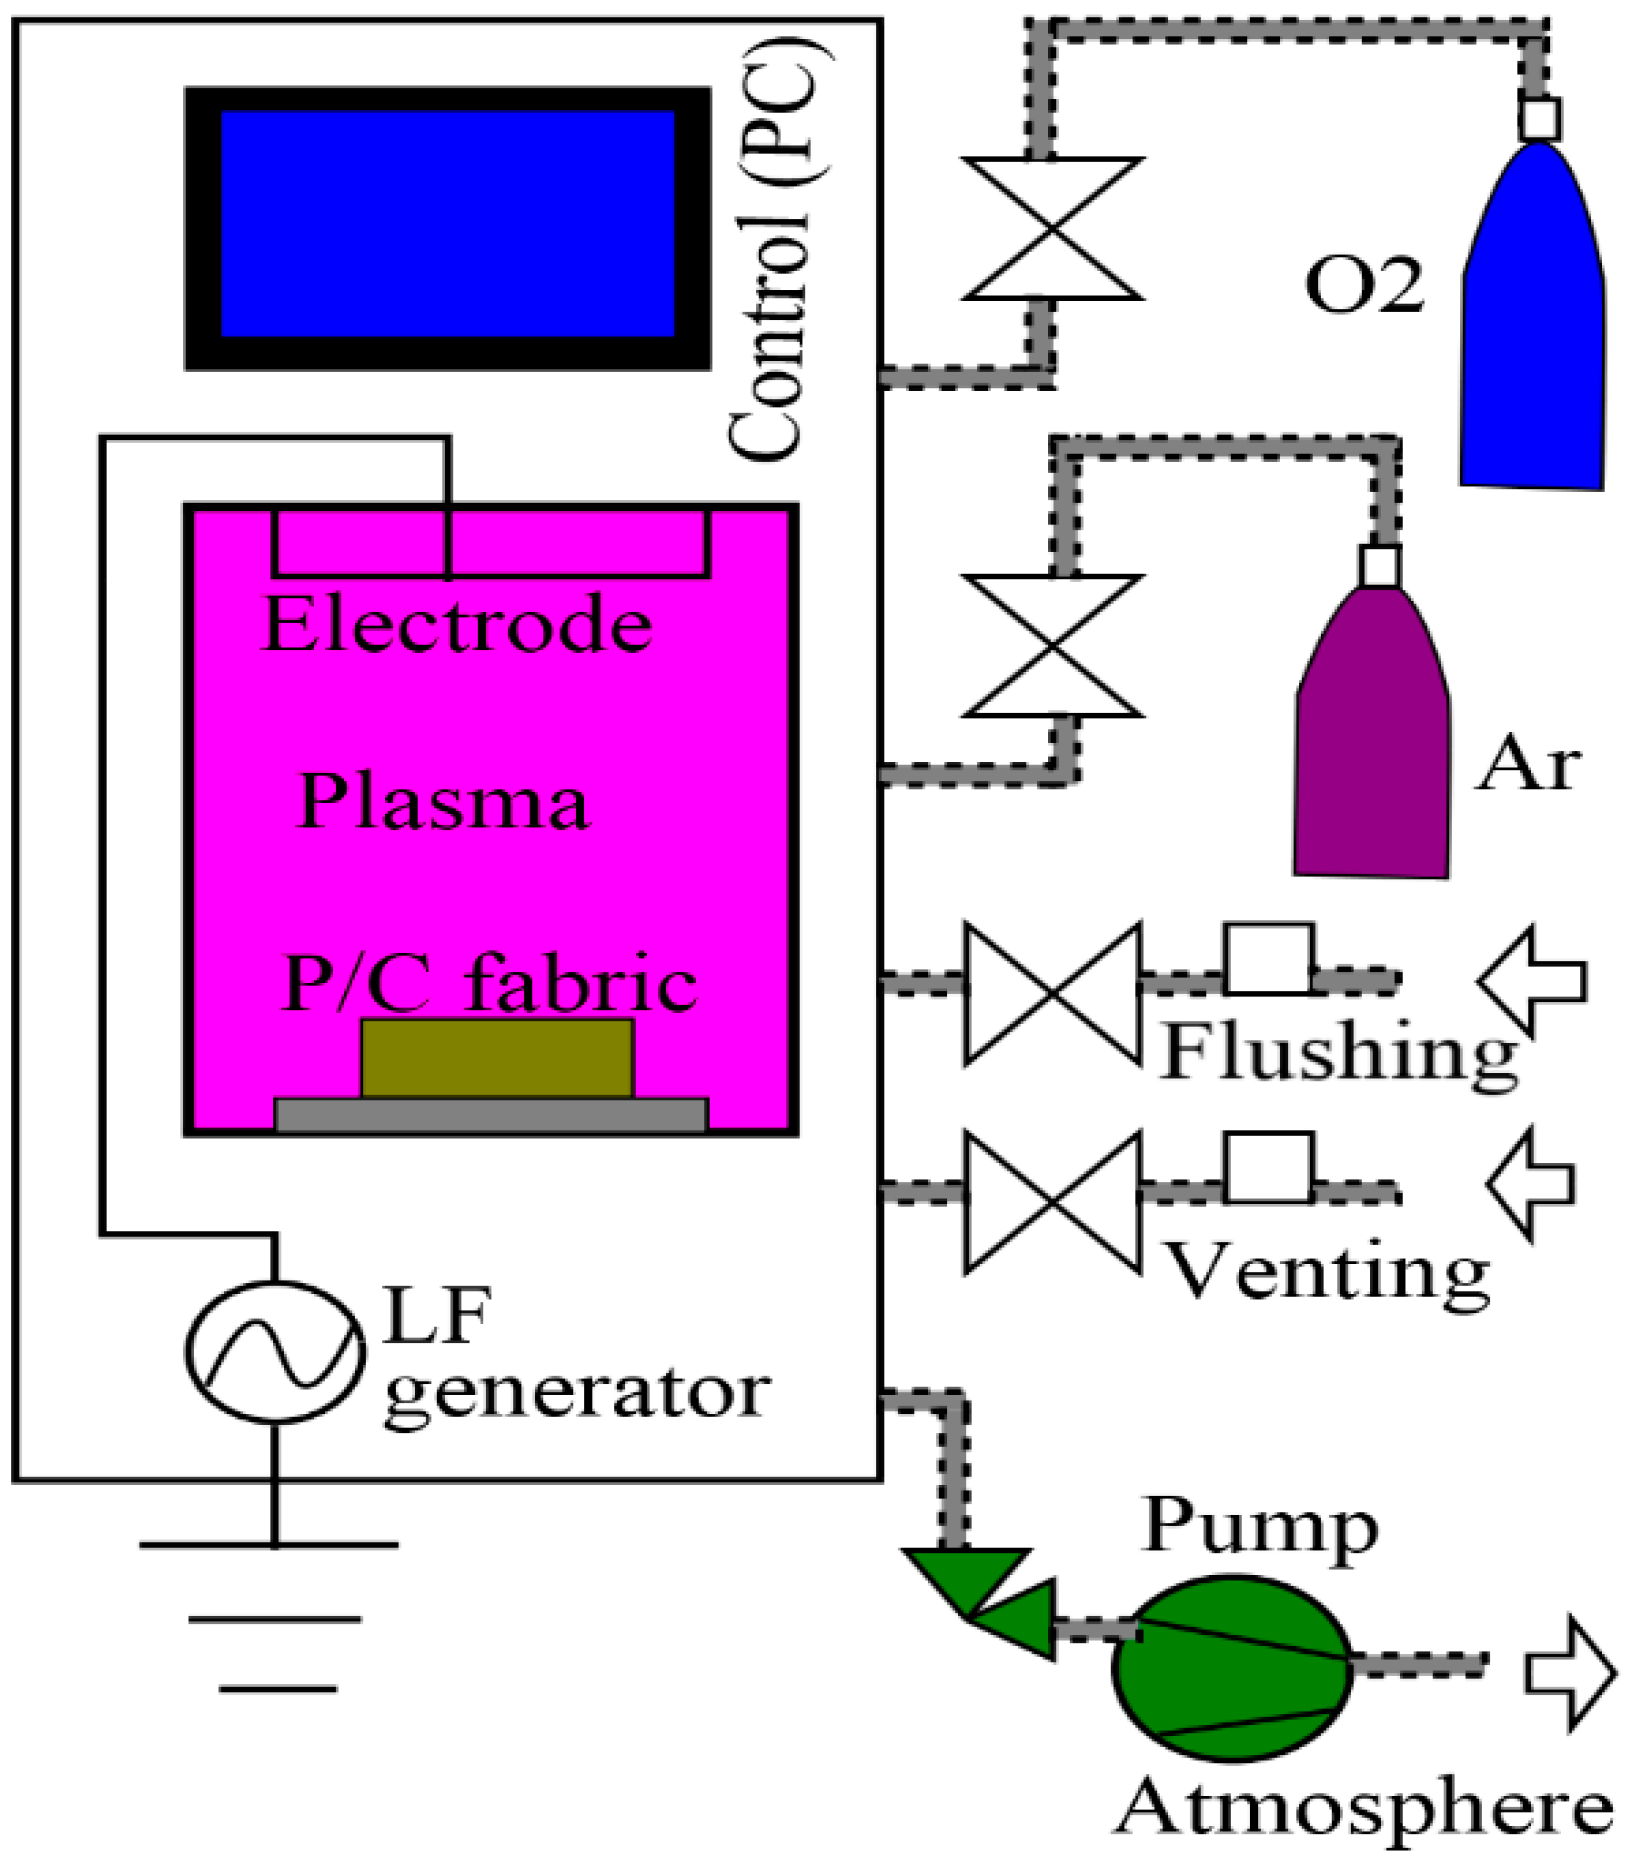
2. Materials and Methods

In this research, a plain weave 65% PET and 35% cotton blend fabric, ready to make shirt cloth, 115 g/m2 in weight and 0.22 mm in height with 144 ends per inch (44 Ne) and 72 picks per inch (72 Ne) was used. The samples were cut into the size of 11 × 11 cm2 for plasma treatment, according to the dimension of Tera Ohmmeter and TSA. The fabric samples were conditioned under standard environmental condition (ASTM D 1776) of 65 ± 2% RH and 21 ± 1 °C for 24 h prior to plasma treatment, resistivity and fabric handle properties measurement [23]. Air, Ar and O2 were used as plasma gases.
LPP laboratory system (Tetra 30, Diener Electronic GmbH + Co. KG, Germany) has been used to treat the P/C blend fabric [24]. It consisted of a rectangular vacuum chamber (approx. 34 L) with a movable sample holder floor tray over the ground electrode and capacitive coupled system, which was driven by low frequency (LF) power supply, typically at 40 kHz (0–1000 W capacity), as shown in Figure 1. In addition, a vacuum pump and suction from Leybold (approx. 80 m3/h) were parts of the plasma system. Air, Ar and O2 were used as plasma gases separately. The duration of treatment time (5, 10 and 15 min) and operating power (200, 500 and 800 W) were varied in order to investigate the time and power effect of the plasma treatment on the electrical resistivity and hand-feel properties of the P/C blend fabric. The plasma gases were introduced into the vacuum chamber at a working pressure of 0.3 mbar (the base pressure is 0.005 mbar) and at a constant flow rate of 60 sccm (standard cubic centimeters per minute), as well as at room temperature. At the end of each plasma process, air-flushing and venting was done for 20 and 30 s, respectively. All plasma process parameters were fully PC controlled.
Tera-Ohmmeter, with a guard ring Textile Electrode (TO-3 TE 50, H. -P. Fischer Elektronik GmbH and Co. Industrie und Labortechnik KG, Germany), was used to measure the surface and volume resistivities of the plasma treated and untreated P/C blend fabrics according to AATCC TM76 test standard, as shown below in Figure 2 [25].
Due to the presence of a concentric ring electrode, the resistivity of specimens was measured in both the length and width directions simultaneously. During the surface resistivity measurement, the insulating disk was placed between the ground base plate and the specimen. Finally, the ring electrode and inner electrode were positioned on the specimen, respectively, whereas in the volume resistivity measurement, the insulating disk was not needed. The resistivity was measured at 60 Sec electrification time by applying 100 V. For each set of experiments, the mean of the three test specimens were taken [26].
Softness, smoothness/roughness, stiffness and overall HF value of the plasma treated and untreated P/C fabric samples were measured by TSA (Emtec Electronic GmbH, Germany) [27]. TSA was an objective measuring device and it was capable of collecting, simultaneously, all relevant parameters that had an influence on the haptic characteristics of P/C blend fabrics. The haptic property was evaluated by measuring the sonic waves produced by rotating a set of blades on the clamped blend fabric surfaces, and at the same time, applying a constant 100 mN force on the surface. Thus, the vibration was captured by the microphone and recorded within a few seconds. Then, the blade applied 600 mN force, removed it, and again applied a 600 mN force using a constant loading rate. After this process, all variables and their values were accessible by Software “EMS Emtec Measurement system”, which was interfaced with TSA. In the resulting sonic spectrum, the fabric smoothness value (TS750) was given at 750 Hz signal peak by measuring the fabric vibration, as seen in Figure 3a, while the softness value (TS7) was obtained at 6500 Hz through the vibration of the rotating blade itself, as depicted in Figure 3b. The amplitude of acoustic signal peaks was measured in the dBV unit. In addition, the stiffness value (D) was determined by the measurement of the sample deformation under a 600 mN force, as shown in Figure 3c. A combination of these parameters, with the blend fabric weight, thickness and a number of plies, was used to calculate the overall HF value (HF = f (TS7, TS750, D, weight, thickness, number of plies)). In this experiment, only the bottom (back) side of the fabric sample was investigated and the average of the three specimens was taken from one set of tests and reported.
The surface chemical analysis of the P/C blend fabric samples was evaluated by attenuated total reflection Fourier transform infrared spectroscopy (ATR-FTIR). The ATR-FTIR analysis was carried out with Thermo Scientific Nicolet iS10 FTIR spectrometer (Thermo Fisher Scientific Inc., Madison, WI, USA) powered by the OMNICTM spectraTM Software. It also contains a deuterated triglycine sulfate (DTGS) detector and KBr beamsplitter. The spectra were collected using 16 scans for each sample with a 4 cm−1 resolution between 650 and 4000 cm−1.
The surface morphology of the untreated and plasma-treated P/C blend fabrics were studied using SEM (Zeiss Sigma VP, Carl Zeiss Microscopy, Germany). The samples were coated (2–3 nm) with gold for 12 min to obtain conductive fiber surfaces before the analysis [28]. X-Max EDS system (Oxford Instruments, Oxford, UK) analysis of these samples was conducted in Field Emission Scanning Electron Microscopy (FESEM) at the voltage of 5 kV and a magnification of 10,000X for single polyester or cotton fiber surfaces in the P/C blend fabric.

3. Results and Discussion

3.1. Surface and Volume Resistivity (ρs, ρv) Behavior of Plasma-treated P/C Blend Fabric

The surface resistivity (ρs) is the resistance to leakage current along the surface of an insulating material, while the volume resistivity (ρv) is the resistance to the leakage current through the whole body of an insulating material under standard conditions. The electrical resistivity of any dielectric material mainly depends on the applied voltage level, relative humidity, temperature and electrification time. Insulation resistivity is a function of both the surface and volume resistivity of the substrate. The ρs changes almost instantaneously with the change in relative humidity, while ρv is particularly sensitive to temperature changes. In this study, both plasma-treated and untreated P/C blend fabrics were conditioned at 65 ± 2% RH and 21 ± 2 °C for 24 h prior to resistivity measurement. The ρs and ρv measurement were carried out under above-mentioned standard conditions at 60 Sec electrification time by applying 100 V on the backside of the blend fabric. This fabric side was directed towards the wearer’s body.
P/C blend fabric with plasma treatment would develop low electrical resistivity. During the plasma process, a mixture of electrons, free radicals, excited species, photons and ions can interact, either chemically or physically, with the P/C blend fabric surface. Consequently, the surface may incorporate new chemical groups and/or etch away the surface materials. In this experiment, several factors that remained constant included: set pressure of 0.3 mbar, gas flow rate of 60 sccm and a temperature of 23 ± 2 °C. The selection of these parameters was based on previous experience in order to obtain the optimum result [29].

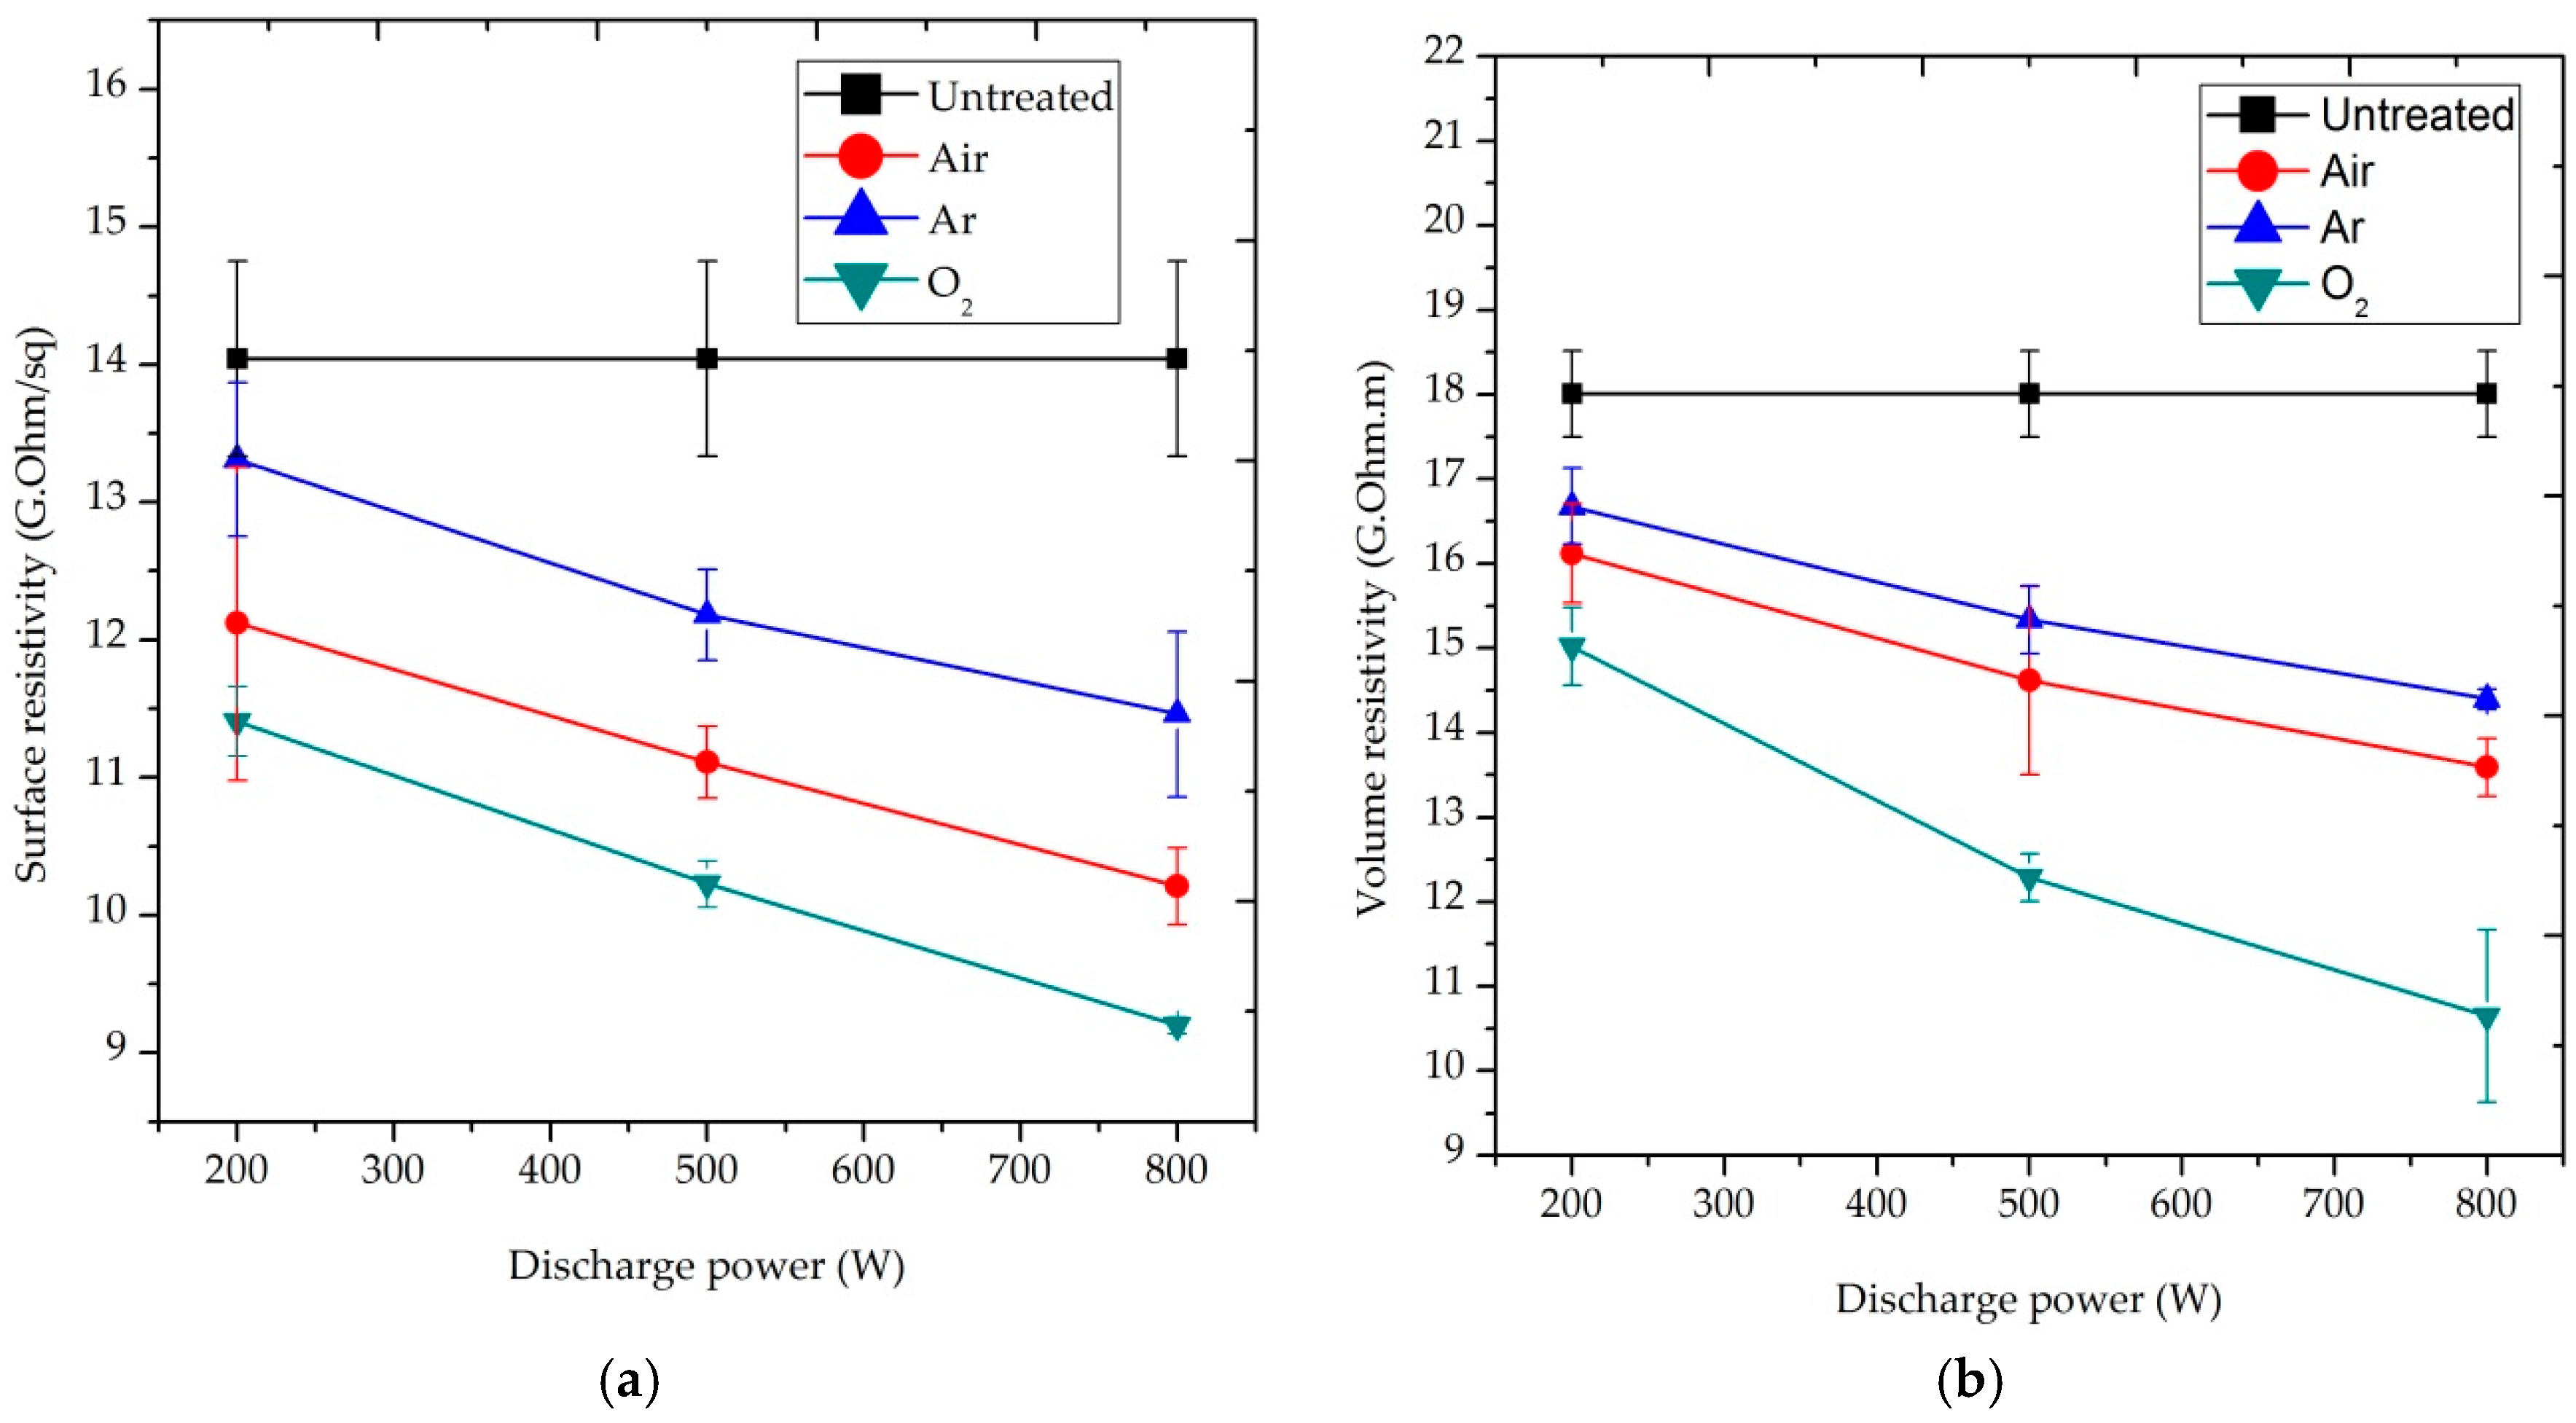
3.1.1. Effect of the Discharge Power

Figure 4 shows the effect of discharge power on the ρs and ρv of the blend fabric after 10 min plasma treatment, respectively. The discharge power was varied from 200 to 800 W during plasma treatment. The mean of three measurements was taken for each datum in the figure. It should be noticed that the lower the ρs and ρv, the lower the static charge of the sample. However, a test result showed that the surface and volume resistivity of untreated P/C blend fabrics developed 14.04 GΩ/sq and 18.01 GΩ⋅m, respectively, which inferred that it would adversely affect the wearer’s body when using the fabric as a garment. Increased discharge power with the decreased trend of resistivity was observed in Figure 4. Different active species from the air, Ar and O2 plasma bombarded and/or reacted with the blend fabric surface by activation, etching, sputtering and cleaning to change its surface properties. As a result of the interaction, carboxyl and hydroxyl groups would be formed. These hydrophilic functional groups would promote the electrical conductivity of the blend fabric. During the treatment process, some low molecular organic materials would be removed by plasma, resulting in an eroded feature. The rougher surface would offer space for water molecules, which is conducive to dissipate the build-up static charge in the blend fabric [16].

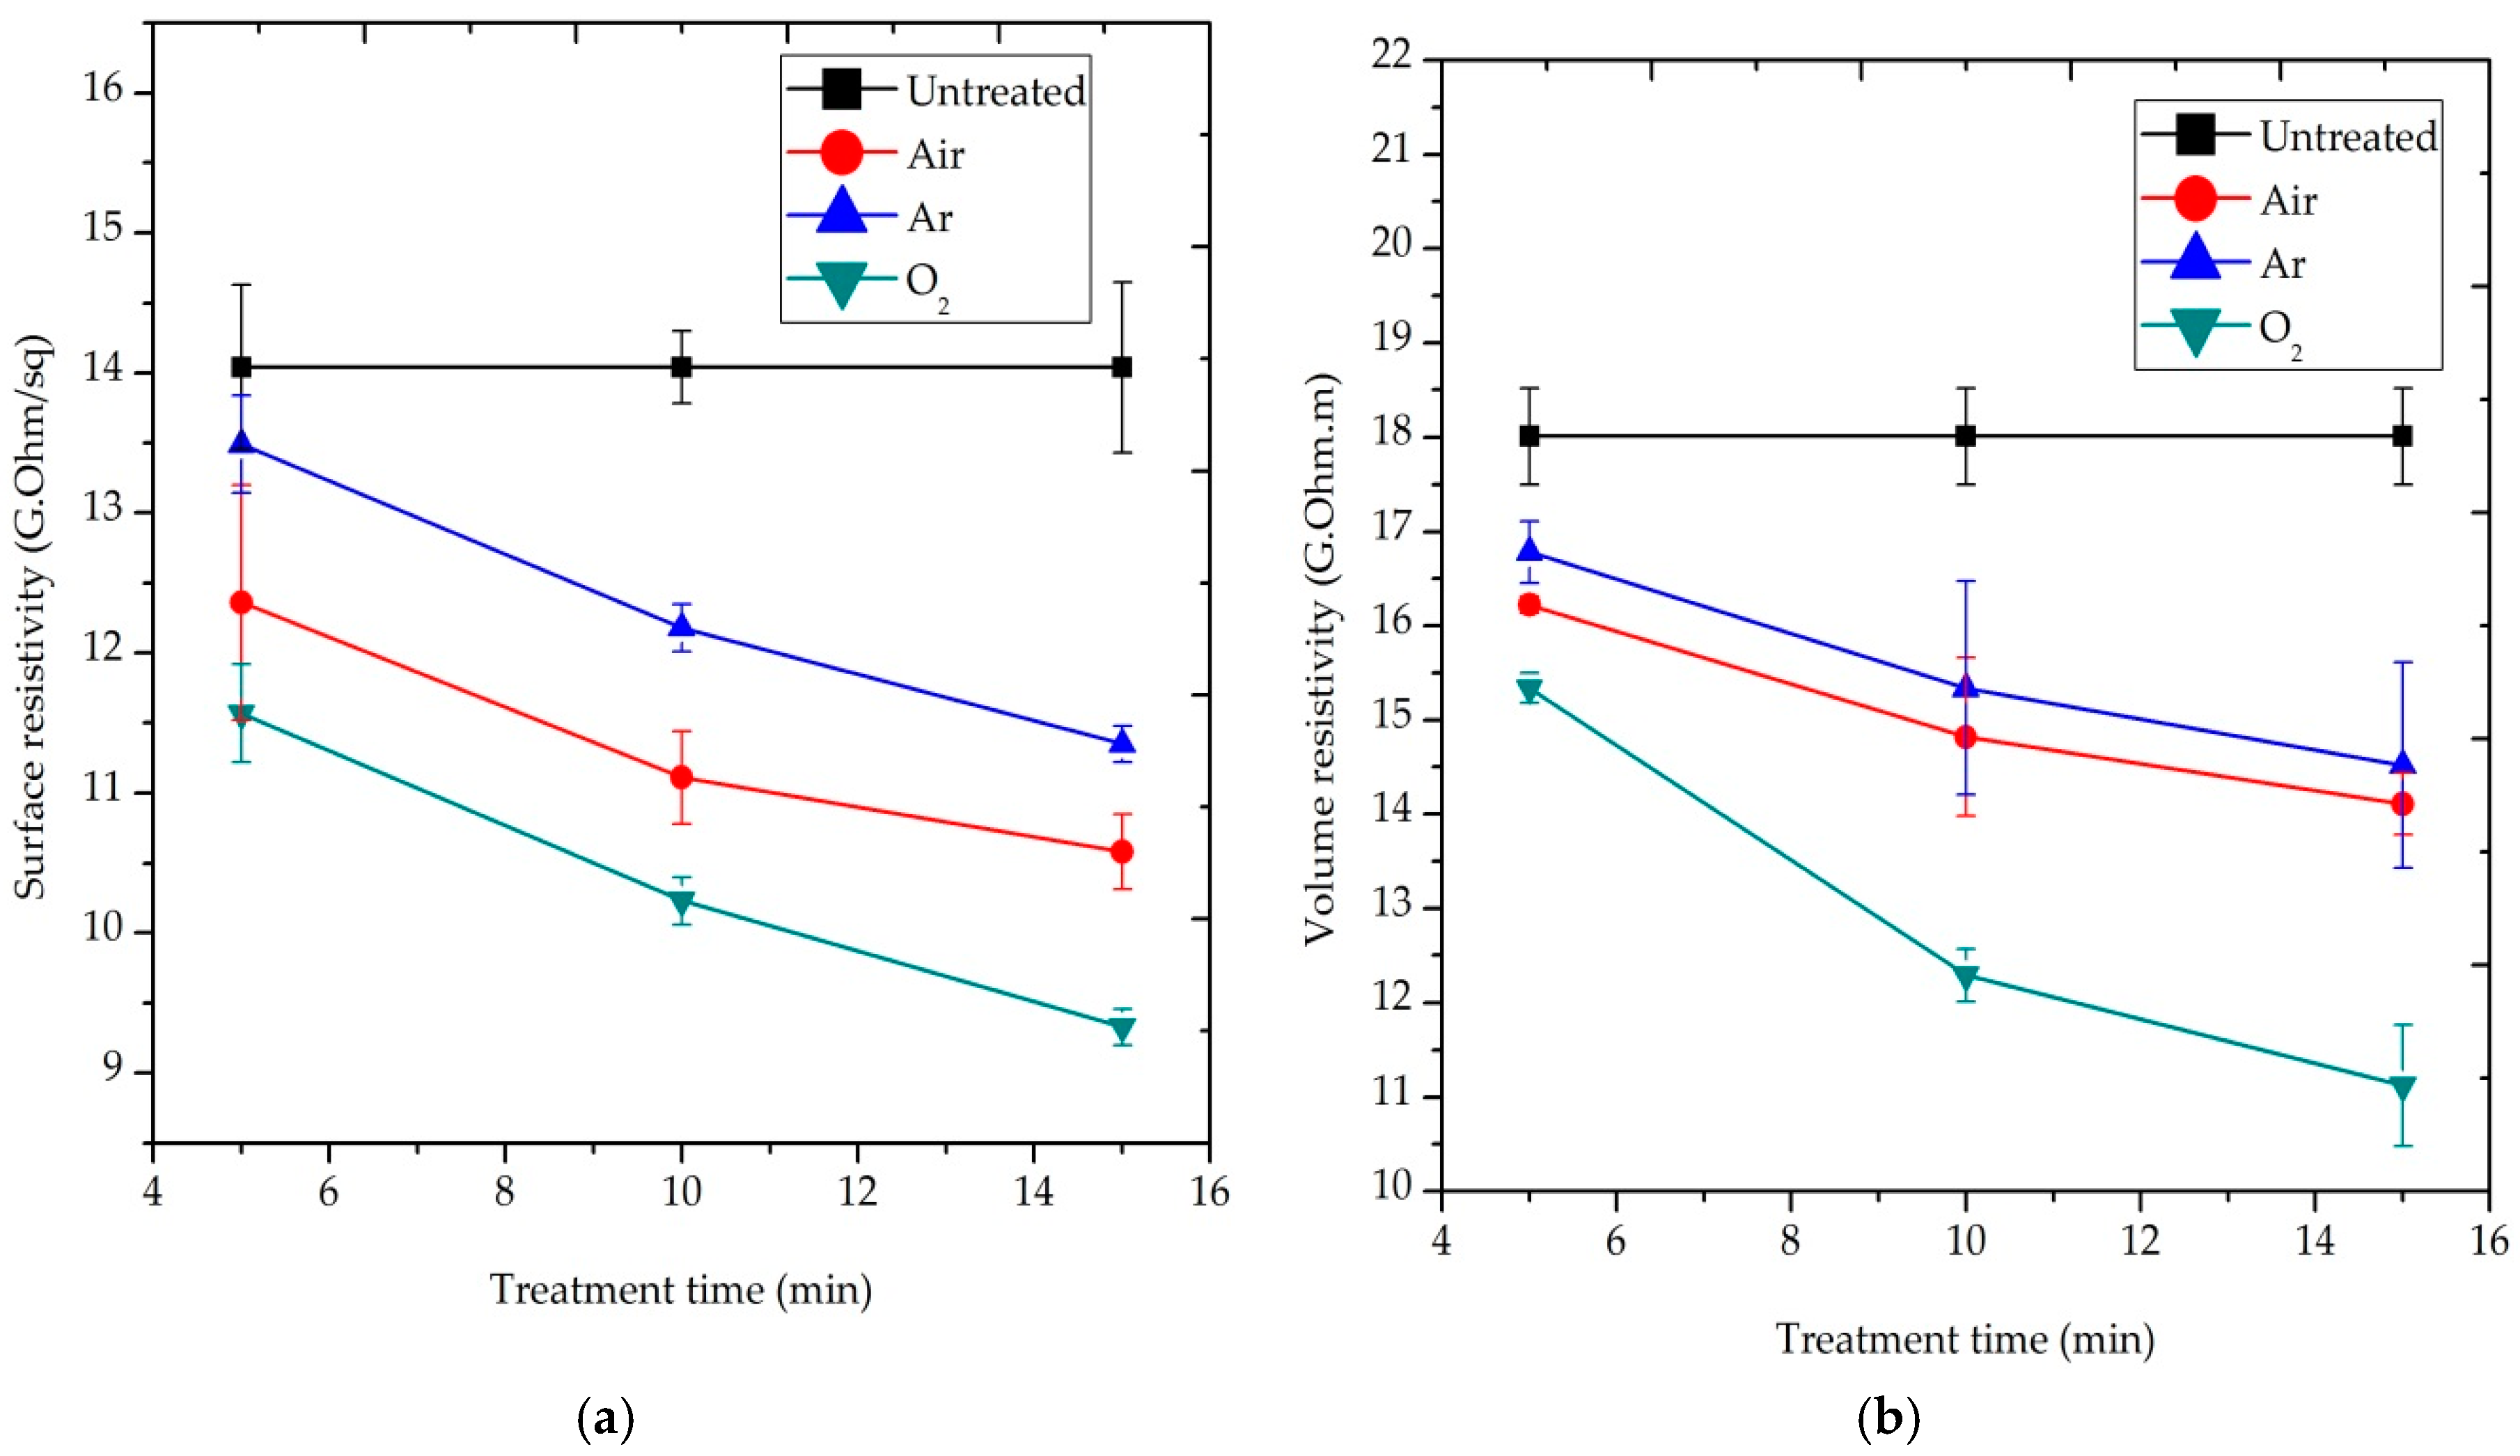
3.1.2. Effect of the Treatment Time

Figure 5 presents the effect of treatment time on the surface and volume resistivity of the blend fabric at 500 W of discharge power, respectively. The plasma exposure time varied from 5 to 15 min in the experiment. The data point in the figure was the average of the three readings. It is noticeable that the less electrical resistivity, the better electrical conductivity of the fabric. This implied that the hazard potential of the blend fabric would be lowered. The wearer’s body would also be more comfortable. Surface and volume resistivity decreased as the treatment time increased. This is due to the formation of polar groups by air and oxygen plasmas, as well as physical changes by argon, air and oxygen plasmas on the surface of blend fibers, which would affect the electrical resistivity. These effects would promote the adsorption of moisture on the fiber surface and reduce its resistivity [4].

3.1.3. Effect of the Types of Plasma Gases

As shown in Figure 4 and Figure 5, two reactive (air and O2) and one inert (Ar) gas were used for plasma treatment. Under a discharge power of 800 W and exposure time of 10 min, O2-plasma treated samples developed a ρs value of 9.2 GΩ/sq, compared to the 14.04 GΩ/sq of the untreated samples with a reduction of 35.5%. In addition, the ρs decreased significantly to 10.21 GΩ/sq for air-plasma and 11.46 GΩ/sq for Ar plasma-treated samples, resulting in a 27.3% and 18.4% reduction, accordingly, as depicted in Figure 4a. A similar effect is also observed after 15 min O2−, air and Ar-plasma treatment with a discharge power of 500 W, as shown in Figure 5a. The ρv of O2-plasma treated sample at 800 W highly reduced to 10.65 GΩ⋅m, compared to the 18.01 GΩ⋅m produced by untreated samples with a reduction of 40.9%. Air and Ar plasma treated samples also generated a ρv of 14.35 and 14.4 GΩ⋅m. These values correspond to a 20.3% and 20% reduction, respectively, as presented in Figure 4b. A similar effect is also noticed in 15 min O2, air and Ar-plasma with a discharge power of 500 W, as seen above in Figure 5b.

3.2. Hand-Feel Properties of Plasma-treated P/C Blend Fabric

Fabric hand properties, including stiffness, softness, smoothness and hand-feel (HF), are the fundamental quality parameters of clothing fabric. However, different treatment processes sometimes affect these properties. Here, plasma treated P/C blend fabric hand properties were evaluated by TSA after being conditioned for 24 h at 65 ± 2% RH and 21 ± 1 °C. During plasma treatment, an operating pressure of 0.3 mbar, gas flow rate of 60 sccm and a temperature of 23 ± 2 °C remained identical, while the discharge power and treatment time varied from 200 to 800 W and 5 to 15 min, respectively. Here, only the effect of discharge power was discussed, due to the similar effect of power and treatment time on the fabric hand properties. However, when comparing the two parameters, the effect of discharge power on the fabric hand was slightly higher than the treatment time. The mean of the three readings was taken on the back (bottom) side of the blend fabric for each datum in the figure. This was because this side of the fabric was directed towards the wearer’s body.

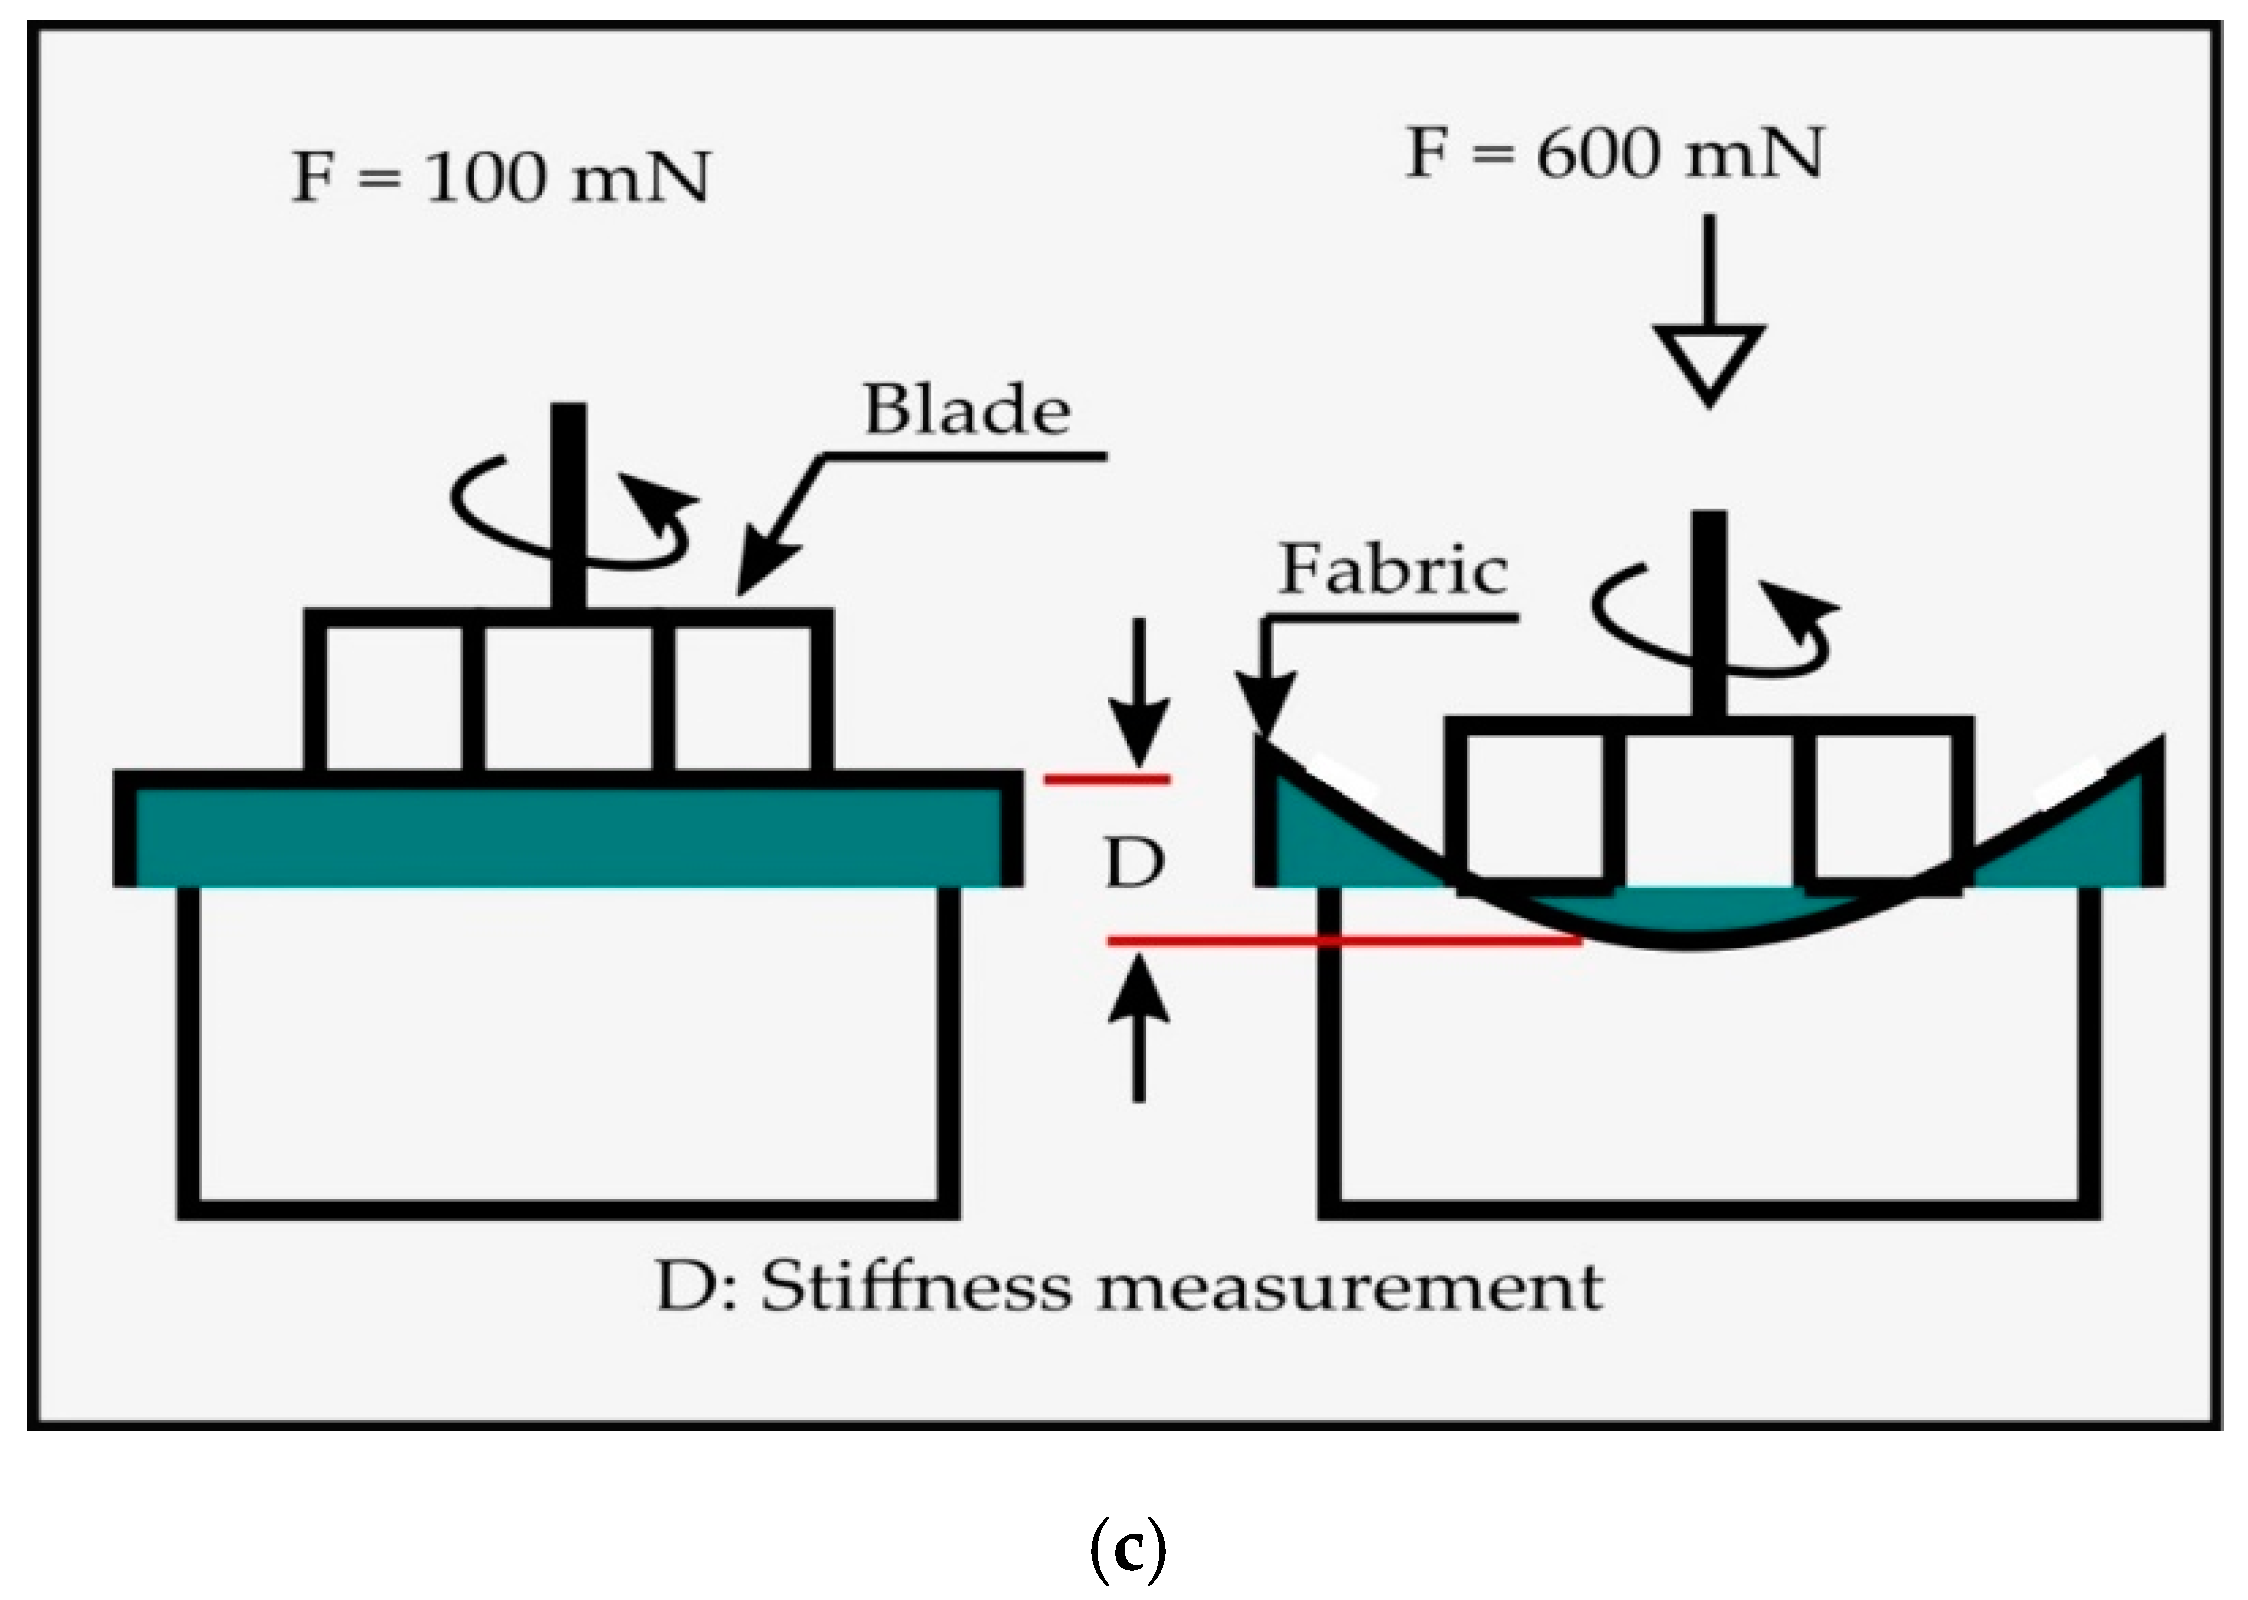
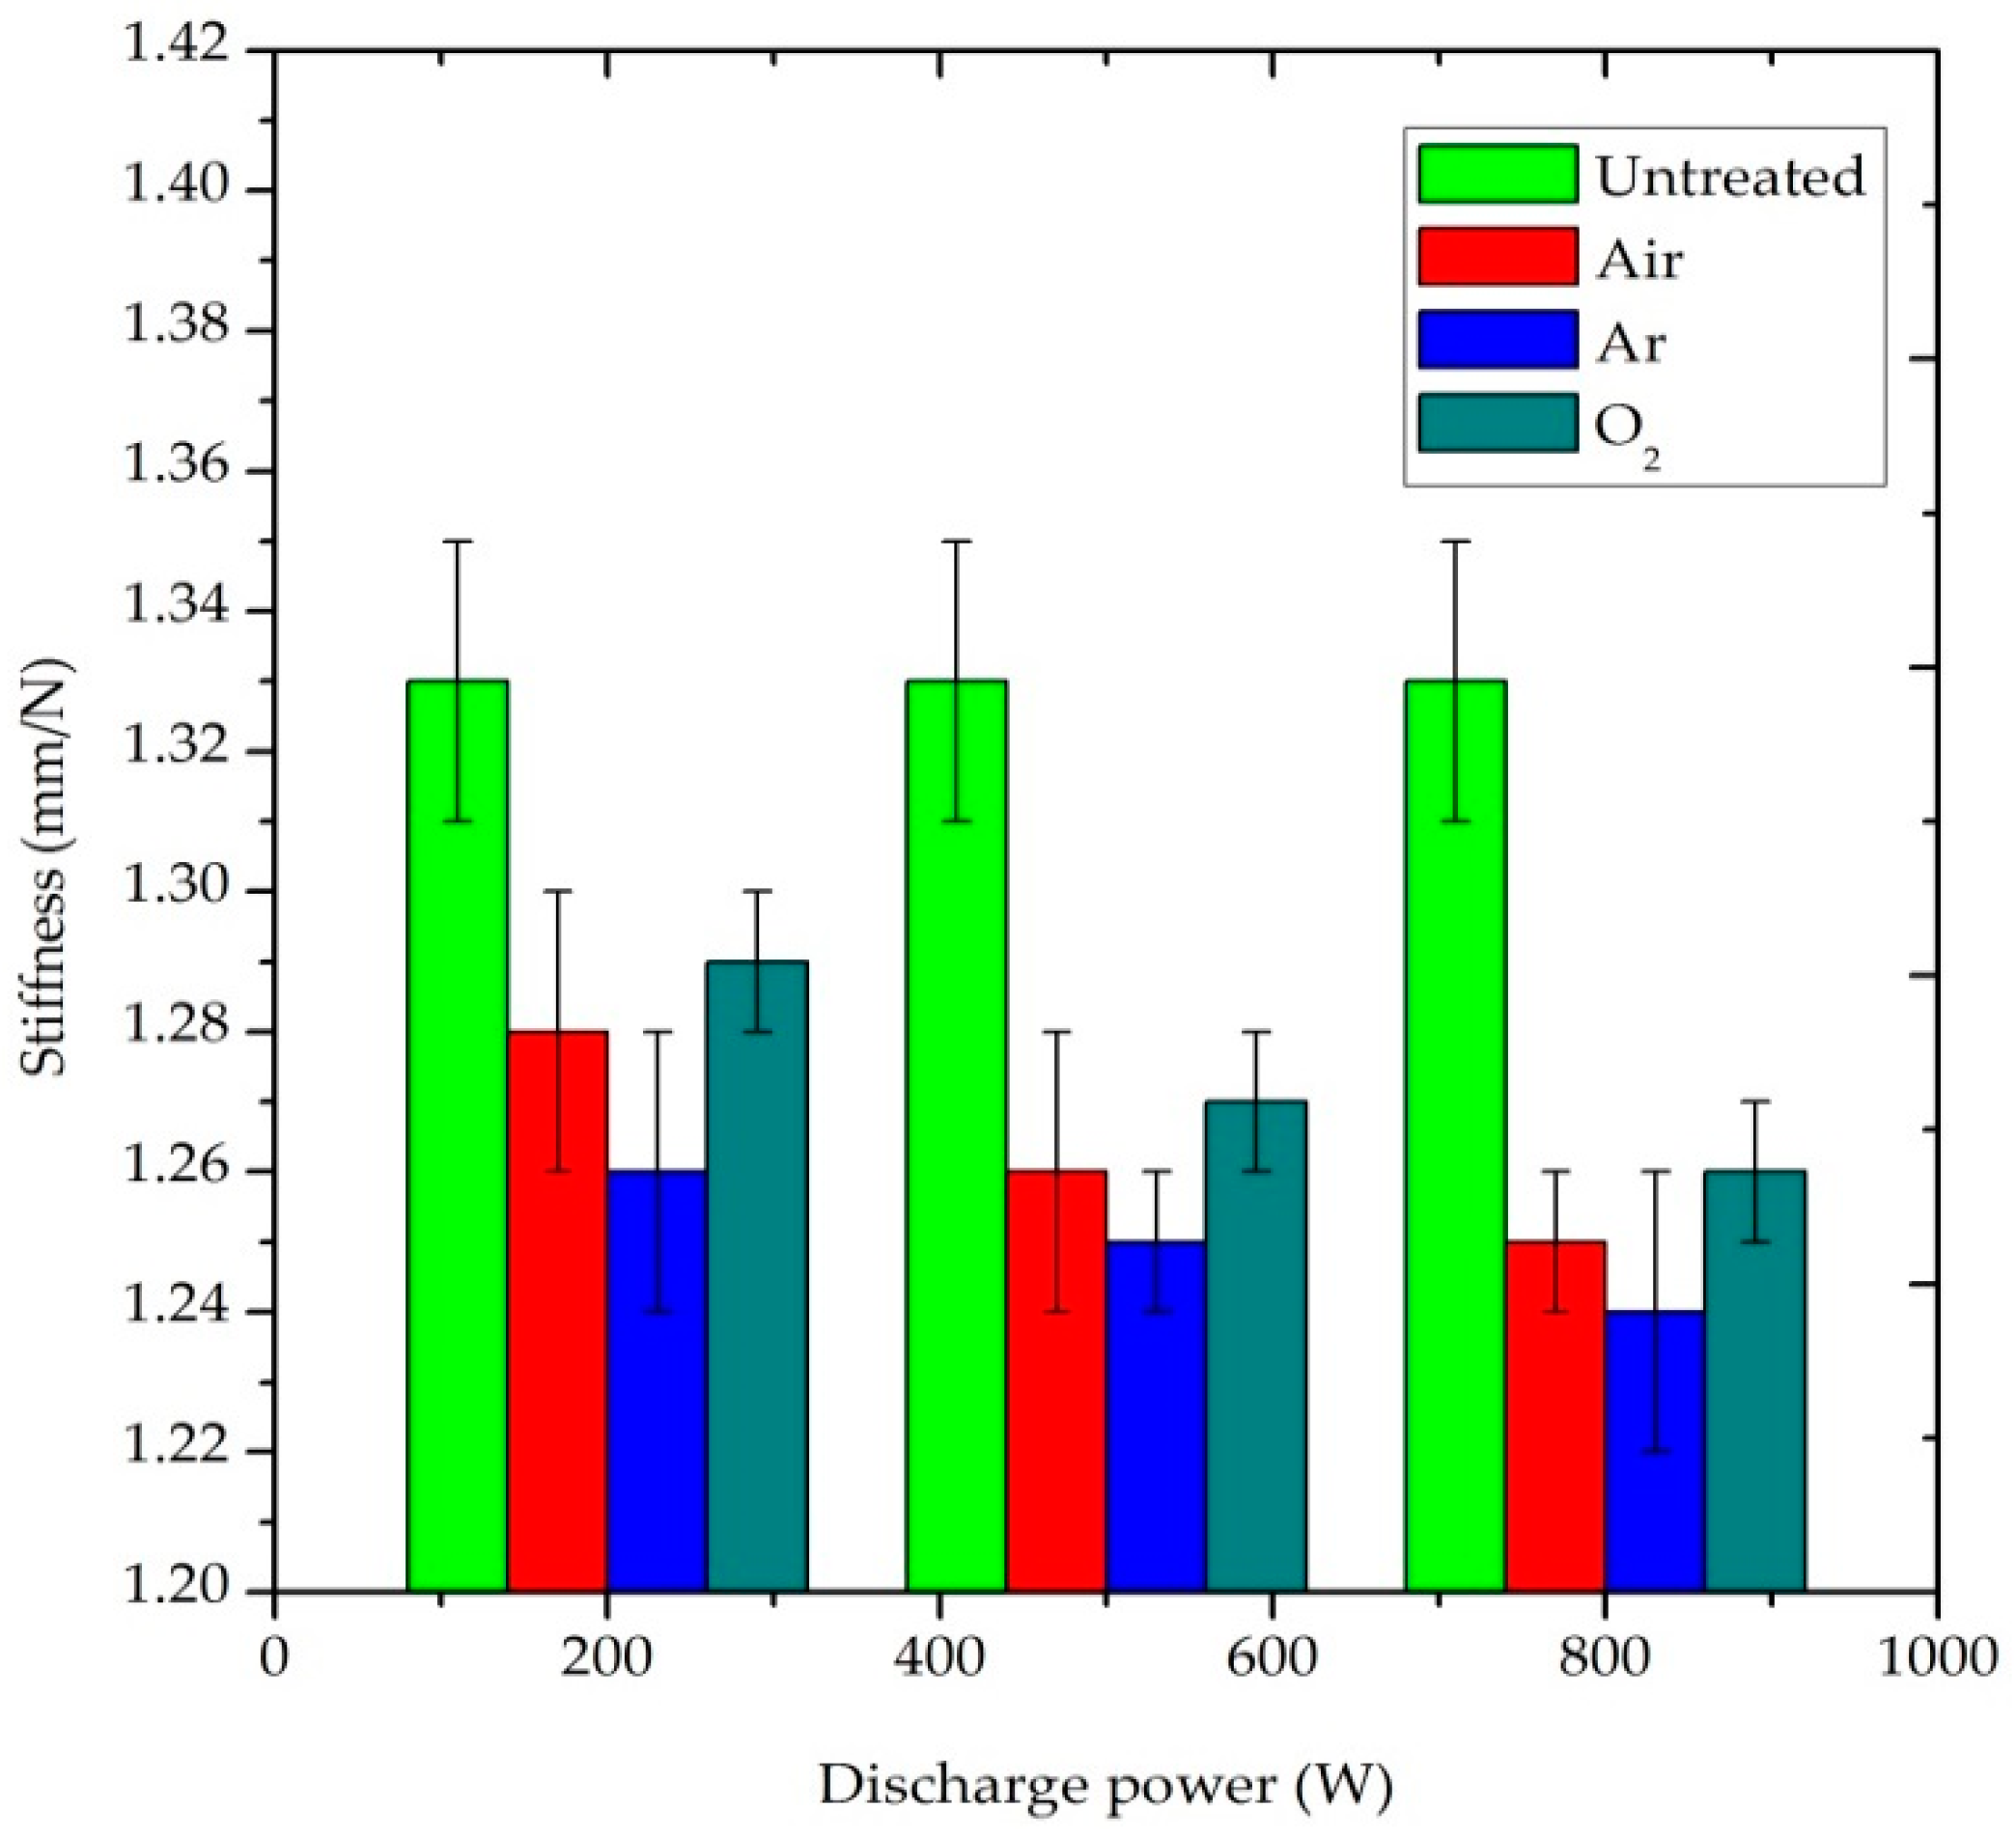
3.2.1. Stiffness (mm/N)

The stiffness values of plasma-treated and untreated P/C blend fabrics are presented in Figure 6. According to the TSA measurement, the lower the value of the stiffness, the stiffer the sample. Thus, it is a direct indicator of compliance. Stiffness refers to the tendency of a fabric to keep standing without any support or resistance to bend when external forces is applied on it [30]. The untreated fabric had a stiffness value of 1.33 mm/N. All the plasma-treated samples showed a lower stiffness value than the untreated samples, which demonstrated that plasma treatment caused an increase in stiffness in the P/C blend fabrics. In addition, the fabric becomes stiffer when the plasma variables, power and treatment time are increased. During plasma bombardment, the PET fiber was heated when the power and treatment were increased, and it becomes harder when exposed to air. As a consequence, the fiber and the yarn become stronger and the stiffness of the P/C blend fabric was enhanced. The small detected increase in stiffness after plasma treatment means that the fabric becomes presumably less comfortable to a sensitive person [31].

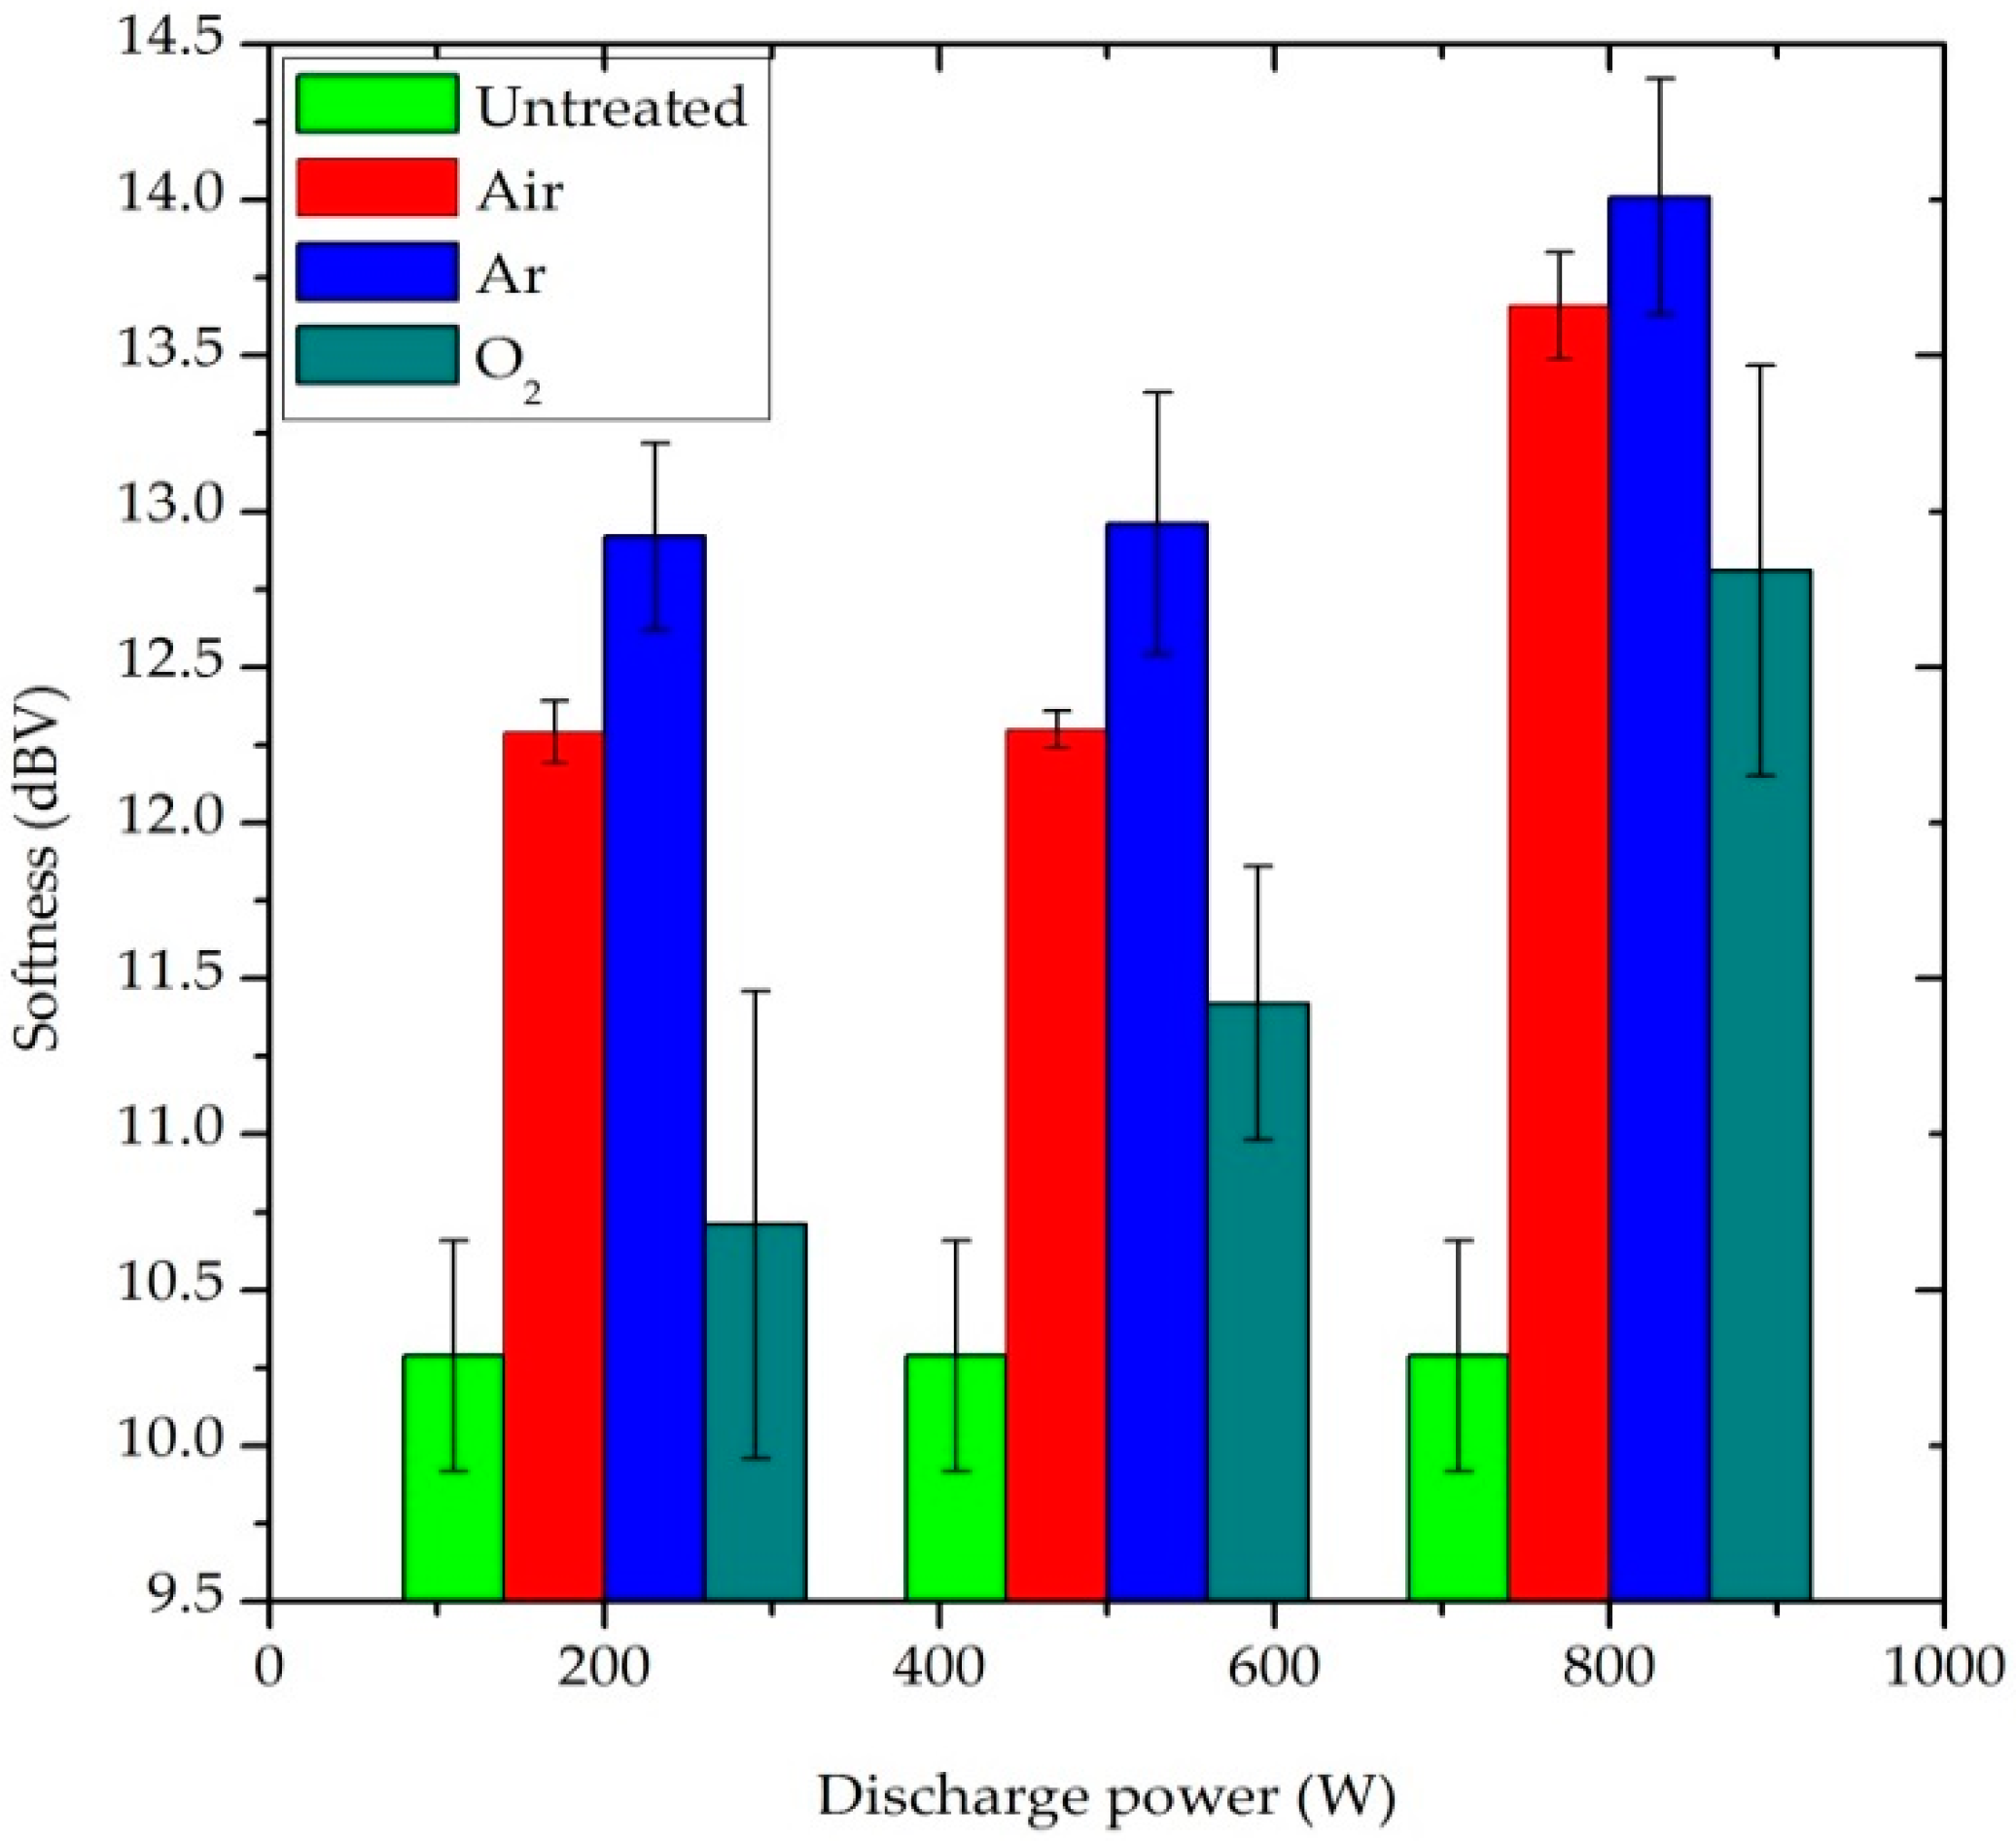
3.2.2. Softness (dBV)

Softness is a flexural property of the fabric and it is one of the key elements of clothing comfort [32]. A lower softness value indicates a softer fabric surface. The untreated fabric had a softness value of 10.293 dBV. All plasma-treated samples have a higher value than untreated blend fabric, as shown in Figure 7. After plasma treatment, softness is decreased due to the etching and sputtering effect of the fiber surface. Additionally, the softness value of the fabric was further increased when the plasma power and the exposure time were enhanced, which means that the softness of the blend fabric decreases. As a result, the fabric comfort property was slightly affected after plasma treatment [33]. In particular, the Ar-plasma treated sample was more affected when compared with air and O2-plasma treated samples.

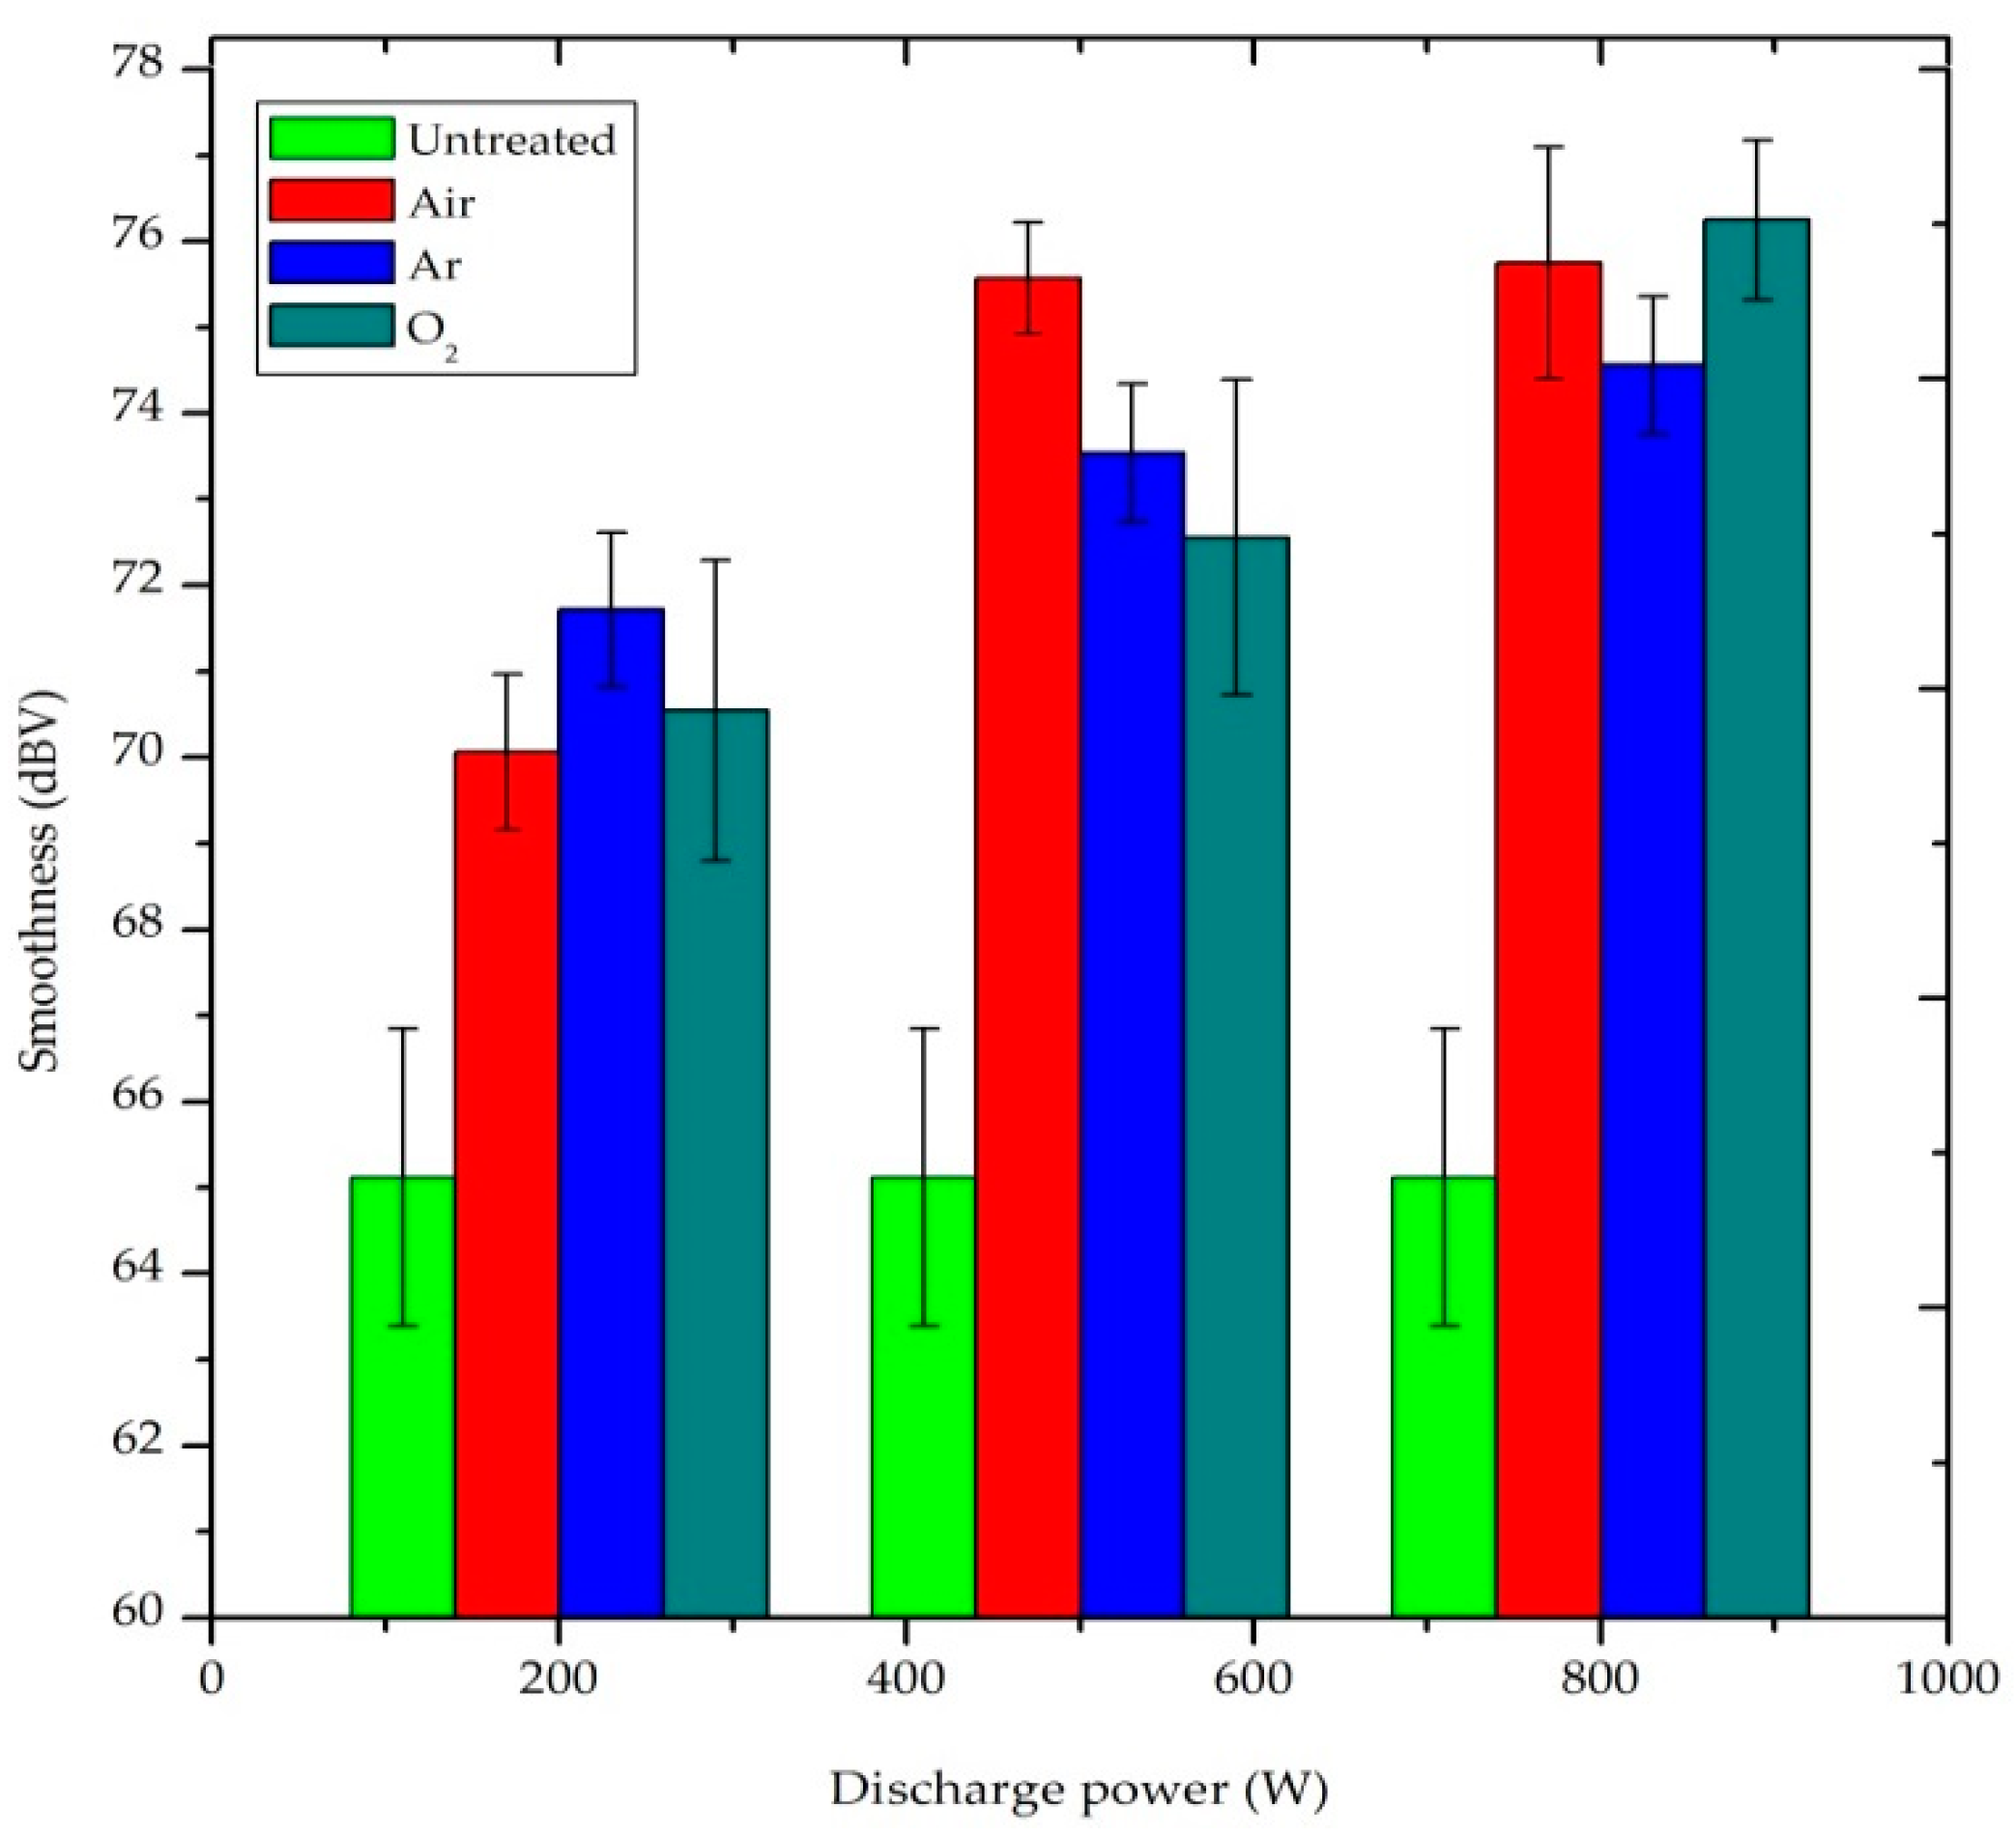
3.2.3. Smoothness (dBV)

Smoothness is correlated to fabric surface slipperiness, as a function of frictional property, whereas roughness is related to the surface texture of the fabric [34]. As TSA results depict, in Figure 8, that the roughness value of all plasma treated samples were greater than untreated sample. The smoothness of the fabric was reduced after plasma treatment due to the formation of voids, cracks and pores on the plasma treated P/C blend fabric surface by the etching and cleaning effect [33]. This gives an uneven fabric surface and comparatively high surface roughness. Prolonged treatment time and high plasma power produced rougher fabric surfaces. As shown in Figure 8, all gases used have almost similar influence on the increase in surface roughness as a function of the discharge power. There is no significant difference between the gases within the accuracy of our measurements.

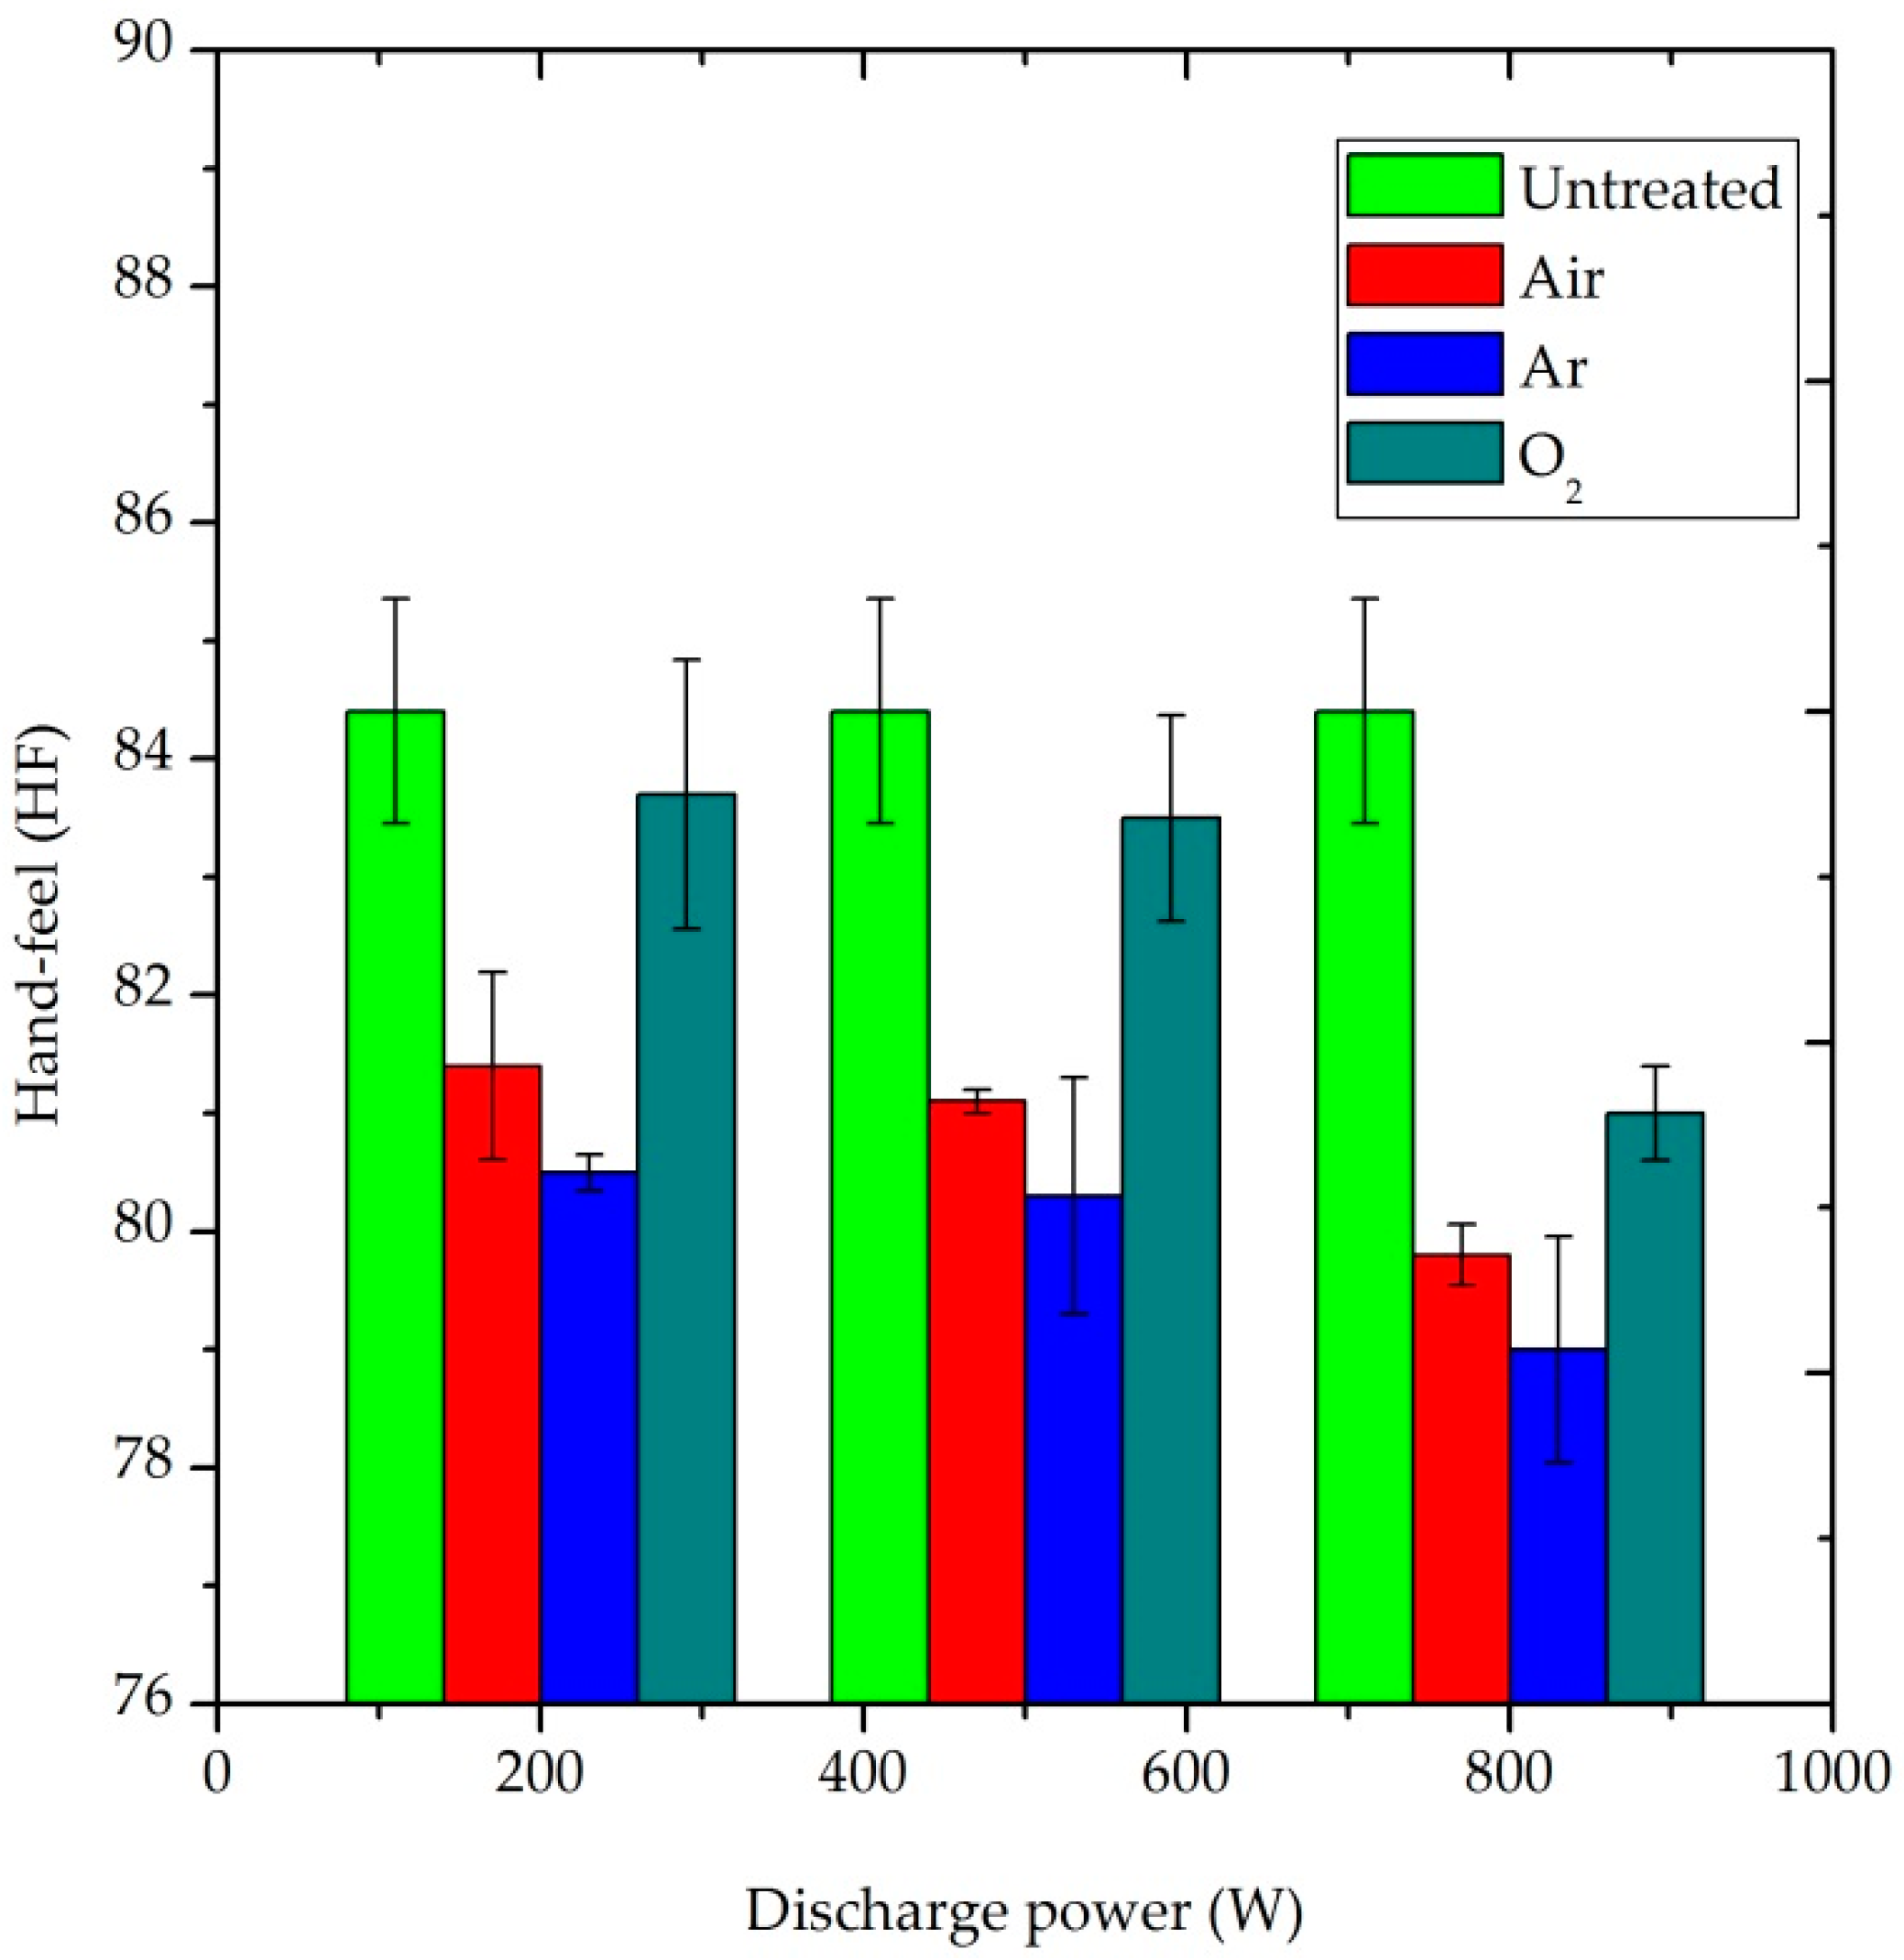
3.2.4. Hand-Feel (HF)

The HF value is the overall effect of stiffness, smoothness, softness, number of plies, thickness and weight of fabric, i.e., HF = f (TS7, TS750, D, weight, thickness, number of plies). A higher HF value would be obtained when the TS7 and TS750 values were decreased and D value was increased. Additionally, the elasticity, plasticity and hysteresis properties of the fabric were also included in HF values through Emtec software within the TSA device. As is presented in Figure 9, all plasma-treated samples had lower HF values than the untreated sample. In general, the plasma treatment affected the haptic property of the P/C blend fabric [33,35]. The degree of its effect depends on the type of plasma gas, duration of treatment and the amount of plasma power.

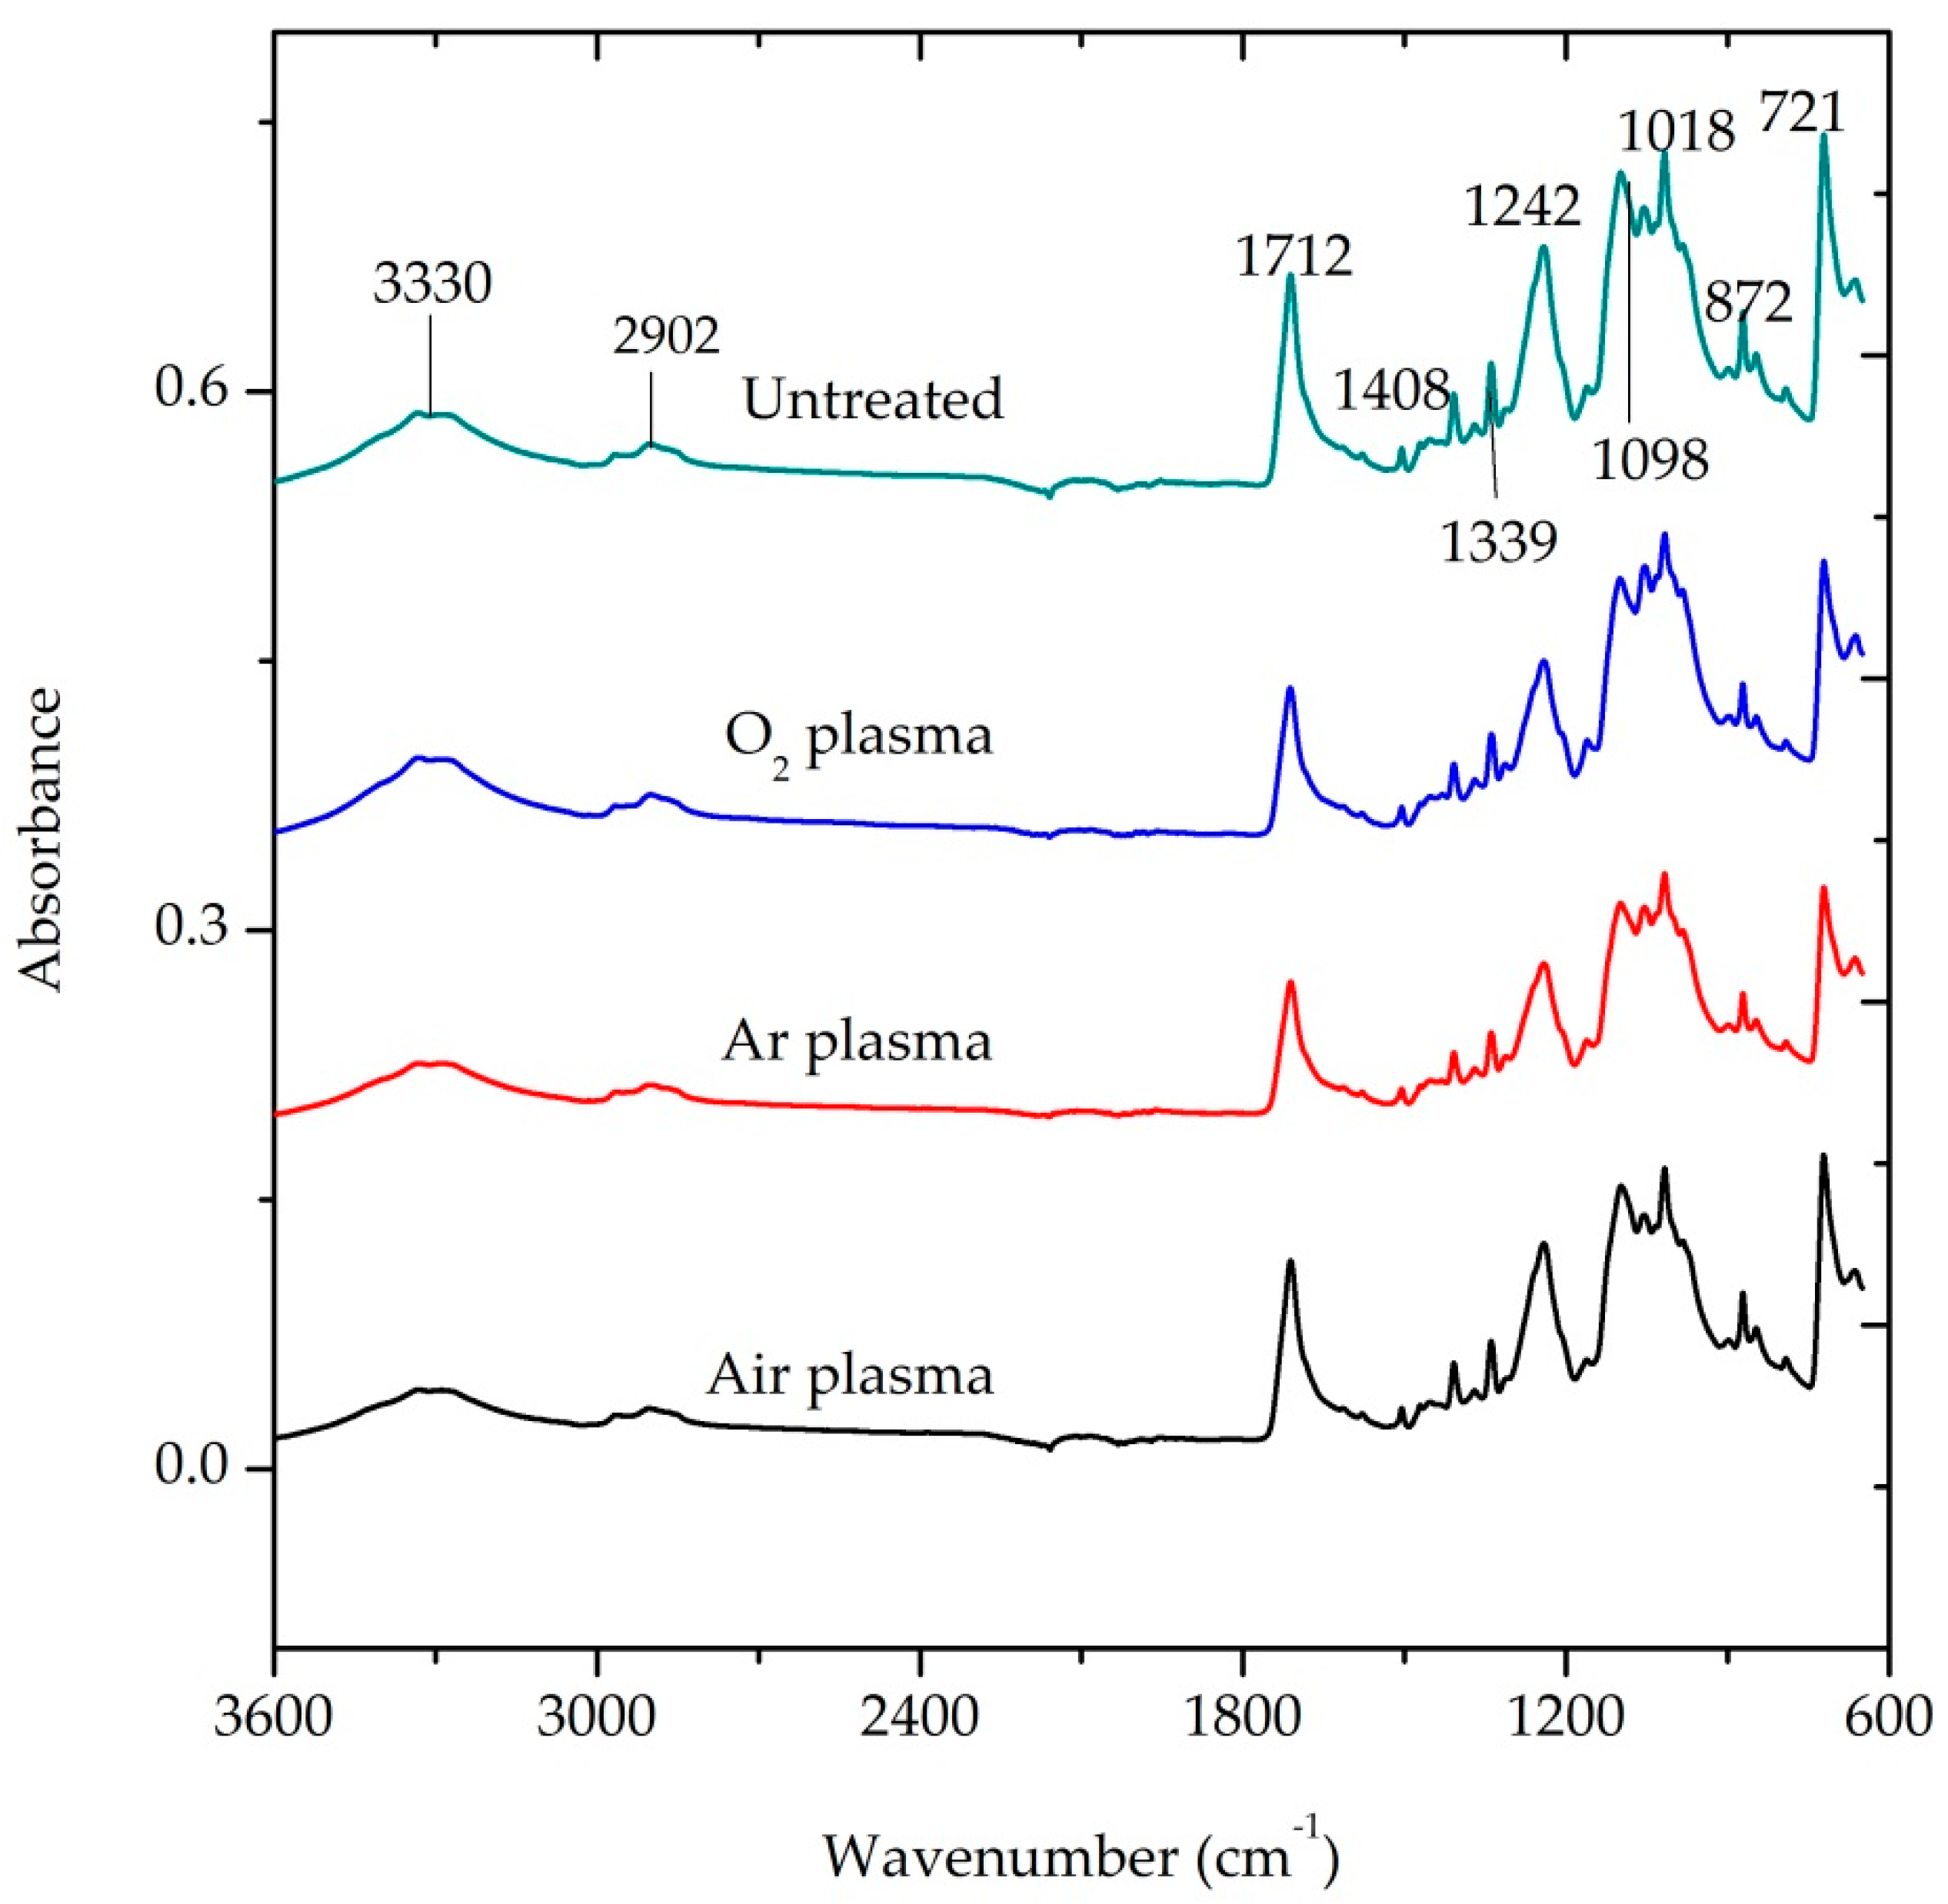
3.3. Surface Chemical Analysis

The ATR-FTIR spectra of air, Ar, O2-plasma treated and untreated P/C fabric samples are presented in Figure 10. The blend ratio of the PET fiber in the blend fabric covers 65%. For this reason, the developing peaks of the P/C blend fabric are similar to the peaks of pure PET fabric. The peaks emerging in the ATR-FTIR spectra at 1712, 1242 and 721 cm−1 can be assigned to the chemical nature of the PET fiber [3,36,37], whereas peaks observed at 3330 and 2902 cm−1 can be associated to both PET and cotton in the blend. Nevertheless, the absorption bands and their functional groups of plasma treated and untreated P/C blend fiber ATR-FTIR spectrum is presented below in Table 1 [38].
The spectra developed from untreated and plasma treated P/C samples are very similar. It does not depict any considerable difference on the surface chemistry of the fabric. However, the intensity ratio was calculated by normalizing the peaks at 1712 and 1242 cm−1 with respect to that at 721 cm−1. The intensity ratios of A1712/A721 and A1242/A721 are shown in Table 2. In regards to the Ar-plasma treated sample, the absorbance ratio is very slightly decreased, as compared to other plasma treated and control samples. In the case of O2 and air plasma treatment, the normalized peak intensity ratio is better than that of the untreated sample. This probably indicates the formation hydrophilic groups on the surface of the fabric during O2 and air plasma treatment [39,40].
In general, the absorbance ratios measured by ATR-FTIR have not revealed a significant difference among samples. As is already known, the plasma treatment only changes the outermost surface layers of a textile substrate at the depth of a few nanometer ranges (5–50 nm). However, the ATR-FTIR technique is very limited in detecting a thin layer in a nano-level. In order to get more accurate surface chemistry of plasma treated sample, more sophisticated techniques are required [3,12].

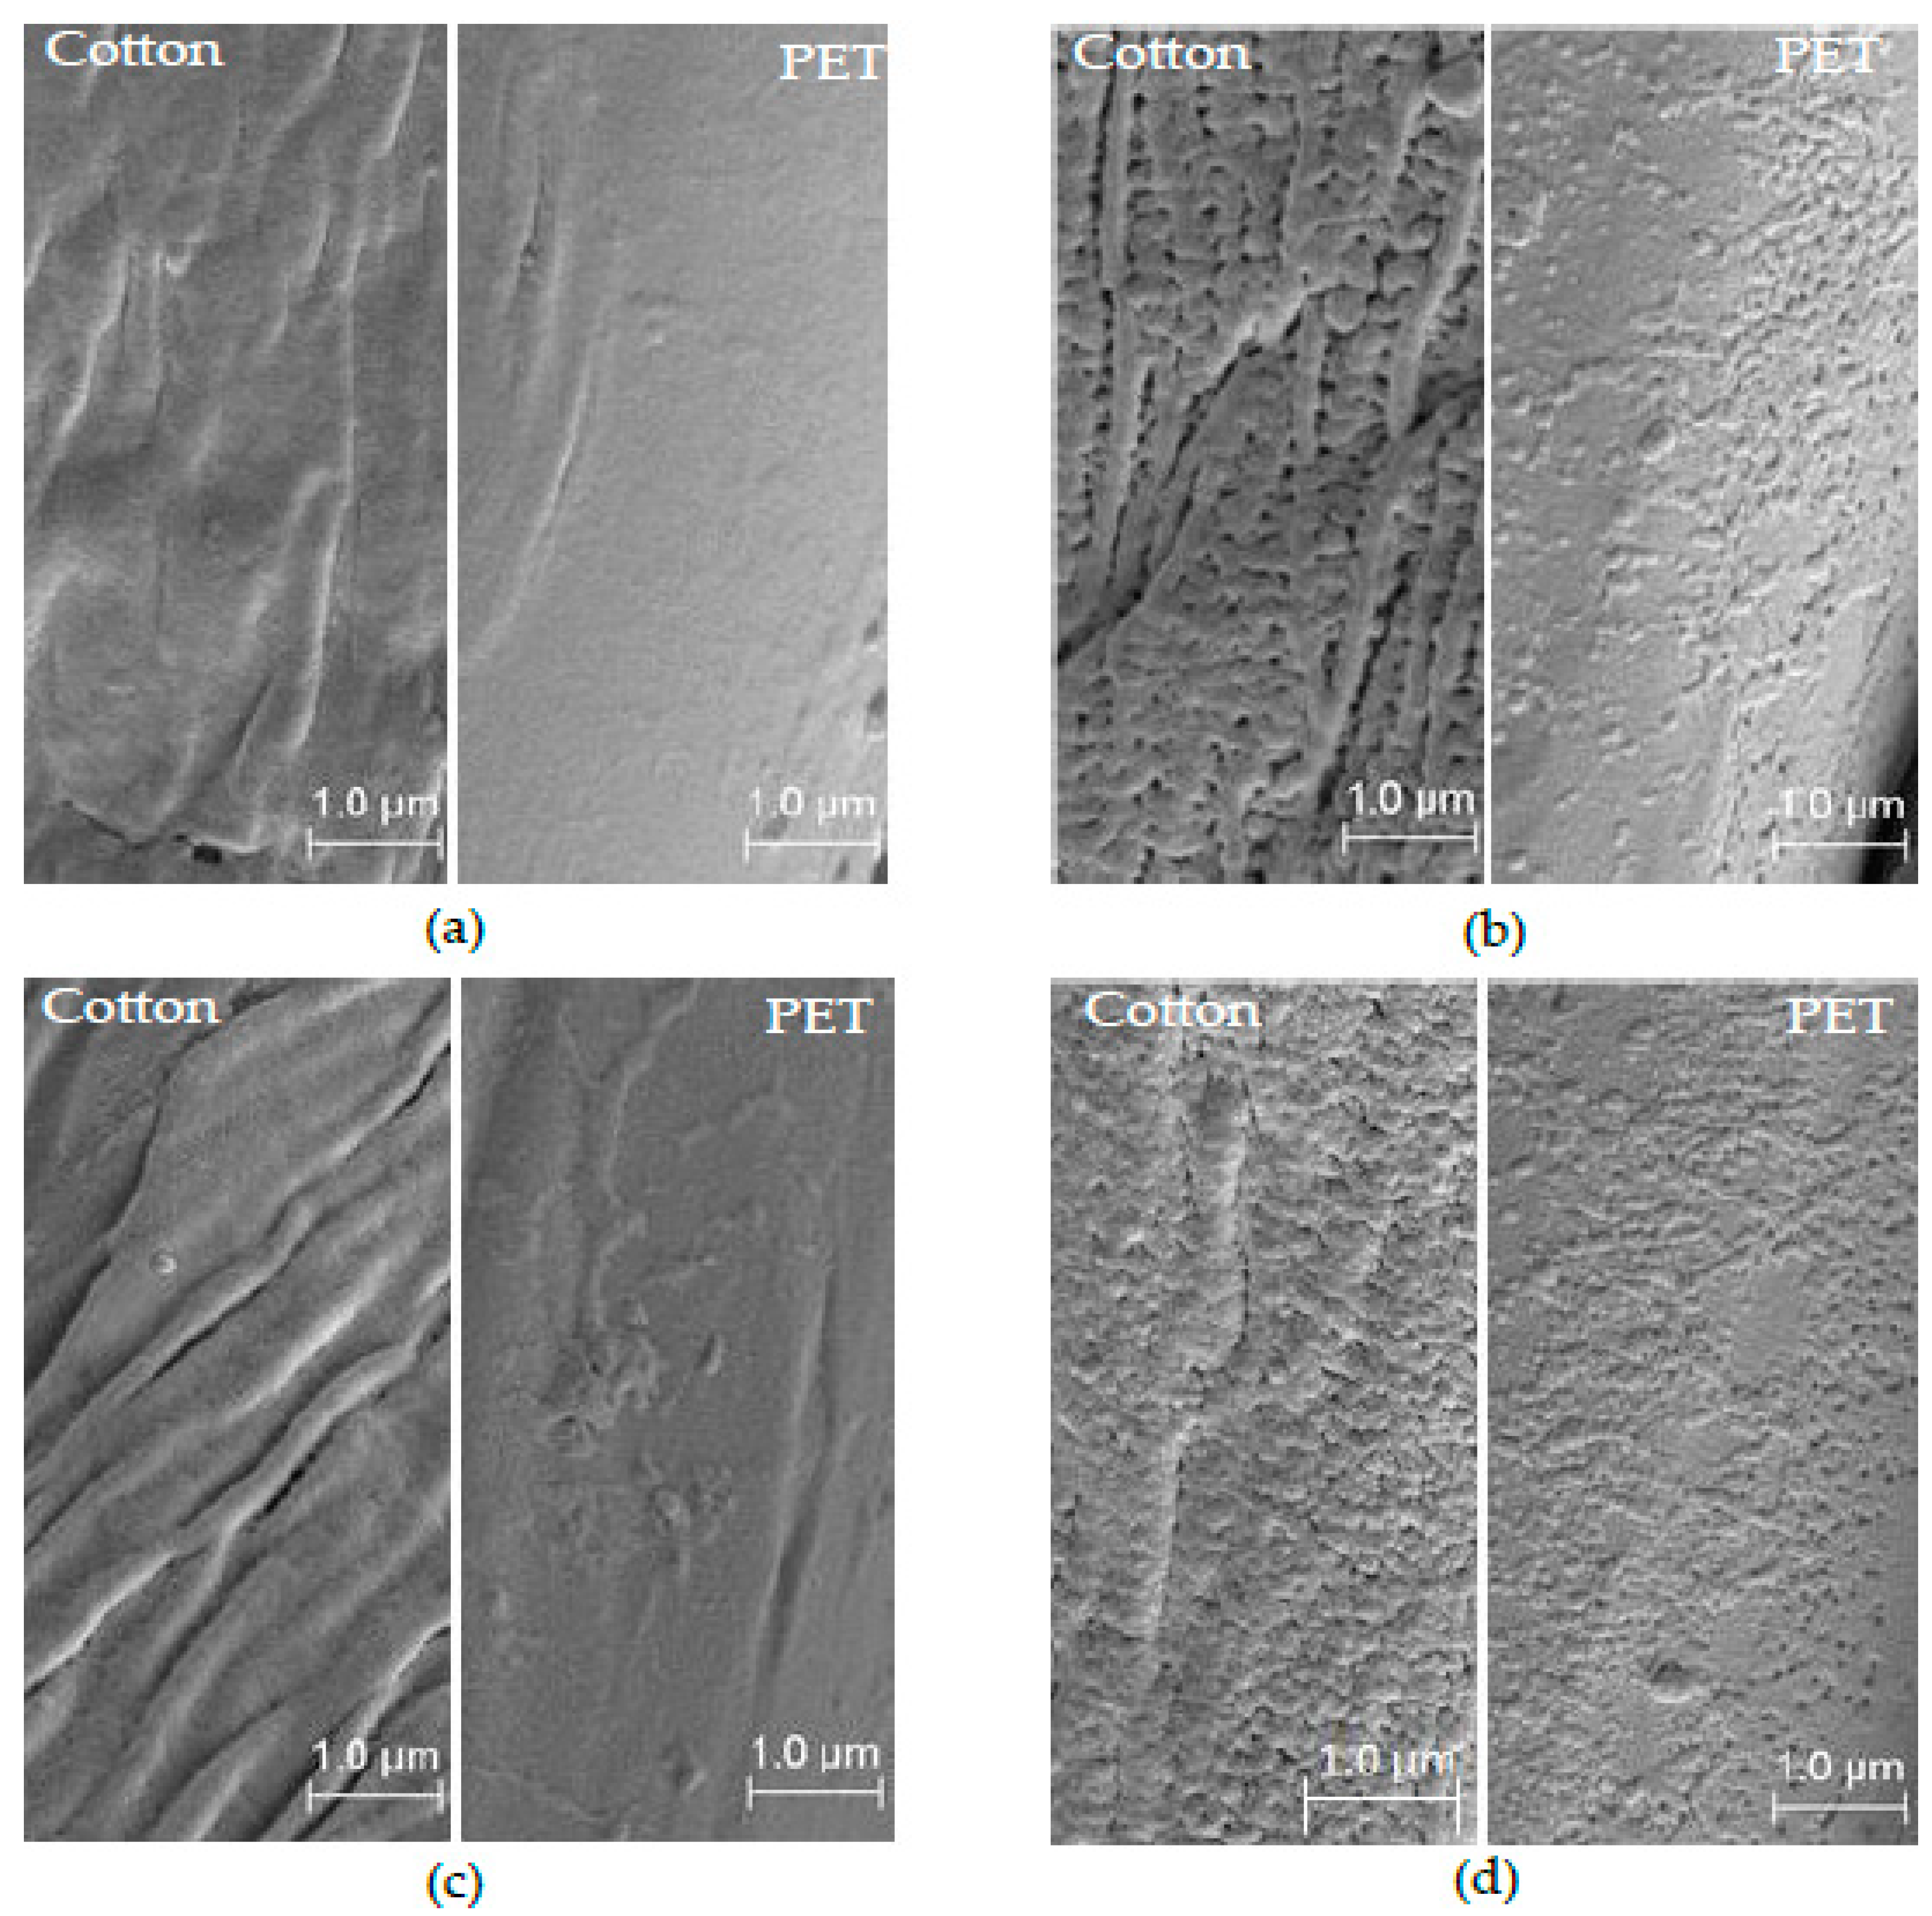
3.4. Surface Morphology Analysis

The SEM images of (a) untreated, (b) air, (c) Ar and (d) O2 plasma treated P/C blend fabric samples are shown in Figure 11. The single fiber was scanned at the size of 1 μm and a magnification of 10000× with 5 kV to present the surface characteristics. It can be seen on SEM images that untreated PET and cotton fibers, in the P/C blend fabric, have relatively flat and smooth surfaces, whereas after 10 min plasma treatment, some new features develop on the fiber surface according to the types of plasma gases [12].
The morphological changes of the fiber surfaces were produced by ion bombardment with high energetic particles during the plasma process. In particular, air-plasma (Figure 11b) created porosity and voids on cotton fibers, as well as solidified nano-spots on the PET fiber surfaces [13]. However, Ar-plasma (Figure 11c) produced grooves and ribbon-like features on the cotton surface and eroded surfaces on the PET fibers [19,41]. In addition, O2-plasma (Figure 11d) also developed a similar feature to that of the air-plasma treatment. The effect of air-plasma treatment is more pronounced compared to O2-plasma [20]. Ar-plasma produced stronger and harder micro surfaces due to the cross-linking of polymers. In all plasma treatments, some solidified particles are observed on the plasma-treated PET fiber surfaces [16].

4. Conclusions

This study concerned the effect of air, Ar and O2 plasma gases on the electrical resistivity and fabric hand properties of P/C blend fabrics under the LPP system. After plasma treatment, the ρs and ρv of the fabric was reduced. However, the fabric softness, smoothness, stiffness and overall HF properties were slightly affected by plasma treatment, as the TSA results revealed. The O2-plasma had a higher resistivity reduction and lower hand-feel effects due to its chemical nature, whereas Ar-plasma had a lower resistivity reduction and higher hand-feel effects due to its stronger sputtering effect. In addition, the SEM images have shown the voids, grooves and micro-pits feature on the plasma treated P/C blend fabric surfaces that correspond to the types of plasma gases. As a result, the plasma treated fabric surface became relatively rougher and stiffer than untreated fabric surfaces. In general, cold plasma treatment had a unique potential to modify and alter the outermost surface of the fibers by less than a few nanometers in depth; it has also been widely used in the area of textile substrate modification in order to change its surface properties.

Author Contributions

J.F.L. and G.N. were supervisors for the research work; B.B.Y. proposed the research idea and designed the experiment together with J.F.L.; J.F.L. offered the laboratory access; B.B.Y. undertook the plasma treatment, resistivity, hand-feel testing, analysis of the result and wrote the draft of the manuscript; J.F.L. and B.B.Y. carried out SEM and ATR-FTIT work; J.F.L., B.B.Y. and G.N. edited the manuscript together. All authors have read and agreed to the published version of the manuscript.

Funding

This research was funded by Engineering Education Capacity Building Program of Ethiopia (EECBP) together with the German Academic Exchange Service (DAAD) by providing scholarship under section ST32 and the APC was funded by Albstadt Sigmaringen University.

Acknowledgments

Authors are very grateful to Groz-Beckert KG (Albstadt-Ebingen, Germany) for giving the opportunities to use SEM and ATR-FTIR. The authors also would like to thank Ziad Heilani and Paul-Gerhard Ringwald for their support during the experiments.

Conflicts of Interest

The authors declare no conflict of interest. The funders had no role in the design of the study; in the collection, analyses, or interpretation of data; in the writing of the manuscript, or in the decision to publish the results.

References

  1. Sarker, F.; Prasad, R.K.; Howlader, M.R.; Abir, N.; Nurunnabi; Akter, R. Scope of Dyeing Polyester Cotton (PC) Blended Fabric in Single Bath Process for Water, Energy and Time Saving. IOSR J. Polym. Text. Eng. 2015, 2, 12–16. [Google Scholar] [CrossRef]
  2. Abou-Nassif, G.A. Blending Behavior of Cotton and Polyester Fibers on Different Spinning Systems in Relation to Physical Properties of Blended Yarns. IJSRET 2017, 6, 1–11. [Google Scholar]
  3. Kale, K.; Palaskar, S.; Hauser, P.J.; El-shafei, A. Atmospheric pressure glow discharge of helium-oxygen plasma treatment on polyester/cotton blended fabric. Indian J. Fibre Text. Res. 2011, 36, 137–144. [Google Scholar]
  4. Bhat, N.V.; Benjamin, Y.N. Surface Resistivity Behavior of Plasma Treated and Plasma Grafted Cotton and Polyester Fabrics. Text. Res. J. 1999, 69, 38–42. [Google Scholar] [CrossRef]
  5. Gonzalez, J.A. Electrostatic protection. In Textiles for Protection, 1st ed.; Scott, R.A., Ed.; Woodhead Publishing Limited: Cambridge, UK; CRC Press LLC: New york, NY, USA, 2005; pp. 503–528. [Google Scholar]
  6. Sello, S.B.; Stevens, C.V. Antistatic Treatment. In Handbook of Fiber Science and Technology Part B, 1st ed.; Lewin, S.B., Sello, M., Eds.; Marcel Dekker, INC.: New york, NY, USA; Basel, Switzerland, 1984; pp. 291–299. [Google Scholar]
  7. Bhattacharya, S.S.; Amin, H.N. Analysis of Surface resistivity behavior of Conductive Woven fabrics made from Copper Jari & SS/Polyester yarns for ESD control. IRJET 2015, 2, 1007–1012. [Google Scholar]
  8. Hersh, S.P. Surface Characteristics of Fibers and Textiles, Part 1; Marcel Dekker: New York, NY, USA, 1975. [Google Scholar]
  9. Cullough, M.; Francis, P.; Hall, J.; David, M. Nonlinear Aromatic Polyamide Fiber or Diber Assembly and Method of Preparation. Patent 4869951, 1989. [Google Scholar]
  10. Henry, P.S.H. Radioactive Static Eliminators for the Textile Industry. In Radioisotope Techniques. Volume II; M.H. Stationary Office: London, UK, 1952; pp. 150–161. [Google Scholar]
  11. Shyr, T.; Lien, C.; Lin, A. Coexisting antistatic and water-repellent properties of polyester fabric. Text. Res. J. 2011, 81, 254–263. [Google Scholar] [CrossRef]
  12. Samanta, K.K.; Jassal, M.; Agrawal, A.K. Antistatic effect of atmospheric pressure glow discharge cold plasma treatment on textile substrates. Fibers Polym. 2010, 11, 431–437. [Google Scholar] [CrossRef]
  13. Rashidi, A.; Moussavipourgharbi, H.; Mirjalili, M.; Ghoranneviss, M. Effect of low-temperature plasma treatment on surface modification of cotton and polyester fabrics. Indian J. Fibre Text. Res. 2004, 29, 74–78. [Google Scholar]
  14. Morent, R.; Geyter, N.D.; Verschuren, J.; Clerck, K.D.; Kiekens, P.; Leys, C. Non-thermal plasma treatment of textiles. Surf. Coatings Technol. 2008, 202, 3427–3449. [Google Scholar] [CrossRef]
  15. Jelil, R.A. A review of low-temperature plasma treatment of textile materials. J. Mater. Sci. 2015. [Google Scholar] [CrossRef]
  16. Chongqi, M.; Shulin, Z.; Gu, H. Anti-static charge character of the plasma treated polyester filter fabric. J. Electrostat. 2010, 68, 111–115. [Google Scholar] [CrossRef]
  17. Meng, L.; Wei, Q.; Li, L. Influence of oxygen plasma treatment on properties of polyester fabrics coated with copper films. Appl. Mech. Mater. 2012, 189, 193–196. [Google Scholar] [CrossRef]
  18. Haji, A.; Rahbar, R.S.; Shoushtari, A.M. Plasma assisted attachment of functionalized carbon nanotubes on poly(ethylene terephthalate) fabric to improve the electrical conductivity. Polimery 2015, 60, 337–342. [Google Scholar] [CrossRef]
  19. Wang, C.X.; Lv, J.C.; Ren, Y.; Zhi, T.; Chen, J.Y.; Zhou, Q.Q.; Lu, Z.Q.; Gao, D.W. Surface modification of polyester fabric with plasma pretreatment and carbon nanotube coating for antistatic property improvement. Appl. Surf. Sci. 2015, 359, 196–203. [Google Scholar] [CrossRef]
  20. Rani, K.V.; Sarma, B.; Sarma, A. Plasma treatment on cotton fabrics to enhance the adhesion of Reduced Graphene Oxide for electro-conductive properties. Diam. Relat. Mater. 2018, 84, 77–85. [Google Scholar] [CrossRef]
  21. Mojtahed, F.; Shahidi, S.; Hezavehi, E. Influence of plasma treatment on CNT absorption of cotton fabric and its electrical conductivity and antibacterial activity. J. Exp. Nanosci. 2016, 11, 215–225. [Google Scholar] [CrossRef] [Green Version]
  22. Kan, C.W. Evaluating antistatic performance of plasma-treated polyeste. Fibers Polym. 2007, 8, 629–634. [Google Scholar] [CrossRef]
  23. ASTM International. ASTM D1776-04: Standard Practice for Conditioning and Testing Textiles; West Conshohocken: Philadelphia, PA, USA, 2004; pp. 1–4. [Google Scholar]
  24. Low-pressure plasma laboratory system (Tetra 30, S. No. 114275). Operating Instructions, Diener Electron; GmbH + Co. KG: Ebhausen, Germany, 2018; pp. 1–102. [Google Scholar]
  25. AATCC Test Method 76. Electrical Surface Resistivity of Fabrics; AATCC Standard: Research Triangle Park, NC, USA, 2005. [Google Scholar]
  26. ASTM standard D 257. Standard Test Methods for DC Resistance or Conductance of Insulating Materials; West Conshohocken: Philadelphia, PA, USA, 2007. [Google Scholar]
  27. Emtec TSA—Textile Softness Analyzer—Techtextil & Texprocess. Available online: https://techtextil-texprocess.messefrankfurt.com/frankfurt/en.html (accessed on 18 November 2019).
  28. Nezhad, H.Y.; Thakur, V.K. Effect of morphological changes due to increasing carbon nanoparticles content on the quasi-static mechanical response of epoxy resin. Polymers (Basel) 2018, 10, 1106. [Google Scholar] [CrossRef] [Green Version]
  29. Yilma, B.B.; Luebben, J.F.; Nalankilli, G. The Effect of Low Pressure Oxygen Plasma Treatment on Comfort Properties of Polyester/Cotton Blend Fabric. Int. J. Text. Eng. Process. 2018, 4, 1–10. [Google Scholar]
  30. Vasile, S.; Ciesielska-Wróbel, I.L.; Langenhove, L.V. Wrinkle recovery of flax fabrics with embedded superelastic shape memory alloys wires. Fibres Text. East. Eur. 2012, 93, 56–61. [Google Scholar]
  31. Kan, C.W.; Yuen, C.W.M. Influence of Plasma Gas on the Mechanical Properties of Wool Fabric. IEEE Trans. PLASMA Sci. 2009, 37, 653–658. [Google Scholar] [CrossRef]
  32. Hung, O.; Kan, C. Effect of CO2 laser treatment on the fabric hand of cotton and cotton/polyester blended fabric. Polymers (Basel) 2017, 9, 609. [Google Scholar] [CrossRef] [PubMed] [Green Version]
  33. Naebe, M.; Tester, D.; Mcgregor, B.A.; Wang, X. The effect of plasma treatment and loop length on the handle of lightweight jersey fabrics as assessed by the Wool HandleMeter. Text. Res. J. 2015, 85, 1190–1197. [Google Scholar] [CrossRef] [Green Version]
  34. Mao, N.; Wang, Y.; Qu, J. Smoothness and Roughness: Characteristics of Fabric-to-Fabric Self-Friction Properties. In Proceedings of the 90th Textile Institute World Conference, Poznan, Poland, 25–28 April 2016. [Google Scholar]
  35. Murakami, M.; Mori, M.; Fujimoto, T.; Murata, C. Influence of Plasma Treatment on Total Hand Value and Adhesion Properties of Bi-Fabrics of Fused Interlining and Wool Fabrics. In Proceedings of the 5th Kanesi Engineering and Emotion Research, International Conference, Linköping, Sweden, 11–13 June 2014; pp. 1031–1038. [Google Scholar]
  36. Gore, A.V.; Venkataraman, A. Identification of polyester/cellulosic blends using FT-IR spectrometer. Indian J. Fibre Text. Res. 1998, 23, 165–169. [Google Scholar]
  37. Platnieks, O.; Gaidukovs, S.; Barkane, A.; Gaidukova, G.; Grase, L.; Thakur, V.K.; Filipova, I.; Fridrihsone, V.; Skute, M.; Laka, M. Highly Loaded Cellulose/Poly (butylene succinate) Sustainable Composites for Woody-Like Advanced Materials Application. Molecules 2020, 25, 121. [Google Scholar] [CrossRef] [PubMed]
  38. Lima da Silva, R.C.; Alves, C., Jr.; Nascimento, J.H.; Neves, J.R.O.; Teixeira, V.; Lima da Silva, R.C.; Alves, C., Jr.; Nascimento, J.H.; Neves, J.R.O.; Teixeira, V. Surface modification of polyester fabric by non-thermal plasma treatment. J. Phys. Conf. Ser. 2012, 406. [Google Scholar] [CrossRef]
  39. Kan, C.; Lam, C. Atmospheric Pressure Plasma Treatment for Grey Cotton Knitted Fabric. Polymers (Basel) 2018, 10, 233. [Google Scholar] [CrossRef] [Green Version]
  40. Caschera, D.; Mezzi, A.; Cerri, L.; Caro, T.D.; Riccucci, C.; Ingo, G.M.; Padeletti, G.; Biasiucci, M.; Gigli, G.; Cortese, B. Effects of plasma treatments for improving extreme wettability behavior of cotton fabrics. Cellulose 2014, 21, 741–756. [Google Scholar] [CrossRef]
  41. Samanta, K.; Jassal, M.; Agrawal, A.K. Atmospheric pressure glow discharge plasma and its applications in textile. Indian J. Fibre Text. Res. 2006, 31, 83–98. [Google Scholar]
Figure 1. Schematic diagram of vacuum plasma system (Tetra 30 PC).
Fibers 08 00017 g001
Figure 2. Surface and volume resistivities (ρs, ρv) measurement configuration of concentric ring electrodes.
Fibers 08 00017 g002
Figure 3. Technical principle of TSA by sound analysis and deformation measurement: (a) Measuring of smoothness; (b) measuring of softness, and (c) measuring of stiffness ("Reproduced/Adapted with permission from [emtec Electronic GmbH, Leipzig, Germany], Alexander Grüner, Emtec TSA – Textile Softness Analyzer: A new and objective way to measure smoothness, softness and stiffness of textiles, emtec Electronic GmbH, 2018".) [27].
Fibers 08 00017 g003aFibers 08 00017 g003b
Figure 4. Effect of discharge power on: (a) surface resistivity (ρs) and (b) volume resistivity (ρv) of P/C blend fabric.
Fibers 08 00017 g004
Figure 5. Effect of the treatment time on: (a) surface resistivity (ρs) and (b) volume resistivity (ρv) of P/C blend fabric.
Fibers 08 00017 g005
Figure 6. Effect of plasma treatment on the stiffness property of P/C blend fabric.
Fibers 08 00017 g006
Figure 7. Effect of plasma treatment on the softness property of P/C blend fabric.
Fibers 08 00017 g007
Figure 8. Effect of plasma treatment on the smoothness property of P/C blend fabric.
Fibers 08 00017 g008
Figure 9. Effect of plasma treatment in the hand-feel property of the P/C blend fabric.
Fibers 08 00017 g009
Figure 10. ATR-FTIR spectra of plasma treated and untreated P/C blend fabric (plasma condition: 0.3 mbar pressure, 10 min treatment time, 500 W power and 60 sccm gas flow rate).
Fibers 08 00017 g010
Figure 11. SEM images: (a) untreated; (b) air; (c) Ar and (d) O2 plasma treated P/C blend fabric at LPP conditions (60 sccm, 500 W, 0.3 mbar and 10 min).
Fibers 08 00017 g011
Table 1. Functional groups and their peaks found in ATR-FTIR spectrum of plasma treated and untreated P/C blend fabric.
Absorption Peaks (cm−1)Functional Groups
3330Hydroxyl O-H
3100–3000Aromatic C-H
2902Aliphatic C-H
1712Carboxylic C=O
1408Aromatic ring
1339Alkane CH2
1242Carboxylic (C-O)
1098, 1018Ester (O=C-O-C)
872, 721Aromatic (C-H)
Table 2. The Absorbance ratio of the peaks in ATR-FTIR spectra of plasma treated and untreated P/C blend fabric.
SampleA1712/A721A1242/A721
Untreated P/C0.620.706
O2-plasma treated0.6220.708
Ar-plasma treated0.6170.695
Air-plasma treated0.6470.717
Peak intensity at 721 cm−1 for aromatic C-H out of plane vibrations was used for normalization.

