Abstract
In this research, poly(ε-caprolactone) (PCL) was melt-mixed with sepiolite nanoclays in a twin-screw extruder. In a subsequent step, the extruded films were drawn in the solid state to highly oriented nanocomposite films or tapes. A twin-screw extruder equipped with a Sultzer mixer for improved mixing in combination with a bench top drawing unit was used to prepare oriented nanocomposite tapes of different sepiolite loading and draw ratios. In order to study the influence of the solidification step on the drawability of the materials, different cooling procedures were applied prior to drawing. Optical microscopy images showed that slow or fast solidification using different chill rolls settings (open or closed) for the cast films resulted in different morphological conditions for subsequent drawing. The addition of sepiolite nanofillers led to nucleation and faster crystallization kinetics and oriented tapes which deformed by homogenous deformation rather than necking. The addition of sepiolite significantly improved the mechanical properties of both undrawn and drawn PCL tapes and Young’s modulus (1.5 GPa) and tensile strength (360 MPa) for composites based on 4 wt% sepiolite were among the highest ever reported for PCL nanocomposites. Interestingly, samples cooled with open chill rolls (slow crystallization) showed the highest modulus while solidification with closed rolls (fast crystallization) showed the highest tensile strength after drawing.
1. Introduction
In order to fully explore the reinforcement potential of anisotropic nanofillers, orientation in the direction of the load is preferred. Polymer fibers, films, and tapes are typically drawn in the solid state after the initial melt or solution-based processing step, which provides a possibility to effectively orient not only the polymer chains, but also the anisotropic filler in the drawing direction. Upon solid-state drawing, the initial, often spherulitic, structure of the polymer is transformed into a fibrillar structure, and uniaxially strong fibers or tapes are obtained [1]. The attainable draw ratio and degree of orientation of the polymer chains are correlated to the structure of the polymer, but also strongly dependent on the processing history.
Compared to the relatively abundant literature available on the drawability and structure development upon drawing of different homopolymers, in particular polyolefins [2,3,4,5], nylons [6], and polyesters [7,8], there are relatively few articles on the drawing of polymer nanocomposites. Most of the research effort on drawn composites has been focused on carbon nanotubes [9,10,11,12,13,14,15,16] due to their high reinforcement potential, but also other anisotropic fillers like different types of clays [17,18,19,20,21,22], cellulose nanocrystals [23,24], and silicon nitride [25] have been studied. It has been shown that employing solid-state [12] or hot [13] drawing, extremely stiff and tough tapes of poly(vinyl alcohol) (PVA) reinforced with single wall carbon nanotubes, could be obtained. The reinforcement was, in both cases, fully attributed to the presence of the filler and not to modification of the polymer matrix, as is often the case. However, Ciselli et al. [14,26] also showed that the reinforcement effect of carbon nanotubes in oriented tapes of PVA depended on the processing method. When a surfactant-free method was used for the preparation of nanocomposite films that, in a subsequent step, were drawn into tapes, the reinforcement was fully attributed to the filler. On the other hand, when a surfactant was used to facilitate dispersion of the filler in the matrix, the reinforcement could not be directly attributed to the filler since the presence of the filler also changed the morphology of the polymer matrix. Single wall nanotubes have also been used to reinforce polypropylene (PP) [10,15] and poly(lactide acid) (PLA) [16]. When the nanotubes were well-dispersed in the matrix, the stiffness was increased threefold and the tensile strength was increased fivefold as compared to neat PP with improvements being fully attributed to the good load transfer between the filler and the matrix [10].
Sepiolite has also been successfully employed to prepare oriented nanocomposites. Sepiolite is a needle-like clay with a thickness of 5–10 nm, a width of 10–30 nm, and a length between 200–3000 nm. In fact, sepiolite being a 1D nanofiller like carbon nanotubes is more effective in reinforcing oriented fibers and films than 2D nanoclays like montmorillonite (MMT) as in the case of 1D fillers the aspect ratio remains constant over the width of the reinforcement while it may vary for 2D fillers [21]. In a paper by Bilotti et al., it was, therefore, used to effectively reinforce PP [20]. At intermediate draw ratios and filler content, the reinforcement efficiency exceeded theoretical predictions, which was said to be due to an altered morphology of the polymer matrix, caused by the presence of the filler. Generally, improvements in mechanical properties in drawn nanocomposites can be attributed to a more effective load transfer from the polymer matrix to the well-dispersed aligned high-aspect ratio nanofiller. However, in some composites, improvements were also attributed to more effective orientation of polymer chains in the presence of a filler during the drawing process, or to changes in the morphology of the polymer matrix due to the filler, rather than attributed to a direct filler reinforcement effect [19,20,22,25]. Given the fact that nanocomposite reinforcement can either originate from filler reinforcement as well as matrix modification, it is essential to understand the influence of nanofiller addition on the morphology before and after processing, such as melt-extrusion or melt-spinning followed by an adjacent solid-state drawing step. As mentioned before, this is a complex problem since filler addition can affect matrix polymer morphology in multiple ways.
Poly(ε-caprolactone) (PCL) is a biodegradable, semi-crystalline polymer with good processability due to its low glass transition and low melting temperature [27]. The main drawback of PCL is the moderate stiffness (0.15–0.20 GPa), which greatly limits its application. The development of PCL-based nanocomposite materials is one way to increase the applicability of the polymer outside its current uses in the biomedical field and, over the years, several groups have, therefore, concentrated their research efforts on such composites. A large range of nanofillers has been incorporated in PCL matrices with good levels of dispersion [28,29,30,31,32,33,34,35,36,37,38,39,40,41,42,43]. Since poly(ε-caprolactone) is polar in its nature due to the carboxyl group in the molecular structure, filler materials with naturally occurring hydroxyl groups on the surface can often be dispersed in the matrix via melt-mixing without the need of surface modification or coupling agents. This has previously been shown for silica [28] and clays like sepiolite [40,41,42,43] and halloysite [42]. For filler surfaces that are not naturally rich in hydroxyl groups, surface modifications are used to render them more hydrophilic. This is typically needed for clays like montmorillonite [35,36,37,39,40,42]. Another successfully employed way of compatibilization with the PCL matrix is to graft polymer chains onto the filler [30,32]. On a lab scale, dispersion can be improved by using solvent casting such as dissolve the polymer and mix it with the fillers in a common solvent and, thereafter, evaporate the solvent [32,33,34,38,39], or by combining solvent casting and extrusion compounding [29,33]. Another method often employed on a lab scale is to synthesize the filler in the presence of the polymer or to synthesize the polymer in the presence of the filler [31]. It has been shown that the mechanical properties of PCL can be improved to some extent with the addition of silica [30,31] and cellulose nanocrystals [32,33] and, to a greater extent, with carbon nanotubes [31], graphite oxide [34], and different types of clays [35,36,37,38,39,40,41,42,43]. In addition, sepiolite nanoclays have been used for the modification of PCL and it has been shown that that the addition of 5 wt% of sepiolite to PCL can improve the mechanical properties of a PCL matrix [39,40,41,42,43]. In our previous research, we found that, in melt-mixed composites of PCL and unmodified sepiolite, the reinforcing efficiency was highly dependent on filler dispersion and relatively low for all samples prepared in that study [43]. However, for samples with relatively good dispersion, a trend of increasing elongation at break with increased filling content was observed. This finding indicates that the addition of small amounts of well-dispersed sepiolite could potentially be beneficial for solid-state deformation processes such as the solid-state drawing of PCL films or fibers, which is similar to what has been observed in PP [22].
In this paper, oriented tapes are prepared from extruded PCL/sepiolite nanocomposite cast-films. These nanocomposites are prepared in a continuous process using a twin-screw extruder equipped with a Sultzer mixer for improved mixing and a melt pump for supplying an even melt flow for the subsequent cast-film extrusion and tape drawing process. Drawing is performed in two steps on a bench-top drawing unit with an oven between two calendar units. It is well known that the efficiency of solid-state drawing below the melting temperature is increased with increasing drawing temperature, and, typically, higher drawing ratios are obtained at higher temperatures. The low melting temperature of PCL does, however, limit the possibility of drawing at elevated temperatures and, therefore, any increase in drawability caused by filler addition can be technologically beneficial. In a continuous process, an isothermal cooling step is not realistic, since it compromises the continuity of the process, but cooling time can be varied to some extent. Here, cooling time and solidification was varied by changing the gap between the two water-cooled chill rolls. Open chill rolls allowed the material to solidify more slowly, while closed chill rolls made the tapes thinner, allowing more rapid cooling. The influence of these different cooling procedures and filler content on the mechanical properties of both drawn and undrawn neat PCL and PCL/sepiolite nanocomposite tapes is reported.
2. Materials and Methods
2.1. Materials
Poly(ε-caprolactone) (PCL) CAPA® 6800 (Mn ~80 kg/mol) from Perstorp Caprolactones (Perstorp, Sweden) (now Ingevity, SC, USA) was used as a matrix polymer. The sepiolite, Pangel® S9, was provided by Tolsa S.A. (Madrid, Spain) and used as received. The average diameter of the sepiolite needles used in this study was 20–30 mm and the length was 1000–2000 nm.
2.2. Sample Preparation
A Haake Polylab OS PTW 16 twin-screw extruder from Thermo Fischer (Waltham, MA, USA) was equipped with a melt pump. The diameter of the screws was 16 mm, the L/D ratio was 40, and the extruder was used in a simple compounding configuration. A Sulzer mixer of 7 mm (4 units) was installed just before the die to provide better mixing. A flat film die of 1 × 16 mm was used. After leaving the die, the cast-film was cooled on adjustable chill rolls and, thereafter, drawn at room temperature (RT) in the solid state on a customized bench top drawing unit from Retech (Meisterschwanden, Switzerland) to highly oriented tapes. In order to vary the draw ratio (DR), the speed of the second set of godet rolls was adjusted. In Figure 1, a schematic of the setup can be found. All the important processing parameters related to the different steps of the film extrusion and subsequent drawing process are listed in Table 1.
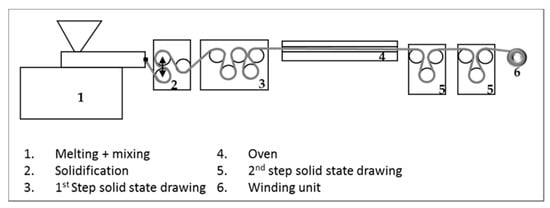
Figure 1.
Schematic showing the experimental setup.

Table 1.
The processing parameters used in the different processing steps.
A reference neat PCL material and two nanocomposite pre-mixes consisting of polymer pellets and sepiolite powder with different filler loading were prepared and fed manually into the hopper of the extruder. For each material system, two sets of processing conditions were applied for the preparation of the extrusion cast films, viz. solidification with either open or closed chill rolls. When the chill rolls were left open, the polymer was cooled by the surrounding air (slow cooling). With closed chill rolls, the polymer was cooled by the water-cooled chiller rolls themselves (rapid cooling). Unfortunately, no quantitative cooling rate could be determined with the current experimental set-up. The as-extruded films were subsequently drawn in the solid state to two different draw ratios (intermediate or high). In Table 2, an overview of the different samples and the nomenclature used to describe them are presented.
Table 2.
Description of the samples and their abbreviations.
2.3. Analytical Methods
A Q500 thermogravimetric analyzer (TGA) from TA Instruments (New Castle, DE, USA) was used for the determination of the weight percentage of sepiolite in the samples. Then, 10–15 mg of sample was heated to 600 °C at a rate of 10 °C/min under nitrogen atmosphere. Four samples of each material were measured. The dispersion of the nanofillers was investigated with transmission electron microscopy (TEM). Ultrathin sections (70 nm) were micro-tomed at −100 °C using a Leica Ultracut S/FCS microtome (Wetzlar, Germany). The sections were placed on a 200 mesh copper grid with a carbon support and were examined in an FEI Tecnai 20 transmission electron microscope (TEM, Eindhoven, Netherlands), operated at 200 kV. Differential scanning calorimetry (DSC) measurements were performed on a Q1000 DSC from TA Instruments (New Castle, DE, USA). Approximately 3–5 mg of sample was heated from RT to 100 °C at a rate of 10 °C/min and held at that temperature for 5 min. This was followed by a cooling step to −80 °C, also at a rate of 10 °C/min. This cycle was repeated twice. The melting temperature (Tm) was determined from the maximum of the melting peak of the second heating run, while the crystallization temperatures (Tc) (onset and maximum temperature) were determined from the first cooling cycle. The degree of crystallinity (Xc) was determined using a heat of fusion at 100% crystallinity of 136 J/g [44]. Isothermal crystallization experiments were also performed. The samples were initially subjected to two heating/cooling cycles as previously described, followed by a heating run from RT to 100 °C at a rate of 10 °C/min and held at that temperature for 5 min. Subsequently, they were cooled at as high a rate as possible, 50 °C/min, to the desired isothermal temperature where they were kept for 30 min before heating up to a temperature of 100 °C again. This cycle was repeated at four different temperatures. Polarized optical microscopy (POM) was used to study the crystalline structure of samples solidified using different cooling methods. A Zeiss Axioplan 2 microscope (Jena, Germany) equipped with a Zeiss Axiocam camera was used. Thin sections of compression molded samples were prepared using a Leica Ultracut S/FCS microtome equipped with a diamond knife. Mechanical properties were investigated using a Zwick 100 universal tensile tester (Ulm, Germany) equipped with a 100 N load cell. Small dumbbell-shaped samples with a total length of 30 mm, a width of 2 mm at the thinnest part, and a thickness of 0.1–0.6 mm (depending on the draw ratio) were cut according to ISO 527-2-1BB directly from the drawn film samples. The test speed was 12 mm/min and the Young’s modulus was determined from the slope between 3 and 5 Newton. For each composition, at least seven samples were tested.
For the evaluation of the mechanical properties of composite systems, many different micromechanical models have been proposed. One widely used practical model is the Halpin-Tsai equation [45]. According to this model, the tensile modulus of a composite can be written as:
with
where Ecomposite is the modulus of the composite, Ematrix is the modulus of the polymer matrix, Efiller is the modulus of the filler, and φ is the filler volume fraction, while ξ (=2l/d) is a geometrical factor used to describe the influence of filler geometry or filler aspect ratio (l/d) on mechanical reinforcement. In polymer nanocomposites where the filler is assumed to be in-plane (2D) randomly oriented in the matrix, not all of the filler contributes to the stiffness increase. The composite modulus, Ecomposites, can be described by:
where E11 is the longitudinal and E22 is the transversal modulus [26]. For the polymer matrix, the average values of the modulus obtained from the tensile tests were used and, for sepiolite, a modulus similar to montmorillonite was assumed and set to 178 GPa [46]. This equation was used to calculate the elastic modulus of the as-extruded films. For the oriented tapes, it was assumed that all sepiolite needles were uniaxially (1D) oriented in the drawing and test direction and, therefore, this equation becomes:
Ecomposite/Ematrix = (1 + ξηϕ)/(1 − ηϕ)
η = (Efiller/Ematrix − 1)/(Efiller/Ematrix + ξ)
Ecomposite = 3/8E11 + 5/8E22
Ecomposite = E11.
2D wide-angle x-ray diffraction (2D-WAXD) measurements were performed in-house using Cu Ka radiation from a Bruker Beamline (Billerica, MA, USA). The patterns were recorded in transmission mode at RT using an exposure time of 300 s. The 2D patterns were transformed into 1D patterns by performing integration of the azimuthal intensity with the data analysis program General Area Detector Diffraction System (GADDS) V4.1.02. In order to estimate the orientation of the polymer chains in the crystalline phase of the polymer, Hermans’ orientation factor was calculated. Details of the calculations can be found in Appendix A.
In order to study the orientation of both the amorphous and the crystalline part of the polymer nanocomposites, Fourier transformed infrared spectroscopy (FTIR) measurements were performed. Infrared (IR) spectra were recorded using a microscope coupled to a Varian 670-IR spectrometer (now Agilent Technologies, Santa Clara, CA, USA). A wire grid polarizer was placed in the infrared beam in front of the sample and in front of the mercury cadmium telluride (MCT) detector to record spectra with the radiation polarized parallel and perpendicular to the stretching direction. Attenuated total refection (ATR) spectra were recorded using a slide-on ATR accessory equipped with a germanium crystal. The data obtained from the FTIR measurements were also used to calculate the Hermans’ orientation function, F. Details of the calculations can be found in Appendix B.
3. Results and Discussion
3.1. Morphology of the Nanocomposites
After (slow) solidification using open chill rolls, a white opaque film was obtained for the unfilled PCL sample, typical for a semi-crystalline material. Upon drawing this polymer, film deformed by necking into an oriented transparent tape. Stable drawing was not observed for draw ratios below 3.5. The addition of 2–4 wt% of sepiolite gave the as-extruded film a slight brownish color but upon drawing a transparent material was, again, obtained. There were no visible defects or large agglomerates in the composite films, indicating that the dispersion of the sepiolite nanofiller in the PCL matrix is fairly homogeneous. In the drawing unit, these films were drawn to oriented tapes with a draw ratio of 10 in a stable process. However, when the actual draw ratio was calculated from the cross-sectional area difference between drawn and undrawn samples, a slightly lower maximum draw ratio of around 7 was found. For the samples with 2 wt% sepiolite, the largest difference between set and actual draw ratio was found. Plausible explanations for this difference between set and actual values are slip at the draw-down godet rolls during the drawing process and residual elasticity in the drawn tapes, which makes them contract once tension is released. With the chill rolls closed, solidification was much faster, and quite a different material was obtained. Here, the film was already transparent after passing through the water-cooled chill rolls and drawability was significantly reduced. A stable drawing process was only obtained for draw ratios up to 3. The cross-sectional area of the tape decreased with an increasing draw ratio, but no necking was observed. Instead, the films deformed homogeneously, which is a strong indication of reduced strain softening and/or increased strain hardening behavior. Again, the largest difference between set and actual draw ratio was found in tapes based on 2 wt% sepiolite.
In Table 3, a list of all the samples with the intended as well as calculated actual draw ratios and filler content as measured with thermogravimetric analysis (TGA) is found. It is noteworthy that the filler content in cast film samples extruded with open and closed chill rolls are different for the 2 wt% sample. A possible explanation for this is that the polymer/filler mixture was added manually to the hopper and there was a tendency for bridging of the sepiolite powder in the hopper, leading to a somewhat higher filler content near the end of the extrusion process. The samples with 2 wt% of sepiolite with closed chill rolls were the last ones to be extruded and a large standard deviation in this sample confirms that the bridging caused a variation in sepiolite content as compared to the other samples. For the 4 wt% sample, the filler content as determined from TGA corresponds better to the intended value. These samples were all processed at the beginning of the extrusion round. Since the tendency of bridging was even greater in the sample with more sepiolite, the hopper was always monitored, and the feed rate was kept more constant.
Table 3.
Overview of dimensions, the calculated draw ratios, and the filler content (average ± standard deviation) for the different samples employed in this study.
In order to examine the crystalline structure of the as-extruded tapes, thin sections of the center of the tapes were microtomed in the extrusion direction. In the schematic in Figure 2, the position of the sample within the tape can be seen.
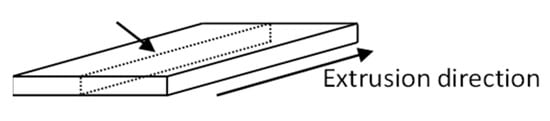
Figure 2.
Schematic showing the position of the microtomed sample within the tape.
In the POM images presented in Figure 3, cross-sections of the central part of the tapes are shown. Samples cooled relatively slowly in air with open chill rolls show a spherulitic morphology after extrusion (Figure 3a–c). Since the spherulites are very small in all samples, it is difficult to visually detect a possible nucleation effect of the sepiolite filler. However, overall, it appears that the morphology of the neat PCL is coarser than for the filled samples. The finer microstructure of the sepiolite filled samples is indicative of increased nucleation during cooling, resulting in a larger number of smaller spherulites compared to the unfilled PCL sample. A certain orientation upon extrusion is also visible in the filled materials. The faster cooled samples using closed chill rolls show a completely different morphology. There is no sign of spherulites, which indicates they are either not present, or too small to distinguish visually. Noteworthy is that the neat PCL sample shows a skin-core morphology with a different structure near the edges and core of the tape (Figure 3d). This is a well-known phenomenon in thicker samples where a large temperature gradient is present during cooling. The outer layers crystallize faster, creating a skin that slows down heat transfer and, thus, solidification of the core. Interestingly, this layered skin-core structure is absent in the sepiolite filled samples (Figure 3e,f). Since the filler acts as an efficient nucleation agent, here, crystallization is also accelerated in the core of the films. Thereby, it creates a more homogeneous microstructure. Even though the films prepared with open chill rolls where thicker than the samples produced with closed chill rolls, the presence of air between the chill roll and film reduced the efficiency of the cooling and, thereby, the steepness of the temperature gradient, resulting in a more homogeneous structure.
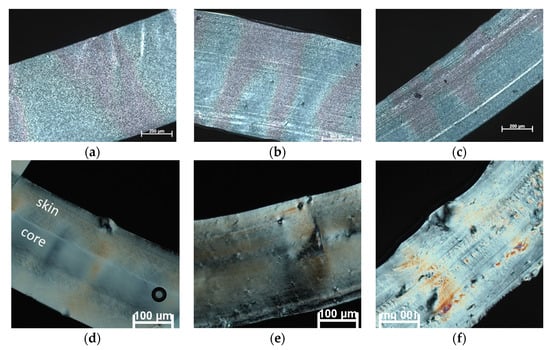
Figure 3.
Polarized optical microscopy (POM) images of as-extruded films. Top row shows samples cooled with open chill rolls: (a) sample 1.1: PCL, (b) sample 3.1: PCL + 2 wt% sep; (c) sample 5.1: PCL + 4 wt% sep. Bottom row shows samples cooled with closed chill rolls: (d) sample 2.1: PCL, (e) sample 4.1: PCL + 2 wt% sep, (f) sample 6.1: PCL + 4 wt% sep. The white arrows indicate the extrusion direction.
The dispersion of the sepiolite needles within the polymer matrix in both drawn and undrawn nanocomposite samples was investigated using TEM. Figure 4 shows that the sepiolite needles are well dispersed throughout the samples. The sepiolite is present as either individual needles or agglomerates of a few needles thick. The length distribution is very large due to the high shear forces in the extruder. These high shear forces are needed to break down the sepiolite bundles or agglomerates, but can also cause break-up of the needles themselves, reducing their aspect ratio, and, hence, their reinforcing efficiency. Moreover, it is also shown that needles are already highly oriented by the cast-film extrusion process, and that this orientation is independent of the cooling process. Interestingly, the needles also seem to break-up into smaller fragments upon drawing, with these smaller fragments oriented at an angle of 45° or 90° to the drawing direction. The difference between the two solidification or cooling methods is that these small fragments of broken sepiolite needles could not be found in undrawn as-extruded samples cooled with open chill rolls while they were already present in samples cooled with closed rolls. After drawing, similar filler structures were found in both samples. It was hypothesized that this break-down of needles is the result of melt-elasticity of the polymer network, which relaxes upon release of the stresses imposed in the die and, thereby, leads to fracture of the needles. A similar phenomenon has been observed in PP/nanoclay composites [47] and was referred to as the formation of a house-of-card structure. The origin was not fully understood, but it was mainly attributed to either the elongational flow field or interaction between the modified polymer and the layered silicates.
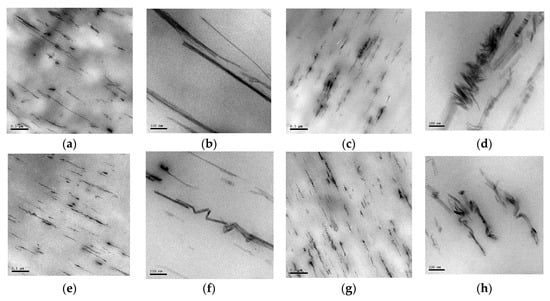
Figure 4.
TEM images of samples of PCL + 2 wt% sep. (a) and (b) sample 3.1: undrawn sample, cooled with open chill rolls, (c) and (d) sample 3.3: drawn samples cooled with open chill rolls, (e) and (f) sample 4.1: undrawn sample cooled with closed chill rolls, and (g) and (h) sample 4.3: drawn samples cooled with open chill rolls. The white line in the pictures indicates the extrusion direction.
Even though the majority of the TEM images showed well dispersed sepiolite needles, it has to be mentioned that large agglomerates were occasionally observed in both drawn and undrawn samples when a larger sample area was scanned (see Figure 5). These agglomerates are believed to be linked to the uneven feed of the extruder, where the concentration of sepiolite powder fed to the extruder could suddenly increase after the occurrence of arching or hopper bridging. Once the bridge collapses, a sudden surge or flood of sepiolite powder to the extruder occurs, leading to local variations in filler content. In order to avoid these problems in the future, it is recommended to use gravimetric feeding systems for better control of the feed to the extruder.
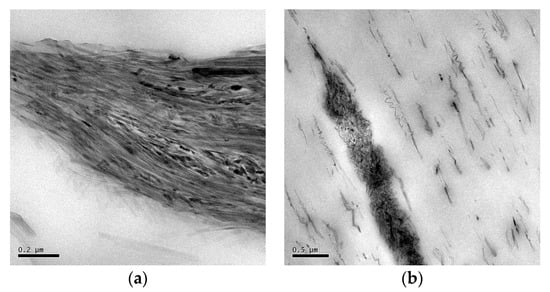
Figure 5.
TEM images of large agglomerates found in both (a) drawn, and (b) undrawn samples of PCL + 2 wt% sep.
3.2. Crystallization Behavior
In Figure 6, DSC thermograms of as-extruded films obtained from the first heating run are presented. In the thermograms, the difference between samples cooled with open and closed chill rolls is visualized. The peak area is larger for films solidified with closed chill rolls, indicating a higher degree of crystallinity in those samples. This result is somewhat unexpected, since one would expect that slowly cooled samples would reach a higher degree of crystallinity. However, as seen in the optical microscopy pictures, the morphology of the samples is also different with a spherulitic structure in the films prepared with open chill rolls, and no visible spherulites in the films produced with closed chill rolls.
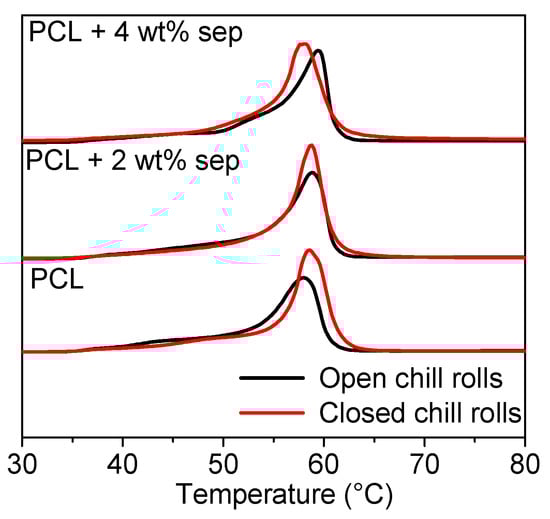
Figure 6.
Melting peaks from the first heating run of DSC experiments. The solid black lines represent samples obtained with open chill rolls (slow cooling) and the red lines are for samples obtained with closed chill rolls (rapid cooling), indicating a higher degree of crystallinity for the latter.
Samples with sepiolite do generally show a narrower peak than neat PCL, which is an indication of the nucleating ability of the sepiolite. Data extracted from these thermograms can be found in Appendix C. A small increase in the onset of crystallization temperature in the filled samples confirms the limited nucleation ability of the PCL. This is in line with previous studies, showing a maximum nucleating efficiency of ~20% for PCL/sepiolite nanocomposites [42].
DSC trajectories of the first heating run of the drawn samples are depicted in Figure 7. In the drawn samples, the melting peak is shifted to the right, which is indicative of a more stable crystalline structure after drawing. The melting peaks are broad, indicating that different sizes or structures of crystals are present in the samples. L’Abee described the deformation behavior of PCL, which is very similar to polyethylene. Upon deformation, the spherulites are first broken up into small crystallites, which, upon further deformation, are reorganized into fibrils [48]. The broad melting trajectories observed here indicate that this reorganization might not have fully taken place, and, as a result, the structure is a mix of stable fibrillar crystals and not yet transformed spherulites.
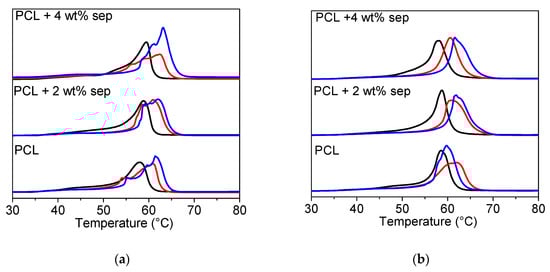
Figure 7.
Heating trajectories obtained from DSC experiments. (a) Samples cooled with open chill rolls. (b) Samples cooled with closed chill rolls. Solid black lines are for undrawn films, red lines are intermediate, and blue lines are for highly drawn tapes.
In order to quantify the changes in melting behavior observed in Figure 7, the melting temperature and the degree of crystallinity were calculated (Appendix C). As already mentioned, the melting temperature is increased upon drawing and slightly higher values are obtained in the nanocomposites as compared to the reference. This indicates that the drawing step is more efficient in the nanocomposites. The degree of crystallinity is also generally higher in the nanocomposite samples, underpinning the hypothesis that sepiolite facilitates the transformation from a spherulitic structure to a more fibrous structure and concomitant recrystallization. However, it must be emphasized that the uncertainty in the calculations of the degree of crystallinity is large due to irregular heating trajectories.
3.3. Mechanical Properties
In Figure 8, a comparison of the tensile modulus as a function of draw ratio for films cooled with open and closed chill rolls is shown. The dotted lines are mere guides for the eye. At a drawn ratio of one, i.e., as-extruded cast films, a remarkable increase in tensile modulus of samples cooled with closed chill rolls is observed. However, as mentioned before, the drawability of samples cooled with closed chill roles is limited. A maximum draw ratio of only 3 was obtained. However, the increase of the Young’s modulus with a draw ratio is much steeper for these samples and a modulus comparable to that for samples produced with open chill rolls and high draw ratios is obtained at much lower draw ratios.
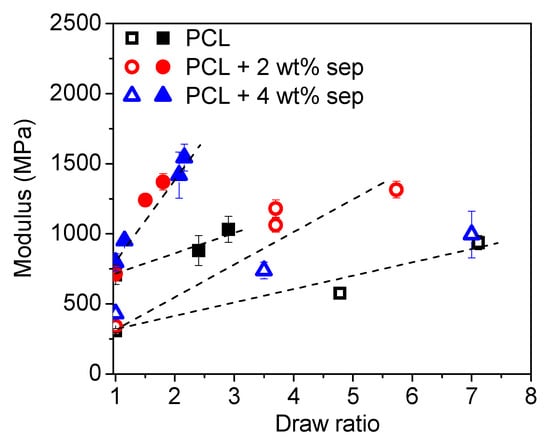
Figure 8.
Young’s modulus as a function of draw ratio for samples cooled with open (open symbols) and closed (closed symbols) chill rolls. The dotted lines are added as a guide for the eye.
In Figure 9, the tensile strength and the elongation at break of the various tapes as a function of draw ratio are presented. In the as-extruded undrawn cast films (DR1), no influence of filler addition is observed in the tensile strength, neither in samples cooled with open nor closed chill rolls, even though the latter show a higher initial tensile strength. In the samples, produced with open chill rolls, the elongation at break is increased slightly with filler content, from 590% for neat PCL to 630% for the PCL + 4 wt% sepiolite sample. In the films produced with closed chill rolls, the trend is the opposite, going down from ~150% for neat PCL to 90% for filled samples. Upon drawing, the tensile strength increases significantly for both sets of composite tapes, but the increase observed in films cooled with open chill rolls is more pronounced. The elongation at break decreases for all samples upon drawing but some samples are outside this trend, i.e., some samples of neat PCL and PCL + 4 wt% sepiolite showed no clear trend. It is, however, worth noting that some samples of neat PCL and PCL + 4 wt% sepiolite exhibited higher values for elongation at break than the 2 wt% composites. This indicates that these samples are less oriented, which could also be an explanation for their lower Young’ modulus and tensile strength. The samples cooled more rapidly with the chill rolls closed do, in general, show a much lower elongation at break, both in an undrawn state and a drawn state.
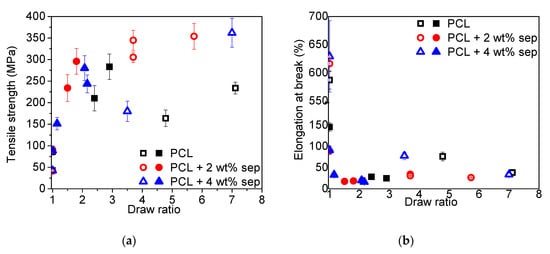
Figure 9.
(a) Tensile strength and (b) elongation at break as a function of the draw ratio of different tapes. Open symbols represent film samples prepared with open chill rolls and closed symbols represent samples prepared with closed chill rolls.
In Table 4, the mechanical properties of various PCL-based nanocomposites reported in literature [29,30,31,32,33,34,35,36,37,38,39,40,41,42] are summarized for comparison. The highest modulus was reported for composites with montmorillonite (MMT) clay with modulus and tensile strength values of 2.4 GPa and 32 MPa, respectively, for composites with 30 wt% MMT [36]. However, in most cases, a modest increase (<50%) in stiffness was observed with filler addition, often accompanied by a decrease in tensile strength. This is fully in line with data presented in this paper, where a 40% increase in stiffness was obtained for undrawn films cooled with open chill rolls, while tensile strength was unaffected. However, when the films were cooled with closed chill rolls, the difference between neat PCL and the nanocomposites is smaller, showing that there is a strong influence of processing conditions as well. This was also observed in drawn films of PCL/chitin nanocrystals [32] and PC/halloysite films [37] where the stiffness increase observed in undrawn nanocomposites was reduced or not at all present when these PCL nanocomposites were drawn to a draw ratio of 5. This is also in agreement with the results from the samples drawn with the open chill rolls where there is no difference between neat PCL and the 4 wt% nanocomposite. However, in this case, a large increase in tensile strength upon drawing was observed, and the values are much higher than any value reported in literature. For the samples cooled with closed chill rolls, an opposite trend is observed. In the undrawn samples, the effect of the sepiolite is negligible, and, after drawing, the increase in stiffness compared to neat PCL is ~50%, which is similar to what was obtained in literature for undrawn samples.
Table 4.
An overview of the mechanical properties (Young’s modulus, yield stress, and tensile strength from tensile tests or dynamic mechanical analysis (DMA) tests at RT), extracted from literature [29,30,31,32,33,34,35,36,37,38,39,40,41,42]. Only the composition with the highest reported modulus and corresponding yield stress and tensile strength, or, in some case, the highest tensile strength, are presented together with values of neat PCL from each reference. The increase compared to neat PCL is listed in parenthesis. Any information on surface modifications is omitted. chitin NC = chitin nanocrystals, CNC = cellulose nanocrystals, CNT = carbon nanotubes, HNT = halloysite nanotubes, MMT = montmorillonite, MWNT = multi-wall carbon nanotubes.
3.4. Orientation
In order to obtain more information regarding orientation of the crystalline phase, 2D WAXD was used together with FTIR measurements, which provided information on the orientation of both the crystalline and the amorphous phase. 2D WAXD images of both drawn and undrawn samples are presented in Figure 10. The two strongest reflections correspond to the (110) and the (200) planes of the crystals. Undrawn films prepared with open chill rolls show isotropic Debye-Scherrer rings (Figure 10a), indicating that orientation of the crystalline phase is random in these films. This result corresponds well with the spherulitic structure observed in the optical microscopy images (see Figure 3). Upon drawing, arcs are formed at the meridional. Both (110) and (200) reflections appear perpendicular to the c-axis, indicating that, upon drawing, the chain axis orients in the drawing direction. The fact that both the (110) and the (200) arcs appear at the meridional suggests that there is a random orientation of crystallites in a plane perpendicular to the direction of drawing [49]. This hypothesis is also supported by the appearance of streaks at 2θ~16°, which indicates the formation of a ring-fiber orientation. In the sample prepared with closed chill rolls, a certain pre-orientation of the polymer crystals, characterized by arcs at the meridional is already visible in the as-extruded but undrawn films. Upon drawing, the size of these arcs is reduced as more and more crystals align in the drawing direction. When the polymer melt is allowed to solidify slowly, any orientation created in the polymer melt is relaxed, as shown by the isotropic rings in the undrawn samples cooled with open chill rolls (slow cooling). In the samples cooled with closed chill rolls, the solidification was faster and, therefore, the alignment induced by the melt-extrusion was frozen in. Even though the distance between the chill rolls was adjusted to only being in light contact with the polymer film, it is clear from the increased width of the films produced with closed chill rolls that some pressure was applied to the melt. In fact, the polymer was squeezed through the gap between the chill rolls, resulting in orientation at the same time as it was cooled down with the rapid solidification leading to freezing in orientation (Figure 10b). From the 2D WAXD images, no clear influence of filler addition on the orientation of polymer crystals was observed. In the 2D WAXD images, the (100) reflection of the clay can also be found at 2θ ~7°. In the undrawn samples cooled with open chill rolls, an isotropic ring is seen, indicating that the sepiolite needles are randomly distributed. In the undrawn samples cooled with closed chill rolls, the intensity of the isotropic ring is lower and the intensity is higher at the meridional, indicating that a pre-orientation of the sepiolite needles exists in these samples. Upon drawing, the isotropic rings are disappearing and are replaced by arcs. The intensity of the arcs is too low for a calculation of the orientation factor for the clay needles themselves, but the result is consistent with the TEM results, showing an orientation of the clay needles in the drawing direction.
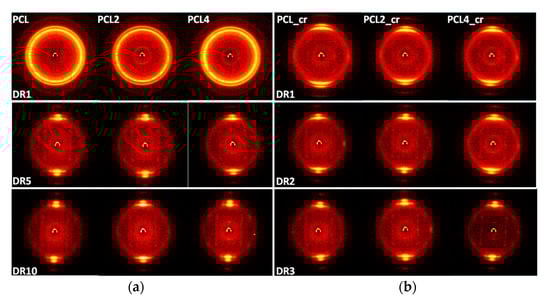
Figure 10.
2D WAXD images recorded through-thickness of the films. (a) Films cooled with open chill rolls and (b) films cooled with closed chill rolls. The drawing direction is horizontal in the images.
By integrating the width of the arcs of the (110) and the (200) reflection of the PCL, the Hermans’ orientation factor for the polymer crystals can be calculated. The results of these calculations are presented in Figure 11. The orientation of the c-axis with respect to the drawing direction is denoted Fc. For films solidified with open chill rolls, a close to anisotropic orientation is observed in the undrawn samples, but, in all drawn samples, the crystals are oriented with the c-axis parallel to the drawing direction. In samples prepared with closed chill rolls, significant orientation of the crystalline phase is already induced by the cast-film extrusion and solidification step, and, upon drawing, smaller improvements in orientation are obtained. From this graph, no influence of filler addition on the orientation of the crystalline phase can be observed. However, sepiolite needles are expected to be present in the amorphous phase and it is, therefore, also of interest to evaluate the influence of this filler on the orientation of the amorphous phase. This was done via FTIR measurements.
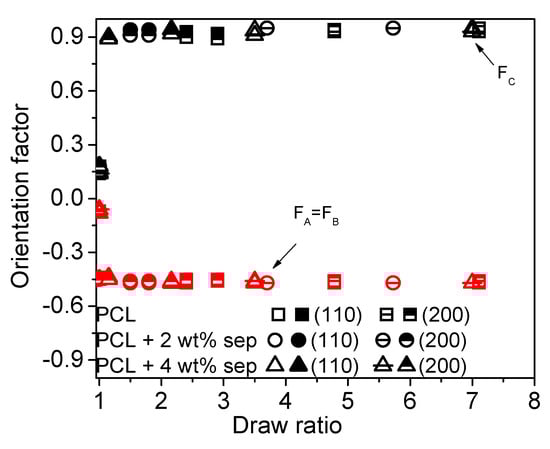
Figure 11.
The Hermans’ orientation factor calculated from the 2D WAXD images. The open symbols correspond to films processed using open chill rolls, while the closed symbols correspond to closed chill rolls. Both the orientation calculated from the (110) and the (200) directions are plotted. The black symbols show the orientation factor of the c-axis of the crystals. The red symbols show the orientation factor calculated for the a-axis and b-axis of the polymer crystals.
By performing ATR-FTIR measurements using cross-polarizers, the orientation of a specific bond can be evaluated. By choosing an absorption band specific to a bond belonging to the amorphous or crystalline phase, the orientation of the different phases can be investigated independently. In Figure 12, the orientation factors calculated from peaks corresponding to different C-O bonds are presented. The orientation factor of the crystalline phase as calculated from the peak at wavenumbers around 1295 cm−1 corresponds well to data obtained from wide-angle X-ray scattering (WAXS) experiments. In samples cooled slowly with open chill rolls, nearly isotropic orientation is observed in the undrawn films, but already, at a draw ratio of 5, most of the crystals are fully oriented with the c-axis parallel to the drawing direction. In the samples cooled rapidly with closed chill rolls, high levels of orientation are already induced after film extrusion and solidification, while, upon drawing, only a small increase in orientation is observed. No significant influence of filler addition on the orientation of the crystalline phase is observed. For the calculation of the orientation factor of the amorphous phase, a deconvolution of the peak around 1150–1200 cm−1 into three separate peaks was necessary from which the peak at the lowest vibration band corresponds to the amorphous phase. In the undrawn films, the initial orientation of the amorphous phase is low for samples cooled slowly with open chill rolls. However, upon drawing, the amorphous phase orients and rather high levels of orientation are obtained at high draw ratios. In samples prepared with closed chill rolls, the orientation of the amorphous phase is initially much higher but remains fairly constant with an increasing draw ratio. Similar to crystalline orientation, upon orientation of the amorphous phase, no clear influence of filler addition is observed.
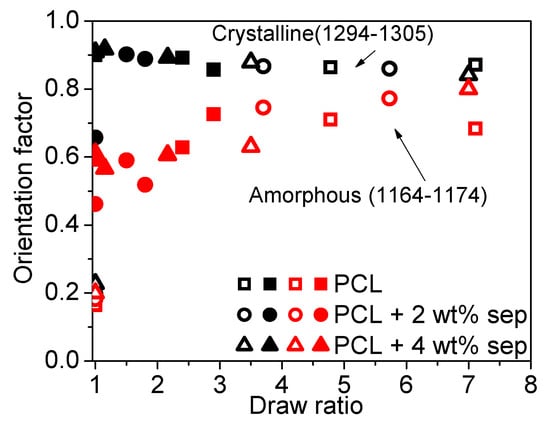
Figure 12.
Orientation functions as a function of the draw ratio. The calculations are performed based on C-O vibrations. The open symbols correspond to samples cooled with open chill rolls. The closed symbols to samples cooled with closed chill rolls. The black symbols show the orientation factor associated with the crystalline phase. The red symbols show the orientation factor calculated for the amorphous phase.
3.5. Micromechanical Modelling
In this paper, PCL was first melt-compounded with needle-like sepiolite nano-clays in a twin-screw extruder. These compounds were subsequently extruded into nanocomposite films, which was followed by solid-state drawing to create oriented nanocomposite tapes. Apparent pre-orientation of sepiolite needles in the machine and drawing direction was confirmed by 2D WAXD images (see Figure 10) for rapid, cooled samples using closed chill rolls. Samples cooled more slowly with open chill rolls showed full Debye-Scherrer rings for the clay reflection, indicating no preferred needle orientation. Calculations of the orientation factors using both WAXD and FTIR data confirmed this observation. The fact that films cooled with closed chill rolls deformed homogeneously without necking indicated that this extrusion induced pre-orientation. This was equivalent to a draw ratio of at least 3.5, since such a draw ratio was necessary to induce necking in films cooled slowly with open chill rolls. The total draw ratio of an oriented tape was then calculated using the formula below.
where is the total draw ratio, is the pre-orientation, and is the macroscopic draw ratio. The results are presented in Figure 13. When the draw ratio of samples cooled with closed chill rolls are corrected for pre-orientation, using = 3.5, two different cases can be identified. The filled samples roughly all fall on the same straight line, independent of cooling conditions, while the unfilled samples follow another straight line with a shallower slope.
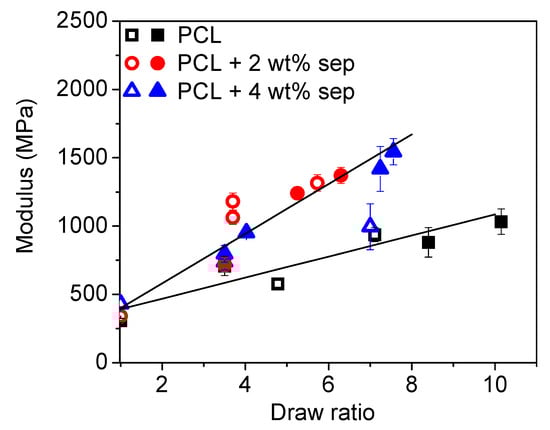
Figure 13.
The elastic modulus as a function of pre-orientation corrected for total draw ratio. Open symbols correspond to samples cooled with open chill rolls, while closed symbols correspond to samples cooled with closed chill rolls.
In most micromechanical models, the assumption that the polymer matrix is unaffected by filler addition is required for the model to be valid [49]. This implies that, for fillers with a strong nucleating effect or any other significant effect on matrix morphology, such models are not valid. In order to test the validity of a micromechanical composite model, like the Halpin-Tsai model for our nanocomposite systems, the modulus is plotted as a function of the degree of crystallinity of the samples. The result is shown in Figure 14. The general trend is that a higher degree of crystallinity implies a higher modulus. However, since no clear influence of filler addition on crystallinity was observed, one can assume that, for these systems, filler addition did not significantly alter polymer morphology. This hypothesis is supported by the previously reported small nucleation effect of sepiolite nanofiller and the similarity in the orientation factor for all drawn tapes.
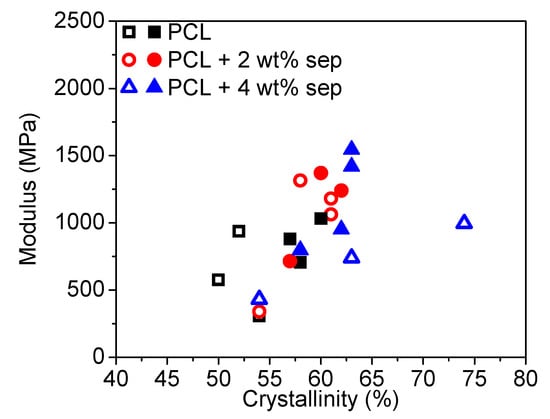
Figure 14.
Plot depicting the elastic modulus versus degree of crystallinity. The open symbols are for samples cooled with open chill rolls, while the closed symbols are for samples cooled with closed chill rolls.
The elastic modulus obtained from tensile testing (Young’s modulus) was compared to micromechanical predictions made using the Halpin-Tsai model. In a first step, the influence of filler addition on the as-extruded films was considered and the increase in modulus resulting from filler addition was predicted using an aspect ratio as a variable. In the calculations, a random orientation of the 1D filler was assumed and the modulus of the composite was described by Equation (3). In Figure 15, the relative modulus increase (Ecomposite/Ematrix) as a function of filler content is plotted together with Halpin-Tsai predictions based on random in-plane (2D) filler orientation. Based on these calculations, an aspect ratio (l/d) of 10 gave the best fit with the experimental data and was, therefore, used for further calculations. The diameter of the sepiolite needles used in this paper are typically 20–30 nm while the length is 1000–2000 nm. This gives a theoretical aspect ratio of 30–100. An aspect ratio of 10 is, therefore, much lower than usually reported for this sepiolite. However, these differences in aspect ratio are realistic when considering the break-up of sepiolite needles during the extrusion compounding step.
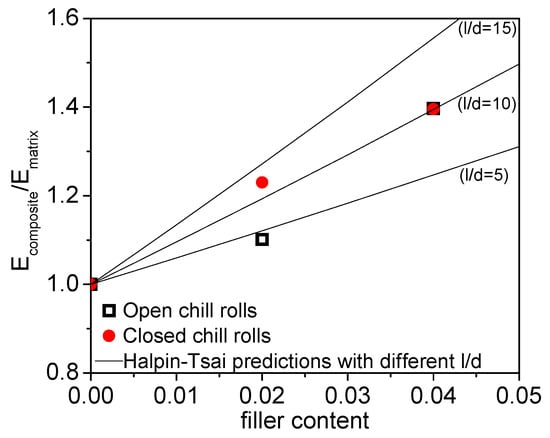
Figure 15.
The relative tensile modulus as a function of filler content. The open square symbols represent the samples cooled with open chill rolls and the closed circles of the samples cooled with closed chill rolls. The solid lines represent Halpin-Tsai predictions using different filler aspect ratios.
In a second set of calculations using a filler aspect ratio of 10, Halpin-Tsai predictions of the modulus of drawn tapes were performed. In these calculations, it was assumed that the sepiolite was uniaxially (1D) oriented in the drawing direction and, therefore, the composite modulus was calculated using Equation (4). In this set of calculations, a linear increase in modulus of PCL matrix with draw ratio was assumed. From the slope of this graph, the modulus of the polymer matrix at any draw ratio could be estimated. These moduli were used as input data for Halpin-Tsai predictions of drawn nanocomposite tapes. The results are presented in Figure 16.
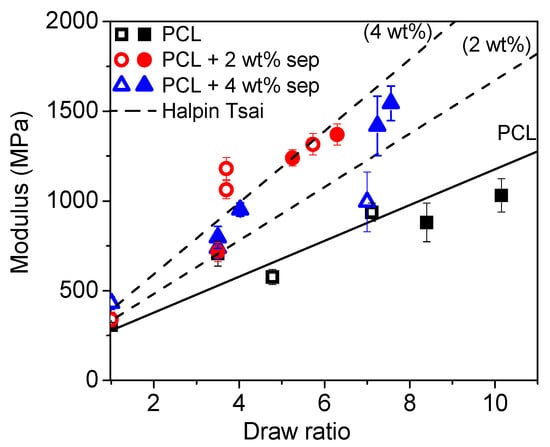
Figure 16.
Modulus as a function of the draw ratio. Open symbols represent samples cooled with open chill rolls. Closed symbols represent samples cooled with closed chill rolls, corrected for matrix pre-orientation. The solid line shows the increase in modulus for neat PCL. The dotted lines show Halpin-Tsai predictions for l/d = 10. The filler is assumed to be uniaxially oriented in the direction of the drawing.
The result of the micromechanical modelling shows that the increase in stiffness of the composites with respect to the oriented polymer matrix corresponds well with predicted values for a nanocomposite containing 4 wt% sepiolite and a filler aspect ratio of 10. For rapidly cooled films with closed chill rolls, it should be remembered that TGA experiments indicated that samples with an intended filler content of 2 wt% actually contained as much as 4 wt% sepiolite and that the Halpin-Tsai predictions for these samples are, therefore, rather good. For the samples cooled with open chill rolls, the prediction is not as accurate with the 2 wt% sepiolite composites exceeding the modulus prediction, while the 4 wt% sepiolite sample does not meet up to the predicted modulus. The reason for this is most likely related to the uncertainty of the actual aspect ratio of the filler in the composites. It is, however, clear that adding more than 2 wt% nanofiller is not beneficial for the mechanical properties of the obtained composites.
4. Discussion
When compared to literature data, it becomes evident that both the stiffness and strength of the manufactured oriented tapes are unusually high and that similar moduli have previously only been reported for much higher filler loadings. From Figure 13, it is evident that the addition of sepiolite changes the drawing behavior of the polymer and that the relationship between modulus and the draw ratio is different as compared to neat PCL. In our previous work [42], it was hypothesized that the addition of sepiolite could potentially stabilize the drawing process so that a more highly oriented polymer is obtained. This was shown by an increased elongation at break for samples containing sepiolite and confirmed in this study by the results presented in Figure 9, where it could be seen that, for samples produced with open chill rolls, the elongation at break was increased slightly with filler content from 590% for neat PCL to 630% for PCL + 4 wt% sepiolite. However, in the actual solid-state drawing process, no difference in the attainable draw ratio could be observed between filled and unfilled samples. In addition, as shown in Figure 11 and Figure 12, there is no significant influence of sepiolite on orientation factors, neither for the crystalline nor for the amorphous phase. Therefore, it can be concluded that the influence of sepiolite is not merely to aid the orient of the polymer to higher draw ratios. Another possible explanation to the observed reinforcement effect could be that the nucleating effect of the sepiolite contributes to a higher overall crystallinity and, as a result, a higher modulus for systems containing sepiolite [20]. In Figure 14, we can see that the elastic modulus scales with crystallinity but, again, no clear influence of filler addition on overall crystallinity can be seen, so it can, therefore, be ruled out that a nucleation effect of the sepiolite is the reason behind the observed reinforcement effect. Instead, the insight obtained from the micromechanical modelling, together with observations of similar degrees of crystallinity and filler and polymer orientations in filled and unfilled samples, suggests that the reinforcement observed is due to the presence of the needle-like nanoclays in the PCL matrix and the good stress transfer between the polymer matrix and nanofiller.
It is also clear that the different solidification processes created different starting points for the subsequent solid-state drawing with slow cooling using open chill rolls, leading to the spherulitic structure observed in Figure 3, and no visible pre-orientation observed in the 2D WAXD images in Figure 10. In the films cooled with closed chill rolls, a certain level of pre-orientation of the polymer chains was already induced in the cooling step. POM images in Figure 3 showed a completely different structure when compared to the tapes cooled with open chill rolls with no visible spherulites. The 2D WAXD images presented in Figure 10 and the orientation factors calculated both from WAXD (Figure 11) and FTIR (Figure 12) confirms a certain pre-orientation of the polymer crystals, characterized by the appearance of arcs at the meridional in as-extruded undrawn films. In addition, the DSC measurements in Figure 6 revealed larger melting peaks for films solidified with closed chill rolls, indicating a higher degree of crystallinity in those samples. Upon drawing, the polymer film cooled slower with open chill rolls deformed by necking into an oriented transparent tape. Stable drawing was observed for macroscopic draw ratios between 3.5 and 10. For the samples cooled with open chill rolls, a stable drawing process was only obtained for draw ratios up to 3. The films deformed homogeneously, and no necking was observed. As expected, the stiffness (Young’s modulus) of the tapes increased with both filler addition and draw ratio (see Figure 8). As already mentioned, the drawability of samples cooled faster with closed chill roles is limited. A maximum draw ratio of only 3 was obtained. However, the increase of the Young’s modulus with draw ratio is much steeper for these samples as compared to samples prepared with open chill rolls. The fact that films cooled with closed chill rolls deformed homogeneously without necking suggests an extrusion-induced pre-orientation equivalent to a draw ratio of at least 3.5 since such a draw ratio was necessary to induce necking in films cooled slowly with open chill rolls. When the draw ratio of samples cooled with closed chill rolls is corrected for pre-orientation, the data overlaps, and two different types of drawing behavior can be identified including one for neat PCL and one for samples with sepiolite, as shown in Figure 13.
5. Conclusions
In this paper, the manufacturing of oriented PCL/sepiolite nanocomposite films or tapes was described. A twin-screw extruder equipped with a Sultzer mixer together with a bench top drawing unit was used for the extrusion and solid-state drawing of nanocomposite films. Nanocomposites containing 2 wt% and 4 wt% sepiolite together with neat PCL without sepiolite were successfully drawn to three different draw ratios. The influence of the solidification procedure during cast-film extrusion prior to solid-state drawing was investigated by cooling the films with either open (slow cooling) or closed (rapid cooling) chill rolls. Solidification using different chill rolls settings resulted in different morphological conditions, affecting subsequent post-drawing. FTIR and WAXD experiments revealed that pre-orientation existed in as-extruded cast films produced with closed chill rolls, leading to a reduction in maximum draw ratio in the subsequent drawing step. When the actual draw ratio of the tapes was corrected for pre-orientation, the modulus of all drawn tapes was proportional to the draw ratio, independent of cooling procedures, albeit following a different linear trend for filled and unfilled samples. The addition of sepiolite significantly improved the mechanical properties of both undrawn and drawn PCL films and tapes. The reported modulus (1.5 GPa) for drawn tapes with 4 wt% sepiolite cooled with closed chill rolls was among the highest ever reported for PCL nanocomposites. For samples cooled with open chill rolls, the tensile strength (360 MPa) was also among the highest ever reported for PCL-based nanocomposites. As shown by WAXD and FTIR, the orientation of the crystalline phase in the drawn samples was very high and similar for both solidification cases. However, a main difference was noted with respect to the orientation of the amorphous phase, which was higher for films cooled with closed rolls.
Author Contributions
Conceptualization, M.E., H.G., and T.P. Methodology, M.E., H.G., and T.P. Investigation, M.E. Resources, H.G. Data curation, M.E. Writing—original draft preparation, M.E. Writing—review and editing, T.P. Visualization, M.E. Supervision, H.G. Project administration, H.G. Funding acquisition, H.G. and T.P. All authors have read and agreed to the published version of the manuscript.
Funding
The project was funded by the Dutch Polymer Institute (DPI) under project number #623.
Conflicts of Interest
The authors declare no conflict of interest.
Appendix A
Calculating Herman’s Orientation Factor from WAXD Data
The crystal structure of PCL is very similar to that of polyethylene with an orthorhombic unit cell with unit cell parameters a = 7.40–7.47, b = 4.97–4.98, and c = 17.05–17.29 [50,51]. The c-axis is parallel to the polymer chain axis and could, therefore, be used for the calculation of chain orientation. In an isotropic 2D WAXD image, two main scattering rings are observed at Bragg angles of 21.4° and 23.7°. These peaks correspond to the (110) and the (200) reflections, respectively [52]. These reflections are commonly used for determining the orientation of the PCL crystals. The crystal orientation factor with respect to the drawing direction can be expressed as:
where φ is the angle between the c-axis of the normal of the crystal planes and the drawing direction and is the averaged mean-square cosine of the angle between the normal of a certain plane of all crystallites and the drawing direction. For a perfect alignment in the drawing direction, fH assumes a value of 1. For a random orientation, it is 0 and, for a perpendicular orientation, it is −1/2. From a 2D WAXD image, the can be calculated from the formula below.
where I(φ) is an intensity function that is dependent of the angle φ. Upon drawing, the initial isotropic Debye-Scherrer rings are transformed into arcs. By performing radial integration over the arc length of a specific reflection, the intensity function as a function of the azimuthal angle χ was obtained. The angle φ between the drawing direction and the normal of a certain plane was expressed as a function of the azimuthal angle χ, according to:
where θ is the Bragg angle of the chosen reflection. Once the intensity function is known, the Hermans’ orientation function can be calculated. Upon uniaxial drawing in the solid state, the c-axis of the PCL chains orient in the drawing direction. Measuring the Hermans’ orientations factor of the c-axis is, therefore, an indication of how effective the drawing procedure is in orienting the polymer crystals. The (001) reflection is, however, very weak and not suitable for measuring orientation. For an orthorhombic unit cell, the a-axis and the b-axis are, however, perpendicular to the c-axis, which means that the orientation of the c-axis with respect to the drawing direction can be determined indirectly from the (110) or the (200) reflection through the Wilchininsky relation [53,54].
Appendix B
Calculating Herman’s Orientation Factor from FTIR Data
A short description of the method will follow below, while a more detailed description can be found elsewhere [55]. All IR vibration modes have a transition-moment vector (M) at some angle α, to the major axis of the molecule. The intensity of the IR adsorption band depends on the angle between the incident radiation and this transition moment vector. This property was used to measure the orientation of the molecules in the sample. When a linear polarized radiation is used, there will be no adsorption of the electric vector (E) if the incident radiation is perpendicular to the transition moment vector and strong adsorption if they are parallel. The absorbance for the parallel polarized light is called AII and the perpendicular polarized light is called AT. The dichroic ratio, R, is defined as:
R = (AII)/(AT).
For a randomly oriented material, R = 1. For uniaxially-oriented samples like a drawn polymer, the dichroic ratio can be related to the Hermans’ orientation function, F. The Hermans’ orientation function can be described as:
where R0 is the dichroic ratio for a sample that is perfectly aligned in the drawing direction. If the molecules are uniaxially oriented in the drawing direction F = 1, if they are randomly oriented F = 0, and if the orientation is perpendicular to the drawing direction F= −0.5. R0 is different for every adsorption band and needs to be determined in order to study the molecular orientation. If we assume that, for a perfectly oriented sample, the polymer chain is perfectly oriented in the drawing direction. The transition moment lies on a cone with an angle to the chain-axis direction. In this case, the dichroic ratio, R0, can be described as:
where α0 is the direction of the transition moment with respect to the chain axes. If this angle is known, the average orientation of the chain segments can be determined from measurements of the dichroic ratio. For PCL, the orientation of the ester bond in the backbone of the polymer and the carbonyl side group can provide useful information on the orientation of both the amorphous and crystalline phase. The values for α0 were taken from literature, and were set to be 10° for the ester bond and 89° for the carbonyl group [56]. In Table 3, an overview of some characteristic vibration bands for PCL are presented.
Table A1.
Some characteristic vibration bands of PCL.
Table A1.
Some characteristic vibration bands of PCL.
| Vibration Band (nm−1) | Description | References |
|---|---|---|
| 1157–1161 | C-O amorphous | [57,58] |
| 1293–1295 | C-O crystalline | [57,59] |
| 1733–1737 | C=O amorphous | [56,58] |
| 1724–1725 | C=O crystalline | [56,58] |
A typical FTIR spectrum for oriented poly(ε-caprolactone) can be found in Figure A1. From this graph, it can be clearly seen that the absorbance at 0° and 90° to the drawing direction is significantly different. The insert shows an enlargement of the area between wave numbers 1500 to 900 cm−1. This is where vibrations of the C-O bond of the polymer backbone are found.

Figure A1.
Example of FTIR spectra measured for PCL. The black line corresponds to measurements performed with the polarizers at 90°, while the red line corresponds to measurements performed with the polarizers at 0°.
The carbonyl group is often used for calculating the orientation functions in PCL [56,59]. A magnification of the carbonyl spectra is shown in Figure A2. For the undrawn film samples, the absorbance at the two polarization angles is similar. Upon drawing, the intensity of the peak increases for both positions of the polarizers, but the difference between the two settings is rather small. The carbonyl group is a side group of the polymer backbone and will, therefore, always be at an angle with the drawing direction. Hence, there will always be a contribution of this side group to the intensity of the peak. The distinction between carbonyl groups in the amorphous and the crystalline phase is not straight forward due to the large overlap of the two peaks. Peak fitting must be performed in order to separate the peaks. Moreover, the peak positions are moving toward each other upon drawing, rendering peak separation even more difficult. In these experiments, the peak fitting did, therefore, not give reasonable results and, as a result, only data from calculations based on C-O vibrations are presented.

Figure A2.
Magnification of FTIR spectra showing the carboxyl group. The solid lines correspond to measurements performed with polarizers at 0°, while the dotted lines correspond to measurements performed with polarizers at 90°. (a) PCL cooled with open chill rolls. (b) PCL cooled with closed chill rolls.
Appendix C
Table A2.
Data obtained from DSC experiments of as-extruded film samples.
Table A2.
Data obtained from DSC experiments of as-extruded film samples.
| Sample | Sample Description | Chill Rolls | Filler Content (wt%) | Heating Cycle | Tonset (°C) | Tpeak (°C) | Xc (%) |
|---|---|---|---|---|---|---|---|
| 1.1 | PCL | open | - | 1st heating | 53 | 58 | 54 |
| 2nd heating | 53 | 56 | 48 | ||||
| cooling | 35 | 34 | 43 | ||||
| 2.1 | closed | - | 1st heating | 56 | 59 | 58 | |
| 2nd heating | 53 | 56 | 47 | ||||
| cooling | 35 | 34 | 41 | ||||
| 3.1 | PCL + 2 wt% sep | open | 1.9 | 1st heating | 54 | 59 | 54 |
| 2nd heating | 53 | 56 | 48 | ||||
| cooling | 36 | 35 | 42 | ||||
| 4.1 | closed | 4.3 | 1st heating | 56 | 59 | 57 | |
| 2nd heating | 54 | 56 | 47 | ||||
| cooling | 37 | 35 | 41 | ||||
| 5.1 | PCL + 4 wt% sep | open | 3.5 | 1st heating | 55 | 59 | 54 |
| 2nd heating | 53 | 56 | 48 | ||||
| cooling | 36 | 34 | 41 | ||||
| 6.1 | closed | 3.6 | 1st heating | 55 | 58 | 58 | |
| 2nd heating | 54 | 56 | 50 | ||||
| cooling | 38 | 36 | 44 |
Table A3.
Overview of thermal properties of the different undrawn and drawn samples. The values are calculated from the first heating curve of the DSC experiment.
Table A3.
Overview of thermal properties of the different undrawn and drawn samples. The values are calculated from the first heating curve of the DSC experiment.
| Sample | Sample Description | Chill Rolls | Draw Ratio | Tm,onset (°C) | Tm,peak (°C) | Xc (%) |
|---|---|---|---|---|---|---|
| 1.1 | PCL | open | DR1 | 53 | 58 | 54 |
| 1.2 | DR5 | 52 | 59 | 50 | ||
| 1.3 | DR10 | 54 | 58 | 52 | ||
| 2.1 | closed | DR1 | 56 | 59 | 58 | |
| 2.2 | DR2 | 55 | 58 | 57 | ||
| 2.3 | DR3 | 55 | 58 | 60 | ||
| 3.1 | PCL + 2 wt% sep | open | DR1 | 54 | 59 | 54 |
| 3.2 | DR5 | 58 | 58 | 61 | ||
| 3.3 | DR10 | 53 | 62 | 58 | ||
| 4.1 | closed | DR1 | 56 | 59 | 57 | |
| 4.2 | DR2 | 59 | 61 | 62 | ||
| 4.3 | DR3 | 57 | 61 | 60 | ||
| 5.1 | PCL + 4 wt% sep | open | DR1 | 59 | 59 | 54 |
| 5.2 | DR5 | 58 | 62 | 63 | ||
| 5.3 | DR10 | 60 | 63 | 74 | ||
| 6.1 | closed | DR1 | 55 | 58 | 58 | |
| 6.2 | DR2 | 58 | 62 | 62 | ||
| 6.3 | DR3 | 60 | 62 | 63 |
References
- Peterlin, A. Drawing and extrusion of semi-crystalline polymers. Colloid Polym. Sci. 1987, 265, 357–382. [Google Scholar] [CrossRef]
- Capaccio, G.; Ward, I.M. Ultra-high-modulus linear polyethylene through controlled molecular weight and drawing. Polym. Eng. Sci. 1975, 15, 219–224. [Google Scholar] [CrossRef]
- Peijs, T. 1.5 High Performance Polyethylene Fibers. In Comprehensive Composite Materials II; Beaumont, P.W.R., Zweben, C.H.P., Eds.; Elsevier Ltd.: Oxford, UK, 2018; Volume 1, pp. 86–126. [Google Scholar]
- Schimanski, T.; Peijs, T.; Lemstra, P.J.; Loos, J. Influence of post drawing temperature on mechanical properties of melt-spun isotactic polypropylene. Macromolecules 2004, 37, 1810–1815. [Google Scholar] [CrossRef]
- Schimanski, T.; Loos, J.; Peijs, T.; Alcock, B.; Lemstra, P.J. On the overdrawing of melt-spun isotactic polypropylene tapes. J. Appl. Polym. Sci. 2007, 103, 2920–2931. [Google Scholar] [CrossRef]
- Prevorsek, D.C.; Harget, P.J.; Sharma, R.K.; Reimschuessel, A.C. Nylon 6 fibers: Changes in structure between moderate and high draw ratios. J. Macromol. Sci. B Phys. 1973, 8, 127–156. [Google Scholar] [CrossRef]
- Long, S.D.; Ward, I.M. Tensile drawing behaviour of polyethylene terephthalate. J. Appl. Polym. Sci. 1991, 42, 1911–1920. [Google Scholar] [CrossRef]
- Zhang, J.M.; Hua, Q.; Reynolds, C.T.; Zhao, Y.; Dai, Z.; Bilotti, E.; Tang, J.; Peijs, T. Preparation of high modulus poly(ethylene terephthalate): Influence of molecular weight, extrusion, and drawing parameters. Int. J. Polym. Sci. 2017, 2781425. [Google Scholar] [CrossRef]
- Gorrasi, G.; Di Lieto, R.; Patimo, G.; De Pasquale, S.; Sorrentino, A. Structure–property relationships on uniaxially oriented carbon nanotube/polyethylene composites. Polymer 2011, 5, 1124–1132. [Google Scholar] [CrossRef]
- Jose, M.V.; Dean, D.; Tyner, J.; Price, G.; Nyairo, E. Polypropylene/carbon nanotube nanocomposite fibers: Process-morphology–property relationships. J. Appl. Polym. Sci. 2007, 103, 3844–3850. [Google Scholar] [CrossRef]
- Anad, A.K.; Jose, S.T.; Agarwal, U.S.; Sreekumar, T.V.; Banwari, B.; Joseph, R. PET-SWNT nanocomposite fibers through melt spinning. Int. J. Polym. Mat. 2010, 59, 438–449. [Google Scholar] [CrossRef]
- Wang, Z.; Ciselli, P.; Peijs, T. The extraordinary reinforcing efficiency of single-walled carbon nanotubes in oriented poly (vinyl alcohol) tapes. Nanotechnology 2007, 18, 455709. [Google Scholar] [CrossRef]
- Xu, X.; Uddin, A.J.; Aoki, K.; Gotoh, Y.; Saito, T.; Yumura, M. Fabrication of high strength PVA/SWNT composite fibers by gel spinning. Carbon 2010, 48, 1977–1984. [Google Scholar] [CrossRef]
- Ciselli, P.; Wang, Z.; Peijs, T. Reinforcing potential of carbon nanotubes in oriented polymer fibres. Mat. Tech. 2007, 22, 10–21. [Google Scholar] [CrossRef]
- Deng, H.; Bilotti, E.; Zhang, R.; Peijs, T. Effective reinforcement of carbon nanotubes in polypropylene matrices. J. Appl. Polym. Sci. 2010, 118, 30–41. [Google Scholar] [CrossRef]
- Fang, M.; Deng, H.; Tu, W.; Chankajorn, S.; Qiang, F.; Bilotti, E.; Peijs, T. Oriented poly(lactic acid)/carbon nanotube composite tapes with high electrical conductivity and mechanical properties. Macromol. Mater. Eng. 2015, 300, 1257–1267. [Google Scholar]
- Joshi, M.; Shaw, M.; Butola, B.S. Studies on composite filaments from nanoclay reinforced polypropylene. Fibers Polym. 2004, 5, 59–67. [Google Scholar] [CrossRef]
- La Mantia, F.P.; Dintcheva, N.D.; Scaffaro, R.; Marino, R. Morphology and properties of polyethylene/clay nanocomposite drawn fibers. Macromol. Mater. Eng. 2008, 293, 83–91. [Google Scholar] [CrossRef]
- Tsai, F.C.; Li, P.; Liu, Z.W.; Feng, G.; Zhu, P.; Wang, C.K.; Huang, C.Y.; Yeh, J.T. Drawing and ultimate tenacity properties of polyamide 6/attapulgite composite fibers. J. Appl. Polym. Sci. 2012, 126, 1906–1916. [Google Scholar] [CrossRef]
- Bilotti, E.; Deng, H.; Zhang, R.; Lu, D.; Bras, W.; Fischer, H.R.; Peijs, T. Synergistic reinforcement of highly oriented poly(propylene) tapes by sepiolite nanoclay. Macromol. Mater. Eng. 2010, 295, 37–47. [Google Scholar] [CrossRef]
- Bilotti, E.; Zhang, R.; Deng, H.; Quero, F.; Fischer, H.R.; Peijs, T. Sepiolite needle-like clay for PA6 nanocomposites: An alternative to layered silicates? Compos. Sci. Technol. 2009, 69, 2587–2595. [Google Scholar] [CrossRef]
- Van Erp, T.B.; Reynolds, C.T.; Bilotti, E.; Peijs, T. Nanoclay assisted ultra-drawing of polypropylene tapes. Nanocomposites 2019, 5, 114–123. [Google Scholar] [CrossRef]
- Uddin, A.J.; Araki, J.; Gotoh, Y. Extremely oriented tunicin whiskers in poly (vinyl alcohol) nanocomposites. Polym. Int. 2011, 60, 1230–1239. [Google Scholar] [CrossRef]
- Uddin, A.J.; Araki, J.; Gotoh, Y. Toward “strong” green nanocomposites: Polyvinyl alcohol reinforced with extremely oriented cellulose whiskers. Biomacromolecules 2011, 12, 617–624. [Google Scholar] [CrossRef] [PubMed]
- Rangari, V.K.; Shaik, M.Y.; Mahfuz, H.; Jeelani, S. Fabrication and characterization of high strength Nylon-6/Si3N4 polymer nanocomposite fibers. Mat. Sci. Eng. A 2009, 500, 92–97. [Google Scholar] [CrossRef]
- Ciselli, P. The Potential of Carbon Nanotubes in Polymer Composites. Ph.D. Thesis, Technische Universiteit Eindhoven, Eindhoven, The Netherland, 25 April 2007. [Google Scholar] [CrossRef]
- Woodruff, M.A.; Hutmacher, D.W. The return of a forgotten polymer-polycaprolactone in the 21st century. Prog. Polym. Sci. 2010, 35, 1217–1256. [Google Scholar] [CrossRef]
- Li, Y.; Han, C.; Bian, J.; Zhang, X.; Han, L.; Dong, L. Crystallization and morphology studies of biodegradable poly(epsilon-caprolactone)/silica nanocomposites. Polym. Compos. 2013, 34, 131–140. [Google Scholar] [CrossRef]
- Eriksson, M.; Peijs, T.; Goossens, H. The effect of polymer molecular weight and silica nanoparticles on the rheological and mechanical properties of poly (ε-caprolactone). Nanocomposites 2018, 4, 112–126. [Google Scholar] [CrossRef]
- Avella, M.; Bondioli, F.; Cannello, V.; Di Pace, E.; Errico, M.E.; Ferrari, A.M.; Focher, B.; Malinconico, M. Poly(ε-caprolactone)-based nanocomposites: Influence of compatibilization on properties of poly (ε-caprolactone)-silica nanocomposites. Compos. Sci. Technol. 2006, 66, 886–894. [Google Scholar] [CrossRef]
- Chrissafis, K.; Antoniadis, G.; Paraskevopoulos, K.M.; Vassiliou, A.; Bikiari, D.N. Comparative study of the effect of different nanoparticles on the mechanical properties and thermal degradation mechanism of in situ prepared poly (ε-caprolactone) nanocomposites. Compos. Sci. Technol. 2007, 67, 2165–2174. [Google Scholar] [CrossRef]
- Habibi, Y.; Goffin, A.L.; Schiltz, N.; Duquesne, E.; Dubois, P.; Dufresne, A. Bionanocomposites based on poly(ε-caprolactone)-grafted cellulose nanocrystals by ring-opening polymerization. J. Mat. Chem. 2008, 18, 5002–5010. [Google Scholar] [CrossRef]
- Wu, X.; Torres, F.G.; Vilaseca, F.; Peijs, T. Influence of the processing conditions on the mechanical properties of chitin whisker reinforced poly (caprolactone) nanocomposites. J. Biobased Mater. Bioenergy 2007, 1, 341–350. [Google Scholar] [CrossRef]
- Kai, W.; Hironata, Y.; Hua, L.; Inoue, Y. Thermal and mechanical properties of a poly (ε-caprolactone)/graphite oxide composite. J. Appl. Polym. Sci. 2008, 107, 1395–1400. [Google Scholar] [CrossRef]
- Lepoittevin, B.; Devalckenaere, M.; Pantoustier, N.; Alexandre, M.; Kubier, D.; Calberg, C.; Jerome, R.; Dubois, P. Poly(ε-caprolactone)/clay nanocomposites prepared by melt intercalation: Mechanical, thermal and rheological properties. Polymer 2002, 43, 4017–4023. [Google Scholar] [CrossRef]
- Di, Y.; Iannace, S.; Di Maio, E.; Nicolais, L. Nanocomposites by melt intercalation based on polycaprolactone and organoclay. J. Polym. Sci. Pol. Phys. 2003, 41, 670–678. [Google Scholar] [CrossRef]
- Chen, B.; Evans, J.R.G. Poly (ε-caprolactone)-clay nanocomposites: Structure and mechanical properties. Macromolecules 2006, 39, 747–754. [Google Scholar] [CrossRef]
- Bugatti, V.; Viscusi, G.; Naddeo, C.; Gorrasi, G. Nanocomposites based on PCL and halloysite nanotubes filled with lysozyme: Effect of draw ratio on the physical properties and release analysis. Nanomaterials 2017, 7, 143–154. [Google Scholar]
- Ludeña, L.N.; Alvarez, V.A.; Vazquez, A. Processing and microstructure of PCL/clay nanocomposites. Mat. Sci. Eng. A 2007, 460-461, 121–129. [Google Scholar] [CrossRef]
- Fukushima, K.; Tabuani, D.; Camino, G. Nanocomposites of PLA and PCL based on montmorillonite and sepiolite. Mater. Sci. Eng. C 2009, 29, 1433–1441. [Google Scholar] [CrossRef]
- Nikolic, M.S.; Petrovic, R.; Veljovic, D.; Cosovic, V.; Stankovic, N.; Djonlagic, J. Effect of sepiolite organomodification on the performance of PCL/sepiolite nanocomposites. Eur. Polym. J. 2017, 97, 198–209. [Google Scholar] [CrossRef]
- Amel, K.; Benhamida, A.; Kaci, M.; Bruzaud, S. Effects of montmorillonite, sepiolite, and halloysite clays on the morphology and properties of polycaprolactone bionanocomposites. Polym. Polym. Compos. 2019. [Google Scholar] [CrossRef]
- Eriksson, M.; Goossens, H.; Peijs, T. The influence of melt-mixing conditions and state of dispersion on the crystallisation, rheology and mechanical properties of PCL/sepiolite nanocomposites. Int. Polym. Proc. 2020, 35, 303–313. [Google Scholar] [CrossRef]
- Avella, M.; Errico, M.E.; Rimedio, R.; Sadocco, P. Preparation of biodegradable polyesters/high-amylose-starch composites by reactive blending and their characterization. J. Appl. Polym. Sci. 2002, 83, 1432–1442. [Google Scholar] [CrossRef]
- Halpin, J.C.; Kardos, J.L. The Halpin-Tsai equations: A review. Polym. Eng. Sci. 1976, 16, 344–352. [Google Scholar]
- Beall, G.W.; Powell, C.E. Fundamentals of Polymer-Clay Nanocomposites, 1st ed.; Cambridge University Press: Cambridge, UK, 2011. [Google Scholar]
- Okamoto, M.; Nam, P.H.; Maiti, P.; Kotaka, T.; Hasegawa, N.; Usuki, A. A house of cards structure in polypropylene/clay nanocomposites under elongational flow. Nano Lett. 2001, 1, 295–298. [Google Scholar] [CrossRef]
- L’Abee, R.; van Duin, M.; Goossens, H. Deformation mechanisms of sub-micrometer thermoplastic vulcanizates obtained by reaction-induced phase separation of miscible poly(e-caprolactone) /dimethacrylate systems. Soft Matter 2017, 13, 6905–6912. [Google Scholar] [CrossRef]
- Fornes, T.D.; Paul, D.R. Modeling properties of nylon 6/clay nanocomposites using composite theories. Polymer 2003, 44, 4993–5013. [Google Scholar] [CrossRef]
- Bittiger, H.; Marchessault, R.H. Crystal structure of poly-ε-caprolactone. Acta Crystallogr. 1970, 26, 1923–1927. [Google Scholar] [CrossRef]
- Chatani, Y.; Okita, Y.; Tadokoro, H.; Yamashita, Y. Structural studies of polyesters. III. Crystal structure of poly-ε-caprolactone. Polym. J. 1970, 1, 555–562. [Google Scholar] [CrossRef]
- Zhang, Y.; Leblanc-Boily, V.; Zhao, Y.; Prud’homme, R.E. Wide angle X-ray diffraction investigation of crystal orientation in miscible blend of poly(ε-caprolactone)/poly(vinyl chloride) crystallized under strain. Polymer 2005, 46, 8141–8150. [Google Scholar] [CrossRef]
- Wilchinsky, Z.W. Recent developments in measurement of orientation in polymers by X-ray diffraction. Adv. X-ray Anal. 1962, 6, 231–241. [Google Scholar] [CrossRef]
- Lafrance, C.P.; Pézolet, M.; Prud’homme, R.E. Study of the distribution of molecular orientation in highly oriented polyethylene by x-ray diffraction. Macromolecules 1991, 24, 4948–4956. [Google Scholar] [CrossRef]
- Koenig, J.L. Spectroscopy of Polymers, 2nd ed.; Elsevier Science Inc.: New York, NY, USA, 1991. [Google Scholar]
- Van Casteren, I.A. Control of Microstructures to Induce Ductility in Brittle Amorphous Polymers. Ph.D. Thesis, Technische Universiteit Eindhoven, Eindhoven, The Netherland, 3 September 2003. [Google Scholar] [CrossRef]
- Elzein, T.; Nasser-Eddine, M.; Delaite, C.; Bistac, S.; Dumas, P. FTIR study of polycaprolactone chain organization at interfaces. J. Colloid Interface Sci. 2001, 273, 381–387. [Google Scholar] [CrossRef] [PubMed]
- Coleman, M.M.; Zarian, J. Fourier-transform infrared studies of polymer blends. II. Poly (ϵ-caprolactone)-poly (vinyl chloride) system. J. Polym. Sci. Pol. Phys. 1979, 17, 837–850. [Google Scholar] [CrossRef]
- Zhao, Y.; Keroack, D.; Prud’homme, R. Crystallization under strain and resultant orientation of poly (ε-caprolactone) in miscible blends. Macromolecules 1999, 32, 1218–1225. [Google Scholar] [CrossRef]
Publisher’s Note: MDPI stays neutral with regard to jurisdictional claims in published maps and institutional affiliations. |
© 2020 by the authors. Licensee MDPI, Basel, Switzerland. This article is an open access article distributed under the terms and conditions of the Creative Commons Attribution (CC BY) license (http://creativecommons.org/licenses/by/4.0/).