Article

Effect of Calcination Temperature on NO–CO Decomposition by Pd Catalyst Nanoparticles Supported on Alumina Nanofibers

1
Department of Chemical and Biomolecular Engineering, The University of Akron, Akron, OH 44325, USA
2
Department of Chemical Engineering, Jazan University, Jazan 45142, Saudi Arabia
3
Domnick Hunter Process Filtration Division, Parker-Hannifin Corporation, Oxnard, CA 93030, USA
*
Author to whom correspondence should be addressed.
Fibers 2017, 5(2), 22; https://doi.org/10.3390/fib5020022
Submission received: 28 April 2017 / Revised: 25 May 2017 / Accepted: 6 June 2017 / Published: 8 June 2017
(This article belongs to the Special Issue Nanofibers)

Abstract

:
In this work, palladium (Pd) nanoparticles were blended into a solution of a sacrificial polymer and an aluminum sol gel precursor to form alumina fibers containing the palladium particles. The polymer solution was electrospun into template submicron fibers. These fibers were calcined at temperatures between 650 °C and 1150 °C to remove the polymer and oxidize the aluminum. The internal crystalline morphologies of the calcined fibers transformed with change in the calcination temperature. The calcined fibers were formed into fibrous mats and further tested for their catalytic performances. The Pd particles had a size ranging from 5–20 nm and appeared randomly distributed within and near the surfaces of the alumina fibers. The final metal loading of all Pd/Al2O3 samples ranged from 4.7 wt % to 5.1 wt %. As calcination temperature increased the alumina crystal structure changed from amorphous at 650 °C to alpha crystal structure at 1150 °C. With the increase of calcination temperature, the average fiber diameters and specific surface areas decreased. The catalyst supported fiber media had good conversion of NO and CO gases. Higher calcination temperatures led to higher reaction temperatures from 250 to about 450 °C for total conversion, indicating the effective reactivity of the fiber-supported catalysts decreased with increase in calcination temperature. The fibers formed at the 650 °C calcination temperature had the highest reaction activity.

1. Introduction

The catalyzed reaction decomposition of NO with CO gases are of significant interests for environmental and health reasons. Latest advancements in the fabrication of submicron ceramic fibers facilitate as a means to fabricate fibrous catalyst support structures that may result in smaller catalytic converters, as well as new designs of catalyst support structures not available in the conventional monolithic or pelletized bed designs. The polymeric nanoscale supporting fibers provides enhancements such as restricting the migration of metal catalyst particles. Research and development on the performance of nanofiber-based catalysts is relatively new and scientific literature is very limited. Supported catalysts are used in several industries, including automotive and petro-chemicals, for controlling chemical reactions. The catalysts are often used to meet regulatory agency requirements to reduce harmful engine emissions [1,2]. Typical supported catalysts have metal catalyst particles attached to the surface of an inert support structure.
Many transition metals (Au, Ir, Fe, Ni, Pd, Pt, Rh, Zr and others) can be used as catalysts due to their inherent properties to selectively adsorb chemical species and to reduce activation energies of chemical reactions [3,4,5,6,7,8,9,10,11,12,13,14,15,16,17,18,19]. In many applications in the automotive industry, multi-metal catalysts are used simultaneously to introduce desired performances over a wide range of operating conditions (such as three-way noble metal Pt, Pd and Rh catalysts) [3,4,5,6]; metal oxide materials, which have multiple metal atoms such as Ce combined with transition metals (Fe, Au, Zr, Ti, Sn and others), can further enhance performance [7,17,18,19]. The noble metals (Pd or Pt) supported on alumina are frequently used for gas phase catalytic reactions due to their high activity and thermal stability [5,8,9,10,11,12,13].
Reaction performance can be enhanced by applying the catalyst as small nano- or micro-scale particles that have increased surface areas of the catalysts per unit mass of metal [20]. These small particles are often supported on an inert substrate for ease of handling and to immobilize the particles, preventing them from moving with the gas or liquid flow streams. A number of materials are used as the monolithic catalyst supports [21,22,23,24]. Recent attention has turned to the use of submicron fibers as catalyst support due to their high surface area, flexibility, and flow-through pore structures that make it easy for the reactants to reach the catalyst particles [24,25,26,27,28,29,30,31,32,33,34]. For high temperature applications, alumina is relatively inert and stable at elevated temperatures making it a commonly used support material [35]. Methods have been developed for fabrication of alumina fibers by electrospinning polymer precursor materials [36,37]. Catalyst particles such as Pd can be integrated within and near the surface of alumina submicron fibers by blending the catalyst particles into the sol gel electrospinning solution [20,33,34,38].
Alumina has different crystalline phases, depending on the fabrication temperature [39]. The different phases are known to affect the performance of impregnated catalysts in monolithic structures [40,41]. The small diameters of nanofibers may affect the crystal phases in alumina fibers, and the method of introduction of the catalyst particles into the sol gel precursor solution may introduce enough differences in the structure that experiments are needed to determine whether the crystal phases of the alumina in nanofiber form also affects the catalyst performance. A study of Pd catalyst supported on titania nanofibers showed that the concentration of the anatase phase of the titania affected the performance [9], hence it is likely that the same will occur with alumina, showing that this is a general phenomenon.
The aim of this work is to determine whether the crystalline phase of the alumina fibers affects the catalyst performance in the reaction of NO and CO gases. To avoid complications of experimental evaluation that occurs with multi-metal catalysts, only one metal catalyst (Pd) was selected for this work. The alumina fiber crystallinity was varied by controlling the calcination temperature. Experiments were conducted to observe the catalyst performance to react gaseous CO and NO.

2. Experimental

2.1. Materials

The aluminum precursor solution was prepared by mixing aluminum acetate (basic hydrate, (CH3CO2)2AlOH·XH2O, AlfaAesar, Thermo Fisher Scientific, Haverhill, MA, USA), formic acid, and distilled water at a weight ratio of 1:1:2.5, respectively. This mixture was well stirred overnight. A 9 wt % solution of polyvinylpyrrolidone (PVP, Sigma-Aldrich, St. Louis, MO, USA), MW: 1,300,000) was prepared by dissolving a polymer (PVP) in ethanol (AAPER alcohol, 200 proof). The PVP solution was mixed with the aluminum precursor solution in 1:2 weight ratios, respectively, for 12 h to achieve complete dissolution. Palladium chloride powder (Sigma-Aldrich, St. Louis, MO, USA), 60% Pd) was mixed into the resulting mixture in the ratio of 5 wt % PdCl2 with respect to aluminum acetate and stirred overnight at 40 °C using a magnetic stirrer [33].

2.2. Fabrication of PdCl2 Doped Aluminum Acetate/PVP Composite Submicron Fibers

In this work, electrospinning was used to form the polymer fiber templates with the PdCl2 particles and Aluminum acetate/PVP sol gel precursor material in the polymer [36,42,43,44,45,46]. The electrospinning setup is shown in Figure 1 with two metallic needles fed by a syringe pump, a power supply and a rotating drum collector.
Two plastic syringes Becton Dickinson (BD) 5 mL Syringe, (Thermo Fisher Scientific, Haverhill, MA, USA), were filled with a prepared electrospinning solution and attached to the syringe pump and the power supply. The syringe pump, (SP101I, WPI-World Precision Instruments), was adjusted to provide a 3 μL/min of the electrospinning solution at the tips of the 21 gauge steel needles. A distance of 12 cm was maintained between the tip of the needles and the rotating collectors. A 25 kV of electric voltage potential was applied to the needles from the power supply (Gama High Voltage, Ormond Beach, FL, USA) to launch the polymer jets [43,44].

2.3. Thermal Treatment of Electrospun PdO Doped Alumina Submicron Fibers

The collected electrospun submicron fibers were calcined in air to remove the polymer (PVP), to convert the aluminum precursor to alumina metal oxide form, and to convert the metal salt (PdCl2) to metal oxide (PdO). The PVP degrades at more than 450 °C. In this work, the fibers were calcined for 4 h at 650 °C, 750 °C, 850 °C, 950 °C, 1050 °C, and 1150 °C with a 10 °C/min ramping rate in a furnace (Baker Furnace, Inc. Laboratory Oven Model 13, Yorba Linda, CA, USA).

2.4. Preparation of Catalytic Fiber Media

Palladium catalytic fiber media were prepared by using a vacuum molding process. The custom-made vacuum mold apparatus consisted of a mixing tank, collecting tank, Plexiglas mold, and a vacuum pump. A liquid slurry contained four liters of deionized water with 0.5 g of chopped alumina microfibers (Saffil HA bulk fibers, Thermal Ceramics, Blacksburg, VA, USA), 0.05 g of PdO doped alumina submicron fibers (synthesized in this work), 0.02 g of corn starch, 0.5 mL of binder Megasol S50, Wesbond Corporation, Wilmington, DE, USA), and 20 drops of dilute H2SO4 acid. The acid was added to maintain the slurry at a pH ~ 6.0 and starch was added to enhance the binding capability of binder and fibers.
The slurry was mixed overnight using an agitator (Talboys Laboratory Stirrer with 2-inch paddle propeller) to obtain a uniform dispersion of materials. The slurry was placed into the mixing tank and agitated by bubbling air into the bottom of the tank. The slurry was drained through a filter paper (Schleicher & Schuell Whatman Cat No. 1113-090) supported by a stainless-steel mesh in a Plexiglas mold with an internal diameter of 2.3 cm. The liquid was drawn through the mold by vacuum into the collection tank with aid of a vacuum pump. The fibers were retained on the steel mesh covered by filter paper to form a wet fibrous cake and the wet cake was heated to 600 °C to dry the cake and bind the fibers together.

2.5. Reduction

The PdCl2 precursor was converted into PdO through the calcination process due to the reaction with oxygen in the air. The PdO was reduced into metalic Pd nanoparticles using hydrazine by the reaction [47]. The oxidized fiber media were placed in a ceramic crucible and placed inside a hood. Then, 3 mL of hydrazine monohydrate (N2H4·H2O, 98% purity) solution were added drop by drop to the media. An exothermic reaction occurred during the addition of the hydrazine solution, and the oxygen atoms were removed from the palladium oxide. The reduction of PdO to Pd was verified using X-ray diffraction peaks as discussed in the XRD section. The catalytic fiber media were stored inside the covered crucible until the exothermic reaction stopped and all smoke from the media terminated. The color of the media changed from brown to grayish black.

2.6. Catalytic Reaction Set up for NO Decomposition

For the reaction tests of the catalytic fiber media, three gases (He, CO and NO) were flowed through the media with controlled flow rates using three mass flow meters (Omega FLDA3428ST, FMA 5400, FMA 5500, Norwalk, CT, USA). The flowrates were adjusted as needed to vary the inlet flow rate and compositions for the experiments.
NO (nitric oxide 99.5%, Airgas, Radnor Township, PN, USA) and CO (carbon monoxide, 99.99%, Airgas) were used for testing the catalyst performance. The programmed temperature condition in gas chromatograph (GC, SRI 8610C) was 26 °C/30 min/0 °C/26 °C (initial temperature/holding time/temperature ramping/final temperature) to separate all the gases’ peaks. The exhaust gas line from the test sample holder was directly connected to inlet line of the GC and automatically injected by pressing the start run button of the computer. When the reactor temperature reached the set temperature in the monitor of the temperature controller, the reaction test was carried out. The reaction gases consisted of 3 mole/mole % NO, 3% CO, and 94% He, and the inlet volumetric flow rate was 100 sccm. The range of reaction temperatures was 100–500 °C.
The catalytic medium was placed in a steel reactor with a 2.3 cm diameter hole to hold the test sample. The reactor was wrapped with a heating tape (Omega FGS051-060, Norwalk, CT, USA) connected to a temperature controller (Micromega CN77000, Norwalk, CT, USA). Gas concentrations entering and exiting the reactor were measured with a gas chromatograph. Peak Simple software (Version 3.29, Norwalk, CT, USA) was used to calculate and display the peaks and concentrations of the components. Each experiment was repeated three times with different catalytic media samples at the same inlet flow rates and same inlet concentration ratio of the gases.

2.7. Characterization

Images (Figure 2) from a scanning electron microscope (SEM) (FEI Quanta 200 at 30 kV and HITACHI TM3000 at 15 kV, FEI, Portland, OR, USA) were analyzed to study the fiber morphologies and to determine the fiber diameter distributions. The diameters were measured directly from the SEM images using FibraQuant 1.3 software (nano Scaffold Technologies LLC, Chapelhill, NC, USA), and were displayed as the fiber size distribution curves as shown in Figure 3. Each histogram was generated out of at least 100 measurements. Energy dispersive X-ray analysis (EDX) (Bruker Quantax 70, Billerica, MA, USA) was used for the elemental quantification analysis.
Images from a transmission electron microscope (TEM) (JEM 1200XII and HRTEM, FEI Tecnai G2 F20, Portland, OR, USA) were used to study the fiber size, the catalytic particle size and the morphology of the PdO doped Al2O3 submicron fibers. Small pieces of fiber mats were cut and placed in acetone and ultrasonically vibrated to form suspensions. Drops of the suspensions were passed through a carbon coated copper grid, leaving the fiber on the grid for TEM imaging.
An X-ray diffractometer (Bruker AXS Dimension D8 X-ray, Billerica, MA, USA) was used to determine the crystal phase, the crystallinity, and the crystal size of the samples. A Cu anode (Kα1 = 0.154056 nm) was used. The voltage was set to 40 kV, whereas the current was set to 40 mA. Scans were collected with the step size of 0.1 deg and scan speed of 0.5 deg/min.
The Brunauer, Emmett and Teller (BET) surface areas of the fiber mats were measured using nitrogen gas adsorption. Each sample was dried in a clean dry tube at 100 °C for 4 h in a degas station (Micromeritics VacPrep 061, Norcross, GA, USA) to remove the moisture from the samples. The combined masses of the sample tube and stopper were determined to 0.1 mg precision using a calibrated microbalance (AX205, Mettler Toledo, Columbus, OH, USA). Surface areas were measured using a Surface Area and Porosity Analysis Instrument (Micromeritics Tristar II, Norcross, GA, USA). A value of 0.162 nm2 was used for the molecular cross-sectional area of N2 at 77 K.

3. Results and Discussion

3.1. Scanning Electron Microscopy Study

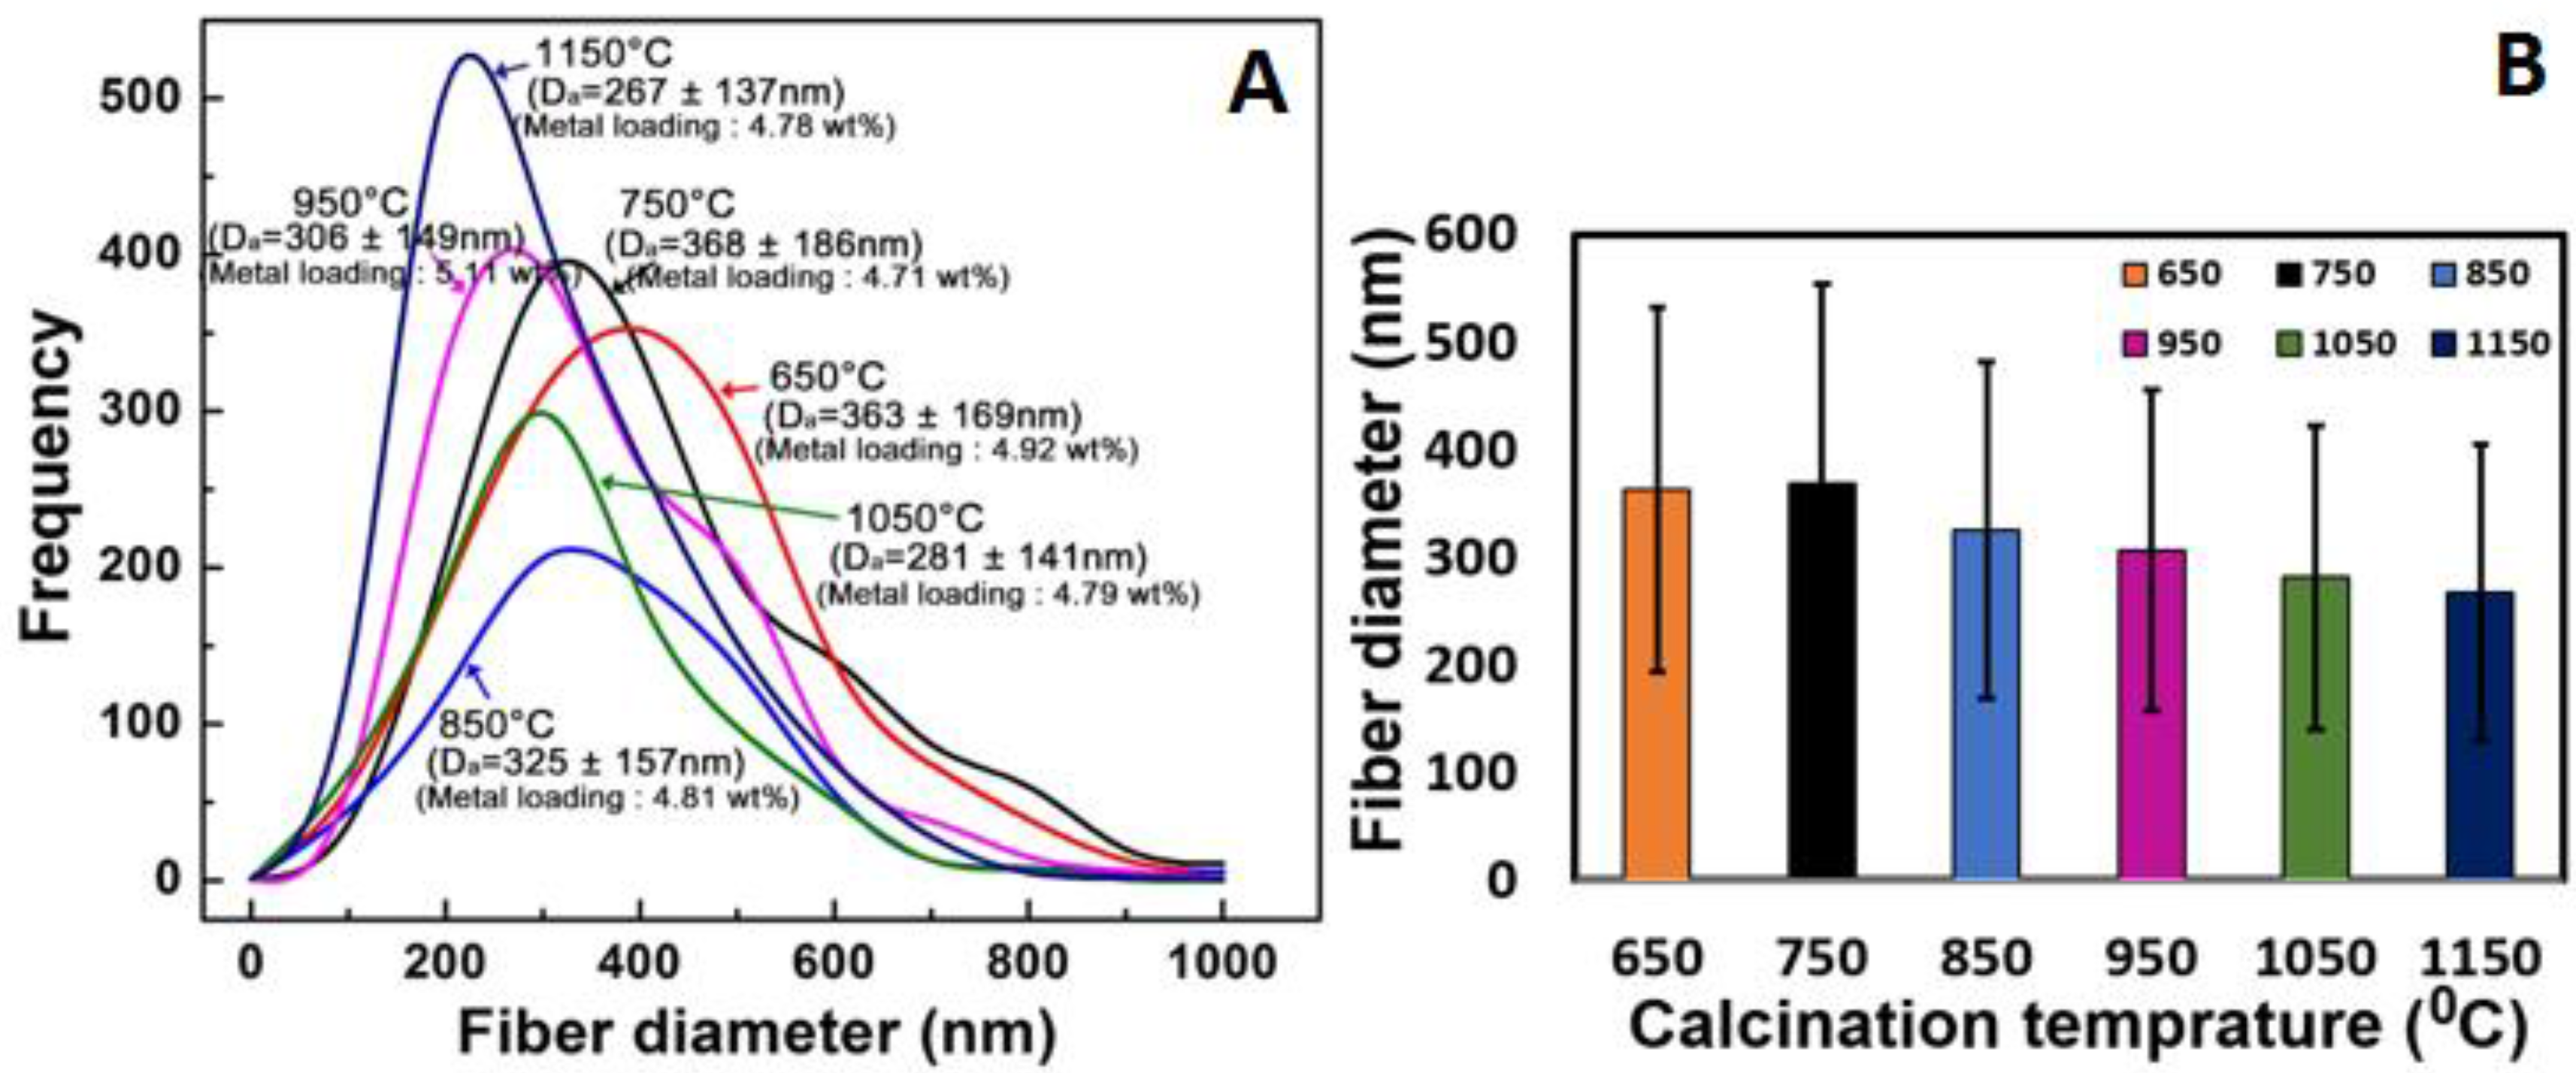
Figure 2 and Figure 3 show sample SEM images and the corresponding diameter distributions of the PdO/Al2O3 submicron fibers. Each distribution of the fiber diameters was measured from multiple fibers in at least 10 SEM images. The distribution curves show most of the fibers had diameters in the range of 100–700 nm. The trend in the distributions in Figure 3 shows that the average diameter of the Pd/Al2O3 fibers generally decreased with an increase in the calcination temperature.
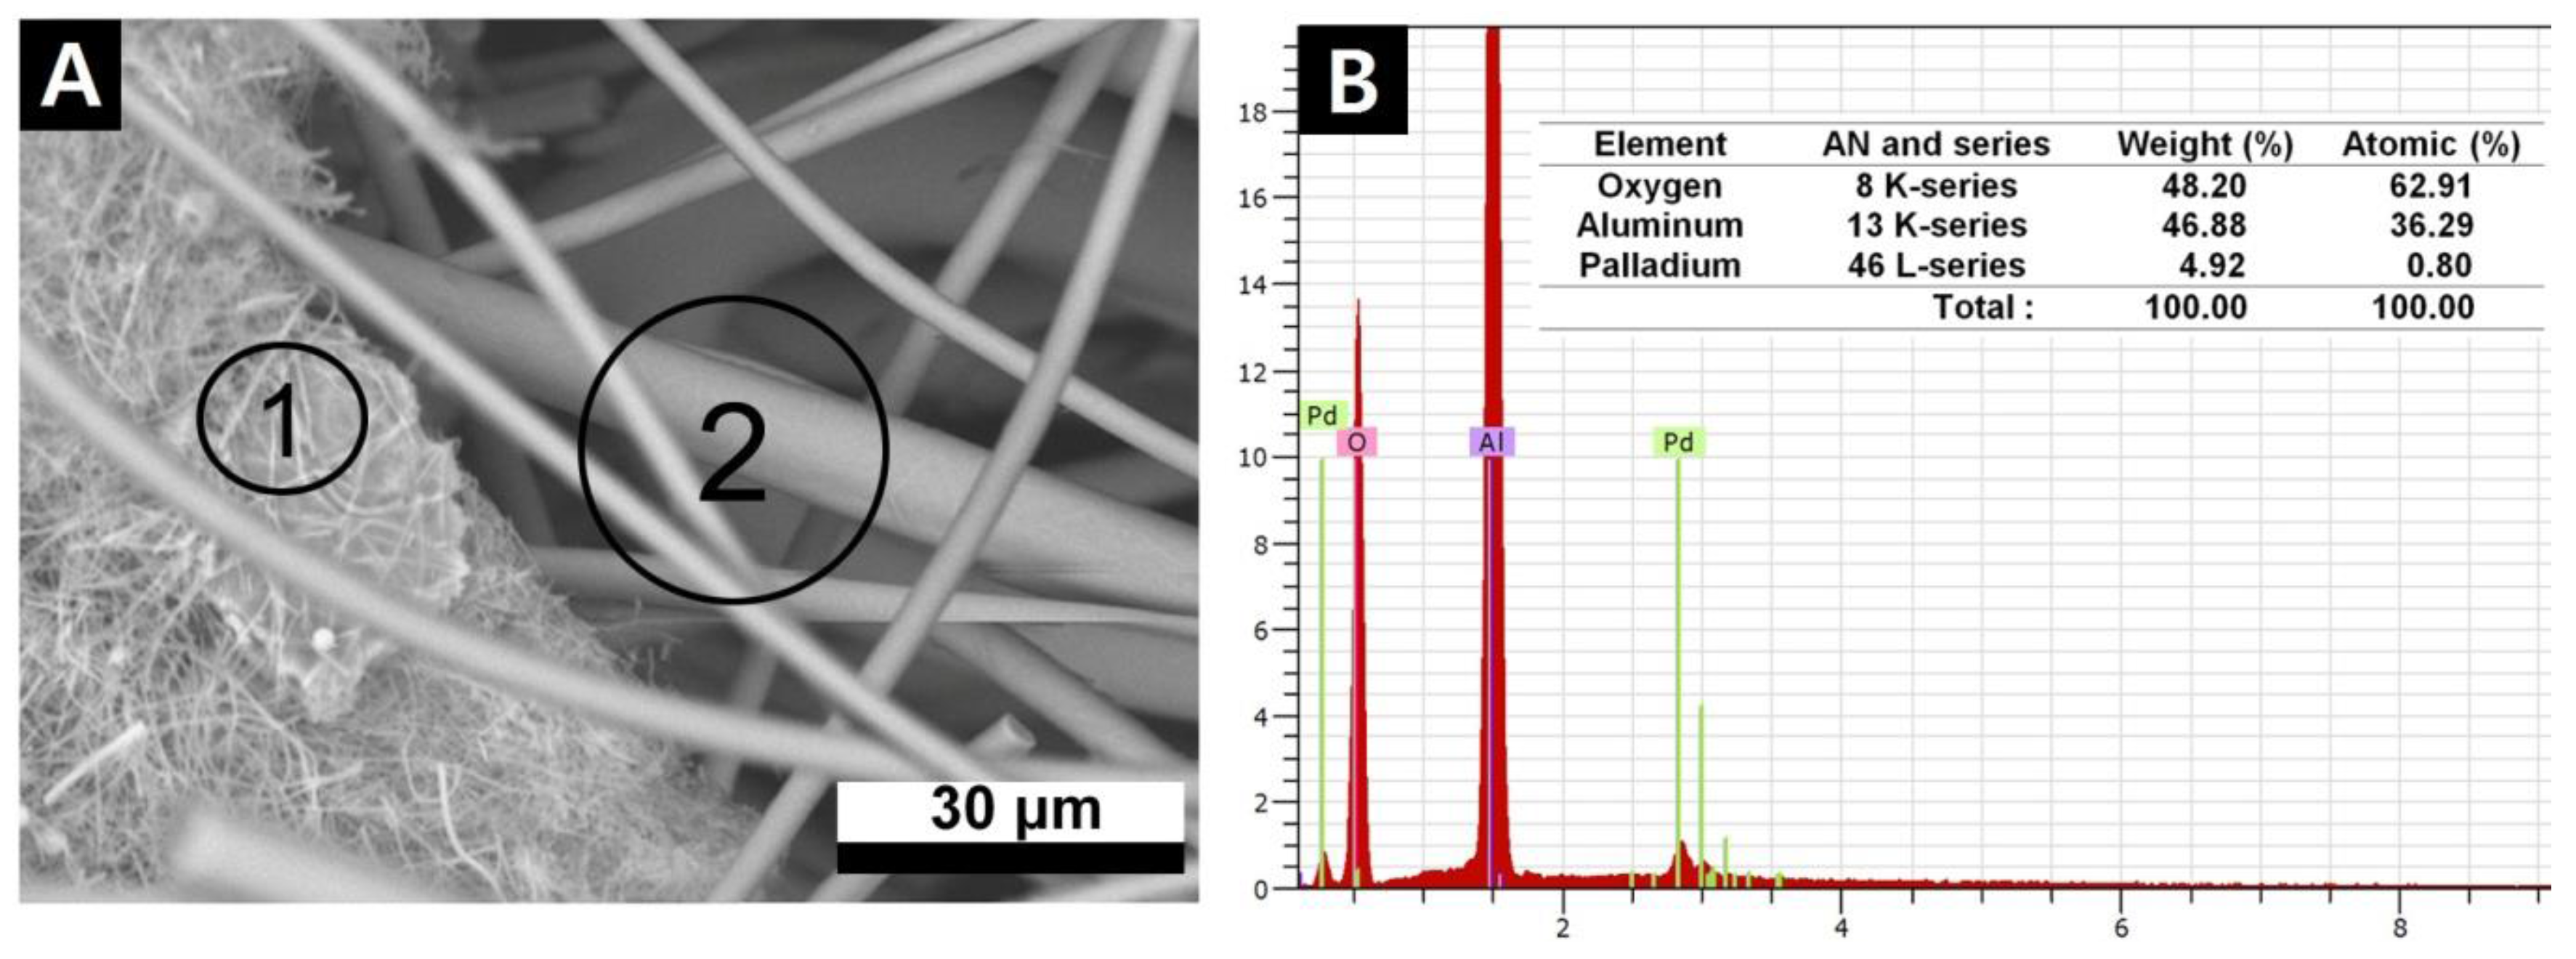
Figure 4A shows an SEM image of palladium alumina submicron fiber marked “1” and alumina micro fibers marked “2”. The submicron fibers were entrapped by the larger microfibers. Thus, this fiber structure formed by the vacuum molding process resulted in a hierarchical fiber size structure that provides strength to the medium, support for the submicron fibers, and a porous open structure with relatively high permeability. The size of microfibers were about 3–5 μm. Figure 4B shows the EDX spectra to quantify the elemental composition of Pd/Al2O3 nanofibers marked “1” in Figure 4A. The expected weight percent of palladium in the fiber media was 5% after calcination and reduction, based on the known starting material compositions. The element summary table in Figure 4B shows the measured amount of palladium in the fibers was very close to this, at 4.92%. The final metal loading of all the Pd/Al2O3 fiber samples ranged from around 4.7 wt % to 5.1 wt % and are labeled with the distribution curves in Figure 3.

3.2. Transmission Electron Microscopy Study (TEM)

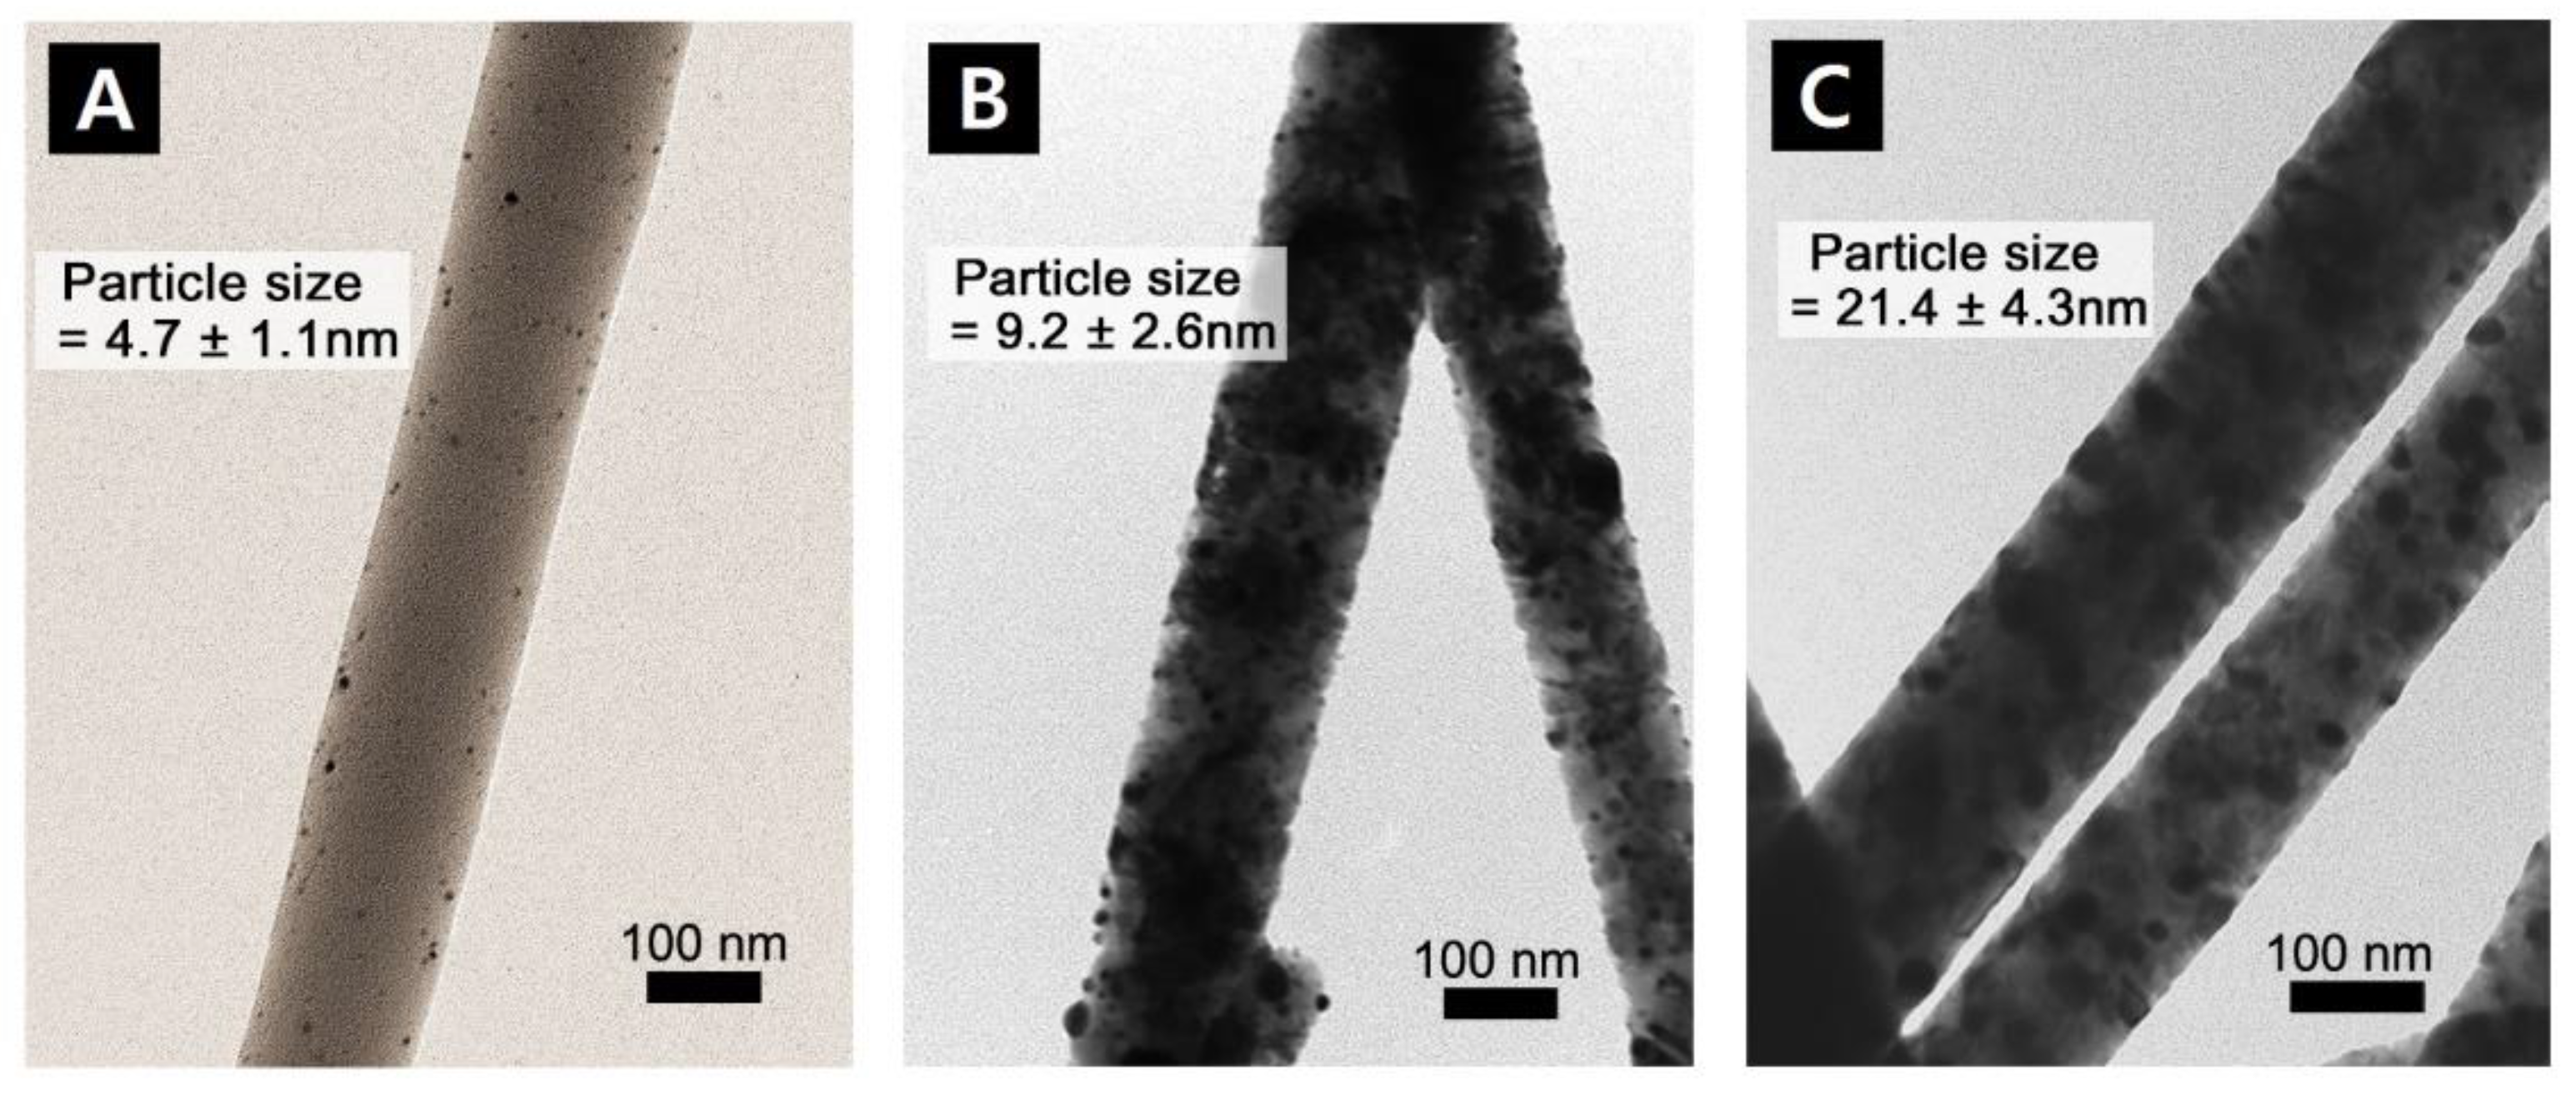
The morphologies of the fibers were observed using the TEM images [48]. Basically, the higher calcination temperatures had produced a rougher surface morphology. During the heat treatment, the crystallite growth of the Al2O3 nanofibers caused significant surface roughness and was consistent with observations reported in literature [49]. The images reveal that the Pd catalytic particles were dispersed within and near the surface of the alumina fibers. The Pd particles increased in size as temperature increased, as shown in Figure 5, from around 4.7 ± 1.1 nm for calcination at 650 °C to 21.4 ± 4.3 nm for calcination at 1050 °C. The increase in particle size may be a result of agglomeration due to higher mobility of the particles at higher temperatures. The larger Pd agglomerates in the fibers at higher temperatures gave a stronger signal in the X-ray diffraction (XRD) measurements as discussed in the next section.

3.3. X-ray Diffraction (XRD) Analysis

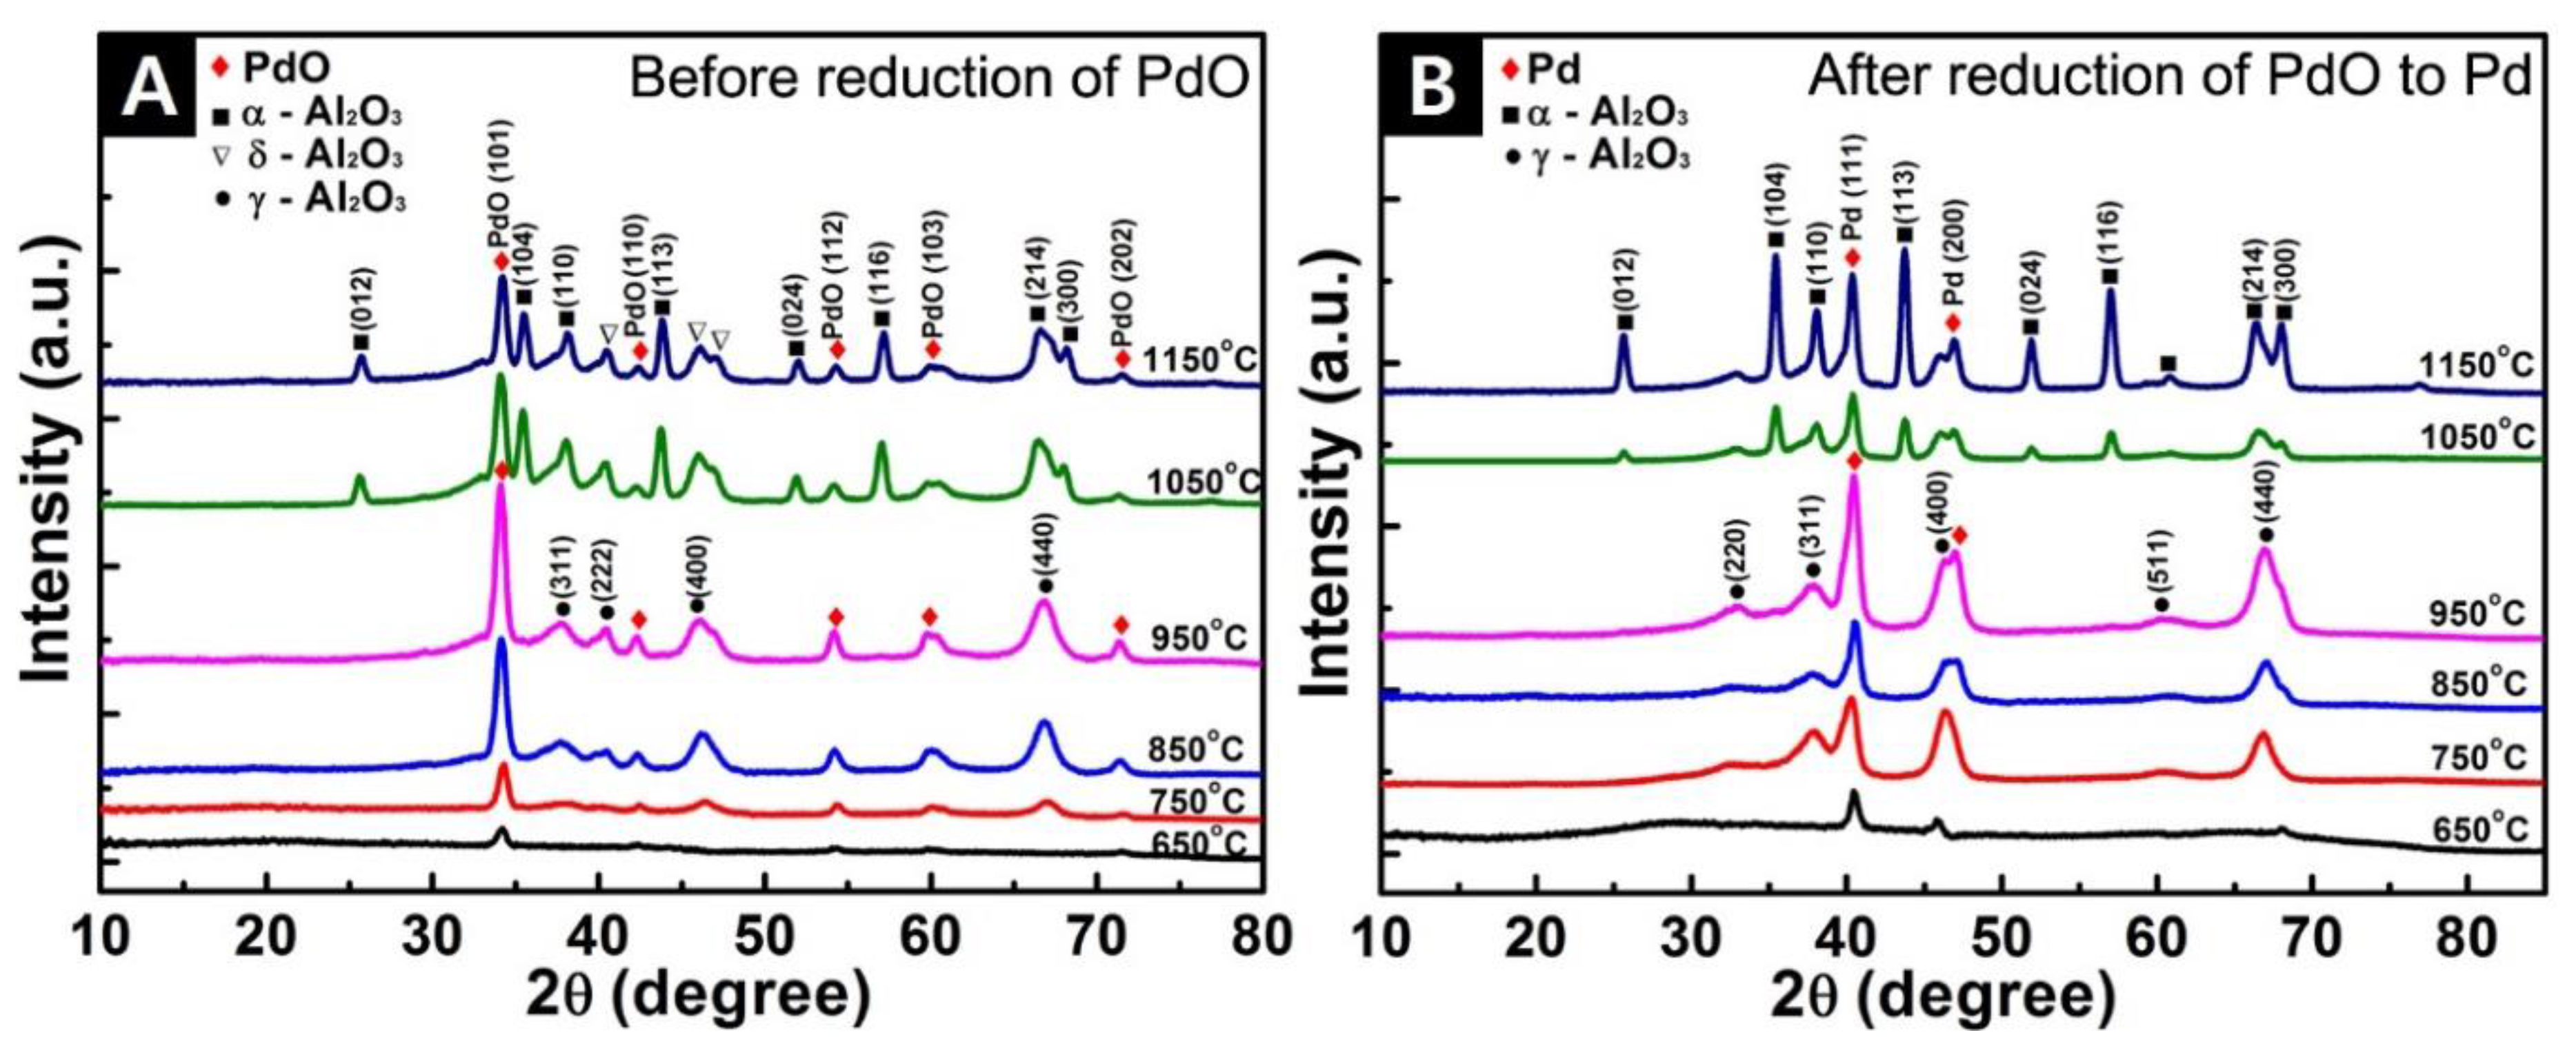
To determine the change of the crystal structure with the calcination temperatures X-ray diffraction analyses were undertaken. Figure 6 shows the comparison of X-ray diffraction peaks of PdO/Al2O3 fibers before hydrazine and Pd/Al2O3 fibers after hydrazine. It is evident from Figure 6 that PdO was reduced to the base metal Pd nanoparticles after reduction using hydrazine.
The reduction of PdCl2 occurs in two steps. First, calcination of PdCl2 happens according to the following reaction:
PdCl2 + 1/2 O2 → PdO + Cl2.
Then, the conversion of PdO to Pd will result from the addition of hydrazine.
For the PdO/Al2O3 spectra in Figure 6A, the diffraction peaks at 2θ = 34.3° (101), 42.4° (110), 54.3° (112), 60.1° (103) and 71.6° (202), indicate the detection of PdO. After reduction with hydrazine, all PdO peaks shifted toward the right indicating the formation of Pd particles. In comparison, in Figure 6B the peaks at 2θ = 40.4°, 46.9° represent the indices of (111), (200) crystal planes of Pd. Diffraction peaks corresponding to the PdO phase were not observed in Figure 6B, indicating that Pd existed in a different crystal phase of the Pd/Al2O3 fibers after treatment with hydrazine. Upon the increase of the calcination temperature from 650° to 1150°, the diffraction line of Pd (2θ = 40.4°, 46.9°) became apparent and more intense, which could be ascribed to the change in crystallite size.
The average crystallite size was calculated using the Scherrer equation, which relates the full width at half maxima, W, of the most intense peak (111) of Pd phase to the angle of incidence, θ, via S = cλ/Wcosθ, where S is the average crystallite size, c is the Scherrer constant and λ is the wavelength of X-rays used (0.154056 nm). The Scherrer constant can take values from 0.9 to 1.2, depending on the shape of the particles. Here we assumed the spherical shape (c = 1). Thus, the calculated average crystallite size of Pd/Al2O3 nanofiber increased with calcination temperature as shown in Figure 6B. Furthermore, the diffraction lines indicative of amorphous—Al2O3 (650 °C), γ-Al2O3 (750 °C–950 °C), and α-Al2O3 (1050 °C–1150 °C) phases were also observed in the PdO/Al2O3 and Pd/Al2O3 samples. It was clear that the phase transformation and the growth of Pd particle size occurred simultaneously.

3.4. BET Characterization

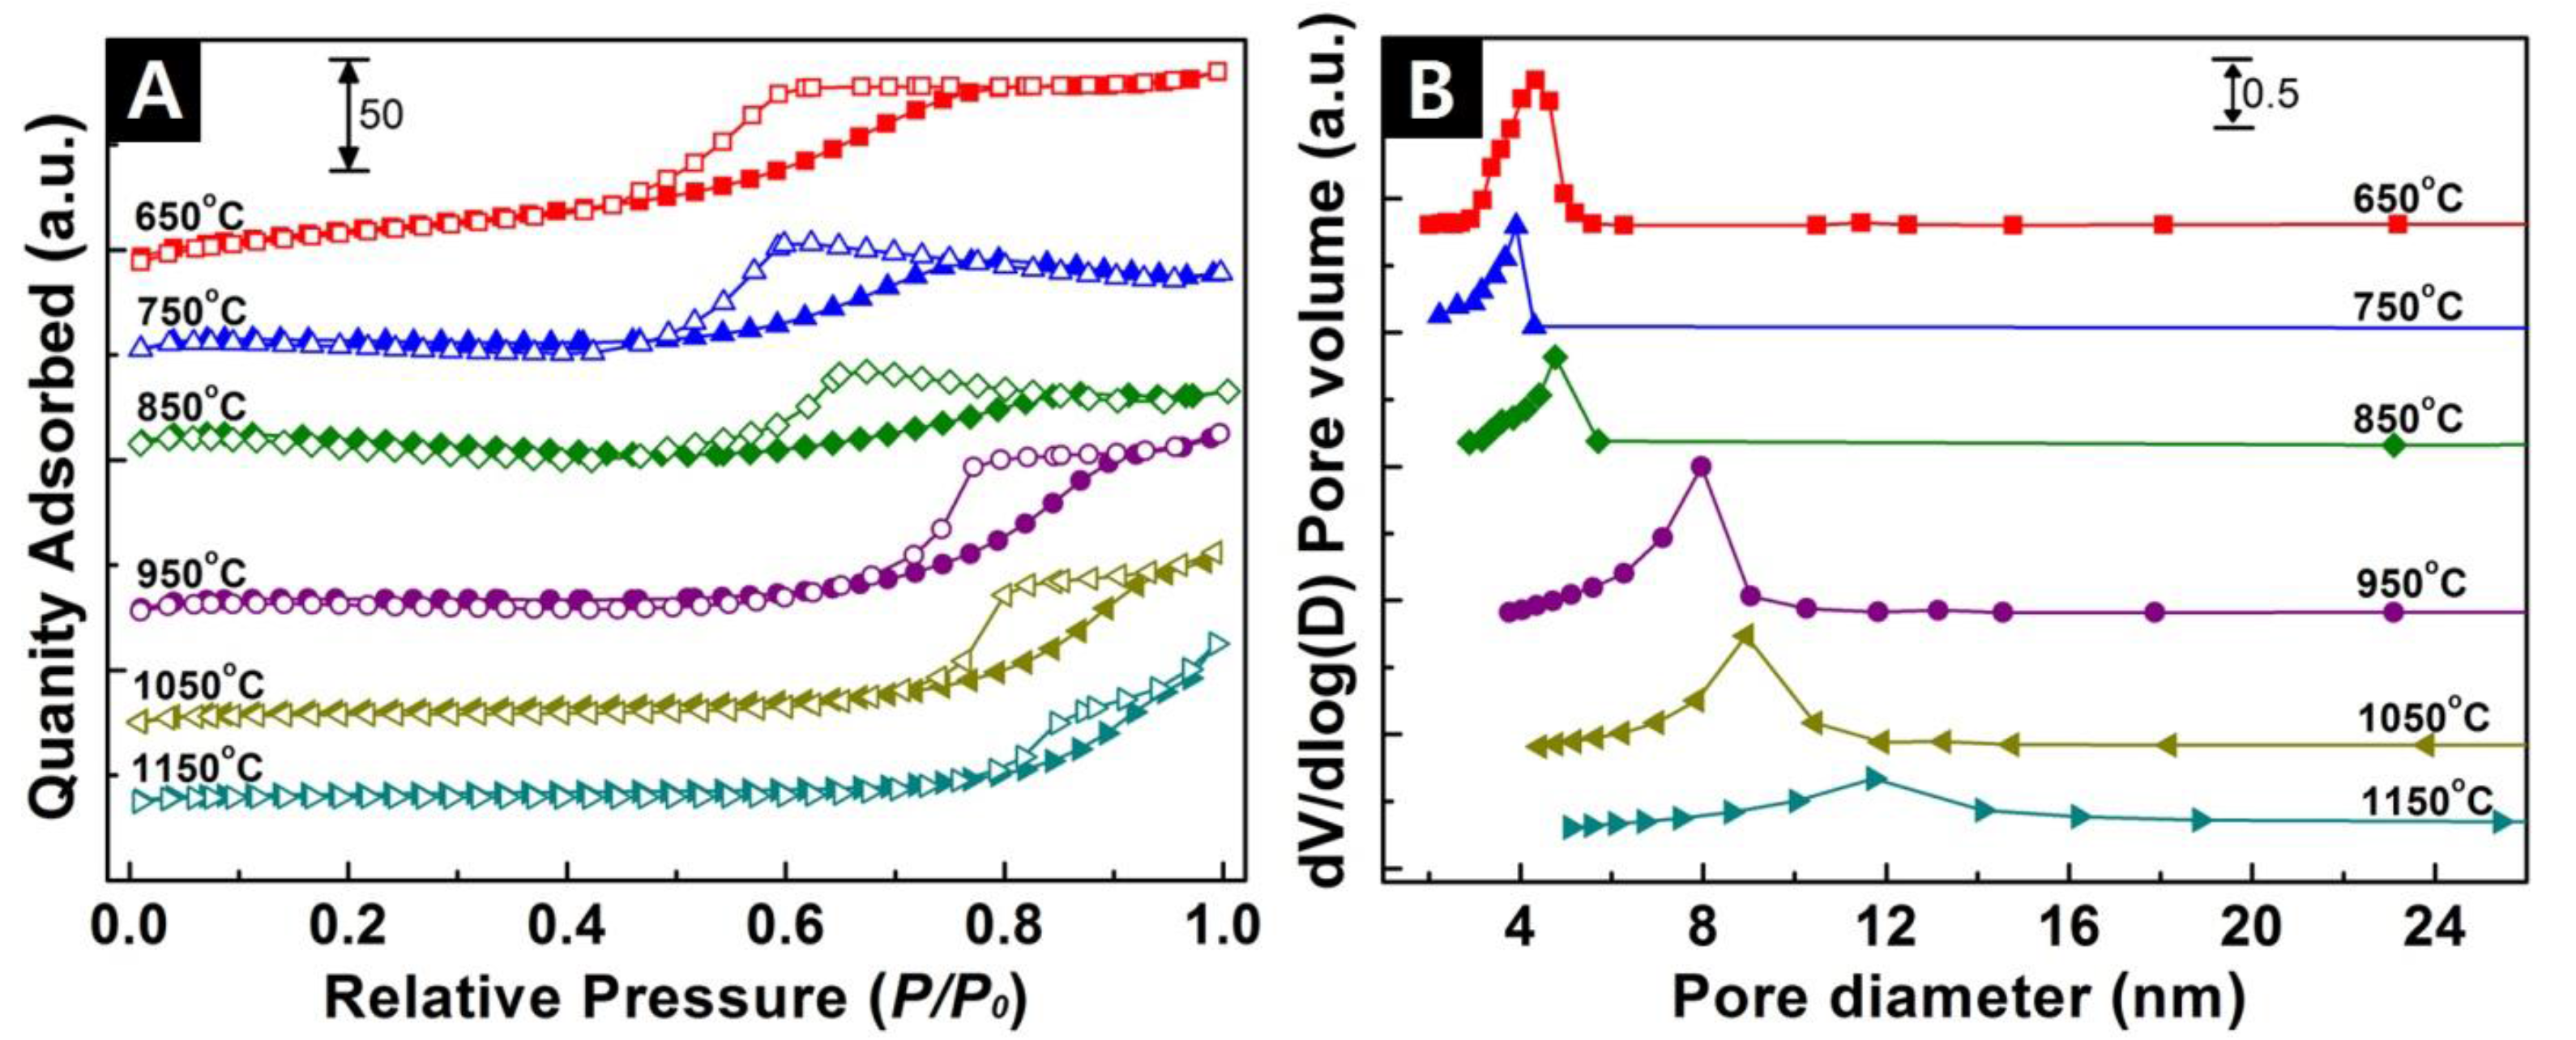
The surface textural characteristics for different Pd/Al2O3 nanofibers samples were estimated via gas adsorption by studying the adsorption and desorption isotherms. The nitrogen isotherms in Figure 7A show a classical type IV performance with a sharp capillary condensation step [50]. A well-defined H2 hysteresis loop with a sloping adsorption branch and a relatively steep desorption branch were observed in the range of 0.4–0.98 relative pressure.
For Pd/Al2O3 nanofibers calcined at 650 °C, the capillary condensation step occurred at a relative pressure of about 0.4. As the calcination temperature increased to 1150 °C, the position of the step gradually shifted to higher relative pressures, which indicated a change in the pore sizes in the fibers.
The distinct capillary condensation step (Figure 7A) indicates the uniformity of mesopores on the surface morphology of Pd/Al2O3 fiber samples. When Pd/Al2O3 fiber samples are calcined with increasing temperature, the corresponding steep capillary step is on the decrease of N2 adsorption with increasing partial pressure. It is reasonable to expect pore sizes to change [36]. Small internal pores might be formed within the fibers at high temperature. Thus, the Pd/Al2O3 fibers calcined at 1050 °C and 1150 °C have small N2 adsorption due to the increase pore size with the elevated calcination temperature.
The systematic increase of the pore size with the increase of calcination temperature was further confirmed by the Barret-Joyner-Halenda (BJH) model [51] according to the desorption branch and the resulting the pore size distribution curves as shown in Figure 7B. The pore size distributions in Figure 7B show that the fibers calcined at 650 °C had pores in the narrow range of 3 to 5 nm in contrast to the fibers calcined at 1150 °C, which had pores in a much broader distribution of about 8 to 16 nm. Such curves typically have hysteresis and pore size distributions may be ascribed to the increase of calcination temperature in control of the Pd particle size and the change of alumina crystallinity structure.
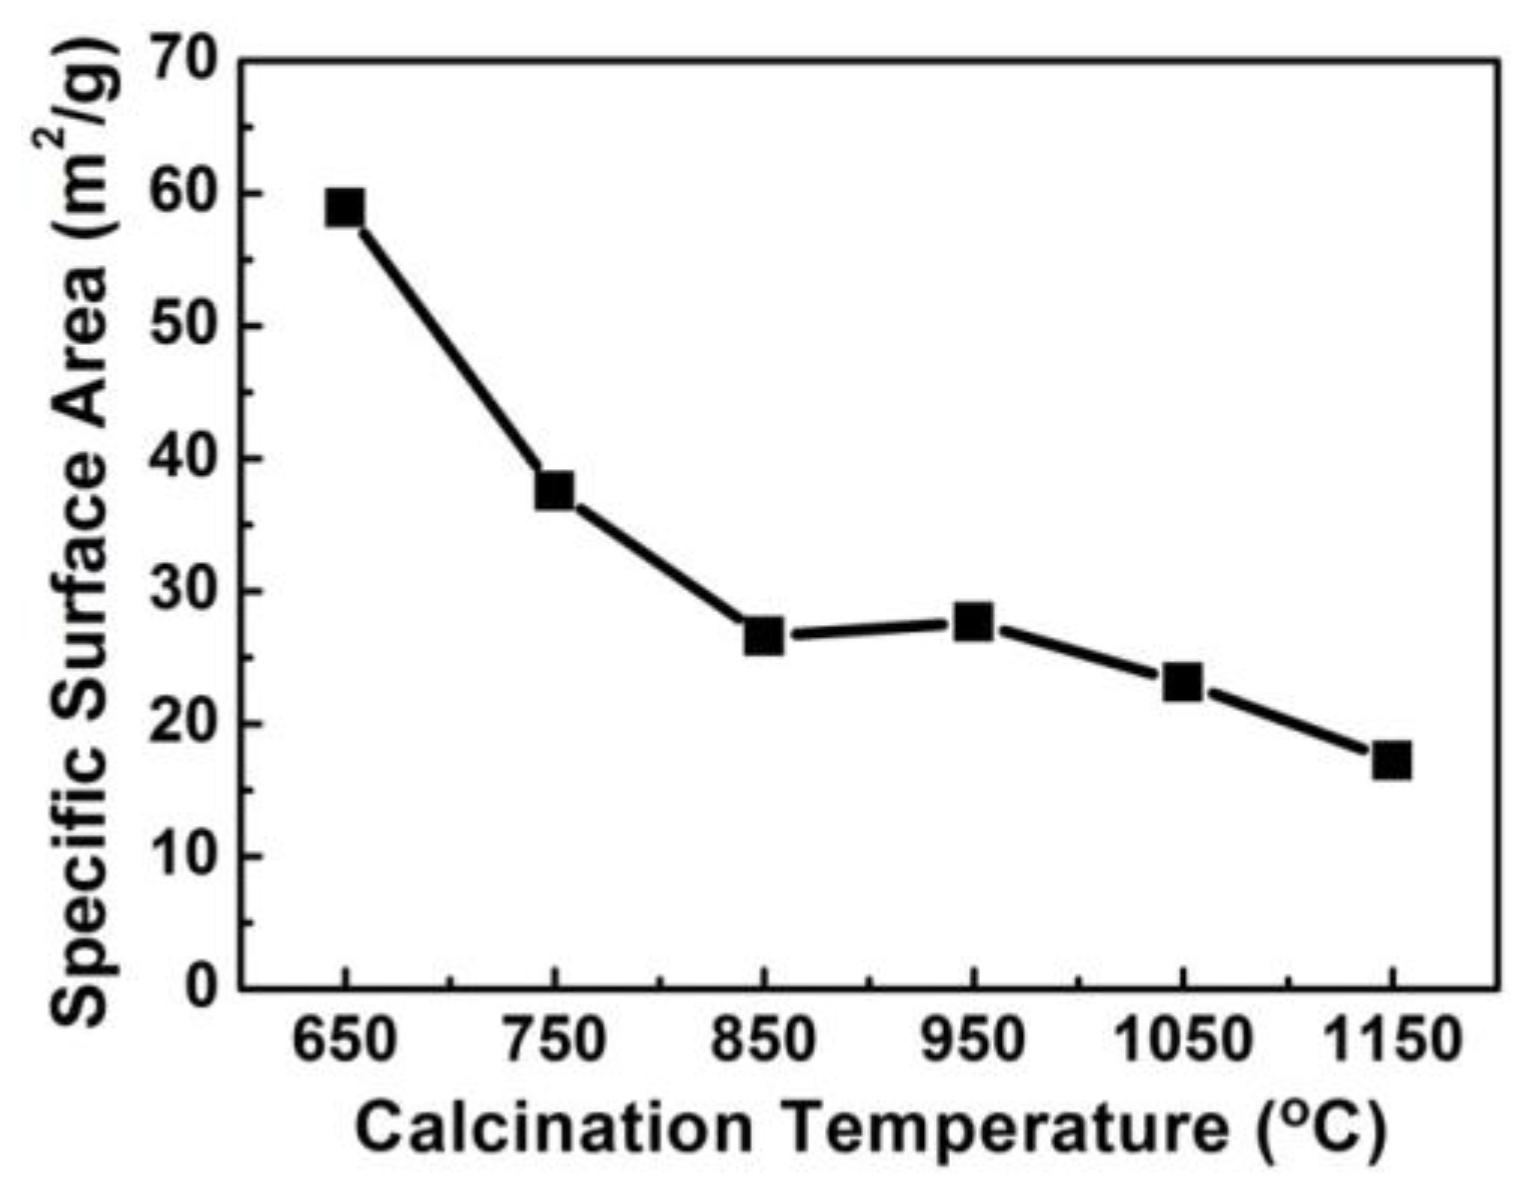
The specific surface areas of Pd/Al2O3 fiber samples were plotted in Figure 8. As the calcination temperature increased from 650 °C to 1150 °C, the surface area decreased from 58.9 m2/g (650 °C) to 17.2 m2/g (1150 °C). This trend of the surface area helps to interpret the catalytic performance of fiber media in the next section.

3.5. Catalytic Performance

NO decomposition by CO was performed to evaluate the catalytic performance of the Pd catalytic fibrous media. The reaction temperature was varied in the range from 100 °C to 500 °C, and reaction concentration data plotted in Figure 9. The inlet concentrations of the reactants, the amounts of Pd, and catalytic materials were fixed to obtain comparable reaction kinetic information of the NO–CO reaction.
Figure 9A,B show that all the nitrogen oxide and carbon monoxide were decomposed to nitrogen, nitrous oxide, and carbon dioxide gases at a 350 °C reaction temperature for media calcined at 650 °C and 750 °C. These media correspond to the amorphous form of Al2O3 with Pd particle sizes of about 5 nm. Similar results were reported by Chambers et al. when the NO–CO reaction was carried out using the Pt group catalysts [21]. Granger et al. also indicated that nitrous oxide (N2O) was an intermediated product in a NO–CO reaction [52].
When the calcination temperature was increased to 850 °C and 950 °C, the simultaneous complete conversion of NO and CO was achieved at 450 °C as shown in Figure 9C,D. Interestingly, the XRD results (Figure 6) showed that the alumina crystal structure was γ-Al2O3 nanofibers with average crystallite size D = 9 nm, which were dependent on the calcination temperature. Furthermore, the metallic Pd nanoparticle size (Figure 5) morphologically became larger. Park et al. developed a mathematical model of NO decomposition by CO regarding catalyst particle size [30].
It can be seen in Figure 9E,F that Pd/Al2O3 fiber media calcined at 1050 °C and 1150 °C showed the lowest catalytic activity. These fibers were α-Al2O3 phase (14 nm of crystallite size) with about 20 nm diameter Pd particles.
For the fiber materials calcined at higher temperatures, the decomposition temperature increased to about 500 °C, indicating a lower reaction activity. At the calcination temperatures, above 950 °C, the fiber materials transitioned to the alpha phase and the Pd particle sizes increased. The larger particle size and possibly the change in phase caused the decline in reactivity of the fiber materials.
The increase of calcination temperature also corresponded to a decrease in BET-specific surface area with the enlargement of the Pd particles, both of which resulted in a net decrease in catalyst surface area. The NO molecules absorb on the surface of the catalysts due to their unpaired electrons [53,54]. Thus, the decline in surface area causes a decline in the NO adsorption and, in turn, reduces the contact between catalyst on the alumina nanofiber and NO–CO molecules [55]. Therefore, the catalytic performances of Pd/amorphous-Al2O3 calcined at 650 °C had better conversion compared to Pd/γ and α-Al2O3 calcined at 750–1150 °C.
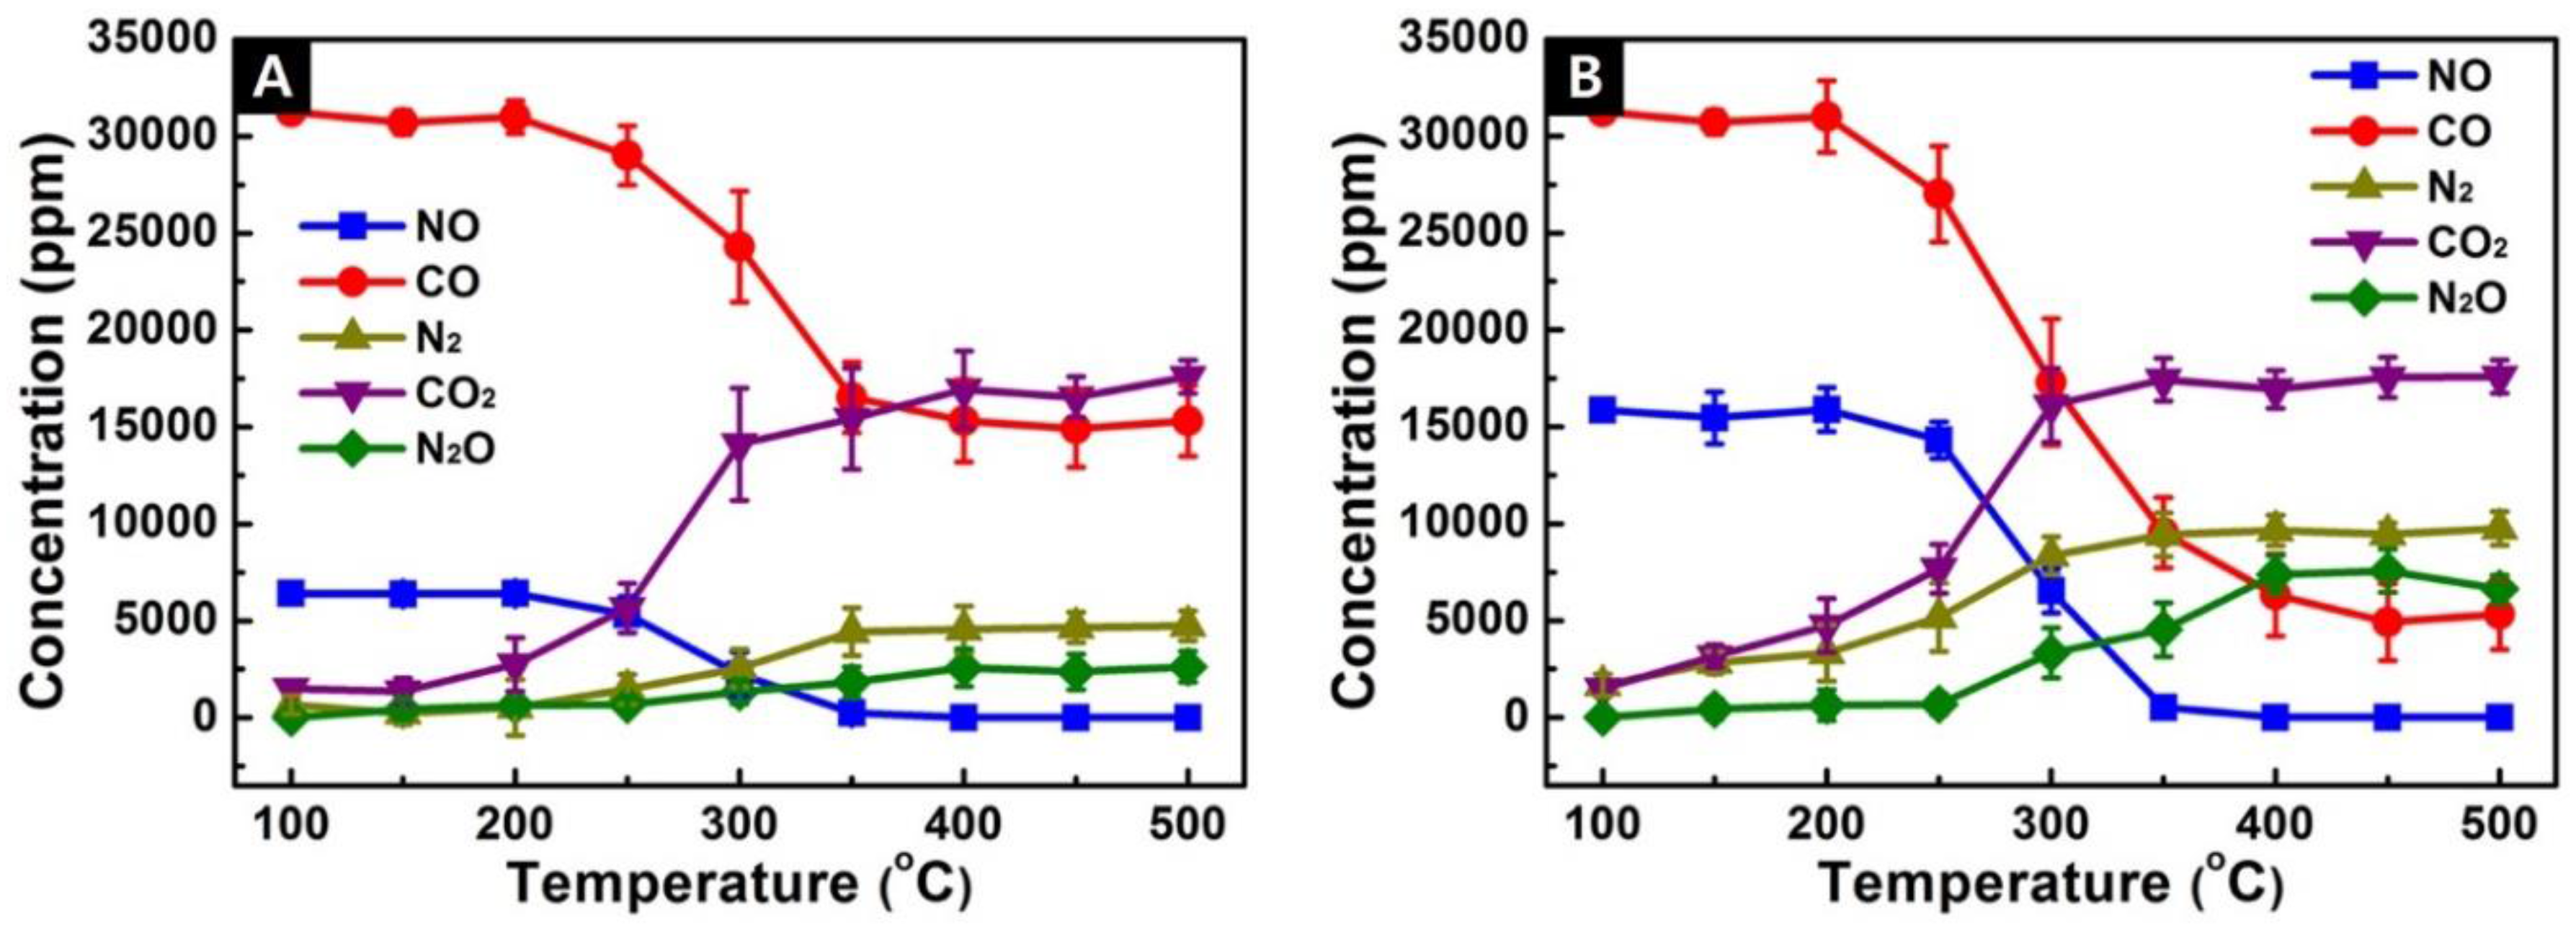
The media were also tested by varying the inlet NO concentration. The flowrate of nitrogen oxide was changed from 6410 to 15,870 ppm while carbon monoxide flow was kept constant (i.e., 31,250 ppm). The catalytic fiber media was correspondingly prepared, and the Pd (5%)/Al2O3 catalyst calcined at 650 °C.
Figure 10 shows the concentration profile versus reaction temperature plot with 6410 ppm and 15,870 ppm of NO and 31,250 ppm of CO. There was not a significant change at a 100 °C–200 °C reaction temperature. As temperature increased, NO was converted to N2O and N2. At 350 °C, all the NO was converted before the gas exited the filter. Some of the CO was converted to CO2. Figure 9A indicates that the reaction NO–CO started at a lower temperature (150 °C) with equal concentrations of NO and CO in the inlet. The reaction data in Figure 10 indicates that the reactions with lower NO inlet concentrations began at about 200 °C. When both NO and CO inlet concentrations were the same, complete conversion occurred at about 300 °C.
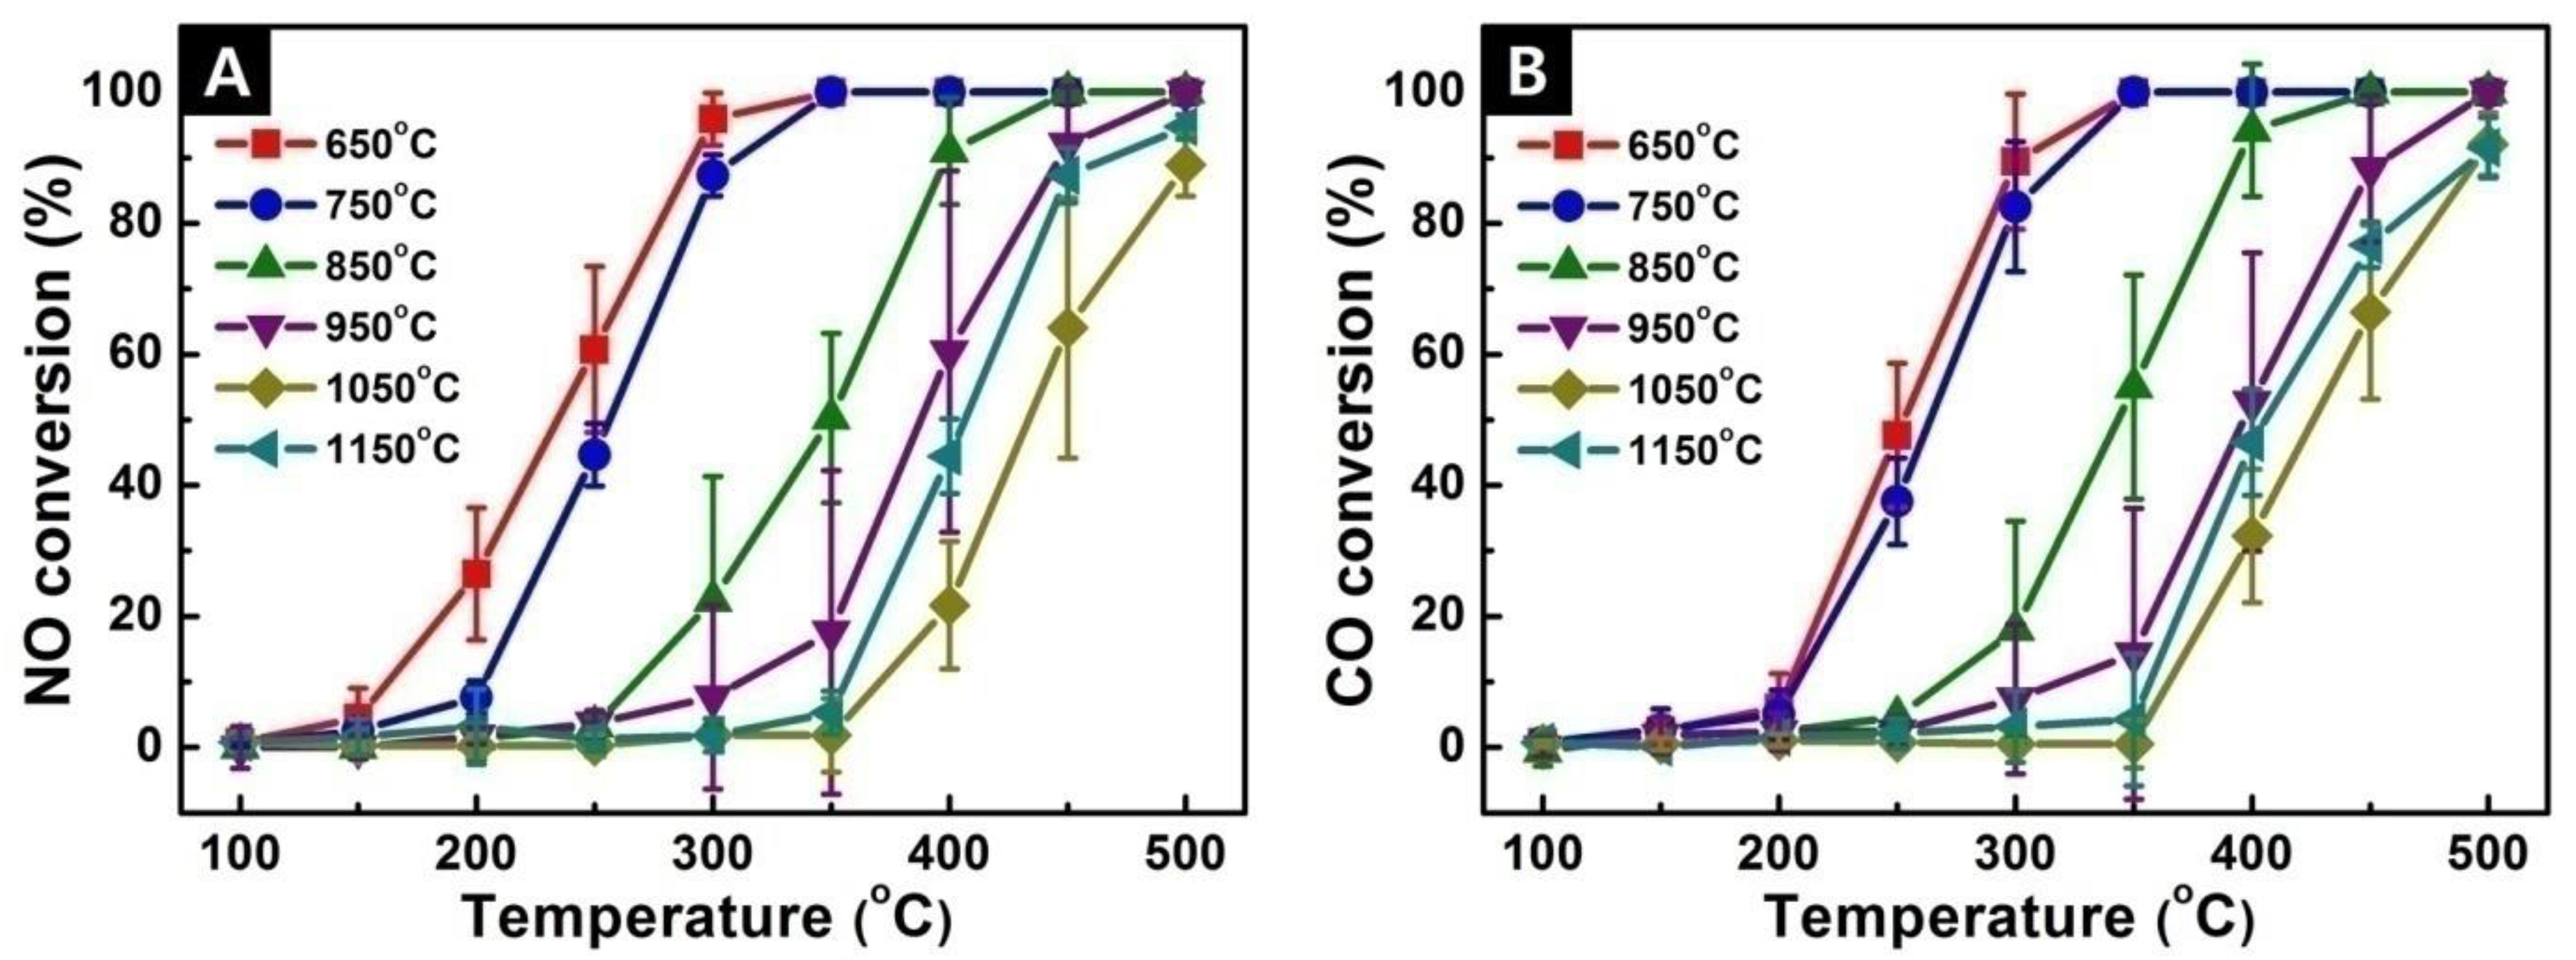
As another way of presenting the data, the reaction data are plotted in Figure 11 to show the conversions of NO and CO as a function of reaction temperature. The plots show the total conversion occurs at lower reaction temperatures for the fiber materials calcined at 650 °C. This is consistent with the increase in Pd particle size and decline in specific surface area as observed as a function of calcination temperature. These results show that for reactions occurring less than 500 °C, the Pd/Al2O3 fiber materials calcined at 650 °C gave the best performance.
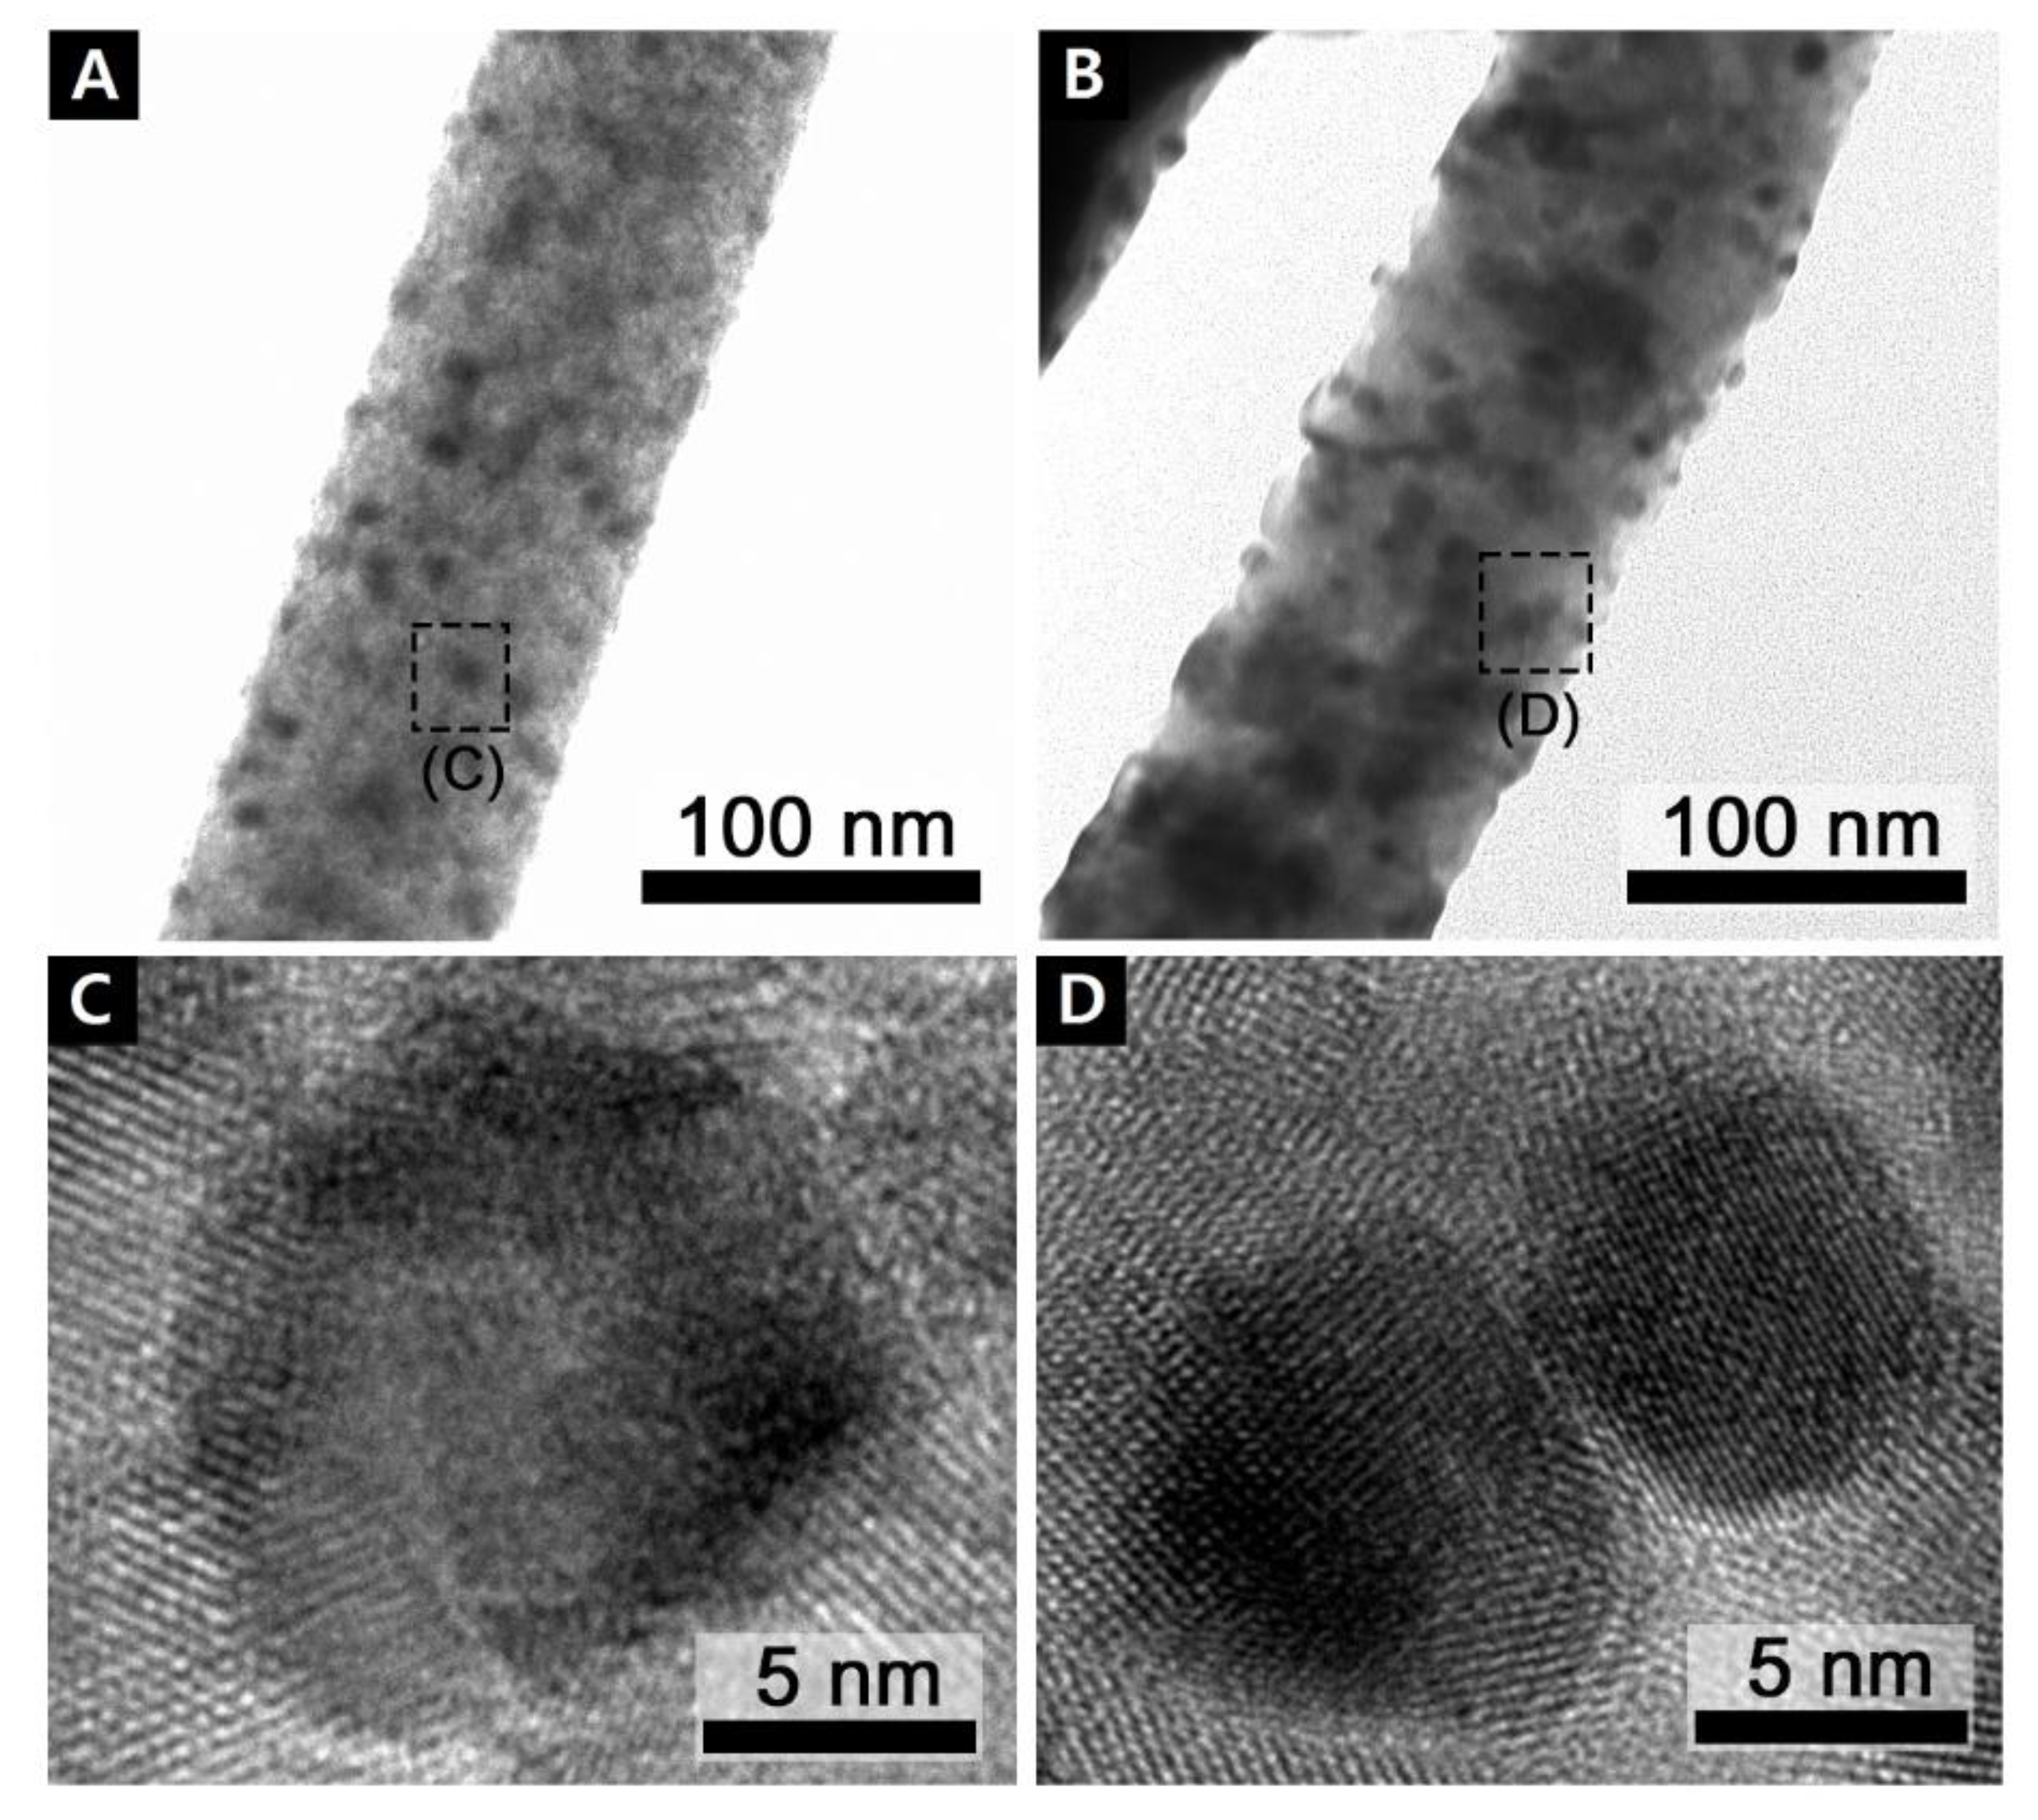
Figure 12 shows the High resolution transmission electron microscope (HRTEM) images of Pd/Al2O3 fibers calcined at 650 °C before and after NO–CO reaction. Statistical size analysis (at least 100 measurements) gave an average particle diameter of 5.35 ± 1.51 nm before reaction, and 5.01 ± 1.18 nm after reaction. There was not a significant particle size change, indicating that migration and agglomeration of catalyst particles during the reaction experiments were not a factor in the reactor performances in this work. It is possible that at higher reaction temperatures migration and agglomeration will occur. This is left to future studies to determine.

4. Conclusions

Palladium doped alumina submicron fibers were produced by the electrospinning and calcination of the polymer template fibers. These materials were tested for catalytic performance of the decomposition of NO and CO gases. The Pd-Au fiber samples were further characterized by SEM, TEM, BET, EDX, and XRD. From the results reported it is observed that the fiber diameters and specific surface areas reduced with the increase in calcination temperature. The fiber crystal structure changed from amorphous to alpha and gamma phases with the increase in calcination temperature. The Pd particle sizes were observed to significantly increase with the calcination temperature. The reaction data showed that the conversion temperature also increased with the calcination temperature. The fibers calcined at 650 °C had the lowest complete NO conversion temperature and the highest reactivity.

Acknowledgments

This work was financially supported by the Coalescence Filtration Nanofibers Consortium: Donaldson, Ahlstrom, Parker Hannifin Corporation, Cummins Filtration, Bekaert, Hollingsworth and Vose, and SNS Nanofiber Technology. Jazan University is acknowledged for support of Ahmed Abutaled.

Author Contributions

H.U.S. and G.G.C. conceived and designed the experiments; H.U.S. performed the experiments and characterized the materials; A.A. and D.L. analyzed the fiber through SEM and TEM; H.U.S. drafted the paper. G.G.C. finalized the paper.

Conflicts of Interest

The authors declare no conflict of interest.

References

  1. Bhattacharyya, S.; Das, R.K. Catalytic control of automotive NOx: A review. Int. J. Energy Res. 1999, 23, 351–369. [Google Scholar] [CrossRef]
  2. Mantri, D.; Aghalayam, P. Detailed surface reaction mechanism for reduction of NO by CO. Catal. Today 2007, 119, 88–93. [Google Scholar] [CrossRef]
  3. Fu, Y.; Tian, Y.; Lin, P. A low-temperature ir spectroscopic study of selective adsorption of NO and CO on CuO/γ-Al2O3. J. Catal. 1991, 132, 85–91. [Google Scholar] [CrossRef]
  4. Kašpar, J.; Fornasiero, P.; Hickey, N. Automotive catalytic converters: Current status and some perspectives. Catal. Today 2003, 77, 419–449. [Google Scholar] [CrossRef]
  5. Hu, Z.; Wan, C.Z.; Lui, Y.K.; Dettling, J.; Steger, J.J. Design of a novel Pd three-way catalyst: Integration of catalytic functions in three dimensions. Catal. Today 1996, 30, 83–89. [Google Scholar] [CrossRef]
  6. Wang, Y.; Zhu, A.; Zhang, Y.; Au, C.T.; Yang, X.; Shi, C. Catalytic reduction of NO by CO over NiO/CeO2 catalyst in stoichiometric NO/CO and NO/CO/O2 reaction. Appl. Catal. B 2008, 81, 141–149. [Google Scholar] [CrossRef]
  7. Yao, X.; Tang, C.; Ji, Z.; Dai, Y.; Cao, Y.; Gao, F.; Dong, L.; Chen, Y. Investigation of the physicochemical properties and catalytic activities of Ce0.67 m0.33 O2 (m = zr4+, Ti4+, Sn4+) solid solutions for NO removal by CO. Catal. Sci. Technol. 2013, 3, 688–698. [Google Scholar] [CrossRef]
  8. Almusaiteer, K.; Chuang, S.S.C. Isolation of active adsorbates for the NO–CO reaction on Pd/Al2O3 by selective enhancement and selective poisoning. J. Catal. 1998, 180, 161–170. [Google Scholar] [CrossRef]
  9. Shahreen, L.; Chase, G.G.; Turinske, A.J.; Nelson, S.A.; Stojilovic, N. NO decomposition by CO over Pd catalyst supported on TiO2 nanofibers. Chem. Eng. J. 2013, 225, 340–349. [Google Scholar] [CrossRef]
  10. Tsou, J.; Magnoux, P.; Guisnet, M.; Órfão, J.J.M.; Figueiredo, J.L. Catalytic oxidation of volatile organic compounds: Oxidation of methyl-isobutyl-ketone over Pt/zeolite catalysts. Appl. Catal. B 2005, 57, 117–123. [Google Scholar] [CrossRef]
  11. Liu, J.; Wang, H.; Chen, Y.; Yang, M.; Wu, Y. Effects of pretreatment atmospheres on the catalytic performance of Pd/γ-Al2O3 catalyst in benzene degradation. Catal. Commun. 2014, 46, 11–16. [Google Scholar] [CrossRef]
  12. Grbic, B.; Radic, N.; Terlecki-Baricevic, A. Kinetics of deep oxidation of n-hexane and toluene over Pt/Al2O3 catalysts: Oxidation of mixture. Appl. Catal. B 2004, 50, 161–166. [Google Scholar] [CrossRef]
  13. Eberhardt, A.M.; Benvenutti, E.V.; Moro, C.C.; Tonetto, G.M.; Damiani, D.E. NO decomposition on PdMo/γ-Al2O3 catalysts. J. Mol. Catal. A 2003, 201, 247–261. [Google Scholar] [CrossRef]
  14. Liu, N.; Chen, X.; Zhang, J.; Schwank, J.W. Drifts study of photo-assisted catalytic CO + NO redox reaction over CuO/CeO2-TiO2. Catal. Today 2015, 258, 139–147. [Google Scholar] [CrossRef]
  15. Gamarra, D.; Belver, C.; Fernández-García, M.; Martínez-Arias, A. Selective CO oxidation in excess H2 over copper−ceria catalysts: Identification of active entities/species. J. Am. Chem. Soc. 2007, 129, 12064–12065. [Google Scholar] [CrossRef] [PubMed]
  16. Zou, W.; Liu, L.; Zhang, L.; Li, L.; Cao, Y.; Wang, X.; Tang, C.; Gao, F.; Dong, L. Crystal-plane effects on surface and catalytic properties of Cu2O nanocrystals for NO reduction by CO. Appl. Catal. A 2015, 505, 334–343. [Google Scholar] [CrossRef]
  17. Yao, X.; Xiong, Y.; Zou, W.; Zhang, L.; Wu, S.; Dong, X.; Gao, F.; Deng, Y.; Tang, C.; Chen, Z.; et al. Correlation between the physicochemical properties and catalytic performances of CexSn1–xO2 mixed oxides for NO reduction by CO. Appl. Catal. B 2014, 144, 152–165. [Google Scholar] [CrossRef]
  18. Wang, Z.; Shen, G.; Li, J.; Liu, H.; Wang, Q.; Chen, Y. Catalytic removal of benzene over CeO2–mNOx composite oxides prepared by hydrothermal method. Appl. Catal. B 2013, 138–139, 253–259. [Google Scholar] [CrossRef]
  19. Ilieva, L.; Pantaleo, G.; Velinov, N.; Tabakova, T.; Petrova, P.; Ivanov, I.; Avdeev, G.; Paneva, D.; Venezia, A.M. NO reduction by CO over gold catalysts supported on Fe-loaded ceria. Appl. Catal. B 2015, 174–175, 176–184. [Google Scholar] [CrossRef]
  20. Matsui, T.; Harada, M.; Ichihashi, Y.; Bando, K.K.; Matsubayashi, N.; Toba, M.; Yoshimura, Y. Effect of noble metal particle size on the sulfur tolerance of monometallic Pd and Pt catalysts supported on high-silica USY zeolite. Appl. Catal. A 2005, 286, 249–257. [Google Scholar] [CrossRef]
  21. Smorygo, O.; Marukovich, A.; Mikutski, V.; Sadykov, V. Evaluation of SiC-porcelain ceramics as the material for monolithic catalyst supports. J. Adv. Ceram. 2014, 3, 230–239. [Google Scholar] [CrossRef]
  22. Van Gulijk, C.; Linders, M.J.G.; Valdes-Solis, T.; Kapteijn, F. Intrinsic channel maldistribution in monolithic catalyst support structures. Chem. Eng. J. Amst. Neth. 2005, 109, 89–96. [Google Scholar] [CrossRef]
  23. Leonov, A.N.; Smorygo, O.L.; Sheleg, V.K. Monolithic catalyst supports with foam structure. Reac. Kinet. Catal. Lett. 1997, 60, 259–267. [Google Scholar] [CrossRef]
  24. DeLuca, J.P.; Campbell, L.E. Monolithic catalyst supports. Adv. Mater. Catal. 1977, 35, 293–324. [Google Scholar]
  25. Sebastian, D.; Lazaro, M.J.; Moliner, R.; Suelves, I.; Arico, A.S.; Baglio, V. Oxidized carbon nanofibers supporting PtRu nanoparticles for direct methanol fuel cells. Int. J. Hydrog. Energy 2014, 39, 5414–5423. [Google Scholar] [CrossRef]
  26. Park, J.-H.; Ju, Y.-W.; Park, S.-H.; Jung, H.-R.; Yang, K.-S.; Lee, W.-J. Effects of electrospun polyacrylonitrile-based carbon nanofibers as catalyst support in PEMFC. J. Appl. Electrochem. 2009, 39, 1229–1236. [Google Scholar] [CrossRef]
  27. Simotwo, S.K.; Kalra, V. Study of co-electrospun nafion and polyaniline nanofibers as potential catalyst support for fuel cell electrodes. Electrochim. Acta 2016, 198, 156–164. [Google Scholar] [CrossRef]
  28. Zhou, Z.; Peng, X.; Zhong, L.; Wu, L.; Cao, X.; Sun, R.C. Electrospun cellulose acetate supported Ag@AgCl composites with facet-dependent photocatalytic properties on degradation of organic dyes under visible-light irradiation. Carbohydr. Polym. 2016, 136, 322–328. [Google Scholar] [CrossRef] [PubMed]
  29. Savva, I.; Kalogirou, A.S.; Chatzinicolaou, A.; Papaphilippou, P.; Pantelidou, A.; Vasile, E.; Vasile, E.; Koutentis, P.A.; Krasia-Christoforou, T. PVP-crosslinked electrospun membranes with embedded Pd and Cu2O nanoparticles as effective heterogeneous catalytic supports. RSC Adv. 2014, 4, 44911–44921. [Google Scholar] [CrossRef]
  30. Park, S.-J.; Bhargava, S.; Chase, G.G. Fitting of kinetic parameters of NO reduction by CO in fibrous media using a genetic algorithm. Comput. Chem. Eng. 2010, 34, 485–490. [Google Scholar] [CrossRef]
  31. Shin, H.U.; Lolla, D.; Nikolov, Z.; Chase, G.G. Pd–Au nanoparticles supported by TiO2 fibers for catalytic NO decomposition by CO. J. Ind. Eng. Chem. 2016, 33, 91–98. [Google Scholar] [CrossRef]
  32. Patel, A.C.; Li, S.; Wang, C.; Zhang, W.; Wei, Y. Electrospinning of porous silica nanofibers containing silver nanoparticles for catalytic applications. Chem. Mater. 2007, 19, 1231–1238. [Google Scholar] [CrossRef]
  33. Park, S.J.; Bhargava, S.; Bender, E.T.; Chase, G.G.; Ramsier, R.D. Palladium nanoparticles supported by alumina nanofibers synthesized by electrospinning. J. Mater. Res. 2008, 23, 1193–1196. [Google Scholar] [CrossRef]
  34. Chambers, A.; Nemes, T.; Rodriguez, N.M.; Baker, R.T.K. Catalytic behavior of graphite nanofiber supported nickel particles. 1. Comparison with other support media. J. Phys. Chem. B 1998, 102, 2251–2258. [Google Scholar] [CrossRef]
  35. Guceri, S.; Gogotsi, Y.G.; Kuznetsov, V. Nanoengineered Nanofibrous Materials; Springer: Berlin, Germany, 2004. [Google Scholar]
  36. Hou, W.; Zhou, J.; Yu, C.; You, S.; Gao, X.; Luo, Z. Pd/Al2O3 sorbents for elemental mercury capture at high temperatures in syngas. Ind. Eng. Chem. Res. 2014, 53, 9909–9914. [Google Scholar] [CrossRef]
  37. Shin, H.U.; Ramsier, R.D.; Chase, G.G. Influence of calcination temperature on the surface area of submicron-sized Al2O3 electrospun fibers. Appl. Phys. A 2016, 122, 1–8. [Google Scholar] [CrossRef]
  38. Wang, Y.; Li, W.; Jiao, X.; Chen, D. Electrospinning preparation and adsorption properties of mesoporous alumina fibers. J. Mater. Chem. A 2013, 1, 10720–10726. [Google Scholar] [CrossRef]
  39. Swaminathan, S.; Chase, G. Electrospinning of Metal Doped Alumina Nanofibers for Catalyst Applications; InTech: Rijeka, Croatia, 2011. [Google Scholar]
  40. Ayral, A.; Droguet, J.C. Alumina powders via a controlled precipitation of aluminum acetate. J. Mater. Res. 1989, 4, 967–971. [Google Scholar] [CrossRef]
  41. McCabe, R.W.; Usmen, R.K.; Ober, K. The effect of alumina phase structure on the dispersion of rhodium/alumina catalysts. J. Catal. 1995, 151, 385–393. [Google Scholar] [CrossRef]
  42. Komeili, S.; Ravanchi, M.T.; Taeb, A. The influence of alumina phases on the performance of Pd-Ag/Al2O3 catalyst in tail-end selective hydrogenation of acetylene. Appl. Catal. A 2015, 502, 287–296. [Google Scholar] [CrossRef]
  43. Chase, G.G.; Nartetamrongsutt, K.; Shin, H.U. Simple Device for Economically Producing Electrospun Fibers at Moderate Rates. U.S. Patent 20,150,158,230, 11 June 2015. [Google Scholar]
  44. Reneker, D.H.; Yarin, A.L.; Fong, H.; Koombhongse, S. Bending instability of electrically charged liquid jets of polymer solutions in electrospinning. J. Appl. Phys. 2000, 87, 4531–4547. [Google Scholar] [CrossRef]
  45. Lolla, D.; Abutaleb, M.; Shin, H.U.; Reneker, D.H.; Chase, G.G. Fabrication, Polarization of Electrospun Polyvinylidene Fluoride Electret Fibers and Effect on Capturing Nanoscale Solid Aerosols. Materials 2016, 9, 671. [Google Scholar] [CrossRef]
  46. Rajala, J.; Shin, H.U.; Lolla, D.; Chase, G. Core-Shell Electrospun Hollow Aluminum Oxide Ceramic Fibers. Fibers 2015, 3, 450–462. [Google Scholar] [CrossRef]
  47. Shin, H.U.; Li, Y.; Paynter, A.; Nartetamrongsutt, K.; Chase, G.G. Vertical rod method for electrospinning polymer fibers. Polymer 2015, 65, 26–33. [Google Scholar] [CrossRef]
  48. Lolla, D.; Gorse, J.; Kisielowski, C.; Miao, J.; Taylor, P.L.; Chase, G.G.; Reneker, D.H. Polyvinylidene fluoride molecules in nanofibers, imaged at atomic scale by aberration corrected electron microscopy. Nanoscale 2016, 8, 120–128. [Google Scholar] [CrossRef] [PubMed]
  49. Demir, M.M.; Gulgun, M.A.; Menceloglu, Y.Z.; Erman, B.; Abramchuk, S.S.; Makhaeva, E.E.; Khokhlov, A.R.; Matveeva, V.G.; Sulman, M.G. Palladium nanoparticles by electrospinning from poly(acrylonitrile-co-acrylic acid)-PdCl2 solutions. Relations between preparation conditions, particle size, and catalytic activity. Macromolecules 2004, 37, 1787–1792. [Google Scholar] [CrossRef]
  50. Yu, P.-C.; Yang, R.-J.; Tsai, Y.-Y.; Sigmund, W.; Yen, F.-S. Growth mechanism of single-crystal α-Al2O3 nanofibers fabricated by electrospinning techniques. J. Eur. Ceram. Soc. 2011, 31, 723–731. [Google Scholar] [CrossRef]
  51. Webb, P.A.; Orr, C. Analytical Methods in Fine Particle Technology; Micromeritics Instrument Corp.: Norcross, GA, USA, 1997. [Google Scholar]
  52. Groen, J.C.; Peffer, L.A.A.; Pérez-Ramírez, J. Pore size determination in modified micro- and mesoporous materials. Pitfalls and limitations in gas adsorption data analysis. Microporous Mesoporous Mater. 2003, 60, 1–17. [Google Scholar] [CrossRef]
  53. Granger, P.; Dhainaut, F.; Pietrzik, S.; Malfoy, P.; Mamede, A.S.; Leclercq, L.; Leclercq, G. An overview: Comparative kinetic behaviour of Pt, Rh and Pd in the NO + CO and NO + H2 reactions. Top. Catal. 2006, 39, 65–76. [Google Scholar] [CrossRef]
  54. Yao, X.; Gao, F.; Cao, Y.; Tang, C.; Deng, Y.; Dong, L.; Chen, Y. Tailoring copper valence states in CuOδ/γ-Al2O3 catalysts by an in situ technique induced superior catalytic performance for simultaneous elimination of NO and CO. Phys. Chem. Chem. Phys. 2013, 15, 14945–14950. [Google Scholar] [CrossRef] [PubMed]
  55. Yao, X.; Gao, F.; Yu, Q.; Qi, L.; Tang, C.; Dong, L.; Chen, Y. NO reduction by CO over CuO-CeO2 catalysts: Effect of preparation methods. Catal. Sci. Technol. 2013, 3, 1355–1366. [Google Scholar] [CrossRef]
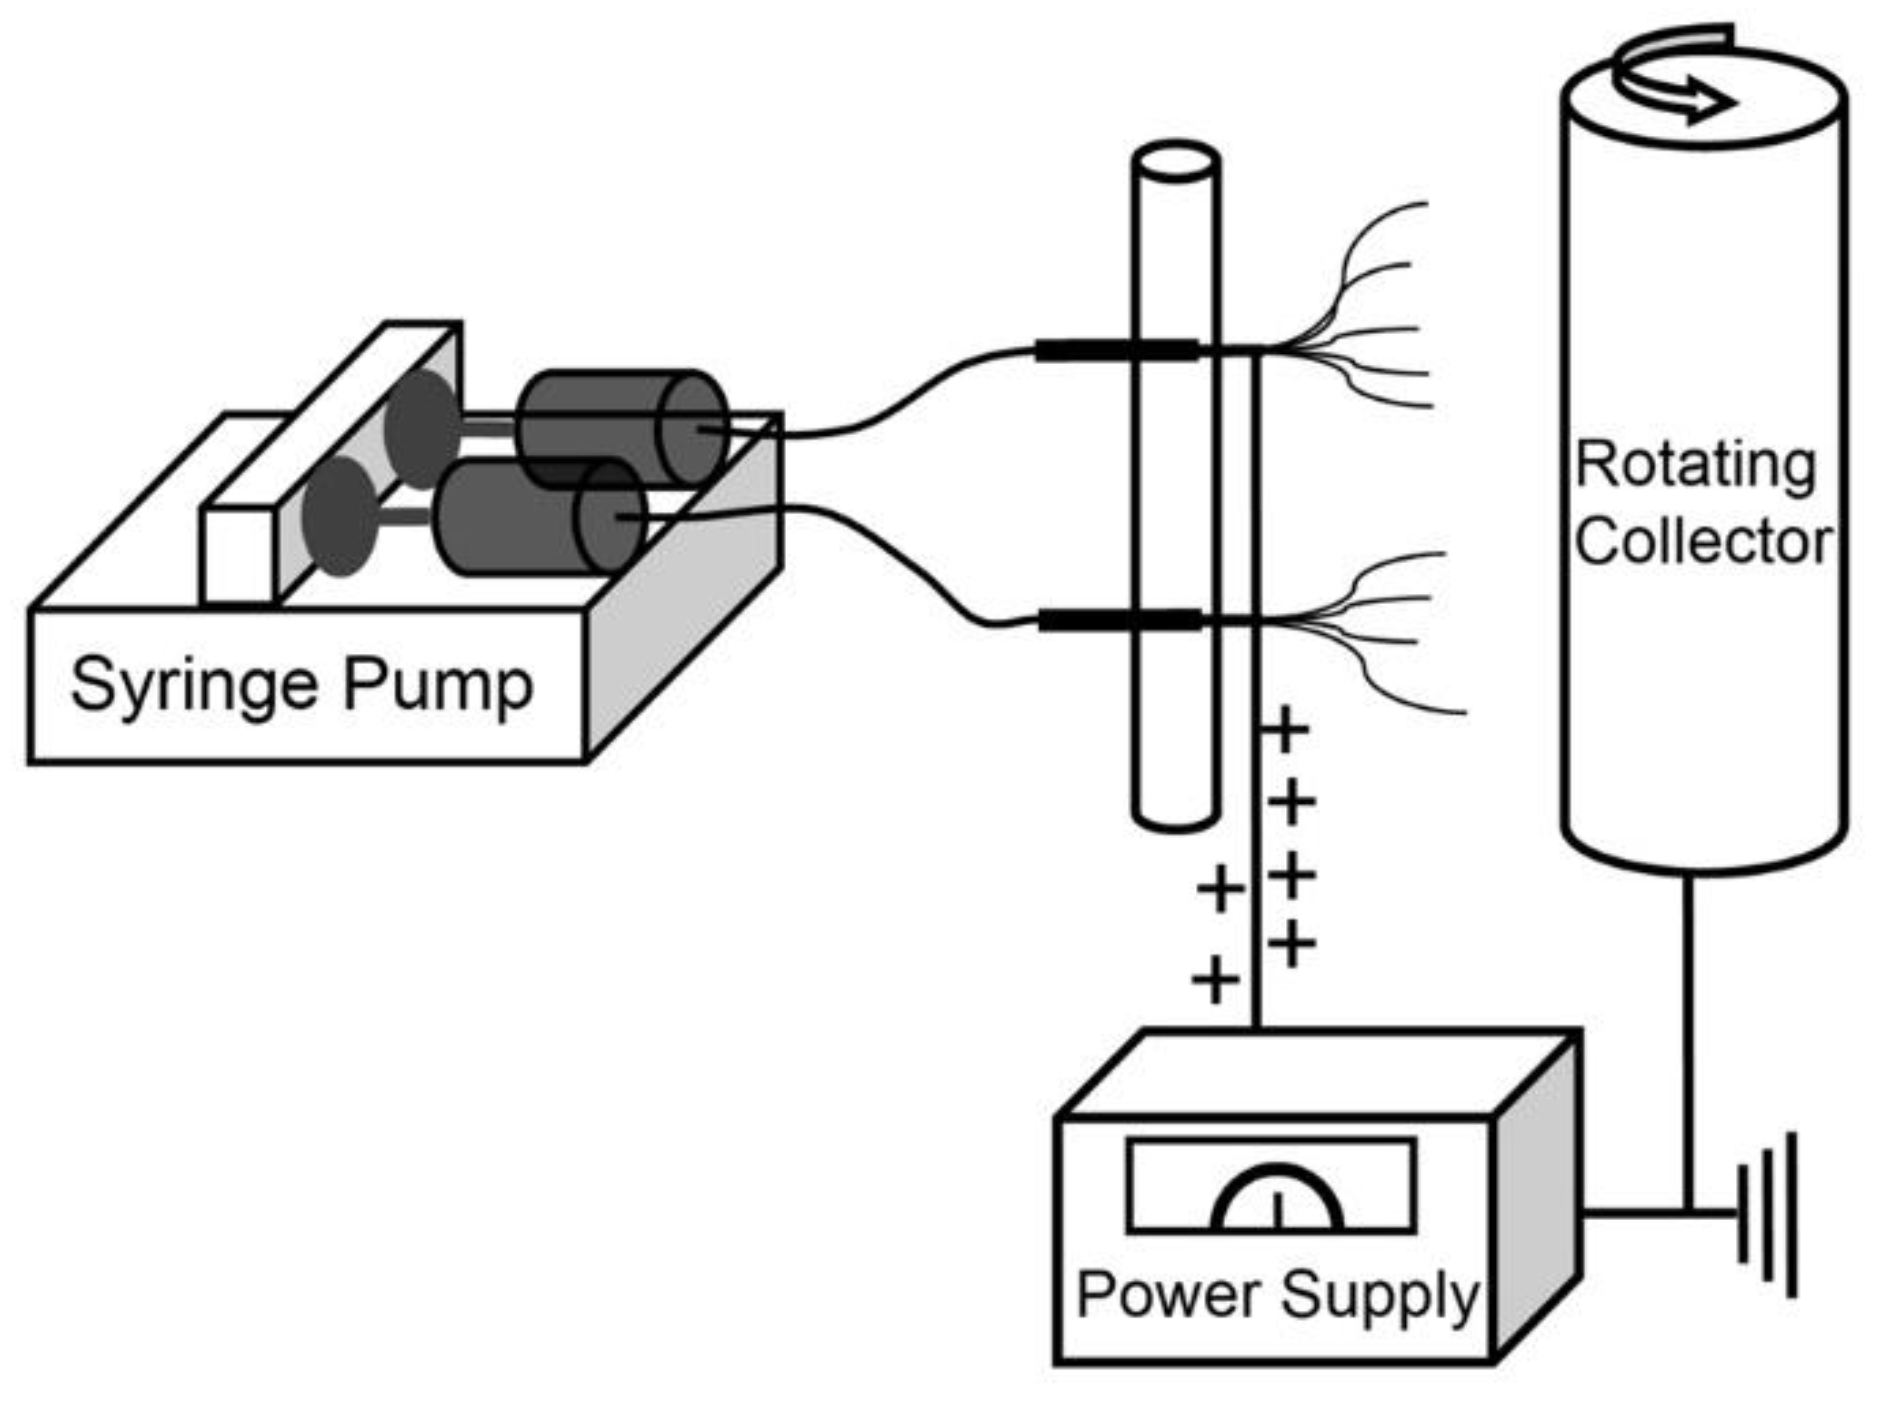
Figure 1. Schematic diagram of the double-needle electrospinning setup.
Fibers 05 00022 g001
Figure 2. Sample scanning electron microscope (SEM) images of PdO doped alumina fibers calcined at (A) 650 °C, (B) 750 °C, (C) 850 °C, (D) 950 °C, (E) 1050 °C, and (F) 1150 °C.
Fibers 05 00022 g002
Figure 3. (A): Fiber diameter distributions and (B): Average diameters (labeled as Da and metal loading) of PdO/Al2O3 fibers of fibers calcined at temperatures ranging from 650 to 1150 °C.
Fibers 05 00022 g003
Figure 4. (A) SEM images of palladium doped alumina nanofibers with alumina microfiber in catalytic filter media; and (B) energy dispersive X-ray analysis (EDX) analysis of elemental composition of the circled area marked “1” in Figure 4A.
Fibers 05 00022 g004
Figure 5. TEM image of Pd doped alumina nanofiber calcined at (A) 650 °C, (B) 850 °C, and (C) 1050 °C.
Fibers 05 00022 g005
Figure 6. X-ray diffraction peaks of (A) PdO/Al2O3 fibers before hydrazine; and (B) Pd/Al2O3 fibers after hydrazine. The PdO peaks in (A) do not appear in (B), while (A) does not have the Pd peaks that appear in (B).
Fibers 05 00022 g006
Figure 7. (A) N2 adsorption-desorption isotherms; and (B) Barret-Joyner-Halenda (BJH) pore size distribution curves of Pd/Al2O3 nanofibers calcined at high temperature.
Fibers 05 00022 g007
Figure 8. Specific surface area of palladium doped alumina nanofibers with calcination temperature.
Fibers 05 00022 g008
Figure 9. Performance of Pd/Al2O3 fiber media calcined at (A) 650 °C, (B) 750 °C, (C) 850 °C, (D) 950 °C, (E) 1050 °C, and (F) 1150 °C.
Fibers 05 00022 g009
Figure 10. Catalytic performance of Pd/Al2O3 fiber media calcined at 650 °C for NO inlet concentrations of (A) 6410 ppm, and (B) 15870 ppm.
Fibers 05 00022 g010
Figure 11. Exhaust gas concentrations of each product and reactant gases of palladium doped on alumina nanofibers with different calcination temperature at (A) NO conversion (%) and (B) CO conversion (%).
Fibers 05 00022 g011
Figure 12. HRTEM images of Pd/Al2O3 fibers before (A,C) and after (B,D) NO–CO reaction.
Fibers 05 00022 g012