Article

Development of Touch Probing System Using a Fiber Stylus

1
Department of Mechanical Systems Engineering, Faculty of Environmental Engineering, The University of Kitakyushu, 1-1 Hibikino, Wakamatsu-ku, Kitakyushu, Fukuoka 808-0135, Japan
2
Department of Mechanical Engineering, Faculty of Engineering, Kyushu University, 744 Motooka, Nishi-ku, Fukuoka 819-0395, Japan
*
Author to whom correspondence should be addressed.
Fibers 2016, 4(3), 24; https://doi.org/10.3390/fib4030024
Submission received: 24 May 2016 / Accepted: 23 July 2016 / Published: 11 August 2016
(This article belongs to the Special Issue Optical Fiber Sensors)

Abstract

:
This paper presents a system that can be used for micro-hole measurement; the system comprises an optical fiber stylus that is 5 µm in diameter. The stylus deflects when it comes into contact with the measured surface; this deflection is measured optically. In this study, the design parameters of the optical system are determined using a ray-tracing method, and a prototype of the probing system is fabricated to verify ray-tracing simulation results; furthermore, the performance of the system is evaluated experimentally. The results show that the design parameters of this system can be determined using ray-tracing; the resolution of the measurement system using this shaft was approximately 3 nm, and the practicality of this system was confirmed by measuring the shape of a micro-hole 100 µm in diameter and 475 µm in depth.

Graphical Abstract

1. Introduction

In recent years, there has been an increasing demand for a method that can measure the accuracy of micro-holes in fuel injector nozzles, nozzles for spinning chemical fibers, optical fiber ferrules, medical devices, mechanical micro-parts, micro-electromechanical systems, micro-molds, optical devices, semiconductors, etc. The diameters of micro-holes range from several µm to several hundred µm. Therefore, a stylus shaft with a diameter smaller than 10 µm is required to investigate these micro-holes. However, it is very difficult to precisely measure the shapes of micro-holes that have large length/diameter (L/D) ratios because of the difficulties encountered during probe fabrication and the complexities involved in employing a sensing method that uses a small measuring force. Many studies have been reported on micro-hole measurement techniques employing a variety of probes such as optical probes [1,2,3], vibroscanning probes [4,5], vibrating probes [6,7,8,9,10,11,12], tunneling effect probes [12,13], opto-tactile probes [14], fiber probes [15,16], optical trapping probes [17], and diaphragm or flexure based probes using an elastic mechanism [18,19,20,21,22,23,24,25,26,27].
This paper presents a system for micro-hole measurement using an optical fiber stylus; this stylus is a type of displacement-measuring probe with low contact force and a wide measuring range; moreover, this stylus is easy to fabricate. The diameter of the stylus shaft is smaller than 3 µm, and the stylus shaft has an aspect ratio larger than 200. The stylus shaft is fabricated using an acid etching technique [28]. In general, the stylus shaft must be rigid to transmit the measuring force acting on the stylus tip to the force detection mechanism installed at the root of the stylus shaft. However, because the proposed probe measures the deflection amplitude of the stylus shaft using a laser-based non-contact method, the stylus shaft need not be rigid; this principle also applies to styluses with much smaller diameters and longer lengths. In this study, the design parameters of the optical system are determined using ray tracing, and a prototype of the measuring system is fabricated to verify the simulation results.

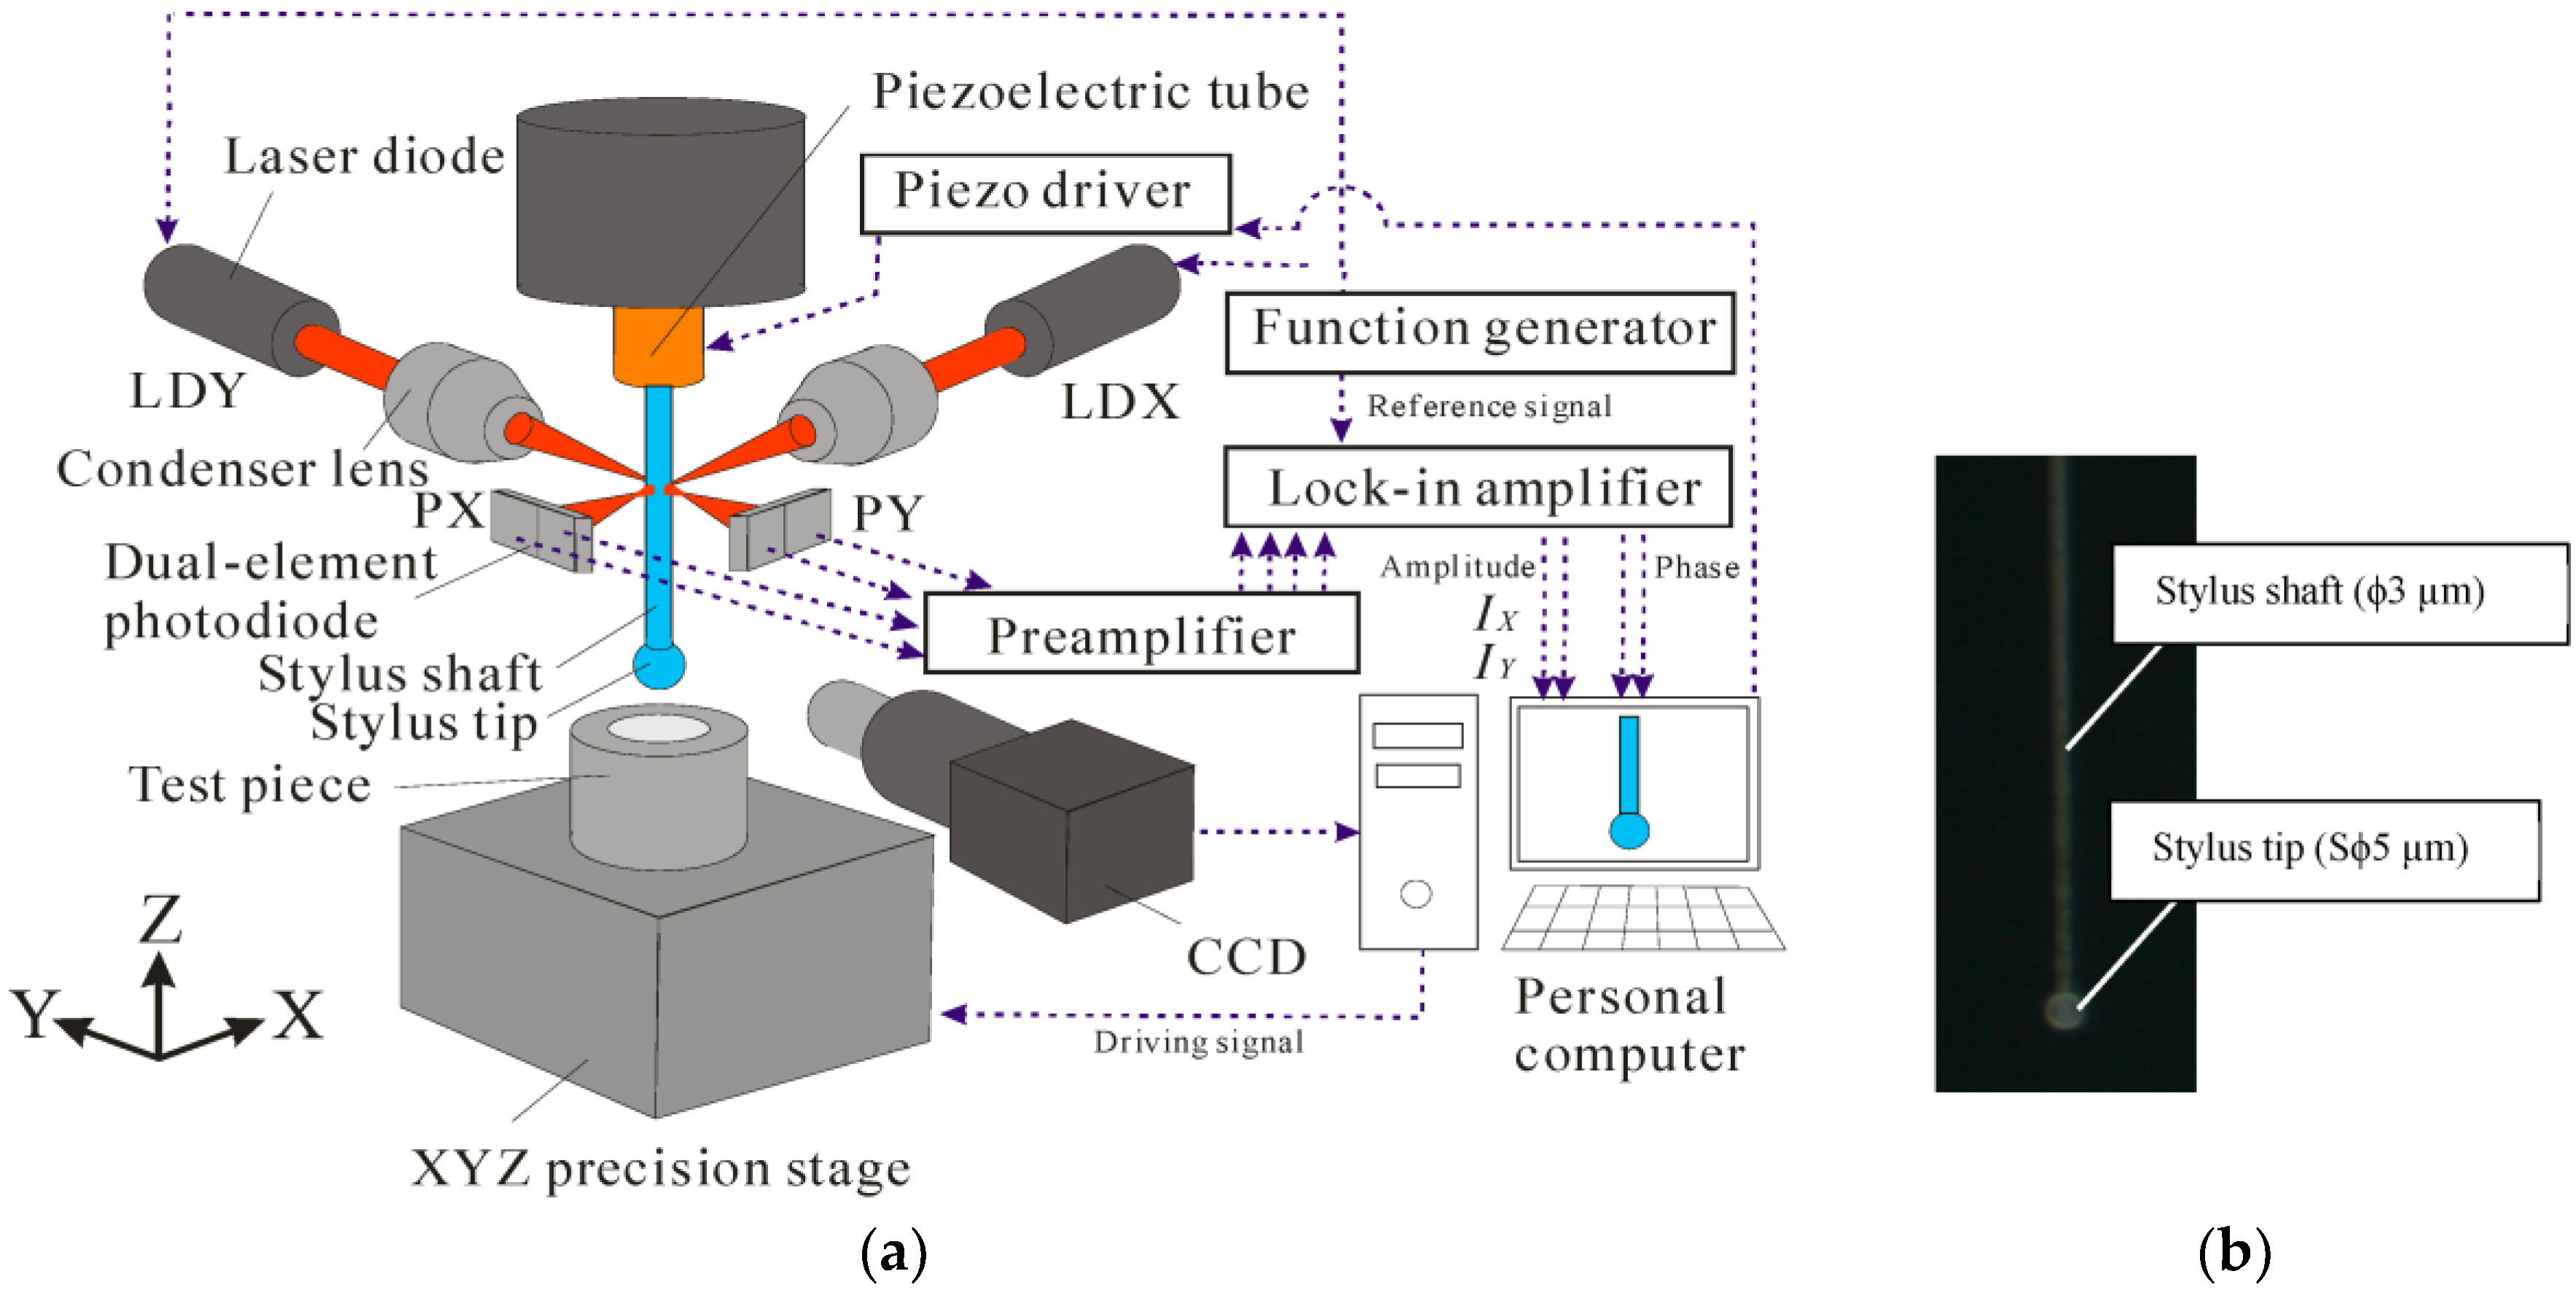
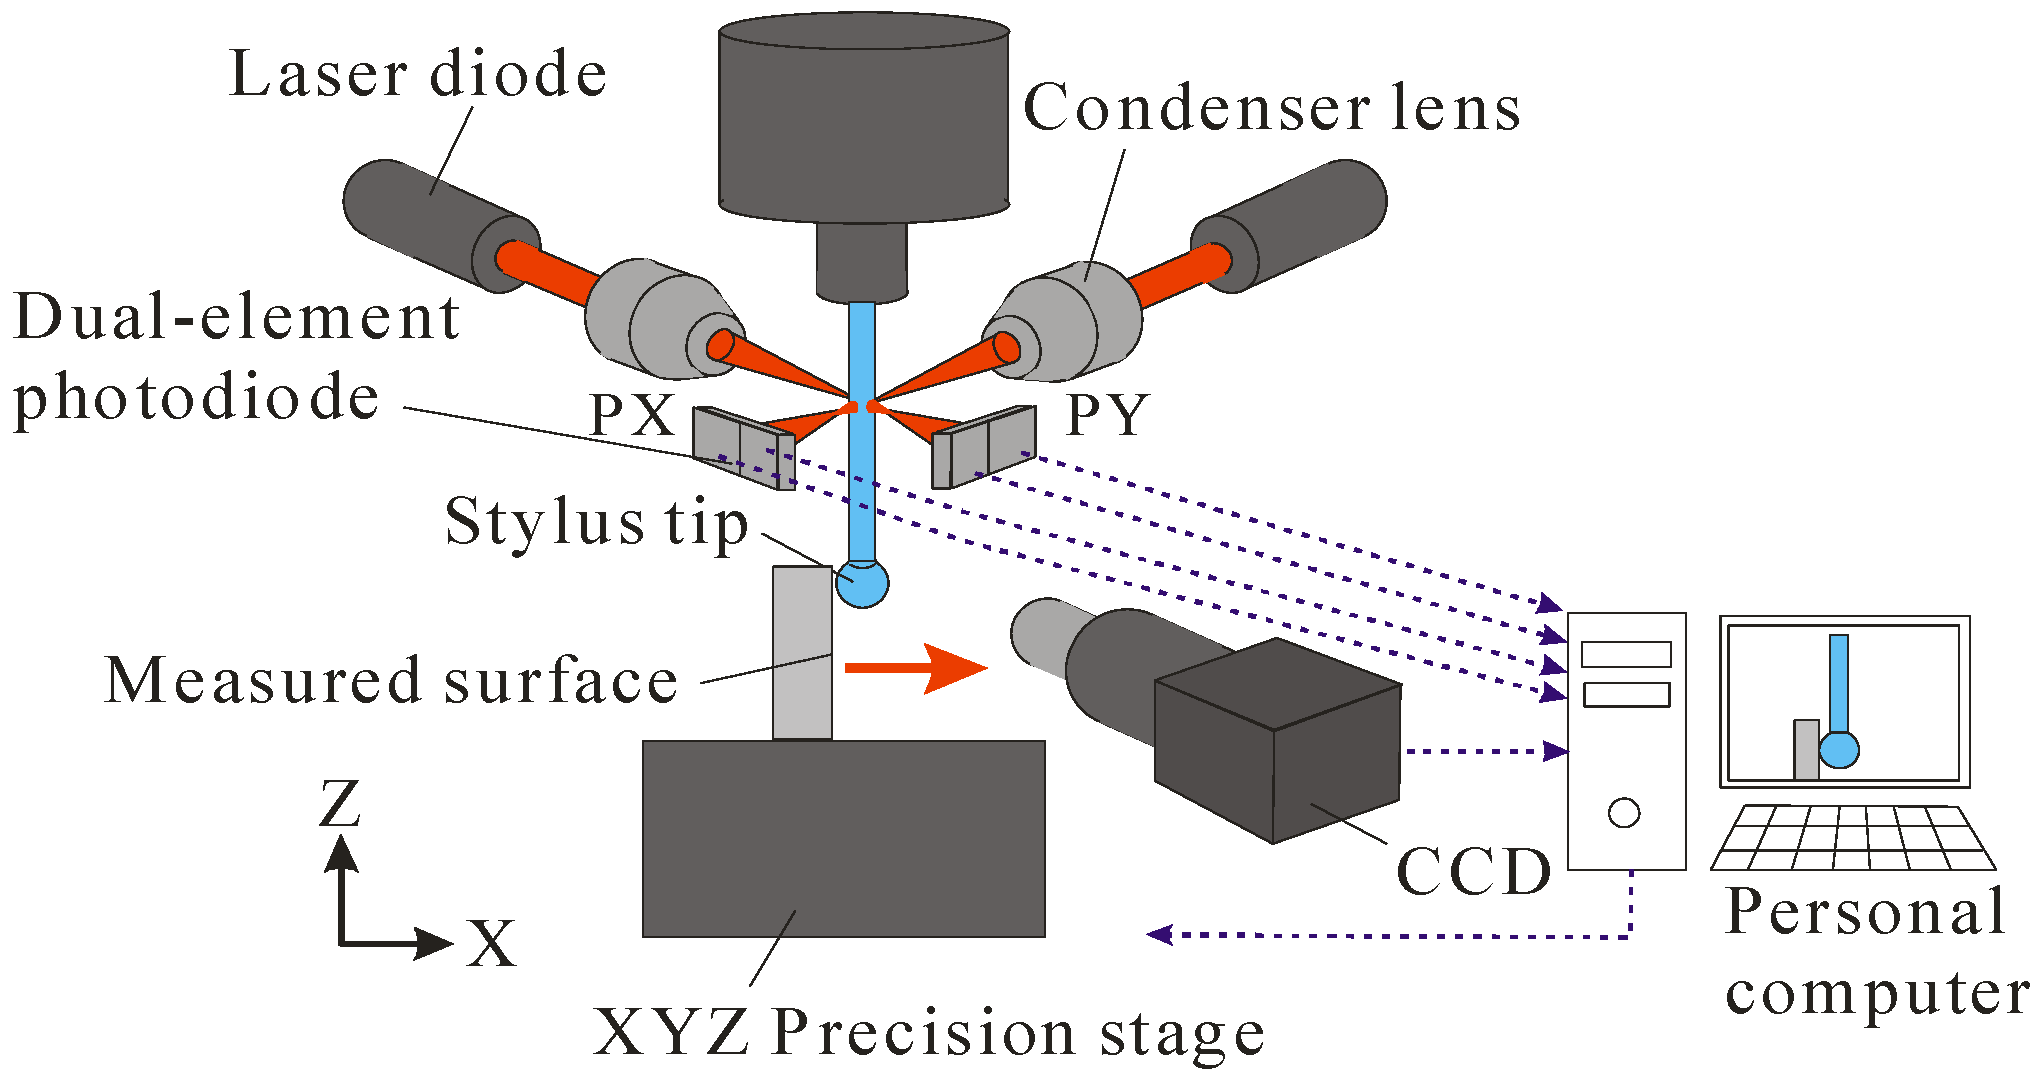
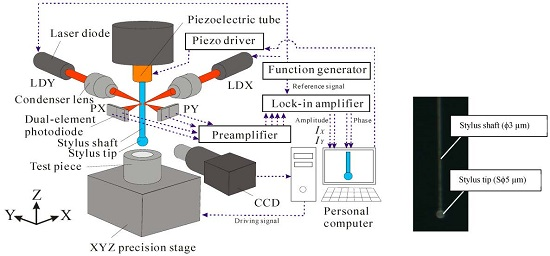
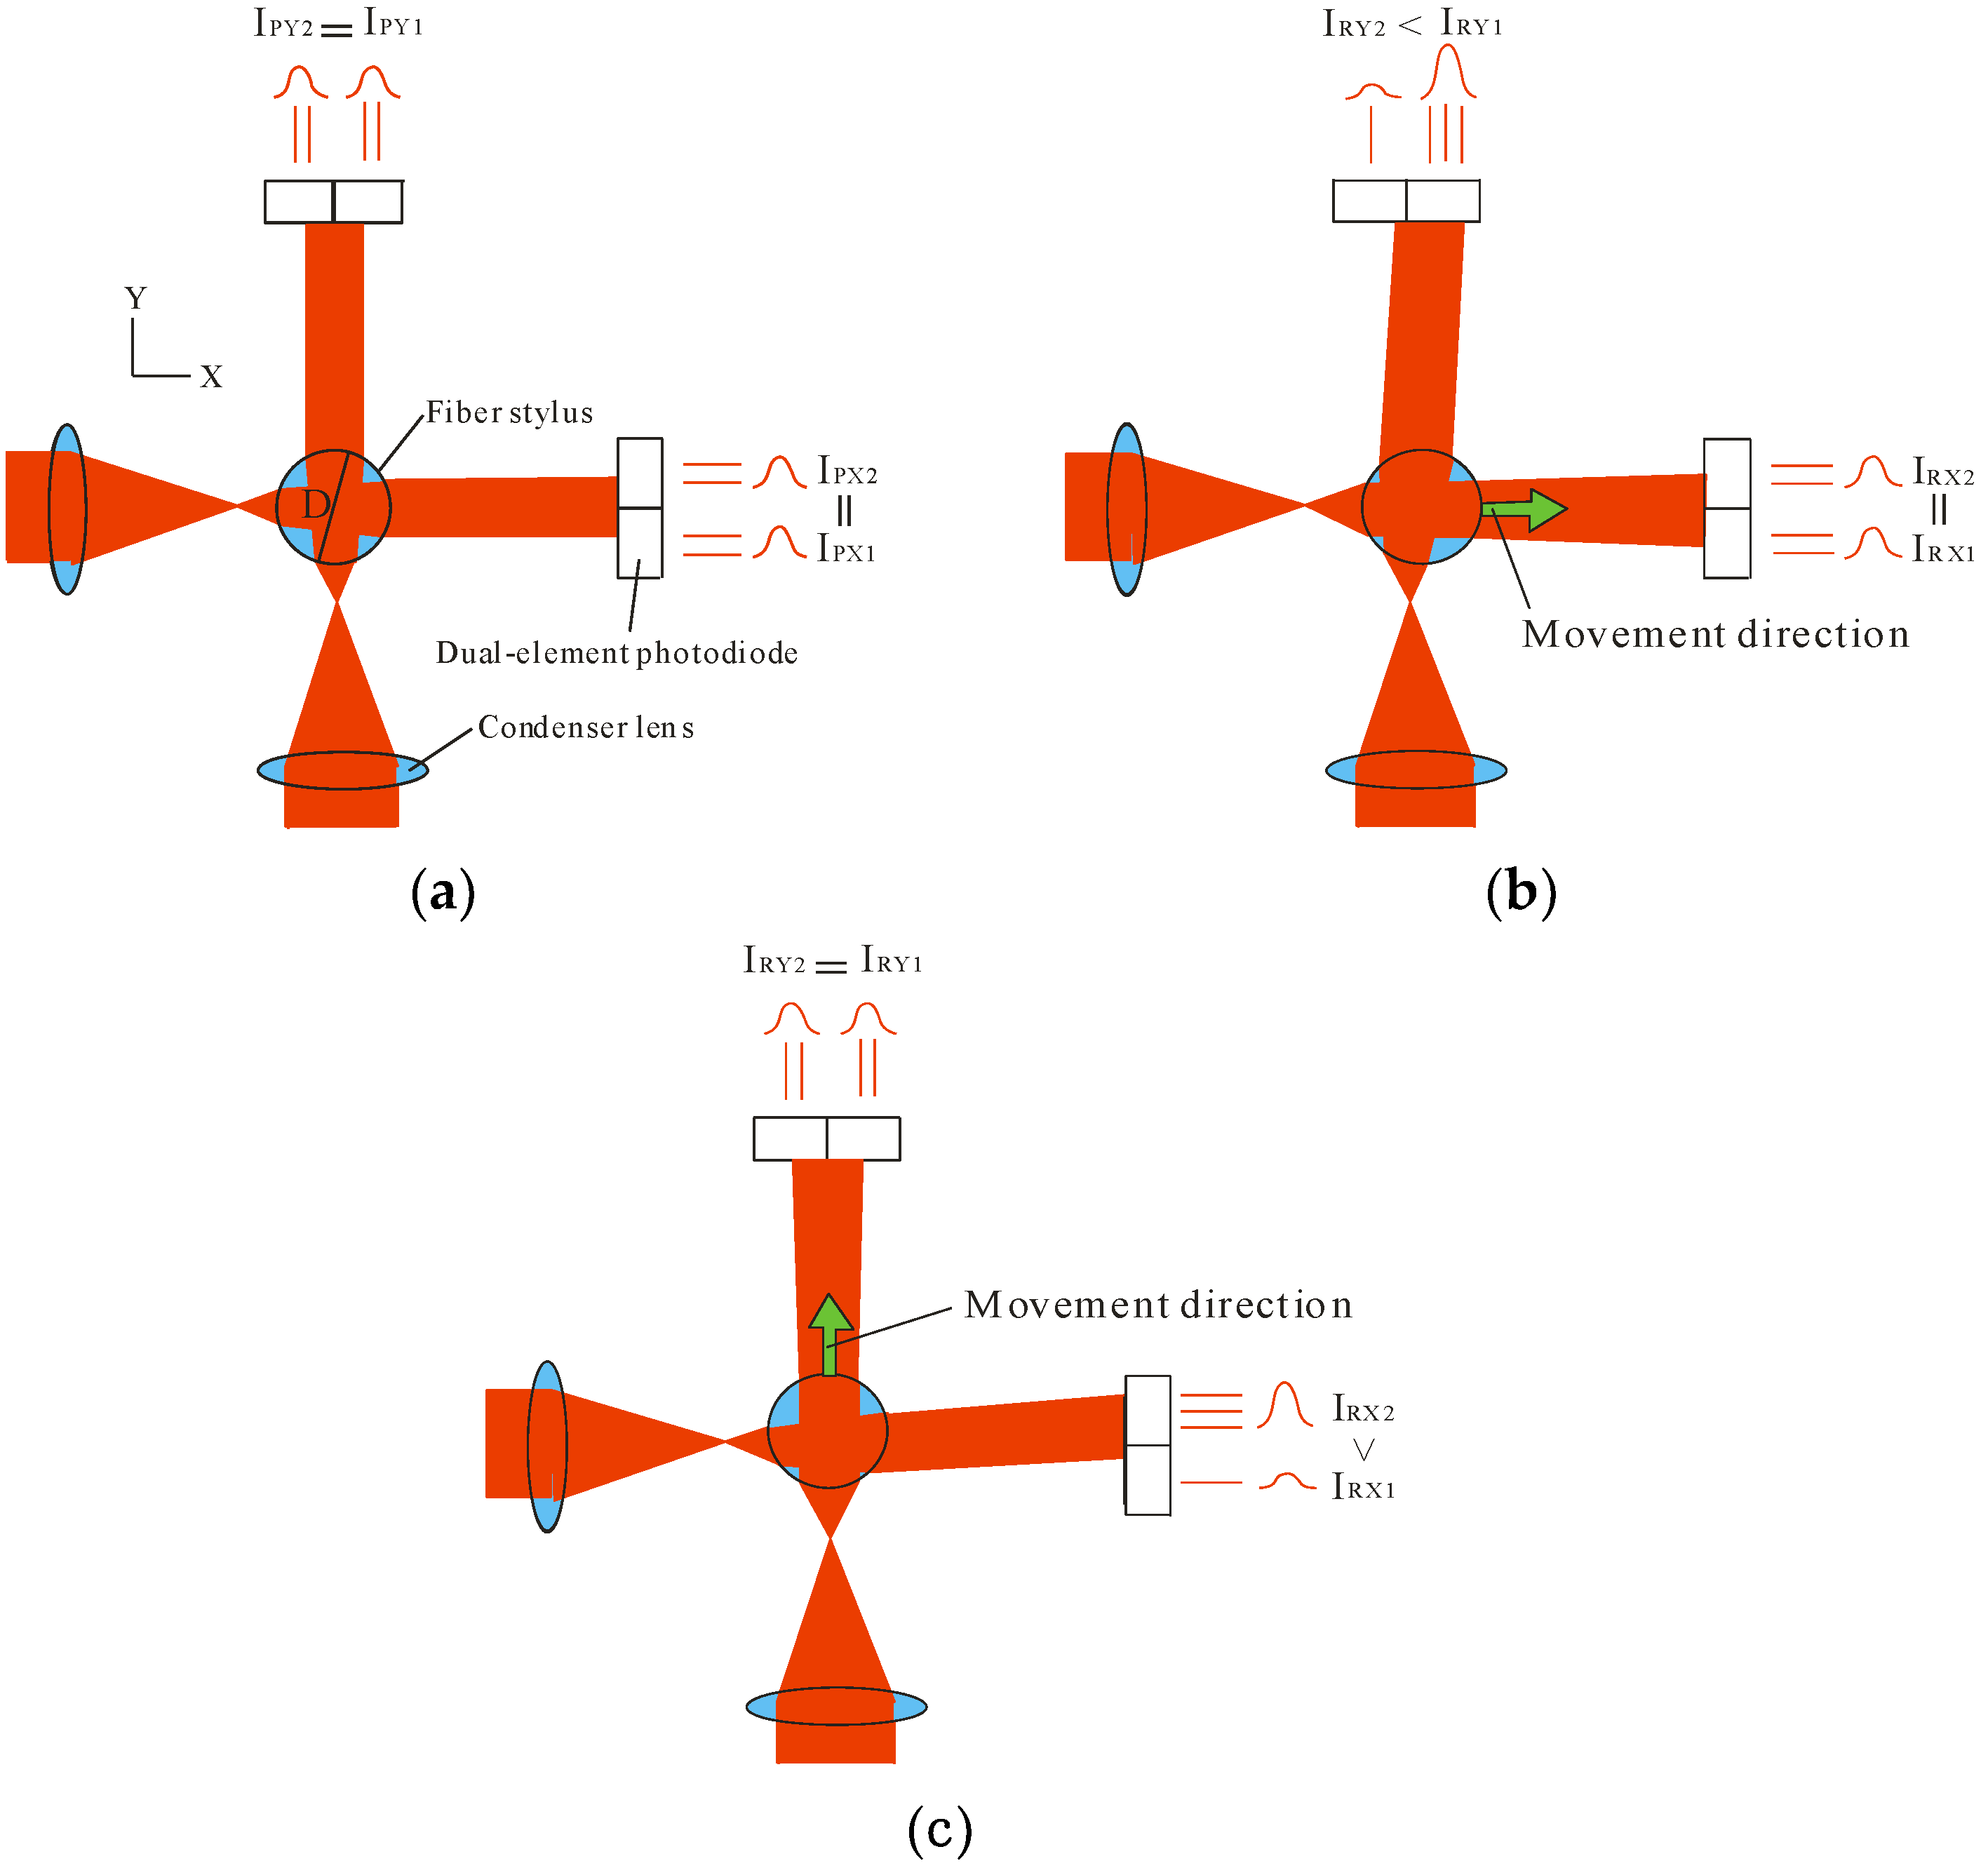
2. Measurement Principle

Figure 1 shows an illustration of the probing system and a photograph of the fiber stylus. The fiber stylus consists of a shaft (optical fiber) and a stylus with diameters of 3 and 5 µm, respectively (Figure 1b). The probing system consists of the fiber stylus, two laser diodes (LDX, LDY), and two dual-element photodiodes (PX, PY) facing the X and Y directions. The stylus shaft is fabricated using an acid etching technique [28]. First, the step index multi-mode optical fibers (core diameter: 100 µm, clad diameter: 125 µm) were stripped of their plastic layers. The tips of the fibers were then immersed in a hydrofluoric acid solution, and hydrofluoric acid etching was carried out at room temperature (23 °C). The diameter of the probe shaft was measured with an optical microscope. After this process, the stylus shaft was rinsed with water and acetone. After fabricating the probe shaft, the shaft’s tip was immersed in ultraviolet curing resin and then moved into contact with a glass probe sphere. Next, the probe shaft and sphere were irradiated by ultraviolet rays and glued together. Figure 1b shows a photograph of a stylus shaft glued to a stylus tip, the two parts having diameters of 3 µm and 5 µm, respectively. The stylus shaft is fixed to a tube-type piezo driver element to perform attitude adjustment of the stylus shaft; the stylus shaft is installed between the laser diodes and the dual-element photodiodes, which are oriented orthogonally (Figure 1a). The stylus shaft is irradiated by two focused laser beams emitted by the two laser diodes through condenser lenses in the X and Y directions. The dual-element photodiodes, PX and PY, are located opposite to the laser diodes, LDX and LDY, with respect to the stylus shaft, respectively. Each laser beam penetrating the stylus shaft impinges upon the corresponding dual-element photodiodes. The light intensities detected by PX and PY are converted into voltage signals and are represented as IPX1, IPX2, IPY1 and IPY2 (V). Figure 2 shows the measurement principle in the case where the diameter of the stylus shaft is larger than approximately 10 µm. Before the stylus tip comes into contact with the measured plane, the light intensity measured by each element of the dual-element photodiode is equal, as shown in Figure 2a (i.e., IPX1 = IPX2, IPY1 = IPY2). When the stylus tip comes into contact with the measured plane in the +X direction, the stylus shaft is displaced and the light intensity of each element of the dual-element photodiode becomes unequal, as shown in Figure 2b (i.e., IPX1 = IPX2, IPY1 > IPY2). When the stylus shaft is displaced in the +X direction, the angle of refraction of the laser beam passing through the stylus shaft in the Y-direction changes owing to a shift in the part of the stylus shaft being irradiated. Additionally, when the stylus tip comes into contact with the measured plane in the +Y direction, the stylus shaft is displaced, and the light intensity of each element of the dual-element photodiode becomes unequal, as shown in Figure 2c (i.e., IPX1 > IPX2, IPY1 = IPY2). On the basis of these changes in light intensities, the contact direction and magnitude of the stylus tip can be ascertained. When the stylus tip comes into contact with the measured plane in the Z-direction, the stylus shaft buckles and deflects. This deflection is also measured using the above-mentioned method.
The displacement of the fiber stylus is magnified by the stylus shaft, which works as a rod lens. The surface of the micro-hole is scanned in the XYZ directions using a precision stage, and the accuracy of the micro-hole is measured by recording the coordinates of the contact points and the displacement of the fiber stylus.
The output signal IX in the X direction obtained using IPY1 and IPY2 and the output signal IY in the Y direction obtained using IPX1 and IPX2 are defined by Equations (1) and (2), respectively.
IX = IPY1IPY2
IY = IPX1IPX2
In general, the stylus shaft must be rigid to transmit the measuring force acting on the stylus tip to the force detection mechanism installed at the root of the stylus shaft. However, because the proposed probe measures the deflection amplitude of the stylus shaft using a laser-based non-contact method, the stylus shaft need not be rigid; this principle also applies to styluses with much smaller diameters and longer lengths. This measurement system measures the deflection of the stylus shaft; however, it does not directly measure the displacement of the stylus tip. The noise present in IX and IY is removed via synchronous detection using a lock-in amplifier. The displacement of the stylus is magnified by using it as a rod lens. The surface of the microstructure is measured by recording the displacement of the stylus shaft as well as the coordinates at which the stylus comes into contact with the measured surface.

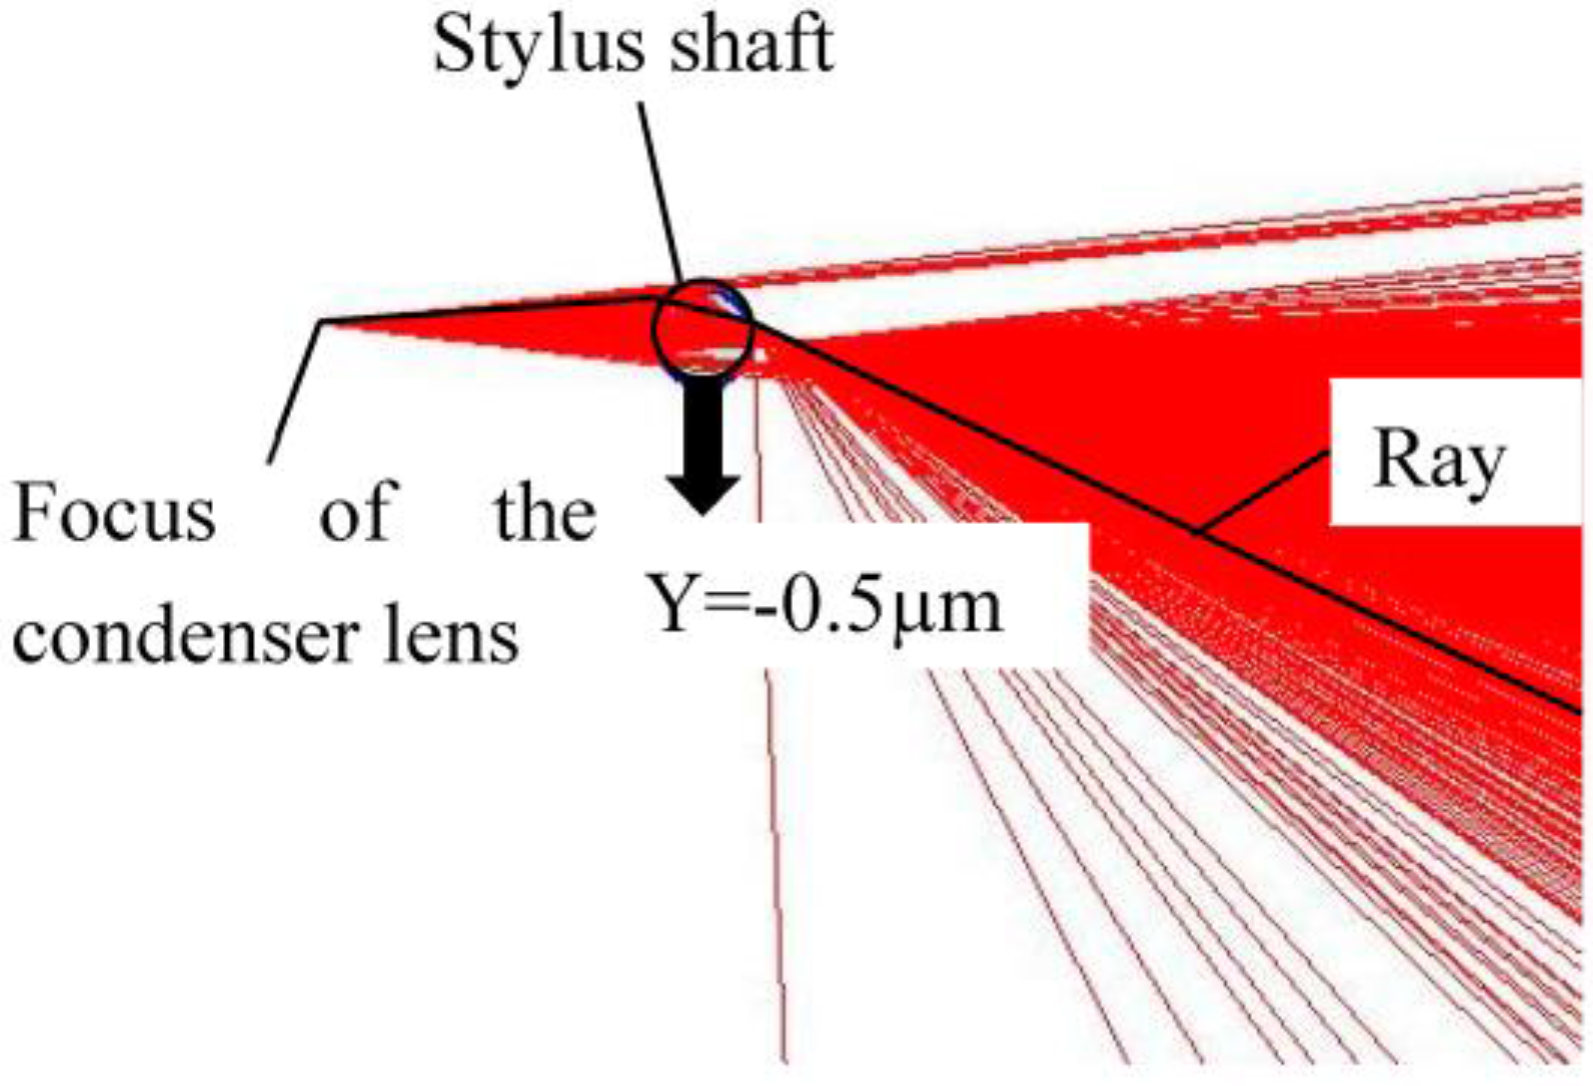
3. Optical Analysis to Determine the Relationship between Stylus Tip Displacement and the Output Signal

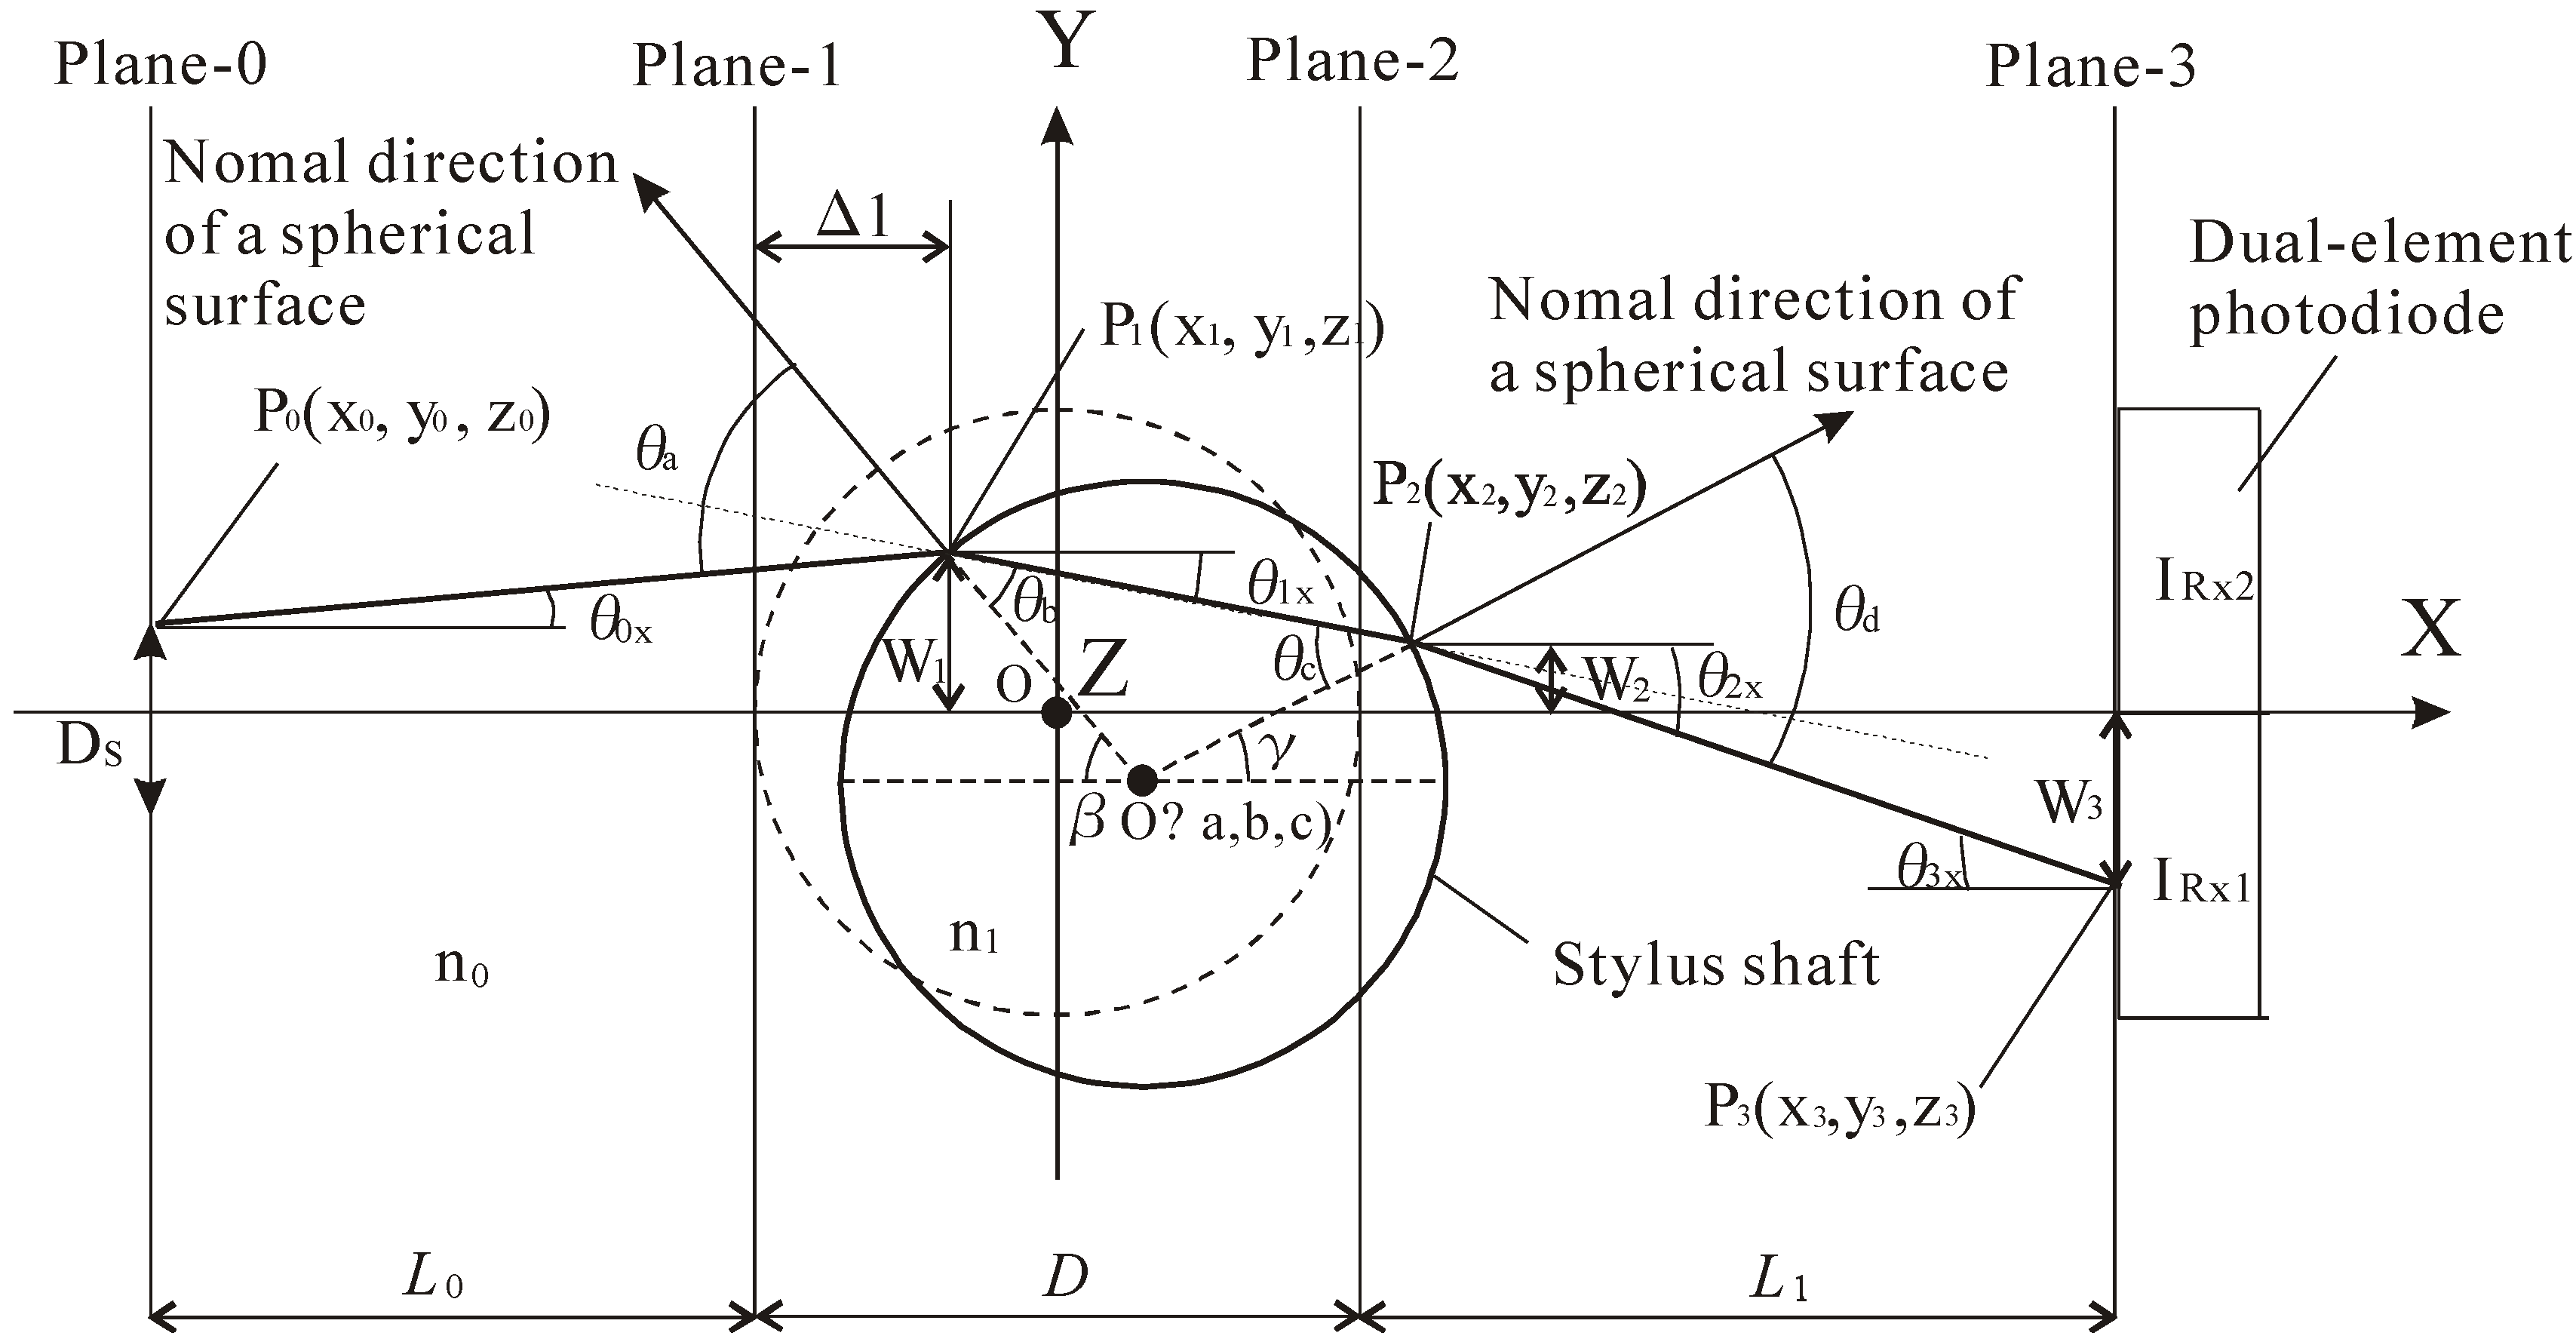
3.1. Analysis Method

When the displacement of the fiber stylus is detected, the resolution of the optical system is changed by the distance L0 between the focal position of the condenser lens and the stylus shaft, the distance L1 between the stylus shaft and the dual-element photodiode, and the diameter D of the stylus shaft. In this study, the design parameters of the optical system are determined using the three-dimensional ray-tracing method.
First, random numbers with a Gaussian distribution are generated using the Box-Muller method [29], and one hundred million rays based on this distribution are radiated from the condenser lens. The radiation intensity distribution of this laser beam is assumed to be a Gaussian distribution. In the simulation of the ray-tracing method, the intensities detected by each photodiode are defined as the relative intensities for all rays and are expressed as IX (%) and IY (%). The rays are then traced through the optical system, and the intensity expected at each photodiode is calculated. The stylus shaft is used as a rod lens. Therefore, part of the laser beam can be collimated after passing through the stylus shaft by aligning the laser beam spot and the stylus shaft, and part of the laser beam diverge. Table 1 lists the simulation conditions. Figure 3 shows the trajectory of a ray incident on the laser-irradiated part of the stylus shaft in the XY plane. Table 2 lists the nomenclature used for the simulation calculations. The spatial coordinate, P3(x3, y3, z3), of the beam at the surface of the photodiode is estimated by:
x 3 =   L 1 + D 2
y 3 =   y 2 + ( L 1 x 2 + D 2 ) tan θ 2 X
z 3 =   z 2 + ( x 3 x 2 ) tan θ 2 Z
Figure 4 shows a graphical display of the ray tracing result when the stylus shaft is displaced to Y = −0.5 µm.

3.2. Conversion to Stylus Tip Displacement

The displacement of the laser-irradiated part of the stylus shaft in the simulation is converted to that of the stylus tip. As shown in Figure 5 and Figure 6, the length of the stylus shaft is 1 mm, and the distance between the stylus tip and the laser-irradiated part of the stylus shaft is 0.5 mm. Therefore, the displacement of the stylus tip is magnified to approximately three times that of the laser-irradiated part of the stylus shaft when the stylus shaft is regarded as the cantilever beam of a rigid support.

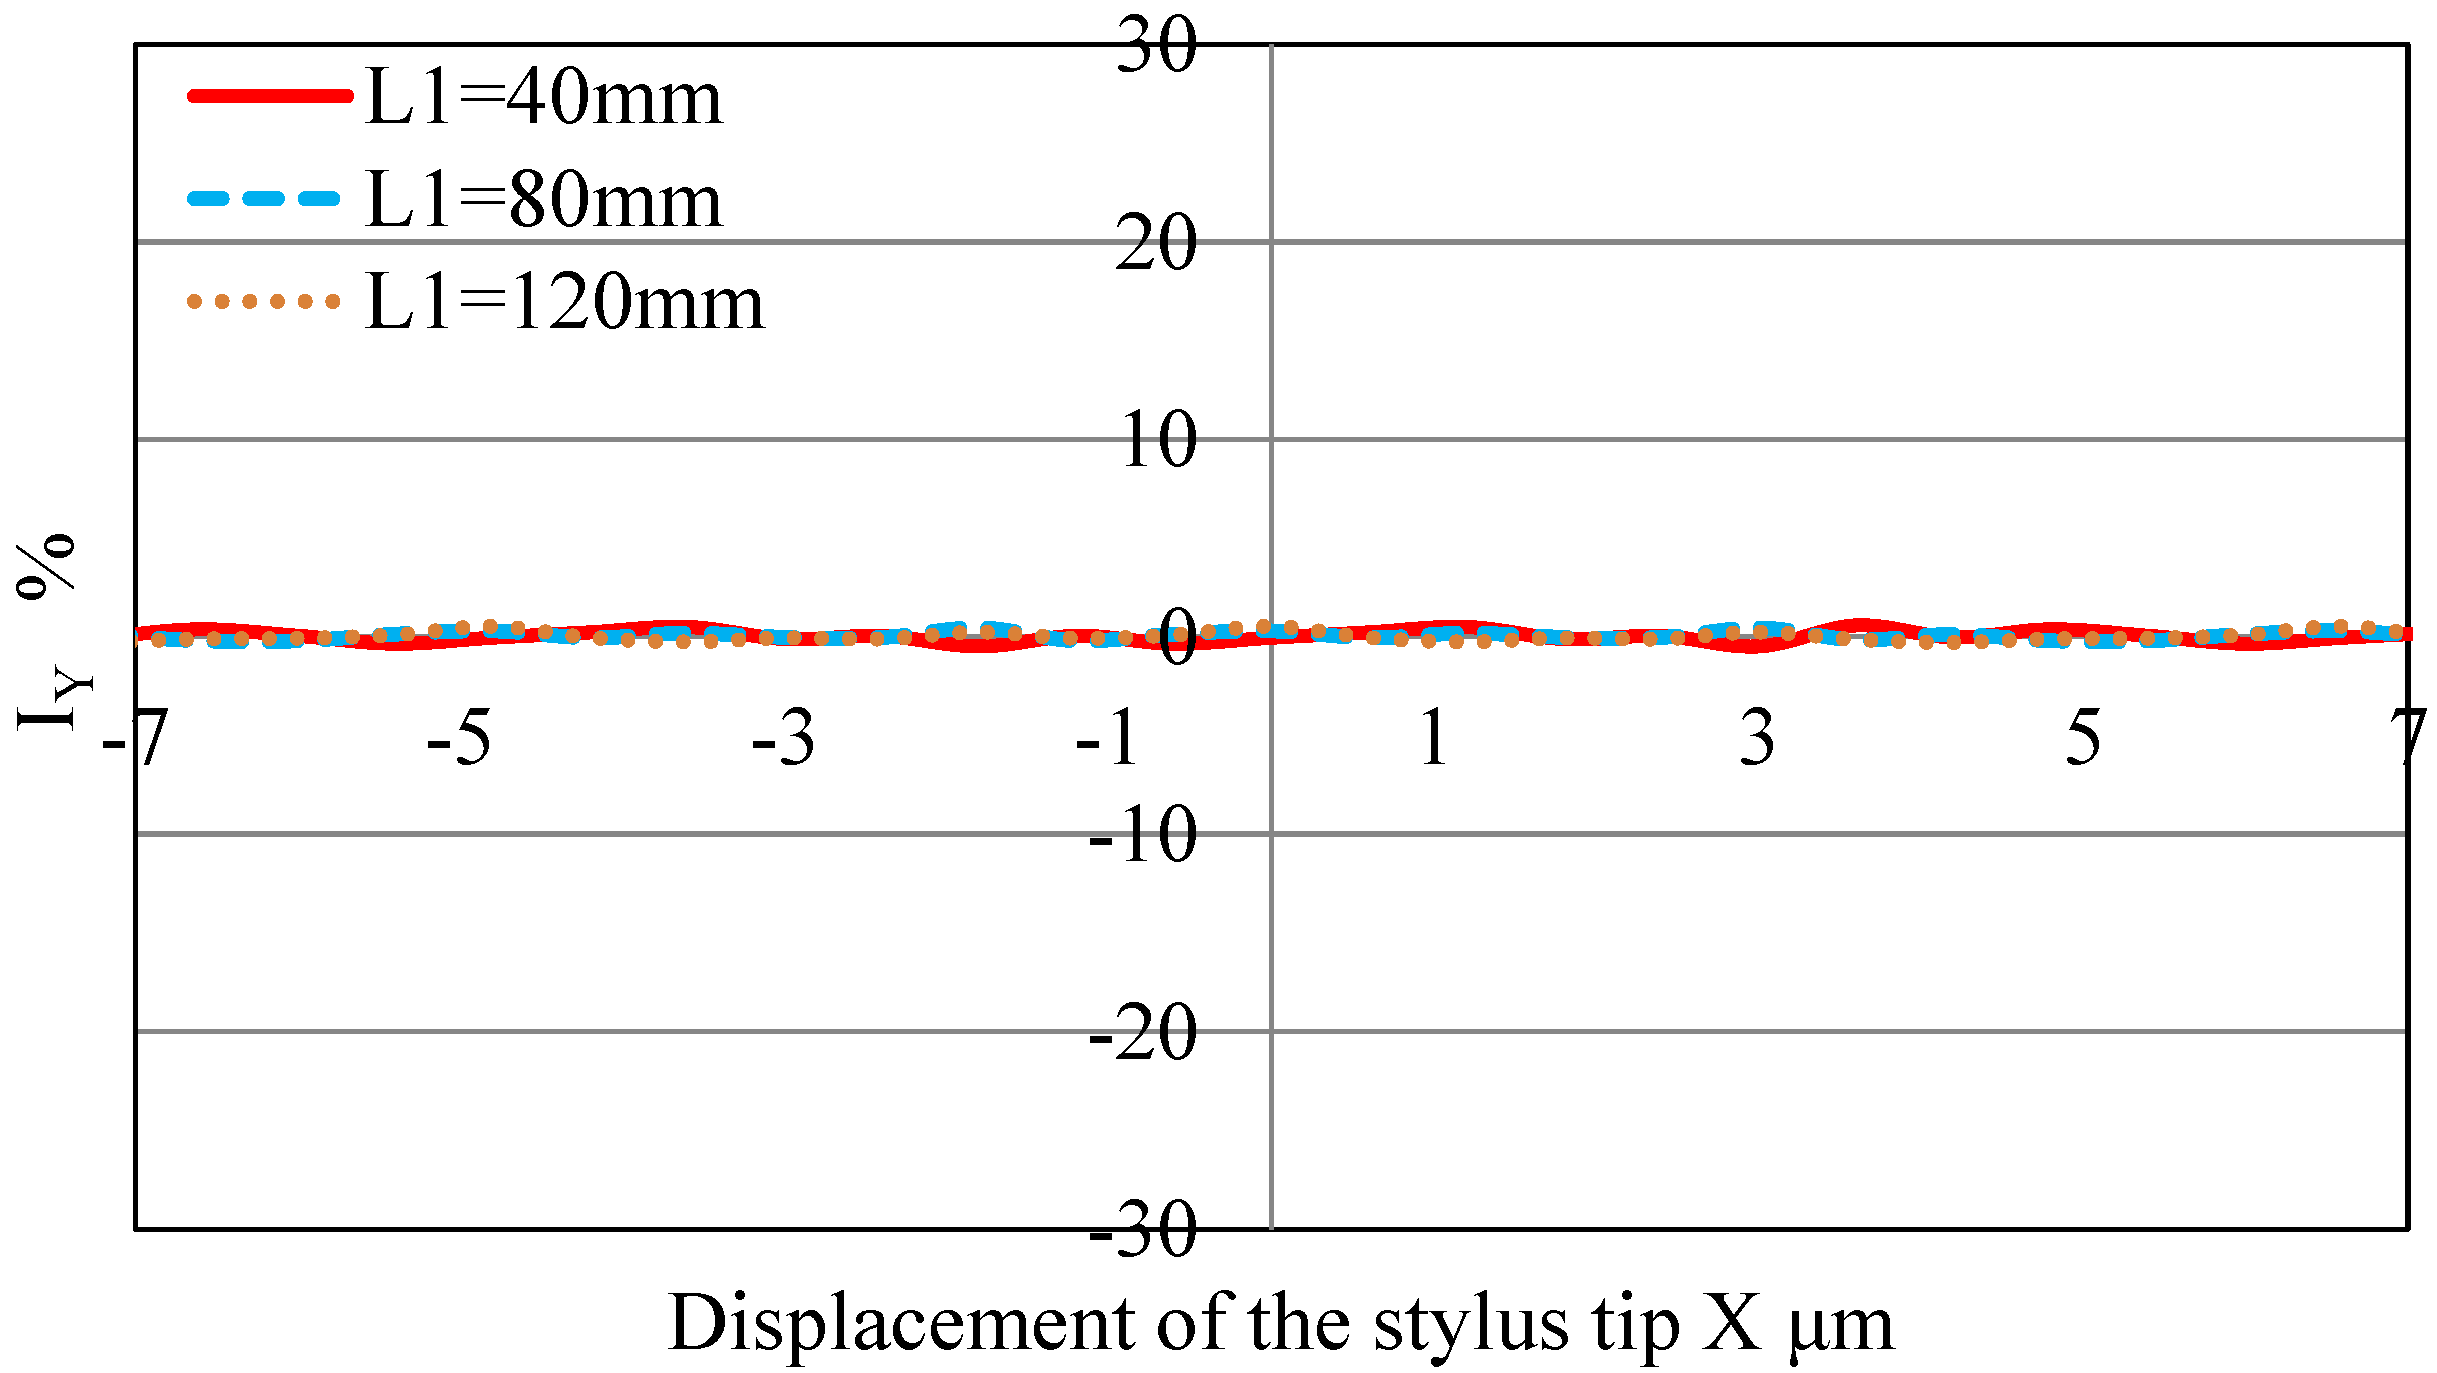
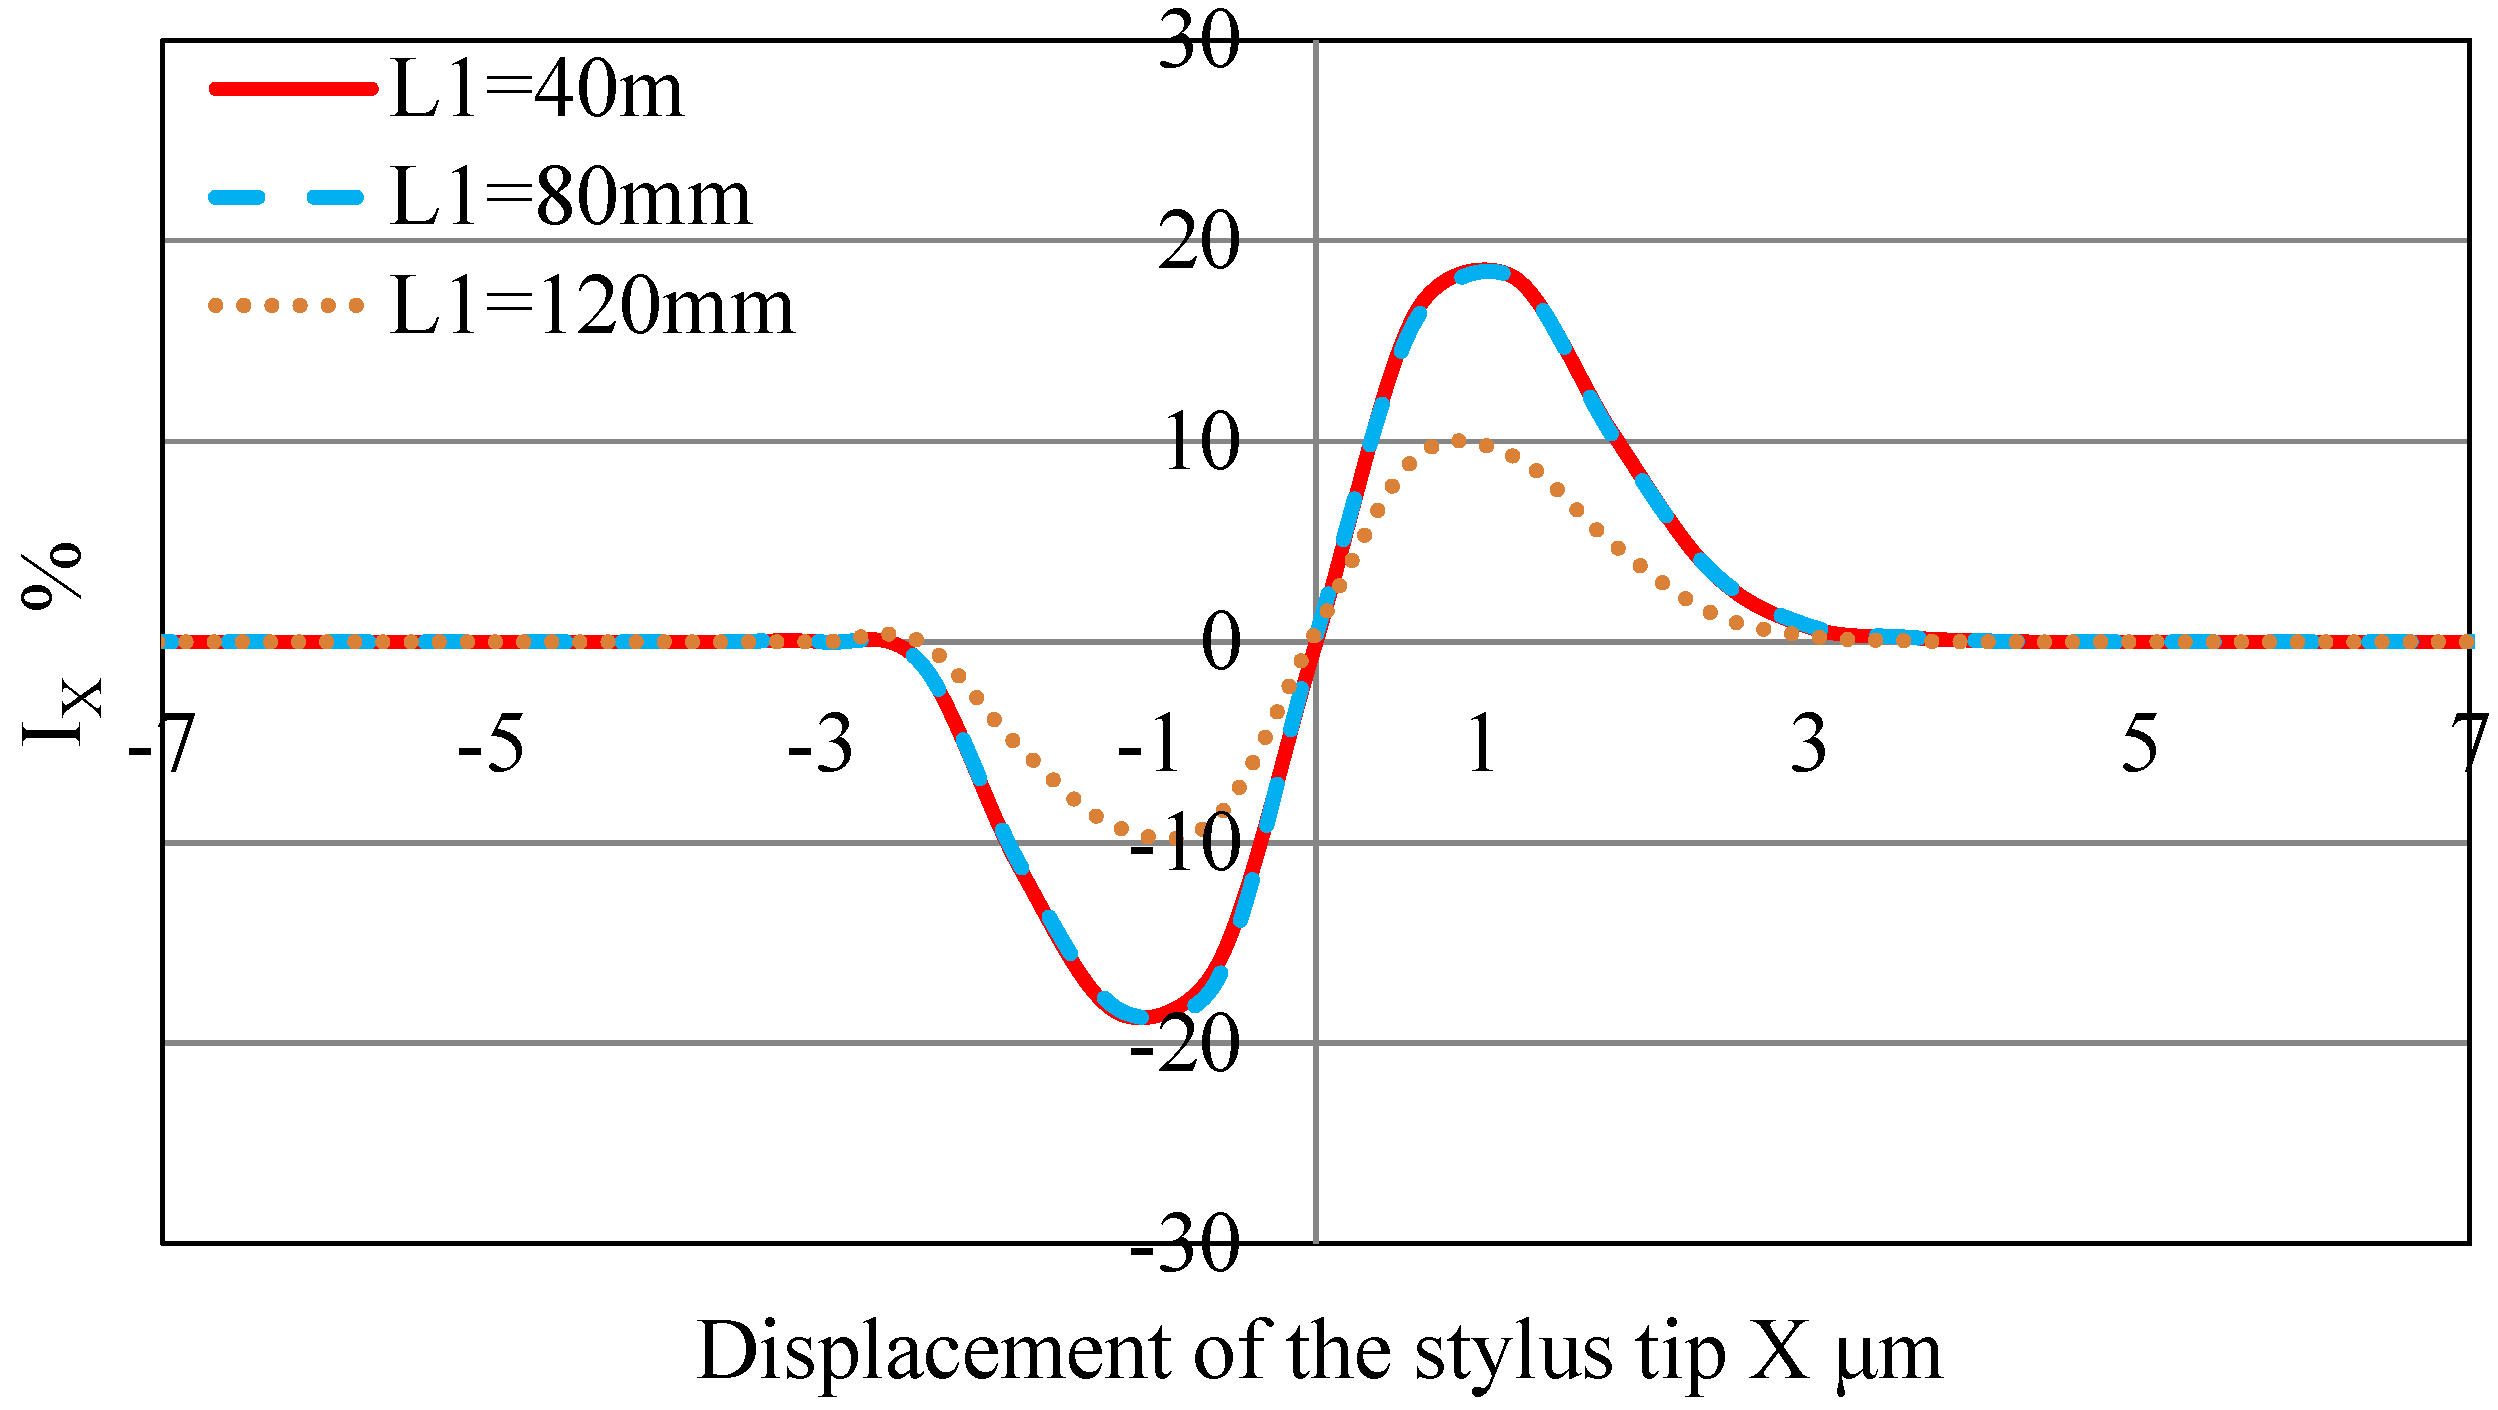
3.3. Simulation Results

Figure 7 and Figure 8 show the ray-tracing simulation results for the case where the stylus shaft is displaced from −7 to +7 µm in the X direction. L0 is selected such that all rays intersect with the stylus shaft. Figure 7 shows the simulation result of IY for distances L1 = 40, 80, and 120 mm. Since IY changes only slightly, the sensitivity relative to the X direction is low.
Figure 8 shows the simulation results of IX for distances L1 = 40, 80, and 120 mm under the same conditions. The rate of change of IX is maximum for L1 = 40 and 80 mm. The slope of the curve for L1 = 120 mm is gradual, resulting in low resolution. The resolution and the measuring range change as a function of the diameter of the stylus shaft. Therefore, the design parameters must be determined as functions of the system specifications.

4. Characteristics of the Stylus during Displacement Detection

Figure 9 and Figure 10 show the experimentally measured changes in IX and IY for the distances L1 = 40 mm when the measured surface approaches the stylus tip by 1 nm in the X direction. The horizontal axis represents the displacement of the stylus tip, and the vertical axis represents the changes in IX and IY. We find that IY changes slightly when the stylus tip is displaced in the X direction. However, because IX remains linear for displacements over approximately ±3 µm, it is possible to use the fiber stylus as a displacement sensor for the X direction.
The experimental results are linear in the range of approximately ±3 µm, but the simulation results are linear in the range of approximately ±0.6 µm. That is, the results of the simulation do not agree with those of the experiment.
Since the laser beam size on the stylus shaft is larger than the diameter of the stylus shaft (3 µm), the results of the simulation are different from those of the experiment. Therefore, in the next simulation, the laser beam size was taken into consideration.

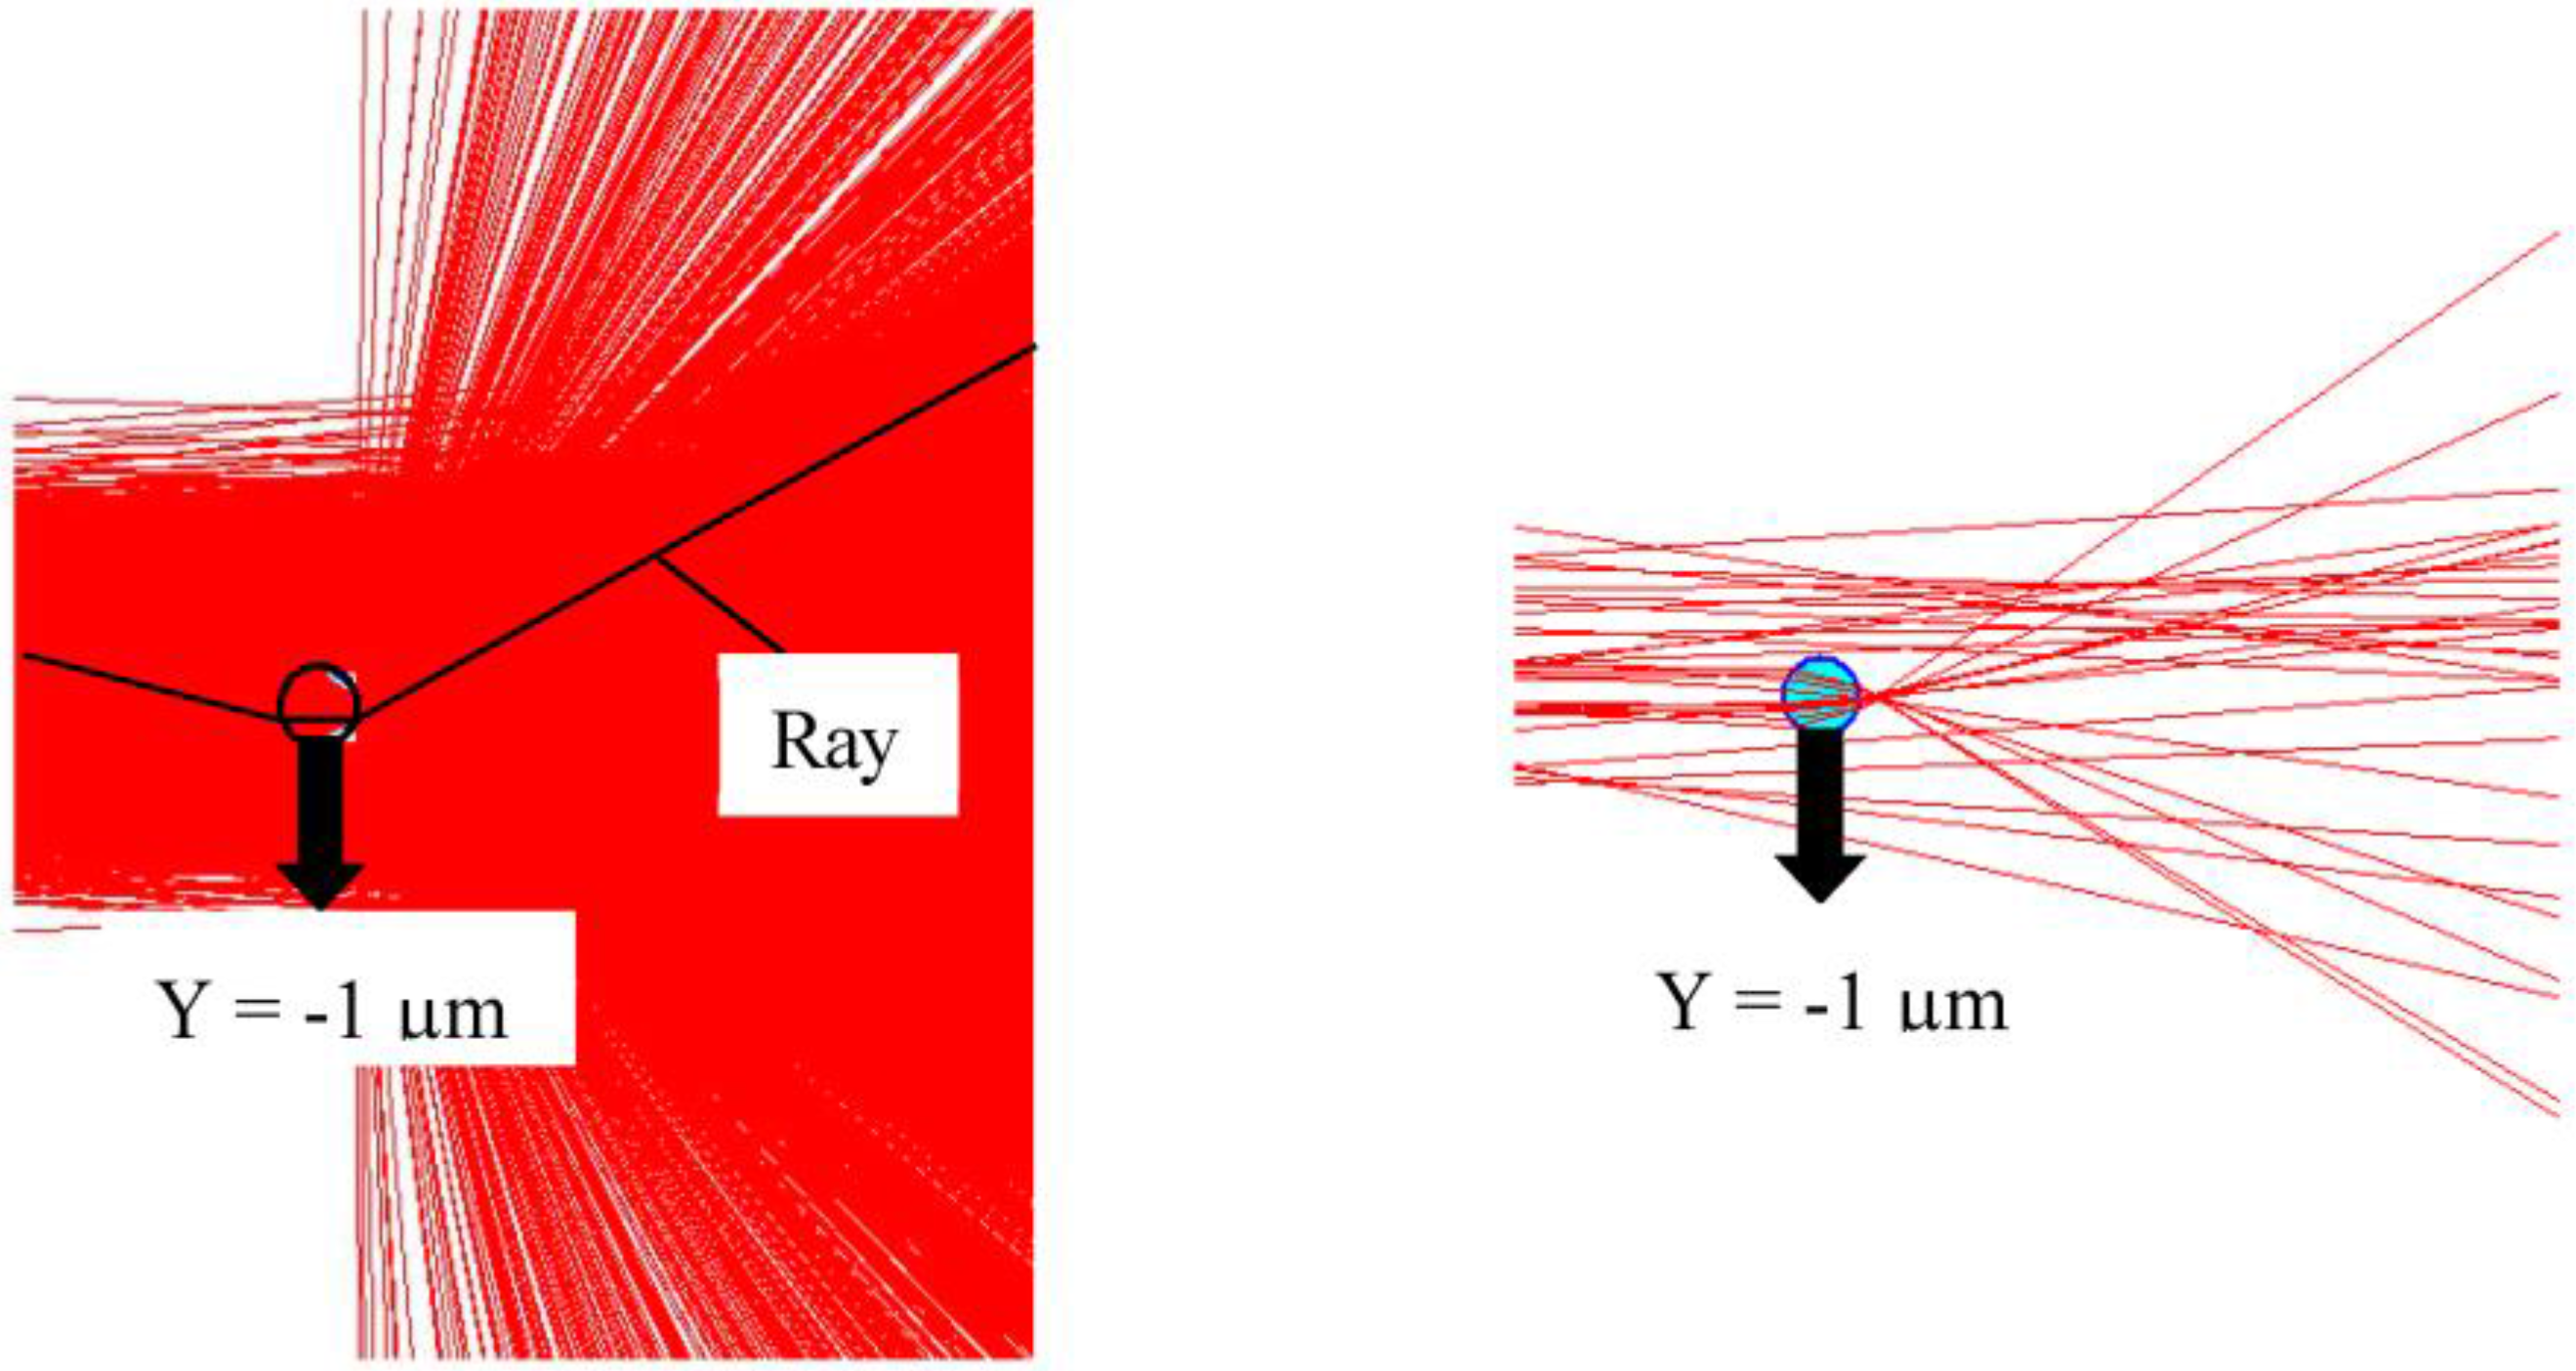
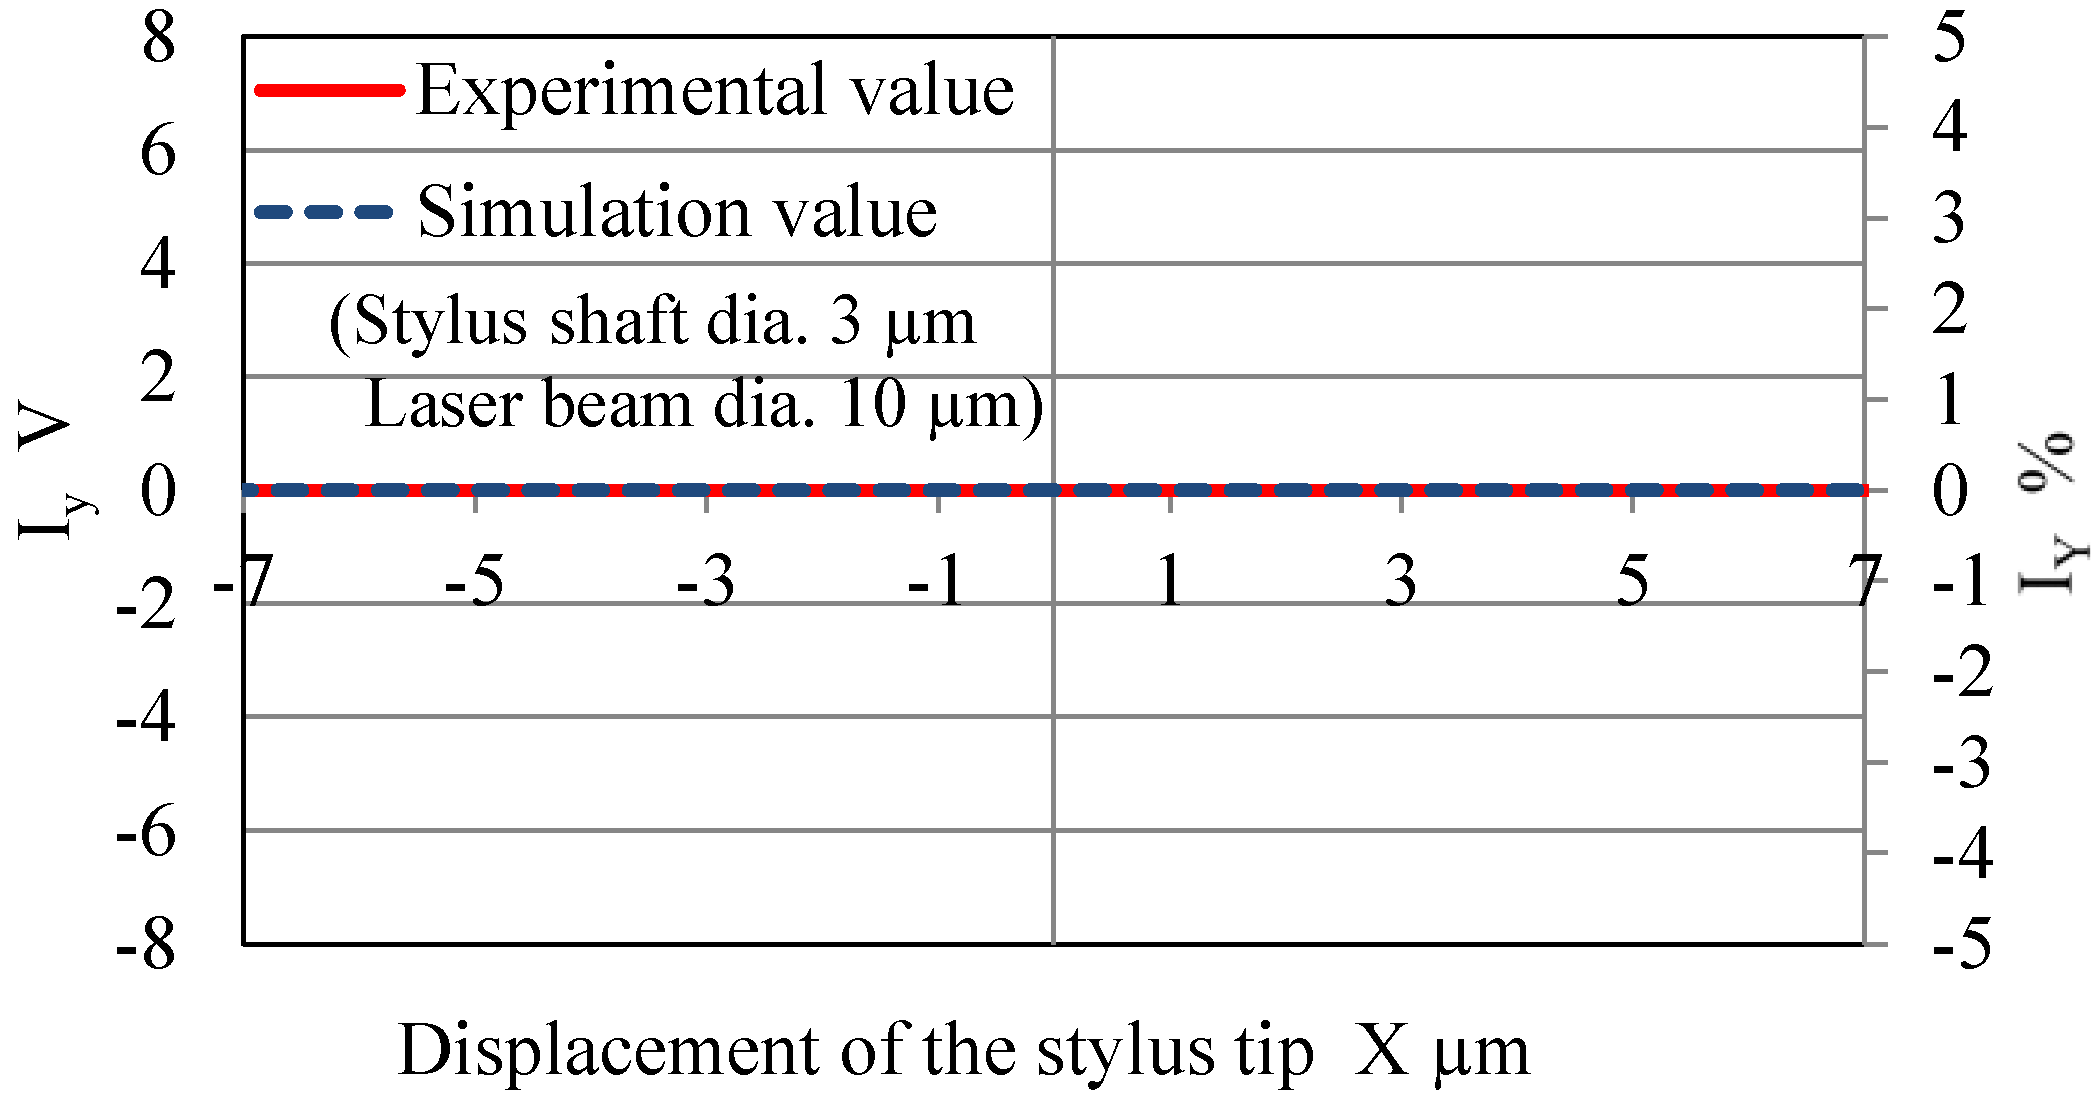
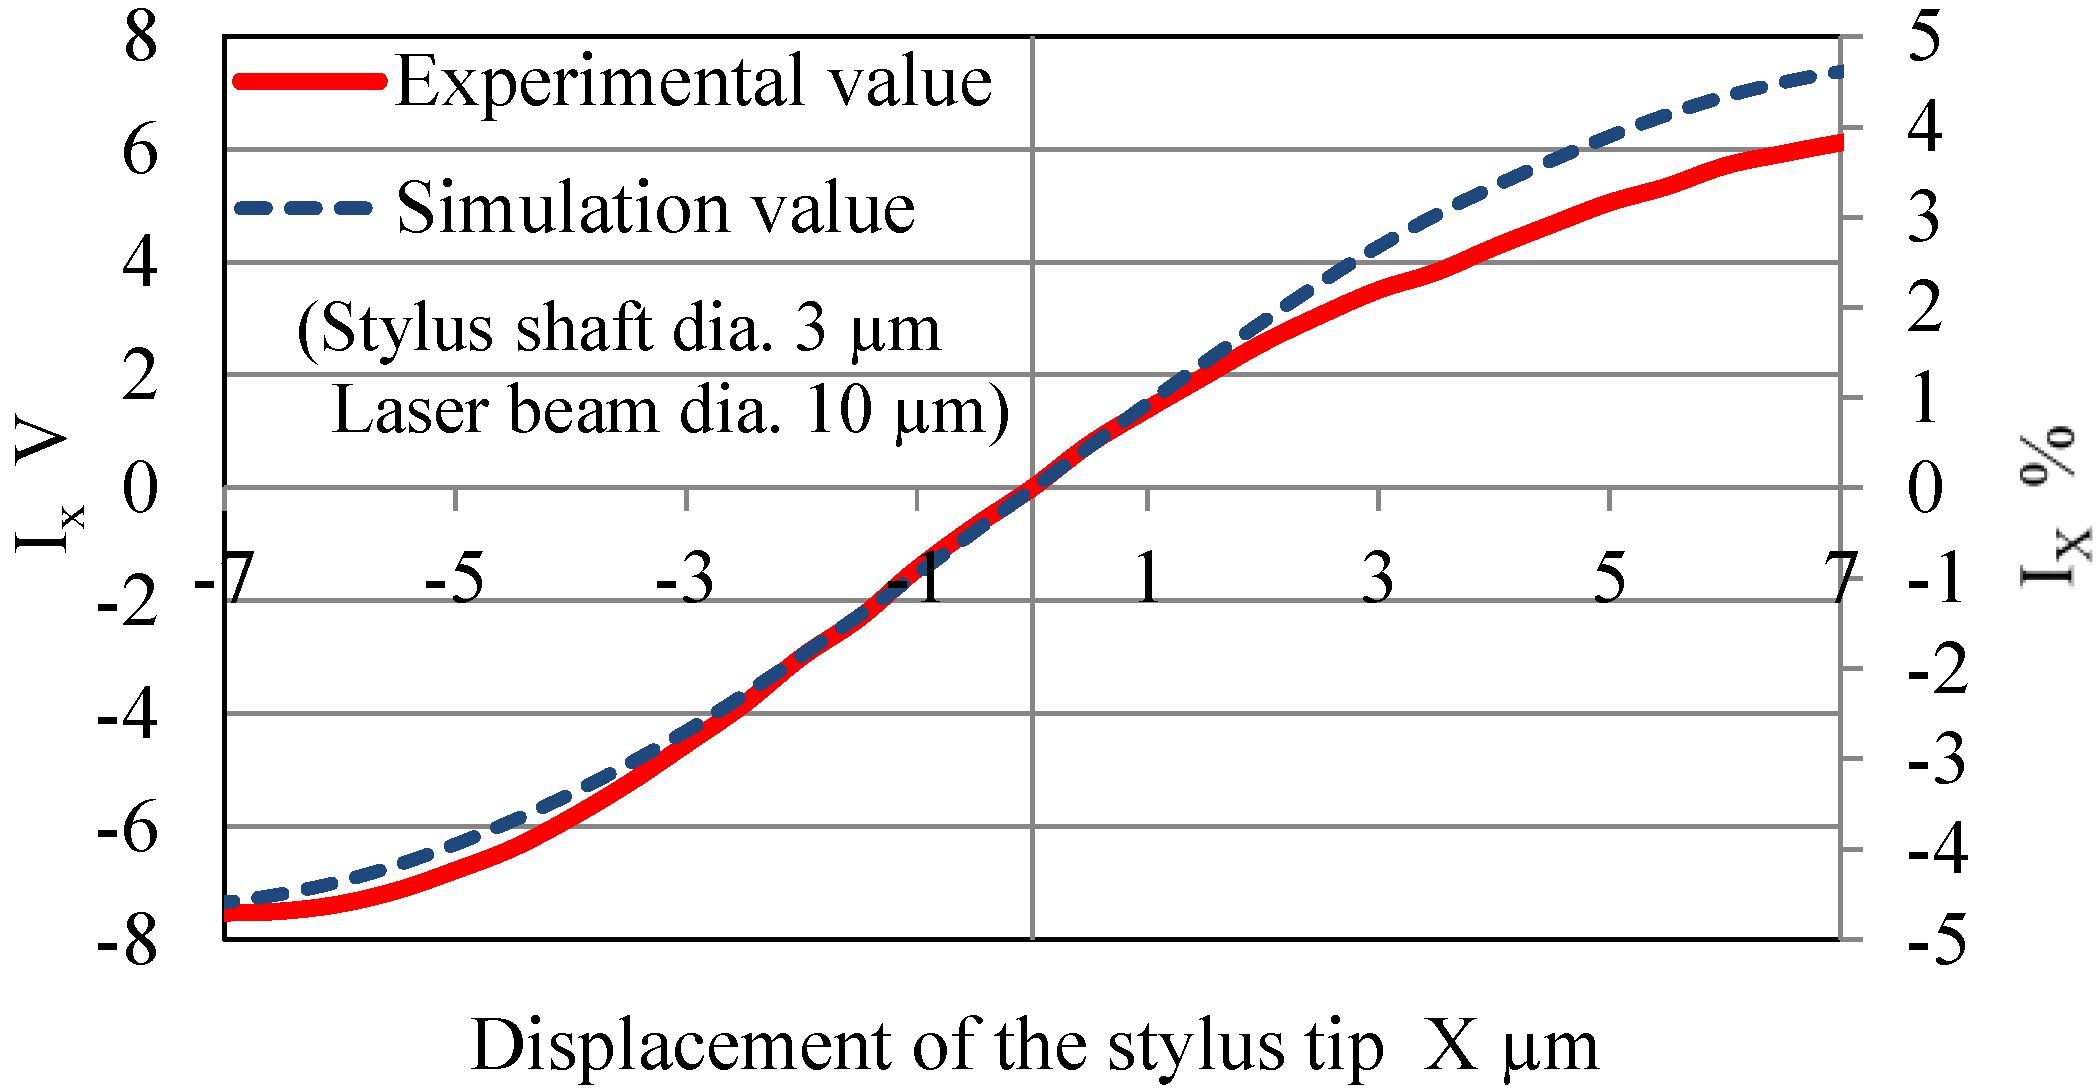
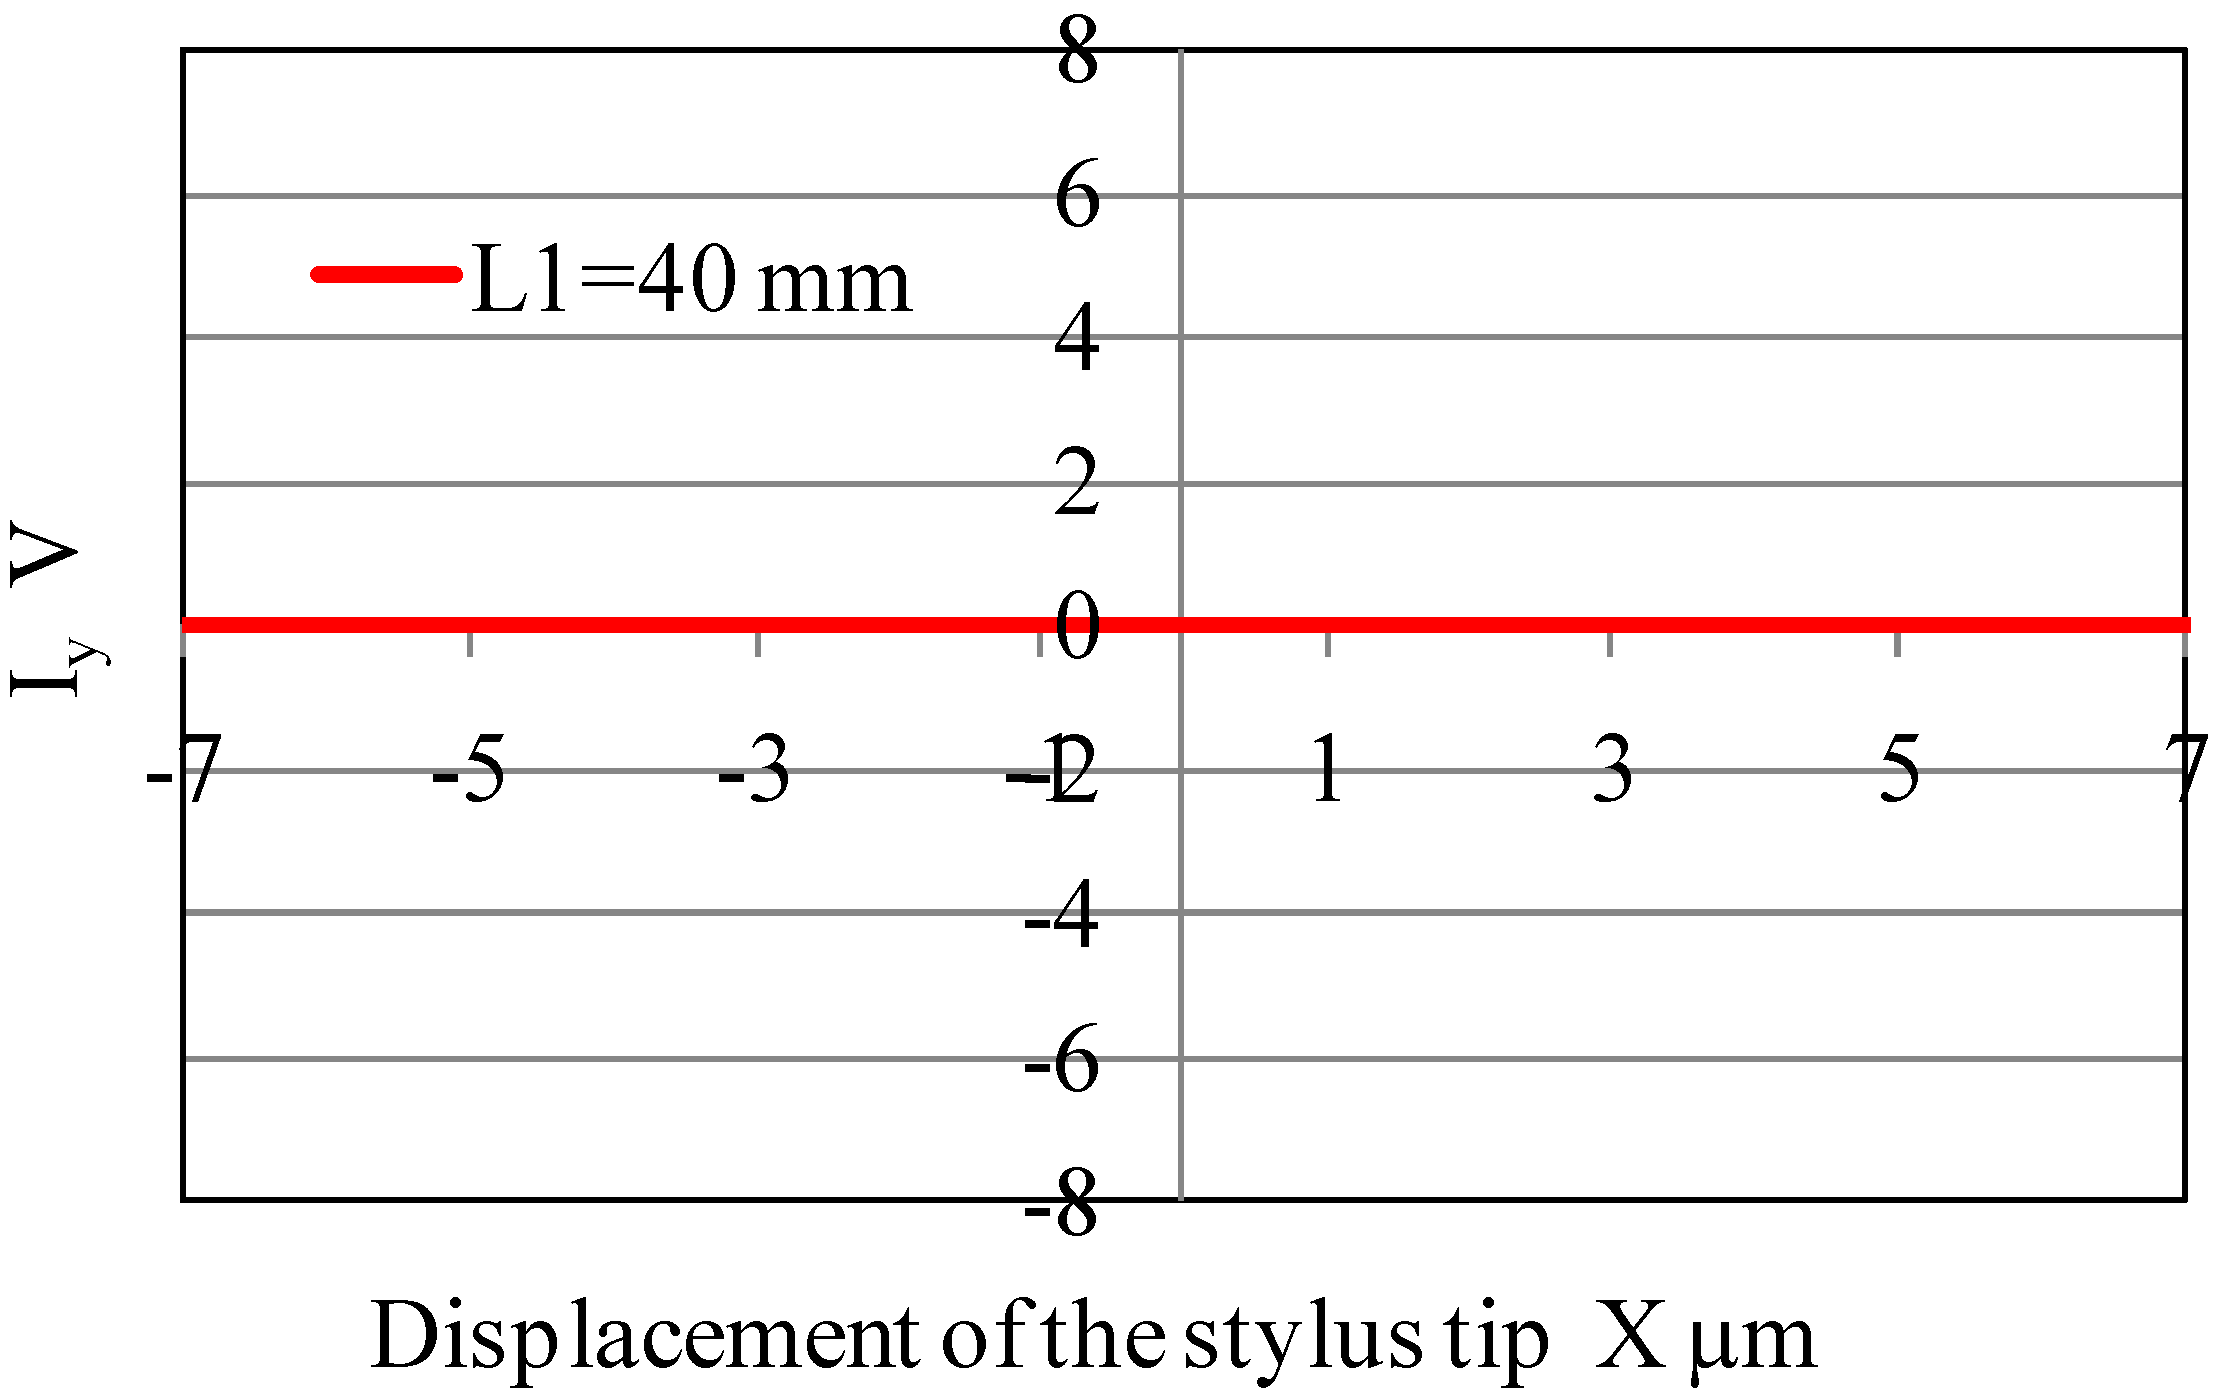
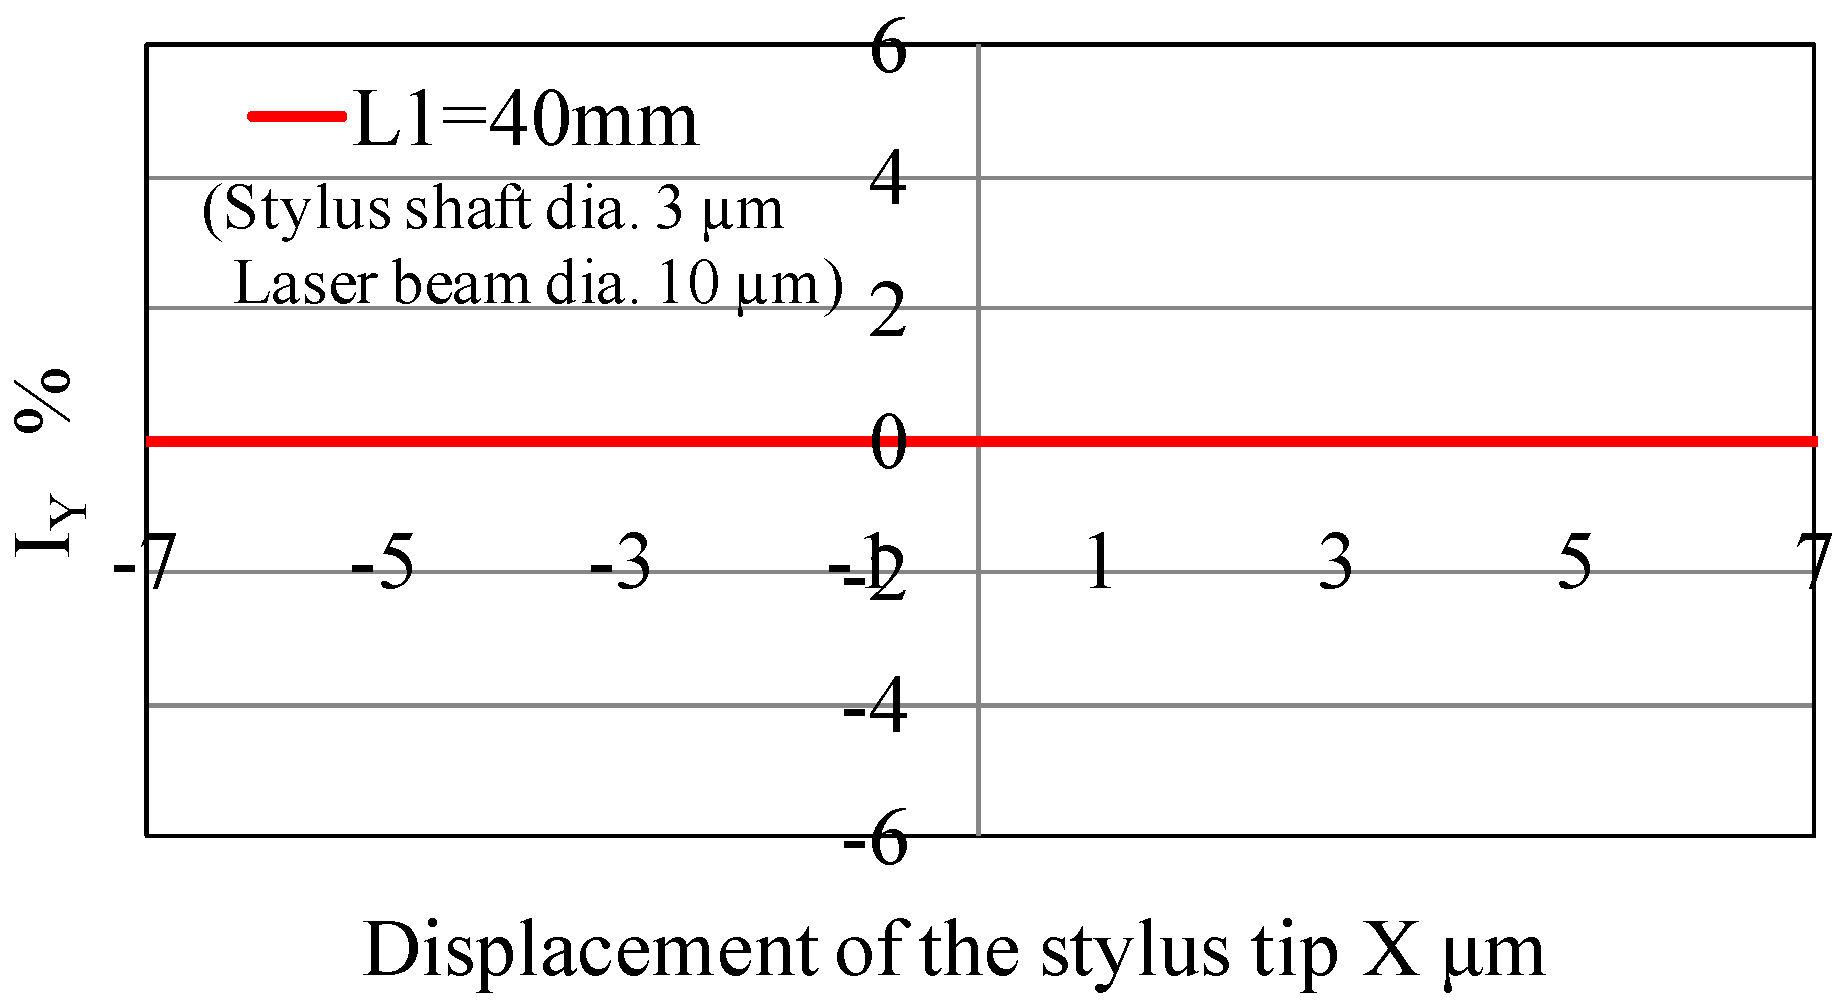
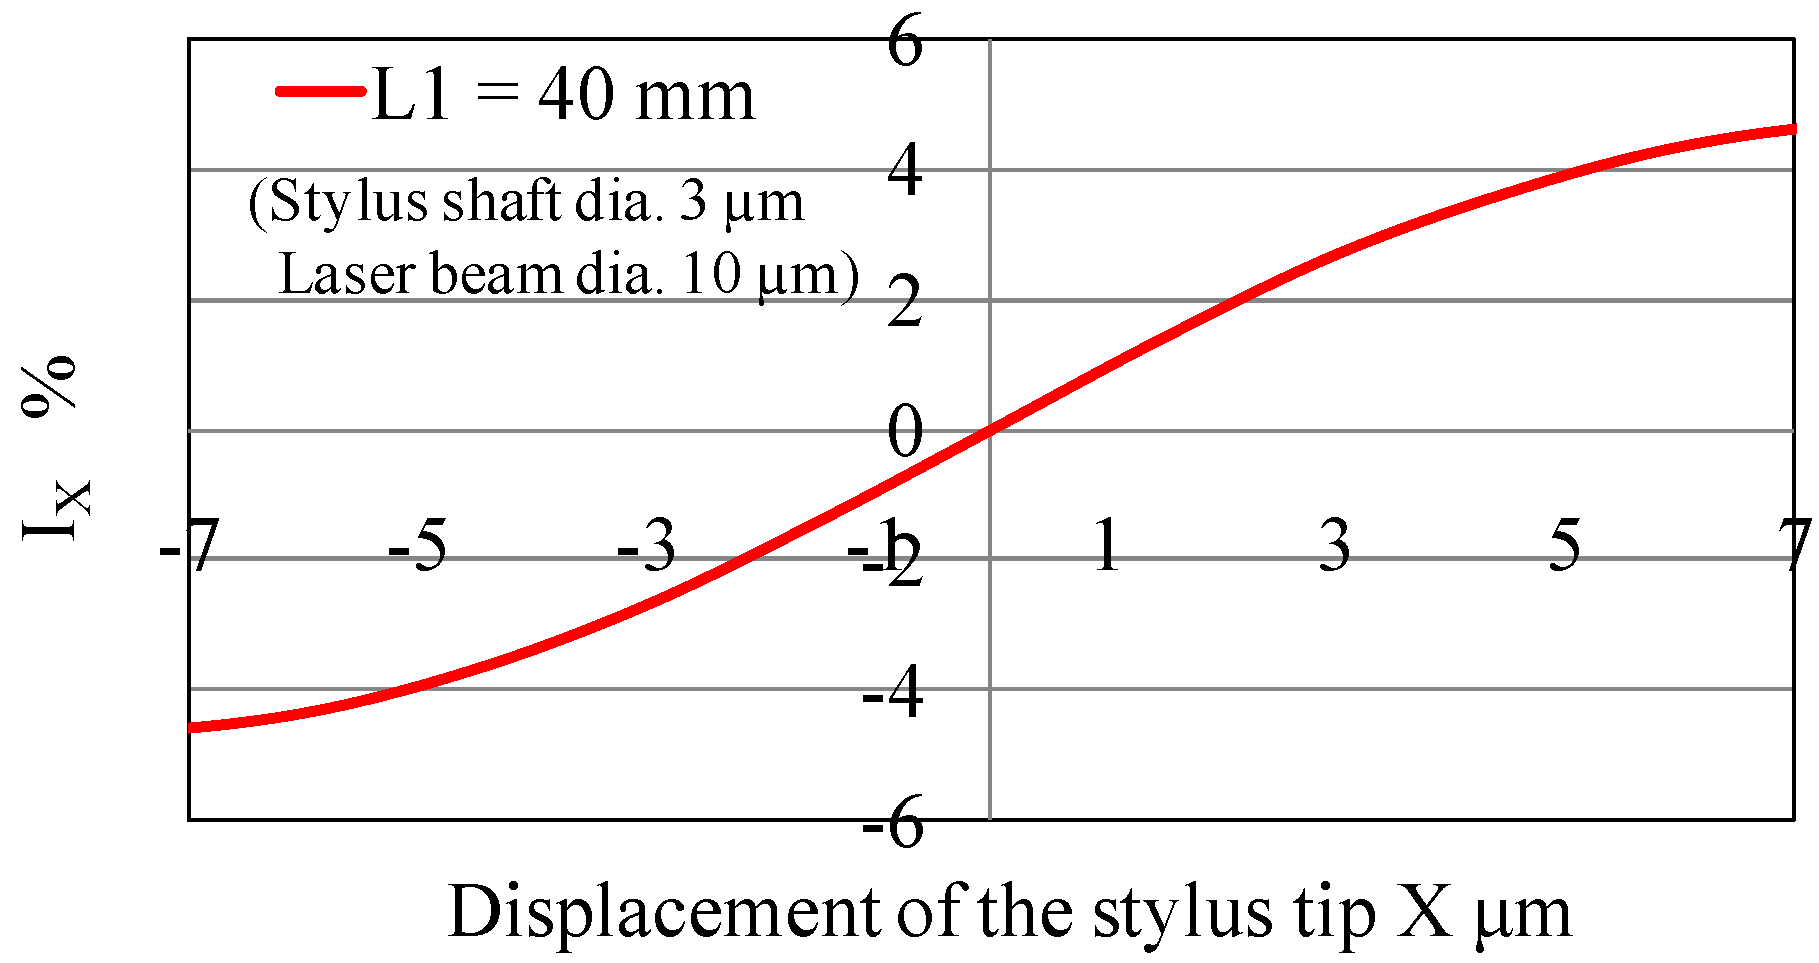
5. Optical Analysis Taking Laser Beam Size into Consideration

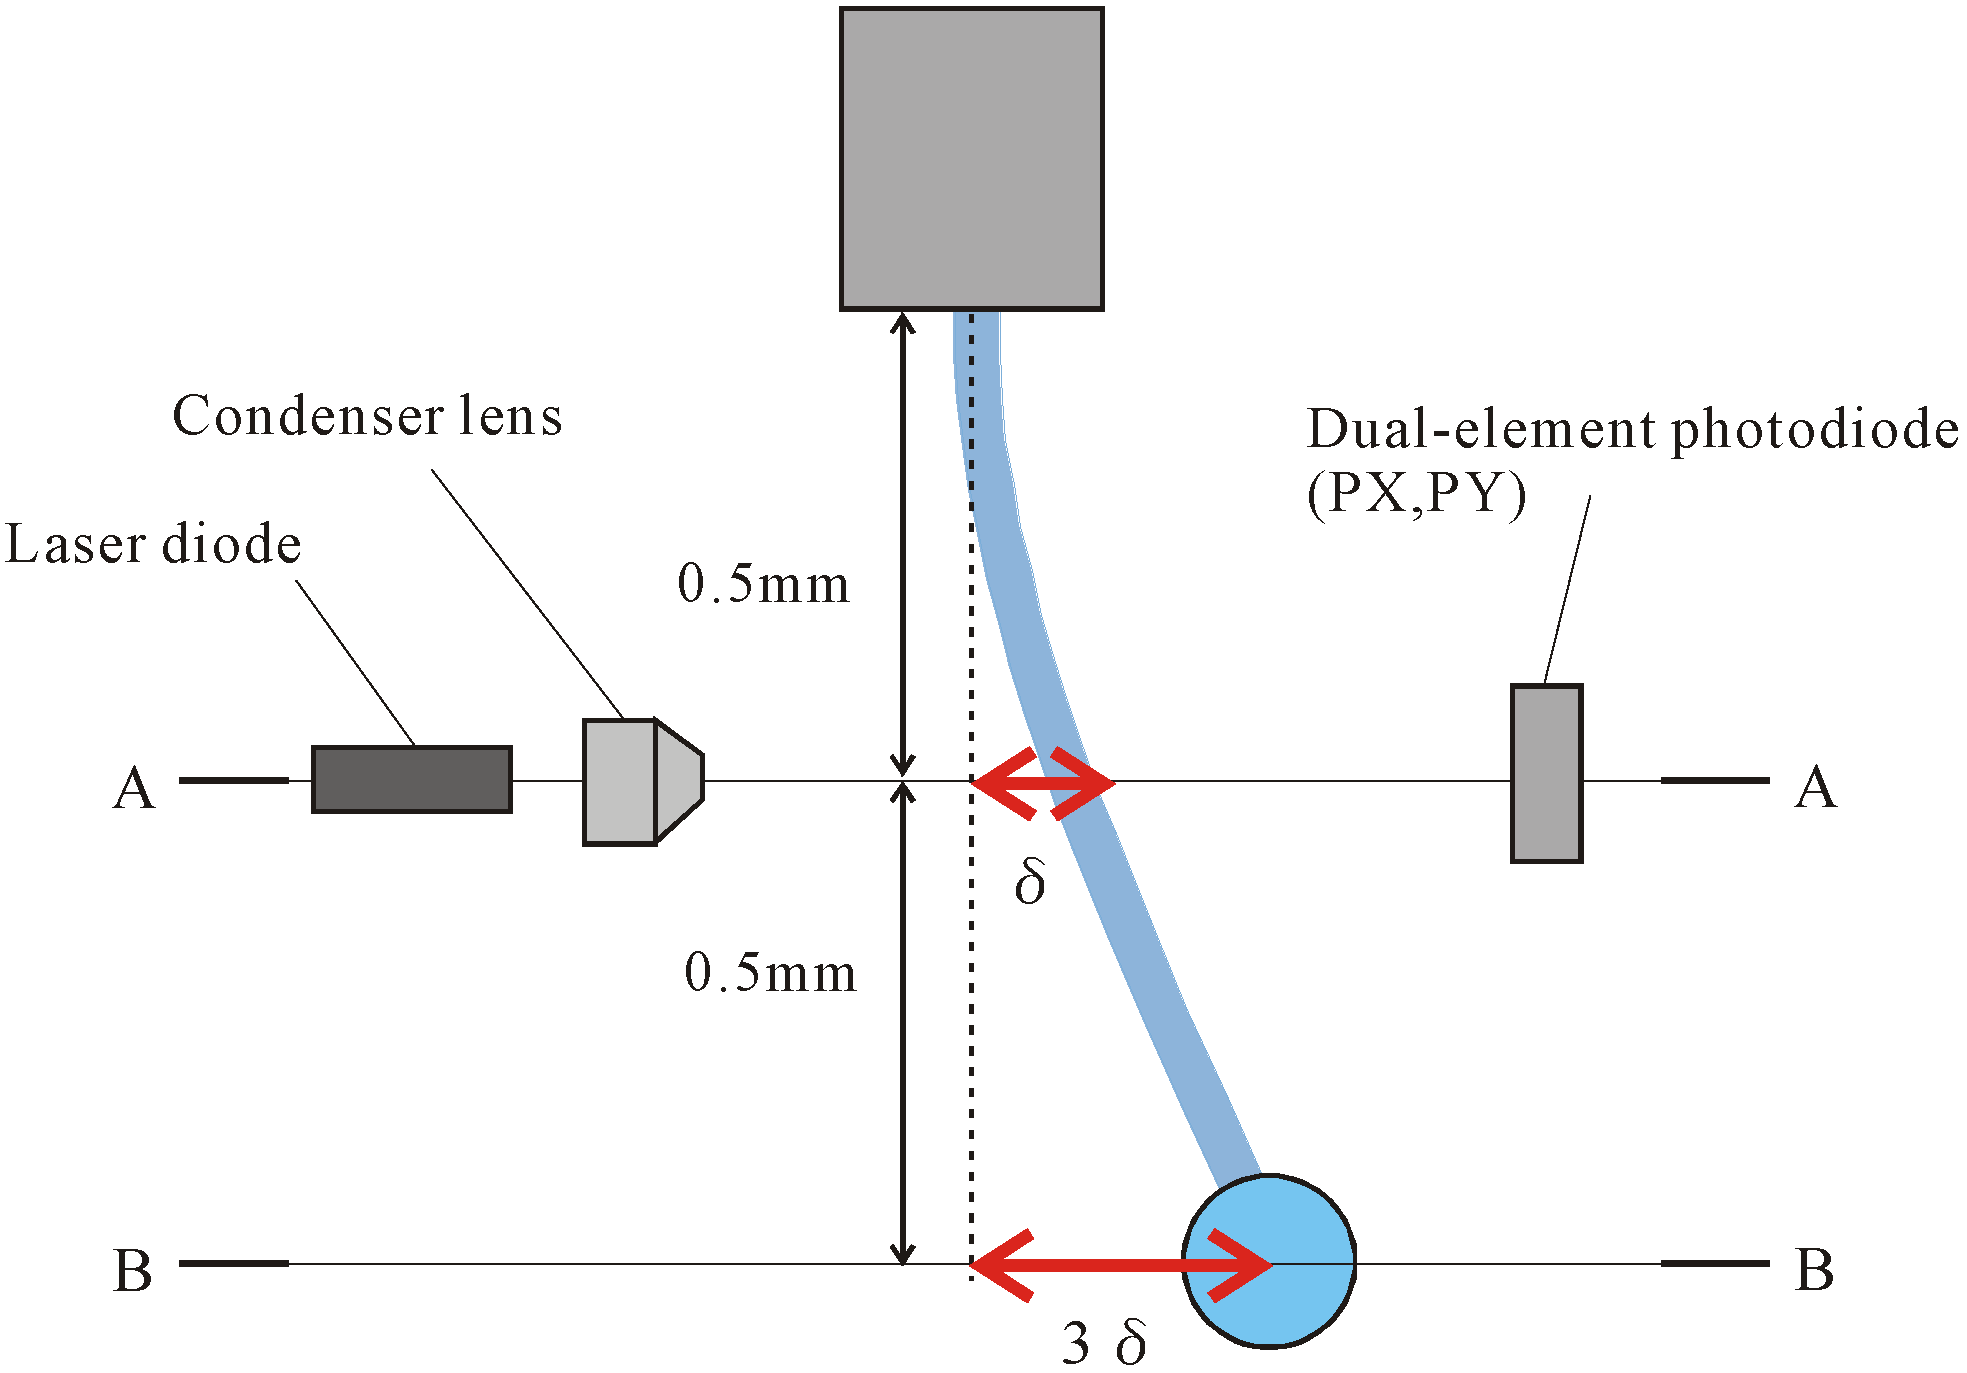
5.1. Analysis Method

In this simulation, the laser beam diameter at the laser-irradiated part of the stylus shaft is considered. The laser beam diameter is aproximately 10 µm. Table 3 lists the simulation conditions. The numerical aperture of the condenser lens is 0.13. The stylus shaft is positioned at the same position described in Section 3.3. Figure 11 shows a graphical display of the ray-tracing result when the stylus shaft is displaced to Y = −1 µm. The analysis procedure is the same as that described in Section 3.1.

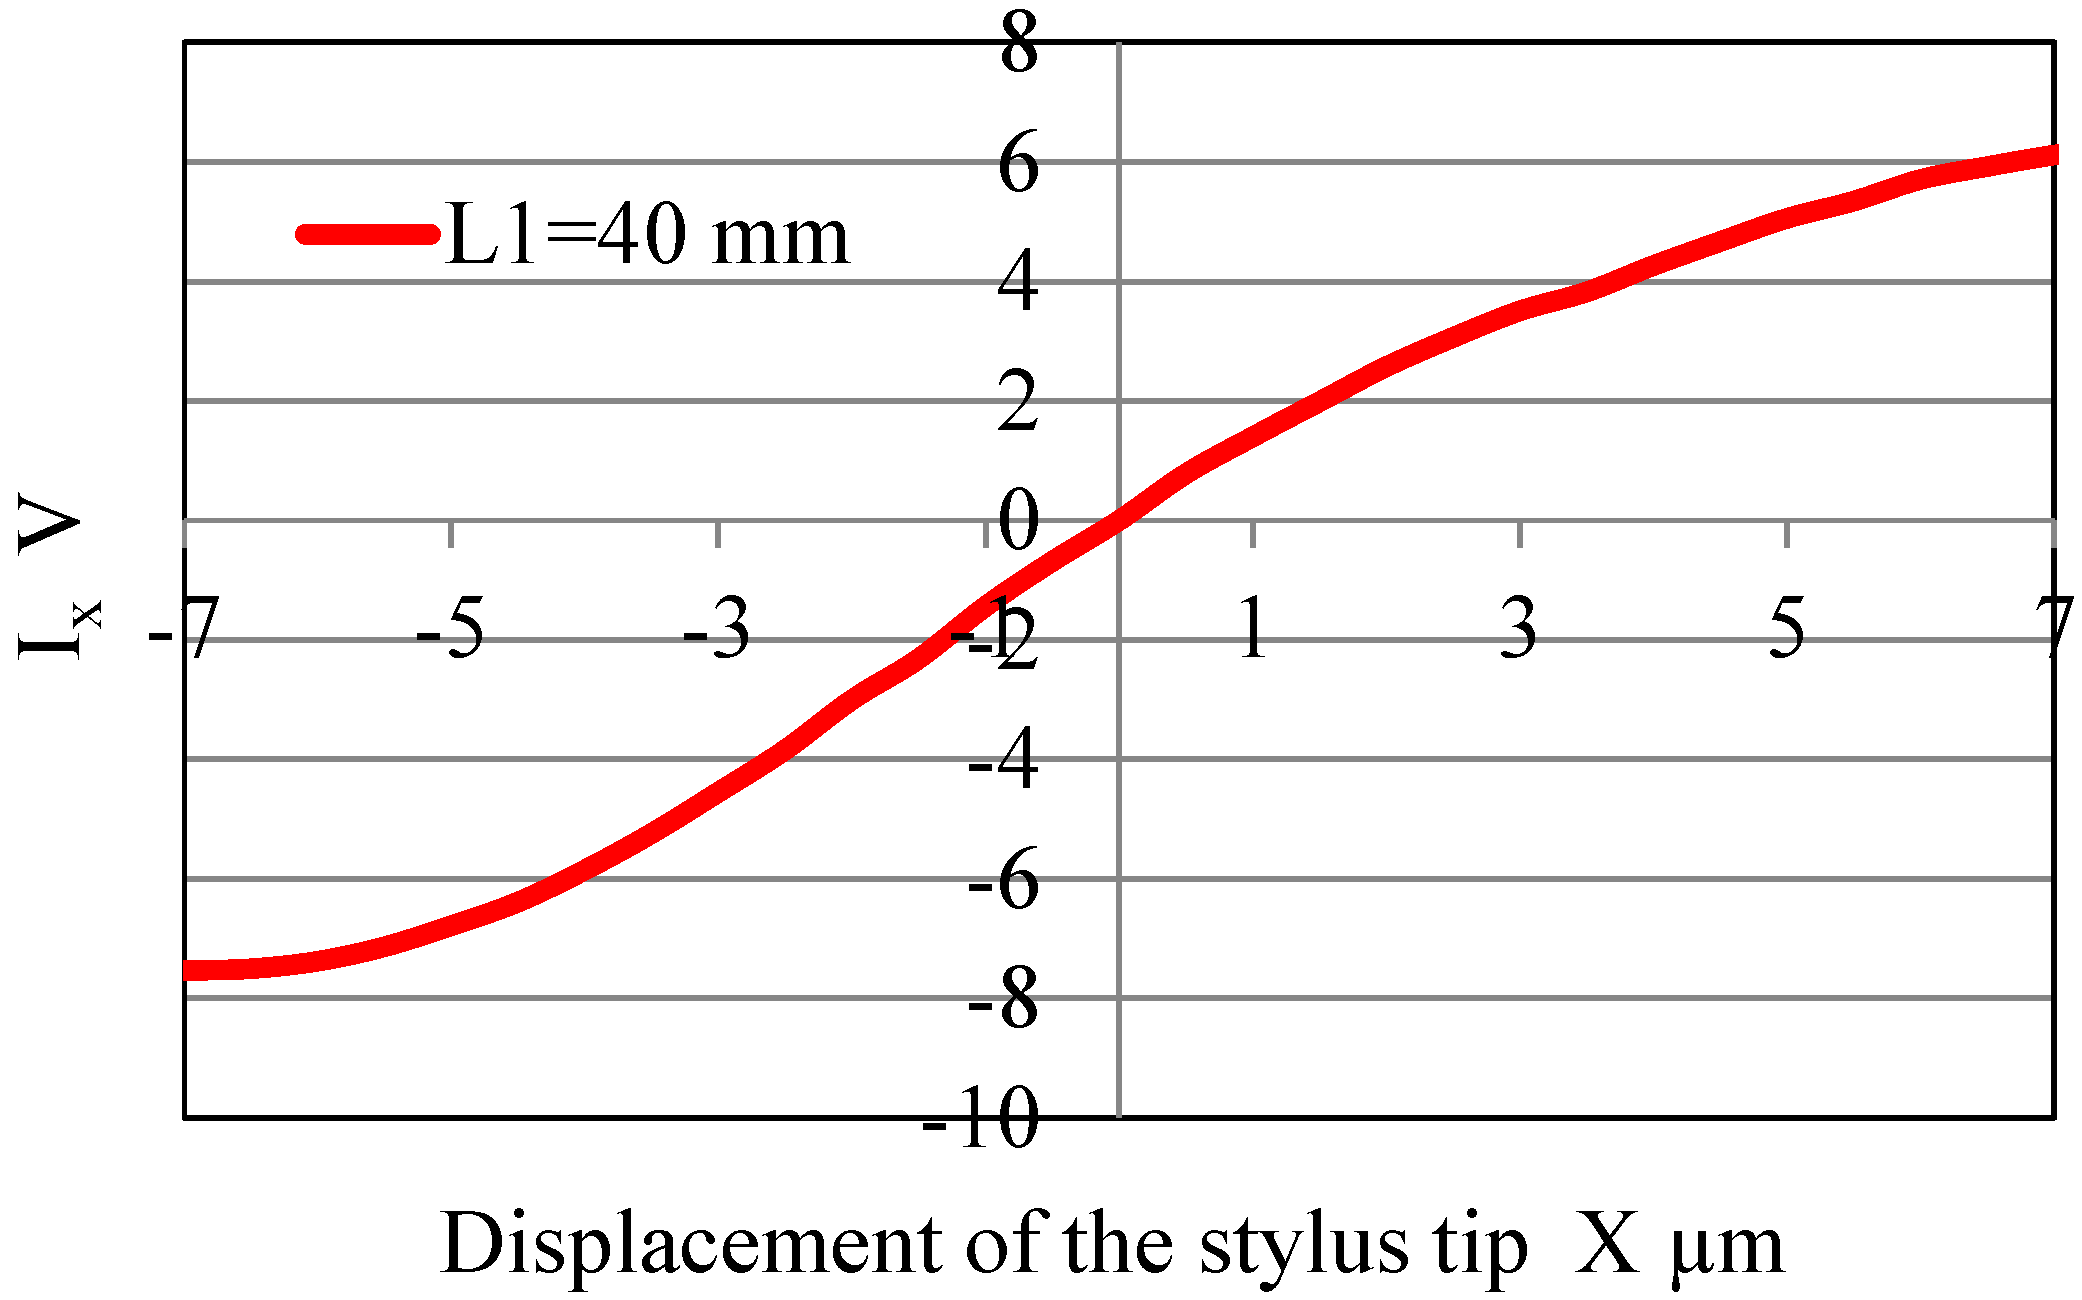
5.2. Simulation Results

Figure 12 and Figure 13 show the ray-tracing simulation results for displacement of the stylus shaft of ±7 µm in the X direction. Figure 12 shows the simulation result for IY for a distance of L1 = 40 mm. Figure 13 shows the simulation result for IX for a distance of L1 = 40 mm under the same conditions.
In addition, Figure 14 and Figure 15 show overlapping displays of ray-tracing simulation and experimental results for displacement of the stylus tip of ±7 µm in the X direction. It is very difficult to directly compare the value of simulation result and experimental result because there are many parameters such as the laser beam intensity, the sensitivity characteristic of dual-element photodiode and the gain amplifier. Therefore, the magnification of the vertical axis is determined so that the inclination of the simulation result at the origin agree with that of the experimental result as shown in Figure 15.
When the displacement ranges of the stylus tip are ±1.5 µm and ±3.0 µm, the linearity errors of the simulation values are ±0.13 %F.S. and ±0.89 %F.S., respectively. When the displacement ranges of the stylus tip are ±1.5 µm and ±3.0 µm, the linearity errors of the experimental values are ±1.06 %F.S. and ±4.79 %F.S., respectively. It seems that there is no problem if the probe operates in touch-trigger mode, but correction of the linearity error is required if using in scanning mode.
The simulation values for ray-tracing agree in terms of the inclination at the origin relative to the experimental values when laser beam size is taken into consideration. Therefore, the utility of the proposed simulation method is confirmed.
The measurement sensitivity depends on the diameter of the stylus shaft [28]. Therefore, it is necessary to calibrate the measurement sensitivity when the stylus is replaced. Additionally, there is a possibility that the cylindricity and roundness of the stylus shaft and tip influence the measurement sensitivity. The investigation of the influence of the cylindricity and roundness of the stylus shaft on measurement sensitivity is left as a future task.

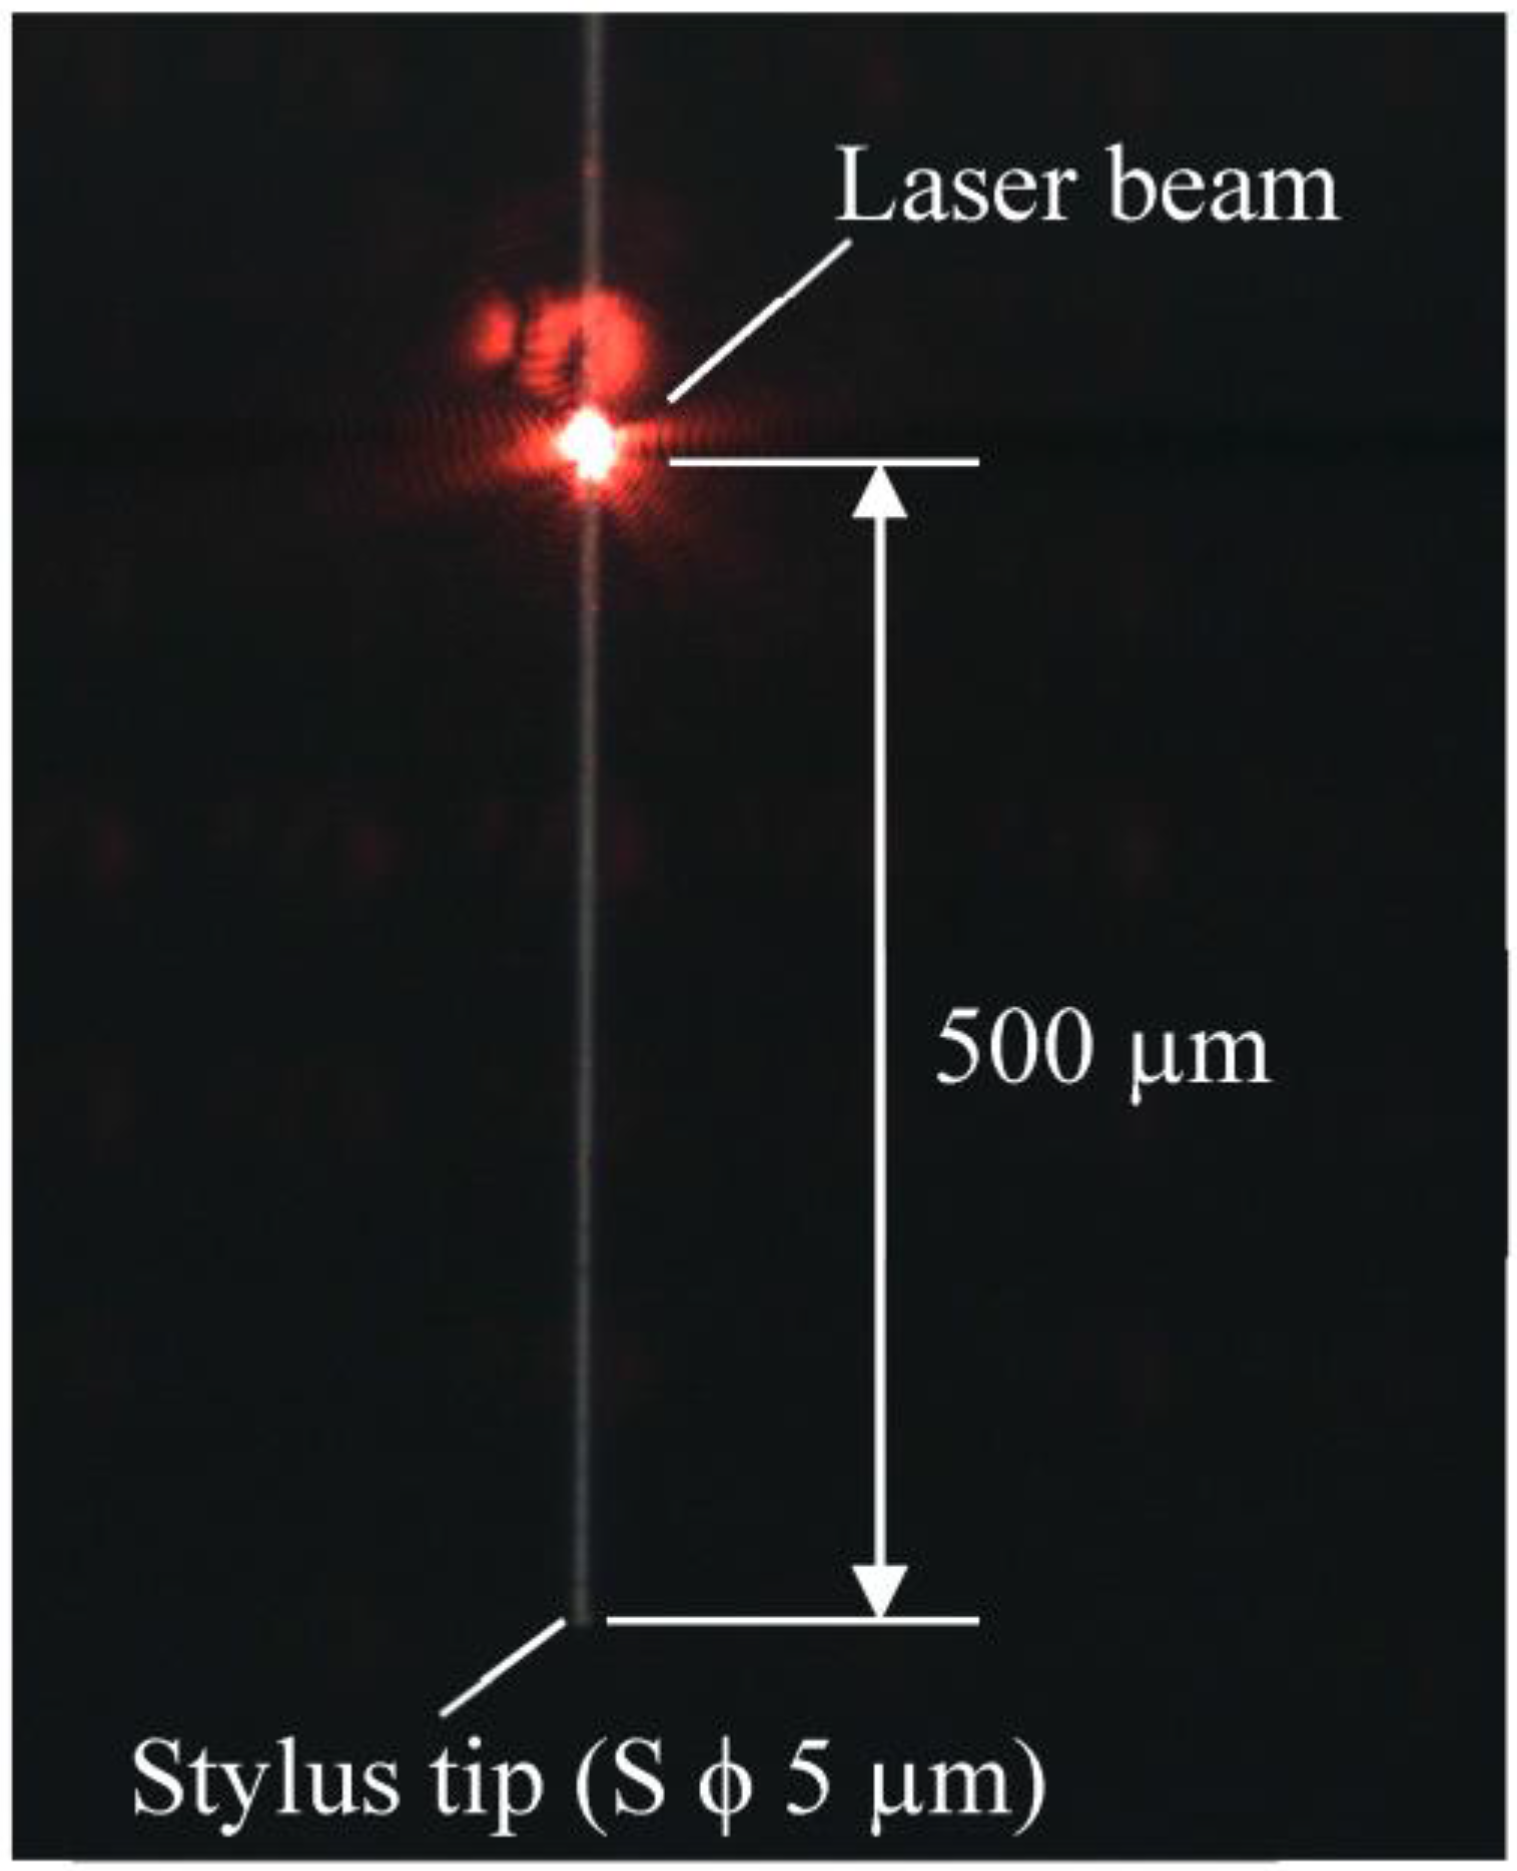
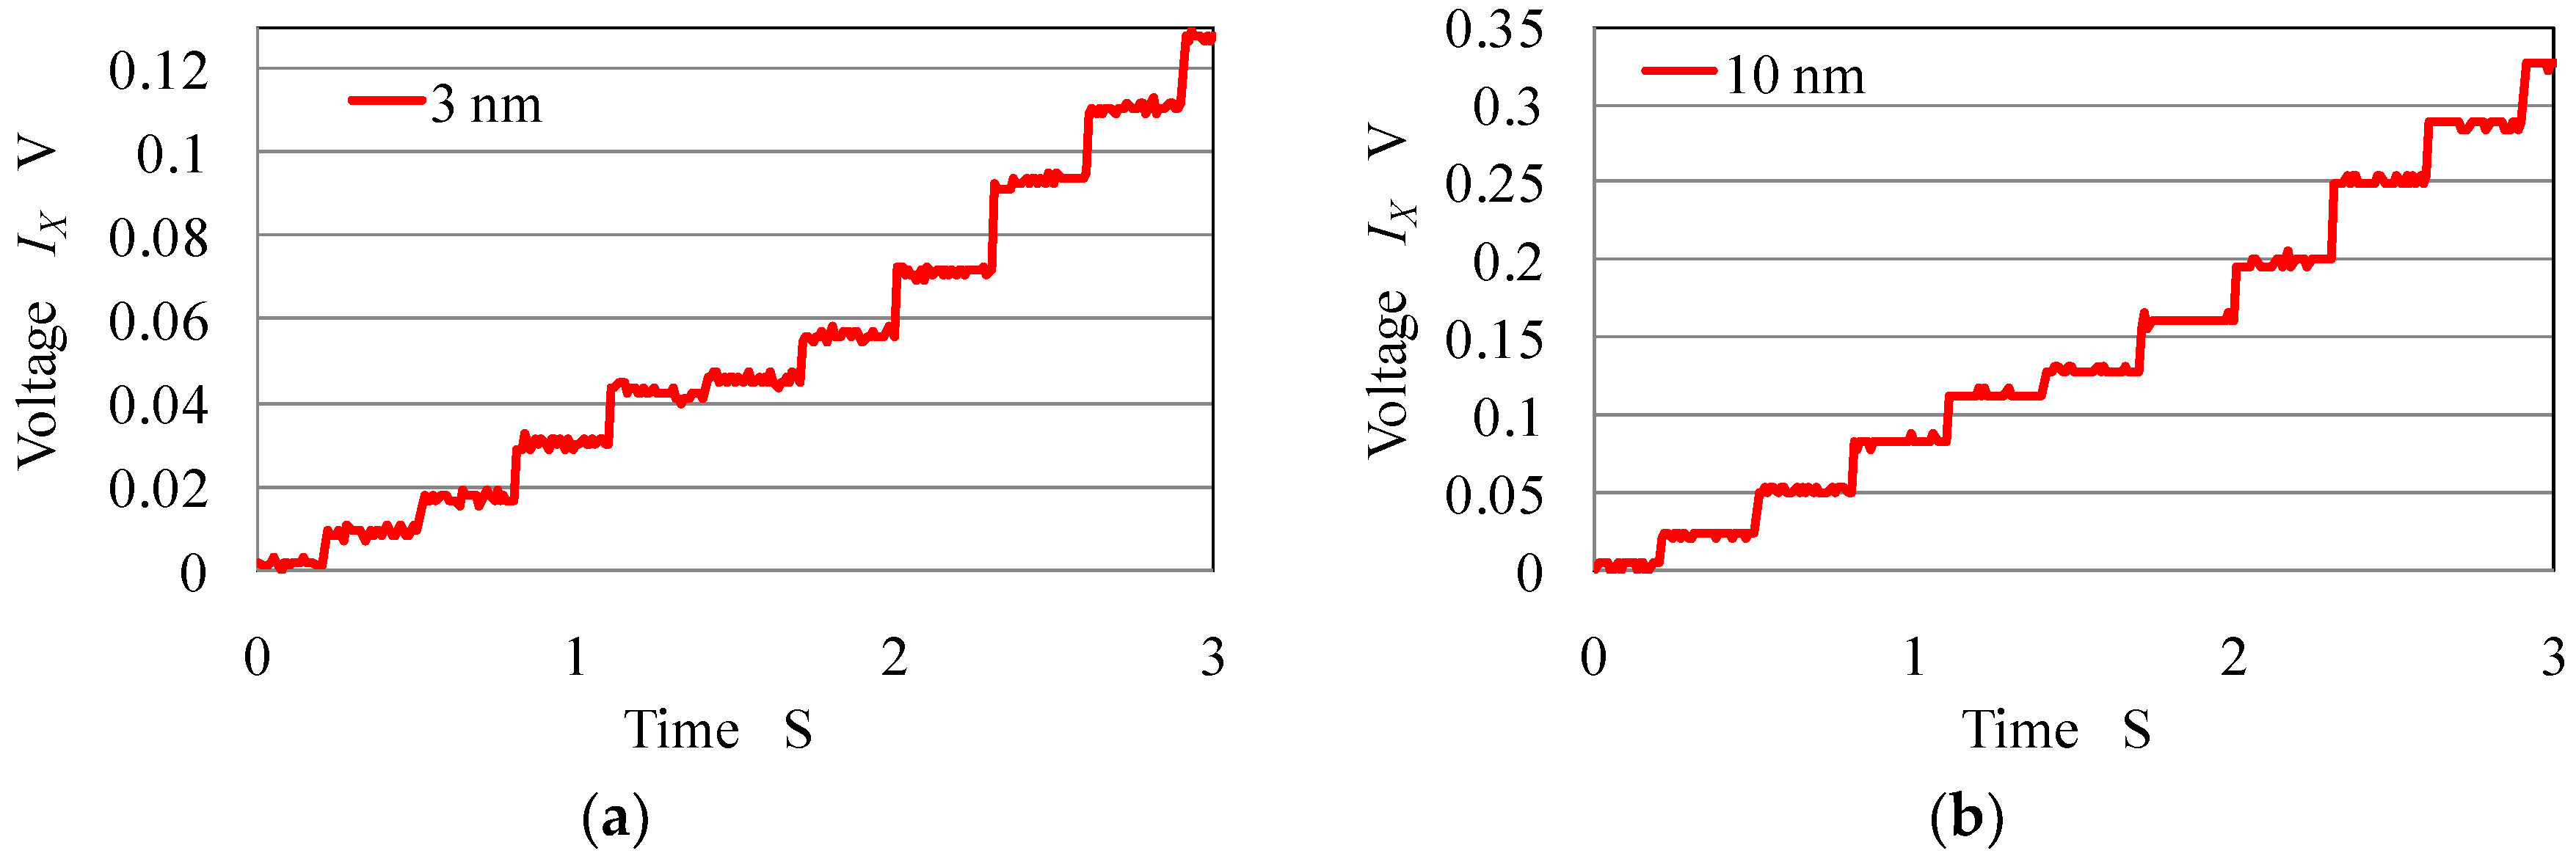
6. Evaluation of Measurement Resolution

An experiment was conducted to evaluate the measurement resolution of the fiber probe. The changes in an output signal IX in the X direction were examined when the stylus tip was displaced by 3 and 10 nm steps in the X direction. The resolution of the stage in the X direction was 1 nm. Figure 16 shows the experimental apparatus used to evaluate the measurement resolution. Figure 17a,b show the output voltage IX induced by displacements of 3 nm and 10 nm in the step feeding of the stage in the +X direction. The horizontal axis shows the measurement time and the vertical axis shows the changes in the output signal IX in the X direction. It is possible to distinguish the 3 nm step, which shows that the measurement resolution of this system is approximately 3 nm. To improve the measurement resolution, it is necessary to reduce noise, develop a signal processing method, and use a high-power and stabilized laser diode. As for repeatability and more details on stylus performance, please refer to [28].

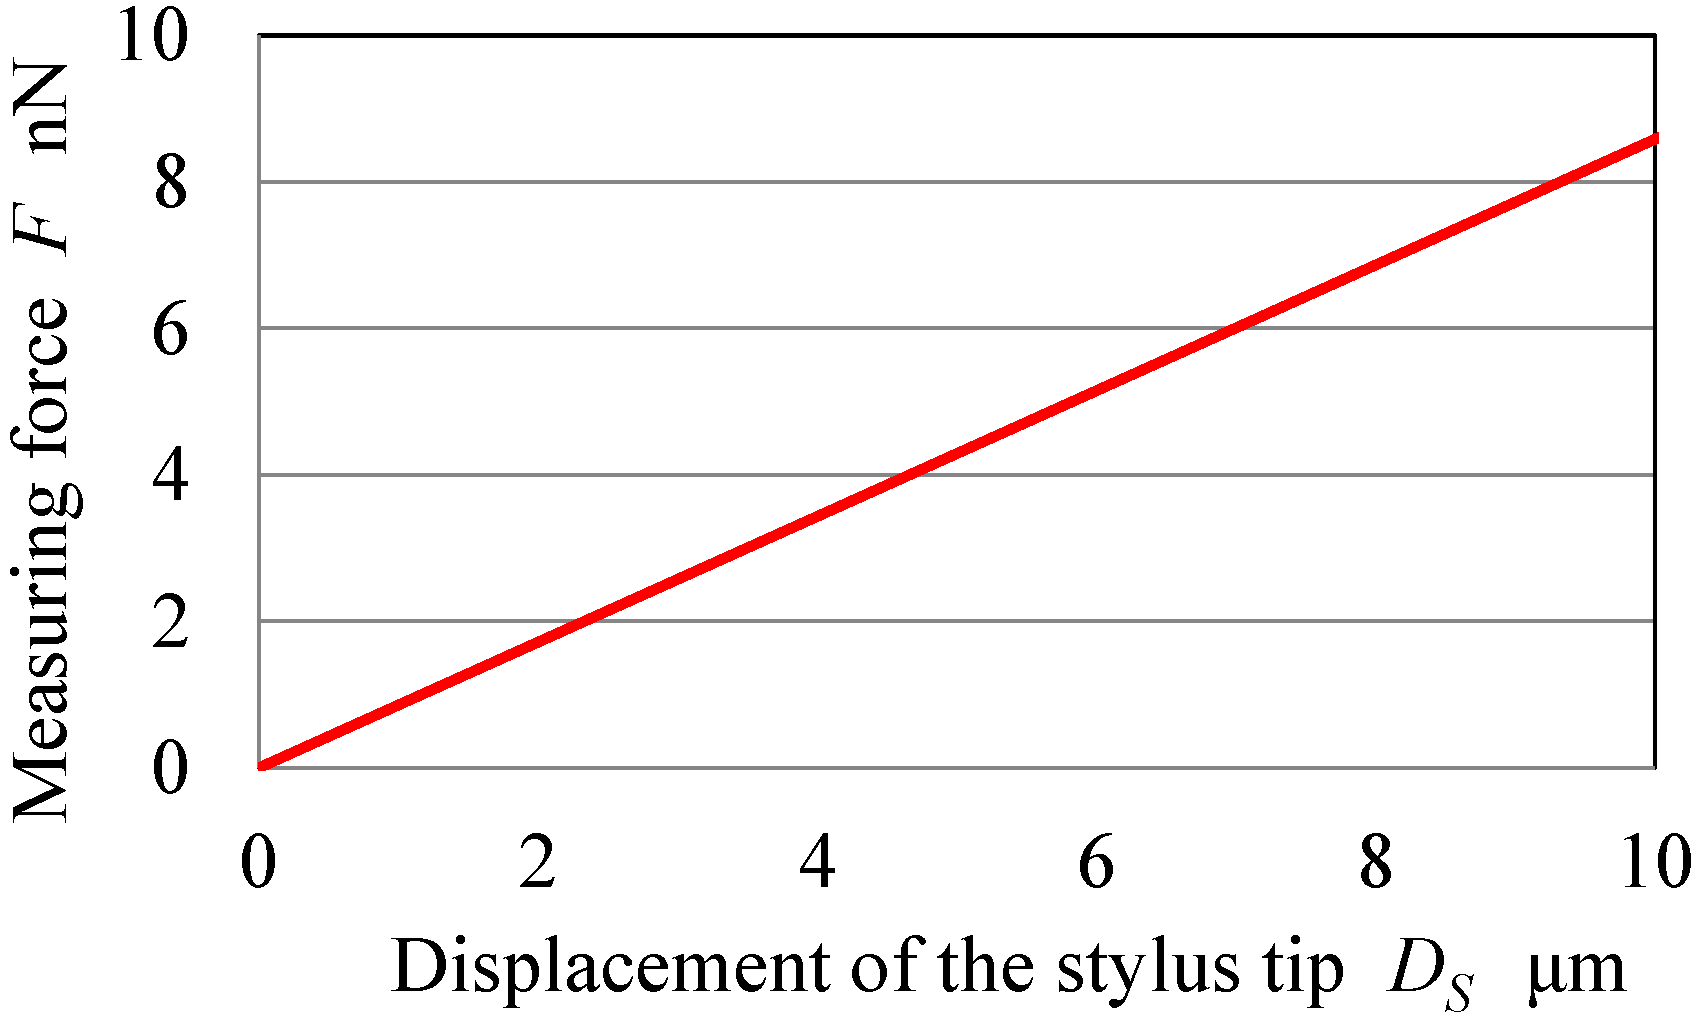
7. Force Measurement

The load acting on the stylus tip, i.e., the measured force, is calculated by assuming that the optical fiber probe, which is 3 µm in diameter and 1 mm in length, is equivalent to a cantilever with fixed support. In other words, the measured force F is calculated by the deflection of the stylus shaft using Equation (6):
F = 3 E I L 3   · D S
where E, I, L, and DS are the Young’s modulus, geometrical moment of inertia, length of the stylus shaft, and displacement of the stylus tip. Figure 18 shows the measured force acting on the stylus tip under the assumption that the stylus shaft (Young’s modulus E = 72 GPa) is equivalent to a cantilever with fixed support. In this figure, the horizontal axis represents the displacement of the stylus tip, and the vertical axis represents the measured force acting on the stylus tip.

8. Micro-Hole Measurement

The performance of the measurement system is examined by measuring a micro-hole with a diameter of 100 µm. The maximum hole depth (along the Z direction) for the measurement was approximately 475 µm. The hole was measured at every 15° in the circumferential direction and every 25 µm along the depth or Z direction. Figure 19 shows the measured hole profile. The maximum hole diameter within the range of our measurement was 104.18 µm.
As noted in Section 3.2, the length of the stylus shaft was 1 mm and the distance between the stylus tip and the laser-irradiated part of the stylus shaft was 0.5 mm. Additionally, the diameter of the stylus tip was 5 µm. Therefore, it appears that the proposed probing system could measure a micro-hole with a diameter larger than 5 µm and a depth smaller than 500 µm.

9. Conclusions

In this study, a system that uses an optical fiber stylus to measure micro-hole accuracy was developed. The design parameters of this system were determined using a ray-tracing method. A trial measurement system was then fabricated and evaluated experimentally. The following results were obtained:
(1)
The design parameters of the optical system were determined using a ray-tracing method.
(2)
Optical analysis reveals that the ray-tracing simulation values agree in terms of the inclination at the origin relative to the experimental values when the laser beam size is taken into consideration. Therefore, the utility of the proposed simulation method was confirmed.
(3)
The resolution of the measurement system using this shaft was found to be approximately 3 nm.
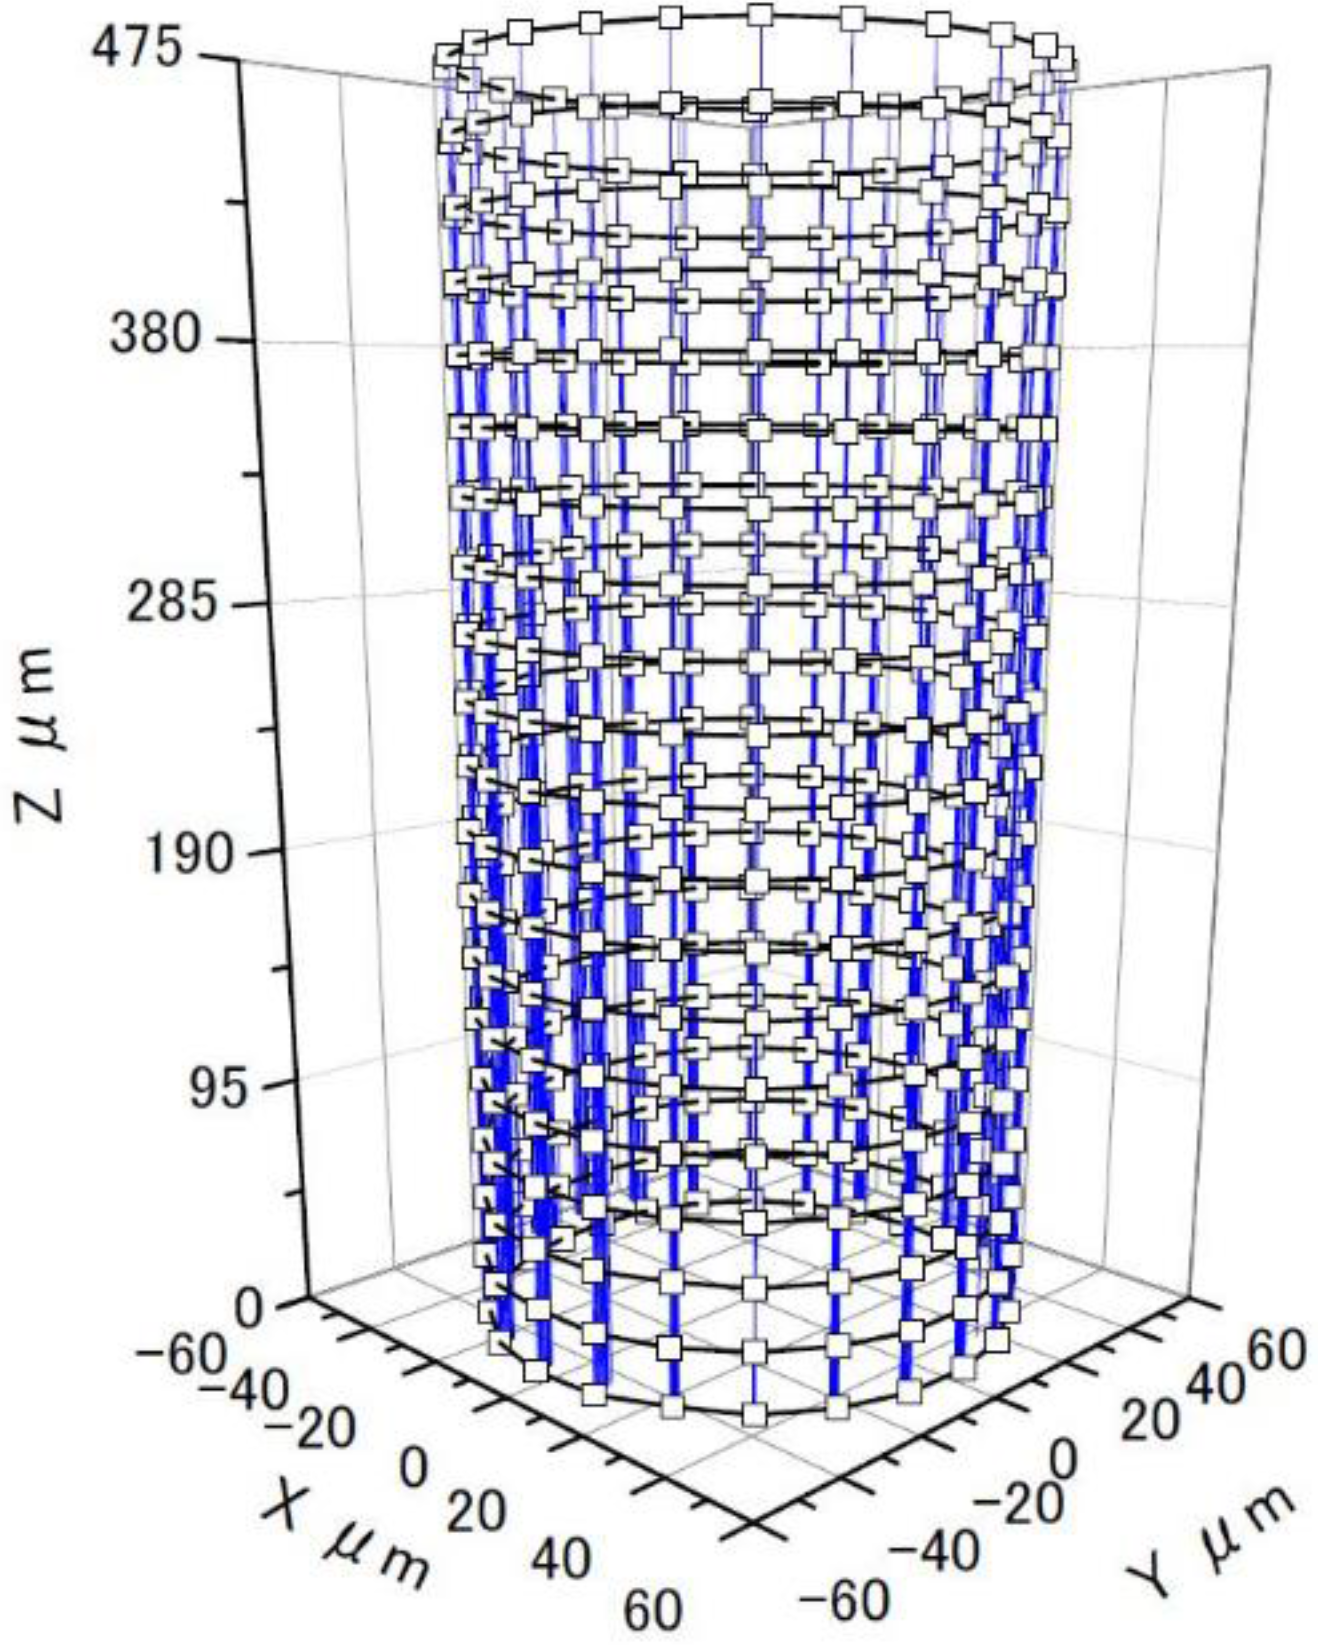
(4)
The practicality of this system was confirmed by measuring the shape of a micro-hole 100 µm in diameter and 475 µm in depth.

Acknowledgments

This study was partly supported by a research grant from the Mitutoyo Association for Science and Technology and by JSPS KAKENHI Grant Number 26420392.

Author Contributions

Hiroshi Murakami conceived and wrote the paper; Hiroshi Murakami, Akio Katsuki and Takao Sajima manufactured the measurement system and analyzed the data.

Conflicts of Interest

The authors declare no conflict of interest.

References

  1. Maruyama, M.; Osaka, H.; Ono, M.; Kasei, S. Development of optical apparatus for measuring small hole diameter. J. Jpn. Soc. Precis. Eng. 1996, 62, 145–149. (In Japanese) [Google Scholar] [CrossRef]
  2. Akiyama, N.; Kitano, A.; Yoshida, M.; Fujimoto, E.; Kohira, H.; Fukushima, T. Development of an optical measurement equipment for diameter of small and deep hole. J. Jpn. Soc. Precis. Eng. 1996, 62, 584–588. (In Japanese) [Google Scholar] [CrossRef]
  3. Onikura, H.; Kuwabara, Y.; Nakamura, T.; Sajima, T.; Imazeki, Y.; Katsuki, A.; Yamada, S. Development of an optical hole-diameter measurement instrument—Optical analysis, fundamental experiment, trial manufacture and performance test. J. Jpn. Soc. Precis. Eng. 1995, 61, 248–252. (In Japanese) [Google Scholar] [CrossRef]
  4. Masuzawa, T.; Hamasaki, Y.; Fujino, M. Vibroscanning method for nondestructive measurement of small holes. CIRP Ann. 1993, 42, 589–592. [Google Scholar] [CrossRef]
  5. Masuzawa, T.; Kim, B.J.; Bergaud, C.; Fujino, M. Twin-probe vibroscanning method for dimensional measurement of microholes. CIRP Ann. 1997, 46, 437–440. [Google Scholar] [CrossRef]
  6. Claverley, J.D.; Leach, R.K. Development of a three-dimensional vibrating tactile probe for miniature CMMs. Precis. Eng. 2013, 37, 491–499. [Google Scholar] [CrossRef]
  7. Hidaka, K. Study of a small-sized ultrasonic probe. CIRP Ann. 2006, 55, 567–570. [Google Scholar] [CrossRef]
  8. Hidaka, K.; Saito, A.; Koga, S. Study of a micro-roughness probe with ultrasonic sensor. CIRP Ann. Manuf. Technol. 2008, 57, 489–492. [Google Scholar] [CrossRef]
  9. Bauza, M.B.; Hocken, R.J.; Smith, S.T.; Woody, S.C. Development of a virtual probe tip with an application to high aspect ratio microscale features. Rev. Sci. Instrum. 2005, 76, 095112. [Google Scholar] [CrossRef]
  10. Claverley, J.; Leach, R. Three-dimensional characterisation of a novel vibrating tactile probe for miniature CMMs. In Presented at the Laser Metrology and Machine Performance X (LAMBDAMAP 2013), Chichley, UK, 20–21 March 2013.
  11. Ito, S.; Kikuchi, H.; Chen, Y.; Shimizu, Y.; Gao, W.; Takahashi, K.; Kanayama, T.; Arakawa, K.; Hayashi, A. A micro-coordinate measurement machine (CMM) for large-scale dimensional measurement of micro-slits. Appl. Sci. 2016, 6. [Google Scholar] [CrossRef]
  12. Shiraishi, T.; Mitsui, K. Development of three dimensional profile measuring apparatus for microparts—Measuring principle and measuring results. J. Jpn. Soc. Precis. Eng. 1998, 64, 1395–1399. (In Japanese) [Google Scholar] [CrossRef]
  13. Shiramatsu, T.; Kitano, K.; Kawata, M.; Mitsui, K. Development of a measuring method for shape and dimension of micro-components—Modification to the original measuring system, calibration of the probes and the results of dimensional measurements. J. Jpn. Soc. Precis. Eng. Ser. C 2002, 68, 267–274. (In Japanese) [Google Scholar] [CrossRef]
  14. Schwenke, H.; Wäldele, F.; Weiskrich, C.; Kunzmann, H. Opto-tactile sensor for 2D and 3D measurement of small structures on coordinate measuring machines. CIRP Ann. 2001, 50, 361–364. [Google Scholar] [CrossRef]
  15. Muralikrishnan, B.; Stone, J.A.; Stoup, J.R. Fiber deflection probe for small hole metrology. Precis. Eng. 2006, 30, 154–164. [Google Scholar] [CrossRef]
  16. Murakami, H.; Katsuki, A.; Sajima, T.; Suematsu, T. Study of a vibrating fiber probing system for 3-D micro-structures: Performance improvement. Meas. Sci. Technol. 2014, 25, 094010. [Google Scholar] [CrossRef]
  17. Michihata, M.; Takaya, Y.; Hayashi, T. Development of the nano-probe system based on the laser-trapping technique. CIRP Ann. 2008, 57, 493–496. [Google Scholar] [CrossRef]
  18. Li, R.-J.; Fan, K.-C.; Huang, Q.-X.; Zhou, H.; Gong, E.-M.; Xiang, M. A long-stroke 3D contact scanning probe for micro/nano coordinate measuring machine. Precis. Eng. 2016, 43, 220–229. [Google Scholar] [CrossRef]
  19. Boris, G.; Lothar, D.; Martin, H. Design and characterization of a resonant triaxial microprobe. J. Micromech. Microeng. 2015, 25, 125011. [Google Scholar]
  20. Spaan, H.A.M.; Donker, R.L.; Widdershoven, I. Isara 400: Development of an ultra-precision CMM for 3D measurement for large parts. In Proceedings of the ASPE Spring Topical Meeting, Chicago, IL, USA, 6–7 April 2009.
  21. Meli, F.; Bieri, M.; Thalmann, R.; Fracheboud, M.; Breguet, J.-M.; Clavel, R.; Bottinelli, S. Novel 3D analogue probe with a small sphere and low measurement force. In Proceedings of the ASPE Summer Topical Meeting, Charlotte, NC, USA, 25–26 June 2003.
  22. Pril, W.O. Development of High Precision Mechanical Probes for Coordinate Measuring Machines. Ph.D. Thesis, Technische Universiteit Eindhoven, Eindhoven, The Netherlands, 2002. [Google Scholar]
  23. Liebrich, T.; Knapp, W. New concept of a 3D-probing system for micro-components. CIRP Ann. 2010, 59, 513–516. [Google Scholar] [CrossRef]
  24. Yang, S.; Li, S.; Kaiser, M.J.; Eric, F.H.K. A probe for the measurement of diameters and form errors of small holes. Meas. Sci. Technol. 1998, 9, 1365–1368. [Google Scholar] [CrossRef]
  25. Bütefisch, S.; Büttgenbach, S.; Kleine-Besten, T.; Brand, U. Micromechanical three-axial tactile force sensor for micromaterial characterization. Microsyst. Technol. 2001, 7, 171–174. [Google Scholar] [CrossRef]
  26. Lewis, A.J. Fully traceable miniature CMM with submicrometer uncertainty. Proc. SPIE 5190 Recent Dev. Traceable Dimens. Meas. II 2003, 265. [Google Scholar] [CrossRef]
  27. Bos, E.J.C. Aspects of tactile probing on the micro scale. Precis. Eng. 2011, 35, 228–240. [Google Scholar] [CrossRef]
  28. Murakami, H.; Katsuki, A.; Onikura, H.; Sajima, T.; Kawagoishi, N.; Kondo, E. Development of a system for measuring micro hole accuracy using an optical fiber probe. J. Adv. Mech. Des. Syst. Manuf. 2010, 5, 995–1004. [Google Scholar] [CrossRef]
  29. Press, W.H.; Teukolsky, S.A.; Vetterling, W.T.; Flannery, B.P. Numerical Recipes in C: The Art of Scientific Computing; Cambridge University Press: Cambridge, UK, 1988; p. 216. [Google Scholar]
Figure 1. Measurement system using an optical fiber probe. (a) Schematic diagram of probing system; (b) Fiber stylus.
Fibers 04 00024 g001
Figure 2. Principle of measurement. (a) Initial stage; (b) displacement in the X-direction; (c) displacement in the Y-direction.
Fibers 04 00024 g002
Figure 3. Ray trajectory in the optical system.
Fibers 04 00024 g003
Figure 4. Graphic display of ray-tracing (movement of the stylus shaft to Y = −0.5 µm).
Fibers 04 00024 g004
Figure 5. Schematic diagram of the probing system.
Fibers 04 00024 g005
Figure 6. Photograph of the fiber stylus.
Fibers 04 00024 g006
Figure 7. Simulation results for IY for distances L1 = 40, 80, and 120 mm (X displacement of the stylus tip = ±7 µm).
Fibers 04 00024 g007
Figure 8. Simulation results for IX for distances L1 = 40, 80, and 120 mm (X displacement of the stylus tip = ±7 µm of the stylus).
Fibers 04 00024 g008
Figure 9. Output voltage of IY for a distance L1 = 40 mm (X displacement of the stylus tip).
Fibers 04 00024 g009
Figure 10. Output voltage of IX for a distance L1 = 40 mm (X displacement of the stylus tip).
Fibers 04 00024 g010
Figure 11. Graphic display of ray tracing (movement of the stylus shaft toward Y = −1 µm); the right figure is obtained by thinning the rays.
Fibers 04 00024 g011
Figure 12. Simulation result for IY for a distance of L1 = 40 mm (X displacement of the stylus tip).
Fibers 04 00024 g012
Figure 13. Simulation result for IX for a distance of L1 = 40 mm (X displacement of the stylus tip).
Fibers 04 00024 g013
Figure 14. Simulation and experimental results for IY for a distance of L1 = 40 mm (X displacement of the stylus tip).
Fibers 04 00024 g014
Figure 15. Simulation and experimental results for IX for a distance of L1 = 40 mm (X displacement of the stylus tip).
Fibers 04 00024 g015
Figure 16. Schematic diagram for evaluating the measurement resolution.
Fibers 04 00024 g016
Figure 17. Output voltage IX induced by step feeding displacement. (a) 3 nm; and (b) 10 nm.
Fibers 04 00024 g017
Figure 18. Measured force acting on the stylus tip (stem length: 1 mm, stem diameter: 3 µm, and ball diameter: 5 µm).
Fibers 04 00024 g018
Figure 19. Profile of φ100-µm micro-hole measured by the proposed measurement system.
Fibers 04 00024 g019
Table 1. Simulation conditions.
Laser sourceWavelength: 650 nm
Stylus shaft diameter, D3 µm
Refractive index of the stylus shaft1.457
Distance between planes 0 and 1, L010 µm
Distance between planes 2 and 3, L140, 80, 120 mm
Numerical aperture of the condenser lens0.13
Displacement, X−1.0 to 1.0 µm, −7.0 to 7.0 µm
Area of the dual-element photodiode5 × 10 mm
Table 2. Nomenclature used for simulation calculations.
X, Y, ZCoordinates of the optical system
DDiameter of the stylus shaft
L0, L1Distances between plane 0 and plane 1, plane 2 and plane 3
n0, n1Refractive indices of the target planes
W1, W2, W3Beam heights of the target planes
θ 0 X , θ 1 X , θ 2 X , θ 3 X Tilt angles for the optic axis (X-direction)
θ 0 Z , θ 1 Z , θ 2 Z Tilt angles for the optic axis (Z-direction)
β , γ Angles between the normal line drawn on the spherical surface and the optic axis
θ a , θ c Angles of incidence
θ b , θ d Angles of refraction
1 Offset of a laser spot on the fiber surface from plane-1
Table 3. Simulation conditions.
Laser SourceWavelength: 650nm
Stylus shaft diameter, D3 µm
Refractive index of the stylus shaft1.457
Distance between planes 0 and 1, L010 µm
Distance between planes 2 and 3, L140 mm
Numerical aperture of the condenser lens0.13
Displacement, X−7.0 to 7.0 µm
Laser beam diameter, DL10 µm
Area of the dual-element photodiode5 × 10 mm

