Abstract
Chenille tufted carpets typically use wet dyeing, which consumes large amounts of water, chemicals, and energy and limits pattern control. This study combines dope-dyed filaments with spatial (juxtaposed) color mixing to eliminate post-dyeing and expand design options. We define a nine-primary filament set and a ten-primary mixing system, quantify color relations in CIE Lab*, and classify four visual effects by hue angle difference (Δh): Blending (<30°), Pointillistic (30–60°), Mosaic (60–120°), and Heathering (≥120°). A CNC chenille spinner independently controls linear density, twist, and diameter via head speed, delivery speed, and spacer width; a 130 °C thermal setting step reproduces dyeing-induced pile morphology. The ten-primary system yields 45 binary and 120 ternary mixes that produce predictable effects matching the Δh categories. Yarn geometry is tuned precisely by rotating-head speed (density), front-roller speed (density/twist), and spacer width (diameter). Dope-dyed carpets reach wash and rub fastness grades 4–5 and light fastness grades 3–4 to 4, meeting industry standards. Spatial color mixing with dope-dyed filaments and CNC-controlled chenille morphology thus enables the production of sustainable, dye-free carpets with quantitatively designed patterns and reliable performance, converting empirical color design into a predictive, more resource-efficient process.
1. Introduction
Chenille tufted carpets have gained significant attention in the textile industry for their excellent water absorption, fluffy texture, soft hand, superior drapability, and aesthetic appeal [1,2,3]. Manufactured by inserting chenille yarns through a base fabric using tufting machines, these carpets undergo dyeing, finishing, and backing to create materials with outstanding decorative properties, sound absorption, and comfort for interior spaces. However, traditional manufacturing confronts substantial environmental and technical challenges. The conventional production process extensively uses dyes, water, electricity, and steam during dyeing, causing significant wastewater discharge, energy consumption, and environmental contamination [4,5,6]. Moreover, traditional dyeing leads to batch-to-batch color variations, limited pattern diversity, and prolonged production cycles—critical bottleneck issues constraining the sustainable development of the chenille carpet industry [7,8].
The global commitment to carbon neutrality has accelerated demand for sustainable textile manufacturing. As of 2021, 127 countries and regions have pledged carbon neutrality, with China specifically targeting carbon peak by 2030 and full carbon neutrality by 2060, catalyzing transformative changes across industrial sectors [9,10,11,12]. Climate change is fundamentally reshaping global industrial strategies, compelling textile manufacturers to develop innovative approaches that significantly reduce carbon emissions and minimize environmental impact.
Dope-dyed fibers revolutionize textile coloration by integrating colorants directly into the polymer solution during fiber production, eliminating subsequent dyeing processes. This technology offers significant advantages: uniform fiber coloration, superior color fastness, minimal batch variations, and complete elimination of dyeing-related environmental pollution [13,14]. Recent research highlights its potential, with Nitu et al. [15] exploring dope-dyed nanofibers in garment fabrics and Nygren et al. [16] demonstrating excellent abrasion resistance and color stability. Despite these benefits, dope-dyed fibers face adoption challenges, including complex colorant dispersion, limited color varieties, higher material costs, and difficulties in creating intricate color patterns [17,18,19,20].
Current chenille yarn and carpet technologies have progressed significantly but remain constrained in pattern creation and environmental sustainability [21,22]. Chenille yarn production involves helically wrapping decorative filaments around core yarns using specialized spinning equipment [23,24,25]. Recent developments have emphasized process optimization, equipment automation, and product diversification, driving the industry toward multifunctional and environmentally friendly solutions [26,27,28,29,30]. The tufted carpet market is expanding through technological innovations like computer-controlled machines, robotic tufting, and automation tools that enhance design flexibility and production efficiency, enabling complex, multi-colored carpet patterns [31,32,33,34,35]. Despite these advances, traditional tufted carpets still struggle to create intricate color patterns without post-production dyeing or printing, with most existing methods relying on equipment modifications rather than fundamental color design innovations.
Spatial color mixing, or optical color mixing, occurs when multiple colored elements blend visually when viewed from a distance, creating a perceived new color [36,37,38,39,40,41]. While previous research by Chae [42] and Seyam & Mathur [43] explored this phenomenon in woven fabrics, existing studies remained descriptively limited and failed to establish a quantitative, predictive framework for engineered visual effects. The critical knowledge gap is the absence of a systematic model using colorimetric data—such as hue angle difference (Δh)—to reliably predict and control visual texture in complex three-dimensional structures like chenille carpets. Current approaches lack the ability to intentionally create effects ranging from smooth blends to high-contrast heathered looks [44]. This work addresses this gap by introducing a predictive model that transforms empirical design into a quantitative engineering process.
This study proposes an innovative approach integrating dope-dyed filaments with spatial juxtaposition mixing principles to develop a comprehensive pattern design system for chenille tufted carpets. By addressing critical limitations in color pattern diversity, environmental impact, and design methodologies, this research aims to develop a spatial juxtaposition mixing model for diverse visual effects, create a multi-element mixing system generating extensive color combinations from limited base colors, investigate chenille yarn morphological parameter controls, and establish sustainable production processes that eliminate traditional dyeing while maintaining product quality. This research seeks to provide a foundational framework for eco-friendly textile production with enhanced design capabilities, bridging environmental concerns and market demands for pattern diversity.
2. Materials and Methods
2.1. Space-Juxtaposed Color Mixing Model
Spatial juxtaposition mixing, the core principle of this research, describes how the human visual system perceives closely arranged colored elements from an optimal distance. This optical color mixing occurs when individual color elements are below the human eye’s angular resolution threshold (typically less than 1–2 arc min) [45,46,47], leading the visual system to integrate separate color stimuli into a cohesive experience, producing new apparent colors without physical mixing.
When micro-scale colored elements are densely arranged, the human visual system, from an appropriate distance, cannot distinguish individual elements. Instead, it optically fuses them into a new perceived hue—a phenomenon known as spatial or juxtaposed mixing, notably used in Pointillist art. The perceived color is influenced by observer distance, viewing angle, and ambient lighting. This principle is particularly effective in chenille yarn structures due to their unique morphology: short pile fibers extend perpendicularly from a helical core, enabling close juxtaposition of colored filaments. The three-dimensional pile maximizes surface area for color interaction and optimizes viewing angles for spatial mixing. Thus, the final visual appearance is a complex optical fusion, not merely an additive or subtractive mixture, dependent on the colorimetric relationships among the dope-dyed filaments.
To systematically apply the spatial mixing principle in chenille carpet design, we developed a comprehensive color framework based on established color theory. We established a foundational nine-primary-color system, comprising five base dope-dyed stock solutions: cyan, magenta, yellow, black, and white. These were blended during fiber production to create four additional intermediate colors: red (magenta + yellow), green (yellow + cyan), blue (cyan + magenta), and gray (cyan + magenta + yellow). This formulation resulted in a complete set of nine primary dope-dyed polyester filaments: Red, Yellow, Green, Cyan, Blue, Magenta, Gray, Black, and White. To establish a precise colorimetric database, samples were prepared by uniformly winding the dope-dyed filaments onto white cardboard substrates to ensure full, opaque coverage. The colorimetric properties were then measured using a YS6060 desktop spectrophotometer. The instrument was configured with a d/8° optical geometry and operated in Specular Component Included (SCI) mode under a D65 standard illuminant with a 10° standard observer. The SCI mode was specifically chosen to capture the total color appearance and minimize the influence of yarn surface texture on the measurements. For each sample, three replicate measurements were taken at different locations, and the results were averaged. The measurement precision was high, with mean standard deviations across all samples being approximately 0.08 for L, 0.11 for a, and 0.12 for b*, confirming excellent repeatability. The final averaged values in CIE Lab*, RGB, and HSL color spaces are presented in Table 1. This color set served as vertices for a three-dimensional color model, or “color solid,” represented as a regular hexagonal prism (Figure 1). The top face of the prism represents White, while the bottom face represents Black. The six vertices of the hexagonal cross-section correspond to the chromatic primary colors at 0°, 60°, 120°, 180°, 240°, and 300°: Red, Yellow, Green, Cyan, Blue, and Magenta. The central axis of the prism represents the neutral grayscale, providing a complete three-dimensional representation of the achievable color space for spatial juxtaposition mixing applications.

Table 1.
Colorimetric properties of the nine-primary-color dope-dyed filament system.
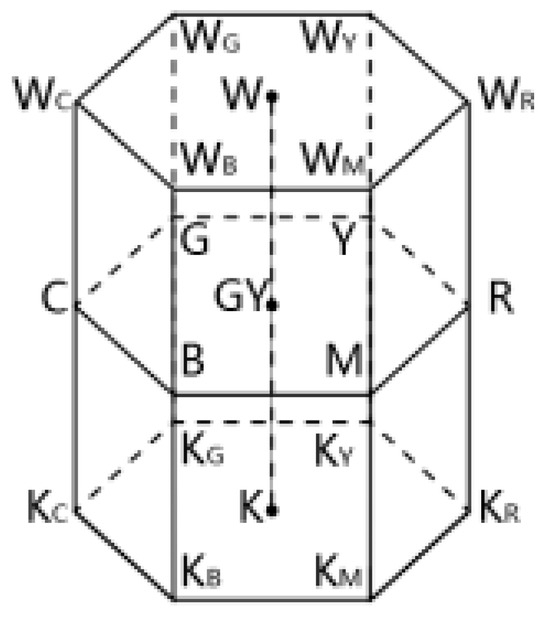
Figure 1.
Conceptual model of the nine-primary-color solid for spatial juxtaposition mixing. The model is represented as a regular hexagonal prism where the top and bottom faces are White and Black. The six vertices of the hexagonal cross-section correspond to the primary chromatic colors: Red (R), Yellow (Y), Green (G), Cyan (C), Blue (B), and Magenta (M). The central axis represents the neutral Gray (GY).
To map the achievable color gamut, we analyzed the color solid via its iso-surfaces. Isohue planes (constant hue) show lightness and chroma variation as quadrilaterals extending from the neutral axis to the prism’s surface at fixed hue angles (0°, 60°, etc.) (Supplemental Figure S1). Isoluminant slices (constant L*) are horizontal cross-sections showing all hues and chromas at a given lightness, appearing as hexagons (Supplemental Figure S2). Isochromatic cylinders (constant chroma) are concentric shells around the neutral axis where hue and lightness vary (Supplemental Figure S3). Two-dimensional “chromatograms” derived from these planes visualize the full mixing gamut and serve as practical design tools (Supplemental Figures S4–S6).
Based on the colorimetric distance between filaments within the color solid, four distinct and predictable spatial juxtaposition mixing effects were defined for chenille carpet pattern design. This classification allows designers to intentionally create specific visual textures and pattern effects through controlled color combinations [48,49,50]. Color blending occurs when filaments differ by less than 30° in hue (Figure 2a), producing near-complete fusion and a harmonious, homogeneous appearance with no obvious separation. Color piecing (Pointillistic), at 30–60° hue differences (Figure 2b), yields a soft, hazy texture where colors partially integrate yet remain subtly discernible with gentle transitions. Patterning (Mosaic), for 60–120° separations (Figure 2c), leaves colors visible as distinct spots, producing pronounced textures and clear separation layers. Heathering, with hue differences >120° (Figure 2d), prevents fusion and creates high-contrast, vibrant effects where individual fibers remain optically distinct.

Figure 2.
The four-category visual effect model for spatial juxtaposition mixing, based on hue angle difference (Δh). (a) Blending effect, occurring at Δh < 30°, resulting in a smooth, near-complete fusion of colors; (b) Pointillistic effect, for 30° ≤ Δh < 60°, creating a soft, hazy texture with subtle color separation; (c) Mosaic effect, for 60° ≤ Δh < 120°, where individual colors remain visible as distinct spots, forming a clear micro-pattern; (d) Heathering effect, at Δh ≥ 120°, producing a high-contrast visual where colors remain optically distinct with minimal fusion.
To quantify spatial mixing, we developed a systematic classification framework using CIE Lab* colorimetric analysis. The mathematical relations for color differences provide predictive design capability; specifically, we compute the Δh between any two filaments using:
Here, h1 and h2 represent the hue angles of filament 1 and filament 2, respectively (degrees); a* denotes the red–green coordinate in CIE Lab* color space; and b* indicates the blue–yellow coordinate in CIE Lab* color space. To ensure the correct quadrant and a full 0–360° range, the hue angle h was computed using a four-quadrant arctangent function (equivalent to atan2(b*, a*)). Δh denotes the absolute difference between the two hue angles.
2.2. Multi-Element Mixing System Development
From a comprehensive market analysis of color trends and manufacturing needs, we selected ten distinct dope-dyed polyester filaments as the foundation for the multi-element mixing system (Figure 3). The colors were chosen to maximize mixing potential while ensuring industrial feasibility and market relevance: brown, champagne, off-white, fruit green, dark gray, lake blue, purple, gray, rose red, and bright red. They cover the full spectrum and provide sufficient colorimetric separation to realize all four spatial mixing effects. Each filament was produced via standardized dope-dyeing to ensure consistent colorimetric properties and reproducibility. The ten-primary-color system enables systematic binary and ternary combinations, balancing design flexibility with manufacturing feasibility. Each level offers distinct advantages for pattern design and production constraints. Binary combinations form the fundamental building blocks for spatial mixing, providing pairs of colors ideal for subtle transitions and gradients through controlled two-color interactions. Ternary combinations expand the palette to three-color mixtures, enabling more complex textures and intermediate color effects, while keeping production planning and quality control manageable.
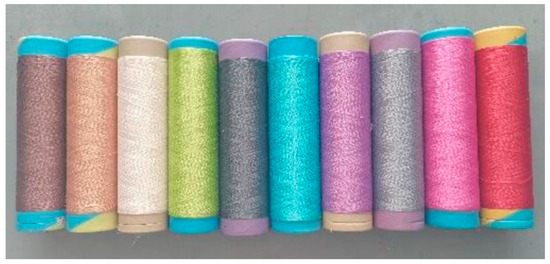
Figure 3.
The ten-primary-color dope-dyed filaments selected for the multi-element mixing system.
Samples were uniformly wound with dope-dyed filaments on white cardboard to ensure full coverage and conceal the substrate. The ten primary filaments were chosen for commercial relevance and functional completeness in spatial mixing. Table 2 shows colors with varying hue differences, providing the separation needed to achieve the full range of effects from subtle blending to high-contrast heathering. HSL analysis confirms hue angles from 15° to 354°, offering comprehensive chromatic coverage for effective spatial mixing.

Table 2.
Colorimetric properties of the ten base filaments for the multi-element mixing system.
Binary combinations with two filament colors (R1,G1,B1) and (R2,G2,B2) form the basis for all subsequent multi-element mixes (Supplemental Table S1). In three-filament configurations, two gradient levels allow basic color variation control. Ternary combinations, using (R1,G1,B1), (R2,G2,B2), and (R3,G3,B3), significantly increase design complexity and creative potential. The three-color calculations are markedly more involved, requiring systematic handling of multiple color interactions and ratio permutations (Supplemental Table S2). This added complexity yields richer color blends and textural effects unattainable with binary mixes.
2.3. Spinning Process of Chenille Yarns
The physical style and tactile properties of a chenille carpet are fundamentally determined by the morphology of the yarn itself. A chenille yarn is a composite structure consisting of two twisted core filaments that securely hold a multitude of short pile filaments, which radiate helically from the core to create a soft, bulky texture (Figure 4). The formation of a chenille yarn is a highly synchronized and continuous process that begins as the pile filaments (1) are fed through a high-speed rotating head, which rapidly wraps them around a stationary, flat spacing plate (6) to create a dense, uniform coil. Pushed forward by the force of the front rollers (4), this coil is then fed into a cutting device (7), where a blade slices the loops into short, uniform pile segments. Immediately following this, these cut segments are precisely intercepted and clamped between the two converging core yarns (2 and 3), which are also guided into position by the front rollers (4). The final stage involves a high-speed twisting action that cinches the core yarns to securely lock the pile fibers in place, forcing them to splay outwards in a radial, spiral pattern to form the characteristic structure of the finished chenille yarn (8) (as illustrated in Figure 5 and Figure 6). A pair of front rollers then advances the wrapped pile filaments towards a cutting device, where a blade slices them into uniform segments. These cut segments are immediately trapped between the two core filaments, and the entire assembly is twisted by a ring-and-traveler system, which locks the pile fibers securely in place (Figure 6).
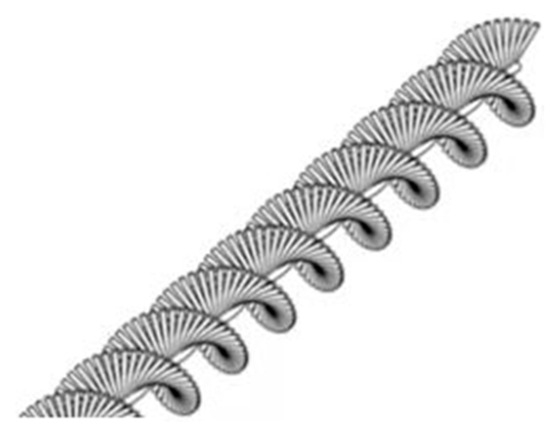
Figure 4.
Morphological characteristics of chenille yarn.
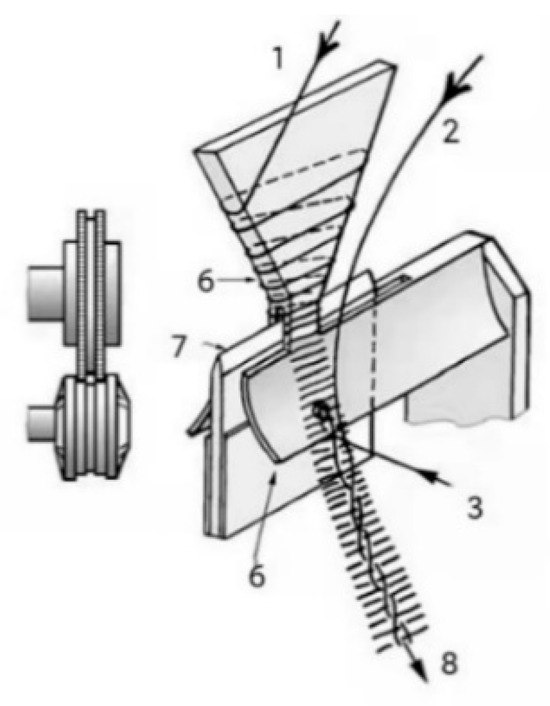
Figure 5.
Diagram of the chenille yarn spinning principle: pile wrapping stage.
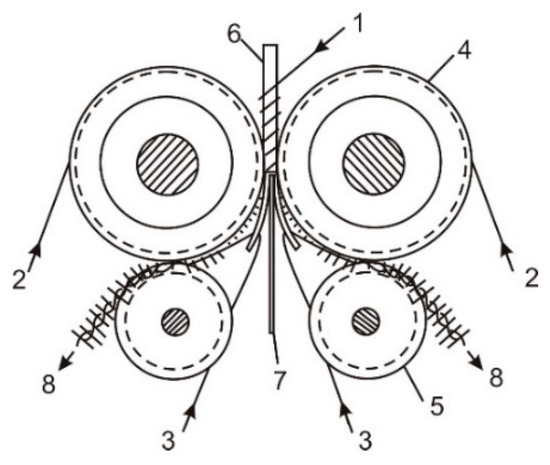
Figure 6.
Diagram of the chenille yarn spinning principle: pile cutting and twisting stage.
To precisely engineer yarns with specific characteristics, a modern CNC (Computer Numerical Control) chenille spinner was utilized (see Figure 7). This machine provides independent, programmable control over the key process variables that govern the final yarn morphology: the front-roller linear velocity (Vq), the rotating head speed (ω), the final spindle speed (nd), and the physically interchangeable spacing plate width (ws, in mm). The relationship between these process variables and the final yarn morphology—specifically its linear density (ρt), twist (Tw), and diameter (d)—is governed by a set of analytical relations. The total linear density is a function of the core and pile yarn properties, the pile arrangement density (m), and the pile height (h), where the pile density is directly proportional to the ratio of the rotating-head speed to the front-roller speed (m ≈ ω/Vq). The final yarn twist is determined by the ratio of the spindle speed to the yarn delivery speed (Tw ≈ nd/Vq), while the yarn’s diameter is primarily set by the spacing plate width. These relationships form a predictive model for yarn engineering.
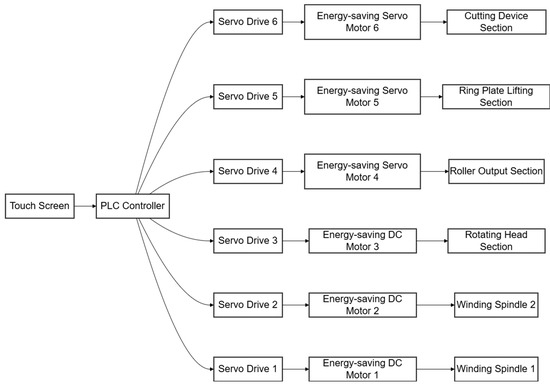
Figure 7.
Control system architecture of the CNC chenille spinning machine.
The final yarn morphology can be tailored by tuning the spinner’s key process variables according to the following analytical relationships: the total linear density is:
In this equation, all linear densities (ρt, N1, and N2) are expressed in tex. S1 is the dimensionless number of core yarn strands (S1 = 2 in this study). The m is given in wraps/cm, and the pile height, h, is in mm. The coefficient k is the dimensionless twist-contraction coefficient, which accounts for the shortening of the core yarns upon twisting; a value of k ≈ 1.1 was used for our calculations. The /10 factor in the second term is a unit conversion constant required for dimensional consistency. It converts the product of m (in wraps/cm) and h (in mm) into a dimensionless ratio representing the length of pile yarn per unit length of core yarn (mm/cm is converted to mm/mm). Using these principles, we experimentally validated three control strategies—altering front-roller speed, rotating-head speed, and spacing-plate width—to achieve precise, predictable changes in yarn density, twist, and diameter.
Three experimental series validated the control model by systematically modulating yarn morphology. In the first, varying the front-roller linear velocity with other parameters fixed altered pile density and twist simultaneously. In the second, varying the rotating head speed changed pile density while keeping twist constant. In the third, changing the spacing plate width directly controlled yarn diameter and bulk. The resulting yarns were analyzed, and the results are presented and discussed in the following section.
2.4. Tufting Technology for Chenille Carpets
All carpet samples were produced on a computerized tufting machine using a consistent set of parameters: gauge 15 mm, pile height 27 mm, stitch density 10 stitches per inch (~39 stitches/10 cm), and speed 9700 RPM. Using theoretical color values from binary and ternary spatial mixing models, we created a CorelDRAW 2023 digital database of individual pile tufts, with each tuft filled by its corresponding simulated RGB color to represent a single pile loop. The database was organized by visual effects—blend, mosaic, division, heather—for efficient design retrieval. A digital grid, with dimensions matching the desired pattern repeat (e.g., 20 × 20), served as the design canvas. Designers populated the grid with selected tufts to generate a virtual carpet preview (Figure 8), enabling rapid iteration of color placement, yarn sequence, and tufting patterns. Once finalized, a detailed weaving process specification table (Table 3) was produced, providing the manufacturing blueprint with three core sets of instructions: chenille yarn composition, yarn arrangement sequence, and tufting program.
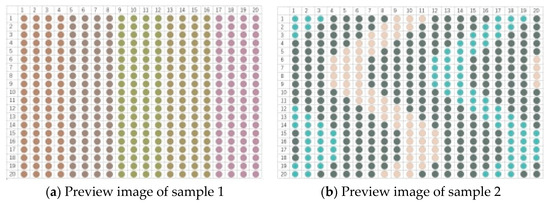
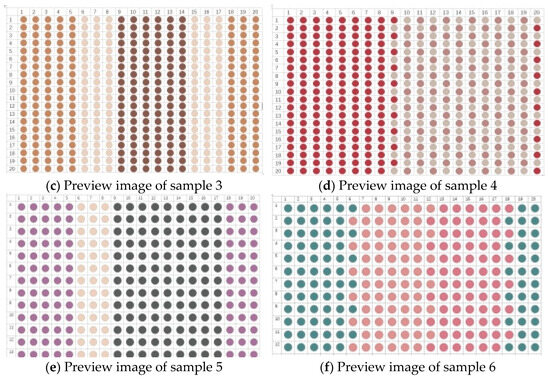
Figure 8.
Virtual prototyping of carpet patterns using the digital pile tuft database.

Table 3.
Production specification table for spatially mixed carpet patterns.
Based on the weaving process specification tables, physical carpet samples were manufactured with yarn combinations and arrangement sequences set up on the tufting machine and the corresponding tufting programs executed. The resulting samples (Figure 9) validated the design methodology and served as final products for analysis, directly corresponding to their digital previews.
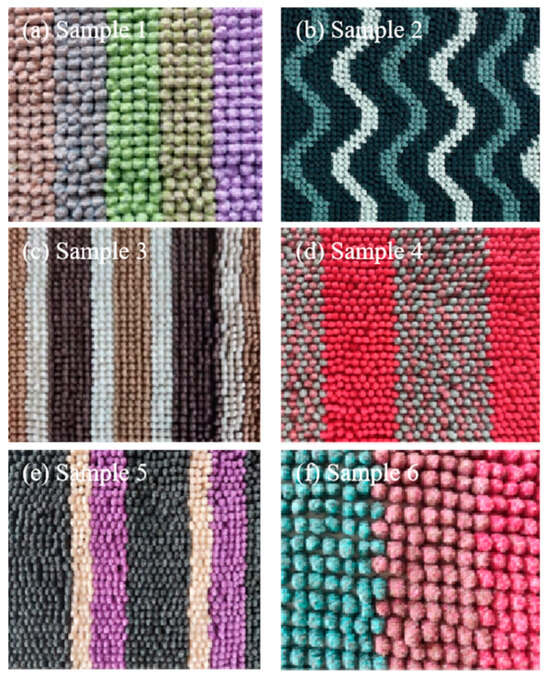
Figure 9.
Physical carpet samples produced using the spatial mixing design methodology.
2.5. Finishing Process Development
Finishing process development established optimal treatment conditions for conventional and dope-dyed chenille tufted carpets to achieve comparable pile morphology and performance. Two distinct processing pathways were investigated because dope-dyed carpets eliminate traditional dyeing while maintaining aesthetic and functional requirements.
The conventional dyeing process served as the control, incorporating established industry practices for chenille tufted carpets. Pre-treatment scoured the carpet with degreasing agents in the dye bath to remove manufacturing residues and ensure thorough cleaning, enabling optimal dye uptake and uniform color development across the surface.
The dyeing temperature profile was optimized for both color development and pile morphology. Starting at 40–50 °C with dyeing auxiliaries and required dyes, temperature rose at 2 °C/min to 95 °C with a 10 min isothermal hold for dye dissolution and initial penetration. A second stage raised the temperature at 1 °C/min to 105 °C with a 10 min hold, followed by a third stage at 0.5 °C/min to 115 °C with continued isothermal treatment. The final stage accelerated at 1 °C/min to 130–135 °C, with isothermal hold times at maximum temperature varying by color depth: 30 min for light, 45–50 min for medium, and 60 min for dark colors to ensure fixation without degradation. Controlled cooling at 10 °C/min to 80 °C relieved thermal stress and stabilized pile structure. Post-dyeing finishing included washing at 40–50 °C with hydrophilic softeners and smoothing agents for 30 min to improve hand feel and surface, followed by maximum-power dehydration (11–15 min) and three-stage drying at 130 °C, 115 °C, and 100 °C to achieve optimal pile morphology and dimensional stability.
A room-temperature finishing process was developed for dope-dyed chenille carpets to bypass conventional dyeing while preserving essential thermal treatment for pile morphology. The optimized sequence starts with washing the tufted fabric at 30–40 °C to remove residues, then a 30 min wash with hydrophilic softeners and smoothing agents is performed to improve fiber surface properties and pile characteristics. Maximum-power dehydration (11–15 min) removes process water with minimal mechanical stress. The key innovation is drying at 130 °C for 30 min, replacing the thermal effects of dyeing. This heat treatment induces molecular rearrangement in polyester fibers, promoting pile expansion, elasticity, and fullness. A single-stage drying approach achieves morphologies equivalent to traditional multi-stage processes. The 130 °C temperature exceeds the polyester glass transition temperature, enabling necessary chain mobility, while 30 min provides sufficient development without excessive energy use or degradation. This streamlined approach shows dope-dyed carpets can attain comparable aesthetic and functional properties without the environmental burden of traditional dyeing.
2.6. Colorfastness and Performance Testing
To assess the finished dope-dyed carpets against conventional standards, six representative samples (three conventional P1-P3 and three dope-dyed Y1-Y3 across dark, medium, and light shades) were tested for colorfastness. From each sample type, one specimen per test (wash, rub, light fastness) was prepared following GB/T protocols, with all tests conducted in accordance with GB/T standards. Wash fastness (GB/T 12490-2014 [51]) utilized multi-fiber A2S at 40 °C for 30 min, evaluating color changes and staining of adjacent fabrics against gray scales. Rub fastness (GB/T 3920-2008 [52]) employed a crockmeter under both dry and wet conditions, in longitudinal and transverse directions, at 9 ± 0.2 N for 10 cycles, with color transfer to the rubbing cloth graded on the gray scale for staining. Light fastness (GB/T 8427-2008 [53], Method 3) followed Xenon arc exposure with a black panel at 47 ± 3 °C and irradiance of 42 W/m2, and fading was assessed by comparison with blue wool standards.
3. Results and Discussion
The results strongly validate the proposed spatial juxtaposition mixing model and its sustainable manufacturing process. The discussion centers on three areas: validating the color design model, engineering yarn morphology for texture variety, and developing an environmentally sound finishing process that delivers high-performance products.
3.1. Validation of Spatial Juxtaposition Mixing Model
The experimental results robustly validate the proposed spatial juxtaposition mixing model, showing its ability to convert empirical color design into a predictive, quantitative methodology. By building a precise colorimetric database of base filaments with CIE Lab* measurements, we achieved accurate predictions of visual outcomes from hue angle differences Δh. Supplemental Tables S3 and S4 show that spun chenille yarns consistently fall into one of four categories—Blending (Δh < 30°), Pointillistic (30° ≤ Δh < 60°), Mosaic (60° ≤ Δh < 120°), and Heathering (Δh ≥ 120°)—and Figure 10 illustrates representative binary combinations from these data that confirm the model’s predictive power. Blending (Δh < 30°): Brown (N) with Champagne (C) (Δh = 10°) yields a smooth, uniform hue (Figure 10a). Pointillistic (30° ≤ Δh < 60°): Fruit Green (G) with Off-white (W) (Δh = 33°) produces a soft, subtly stippled texture (Figure 10b). Mosaic (60° ≤ Δh < 120°): Fruit Green (G) with Lake Blue (B) (Δh = 111°) creates a clear micro-pattern of distinct color spots (Figure 10c). Heathering (Δh ≥ 120°): Bright Red (R) with Lake Blue (B) (Δh = 172°) yields a high-contrast, minimal-fusion look (Figure 10d). This consistent alignment between predicted and observed visuals across all cases, detailed in Supplemental Tables S3 and S4, demonstrates the model’s practical utility and moves chenille carpet design from intuition to a systematic color-engineering approach.
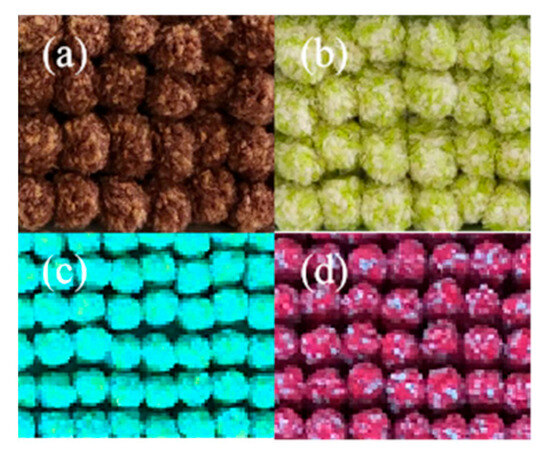
Figure 10.
Validation of the four-category visual effect model. Each panel shows a representative binary yarn combination, its calculated Δh, the predicted effect, and the resulting physical yarn sample, confirming the model’s accuracy. (a) Blending effect with N + C (Δh = 10°). (b) Pointillistic effect with G + W (Δh = 33°). (c) Mosaic effect with G + B (Δh = 111°). (d) Heathering effect with R + B (Δh = 172°).
We quantitatively validated the predictive accuracy of the Δh thresholds by classifying all 45 binary combinations documented in Supplemental Table S3. Each combination received a predicted visual category (Blending, Pointillistic, Mosaic, or Heathering) from its Δh and the thresholds then was compared to the actual visual effect observed in the corresponding yarn sample. The model achieved 43 correct classifications, or 95.6% accuracy. The two misclassifications occurred at category boundaries (e.g., Δh = 58° appearing more Mosaic than Pointillistic), reflecting perceptual gradients rather than fixed divisions. This high accuracy supports the robustness and practical utility of the thresholds for translating design goals into predictable manufacturing outcomes.
Although hue angle difference Δh primarily determines the type of color interaction (harmonious vs. contrasting), our results show that lightness ΔL* and chroma ΔC* act as crucial secondary modulators that shape texture and intensity, especially within the Blending category (Δh < 30°). When Δh, ΔL*, and ΔC* are all small, filaments blend into a homogeneous, smooth surface. If Δh is small but ΔL* and/or ΔC* are large, the result is a tonal, “sparkled,” or “vibrating” texture rather than uniform fusion, since color differences in lightness or saturation prevent complete optical blending. Figure 11 illustrates this: (a) two gray filaments with large ΔL* but negligible Δh/ΔC* yield a salt-and-pepper texture rather than uniform gray, and (b) a vibrant vs. muted red (large ΔC*, small Δh) produce a textured, sparkled effect. This principle extends to Mosaic or Heathering, where ΔL* and ΔC* can accentuate or soften the effect. Consequently, a complete predictive model must incorporate all three dimensions: Δh establishes the baseline visual effect, while ΔL* and ΔC* modulate its textural expression. This multidimensional framework offers designers a more powerful toolkit for engineering complex visual aesthetics.
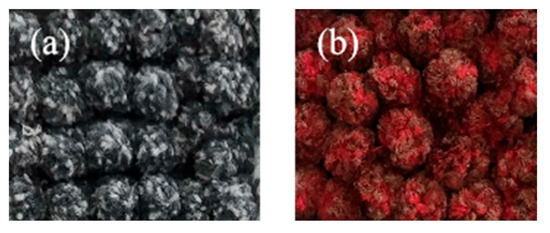
Figure 11.
The modulating effect of lightness (ΔL*) and Chroma (ΔC*) on spatial mixing. (a) Tonal blending: two filaments with a large ΔL* but minimal Δh (e.g., light gray and dark gray) create a “sparkled” or “salt-and-pepper” texture, not a uniform blend. (b) Chroma-driven texture: Two filaments with a small Δh but large ΔC* (e.g., a vibrant red and a muted red) also produce a visible texture due to the contrast in saturation.
Our systematic classification markedly advances spatial color mixing in textiles. While Chae [42] and Seyam & Mathur [43] described optical blending in woven fabrics, their work remained descriptive without quantitative predictive frameworks. We extend these concepts by introducing mathematical relationships that enable precise control of visual texture through colorimetric analysis. The four-category model affords unprecedented design control, enabling deliberate creation of harmonious blending for uniform surfaces, pointillistic effects for dynamic textures, mosaic patterns for micro-structures, and heathering for high-contrast aesthetics.
The textile industry stands to gain transformative practical benefits. Traditional chenille carpet design relied on intuition, trial-and-error, and extensive physical sampling—processes that are time-consuming, wasteful, and environmentally burdensome. Our methodology shifts this paradigm by allowing computational prediction of visual outcomes before production. This addresses Nguyen’s identified gap in systematically controlling color gradients in fiber mixing [41]. By establishing quantitative relationships between colorimetric properties and visual effects, the framework eliminates guesswork and expands creative possibilities.
Integrating spatial mixing with dope-dyed filaments offers clear advantages over conventional post-dyeing. Unlike dyeing methods that incur batch-to-batch variability, our approach preserves consistent colorimetric properties throughout production. Coupled with the predictive spatial mixing model, this reliability enables scalable, sustainable carpet manufacturing that meets rising market demands for environmental responsibility and design diversity.
3.2. CNC-Controlled Chenille Yarn Engineering
Beyond color innovation, our study of chenille yarn morphology control reveals unprecedented precision in engineering the physical properties that shape carpet aesthetics and performance. The three experimental methods validating CNC control over yarn structure show varying effectiveness and offer key insights for industrial implementation.
The first method—controlling yarn density via front-roller linear velocity variation—increased density from 1665 tex to 3567 tex (Table 4), confirming the link between delivery speed and pile density. However, a key discrepancy arose: despite aiming for a 4.0x density multiplier, results plateaued at 3.3x. This 3.3x limit offers mechanistic insights beyond Wei et al. [24] and Şener et al. [23], who emphasized process optimization without addressing fundamental constraints. The limit stems from twist transfer phenomena: as front-roller speed decreases, the twist Tw = nd/Vq increases, creating high-twist zones that migrate along the yarn and prevent maximum packing density. This redistribution caps density increases and marks a significant advance in chenille yarn physics, informing industrial design parameters. The yarns and carpet samples (Figure 12a,d) demonstrate successful production of increasingly plush yarns despite the theoretical ceiling.

Table 4.
Effect of front-roller velocity on chenille yarn linear density.
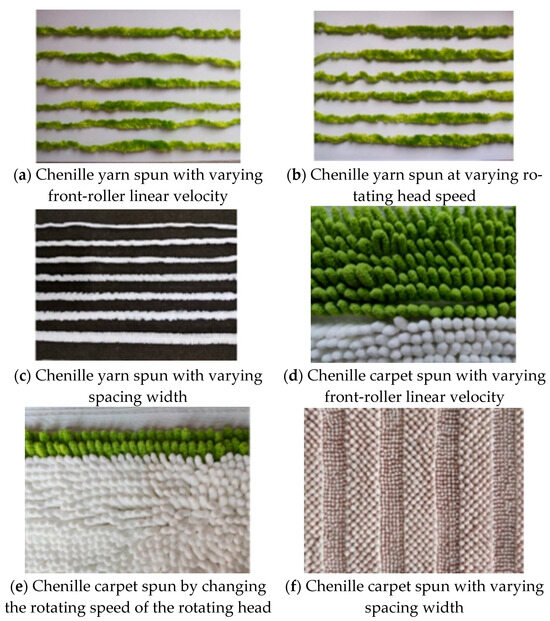
Figure 12.
Engineered chenille yarns and corresponding carpet samples produced by varying spinning parameters.
The limitation arises not from geometry alone but from yarn-structure stability. Excessive pile density induces internal stresses that undermine long-term dimensional stability and processing reliability. The 3.3x threshold seems to balance density and structural integrity, offering practical guidance for industrial design. This insight fills a notable gap in the chenille spinning literature, where upper limits for morphological control had not been systematically investigated.
The experimental density multiplier plateaued at 3.3x and did not reach the designed 4.0x when front-roller velocity was varied (Table 4). We hypothesize a twist transfer phenomenon: based on yarn dynamics (Tw ≈ nd/Vq), reducing front-roller velocity while maintaining spindle speed increases torsional stress, which redistributes along the yarn length as twist migrates from high- to low-twist regions to reach equilibrium. This redistribution prevents maximum theoretical packing density. Note that we did not directly measure local twist distribution to validate this quantitatively; thus, twist transfer is offered as a plausible explanation grounded in established yarn physics. Quantitative verification of this mechanism is a valuable direction for future research.
The second method, varying rotating head speed while keeping front-roller velocity constant, achieved the full 4.0x density range (Table 5) and demonstrated superior control precision. The linear relationship between rotating-head speed (14,525–38,180 r/min) and density (1635–4010 tex) corroborates the model m ≈ ω/Vq, enabling reliable, twist-transfer-free process control. By keeping yarn twist constant while independently adjusting pile density, this approach yields stable control and higher pile fiber density without secondary effects. The resulting yarns (Figure 12b) show consistent morphological progression, translating to predictable carpet aesthetics (Figure 12e). For industrial manufacturing, this method offers linear, predictable control over the full range, unlike the front-roller method, which is limited by twist dynamics. This reliability is essential for consistent quality and commercial viability.

Table 5.
Effect of rotating head speed on chenille yarn linear density.
The third method—controlling yarn diameter via spacing plate width variation—offers the most intuitive, visually direct approach to yarn bulk engineering. The proportional link between plate width (7.0–15.0 mm) and linear density (901–1900 tex) enables straightforward control of pile length and yarn diameter (Table 6). Its primary advantage is independence from dynamic process variables, delivering deterministic control through physical geometry. The resulting yarns (Figure 12c) show progressive thickness increases, enabling high–low pile effects in carpet samples (Figure 12f) for textural pattern and aesthetic contrast. A key limitation is the need for hardware changes, rather than software adjustments, reducing flexibility for rapid design iteration.

Table 6.
Effect of spacing plate width on chenille yarn linear density and diameter.
3.3. Critical Process Parameters for Optimal Pile Morphology
Filament fineness significantly influences pile morphology and tactile properties in dope-dyed versus conventional carpets. Conventional chenille carpets use 150D/288F polyester filaments, while dope-dyed variants use 300D/288F. At identical fiber counts, dope-dyed filaments are coarser, yielding a stiffer pile than conventional options. This fineness difference creates a trade-off between environmental benefits and hand feel. Figure 13 compares conventional and dope-dyed pile morphologies, showing the coarser texture of dope-dyed variants. This limitation also points to future optimization through finer-denier dope-dyed filaments or hybrid approaches that balance sustainability with improved tactile properties.
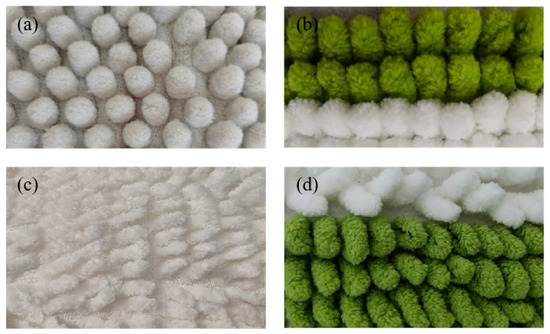
Figure 13.
Comparative analysis of chenille pile morphology under different material and processing conditions. (a) Pile from a conventional carpet using finer 150D/288F filaments, showing a soft texture. (b) Pile from a dope-dyed carpet using coarser 300D/288F filaments, resulting in a stiffer morphology. (c) Pile from an unfinished carpet before the thermal treatment step. (d) Defective pile structure with unformed spirals resulting from insufficient yarn twist.
A concise analysis of twist effects identifies key parameters for optimal chenille pile morphology. Tufting naturally yields spiraled piles from inherent twist; higher twist promotes curling and intertwining, enhancing fullness and aesthetics. Insufficient twist prevents spirals, leaving loop structures, while excessive twist stiffens the yarn and reduces softness. Table 7 defines twist thresholds for different diameters, guiding manufacturers to achieve optimal spiral formation across product specs. This study marks the first systematic twist-optimization investigation in dope-dyed chenille and fills a literature gap.

Table 7.
Recommended twist levels for chenille yarns of varying diameters (by spacing-plate width).
Decorative yarn arrangement density is a key factor affecting pile fullness and structural integrity. Figure 14 shows how different densities influence yarn and pile morphology. Sparse arrangements per unit length produce thin, flat piles with reduced comfort (Figure 14a,c). Excessive density overcrowds core yarn twist intervals, lowers twist, prevents natural spiral formation, and leads to loop retention (Figure 14b,d).
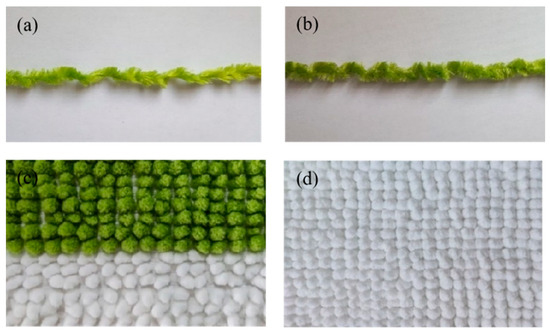
Figure 14.
The effect of pile yarn arrangement density on chenille yarn structure and final pile morphology. (a) Yarn produced with a sparse pile arrangement density. (b) Yarn produced with an excessively dense pile arrangement. (c) The resulting thin and flat pile morphology associated with sparse density. (d) The full, upright pile morphology achieved with an optimal (normal) arrangement density.
Table 8 presents systematically optimized decorative yarn arrangement densities for different spacing-blade widths, providing quantitative guidelines for achieving optimal pile characteristics across various yarn specifications. These optimized parameters enable precise control over pile fullness while maintaining structural integrity, addressing critical manufacturing considerations for achieving consistent product quality in industrial applications.

Table 8.
Recommended pile arrangement densities for chenille yarns of varying diameters.
3.4. Innovative Thermal Treatment for Dope-Dyed Carpets
A key breakthrough is developing thermal treatment that replicates dyeing morphology without environmental impact. The 130 °C process successfully substitutes high-temperature dyeing effects, marking a major advancement in sustainable carpet processing. Figure 15 shows the complete morphological evolution during our optimized finishing, with clear evidence of the effectiveness of thermal treatment alternatives. Observations reveal distinct changes at each stage. The initial pile is flattened and collapsed (Figure 15a). After scouring to remove residues, the pile is irregular in the wet state (Figure 15b). High-temperature treatment expands the pile and begins upright structuring, but it remains too soft with a granular surface, needing further finishing (Figure 15c). Final treatment with hydrophilic softeners and smoothing agents, followed by controlled dehydration and targeted heating, yields optimal morphology—fullness, roundness, and refined texture (Figure 15d).
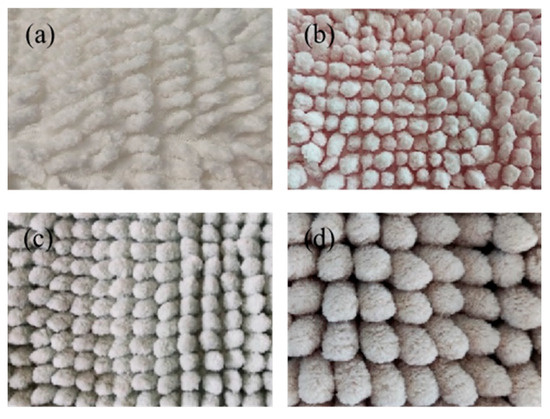
Figure 15.
Morphological evolution of the chenille pile during the optimized wet finishing process. (a) Initial pile morphology before treatment, showing a flattened and collapsed structure. (b) Pile after scouring, appearing irregular in the wet state. (c) Pile after the 130 °C thermal treatment, exhibiting initial expansion and upright structuring. (d) Final pile morphology after the complete finishing process, showing optimal fullness, roundness, and refined texture.
The 130 °C thermal treatment effectiveness can be understood through polyester thermodynamics. Polyester has a Tg of ~80–85 °C; at 130 °C, chains gain mobility and reorganize during cooling, enabling a stable configuration that reproduces the fiber “setting” achieved by high-temperature dyeing, and thereby increase pile fullness and loft. This suggests that thermal effects, not chemical dye interactions, chiefly determine pile morphology—a shift beyond Hassabo et al.’s emphasis on dyeing chemistry [3]. Our findings show that thermal treatment alone can yield equivalent morphologies, enabling a simplified, room-temperature finishing process with substantial environmental advantages over conventional dyeing. Traditional dyeing uses significant water, chemicals and energy and generates wastewater; the new process eliminates these burdens while maintaining product quality. In terms of efficiency, conventional dyeing requires 6–8 h for complete cycles, whereas the streamlined approach takes about 1.5 h, a 75% reduction.
3.5. Comprehensive Performance Validation
For rigorous validation, colorfastness tests were conducted on six representative samples covering the full range of color depths and processing methods. Table 9 lists the sample codes for traceability from processing conditions to outcomes. This systematic selection enables direct comparison of conventional and dope-dyed approaches at matching color depths, attributing performance differences to processing rather than color.

Table 9.
Identification codes for carpet samples used in colorfastness testing.
Colorfastness tests (Table 10, Table 11 and Table 12) show that dope-dyed carpets meet industry standards, with excellent wash and rub fastness (grades 4–5) and good light fastness (grades 3–4 to 4). This confirms that a sustainable, dye-free process does not compromise performance. The superior wash and rub fastness stems from colorants integrated into the fiber matrix during dope-dyeing, not surface application, validating the fibers’ color stability and aligning with findings in other textiles by Balakrishnan et al. [13] and Nitu et al. [15].

Table 10.
Comparative analysis of colorfastness to washing (GB/T 12490-2014 [51]).

Table 11.
Comparative analysis of colorfastness to rubbing (GB/T 3920-2008 [52]).

Table 12.
Comparative analysis of colorfastness to light (GB/T 8427-2008 [53]).
Light fastness (grades 3–4 to 4) meets interior requirements and highlights the stability benefits of incorporating colorants during fiber production rather than by surface application. These results address Uglea & Stan’s concerns [18] about colorant degradation in dope-dyed systems, confirming that modern dope-dyeing achieves excellent stability across performance metrics. Comparable performance between dope-dyed and conventionally dyed samples across all color depths demonstrates process robustness and supports a complete shift to sustainable production without sacrificing performance. Notably, dope-dyed samples consistently reach the upper end of acceptable grades, indicating advantages of the integrated colorant approach over surface dyeing.
3.6. Addressing Current Limitations and Industrial Considerations
Although our results show clear advantages, some limitations must be acknowledged for industrial deployment. Using 300D/288F dope-dyed filaments instead of 150D/288F conventional filaments yields coarser fibers and slightly reduces softness. This sustainability-versus-hand-feel trade-off is a design consideration manufacturers must evaluate based on product requirements and market positioning.
The ten-color base system offers many combinations (45 binary + 120 ternary) but may need expansion for specialized applications needing broader color gamuts. Our research provides a clear, systematic framework to add base colors while preserving predictive accuracy. Industrial scaling requires CNC spinning equipment modifications and standardized thermal treatment protocols. The established linear relationships between process parameters and yarn properties form a solid foundation for implementation, though equipment adaptations may be necessary for different production scales.
Dope-dyed chenille tufted carpets can match conventionally dyed performance with optimized processing. The 130 °C thermal treatment effectively replaces high-temperature dyeing for pile morphology, marking a major advancement in sustainable carpet manufacturing. Superior color fastness across all tests confirms the viability of dope-dyeing for high-quality carpets and establishes a foundation for sustainable textile practices.
3.7. Broader Implications and Future Research Directions
Our approach tackles multiple environmental challenges at once by fully eliminating dyeing. This removes water use (about 50–100 L per kg of carpet), chemicals, energy for heating/cooling, and wastewater treatment. Life cycle thinking indicates these combined benefits substantially reduce environmental impact, supporting a shift toward carbon-neutral textile manufacturing (Rahaman et al. [9]; Hassan et al. [10]). Achieving enhanced design capabilities alongside major environmental advantages contradicts the view that sustainability requires trade-offs in performance. Demonstrating progress toward environmental sustainability while improving design capabilities supports a paradigm in which environmental responsibility drives innovation and competitive advantage, not constraints on product development.
The spatial-mixing and CNC control concepts developed for chenille carpets can be adapted to other textiles. Woven, knitted, and non-woven fabrics could gain color complexity and design sophistication while avoiding post-production dyeing. The color-prediction framework based on colorimetric analysis offers a universal approach across textile structures. Future work should adapt these principles to various fiber types, yarns, and fabric constructions to establish comprehensive sustainable design methodologies for the broader textile industry.
The shift from empirical, trial-and-error design to predictive, quantitative methods marks a fundamental advancement in textile engineering. By linking colorimetric properties to visual effects through mathematical relationships, our research enables systematic, not just incremental, innovation. It lays a comprehensive foundation for sustainable chenille carpet manufacturing that balances environmental responsibility with commercial viability, offering practical tools for eco-friendly production without compromising quality or market competitiveness.
4. Conclusions
This research successfully demonstrates that integrating dope-dyed filaments with spatial juxtaposition mixing principles offers an innovative and environmentally superior approach to chenille tufted carpet production. The developed methodology addresses critical limitations in traditional carpet manufacturing by eliminating wet dyeing, enhancing design possibilities, and maintaining excellent product quality.
This study’s primary contribution is a systematic, quantitative framework for predicting and controlling visual effects. The four-category classification model—based on hue angle difference Δh—was validated with 95.6% predictive accuracy, transforming traditional trial-and-error design into a science-based methodology. We further refined this model by demonstrating that lightness (ΔL*) and chroma (ΔC*) differences act as critical secondary modulators of visual texture. The multi-element mixing system proved highly efficient, with just ten primary colors generating 45 binary and 120 ternary combinations, offering extensive design flexibility from a limited, manageable inventory.
Technologically, the use of CNC spinning enables precise, independent control over chenille yarn morphology (linear density, twist, and diameter), allowing for the engineering of diverse tactile and visual styles. A key innovation is the simplified, dye-free finishing process, where a 130 °C thermal treatment effectively replicates the pile morphology achieved through traditional high-temperature dyeing, drastically reducing processing time and environmental impact. Comprehensive colorfastness testing confirmed the superior performance of the dope-dyed carpets, which achieved grade 4–5 ratings for wash and rub resistance and grade 3–4 to 4 for light fastness, meeting or exceeding conventional quality standards. This confirms that eliminating traditional dyeing does not compromise product durability or performance.
While the approach offers significant advantages, we acknowledge that the use of coarser 300D/288F dope-dyed filaments results in a trade-off between the method’s clear environmental benefits and a reduction in pile softness compared to carpets made with conventional 150D/288F yarns. This stands as a key consideration for industrial adoption and a clear target for future material development.
The broader implications of this research are significant, establishing a replicable framework for sustainable textile production that can be adapted to other applications. By proving that environmental responsibility can be achieved while enhancing—not limiting—design capabilities, this work supports the textile industry’s evolution toward more innovative and responsible manufacturing. Future research should focus on developing finer-denier dope-dyed filaments to improve tactile properties, expanding the base color system for a wider gamut, and integrating the predictive model into automated, AI-driven design systems. This research provides a comprehensive foundation for sustainable chenille carpet manufacturing that successfully reconciles environmental stewardship with commercial viability and design excellence.
Supplementary Materials
The following supporting information can be downloaded at: https://www.mdpi.com/article/10.3390/fib13090126/s1, Figure S1: Isohue planes of the nine-primary-color solid; Figure S2: Isoluminant slices of the nine-primary-color solid at varying lightness (L*) levels; Figure S3: Isochromatic cylinders of the nine-primary-color solid at varying chroma (C*) levels; Figure S4: 2D chromatogram of isohue planes: projected color gamut for each fixed hue angle; Figure S5: 2D chromatogram of isoluminant slices: projected color gamut for each fixed lightness level; Figure S6: 2D chromatogram of isochromatic surfaces: projected color gamut for each fixed chroma level; Table S1: Gradient mixing color values of three stock solution colored filaments; Table S2: Gradient mixing color values of three stock solution colored filaments; Table S3: Simulated and actual visual effects of binary spatial mixing combinations; Table S4: Simulated and actual visual effects of ternary spatial mixing combinations.
Author Contributions
All authors contributed to the conception and design of the study. Material preparation, data collection, and analysis were performed by P.C. and Y.X. The first draft of the manuscript was written by P.C., and all authors commented on the previous versions of the manuscript. All authors have read and agreed to the published version of the manuscript.
Funding
This research was supported by the Zhejiang Provincial “Jianbing” and “Lingyan” R&D Program (Grant No. 2022C01188), the Fujian Provincial Engineering Technology Research Center of Industrial Design and Intelligent Manufacturing (Grant Nos. PT25002 and GCZX202502), and the Intelligent Textile Technology and Flexible Manufacturing Innovation Team under the Quanzhou City High-Level Talent Introduction Program (Grant No. 2024CT019).
Data Availability Statement
The datasets used and/or analyzed during the current study are available from the corresponding author on reasonable request. All colorimetric data, experimental parameters, and testing results supporting the conclusions of this article are included within the article and its supplementary information file.
Conflicts of Interest
The authors declare that they have no competing interests.
References
- İlhan, İ. An experimental investigation on strength and elongation properties of chenille yarn. Text. Appar. 2017, 27, 117–125. [Google Scholar]
- Grice-Venour, A. New conservation practices for a nineteenth-century chenille carpet at the National Trust Textile Conservation Studio. In Textile Conservation; Routledge: Abingdon, UK, 2024; pp. 285–294. [Google Scholar]
- Hassabo, A.G.; Zayed, M.; Bakr, M.; Othman, H. An overview of carpet manufacture: Design, dyeing, printing and finishing. J. Text. Color. Polym. Sci. 2022, 19, 269–290. [Google Scholar] [CrossRef]
- Cascio, A.J. Development of next generation carpet backings for facile recyclability. Master’s Thesis, Georgia Institute of Technology, Atlanta, GA, USA, 2006. [Google Scholar]
- Ponder, C.; Gregory, B.; Griffing, E.; Li, Y.; Overcash, M. Life cycle comparison of carpet dyeing processes. J. Adv. Manuf. Process. 2019, 1, e10012. [Google Scholar] [CrossRef]
- Chequer, F.M.D.; de Oliveira, G.A.R.; Ferraz, E.R.A.; Cardoso, J.C.; Zanoni, M.V.B.; de Oliveira, D.P. Textile dyes: Dyeing process and environmental impact. In Eco-Friendly Textile Dyeing and Finishing; IntechOpen: London, UK, 2013. [Google Scholar]
- Acquah, S.B.; Oduro, K. Traditional cloth dyeing enterprise at Ntonso: Challenges and opportunities. West Afr. J. Appl. Ecol. 2012, 20, 25–36. [Google Scholar]
- Bureekhampun, S.; Maneepun, C. Eco-friendly and community sustainable textile fabric dyeing methods from Thai buffalo manure: From pasture to fashion designer. SAGE Open 2021, 11, 21582440211058201. [Google Scholar] [CrossRef]
- Rahaman, M.T.; Pranta, A.D.; Repon, M.R.; Ahmed, M.S.; Islam, T. Green production and consumption of textiles and apparel: Importance, fabrication, challenges and future prospects. J. Open Innov. Technol. Mark. Complex. 2024, 10, 100280. [Google Scholar] [CrossRef]
- Hassan, R.; Acerbi, F.; Terzi, S.; Rosa, P. Enabling the twin transition of the textile industry: A systematic literature review. Waste Manag. 2025, 195, 294–307. [Google Scholar] [CrossRef]
- Siliņa, L.; Dāboliņa, I.; Lapkovska, E. Sustainable textile industry—Wishful thinking or the new norm: A review. J. Eng. Fibers Fabr. 2024, 19, 15589250231220359. [Google Scholar] [CrossRef]
- Islam, M.T.; Jahan, R.; Jahan, M.; Howlader, M.S.; Islam, R.; Islam, M.M.; Hossen, M.S.; Kumar, A.; Robin, A. Sustainable textile industry: An overview. Non-Met. Mater. Sci. 2022, 4, 15–32. [Google Scholar] [CrossRef]
- Balakrishnan, N.K.; Siebert, S.; Richter, C.; Groten, R.; Seide, G. Effect of colorants and process parameters on the properties of dope-dyed polylactic acid multifilament yarns. Polymers 2022, 14, 5021. [Google Scholar] [CrossRef]
- Moges, G.; Pawlos, M.; Ademasu, Y.; Tesfaye, T. A review of exploring ionic and nonionic dyeing of polyester: Sustainable solutions and applications. Text. Res. J. 2025, 95, 00405175251322133. [Google Scholar] [CrossRef]
- Nitu, N.A.; Ma, Y.; Gong, Y.; Zhang, D.; Zhang, S.; Hasan, M.M.; Hu, Y. Wearable Colorful Nanofiber of Thermoplastic Polyurethane (TPU) Mechanical and Colorfastness Properties by Dope Dyeing. Fibers Polym. 2024, 25, 2485–2502. [Google Scholar] [CrossRef]
- Nygren, N.; Langhans, M.; Heimala, S.; Westerback, H.; Schlapp-Hackl, I.; Hummel, M. Production and Recycling of Dope-Dyed Lyocell Fibers with Pigment Dyes. ACS Sustain. Resour. Manag. 2025, 2, 1139–1146. [Google Scholar] [CrossRef]
- Vuola, J. Recycling of Dope Dyed Fibers. Bachelor’s Thesis, Aalto University, Espoo, Finland, 20 May 2025. [Google Scholar]
- Uglea, C.V.; Stan, V.N. The characterisation of dope dyed poly (ethylene terephthalate). Br. Polym. J. 1982, 14, 39–44. [Google Scholar] [CrossRef]
- Li, Q.; Zhang, F.; Jin, X.; Zhang, S.; Zhu, C. Optimized Stearns-Noechel model to predict mixed color values of yarn-dyed fabrics. Sen’i Gakkaishi 2014, 70, 218–224. [Google Scholar] [CrossRef][Green Version]
- Daneshvar, E.; Amani Tehran, M.; Gorji Kandi, S.; Zeighami, F. Investigating the characteristics of two different methods in nanofiber yarn coloration. J. Text. Inst. 2016, 107, 833–841. [Google Scholar] [CrossRef]
- Çeven, E.K.; Ozdemir, O. Using Fuzzy Logic to Evaluate and Predicte Chenille Yarn’s Shrinkage Behaviour. Fibres Text. East. Eur. 2007, 15, 55. [Google Scholar]
- Fouda, A.; Těšinová, P.; Khalil, A.; Eldeeb, M. Thermo-physiological properties of polyester chenille single Jersey knitted fabrics. Alex. Eng. J. 2022, 61, 7029–7036. [Google Scholar] [CrossRef]
- Şener, A.; Koç, D.D.; Yılmaz, K.; Tosunoğlu, E.; Çam, P.; Gündübay, A.; Demirdelen, T. Chenille yarn production parameters improvement studies and evaluation of their effects. Çukurova Üniversitesi Mühendislik Fakültesi Dergisi 2022, 37, 1047–1060. [Google Scholar] [CrossRef]
- Wei, L.; Yuan, X.; Shulan, J.; Jun, L.; Qunhao, L. Morphological structure regulation mechanism of the chenille yarn and its spinning process design. Adv. Text. Technol. 2023, 31, 36. [Google Scholar]
- Tusief, M.Q.; Ashraf, S.; Manzoor, H.; Waris, Z.; Siddique, A.; Hussain, F.; Raza, Z.; Zeeshan, M.; Saifullah, R.; Amjad, A. Application of Fancy Yarns for Weaving. Acad. Int. J. Soc. Sci. 2025, 4, 395–398. [Google Scholar] [CrossRef]
- Peng, Y.; Sun, F.; Pan, R. Multiplexed Sensing Textiles Enabled by Reconfigurable Weaving Meso-Structures for Intricate Kinematic Posture Recognition and Thermal Therapy Healthcare. ACS Sens. 2025, 10, 3051–3060. [Google Scholar] [CrossRef] [PubMed]
- Attia, A. Innovating New Weaving Structural Components to Create Woven Jacquard Sports Footwear Fabrics. Int. Des. J. 2024, 14, 313–325. [Google Scholar] [CrossRef]
- Liu, H.; Shi, Y.; Pan, Y.; Wang, Z.; Wang, B. Sensory interactive fibers and textiles. NPJ Flex. Electron. 2025, 9, 23. [Google Scholar] [CrossRef]
- Yağız, A.; Usta, İ. Development of multifunctional textile surface with electromagnetic shielding effectiveness, water and oil repellency and flame retardancy features. Text. Appar. 2025, 35, 19–30. [Google Scholar]
- Khan, G.M.A.; Hasan, M.S.; Rahaman, M.H.; Aydid, A.; Rahman, M.M.; Hasanuzzaman, M.; Jahan, R.; Jannat-Al-Foisal, M. Cellulose and its composites in textiles and food industry. In Regenerated Cellulose and Composites: Morphology-Property Relationship; Springer: Berlin/Heidelberg, Germany, 2023; pp. 223–264. [Google Scholar]
- Tufted Carpets Market Size, Share & Industry Analysis, by Material (Animal-Made Yarn, Plant-Made Yarn, and Synthetic Fibers), by Application (Residential and Commercial), by Distribution Channel (E-Commerce/Online and Retail Outlets/Offline), and Regional Forecast, 2025–2032. Available online: https://www.fortunebusinessinsights.com/tufted-carpets-market-112909 (accessed on 4 August 2025).
- Cunningham, P.R.; Miller, S.A. A material flow analysis of carpet in the United States: Where should the carpet go? J. Clean. Prod. 2022, 368, 133243. [Google Scholar] [CrossRef]
- Harman, D.E. An Economic Evaluation of the Robotic Tufting Process Considering the Application of a Novel Composite Wing Rib Post. Doctor’s Thesis, University of Plymouth, Plymouth, UK, 2013. [Google Scholar]
- Zhang, Q.; Luo, H.; Zhu, W.; Qi, G.; Wang, Y. Design and implementation of a automatic carpet edge-cutting system. In Proceedings of the 2016 IEEE International Conference on Mechatronics and Automation, Harbin, China, 7–10 August 2016; pp. 2582–2586. [Google Scholar]
- Wang, J.; Campbell, R.A.; Harwood, R.J. Automated inspection of carpets. In Proceedings of the Optics in Agriculture, Forestry, and Biological Processing, Boston, MA, USA, 31 October–4 November 1994; SPIE: Bellingham, DC, USA, 1995; pp. 180–191. [Google Scholar]
- Fairchild, M.D. Color Appearance Models; John Wiley & Sons: Hoboken, NJ, USA, 2013. [Google Scholar]
- Shevell, S.K. The Science of Color; Elsevier: Amsterdam, The Netherlands, 2003. [Google Scholar]
- Nishida, S.y.; Watanabe, J.; Kuriki, I.; Tokimoto, T. Human visual system integrates color signals along a motion trajectory. Curr. Biol. 2007, 17, 366–372. [Google Scholar] [CrossRef]
- Pascucci, D.; Tanrikulu, Ö.D.; Ozkirli, A.; Houborg, C.; Ceylan, G.; Zerr, P.; Rafiei, M.; Kristjánsson, Á. Serial dependence in visual perception: A review. J. Vis. 2023, 23, 9. [Google Scholar] [CrossRef]
- Nguyen, L.C. Fiber Fusion: An Exploration of Color Gradients through Color Mixing of Blending Wool Fibers. Bachelor’s Thesis, Faculty of Textiles, Engineering and Business, Borås, Sweden, 2023. [Google Scholar]
- Chae, Y. Visual Color Mixing Effect of Yarns in Textile Fabrics. J. Korean Soc. Cloth. Text. 2019, 43, 373–383. [Google Scholar] [CrossRef]
- Seyam, A.-F.M.; Mathur, K. A general geometrical model for predicting color mixing of woven fabrics from colored warp and filling yarns. Fibers Polym. 2012, 13, 795–801. [Google Scholar] [CrossRef]
- Chae, Y. The color appearance shifts of woven fabrics induced by the optical blending of colored yarns. Text. Res. J. 2020, 90, 395–409. [Google Scholar] [CrossRef]
- Sun, X.; Xue, Y.; Liu, Y.; Wang, L.; Liu, L. A neural network algorithm and its prediction model towards the full color phase mixing process of colored fibers. Text. Res. J. 2023, 93, 2449–2463. [Google Scholar] [CrossRef]
- Navarro, R. The optical design of the human eye: A critical review. J. Optom. 2009, 2, 3–18. [Google Scholar] [CrossRef]
- Ashraf, M.; Chapiro, A.; Mantiuk, R.K. Resolution limit of the eye: How many pixels can we see? arXiv 2024, arXiv:2410.06068. [Google Scholar] [CrossRef]
- Bonaque-González, S.; Trujillo-Sevilla, J.M.; Velasco-Ocaña, M.; Casanova-González, Ó.; Sicilia-Cabrera, M.; Roqué-Velasco, A.; Ceruso, S.; Oliva-García, R.; Martín-Hernández, J.; Gomez-Cardenes, O. The optics of the human eye at 8.6 µm resolution. Sci. Rep. 2021, 11, 23334. [Google Scholar] [CrossRef]
- Hagh-Shenas, H.; Kim, S.; Interrante, V.; Healey, C. Weaving versus blending: A quantitative assessment of the information carrying capacities of two alternative methods for conveying multivariate data with color. IEEE Trans. Vis. Comput. Graph. 2007, 13, 1270–1277. [Google Scholar] [CrossRef]
- Boynton, R.M.; Olson, C.X. Locating basic colors in the OSA space. Color Res. Appl. 1987, 12, 94–105. [Google Scholar] [CrossRef]
- Feisner, E.A.; Reed, R. Color Studies; A&C Black: London, UK, 2013. [Google Scholar]
- GB/T 12490-2014; Textiles-Tests for Colour Fastness-Colour Fastness to Domestic and Commercial Laundering. Standards Press of China: Beijing, China, 2014.
- GB/T 3920-2008; Textiles-Tests for Colour Fastnesscolour Fastness to Rubbing. China National Standardization Management Committee: Beijing, China, 2008.
- GB/T 8427-2008; Textiles-Tests for Colour Fastnesscolour Fastness to Artificial Light: Xenon Arc Fading Lamp Test. China National Standardization Management Committee: Beijing, China, 2008.
Disclaimer/Publisher’s Note: The statements, opinions and data contained in all publications are solely those of the individual author(s) and contributor(s) and not of MDPI and/or the editor(s). MDPI and/or the editor(s) disclaim responsibility for any injury to people or property resulting from any ideas, methods, instructions or products referred to in the content. |
© 2025 by the authors. Licensee MDPI, Basel, Switzerland. This article is an open access article distributed under the terms and conditions of the Creative Commons Attribution (CC BY) license (https://creativecommons.org/licenses/by/4.0/).


