Article

Analysis of Interfacial Properties in Flax Yarn-Reinforced Epoxy Resin Composites

1
School of Mechanical Engineering, Zhejiang Sci-Tech University, Hangzhou 310000, China
2
Department of Mechanical Engineering, University of Malta, MSD 2080 Msida, Malta
3
Faculty of Engineering, University of Mauritius, Reduit 80837, Mauritius
*
Author to whom correspondence should be addressed.
Fibers 2025, 13(9), 118; https://doi.org/10.3390/fib13090118
Submission received: 13 June 2025 / Revised: 7 August 2025 / Accepted: 21 August 2025 / Published: 29 August 2025

Abstract

With the increasing demand for green materials, natural fiber-reinforced composites have garnered significant attention due to their environmental benefits and cost-effectiveness. However, the weak interfacial bonding between flax fibers and resin matrices limits their broader application. This study systematically investigates the interfacial properties of single-ply and double-ply flax yarn-reinforced epoxy resin composites, focusing on interfacial shear strength (IFSS) and its influencing factors. Pull-out tests were conducted to evaluate the mechanical behavior of yarns under varying embedded lengths, while scanning electron microscopy (SEM) was employed to characterize interfacial failure modes. Critical embedded lengths were determined as 1.49 mm for single-ply and 2.71 mm for double-ply configurations. Results demonstrate that the tensile strength and elastic modulus of flax yarns decrease significantly with increasing gauge length. Single-ply yarns exhibit higher IFSS (30.90–32.03 MPa) compared to double-ply yarns (20.61–25.21 MPa), attributed to their tightly aligned fibers and larger interfacial contact area. Single-ply composites predominantly fail through interfacial debonding, whereas double-ply composites exhibit a hybrid failure mechanism involving interfacial separation, fiber slippage, and matrix fracture, caused by stress inhomogeneity from their multi-strand twisted structure. The study reveals that interfacial failure originates from the incompatibility between hydrophilic fibers and hydrophobic resin, coupled with stress concentration effects induced by the yarn’s multi-level hierarchical structure. These findings provide theoretical guidance for optimizing interfacial design in flax fiber composites to enhance load-transfer efficiency, advancing their application in lightweight, eco-friendly materials.

1. Introduction

Fiber-reinforced polymer composites, renowned for their lightweight and high-strength properties, have achieved widespread application in aerospace, rail transportation, and related fields [1,2]. However, synthetic fibers such as carbon fiber require substantial energy consumption during manufacturing, and their composites are difficult to degrade post-recycling. Consequently, developing eco-friendly materials and plant fiber-based composites has become a critical research focus. Natural fibers can be categorized as animal fibers, cellulose-lignin fibers, or mineral fibers [3]. Increasing research attention is now directed toward cellulose-lignin fibers derived from bast, leaves, seeds, fruits, and wood stalks. Natural fibers offer advantages including abundance, biodegradability, low cost, low density, high specific strength, and non-toxicity. Flax fiber, a cellulose-based fiber extracted from the bast layer of flax plant stems, primarily comprises cellulose, hemicellulose, waxes, lignin, and pectins. Natural flax fibers exhibit abrasion resistance, anti-static properties, biodegradability, corrosion resistance, cost-effectiveness, and excellent mechanical performance [4]. Flax fiber exhibits superior mechanical properties compared to other natural fibers, making it a leading candidate for high-performance biocomposites. With a tensile strength ranging from 345 to 1500 MPa and a Young’s modulus of 27.6–80 GPa, flax outperforms hemp (285–1735 MPa, 9.93–70 GPa) and jute (393–800 MPa, 10–30 GPa) in terms of specific strength and stiffness. This is attributed to its high cellulose content (64–81%) and tightly aligned microfibril structure, which enhances load transfer efficiency in composite materials. Additionally, flax fibers have lower moisture absorption (7–12%) than jute (12–14%) and hemp (6.2–12%), reducing dimensional instability in humid environments [5]. Despite these merits, a significant drawback persists: poor interfacial compatibility between the hydrophilic plant fibers and hydrophobic polymer matrices, which compromises fiber–matrix bonding [6,7].
The interface in fiber-reinforced composites refers to the finite region where fibers and the matrix interact. As a unique component of composites, the interface critically governs uniform and efficient load transfer and stress distribution between fibers and the matrix. The interfacial physicochemical properties differ from those of the reinforcement and resin matrix, typically exhibiting highly complex compositions, multilayered structures, and intricate interactions such as physical adsorption, chemical bonding, mechanical interlocking, and electrostatic forces [8,9]. Stress concentration and damage initiation during loading often originate at the fiber/matrix interface, which dictates composite debonding and stress-transfer efficiency. The superior strength of composites, particularly synthetic systems like carbon/glass fiber composites, stems from high interfacial shear strength (IFSS). Mechanical performance can be enhanced through fiber surface modifications targeting morphology, specific surface area, surface free energy, and roughness. For instance, Kumar et al. [10] demonstrated that sandblasted SS304 wire mesh reinforcement significantly improves the tensile strength (241.6 MPa) and flexural strength (290 MPa) of epoxy composites when combined with silane-treated pineapple/flax fibers and Si2N2O ceramic filler. Their study highlights the role of uniform filler dispersion in enhancing interfacial bonding and load-bearing capacity. Shelly and Park [11] reviewed the effects of chemical treatments (e.g., alkali, silane) on hemp fiber composites, showing that 5 wt% NaOH treatment increases tensile strength by 11% and reduces water absorption by 30%. Their work underscores the importance of surface modification for optimizing natural fiber-polymer compatibility Elayaraja and Rajamurugan [12] investigated flax/hemp yarn-reinforced SS304 wire mesh composites, revealing that a 90° fiber orientation minimizes wear rate (1.37 × 10⁻⁷ g/m), while 45° orientation achieves the lowest coefficient of friction (0.2721). Their findings provide critical insights for designing tribology-optimized interfaces of natural fiber composites. Li et al. [13] demonstrated that modifying flax fibers with carbon nanotubes (CNTs) prior to composite fabrication significantly improved mechanical properties due to enhanced IFSS between flax and epoxy. Goda et al. [14] treated ramie fibers with 15% NaOH, achieving 4–18% higher tensile strength by removing oils, lignin, and waxes from fiber cell walls, depolymerizing cellulose, and exposing short crystalline regions. Zhang et al. [15] investigated interfacial fatigue strength and toughness in sisal/epoxy composites via cyclic pull-out tests, reporting values of 6.6 MPa and 9.34 J/m2 for CNC-modified fibers—markedly higher than untreated counterparts. These examples illustrate how etching, coatings, or nanoparticle decoration (e.g., CNTs, graphene) create microscale roughness for mechanical interlocking, reduce interfacial defects (microcracks, voids), and homogenize load transfer to prevent premature failure from localized stress concentrations.
Several characterization methods for evaluating interfacial bond strength in composites have been developed, including pull-out tests, microbond tests, push-in tests, and single-fiber fragmentation tests (SFFT). Among these, pull-out testing is widely adopted due to its straightforward sample preparation and interpretable results. The applicability of these methods remains a subject of debate in the literature, with some techniques being adapted for characterizing fiber/matrix interactions in lignocellulosic fiber-reinforced polymers. Majhi et al. [16] utilized single-fiber pull-out tests to evaluate agave fibers treated with varying NaOH concentrations, finding that 5% NaOH treatment yielded optimal tensile strength and IFSS. Wong et al. [17] quantified IFSS via single-fiber pull-out testing for flax fiber-biopolymer composites modified with additives, demonstrating significant IFSS variations across treatments while acetone extraction showed negligible effects. Fidelis et al. [18] systematically assessed jute fiber–matrix interfacial performance and the impact of polymer treatments on adhesion mechanisms through pull-out tests, revealing enhanced chemical affinity and mechanical interlocking from surface modifications. It is important to note that appropriate test configurations should replicate the stress distribution characteristics observed in real composite materials and natural fiber composites. Yarn-based systems more comprehensively reveal hierarchical interfacial behaviors in plant fiber composites, where short fibers are twisted at an angle relative to the yarn axis to provide axial strength to the yarn. Consequently, interfacial adhesion strength must be evaluated at the yarn-scale rather than solely at the individual fiber scale. In this context, Spārniņš et al. [19] proposed a method for estimating interfacial shear strength (IFSS) using the pull-out fiber length distribution in oriented flax fiber-reinforced composites, incorporating a modified Weibull strength distribution to account for these structural features.
While extensive studies have optimized flax fiber–matrix interfaces through surface modifications [13,15] and characterized adhesion at the single-fiber scale [16,17], a critical gap persists in understanding hierarchical interface behavior at the yarn level. Real-world composites utilize twisted yarn structures where stress distribution is governed by multi-scale interactions between fibers, resin, and yarn geometry [20]. Current research lacks: (1) Quantitative analysis of interfacial shear strength (IFSS) for multi-ply yarn configurations; (2) Mechanistic insights into failure modes induced by yarn twisting; (3) Critical embedded length (Lc) data for practical composite design. This study employed pull-out testing to evaluate the mechanical properties of single-ply and double-ply flax yarns at varying gauge lengths, as well as the interfacial bonding performance between yarns and epoxy resin. Through mechanical behavior analysis during fiber extraction and interfacial shear strength (IFSS) quantification, the critical embedded length (Lc) was determined, elucidating key factors governing interfacial adhesion. Scanning electron microscopy (SEM) was utilized to characterize failure modes, revealing yarn debonding mechanisms. These findings establish a theoretical foundation for optimizing flax fiber composite design and broadening their engineering applications.

2. Materials and Experimental Methods

2.1. Materials

In this study, two flax yarn configurations are investigated: single-ply and double-ply variants. The flax yarn was supplied by Shanghai Jiayu Textile Co., Ltd., Tongxiang, Zhejiang, China. Single-ply yarn consists of a single strand of aligned flax fibers, offering high fiber density and direct stress transfer. In contrast, double-ply yarn comprises two strands twisted at 15–20°, enhancing structural cohesion but introducing interfacial inhomogeneity due to multi-strand geometry. This distinction is critical for interfacial load-transfer efficiency, as the twisted structure may compromise bonding uniformity. The linear density of the double-layer yarn (Figure 1) is 600 tex, and the density of the single fiber is 1.45 g/cm3. The thermosetting epoxy resin employed in this research is EPOLAM 2040 (AXSON Technologies Shanghai Co., Ltd., Shanghai, China), with an elastic modulus of 2239 MPa and a Poisson’s ratio of 0.38, and a viscosity of 1100 mPa.s at 25 °C. The hardener is EPOLAM 2042 HARDENER, with a viscosity of 15 mPa.s at 25 °C and a density of 0.95 g/cm3, provided by Axson Technologies, France. The epoxy resin and hardener were mixed at a 100:32 mass ratio, degassed under vacuum to remove air bubbles, and then cured at ambient temperature (25 °C) for 24 h, followed by 16 h of post-curing in a 65 °C constant-temperature oven.

2.2. Yarn Tensile Test

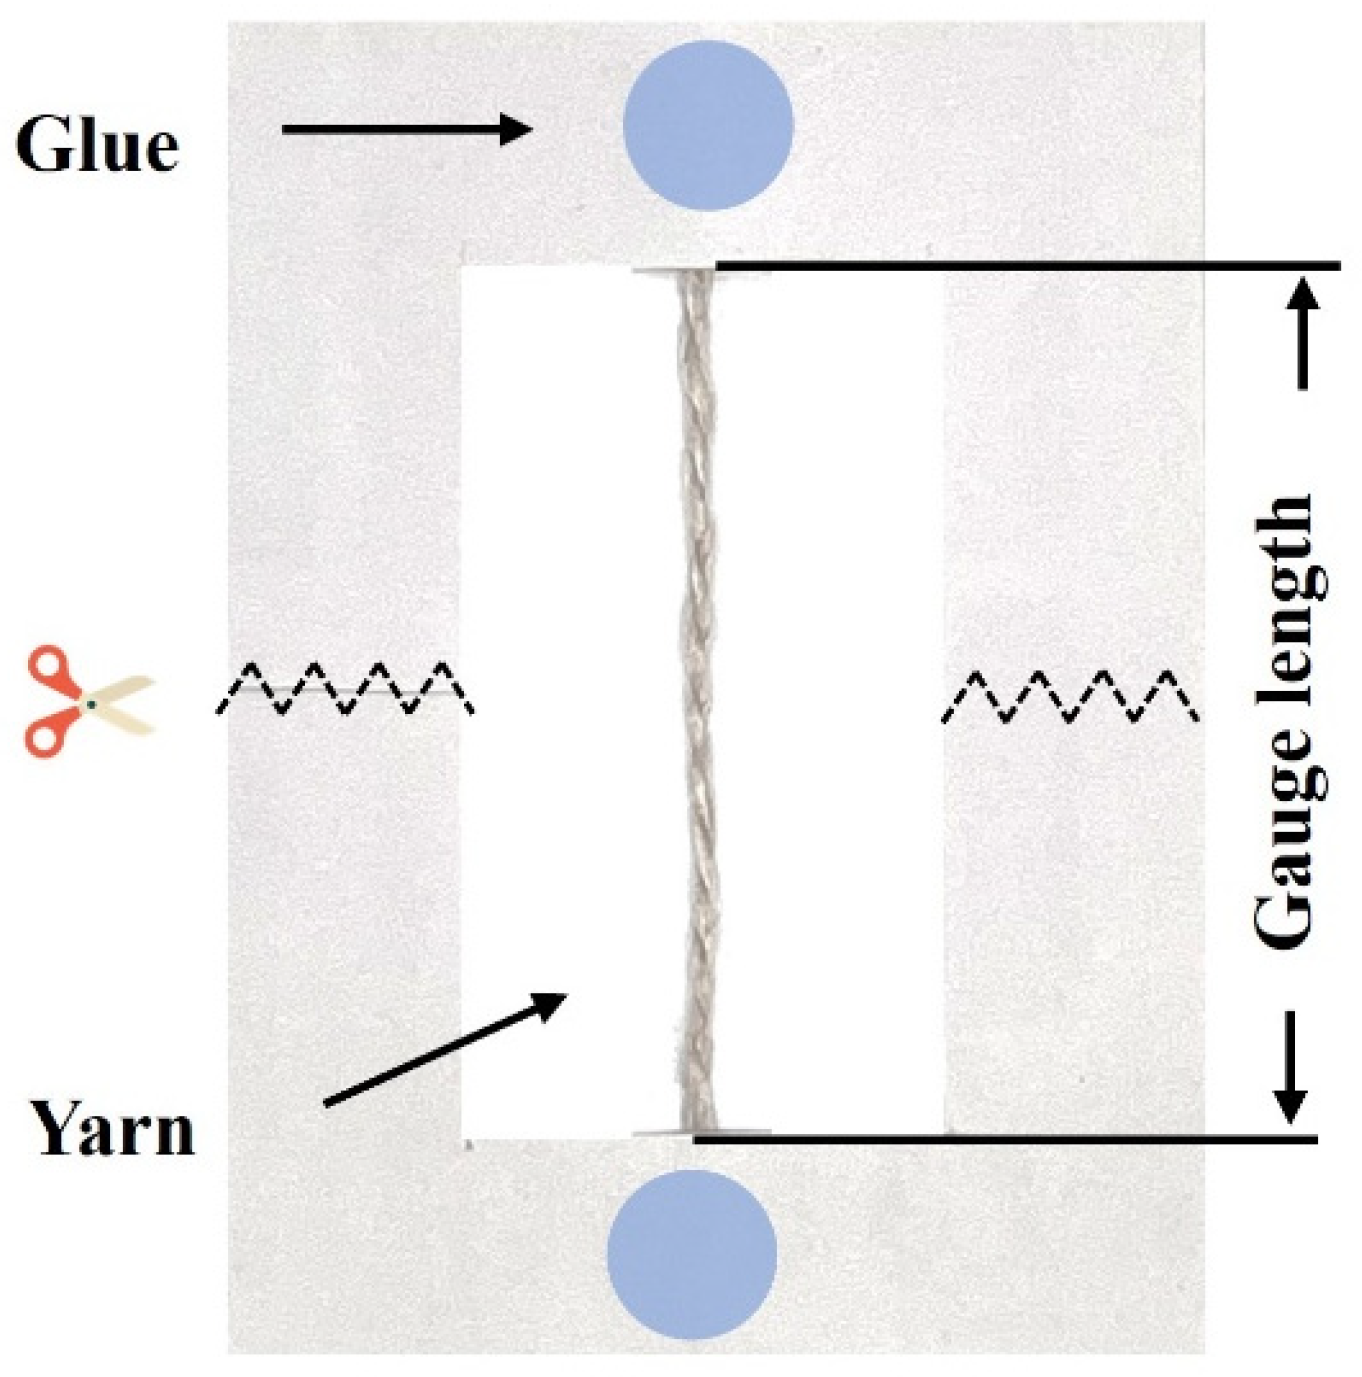
Tensile testing was conducted on single-ply and double-ply flax yarns to mechanically characterize each configuration. Three different gauge lengths—40, 60, and 100 mm—were tested. The flax yarns were evaluated using a computer-controlled electronic universal testing machine WDW-500 (Wance Technologies Ltd., Shenzhen, China) with a 1 kN load cell and a loading speed of 1 mm/min. Following ASTM C1557, 20 specimens per gauge length were prepared by securing the yarns onto thick paper cards with adhesive applied at both ends. The sides of the cardboard frame were then cut to isolate the central yarn segment, which was subsequently pulled until failure by the testing machine, as illustrated in Figure 2. Due to the irregular cross-sectional geometry inherent to lignocellulosic fibers, the yarn cross-section was assumed to be circular for calculations, with the cross-sectional area determined from the average yarn diameter. The tensile strength (MPa) and Young’s modulus E (MPa) of the yarns were calculated as follows:
σ f = F m a x A f
E = σ ε
where F m a x (N) is the peak tensile load of the specimen, A f (mm2) is the cross-sectional area of the specimen, σ (MPa) represents the tensile stress in the elastic stage, and ε is the corresponding strain.

2.3. Yarn Pull-Out Test

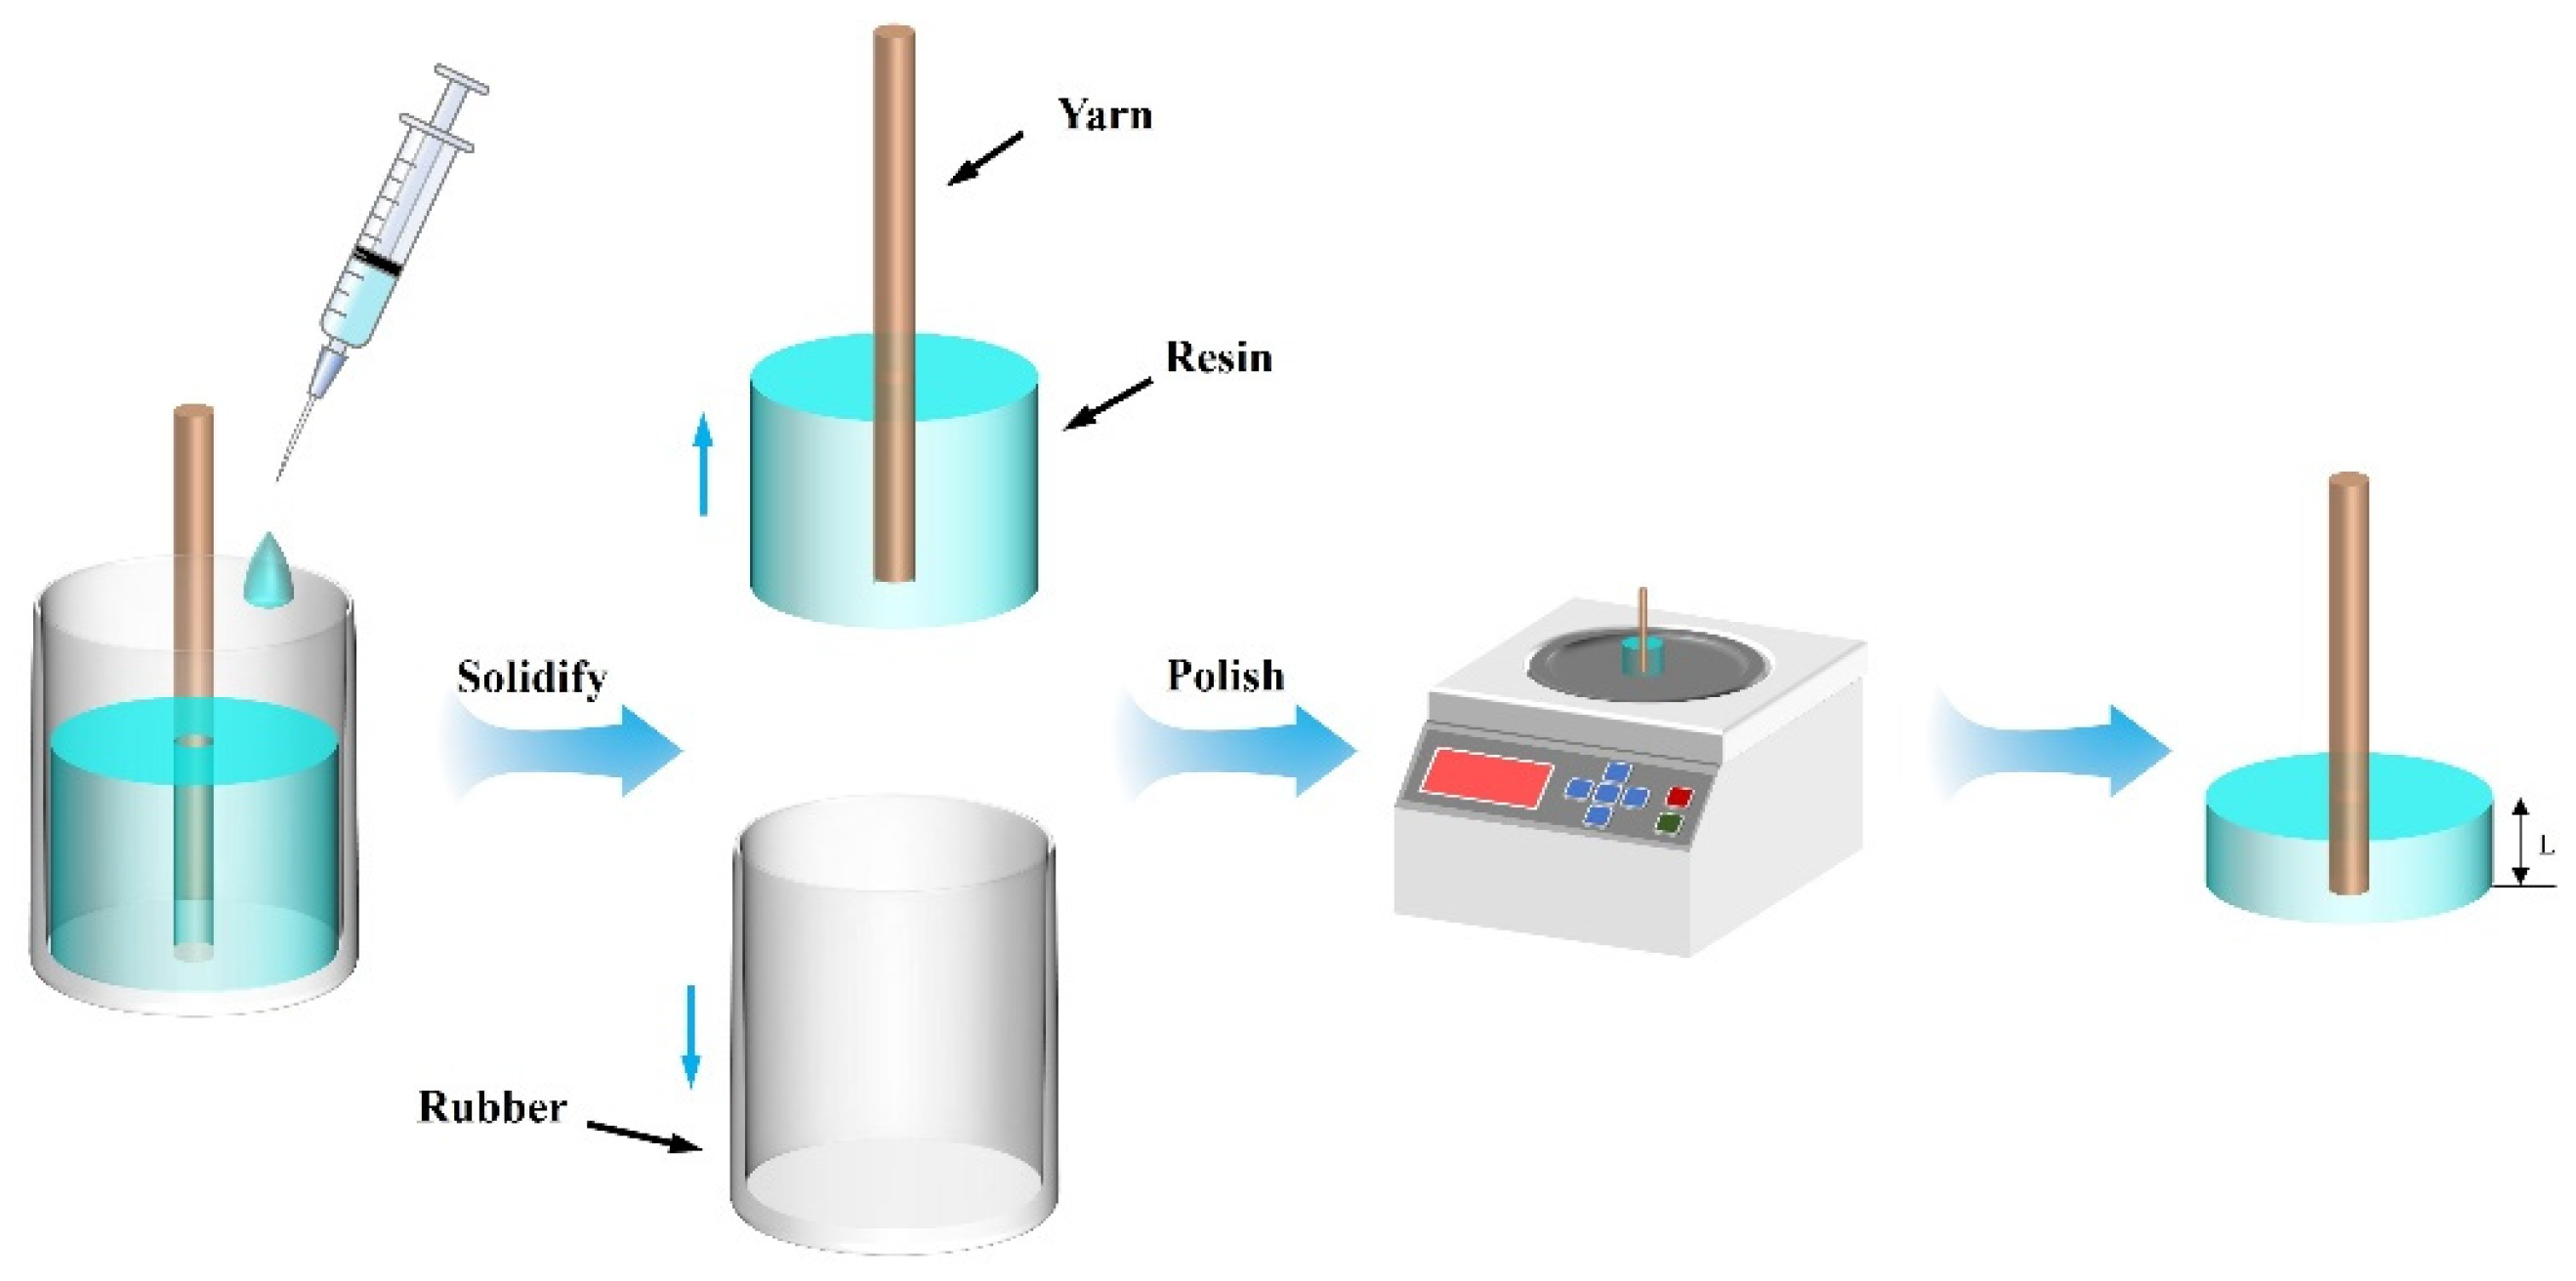
Specimens for yarn pull-out testing were prepared following the procedure recommended by Fiore et al. [21]. As illustrated in Figure 3, yarn segments were cut to 60 mm in length. Before the experiment, the samples were soaked in clean water to remove surface impurities. Then, they were dried at room temperature (25 °C) for 24 h. The yarns were vertically positioned within a rubber mold to ensure alignment within the epoxy resin infusion zone. A syringe was used to slowly inject the mixed epoxy resin into the mold, avoiding bubble formation, until the liquid level covered the target embedded length. The upper end of the yarn was secured in a fixture with a perforated hole. After room-temperature setting, the samples were transferred to a constant-temperature oven to ensure complete resin curing. Post-curing, specimens were polished on the lower surface using a grinding machine to achieve precise embedded lengths (L): 0–0.5 mm, 0.5–1 mm, 1–1.5 mm, 1.5–2 mm for single-ply yarns and 1–1.5 mm, 1.5–2 mm, 2–2.5 mm, 2.5–3 mm for double-ply yarns.
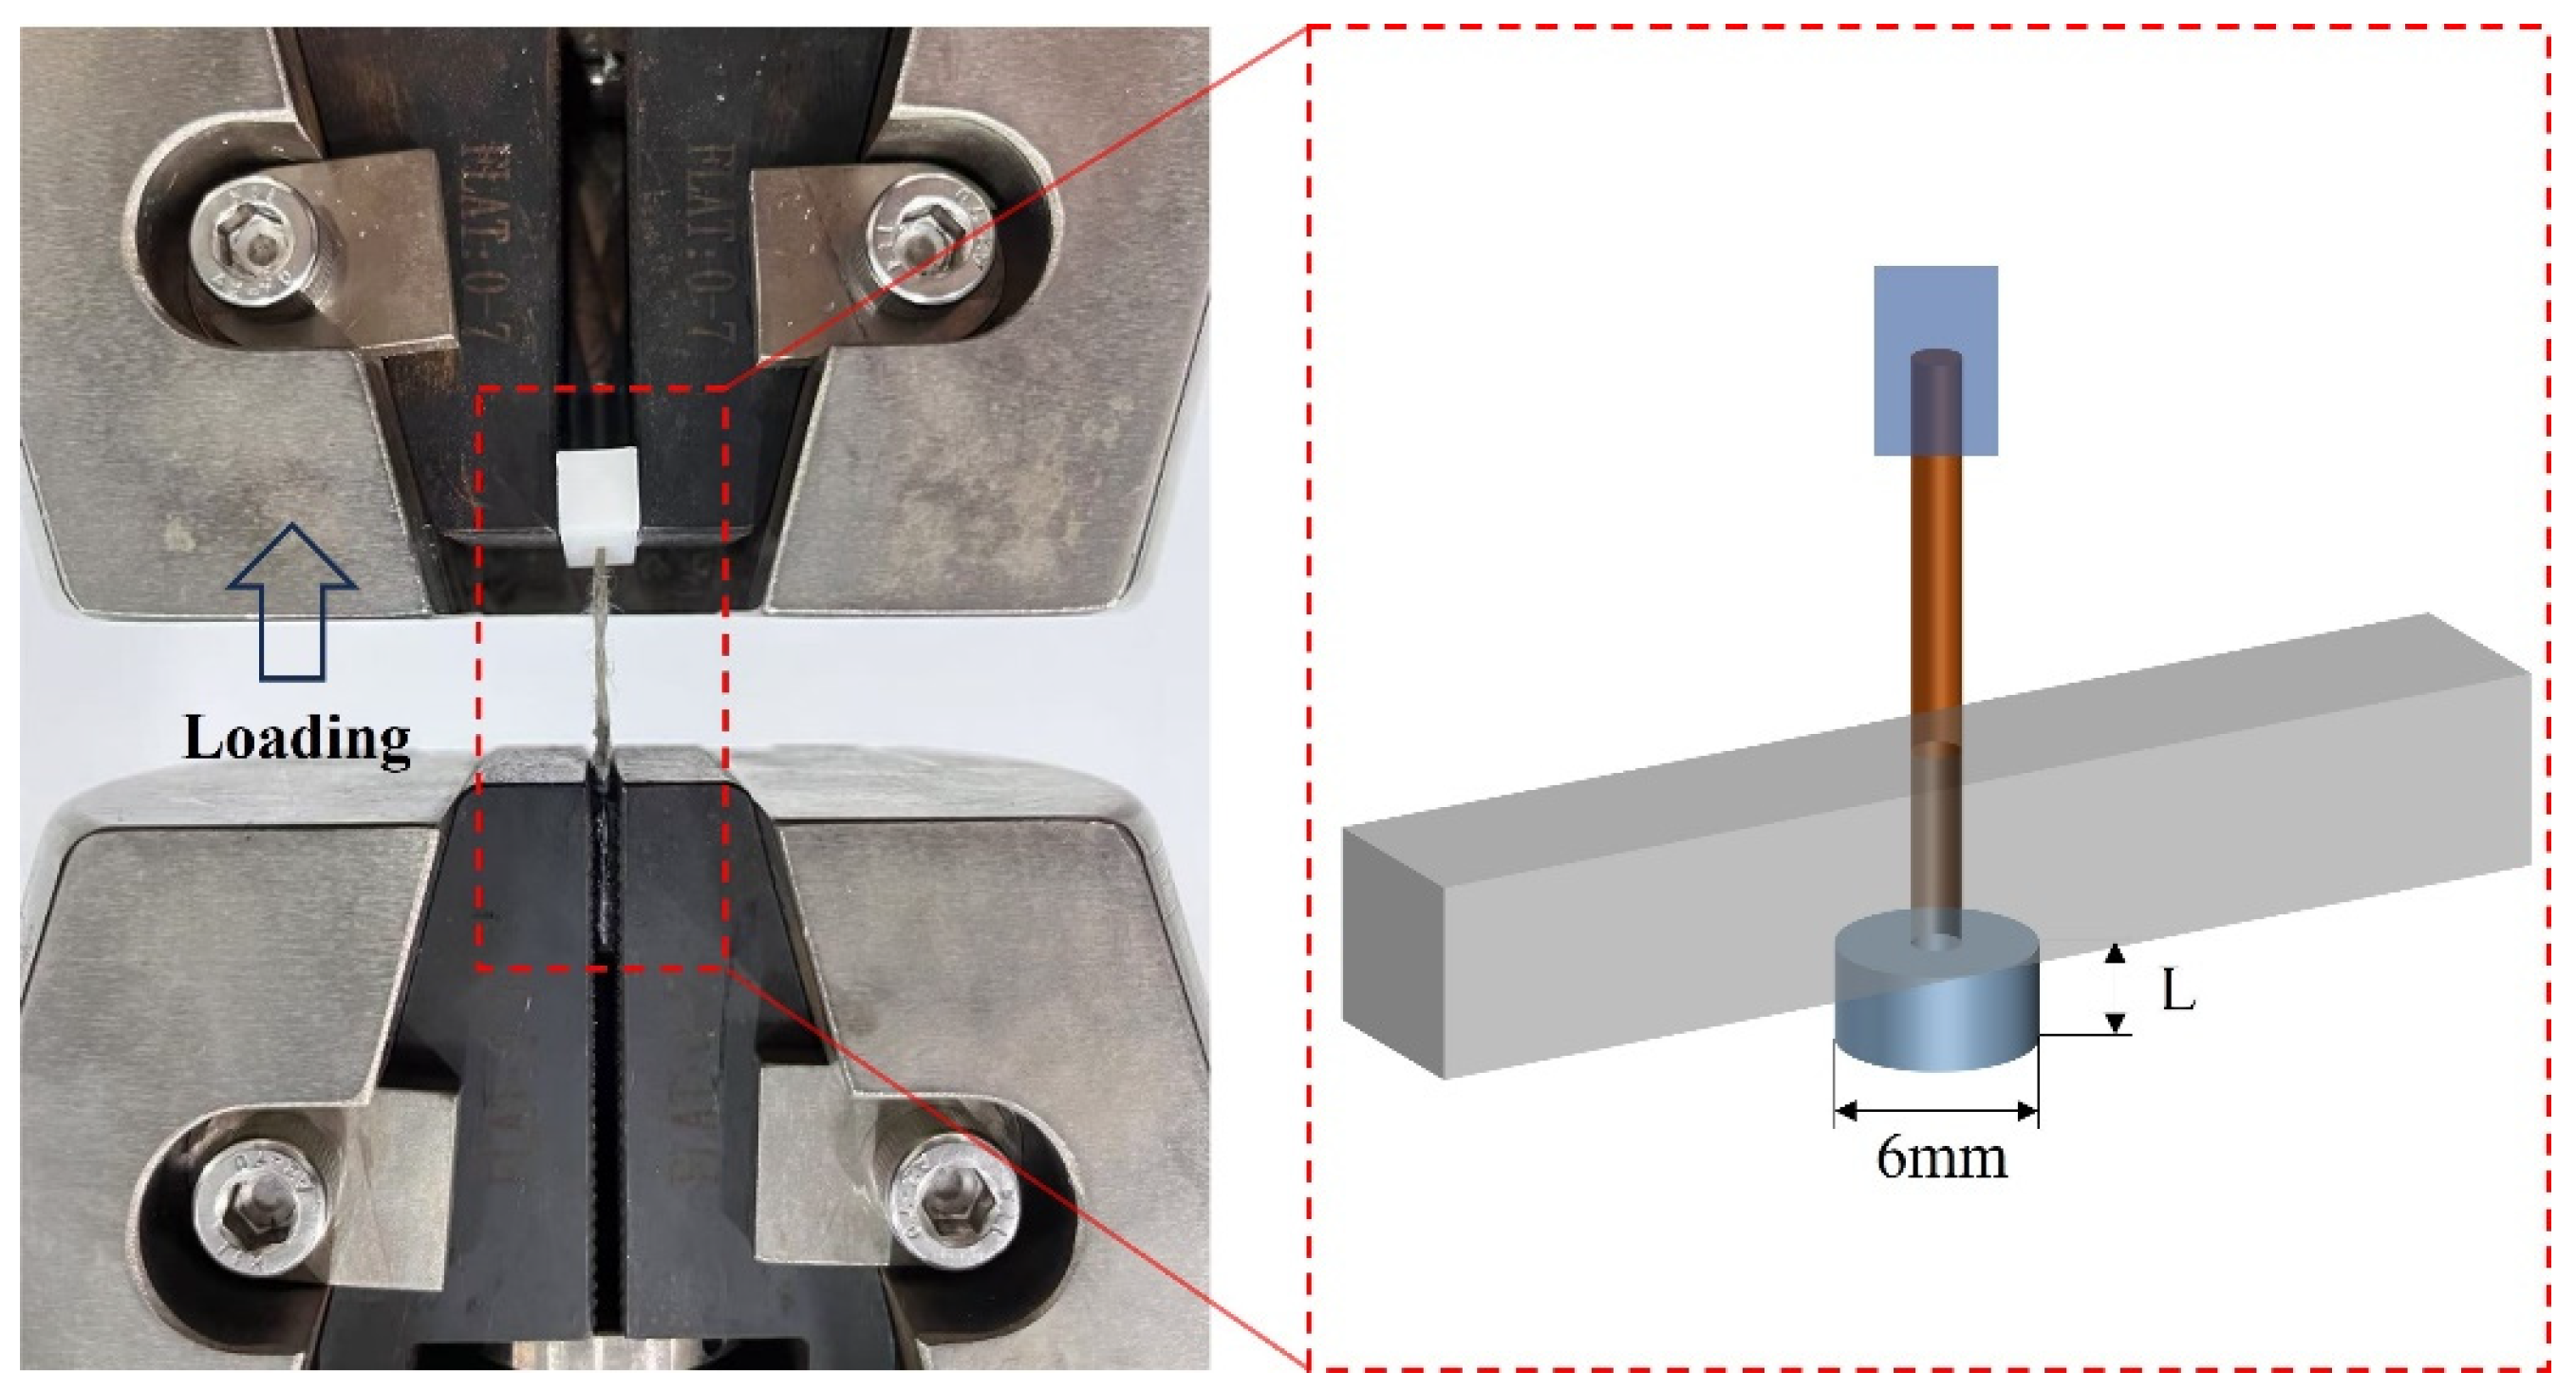
The pull-out test setup incorporated a fixture with a central aperture to allow secure gripping by the testing machine’s jaws, thereby preventing independent matrix deformation. One end of the yarn was embedded in the matrix, while the other end passed through the central aperture of the fixture and was clamped between two thin glass/epoxy composite reinforcement plates to ensure firm gripping, as shown in Figure 4. Following the recommendations of Kelly and Tyson [22], pull-out tests were conducted on individual yarns with varying embedded lengths to determine the critical length of flax yarns in epoxy resin and subsequently calculate the interfacial shear strength (IFSS). The tests were performed using the apparatus described in Section 2.2, with at least 20 valid specimens tested per condition.
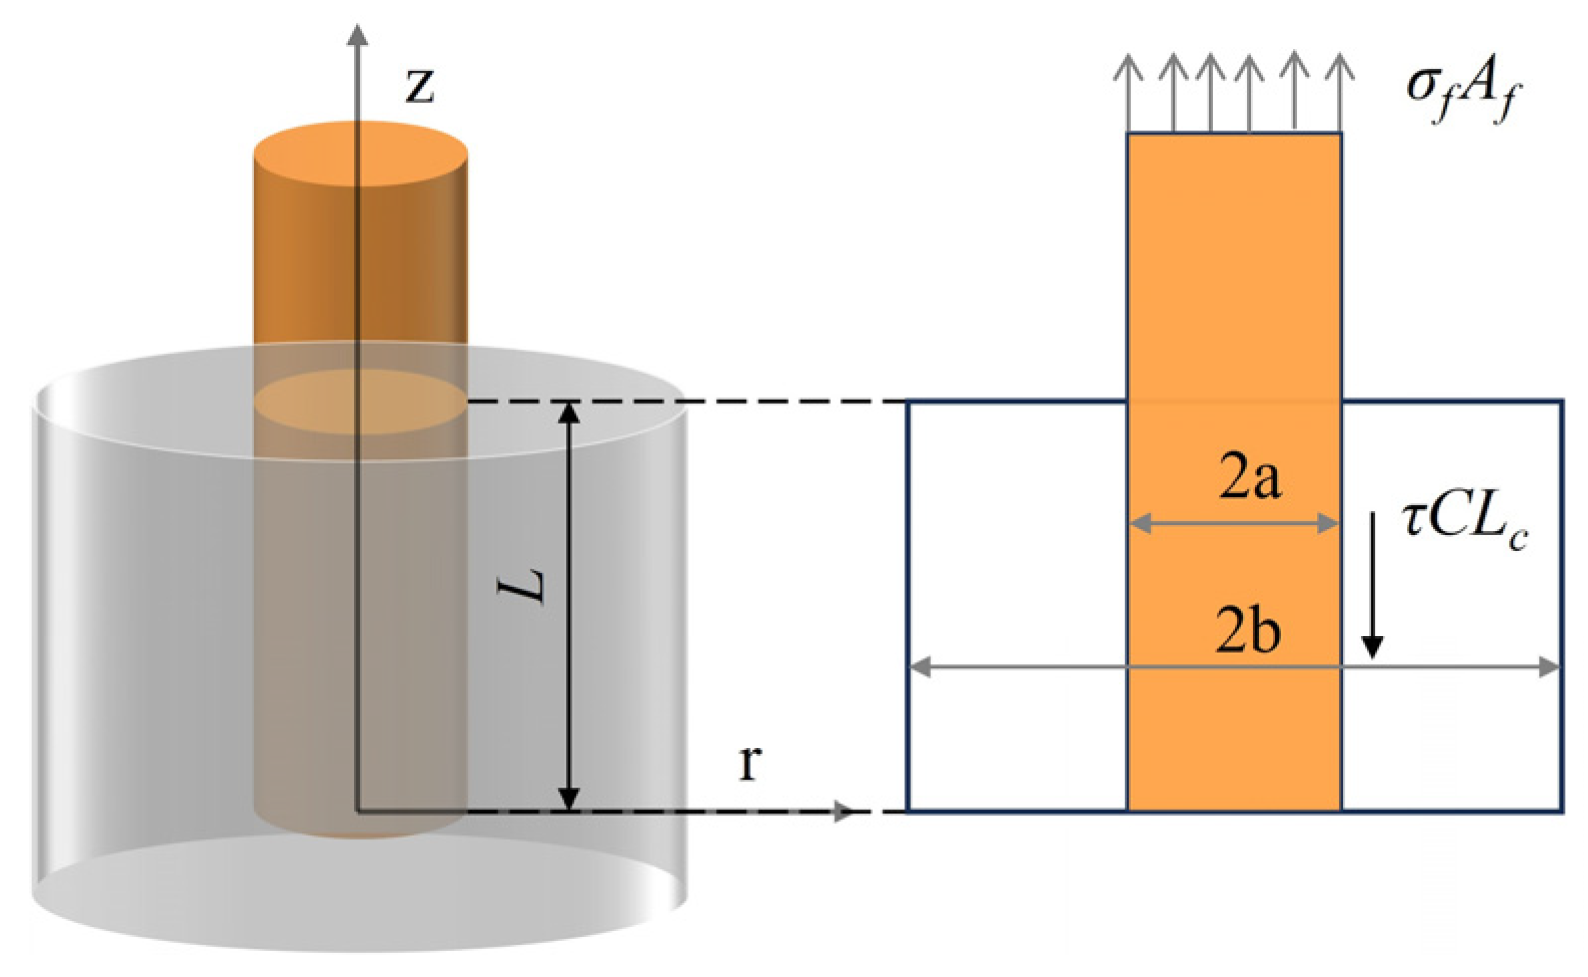
The interfacial shear strength τ (MPa), as calculated by the formula shown in Figure 5, is given by:
τ = P m a x π d L
where P m a x (N) represents the maximum load of the specimen and L (mm) denotes the embedded length of the yarn in the matrix. d (mm) represents the mean yarn diameter.
During the pull-out process, a balance is achieved between the yarn’s tensile strength and interfacial shear resistance, as described by Equation (4). Noorvand et al.; Teklal et al. [23,24]:
F = σ f A f = τ d π L c
The critical embedding length of yarn is calculated as follows:
L c = σ f A f τ d π

2.4. Yarn Appearance Characterization

The surface morphology of prepared flax yarn samples was observed using a three-dimensional ultra-depth video microscope VXH-6000 (Keyence Corporation, Shanghai, China).
For scanning electron microscopy (SEM) analysis, a GeminiSEM500 microscope (ZEISS, Oberkochen, Germany) was employed. To ensure electrical conductivity, the yarn samples were pre-coated with a thin gold layer. To prevent damage from high-energy electron beams, the post-pull-out microscopic morphology of samples with different embedded lengths was evaluated at an accelerating voltage of 3 kV.

2.5. Quasi-Static Nanoindentation Testing

Quasi-static nanoindentation testing was conducted using a nanoindenter (Bruker, Karlsruhe, Germany) equipped with a Berkovich diamond pyramid indenter at 25 °C and 30% humidity. Single-step quasi-static nanoindentation experiments followed a load (25 μN/s)–hold (10 s)–unload (25 μN/s) protocol, with a series of indentations performed at the flax yarn-epoxy resin interface. The elastic modulus and hardness were derived from the load–depth curves using the Oliver and Pharr method [25].

3. Results and Discussion

3.1. Flax Yarn Static Tensile Properties

The tensile properties of most natural fibers exhibit significant scatter due to the substantial variability in measured values. This dispersion can be attributed to the distribution of intrinsic defects within the fibers, including surface irregularities and microstructural heterogeneities. Consequently, the mechanical properties of flax yarns were determined through statistical analysis. Among the most variable parameters is the yarn diameter, which was statistically characterized based on 50-point measurements. The Gaussian probability distribution of flax yarn diameter is defined by the equation:
P ( d ) = 1 2 π σ e ( d μ ) 2 2 σ 2
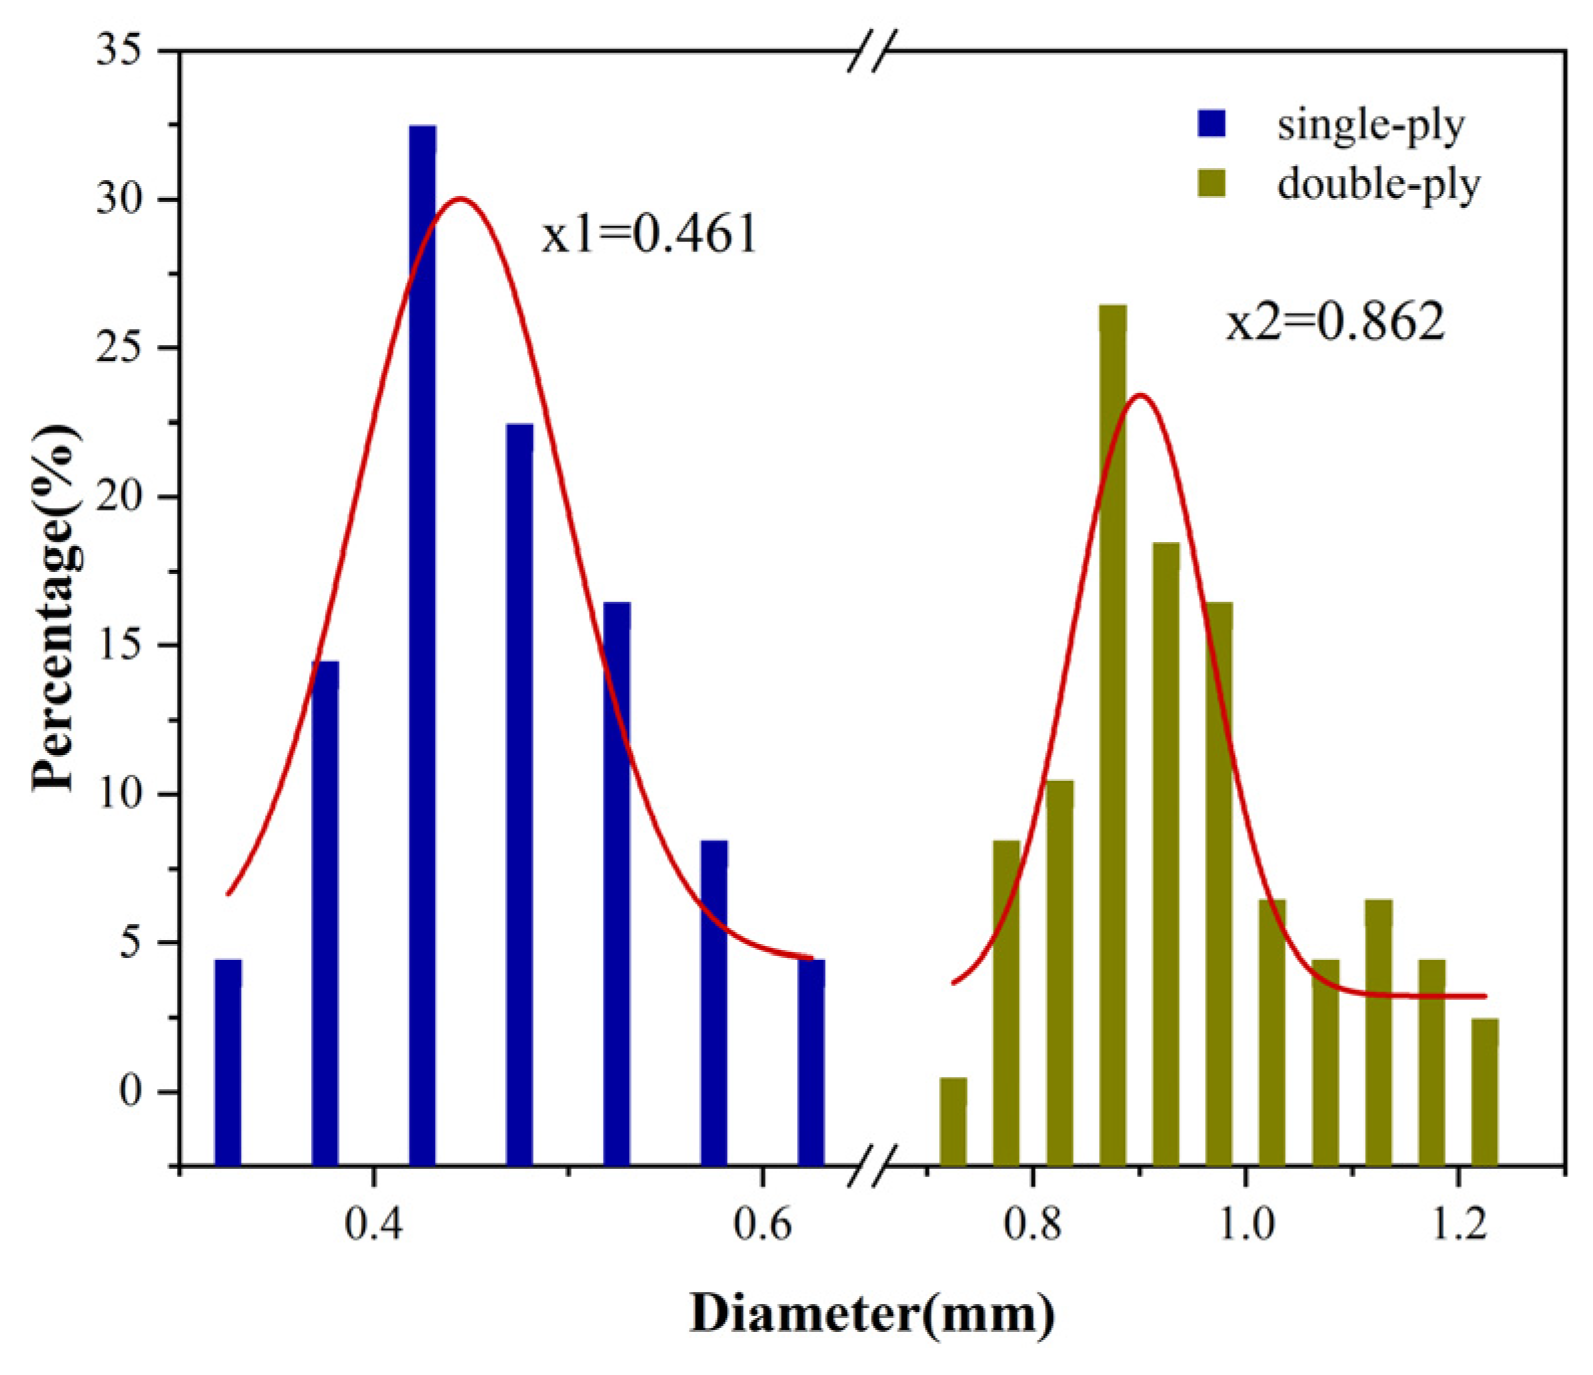
In the equation, d represents the diameter value of flax yarn, μ denotes the distribution mean, and σ2 is the distribution variance. Figure 6 presents the Laplace–Gaussian distribution results for the diameters of single- and double-ply yarns. The diameter distribution of these flax yarns exhibits significant variability: the single-ply yarn has a mean value of 0.461 mm with a standard deviation of 0.070 mm, while the double-ply yarn shows a mean diameter of 0.862 mm and a standard deviation of 0.110 mm. These results confirm the pronounced scattering in measured diameter values, which are used to estimate the cross-sectional area of the yarns under the assumption of a circular geometry. To statistically analyze the dispersion in ultimate stress and Young’s modulus of flax yarns, a two-parameter Weibull distribution was employed. The probability density function (PDF) of this distribution, also known as the cumulative distribution function (CDF) or failure distribution, is defined by Equation (7). This formulation is widely adopted in studies on natural and synthetic monofilaments, such as flax [26], hemp [27] and sisal [28], and has also been applied to artificial bundles of glass [29] and carbon fibers [30].
P ( A ) = 1 e [ A A 0 m A 0 ]
In the equation, P(A) represents the cumulative failure probability, where A is the study variable (e.g., ultimate stress or Young’s modulus), A0 is the scale parameter (characteristic value) associated with A, corresponding to the random variable value at 63.2% cumulative probability. mA0 denotes the shape parameter or Weibull modulus. The primary method for estimating probability density parameters is the linear regression method (graphical approach) based on least squares estimation (LS). Below is a detailed explanation of the methodology.
ln ln 1 1 F = m A 0 ln x m ln A 0
Based on this equation, we can express parameter ln ln 1 1 F as a function of the slope ln x of the linear regression, yielding the Weibull modulus mA0. The intercept of this line enables the determination of the characteristic value A0. The primary challenge in this method lies in obtaining reliable estimates of F (survival probability). The F-values are derived from estimators or empirical ranking indices.
F = i 0.5 N
In this context, N represents the total number of data points, and i denotes the rank of a data point (i.e., the position of the data point in the sorted sequence, ranging from 1 to N.
Figure 7 illustrates the two-parameter Weibull distributions for tensile strength and Young’s modulus, with corresponding parameters listed in Table 1. As the gauge length increases, both single-ply and double-ply yarns exhibit reductions in strength and modulus, a trend also observed in jute and flax fiber bundles [31,32,33,34]. For flax yarns composed of flax fibers, shorter gauge lengths result in a higher proportion of flax fibers spanning from one end of the specimen to the other, causing the tensile properties to align more closely with those of individual flax fibers. Notably, flax elementary fibers have lengths ranging from 4 to 77 mm, with an average of 33 mm [35]. The characteristic tensile strength of single-ply yarns decreases from 430 MPa to 365 MPa, while double-ply yarns decline from 288 MPa to 253 MPa. Single-ply yarns (Figure 7a) display a broader strength distribution, indicating significant variability in tensile performance, likely due to uneven fiber alignment or stress concentration caused by localized defects. In contrast, double-ply yarns (Figure 7c) exhibit narrower strength distributions, demonstrating enhanced stability through load-sharing among multiple fibers, which mitigates the impact of local defects. The increased fiber count in double-ply yarns requires higher loads for fracture, a phenomenon attributed to their twisted structure. In such configurations, only a subset of fibers is initially tensioned, while others remain free to reorient before strain develops. Higher twist levels enhance yarn strength by improving fiber cohesion and compactness during spinning, whereas low twist increases susceptibility to fiber slippage and failure. Young’s modulus distributions for single-ply yarns (Figure 7b) also show wider variability, reflecting inconsistent elastic behavior. Conversely, double-ply yarns (Figure 7d) exhibit tighter modulus distributions, suggesting that the double-ply structure homogenizes elastic properties through enhanced fiber interactions. The strength advantage of single-ply yarns fundamentally arises from their quasi-axial fiber architecture, enabling near-ideal load transfer. Conversely, double-ply twisting induces dual penalties: (1) fiber off-axis orientation reduces effective loading capacity; (2) inter-bundle voids initiate stress concentrations. This explains the reliability superiority reflected by higher Weibull modulus m in single-ply yarns.

3.2. Effect of Embedding Length on Yarn Pull-Out Behavior

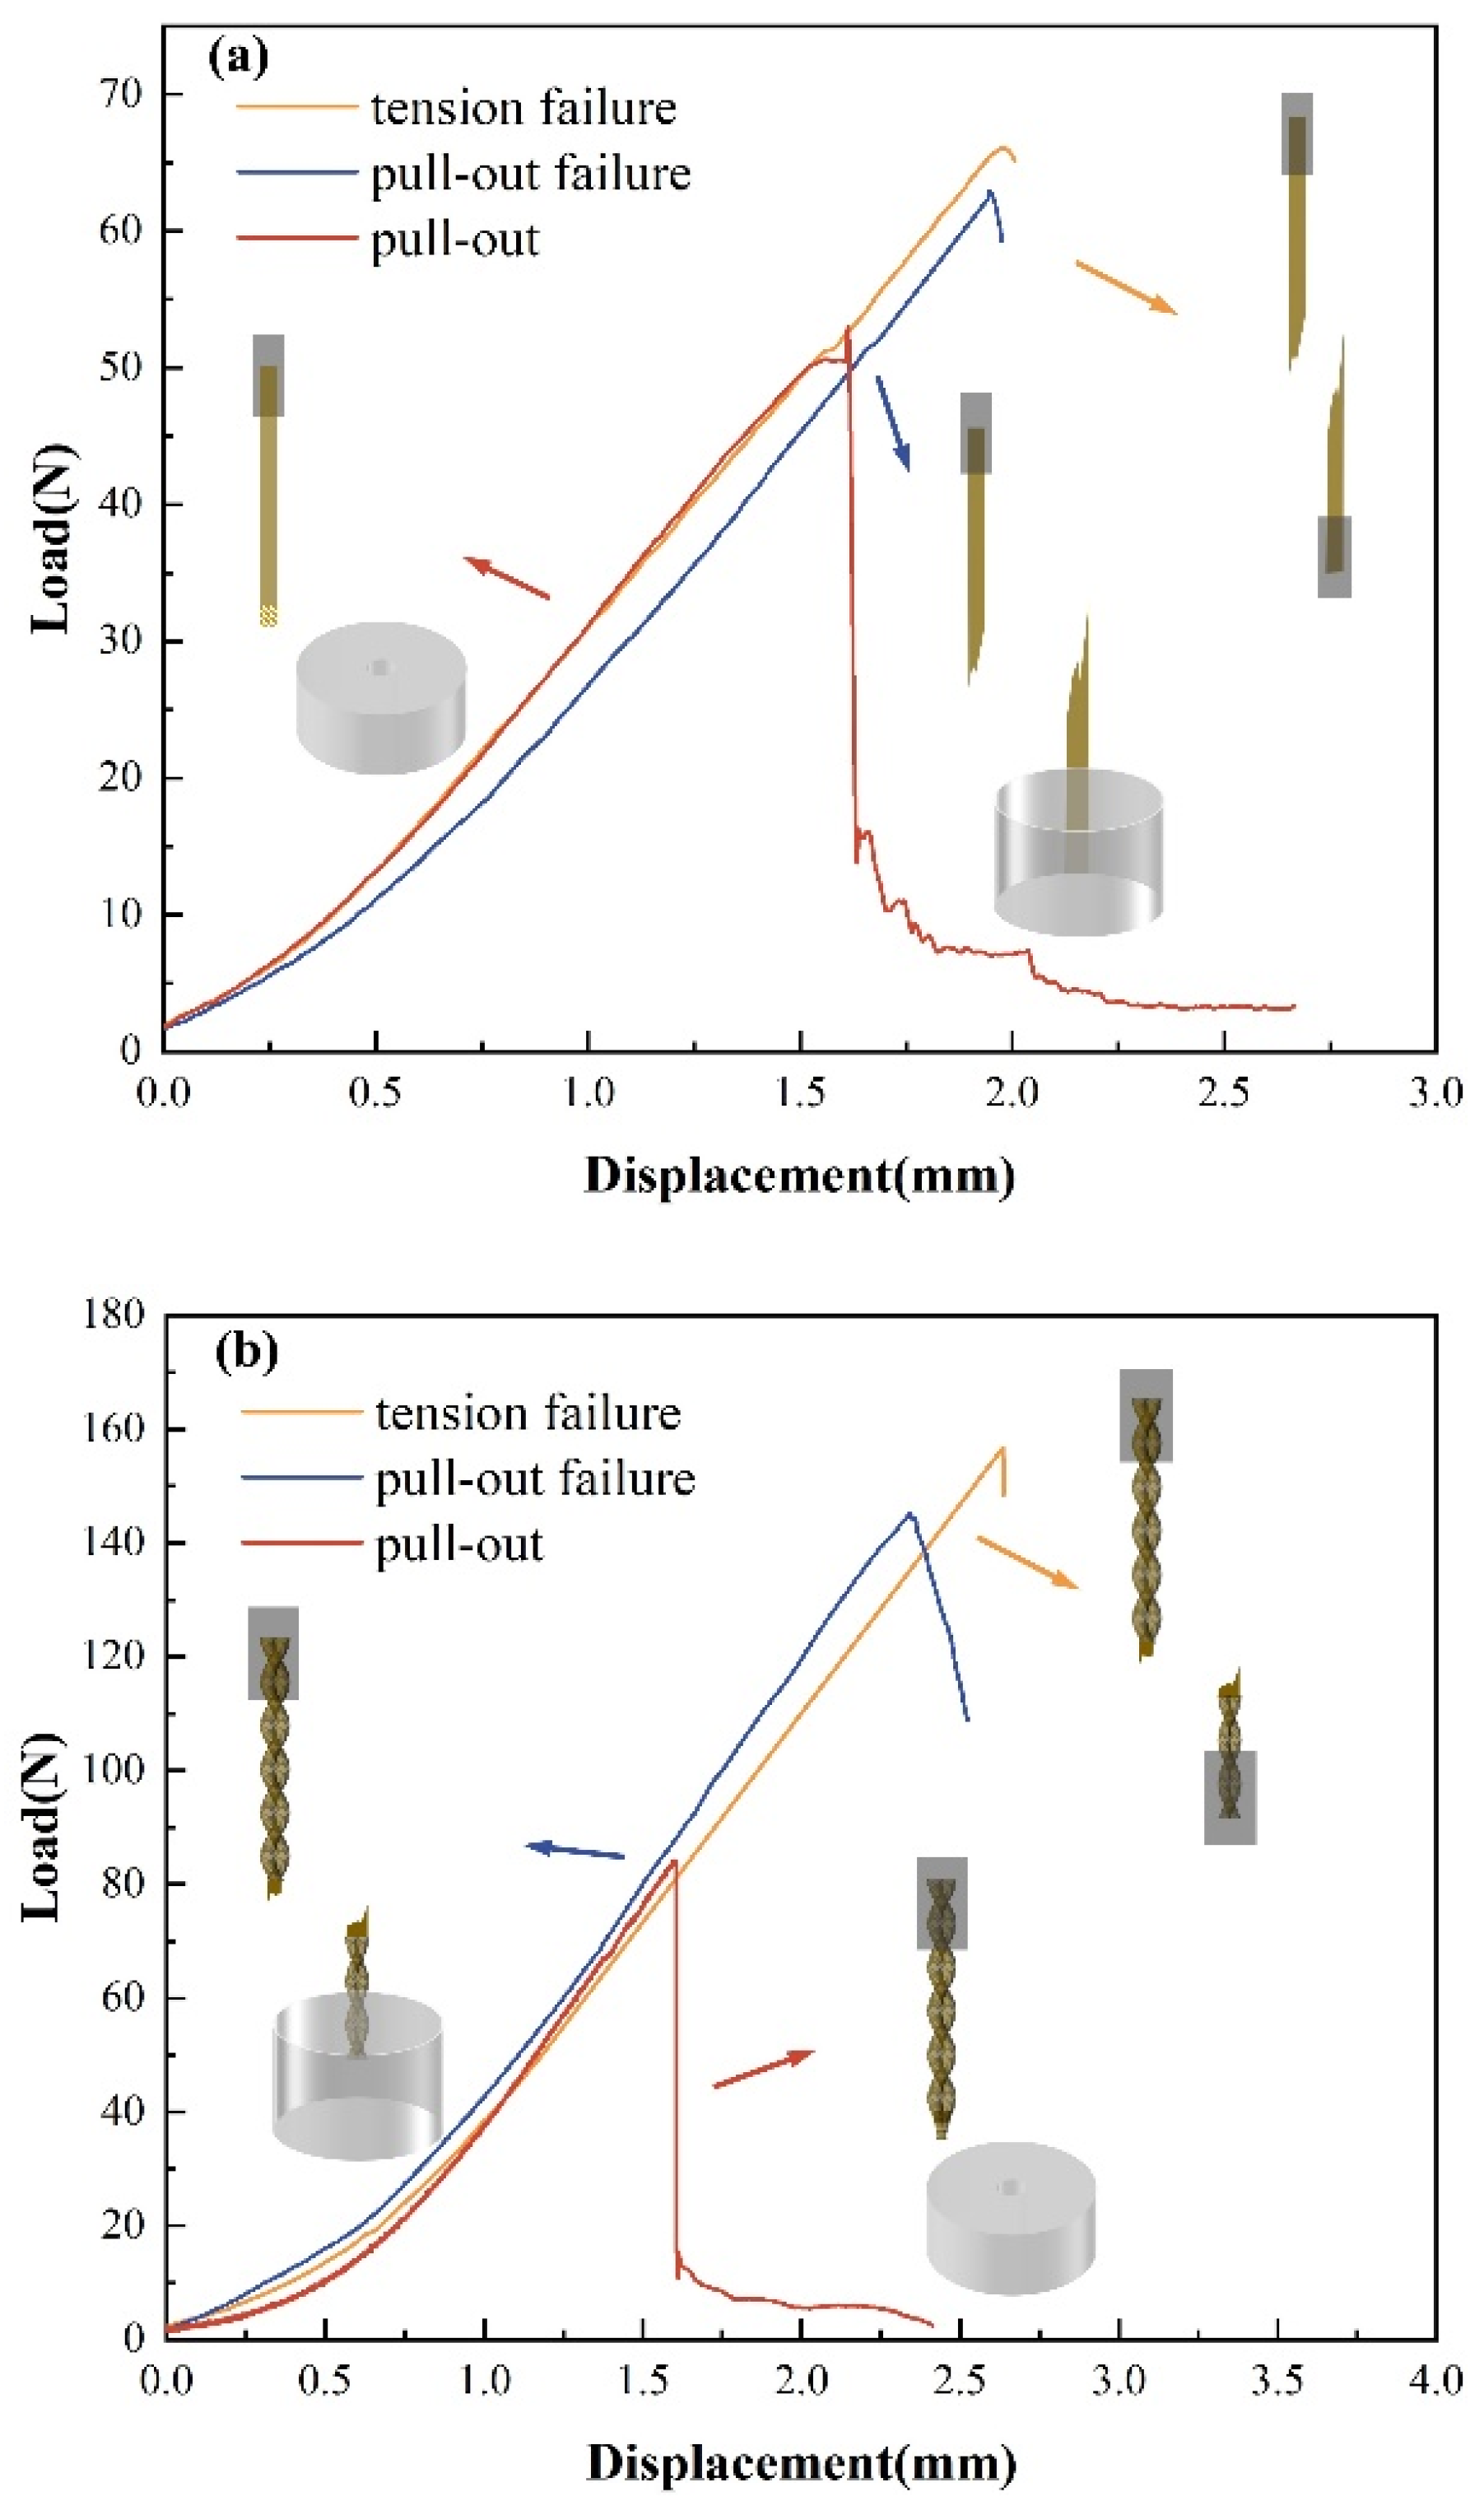
In pull-out tests, the embedded length is a critical parameter influencing the failure modes of yarns. Figure 8 illustrates the effects of varying embedded lengths on the fracture patterns and tensile behavior of yarns during pull-out tests. Yarns exhibit two failure modes: (1) yarn pull-out caused by interfacial debonding between fibers and the matrix, and (2) yarn rupture when the embedded length exceeds a critical threshold. For specific embedded lengths, if the interfacial bond load along the yarn is lower than the ultimate load, the yarn is pulled out without rupture. Conversely, when the embedded length is sufficiently large to prevent interfacial shear, yarn rupture dominates without interfacial debonding, aligning with the tensile failure behavior of single yarns. The failure mode competition fundamentally reflects the battle between interfacial shear capacity and yarn intrinsic strength When L < Lc interfacial shear cannot trigger yarn fracture, causing pull-out. Conversely, yarn rupture occurs when interfacial strength is fully mobilized.
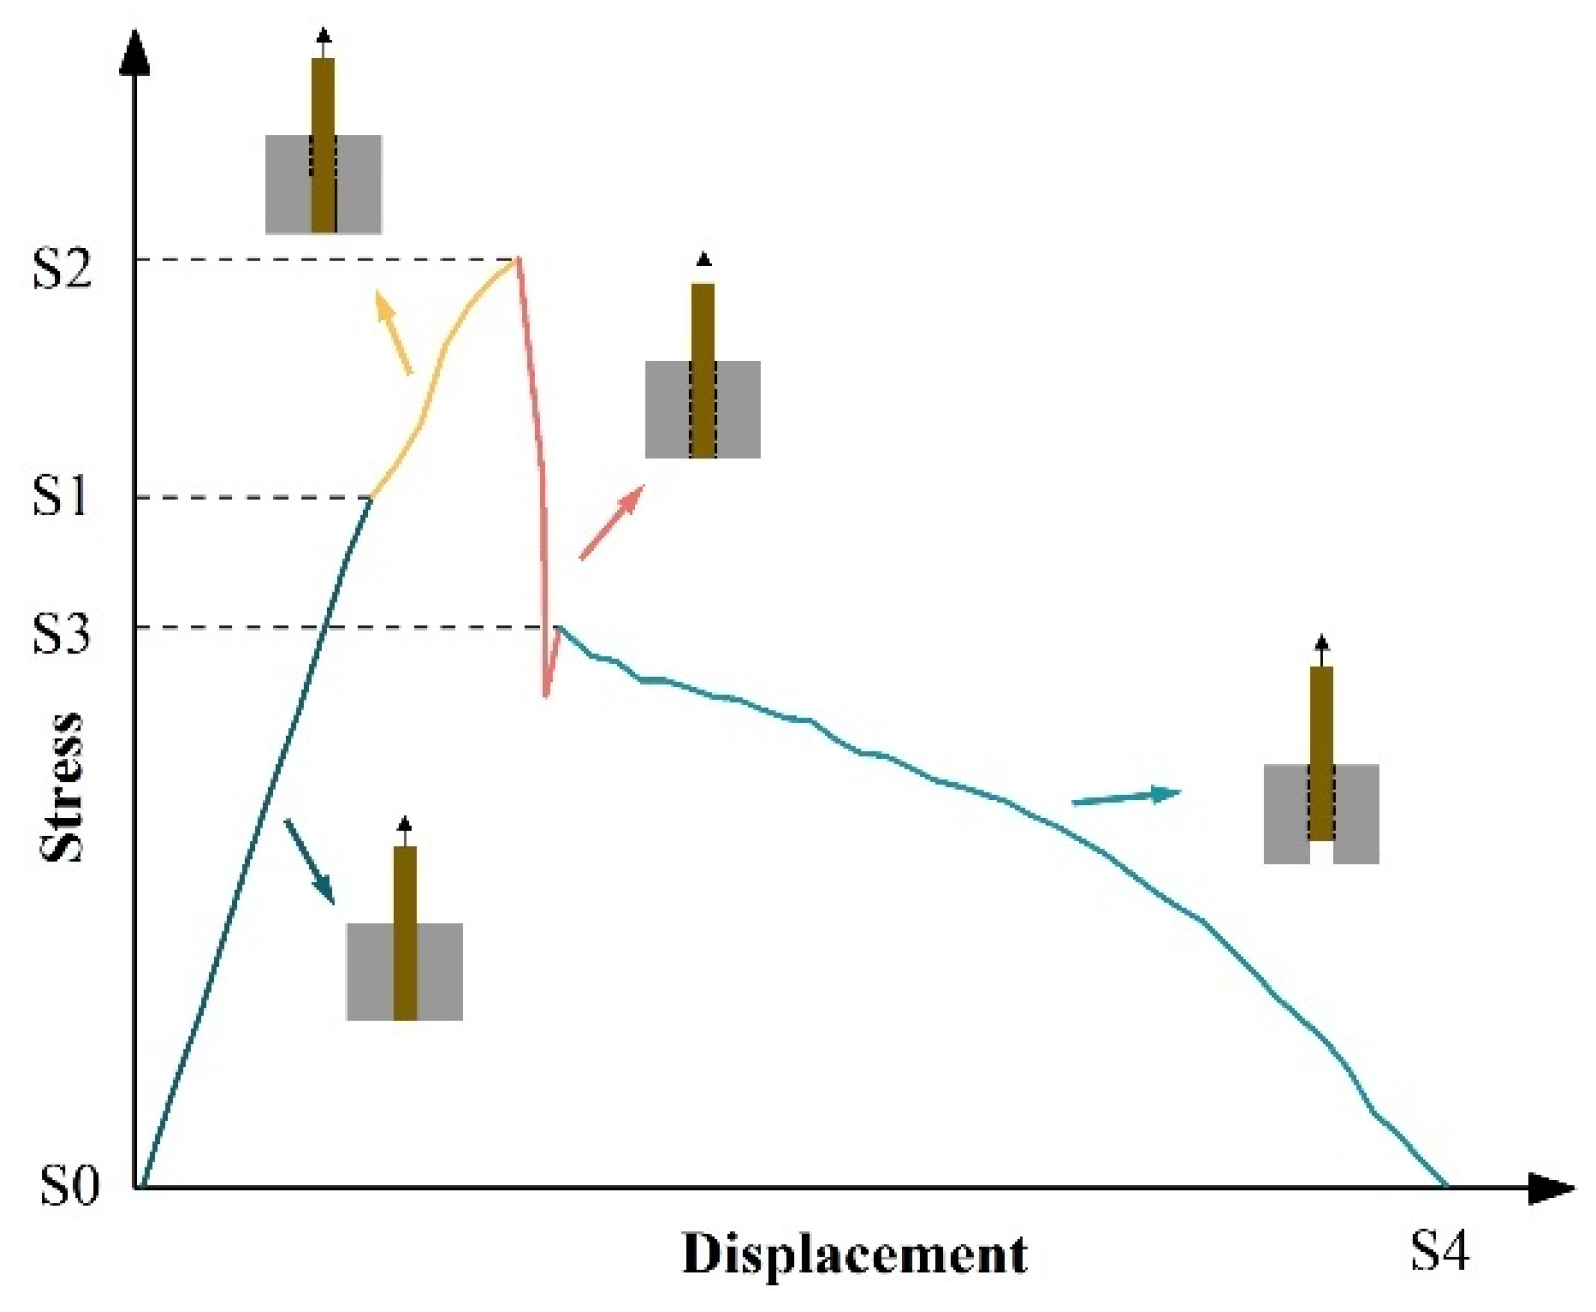
Figure 9 summarizes the typical load–displacement curve of a single fiber pull-out test [36]. The pull-out process comprises four distinct stages: (1) Elastic Stage (S0–S1): Linear load–displacement relationship dominated by elastic deformation of the fiber–matrix interface. (2) Partial Debonding to Maximum Debonding (S1–S2): Progressive interfacial debonding with nonlinear load increase due to localized matrix cracking and fiber–matrix slip. (3) Maximum Debonding to Complete Debonding (S2–S3): Full interfacial separation accompanied by load drop, transitioning to frictional sliding. (4) Sliding Friction Stage (S3–S4): Residual load sustained by interfacial friction and mechanical interlocking, exhibiting steady-state sliding. However, the pull-out load–displacement curve for flax yarns involves three simplified stages (Figure 8).
Significant differences in peak load and displacement are observed under different failure modes. Pull-out tests on yarns reveal that the initial portion of the load–displacement curve is not linear but gradually increases its slope before becoming linear, due to fiber realignment and void formation between fibers twisted into flax yarns. The second stage is characterized by an elastic quasi-linear region with a steep slope, used to determine the yarn’s Young’s modulus, where the yarn’s intrinsic strength plays a crucial role. The third stage typically exhibits two distinct failure modes: (1) yarn pull-out, where the entire embedded yarn segment is extracted from the matrix, causing an instantaneous load drop and complete separation from the matrix, with residual frictional resistance gradually decreasing to zero; and (2) partial yarn fracture, where stress concentration induces localized fiber damage, resulting in a sudden load drop, while the unfractured portion continues to resist pull-out loads.

3.3. Critical Embedding Length of Yarn

The critical embedded length (Lc) is a key parameter describing the minimum length required for fibers (or yarns) to effectively transfer maximum shear forces at the fiber–matrix interface before complete debonding or fractur [37]. It serves as an essential indicator for studying interfacial mechanical properties in composite materials, particularly in fiber pull-out tests. The tensile properties of single and double flax yarns (Table 1) combined with Equation (5) and the interfacial shear strength described in Section 3.4.1 determine the theoretical embedded lengths in epoxy resin (1.42 mm and 2.77 mm). A strong correlation between embedded length and peak load during pull-out is observed (Figure 10). Linear regression of the data reveals the critical embedded lengths for single and double flax yarns (1.49 mm and 2.71 mm), confirming consistency between calculated and experimental data.
The embedded length (L) of yarns significantly affects load transfer efficiency. When L < Lc, the interface cannot fully transmit the tensile load of the yarn, leading to fiber slippage and debonding before reaching the fiber’s fracture strength. At L = Lc, the interface just adequately transfers the yarn’s fracture load, fully utilizing interface strength, and the yarn fractures under maximum tensile stress. For L > Lc, the contribution of interface strength saturates, and excessive embedded length fails to further improve tensile performance, reducing material efficiency. Thus, Lc represents the minimum fiber length at which load transfer efficiency between fiber and matrix is maximized, depending on interfacial shear strength (IFSS) and fiber tensile strength. Selecting an appropriate embedded length enhances load transfer efficiency. Additionally, the critical fiber length (Lc) plays a vital role in improving mechanical properties such as strength and stiffness of composite materials.

3.4. Interface Adhesion Properties

3.4.1. Interfacial Shear Strength

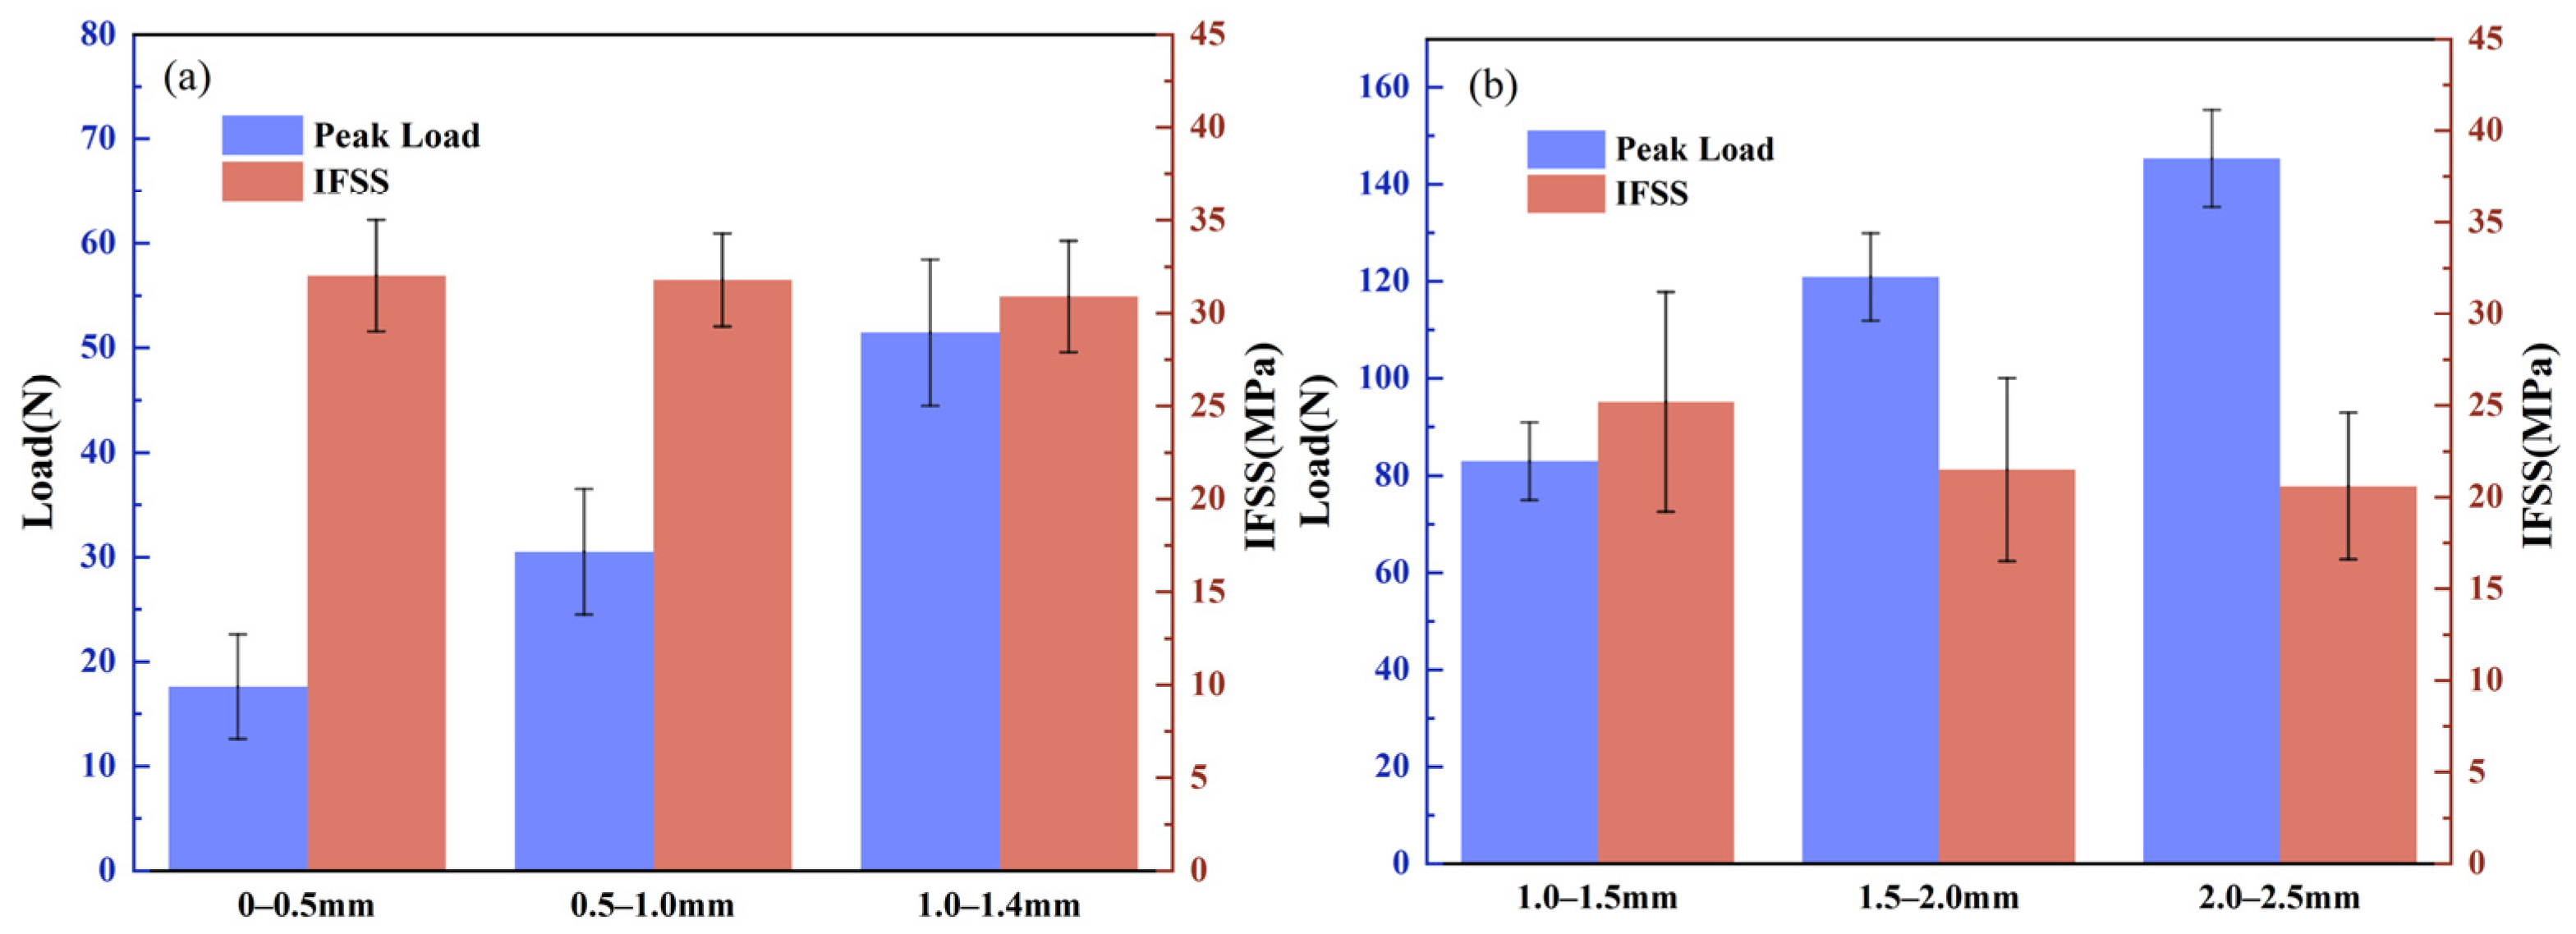
Interfacial shear strength (IFSS) is used to evaluate the bonding performance between fibers and matrices, describing the maximum shear stress the interface can withstand under shear forces. It is commonly used to assess interfacial bond strength and load transfer efficiency between fibers and matrices. Higher IFSS values indicate stronger bonding performance, where high IFSS signifies efficient load transfer and effective utilization of fiber strength. Conversely, low IFSS often leads to interfacial failure (fiber slippage from the matrix), while very high IFSS may result in fiber fracture itself. Below the critical embedded length (Lc), the peak load during yarn pull-out increases with embedded length. As shown in Figure 11, for single-filament yarns, peak loads are 17.62 N (0–0.5 mm), 30.52 N (0.5–1.0 mm), and 51.49 N (1.0–1.5 mm). In double-filament yarns, peak loads are 83.43 N (1–1.5 mm), 121.23 N (1.5–2 mm), and 145.45 N (2–2.5 mm). Increased embedded length indicates greater contact area between yarn and matrix, requiring more force for extraction. However, as embedded length increases, the IFSS values for single-filament yarns are 32.03 MPa, 31.79 MPa, and 30.90 MPa, while those for double-filament yarns are 25.21 MPa, 21.51 MPa, and 20.61 MPa, showing no significant difference. The obtained IFSS values significantly exceed those reported for untreated natural fiber composites, such as 6.6 MPa for sisal/epoxy [15] and 4–18 MPa for NaOH-treated ramie fibers [14]. However, they remain lower than synthetic fiber composites (typically 40–80 MPa for glass/epoxy), highlighting both the progress and remaining challenges in natural fiber composite development. This performance gap can be attributed to the hierarchical structure of flax yarns, which differs fundamentally from the homogeneous structure of synthetic fibers. Although double-filament yarns offer higher tensile strength, their twisted structure may cause uneven interfacial contact, local gaps, or weaker interface bonding regions, reducing overall IFSS. In contrast, single-filament yarns experience more direct stress transfer during pull-out, resulting in higher IFSS values.

3.4.2. Interfacial Stiffness Modulus and Stiffness

To quantify the interfacial properties of composite materials, single-step nano-indentation tests were employed to obtain load–depth curves at the interface between flax yarn and epoxy resin (Figure 12), reflecting the mechanical response behavior of the composite interface at the nanoscale. All curves exhibited distinct elastic-plastic deformation characteristics: the initial stage showed an approximately linear increase in load with displacement, indicating high elastic responsiveness of the material at the early indentation stage. Subsequently, the curves deviated from linearity, signifying significant enhancement of plastic deformation.
Based on the Oliver and Pharr method, the modulus (2936 MPa) and hardness (124.27 MPa) derived from the load–depth curves were higher than the resin modulus (2239 MPa), demonstrating that the presence of yarn significantly enhanced the overall mechanical properties of the interfacial region. Yarns, typically composed of aligned fibers with high modulus and hardness, not only provide support under loading but also transfer stress through the interface, inhibiting plastic deformation of the resin in the indentation area. At the yarn-resin interface, the epoxy resin may undergo microstructural changes due to fiber wetting effects, such as forming denser cross-linked networks or residual stress regions, which may result in higher local modulus and hardness near the interface.

3.4.3. Fracture Characteristics and Interfacial Failure Mechanisms

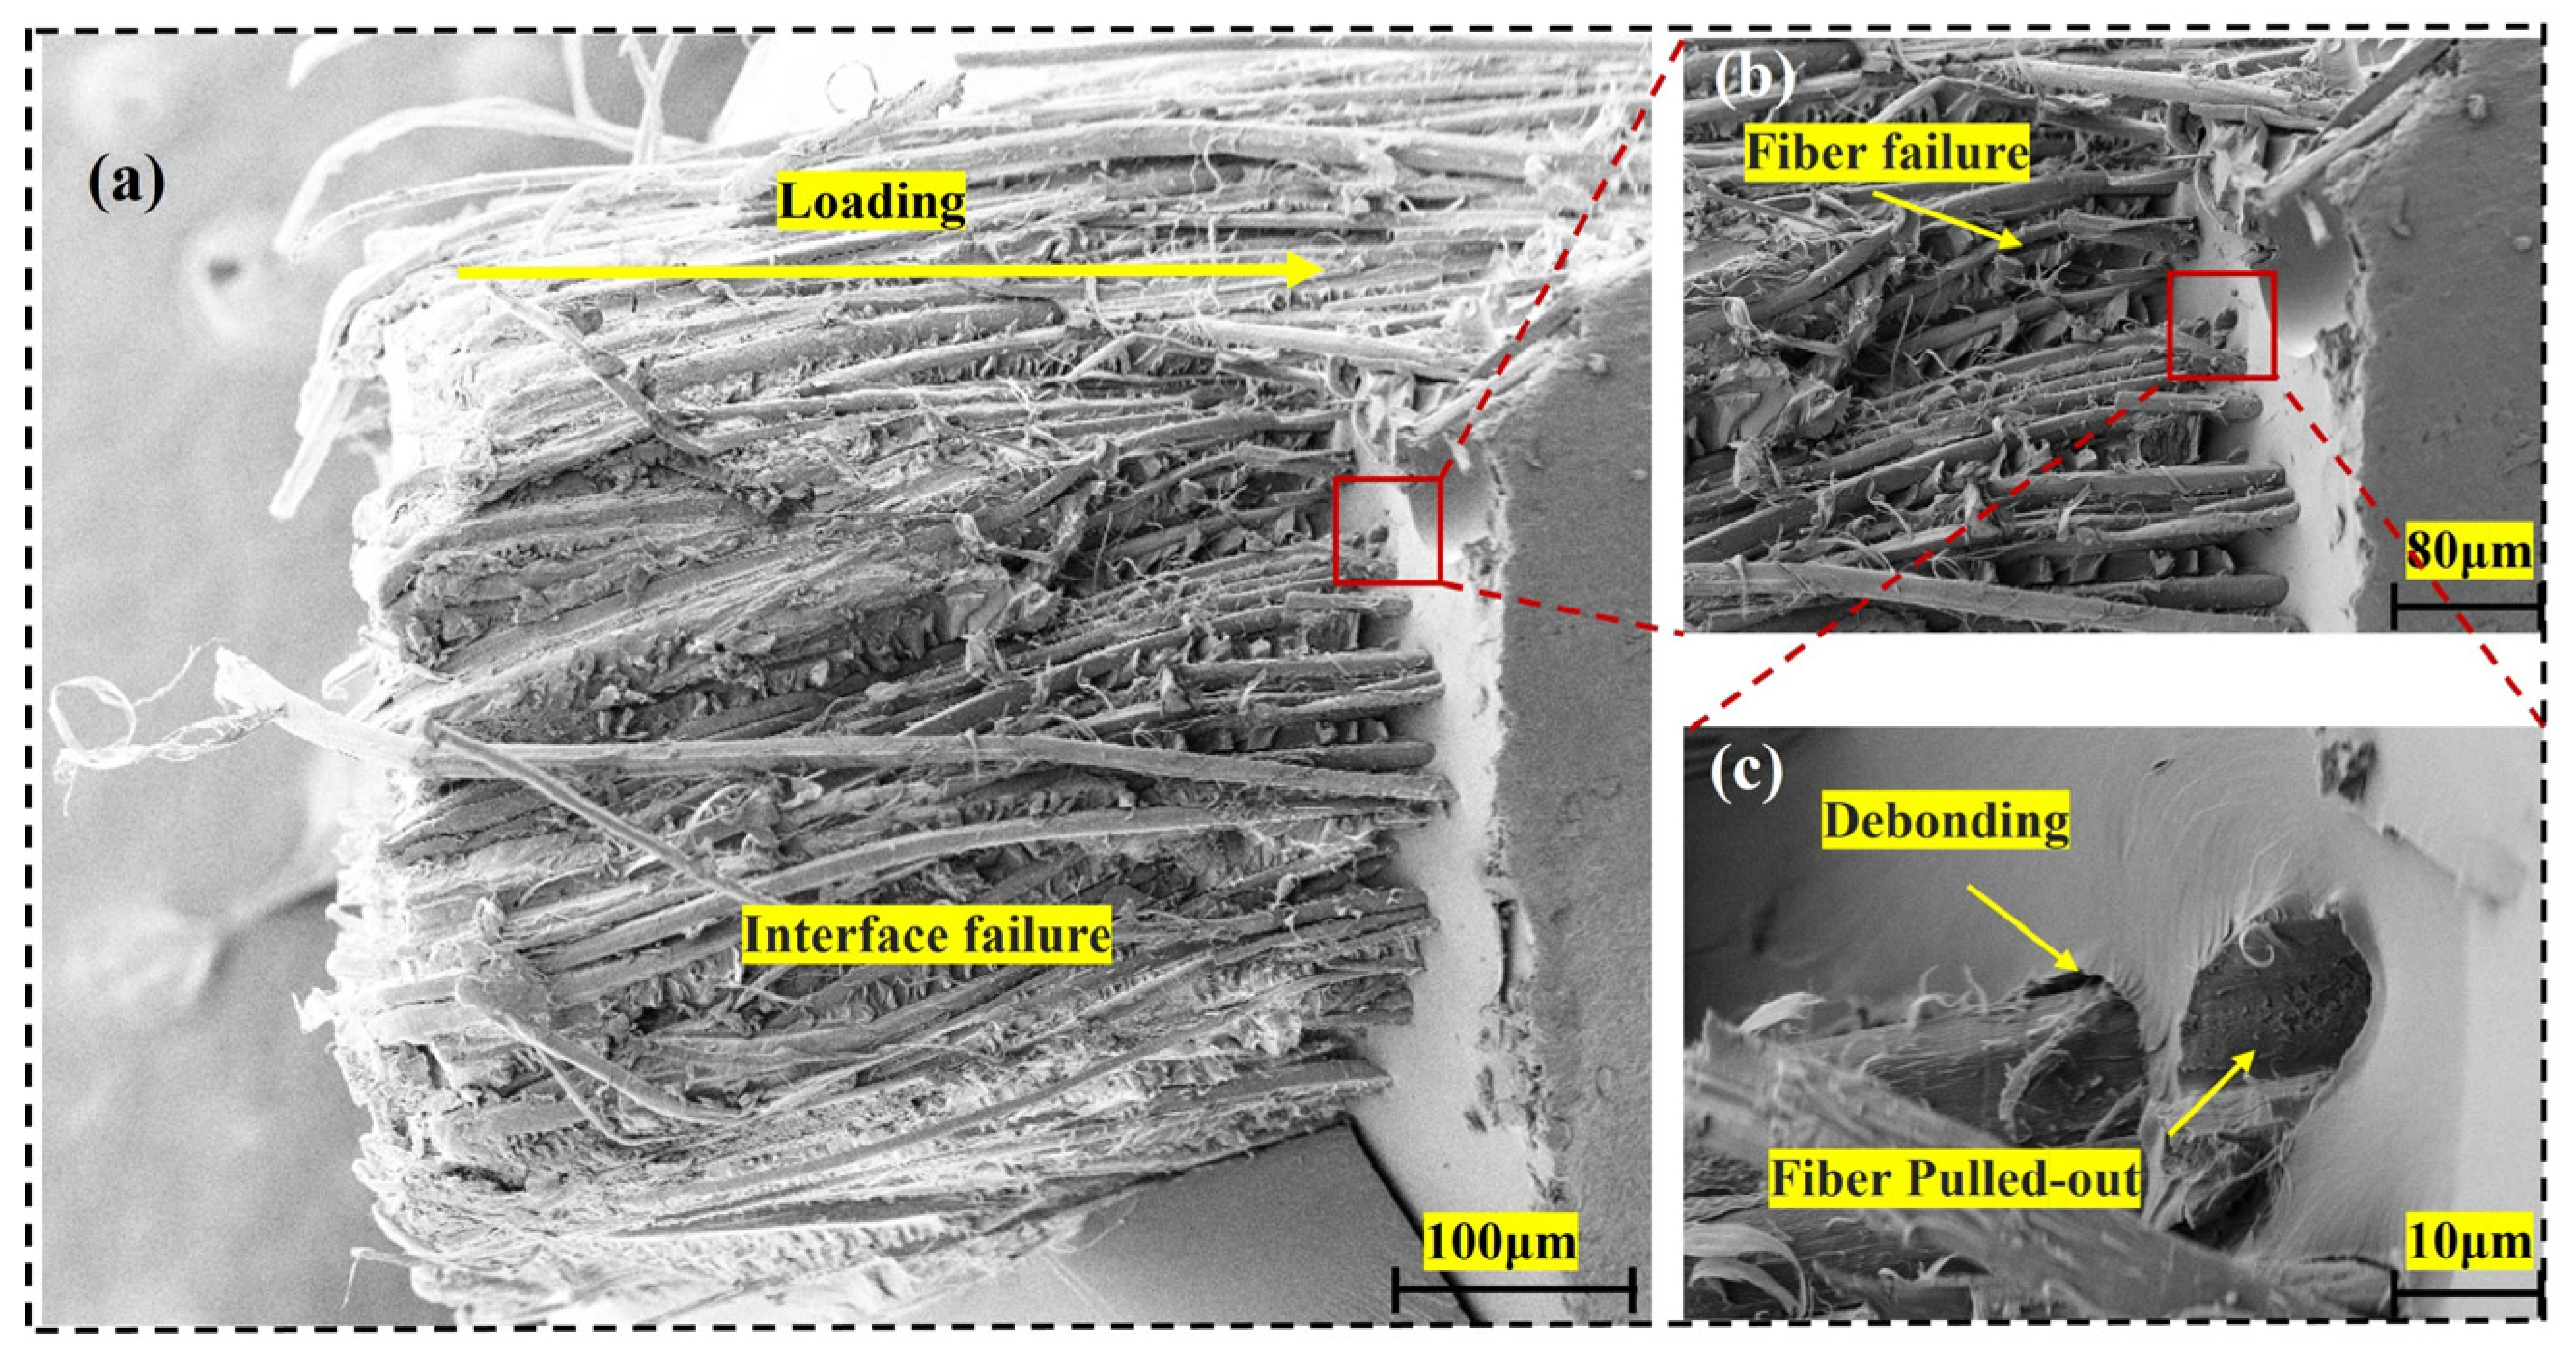
The primary failure characteristic in pull-out tests is interfacial debonding between flax yarn and epoxy resin, as demonstrated by the overall fracture morphology of a single flax yarn extracted from an epoxy matrix in Figure 13a. Clear evidence of interfacial failure is observed, including interface separation, fiber pull-out, and localized fiber breakage. This indicates insufficient interfacial bond strength between the fiber and matrix, resulting in typical interfacial failure behavior during pull-out. The macroscopic fracture morphology clearly shows interfacial failure as the dominant damage mode, with extensive fiber exposure and partial or complete fiber pull-out from the matrix, revealing weak interfacial adhesion and ineffective load transfer. The main reasons for interfacial failure may include inadequate fiber surface wettability or low chemical/physical bonding strength between epoxy resin and the fiber. Figure 13b displays the fracture characteristics of localized fibers, showing distinct fracture marks at the fiber ends, indicating fiber breakage due to reaching ultimate tensile stress during pull-out. The presence of fiber fractures suggests that while individual fibers may have high load-bearing capacity, overall performance is constrained by the balance between interfacial bond strength and fiber strength. Figure 13c illustrates fiber debonding and pull-out features, with a smooth fiber–matrix interface and absence of matrix material residue, indicating insufficient adhesion. Cavities remaining in the matrix after fiber slip further demonstrate low interfacial bond strength, leading to reduced energy dissipation during pull-out.
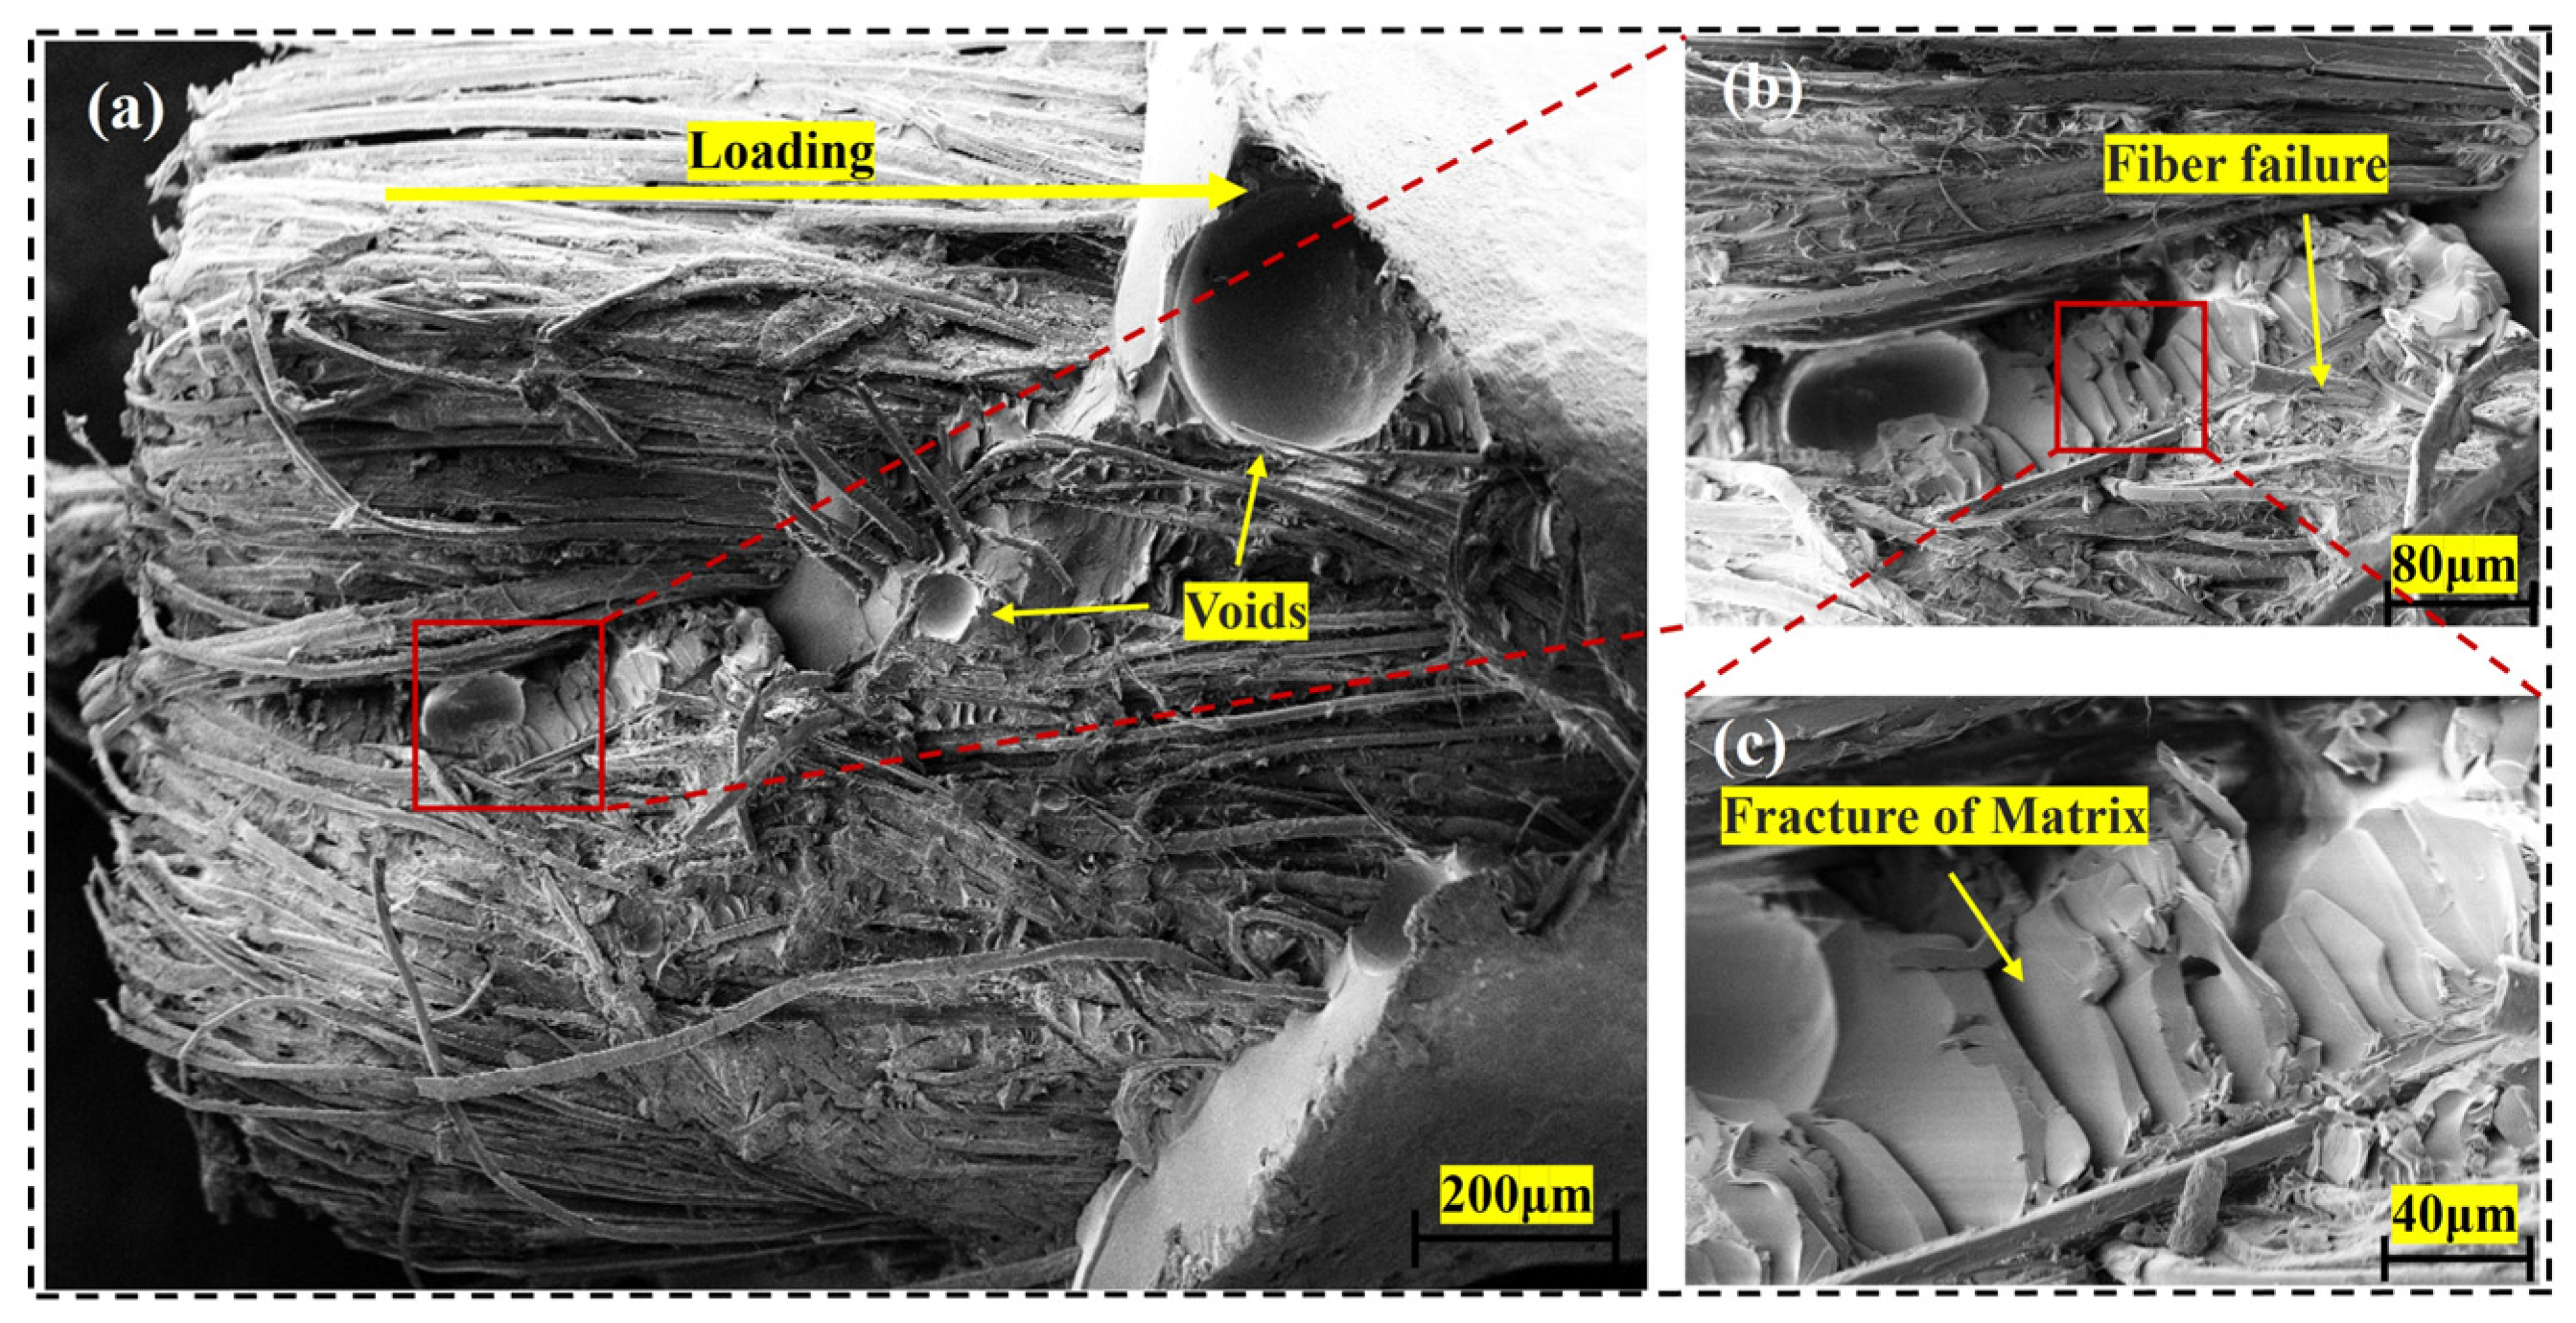
Figure 14a shows the overall fracture morphology of a double-filament flax yarn pulled out from an epoxy resin matrix, highlighting multiple failure characteristics associated with interfacial bond failure during pull-out, including interfacial voids, fiber breakage, and matrix fracture. These failures indicate the complex damage mechanisms of fiber-reinforced composites under external loading. At the macroscopic level, distinct interfacial voids are visible at the fiber–matrix interface, suggesting potential issues with inadequate wetting or incomplete bonding during curing. The presence of interfacial voids significantly reduces load transfer efficiency, serving as a critical factor contributing to interfacial failure. The magnified region in Figure 14b reveals detailed fracture features of the fibers. Clear fracture morphologies indicate that some fibers exceeded their ultimate tensile strength during pull-out, leading to localized breakage. This suggests that while individual fibers may possess high load-bearing capacity, the overall performance is limited by insufficient interfacial bonding and stress distribution. Figure 14c demonstrates the microscale characteristics of matrix fracture. The epoxy resin matrix fractures along the path of fiber extraction, exhibiting relatively regular fracture surfaces. This indicates that the matrix experienced significant stress concentration during loading, ultimately failing in a brittle manner. The occurrence of matrix fracture may be attributed to the insufficient toughness of the resin material itself.
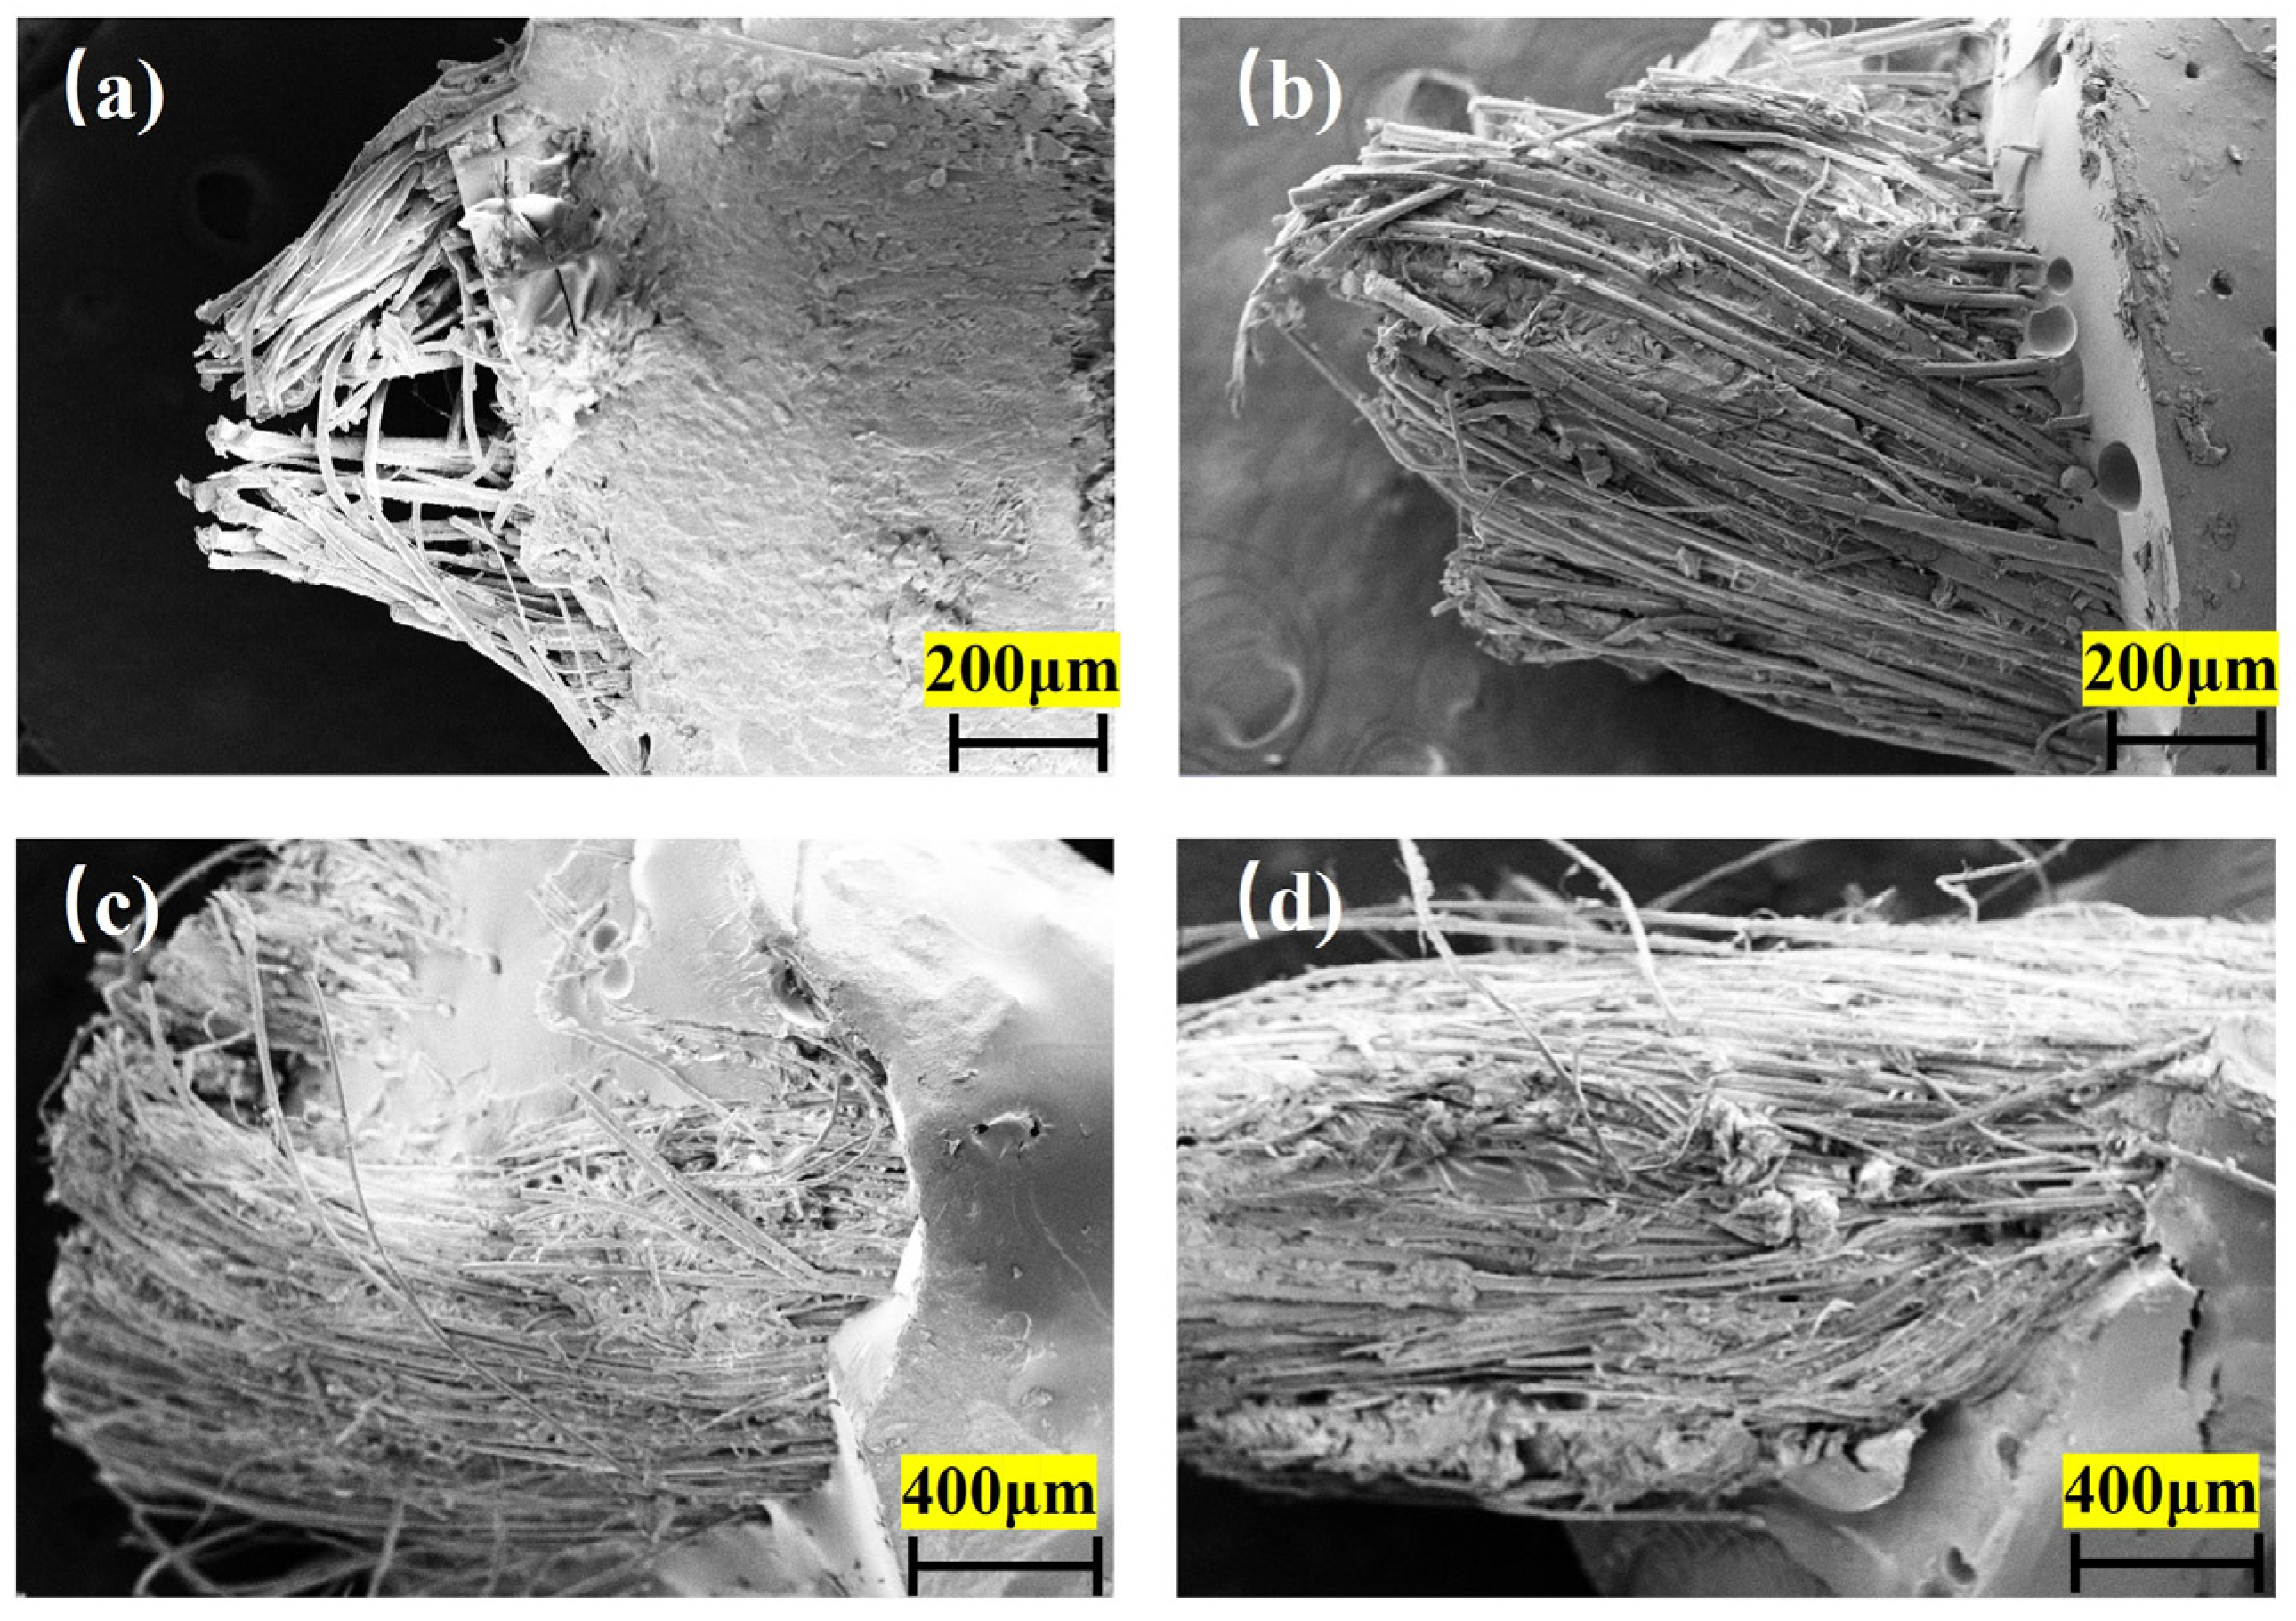
SEM images reveal that at shallow embedding depths (Figure 15a), the interfacial bonding region between yarn and matrix is limited, primarily manifesting as interfacial debonding and fiber pull-out. The matrix exhibits minimal plastic deformation during fiber extraction, indicating low interfacial shear strength. The small damage region around the yarn suggests insufficient load transfer due to inadequate embedding depth. With increasing embedding depth (Figure 15b), the interfacial bonding area significantly expands, yet fiber pull-out remains the dominant failure mode. The enlarged matrix damage region and residual matrix fragments on the fiber surface indicate improved interfacial bonding strength. However, the emergence of fiber fractures (albeit limited in proportion) suggests that the fiber’s load-bearing capacity has not been fully utilized. For double-filament yarns (Figure 15c), the interfacial bonding becomes more complex. At an embedding depth of 1–1.5 mm, both fiber pull-out and matrix fracture co-occur. Extensive interfacial debonding and matrix cracking indicate significant stress concentration effects, while the twisted multi-strand structure may lead to uneven stress distribution, causing localized interfacial failure. The noticeable voids in the matrix could adversely affect interfacial performance. As embedding depth further increases (Figure 15d), the interfacial bonding strength significantly improves, evidenced by increased fiber fracture occurrences. The images show fractured fiber cross-sections and extensive plastic deformation/fracture in the matrix. While the enhanced interaction between yarn and matrix strengthens load transfer, severe matrix cracking highlights the need for optimizing the mechanical compatibility between the interface and matrix.

4. Conclusions

This study systematically analyzed the interfacial properties and influencing factors between flax yarn and matrix materials through pull-out tests on single- and double-filament flax yarns. It evaluated the critical embedded length at the yarn scale, measured interfacial shear strength (IFSS), and assessed pull-out failure modes under different embedded lengths using scanning electron microscopy (SEM). These results provide a scientific basis for optimizing the structural design and performance enhancement of flax fiber-reinforced composites, while also offering significant guidance for their practical engineering applications. The main conclusions are as follows:
(1)
Characteristic strength decreased from 430 MPa (40 mm) to 365 MPa (100 mm) for single-ply, and 288 MPa to 253 MPa for double-ply. Tensile Strength and Elastic Modulus Trends: The tensile strength and elastic modulus of flax yarns decrease with increasing gauge length. Both single- and double-filament yarns exhibit similar trends, which are closely related to the non-uniformity of the internal fiber structure. Under short gauge lengths, the end effects of fibers are reduced, enhancing their synergistic load-bearing capacity and making the tensile performance closer to that of individual fibers. However, extending the gauge length exacerbates defect accumulation and stress distribution unevenness among fibers, leading to overall mechanical property degradation. This phenomenon highlights the critical impact of yarn structure on interfacial stress transfer efficiency.
(2)
Interfacial Shear Strength (IFSS) Comparison: Single-ply achieved higher IFSS (30.90–32.03 MPa vs. 20.61–25.21 MPa in double-ply. The tight fiber arrangement and large effective contact area in single-filament yarns result in more pronounced chemical bonding and mechanical interlocking at the interface. In contrast, the twisted structure and inter-filament gaps in double-filament yarns reduce interfacial bonding efficiency, leading to a downward trend in IFSS. Additionally, single-filament yarns primarily fail via interfacial debonding, while double-filament yarns exhibit more complex failure modes, including interfacial separation, internal fiber slippage, and matrix fracture, due to their structural complexity.
(3)
Interfacial Failure Mechanisms: The interfacial failure of flax fiber-reinforced composites stems from the inherent hydrophilicity of fibers and the hydrophobicity of resins, as well as stress concentration effects due to the hierarchical yarn structure. Microscopic analysis reveals that interfacial debonding, fiber pull-out, and localized matrix fracture are the dominant failure modes, regulated by the synergistic effects of embedded length and yarn structure. Single-filament yarns tend to fail by interfacial debonding due to their uniform stress transfer paths, whereas double-filament yarns experience more complex failures involving interfacial separation and internal slippage. While the multi-filament synergistic effect of double-filament yarns enhances structural stability, it also weakens local interfacial strength due to stress dispersion. Future research should focus on fiber surface modification, resin wettability optimization, and multi-scale interfacial design to break through the performance bottlenecks of natural fiber composites and promote their widespread application in lightweight and eco-friendly engineering materials.

Author Contributions

Conceptualization, H.L. and D.C.; methodology, X.W.; formal analysis, X.W.; investigation, X.W.; resources, Z.W. and W.L.; writing—original draft preparation, X.W.; writing—review and editing, X.C. and B.Y.R.S.; visualization, X.W.; supervision, H.L. and W.L.; project administration, H.L. and L.S.; funding acquisition, Z.W. and D.C. All authors have read and agreed to the published version of the manuscript.

Funding

This work was supported by the Natural Key RD Program of China (2023YFE0106400). Project received funding from Xjenza Malta and the Ministry for Science and Technology of the People’s Republic of China (MOST), through the SINO-MALTA Fund 2022 Call (Science and Technology Cooperation), SINO-Malta 2022–04.

Conflicts of Interest

The authors declare no conflict of interest.

References

  1. Kandasamy, J.; Soundhar, A.; Rajesh, M.; Mallikarjuna Reddy, D.; Kar, V.R. Natural fiber composite for structural applications. In Structural Health Monitoring System for Synthetic, Hybrid and Natural Fiber Composites; Springer: Singapore, 2021; pp. 23–35. [Google Scholar]
  2. Sudhin, A.; Remanan, M.; Ajeesh, G.; Jayanarayanan, K. Comparison of properties of carbon fiber reinforced thermoplastic and thermosetting composites for aerospace applications. Mater. Today Proc. 2020, 24, 453–462. [Google Scholar] [CrossRef]
  3. Ferreira, D.P.; Cruz, J.; Fangueiro, R. Surface modification of natural fibers in polymer composites. In Green Composites for Automotive Applications; Elsevier: Amsterdam, The Netherlands, 2019; pp. 3–41. [Google Scholar]
  4. Fernández, J.A.; Le Moigne, N.; Caro-Bretelle, A.; El Hage, R.; Le Duc, A.; Lozachmeur, M.; Bono, P.; Bergeret, A. Role of flax cell wall components on the microstructure and transverse mechanical behaviour of flax fabrics reinforced epoxy biocomposites. Ind. Crops Prod. 2016, 85, 93–108. [Google Scholar] [CrossRef]
  5. Shelly, D.; Singhal, V.; Jaidka, S.; Banea, M.D.; Lee, S.-Y.; Park, S.-J. Mechanical performance of bio-based fiber reinforced polymer composites: A review. Polym. Compos. 2025. early view. [Google Scholar] [CrossRef]
  6. Behera, S.; Gautam, R.K.; Mohan, S.; Chattopadhyay, A. Hemp fiber surface modification: Its effect on mechanical and tribological properties of hemp fiber reinforced epoxy composites. Polym. Compos. 2021, 42, 5223–5236. [Google Scholar] [CrossRef]
  7. Ramesh, M.; Deepa, C.; Rajeshkumar, L.; Tamil Selvan, M.; Balaji, D. Influence of fiber surface treatment on the tribological properties of Calotropis gigantea plant fiber reinforced polymer composites. Polym. Compos. 2021, 42, 4308–4317. [Google Scholar] [CrossRef]
  8. Hendlmeier, A.; Marinovic, L.I.; Al-Assafi, S.; Stojcevski, F.; Henderson, L.C. Sizing effects on the interfacial shear strength of a carbon fibre reinforced two-component thermoplastic polymer. Compos. Part A Appl. Sci. Manuf. 2019, 127, 105622. [Google Scholar] [CrossRef]
  9. Kim, S.W.; Park, T.; Um, M.K.; Lee, J.; Seong, D.G.; Yi, J.W. Effect of caprolactam modified phenoxy-based sizing material on reactive process of carbon fiber-reinforced thermoplastic polyamide-6. Compos. Part A Appl. Sci. Manuf. 2020, 139, 106104. [Google Scholar] [CrossRef]
  10. Kumar, D.; Mohanasundaram, S.; Karthikeyan, S.K.; Singh, A.K.; Nagabhooshanam, K.D.V.P.; Balasubramanian, M.; Kumar, N.S.; Sree, S.R. Load bearing properties of sand blasted SS304 wire-mesh and silane-treated pineapple/flax-reinforced Si2N2O modified epoxy resin Composites. J. Polym. Res. 2025, 32, 241–256. [Google Scholar] [CrossRef]
  11. Shelly, D.; Lee, S.Y.; Park, S.J. Hemp fiber and its bio-composites: A comprehensive review part I—Characteristics and processing. Adv. Compos. Hybrid Mater. 2025, 8, 252. [Google Scholar] [CrossRef]
  12. Elayaraja, R.; Rajamurugan, G. Utilizing woven flax/hemp yarn on SS304 wiremesh reinforced flax fiber composites for tribological applications. Tribol. Int. 2024, 27, 105909. [Google Scholar] [CrossRef]
  13. Li, Y.; Chen, C.; Xu, J.; Zhang, Z.; Yuan, B.; Huang, X. Improved mechanical properties of carbon nanotubes-coated flax fiber reinforced composites. J. Mater. Sci. 2015, 50, 1117–1128. [Google Scholar] [CrossRef]
  14. Goda, K.; Sreekala, M.; Gomes, A.; Kaji, T.; Ohgi, J. Improvement of plant based natural fibers for toughening green composites—Effect of load application during mercerization of ramie fibers. Compos. Part A Appl. Sci. Manuf. 2006, 37, 2213–2220. [Google Scholar] [CrossRef]
  15. Zhang, Z.; Li, Y.; Fu, K.; Li, Q. Determination of interfacial properties of cellulose nanocrystal-modified sisal fibre in epoxy by cyclic single-fibre pull-out. Compos. Sci. Technol. 2020, 193, 108142. [Google Scholar] [CrossRef]
  16. Majhi, S.; Pradhan, S.; Prakash, V.; Acharya, S.K. Influence of alkali treatment on the interfacial shear strength of Agave lechuguilla fiber and its significance as a reinforcing material in polymer composites for mechanical applications. Polym. Compos. 2023, 44, 3487–3499. [Google Scholar] [CrossRef]
  17. Wong, S.; Shanks, R.; Hodzic, A. Effect of additives on the interfacial strength of poly (l-lactic acid) and poly (3-hydroxy butyric acid)-flax fibre composites. Compos. Sci. Technol. 2007, 67, 2478–2484. [Google Scholar] [CrossRef]
  18. Fidelis, M.E.A.; Toledo Filho, R.D.; de Andrade Silva, F.; Mobasher, B.; Müller, S.; Mechtcherine, V. Interface characteristics of jute fiber systems in a cementitious matrix. Cem. Concr. Res. 2019, 116, 252–265. [Google Scholar] [CrossRef]
  19. Spārniņš, E.; Nyström, B.; Andersons, J. Interfacial shear strength of flax fibers in thermoset resins evaluated via tensile tests of UD composites. Int. J. Adhes. Adhes. 2012, 36, 39–43. [Google Scholar] [CrossRef]
  20. Andersons, J.; Joffe, R.; Spārniņš, E. Evaluation of interfacial shear strength by tensile tests of impregnated flax fiber yarns. J. Compos. Mater. 2012, 46, 351–357. [Google Scholar] [CrossRef]
  21. Fiore, V.; Scalici, T.; Nicoletti, F.; Vitale, G.; Prestipino, M.; Valenza, A. A new eco-friendly chemical treatment of natural fibres: Effect of sodium bicarbonate on properties of sisal fibre and its epoxy composites. Compos. Part B Eng. 2016, 85, 150–160. [Google Scholar] [CrossRef]
  22. Kelly, A.; Tyson, A.W. Tensile properties of fibre-reinforced metals: Copper/tungsten and copper/molybdenum. J. Mech. Phys. Solids 1965, 13, 329–350. [Google Scholar] [CrossRef]
  23. Noorvand, H.; Mobasher, B.; Underwood, S.; Kaloush, K. Development of an analytical framework for evaluation of critical fiber length in asphalt concrete with a fiber pullout test. Constr. Build. Mater. 2022, 360, 129561. [Google Scholar] [CrossRef]
  24. Teklal, F.; Djebbar, A.; Allaoui, S.; Hivet, G.; Joliff, Y.; Kacimi, B. A review of analytical models to describe pull-out behavior–Fiber/matrix adhesion. Compos. Struct. 2018, 201, 791–815. [Google Scholar] [CrossRef]
  25. Oliver, W.C.; Pharr, G.M. An improved technique for determining hardness and elastic modulus using load and displacement sensing indentation experiments. J. Mater. Res. 1992, 7, 1564–1583. [Google Scholar] [CrossRef]
  26. Andersons, J.; Spārniņš, E.; Joffe, R.; Wallström, L. Strength distribution of elementary flax fibres. Compos. Sci. Technol. 2005, 65, 693–702. [Google Scholar] [CrossRef]
  27. Placet, V. Characterization of the thermo-mechanical behaviour of Hemp fibres intended for the manufacturing of high performance composites. Compos. Part A Appl. Sci. Manuf. 2009, 40, 1111–1118. [Google Scholar] [CrossRef]
  28. Belaadi, A.; Bezazi, A.; Bourchak, M.; Scarpa, F.; Zhu, C. Thermochemical and statistical mechanical properties of natural sisal fibres. Compos. Part B Eng. 2014, 67, 481–489. [Google Scholar] [CrossRef]
  29. Jihan, S.; Siddiqui, A.; Sweet, M. Fracture strength of E-glass fibre strands using acoustic emission. NDT E Int. 1997, 30, 383–388. [Google Scholar] [CrossRef]
  30. El Asloun, M.; Donnet, J.; Guilpain, G.; Nardin, M.; Schultz, J. On the estimation of the tensile strength of carbon fibres at short lengths. J. Mater. Sci. 1989, 24, 3504–3510. [Google Scholar] [CrossRef]
  31. Bos, H.; Van Den Oever, M.; Peters, O. Tensile and compressive properties of flax fibres for natural fibre reinforced composites. J. Mater. Sci. 2002, 37, 1683–1692. [Google Scholar] [CrossRef]
  32. Romhany, G.; Karger-Kocsis, J.; Czigany, T. Tensile fracture and failure behavior of technical flax fibers. J. Appl. Polym. Sci. 2003, 90, 3638–3645. [Google Scholar] [CrossRef]
  33. Stamboulis, A.; Baillie, C.; Garkhail, S.; Van Melick, H.; Peijs, T. Environmental durability of flax fibres and their composites based on polypropylene matrix. Appl. Compos. Mater. 2000, 7, 273–294. [Google Scholar] [CrossRef]
  34. Virk, A.S.; Hall, W.; Summerscales, J. Failure strain as the key design criterion for fracture of natural fibre composites. Compos. Sci. Technol. 2010, 70, 995–999. [Google Scholar] [CrossRef]
  35. Baley, C. Analysis of the flax fibres tensile behaviour and analysis of the tensile stiffness increase. Compos. Part A Appl. Sci. Manuf. 2002, 33, 939–948. [Google Scholar] [CrossRef]
  36. Zhou, L.-M.; Mai, Y.-W.; Baillie, C. Interfacial debonding and fibre pull-out stresses: Part VA methodology for evaluation of interfacial properties. J. Mater. Sci. 1994, 29, 5541–5550. [Google Scholar] [CrossRef]
  37. Bhagat, A.B.; Ghosh, A.K. Performance properties of PP/sisal fibre composites having near critical fibre length and prediction of their properties. Fibers Polym. 2022, 23, 1983–1994. [Google Scholar] [CrossRef]
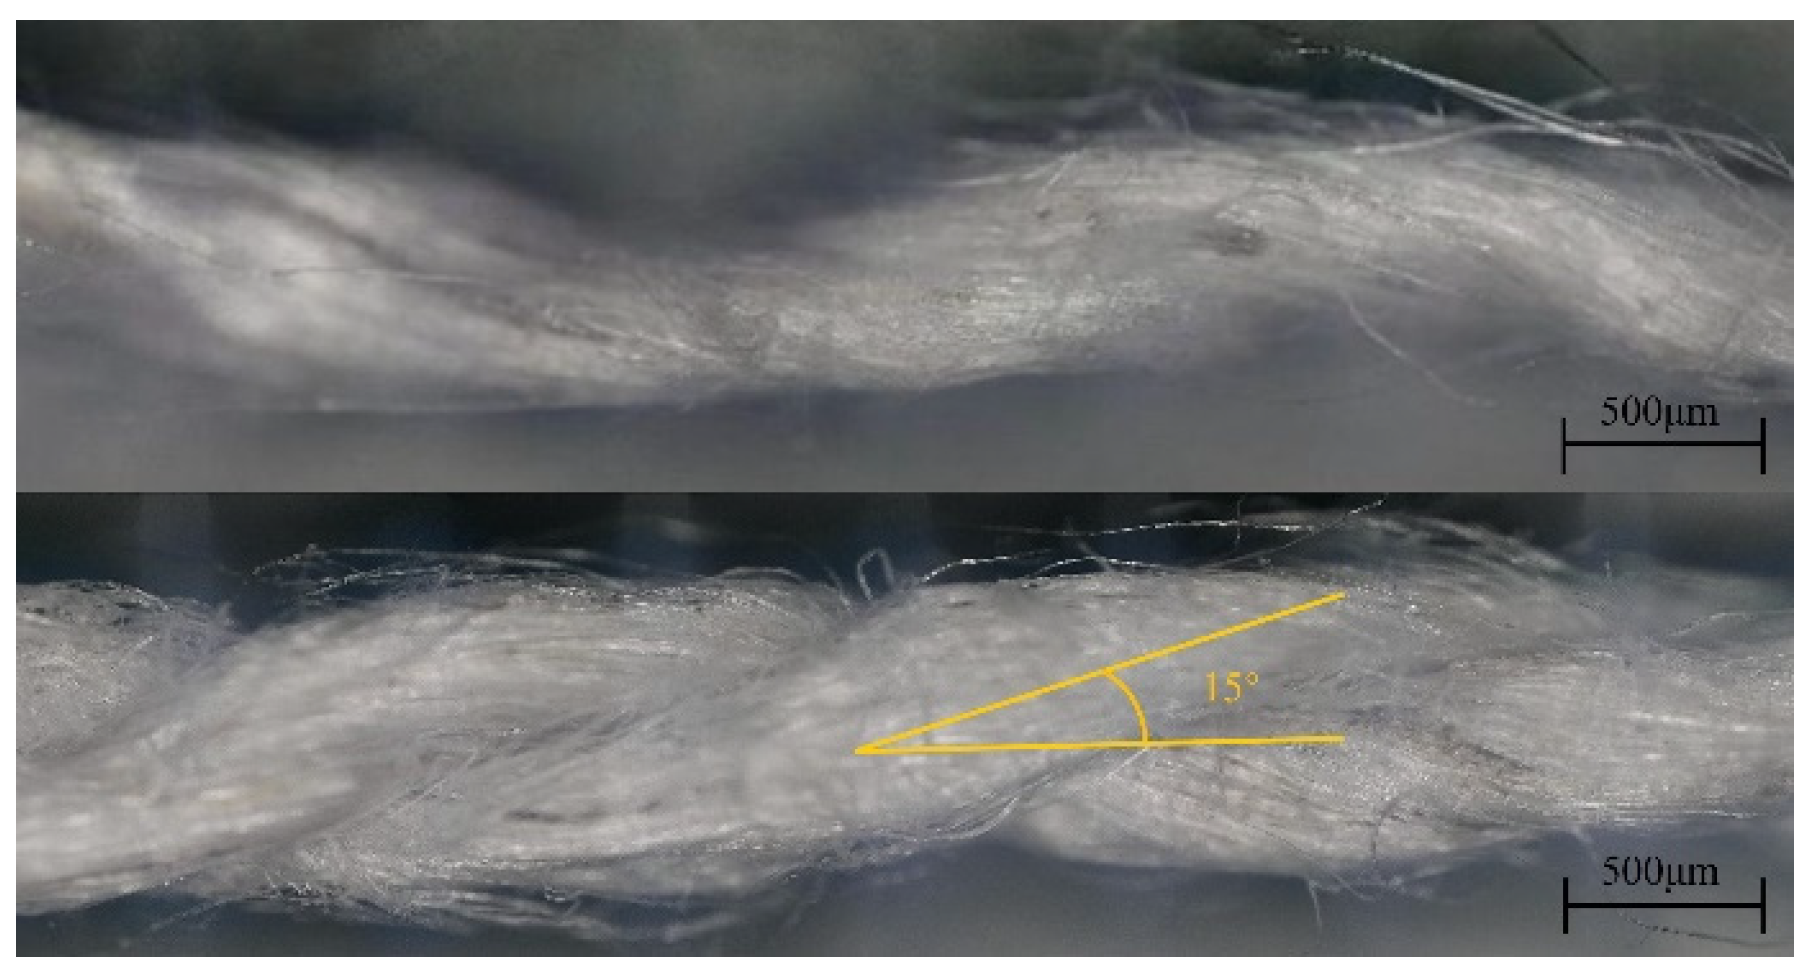
Figure 1. Optical diagram of flax yarn.
Fibers 13 00118 g001
Figure 2. Yarn tensile sample.
Fibers 13 00118 g002
Figure 3. Yarn pull-out test preparation process.
Fibers 13 00118 g003
Figure 4. Yarn pull-out test device.
Fibers 13 00118 g004
Figure 5. Mechanical model of the pull-out.
Fibers 13 00118 g005
Figure 6. Gaussian distribution of measured diameters of flax yarn.
Fibers 13 00118 g006
Figure 7. Mechanical properties of flax yarn two-parameter Weibull distribution. (a,b): single, (c,d): double.
Fibers 13 00118 g007
Figure 8. Pull out experimental load bit–shift curve: (a) single and (b) double.
Fibers 13 00118 g008
Figure 9. Typical load–displacement diagram for pull-out test.
Fibers 13 00118 g009
Figure 10. Debonding force and embedding length fit curve: (a) single and (b) double.
Fibers 13 00118 g010
Figure 11. Peak load and IFSS histogram at different embedding lengths: (a) single and (b) double.
Fibers 13 00118 g011
Figure 12. Load–depth curves obtained from different points.
Fibers 13 00118 g012
Figure 13. SEM of single-strand yarn pulling out: (a): Main panel showing the overall fracture surface with fiber and interface failure modes indicated; (b): Close-up of fiber fracture; (c): Close-up of interface debonding and fiber pull-out.
Fibers 13 00118 g013
Figure 14. SEM of double-strand yarn pulling out: (a): Overall fracture surface showing loading direction and voids; (b): Magnified view of fiber fracture; (c): Magnified view of matrix fracture.
Fibers 13 00118 g014
Figure 15. SEM of single and double-strand yarn with different embeddings depth. (a,b): single; (c,d): double.
Fibers 13 00118 g015
Table 1. Statistics of Weibull distribution of linen yarn.
Gauge Length (mm)mσσ0 (MPa)mEE0 (MPa)
Single-ply
407.999430.4868.09714,893.647
607.551399.0896.11314,354.802
1007.079365.6669.37013,371.246
Double-ply
409.460288.4217.8346460.084
6010.455278.7647.9995920.511
1006.451253.3255.9755341.845
Disclaimer/Publisher’s Note: The statements, opinions and data contained in all publications are solely those of the individual author(s) and contributor(s) and not of MDPI and/or the editor(s). MDPI and/or the editor(s) disclaim responsibility for any injury to people or property resulting from any ideas, methods, instructions or products referred to in the content.