Article

Structure Design by Knitting: Combined Wicking and Drying Behaviour in Single Jersey Fabrics Made from Polyester Yarns

1
German Institutes of Textile and Fiber Research (DITF), 73770 Denkendorf, Germany
2
Institute of Chemical Process Engineering (ICVT), University of Stuttgart, 70199 Stuttgart, Germany
3
Institute for Textile and Fiber Technologies (ITFT), University of Stuttgart, 70569 Stuttgart, Germany
*
Authors to whom correspondence should be addressed.
Fibers 2025, 13(8), 103; https://doi.org/10.3390/fib13080103
Submission received: 12 June 2025 / Revised: 10 July 2025 / Accepted: 29 July 2025 / Published: 31 July 2025

Abstract

Highlights

“What are the main findings?”
  • Eight samples of single jersey knitted fabrics made from polyester yarns with different levels of texturisation and fibre diameters were examined in a combined wicking and drying experiment.
  • The quantitative measures extracted from these experiments show that texturised and non-texturised yarns behave significantly differently.
“What are the implications of these findings?”
  • The wicking and drying properties of fabrics are highly affected by their structure and can be well correlated with the fabrics’ porous properties.
  • The mechanisms observed in this study suggest ways to optimise drying behaviour by combining yarns and knitted fabric structures.

Abstract

The kinetics of liquid transport in textiles are determined by the thermodynamic boundary conditions and the substrate’s structure. The knitting process offers a wide range of possibilities for modifying the fabric structure, making it ideal for high-performance garments and technical applications. Given the highly complex nature of textiles’ interaction with liquids, this paper investigates how fabric structure affects combined wicking and drying behaviour. This facilitates comprehension of the underlying transport processes on the yarn and fabric scale, which is important for understanding the behaviour of the material as a whole. The presented experiment combines analysis of wicking through radial liquid spread using imaging techniques and analysis of the drying process through gravimetric measurement of evaporation. Eight samples of single jersey knitted fabrics were produced using polyester yarns of different texturization and fibre diameters on flat and circular knitting machines. The fabrics demonstrate significantly different wicking behaviours depending on their structure. The fabric’s drying time and rate are directly linked to the macroscopic spread of the liquid. Large inter-yarn pores hinder liquid spread. For the lowest liquid saturations, the yarn structure plays a critical role. Using fine, dense yarns can hinder convective drying within the yarn. Textured yarns tend to exhibit higher specific drying rates. The results offer a comprehensive insight into the interplay between the fabric’s structure and its wicking and drying behaviour, which is crucial for the development of functional fabrics in the knitting process.

1. Introduction

Drying textiles is a critical process in terms of both application and processing. The kinetics of drying are influenced by a number of factors, including thermodynamic ambient conditions and the structure and material of the substrate. The structure of textile fabrics is significantly influenced by the material used, the manufacturing process and the finishing process. Fluid transport in porous materials such as textiles depends heavily on the structure of the pores. The science of porous media provides a means of understanding the structural properties of materials in the context of fluid transport. The single jersey fabric has a porous structure with a bimodal nature. Intra-yarn pores range from 1 to 100 µm, while inter-yarn pores are above 100 µm [1].
Single Jersey is a very common, simple, periodic knitting pattern. Figure 1 illustrates the key elements of knitted fabrics, which affect the wicking and drying behaviour: binding points where the yarns cross, inter-yarn pores between the yarns, and the yarn alternating between the upper and lower fabric surfaces.
The knitted fabric’s unique texture, characterised by its meandering stitch, endows the knitted fabric with exceptional elasticity and drapeability. The yarn’s path from the front to the back plane facilitates the transport of moisture, while the pores between the yarns increase the transport of gaseous and liquid fluids through the plane. Liquid is transported primarily through the intra-yarn pores, while binding points inhibit transport between yarns [2].
The knitting process is highly versatile and allows for a wide range of modifications to the material’s porous properties. Due to the wide range of structural properties that textiles can exhibit, as well as limitations in textile processes, it is challenging to establish specific structural parameterisation in experiments. Knitted fabrics made from polyester yarns are widely used in applications where effective moisture, air or liquid transport is essential. These characteristics are commonly summed up under the concept of moisture management.
Moisture management is a term used to describe the way in which fabrics interact with liquids in the context of garments. A variety of different experiments are used in order to quantify the moisture management properties of textiles [3,4] Knitted fabrics in particular have been investigated in various publications and ranked according to their wetting behaviour [5,6,7], water absorption [5,6,8,9], wicking dynamics [5,6,7,8,9] and drying properties [9,10]. Publications presenting experimental studies provide a description of the different transport characteristics observed, along with a correlation analysis to integral fabric parameters such as fabric weight, fabric thickness and porosity, but lack analysis of structural details. Specific research on the influence of the knitted structure on wicking [11,12,13] and drying [9,14,15,16,17] has been reported and is discussed in detail in the following Section 2.2 and Section 2.5.
Although relevant correlations and mechanisms have been reported, the transport characteristics have not yet been traced back to the quantitative structural properties of the knitted fabrics. The structure of yarns and fabrics is often not examined in sufficient detail [12,13,14,15], or the fabrics examined are made from multiple different fabric materials [9,16], which limits the general application of the findings on knitted fabrics in general.

2. Theoretical Background: Liquid Transport and Drying in Knitted Fabrics

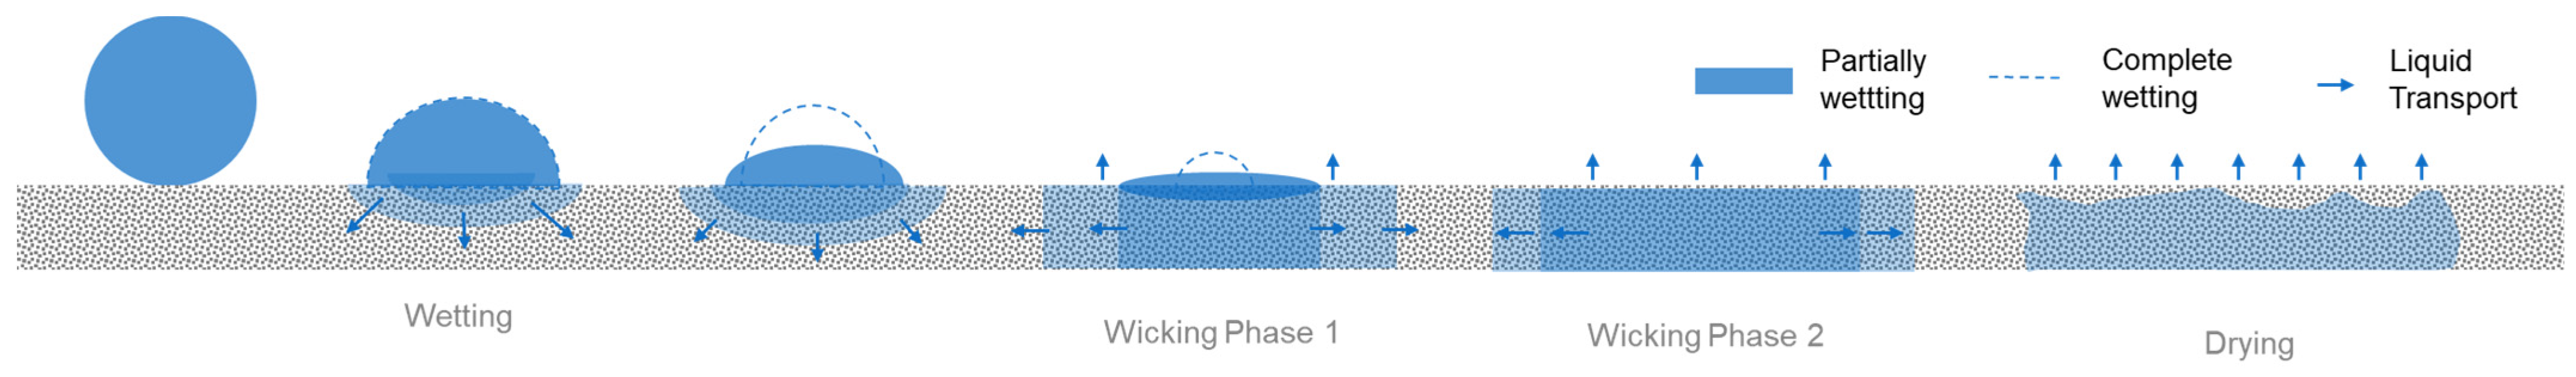
2.1. Wetting and Wicking

A significant amount of research has been conducted on the wetting and wicking of water droplets in the context of printing. Figure 2 illustrates the transient interaction of a thin, porous substrate (e.g., paper or textile fabric) with a liquid drop. The term ‘Wetting’ refers to the interaction between a liquid and the surface upon initial contact, occurring outside the substrate. ‘Imbibition’ is the term used to describe the interaction of liquid within the textile. ‘Wicking’ refers to the movement of liquid within a textile fabric, while ‘Drying’ refers to the evaporation of liquid from a substrate.
During wetting, the fibre/air boundary layer is displaced by the fibre/liquid boundary layer [18]. The most characteristic material property of wetting is the contact angle θ, which is the angle between the substrate surface and the liquid-air boundary layer. Hydrophilic surfaces generally have surface angles lower than 90°, typically ranging from 30° (wetting) to 80° (partially wetting). In contrast, Hydrophobic surfaces have contact angles greater than 90°. It is important to note that the contact angle is not constant; it decreases as the shear rate increases [19]. In the case of the wetting of a partially wetting surface, the contact angle decreases while the droplet radius remains constant. For complete wetting surfaces, the droplet radius reduces while maintaining a more or less constant contact angle [19]. The imbibition of water drops in hydrophilic and hydrophobic knitted fabrics has been demonstrated by Liu, who investigated bi-layer fabrics [20]. Birrfelder’s research focused on investigating horizontal wicking under varying pressures on different knit patterns and yarns from hydrophobic fibres, utilising X-Ray projection measurements. It was found that the knit pattern visibly influenced the wicking process, and that wicking was slower in hydrophobic structures [13].

2.2. Horizontal Wicking

Gillespie identified two distinct phases for the radial, horizontal wicking: during phase 1, the liquid is in the form of a drop on the surface, and the dynamics can be described as imbibition from an infinite reservoir. In phase 2, the liquid (drop) is fully absorbed into the substrate, resulting in a decrease in speed [21]. Kissa developed the widely used exponential formula for the spread area of a liquid on a thin, porous substrate, as outlined in Gillespie’s equation.
A = k σ η u V m t n
A represents the spread area, k is the capillary sorption coefficient, σ is the surface tension, η is the viscosity, V is the drop volume, and t is the time. When the exponents are derived analytically, u, m and n are found to be 1/3, 2/3 and 1/3, respectively. In the initial phase of wicking, the coefficient m is set to 0, and the equation reduces to the Washburn equation for wicking from an infinite reservoir. Following experiments performed by Kissa., the exponents u, m and n have been established as 0.3, 0.7 and 0.3, respectively, for n-alkanes spreading on paper [18] Kawase found that Kissa’s formula was applicable to cotton textiles with water, with the derived exponents depending on ambient conditions, drop volume, substrate and liquid [22]. The sorption coefficient k is influenced by a number of difficult-to-derive parameters. As a result, experimental data is often fitted to a simple exponential equation of time, analogous to Equation (1), by lumping the other coefficients together. Gonçalves discovered multiple spreading phases for multilayer laminates of textiles and foams with exponents n ranging from 0.08 to 0.33 [23].
As textiles generally have a more heterogeneous bimodal porous structure than paper, wetting and, in particular, wicking processes become more complex on the microscale. Capillary forces drive the liquid into the fabric. Initially, parts of the substrate become fully saturated, meaning that all the pores are filled with liquid. The liquid is then soaked from the saturated larger pores into the smaller, unsaturated pores. This process is called capillary pumping and has been demonstrated in pore-network simulations [24], fluid micro experiments [25] and experimental studies of liquid transport in intermingled yarns [2].

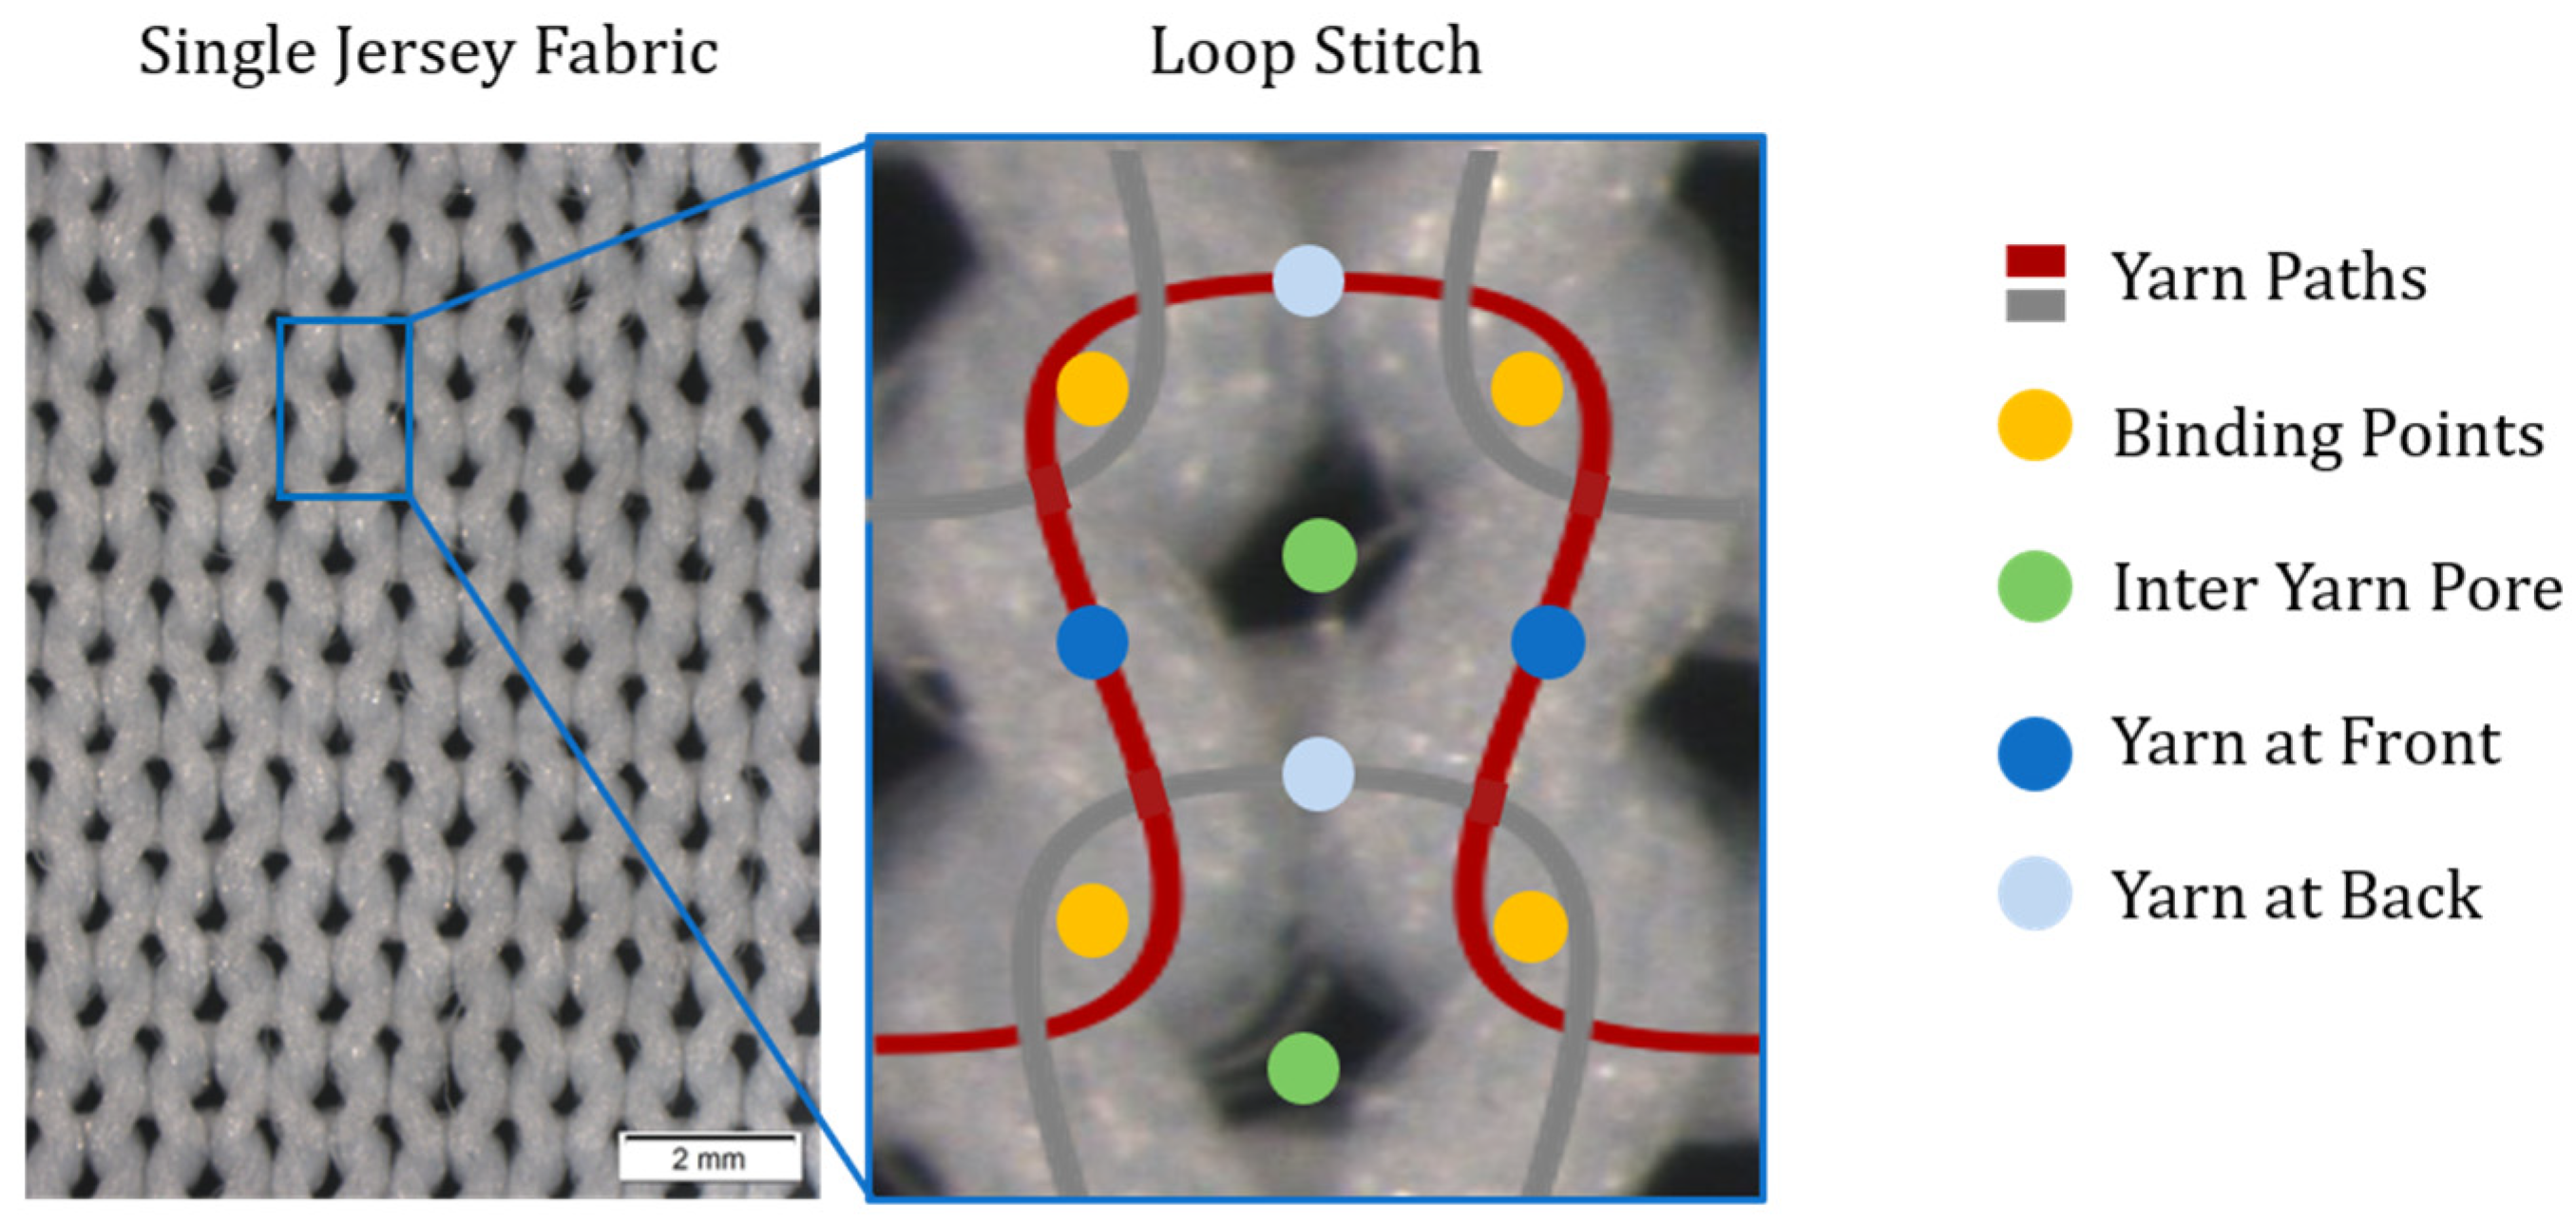
2.3. Capillary Transport in Knitted Fabrics

Fibre fineness has a significant influence on liquid transport in knitted fabrics. Sampath demonstrates that an optimum can be achieved for the spread of liquid in horizontal, radial capillary transport, which is defined by the yarn fineness. For the E28 single jersey knitted fabrics made from PES yarns with 34, 48, 108 and 288 single filaments (167 dtex) that were investigated, a maximum in the spreading area was found in the knitted fabric with 108 single filaments. The influence of the structural parameters of knits, which differ by up to 50% in thickness and up to 35% in mesh density, was not part of the study [26].
Fischer investigates the capillary transport of water between two interlacing yarns in order to gain a deeper understanding of the transport mechanisms in knitted fabrics. He validates simulations on ideal yarn loops using X-ray microscope images of a corresponding element of non-textured yarns. In his simulations on ideal yarns, capillary transport via the binding points is theoretically impossible. In the experiment, liquid transport occurs due to yarn rotation, fibre arrangements and contact compression, creating an irregular contact zone between the yarns. This contact zone deviates sufficiently from the ideal yarn structure and hinders the transition of liquid from yarn to yarn, but does not prevent it once a minimum capillary pressure is exceeded as a critical transition point [2].
Parada conducted detailed investigations into the capillary transport of water in knitted fabrics, examining vertical wicking using neutron radiography and X-ray micrography. The study revealed that, in the case of knitted textiles, intra- and inter-yarn pores form two distinct wicking fronts during vertical wicking. In these experiments, hydrophilic fabrics made from polypropylene showed no reproductive wicking behaviour [12].
Kim’s research focuses on the dynamics of capillary transport in single jersey and interlock knitted fabrics. She employs a methodical approach, systematically introducing liquid through an injection needle to replicate the natural process of sweat evaporation. It has been observed that the rate of liquid transport in the yarn is reduced by liquid transfer at the binding points, resulting in non-linear, anisotropic spreading behaviour. Macroscopically, the liquid tends to be transported in the yarn’s course. In the case of interlock knitted fabrics, where the yarn changes the fabric side, the liquid is transported course by course between the sides of the fabric. When liquid is applied by dropping it from a height of 10 mm, it spreads more in the wale direction because the effective transport path is shorter in this direction [11].

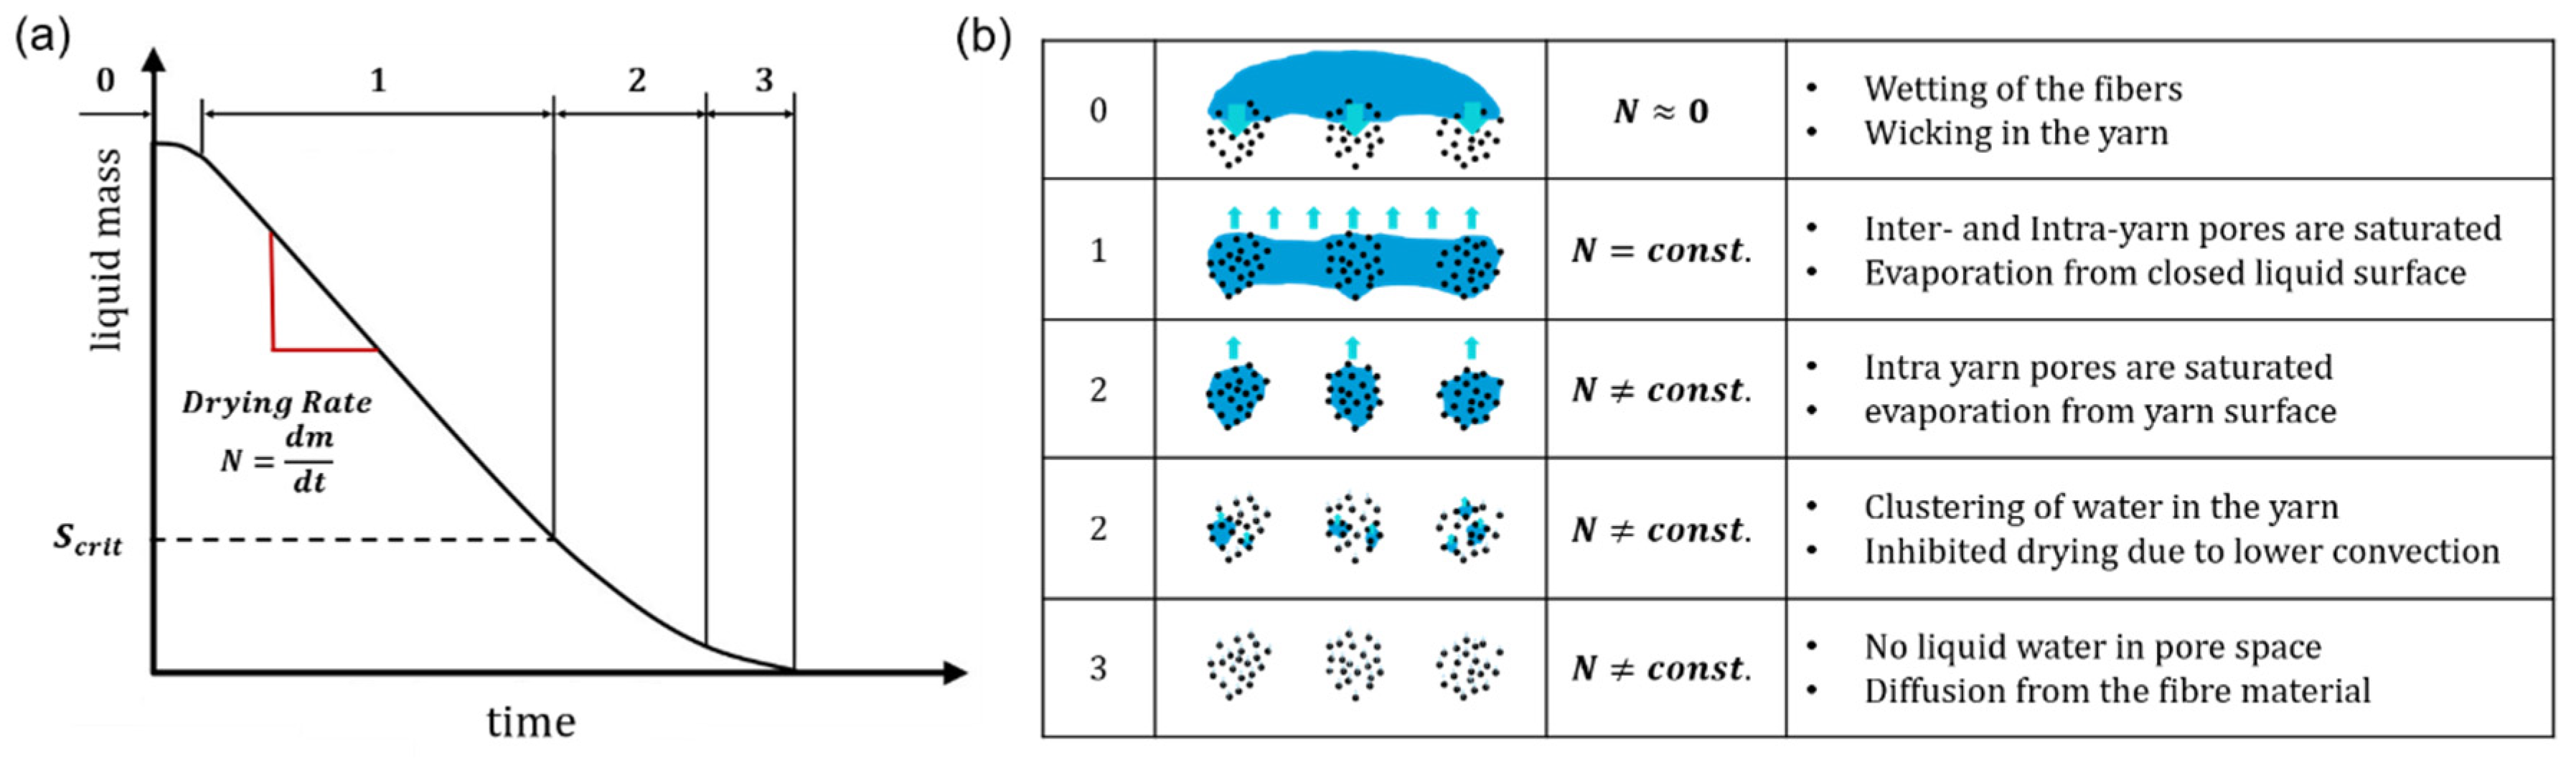
2.4. Drying of Porous Media

Drying is defined as the process of evaporating liquids from surfaces. Water is the most common substance used for this purpose. Evaporation requires the liquid to absorb thermal energy from its surroundings. This energy can be supplied by convection, conduction or radiation. Drying processes are driven by concentration gradients of the evaporating liquid. The macroscopic drying rate, N, can be calculated using the Dalton equation for convective drying.
N = A β ( p w , s u r f p w , a m b )
where A is the area available for evaporation and β is the substance transfer coefficient. The driving concentration gradient is formed by the partial pressure of water on the surface p w , s u r f and the air p w , a m b . When a porous substrate is wetted and then dried, the mass loss typically follows the profile shown in Figure 3a. Figure 3b illustrates the interaction of liquid with the bundles of fibres present in yarn-based textiles.
The drying process can be divided into several distinct phases. In phase 0, the liquid spreads in the medium, the fibres are wetted, and thermal equilibrium is reached. Initially, the available evaporation area is small, so evaporation is minimal. In phase 1, also known as the constant rate phase (CRP), the porous substrate becomes saturated with water and evaporation occurs from the surface of the medium. Liquid is brought to the surface by capillary forces. During this phase, evaporation takes place from a closed liquid surface, and the drying rate is mostly affected by external mass transport. When the critical moisture content is reached, the falling rate phase (FRP) begins. Capillary transport collapses, and the liquid breaks into patches. Drying is then mainly governed by reduced mass transfer through the dry pore space [25]. The last phase, ‘3’, applies to hygroscopic materials, which absorb moisture into the substance. This has a significant impact on removing the final percentages of liquid, particularly from cotton or synthetic cellulosic fibres, but is not apparent in the drying of polyester fabrics [16].
Fei conducted a numerical pore-scale study of the convective drying of porous media with bimodal pore sizes. He showed that convection drives the drying process during the initial constant drying phase (CRP). At lower saturation levels, when the larger pores are emptied, drying becomes diffusion-driven. In the FRP, an increase in convective flow resulted only in a minor increase in the drying rate. He showed in his simulations logarithmic behaviour in the FRP [27].

2.5. Drying of Knitted Fabrics

In addition to the material and structure of the knitted fabric, the wicking and drying performance depend on the experimental setup. Drying is typically measured using a combination of conductive, convective and/or radiative drying methods, alongside gravimetric determination of mass loss. Some experiments involve the drying of fully saturated samples hung on a line [28] or placed on a scale, with a specific amount of water added using a dropper [16]. Other methods involve the application of liquid with a dropper at a constant rate, simulating the activity of a single sweat gland [11]. As evaporation cools down the substrate, thermographic experiments have been conducted [14].
Hassan developed a method for determining the quick-dry ability of materials. This method involves centrifuging wet samples to separate the water at various stages of the drying process. He expresses concern that drying experiments, which measure drying from the surface, favour fabrics with good wicking properties. Fabrics were found to exhibit markedly different drying behaviours, depending on the specific drying experiment that was used. In the centrifuge setup, non-wetting fabrics made from Coolmax fibre demonstrated the highest level of performance [29]. Chau constructed a temperature-controlled drying tester, which enables precise regulation of the specimen holders’ temperature. The drying test was conducted on 30 knitted and woven fabrics made from multiple fibre materials. It was found that the drying process exhibited different dynamics at the start and end, depending on the fabric’s material and structure. In terms of the drying time, the best-wicking fabrics were favoured [30].
Regardless of the experimental setup for the drying experiment, wetting and wicking definitely impact the drying of textiles, as they determine the distribution of the liquid in the knitted structure. Therefore, experimental investigation into drying should take wicking into account. When integrating wicking and drying experiments, a horizontal setup from a finite reservoir is beneficial.
Gurudat conducted gravimetric drying experiments and concluded that the drying rates of knitted fabrics during the CRP, where high saturations are present, are independent of fibre type, whereas during the FRP, fibre type significantly influences the drying rate. He studied striped knitted fabrics made from polyester and cotton yarns and found that they dried up to 16% faster than pure polyester knit. He used thermography to observe capillary pumping from the cotton regions to the polyester regions [14].
Önal conducted gravimetric drying experiments using knitting patterns of different weights and thicknesses. Heavier and thicker fabrics tend to take longer to dry [15].
Onofrei conducted an experimental characterisation of the moisture management properties of special fibres for sportswear. The knit pattern had a minor influence on drying time, which was also affected by the fibre material used. For Coolmax fibres, she observed a distinctive point at which the intra-yarn pores are emptied, with FRP starting at a saturation of 0.2, followed by a second almost linear phase [9]. This observation is a contrast of the logarithmic behavior reported for a diffusion-driven FRP in multiple works.
Cay conducted drying experiments on five different fabrics made from cotton, polyester, and viscose. Knitted polyester fabrics dried fastest, followed by lyocell and polyester blends. Cotton samples took the longest to dry. Although lyocell is a highly hygroscopic fibre, the fabric’s fast-drying characteristics were attributed to its loose structure, which was not documented in detail. He then fitted the drying curves to numerical models and found that FRP was best represented by a logarithmic expression for his fabrics and setup [16].
Chen conducted wicking and drying experiments on fabric samples taken from sportswear. The fabrics were made from different polyester yarns with different patterns. Although transport properties are correlated with the integral properties of the fabric, a detailed structural analysis has not been carried out. It was concluded that finer filaments, proper fabric tightness and a plain knitted structure are beneficial for the development of an optimum sports T-shirt fabric [17].

2.6. Conclusion and Research Gap

A review of the relevant literature has shown that wicking and drying in textiles are closely intertwined, given the variety of textile materials and drying experiments. As fibre material primarily defines wetting and absorbency behaviour, it is most effective to focus on wicking and drying behaviour with respect to the knitted structure with one fibre material. No study could be found that focused on the wicking of knitted fabrics, trying to trace back the observations on the porous structure. We believe such a study would highly contribute to the development of knitted fabrics.
This publication focuses on the impact of knitted fabric structure in a combined wetting, wicking and drying experiment. Single jersey knitted fabrics made solely from polyester have been strictly parametrized by only the loop and yarn structure to investigate the impact of typical elements of knitted fabrics, such as binding points, inter-yarn and intra-yarn pores. The porous properties of the fabrics are quantified in terms of the inter-yarn and intra-yarn pore radii. This structural analysis is essential to comprehend the liquid dynamics in knitted fabrics. Improving the performance of knitted fabrics and designing them for specific purposes requires an understanding of these causes and effects.

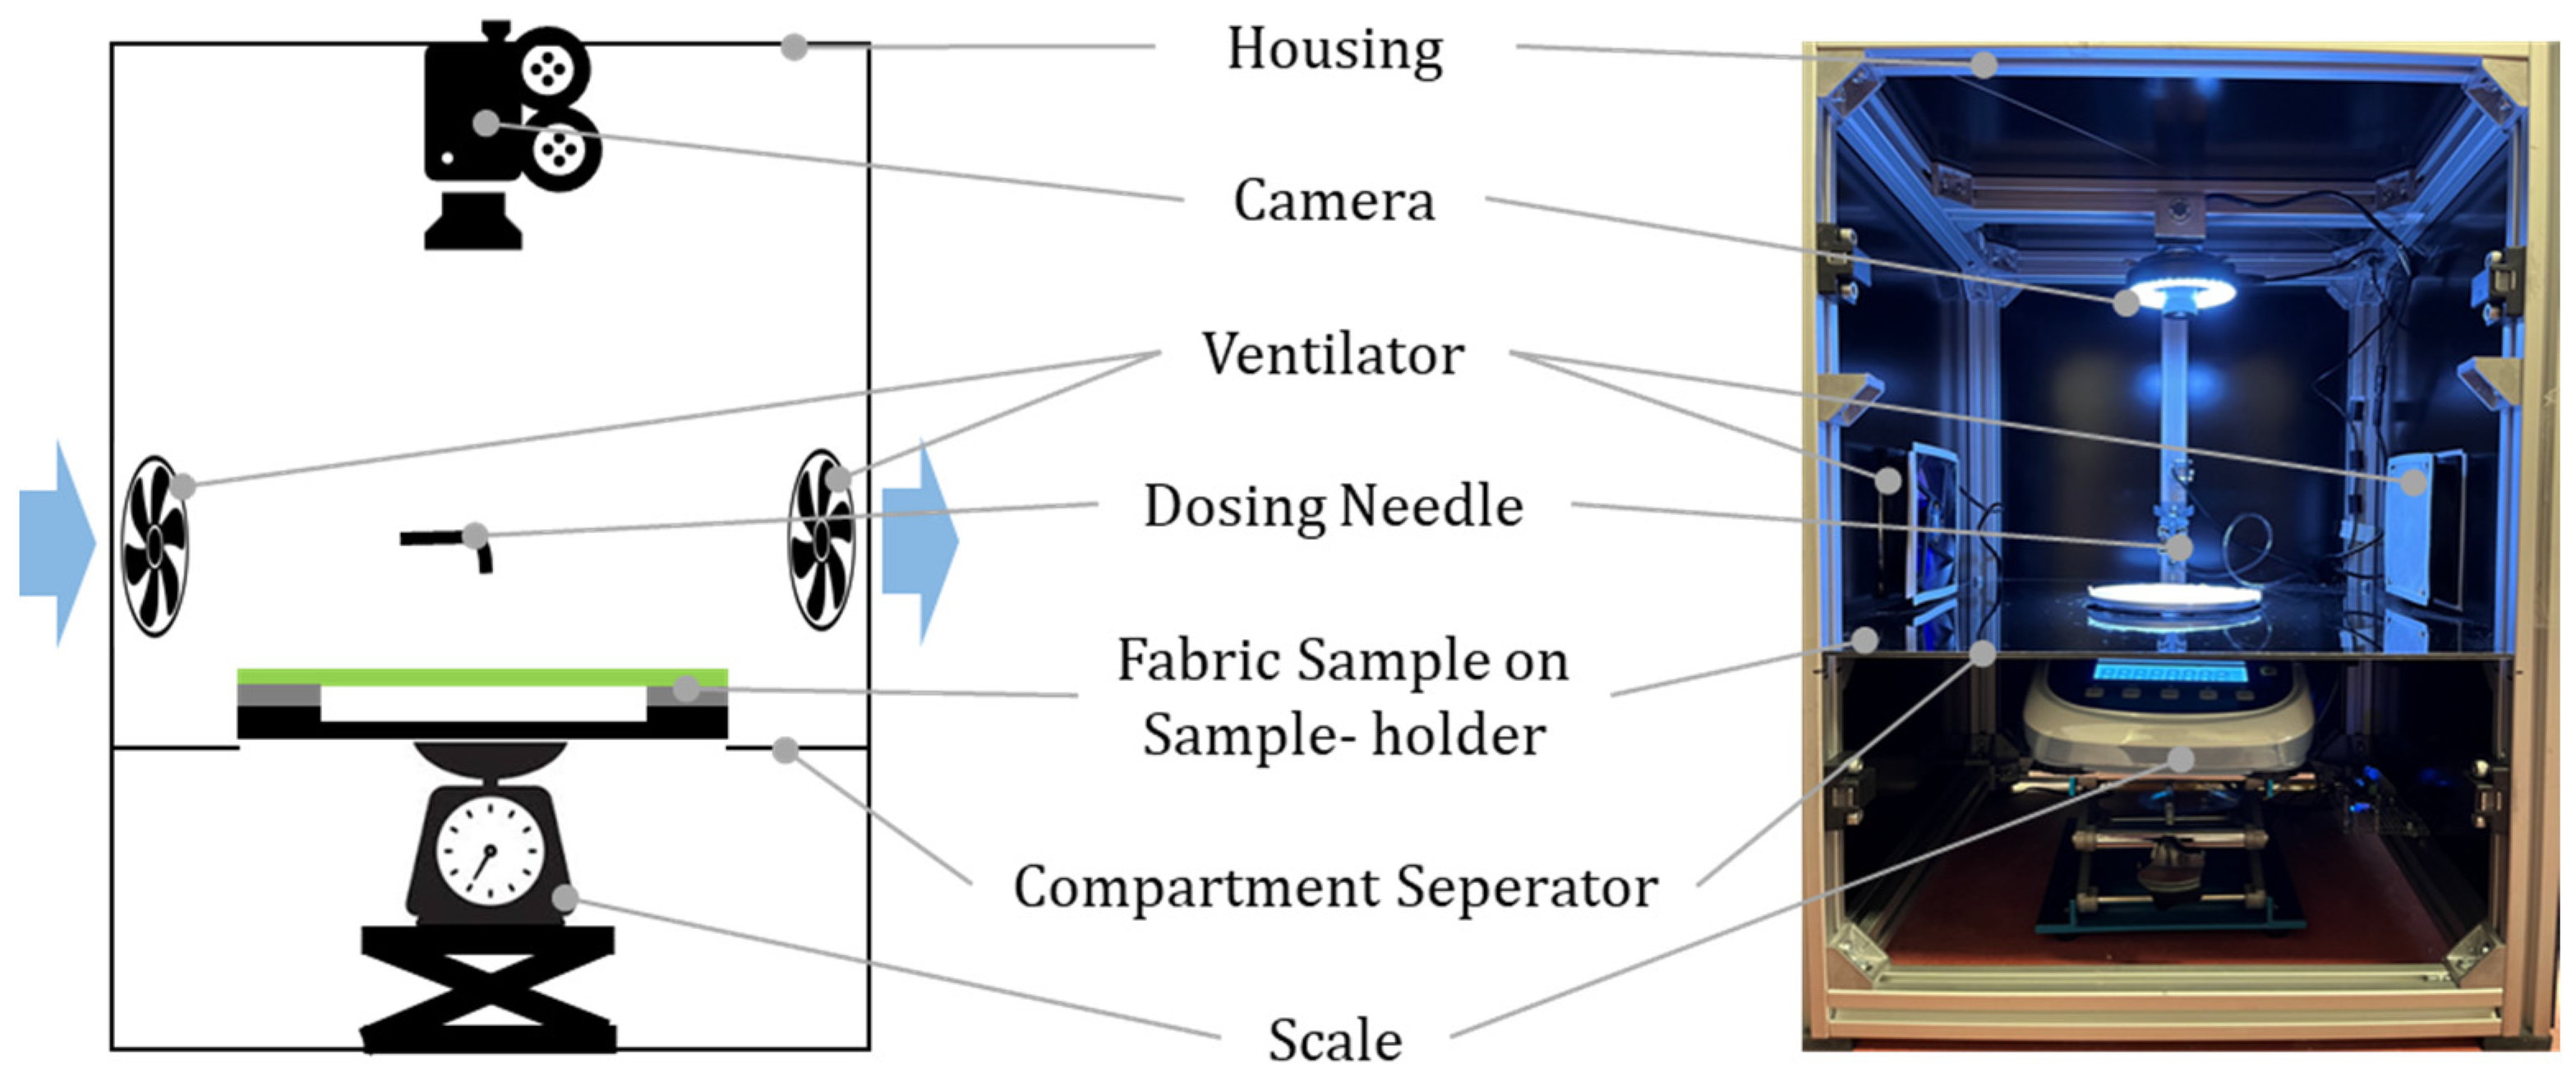
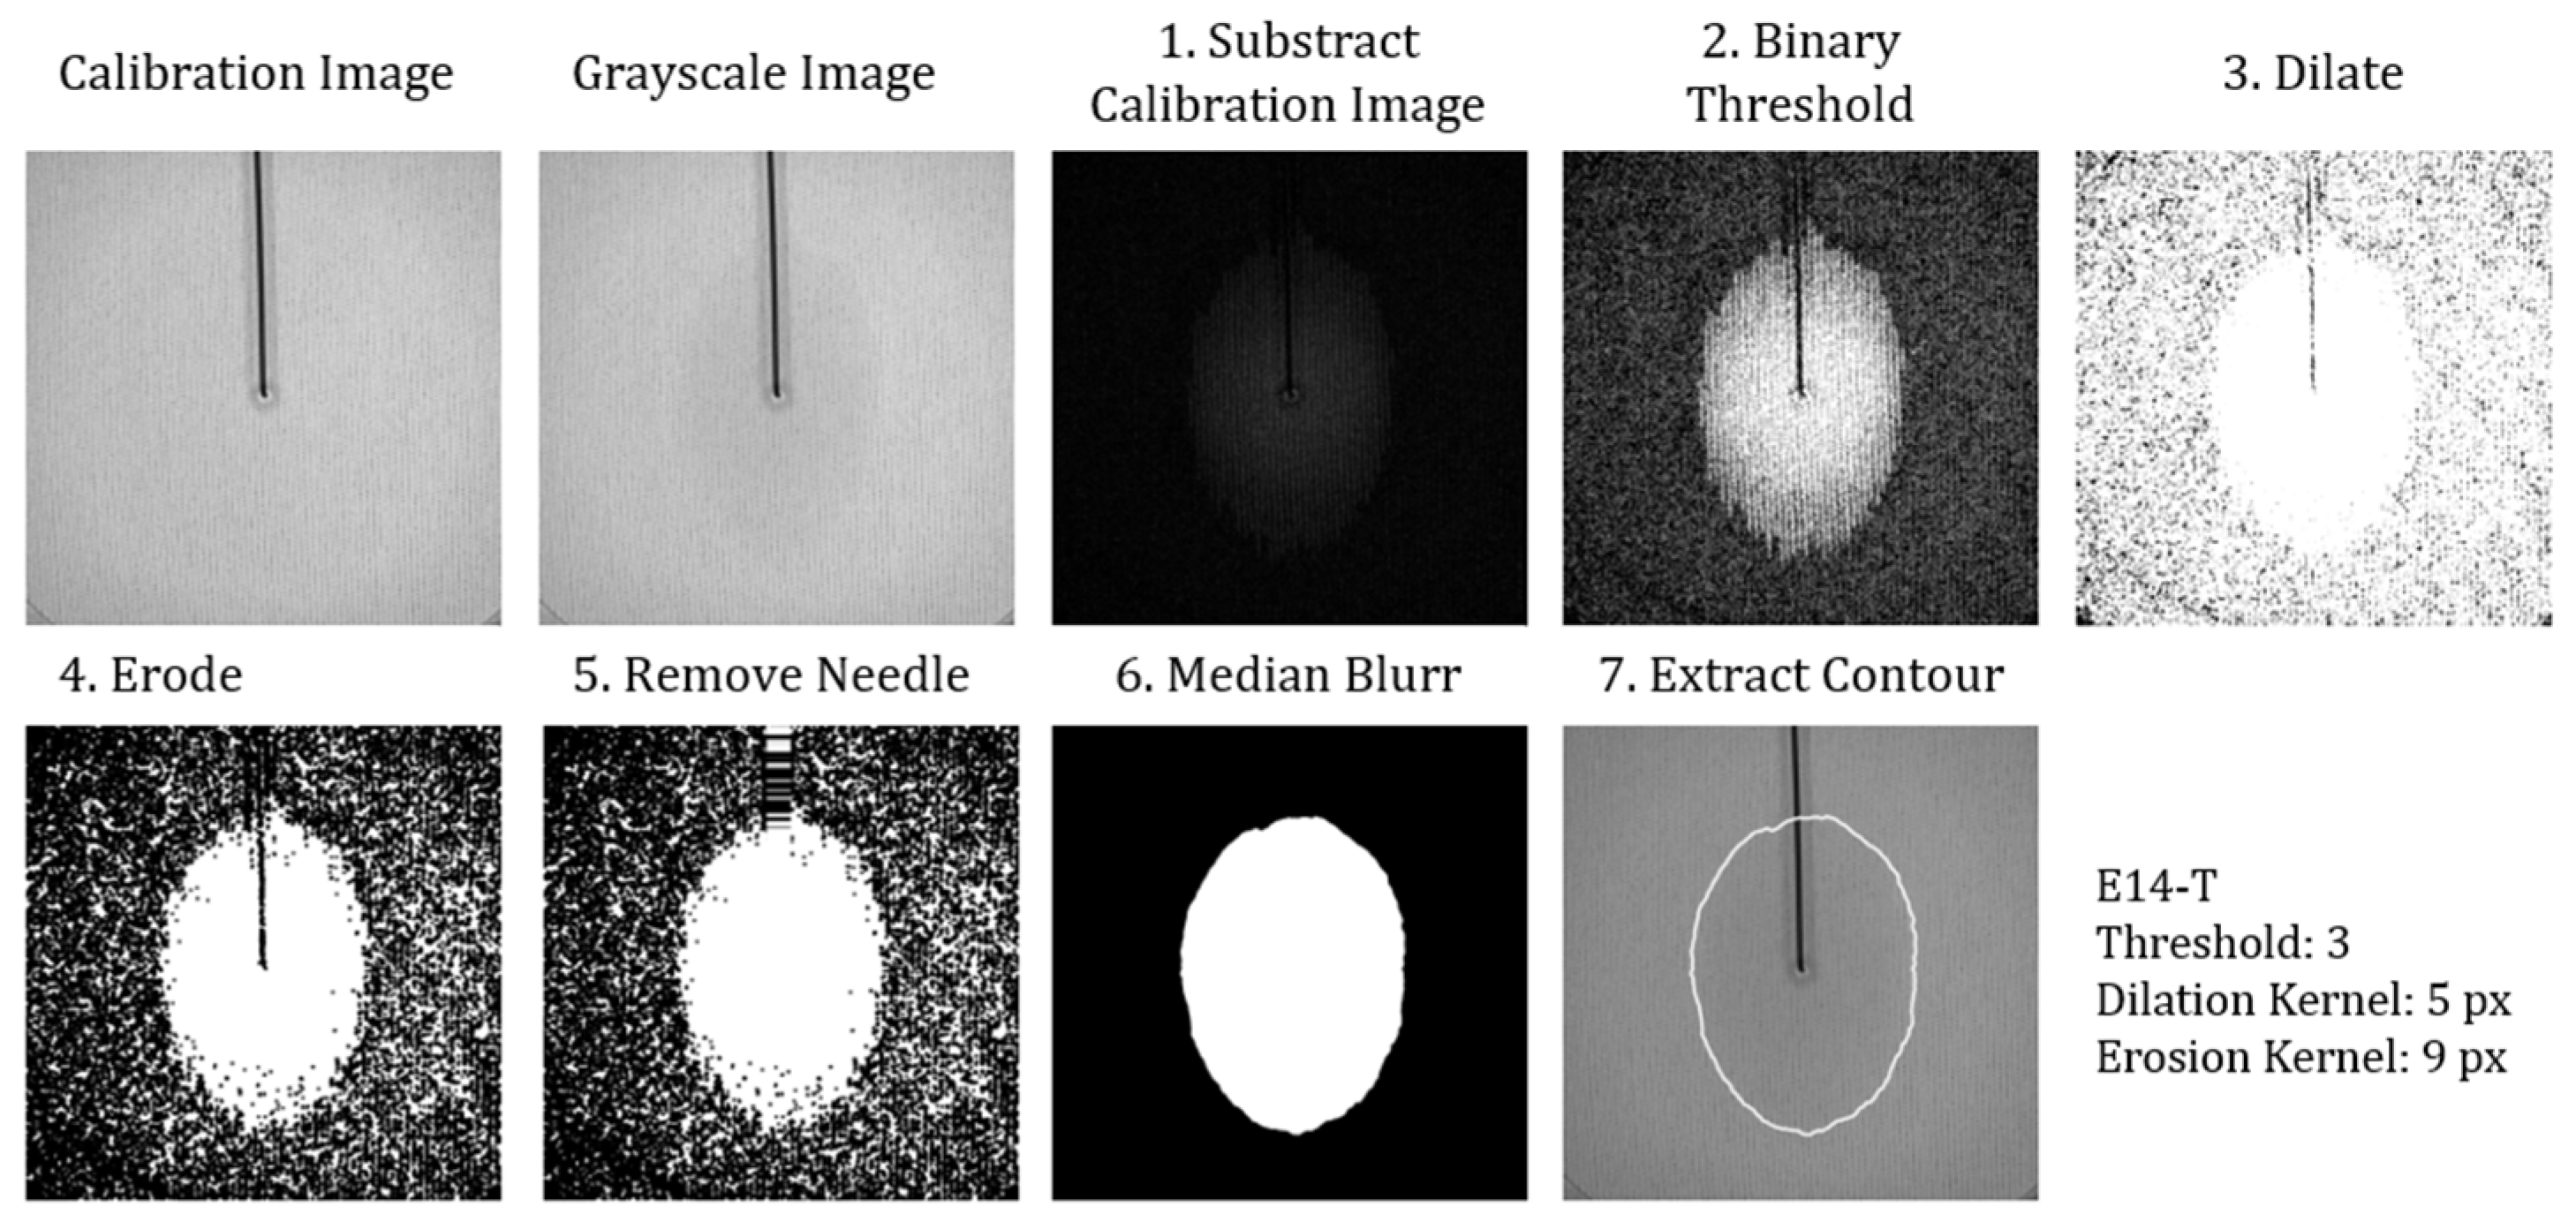
3. Materials and Methods
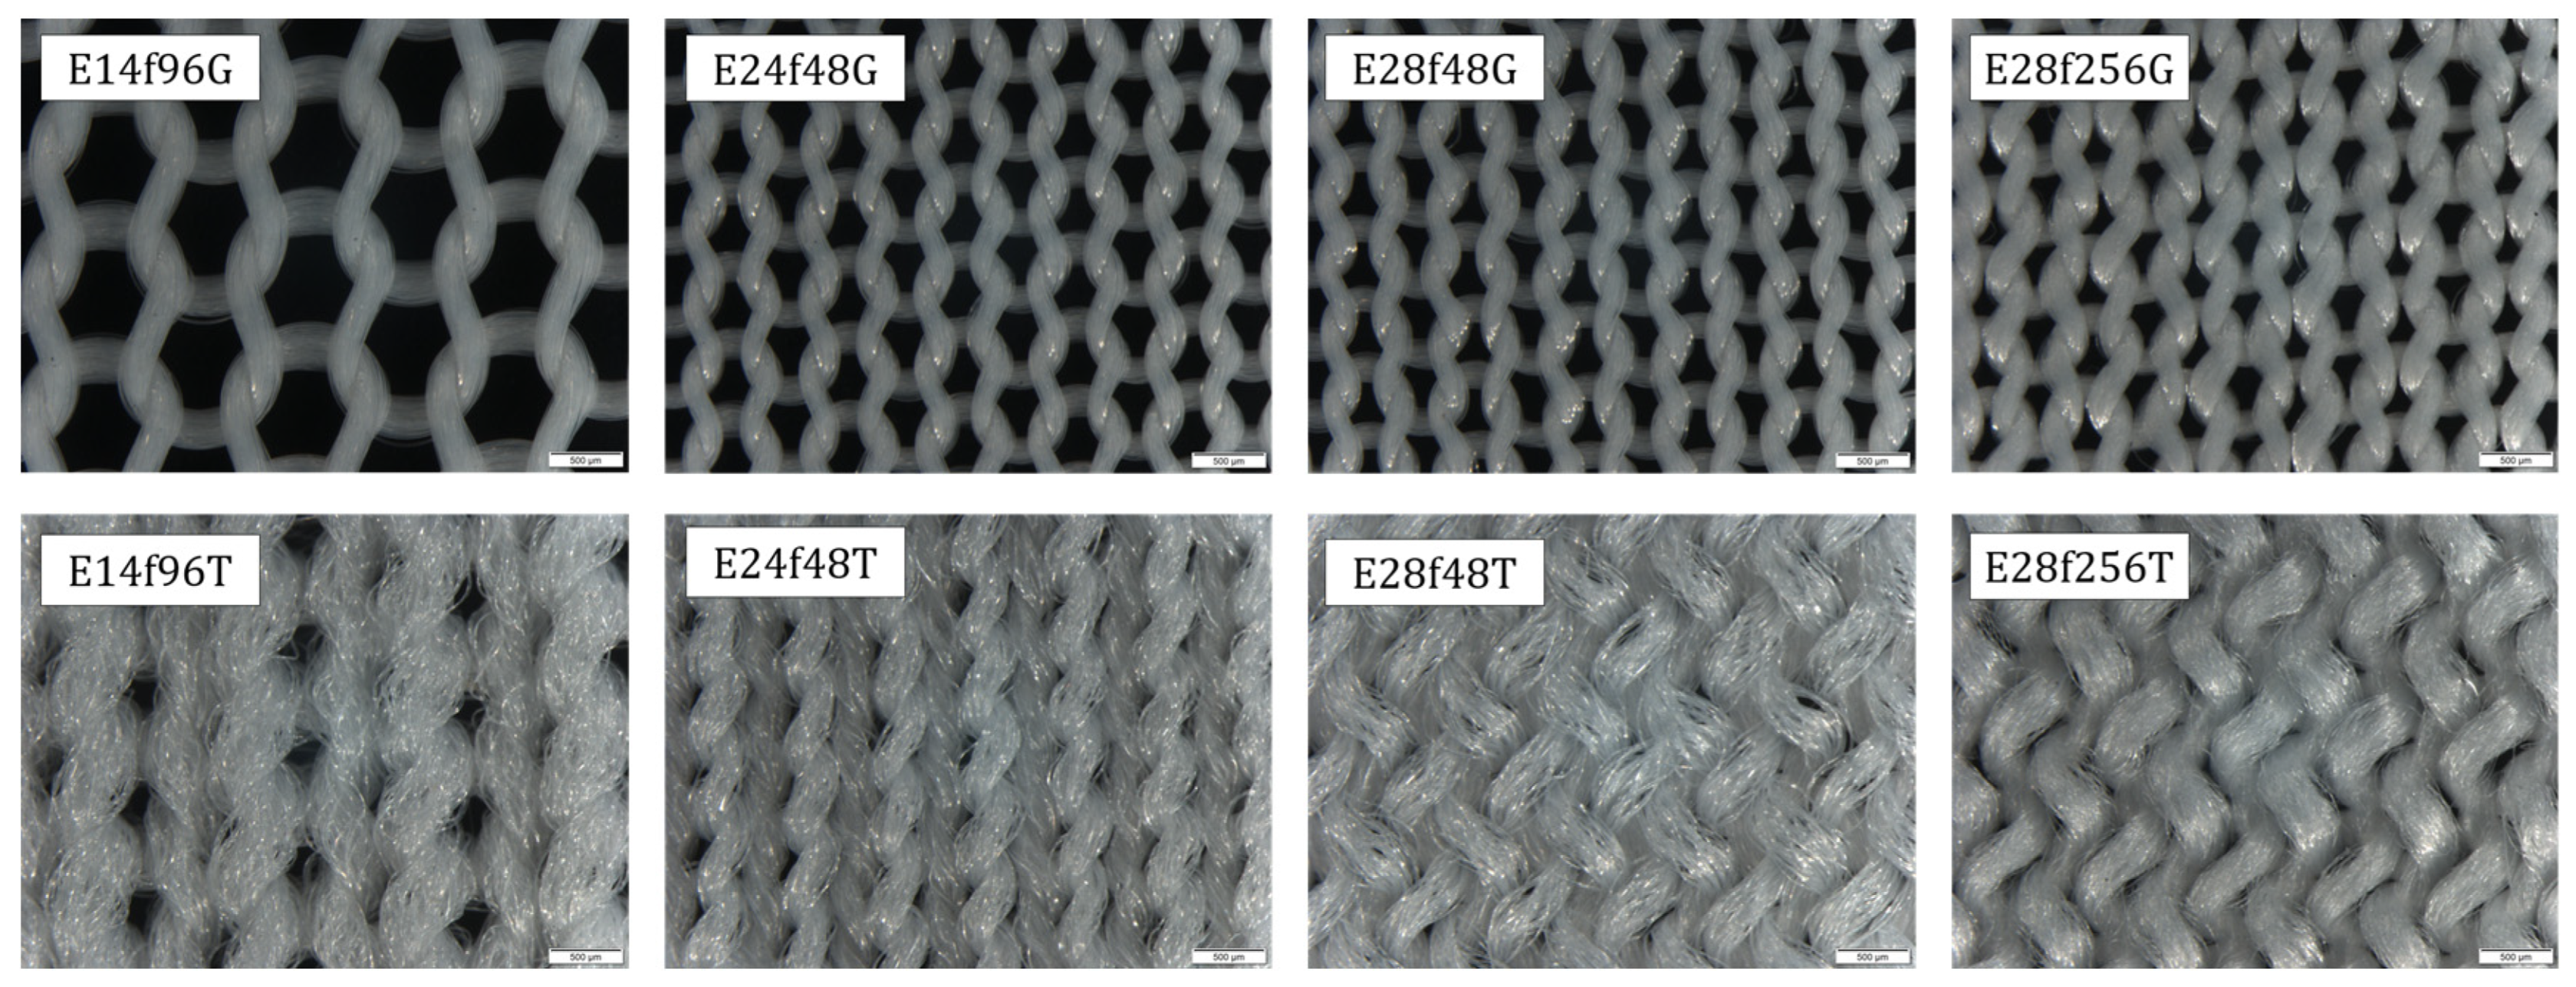
3.1. Materials

To systemically parametrize the characteristic elements of knitted fabrics, eight different single jersey knitted fabrics were produced using polyester (PES) yarns on both flat and circular knitting machines. To investigate the influence of yarn texturisation, smooth yarns (suffix G) and textured yarns (suffix T) were produced with two different filament counts. The yarns were drawn from POY yarns with 48 filaments (f48) and 256 filaments (f256) to yarn linear densities ranging from 180dtex to 196dtex. The textured yarns were texturized during the drawing process by twist-texturization. Yarns were then knitted on a flatbed knitting machine with a gauge of E14 (CMS 330 TC, Stoll, Reutlingen Germany), as well as on circular knitting machines with gauges of E24 (MV4-3.2 16″, Mayer&Cie, Albstadt, Germany) and E28 (MV4-3.2 30″, Mayer&Cie, Albstadt, Germany). For the E14 flatbed knitting machine, the yarns were doubled up to achieve a sufficiently closed fabric structure, resulting in double the yarn linear density and filament count (PES dtex 186 f48/2 and PES dtex 196 f48/2). After knitting, all fabrics were washed in a fine wash programme at 30 °C using IEC 63456 Reference Base detergent and air-dried. The parameters of the fabrics are shown in Table 1.
The fabric thickness ranges from 0.36 mm to 1.01 mm. Texturisation has a significant impact on thickness, resulting in fabric thicknesses that are almost double for textured yarns. Porosities ϕ are calculated using Guidoin’s formula from the thickness d F a b r i c , the density of the polyester fibre ρ F i b e r = 1.38   g m m 3 , and the grammage m F a b r i c [31].
ϕ = 1 m F a b r i c   d F a b r i c ρ F i b e r
The porosities of the fabrics range from 0.73 to 0.87. Textured yarns and coarse fabrics tend to have higher porosities.
As shown in Figure 4, the structure of knitted fabrics differs clearly between non-textured and textured yarns. For non-textured yarns, the yarn path and the single jersey loop shape are clearly visible, as is a distinctive inter-yarn pore in the middle of the loop. For the textured yarns, the yarn path is difficult to discern. The texturisation process leaves the yarn with a residual twist that shifts the loop shape. For the E28 machine gauge, the fine loops in combination with the thick yarn lead to an almost closed fabric surface.
To quantify the bimodal porous structure of the fabrics, the radius of the inter-yarn pores r P ,   Y a r n and the radius of the intra-yarn pores r P ,   K n i t were calculated by the pore model published in a prior publication [1]. This model uses a correlation of the hydraulic diameter to calculate the mean pore size, as well as a logarithmic normal distribution for the intra-yarn pores. An optimised cylinder pore model with normally distributed values was used to describe the inter-yarn pores. These two pore sizes calculated by the model are used to quantitatively characterise the porous structure of the knitted fabric [1]. The non-textured yarns exhibit comparably small intra-yarn radii ranging from 6 µm to 11 µm and large inter-pore radii ranging from 190 µm to 383 µm. The textured yarns showed bigger intra-pore radii ranging from 15 µm to 37 µm and smaller inter-pore radii ranging from 142 µm to 215 µm. Generally, fabrics made from non-textured yarns are compact with small intra-pores, whereas fabrics made from textured yarns are open with larger intra-yarn pores. Inter-yarn pore radii increase in size with machine fineness. Samples from textured yarns show comparable large intra-yarn pores and comparable small inter-yarn pores, which increase in size with machine gauge. Both yarn types exhibit smaller intra-yarn pores in the samples with finer filaments (f256).

3.2. Sample Preparation and Experimental Setup
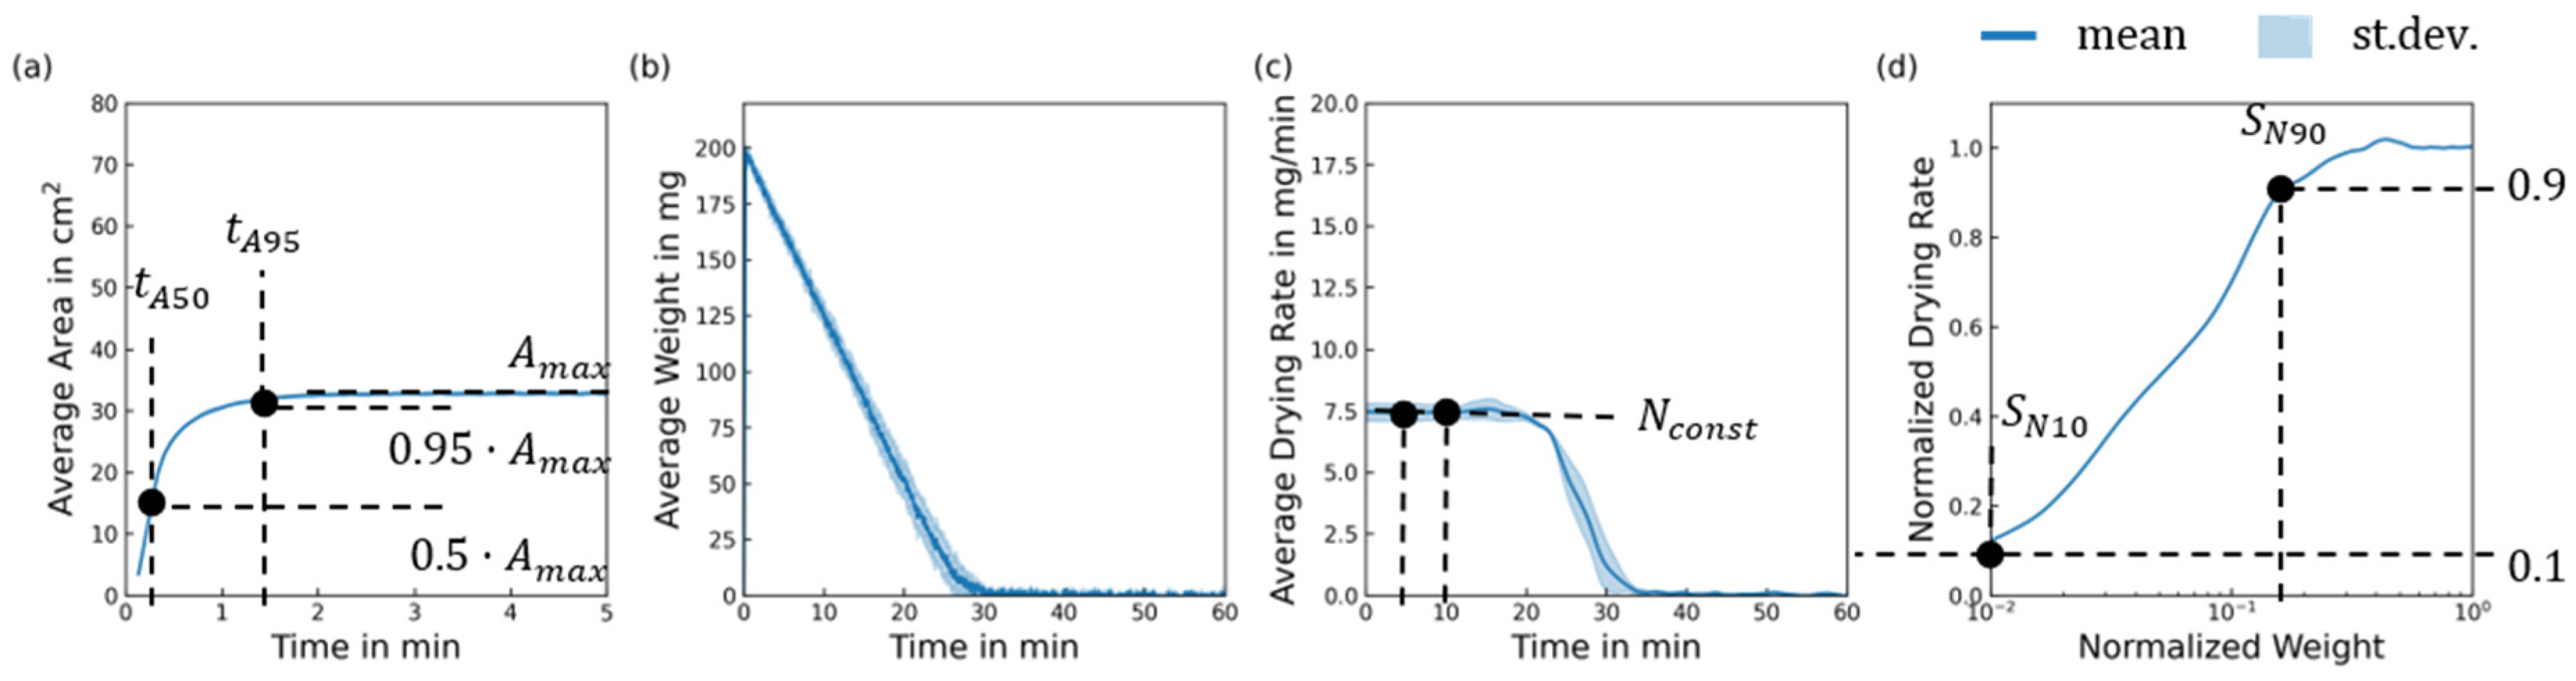
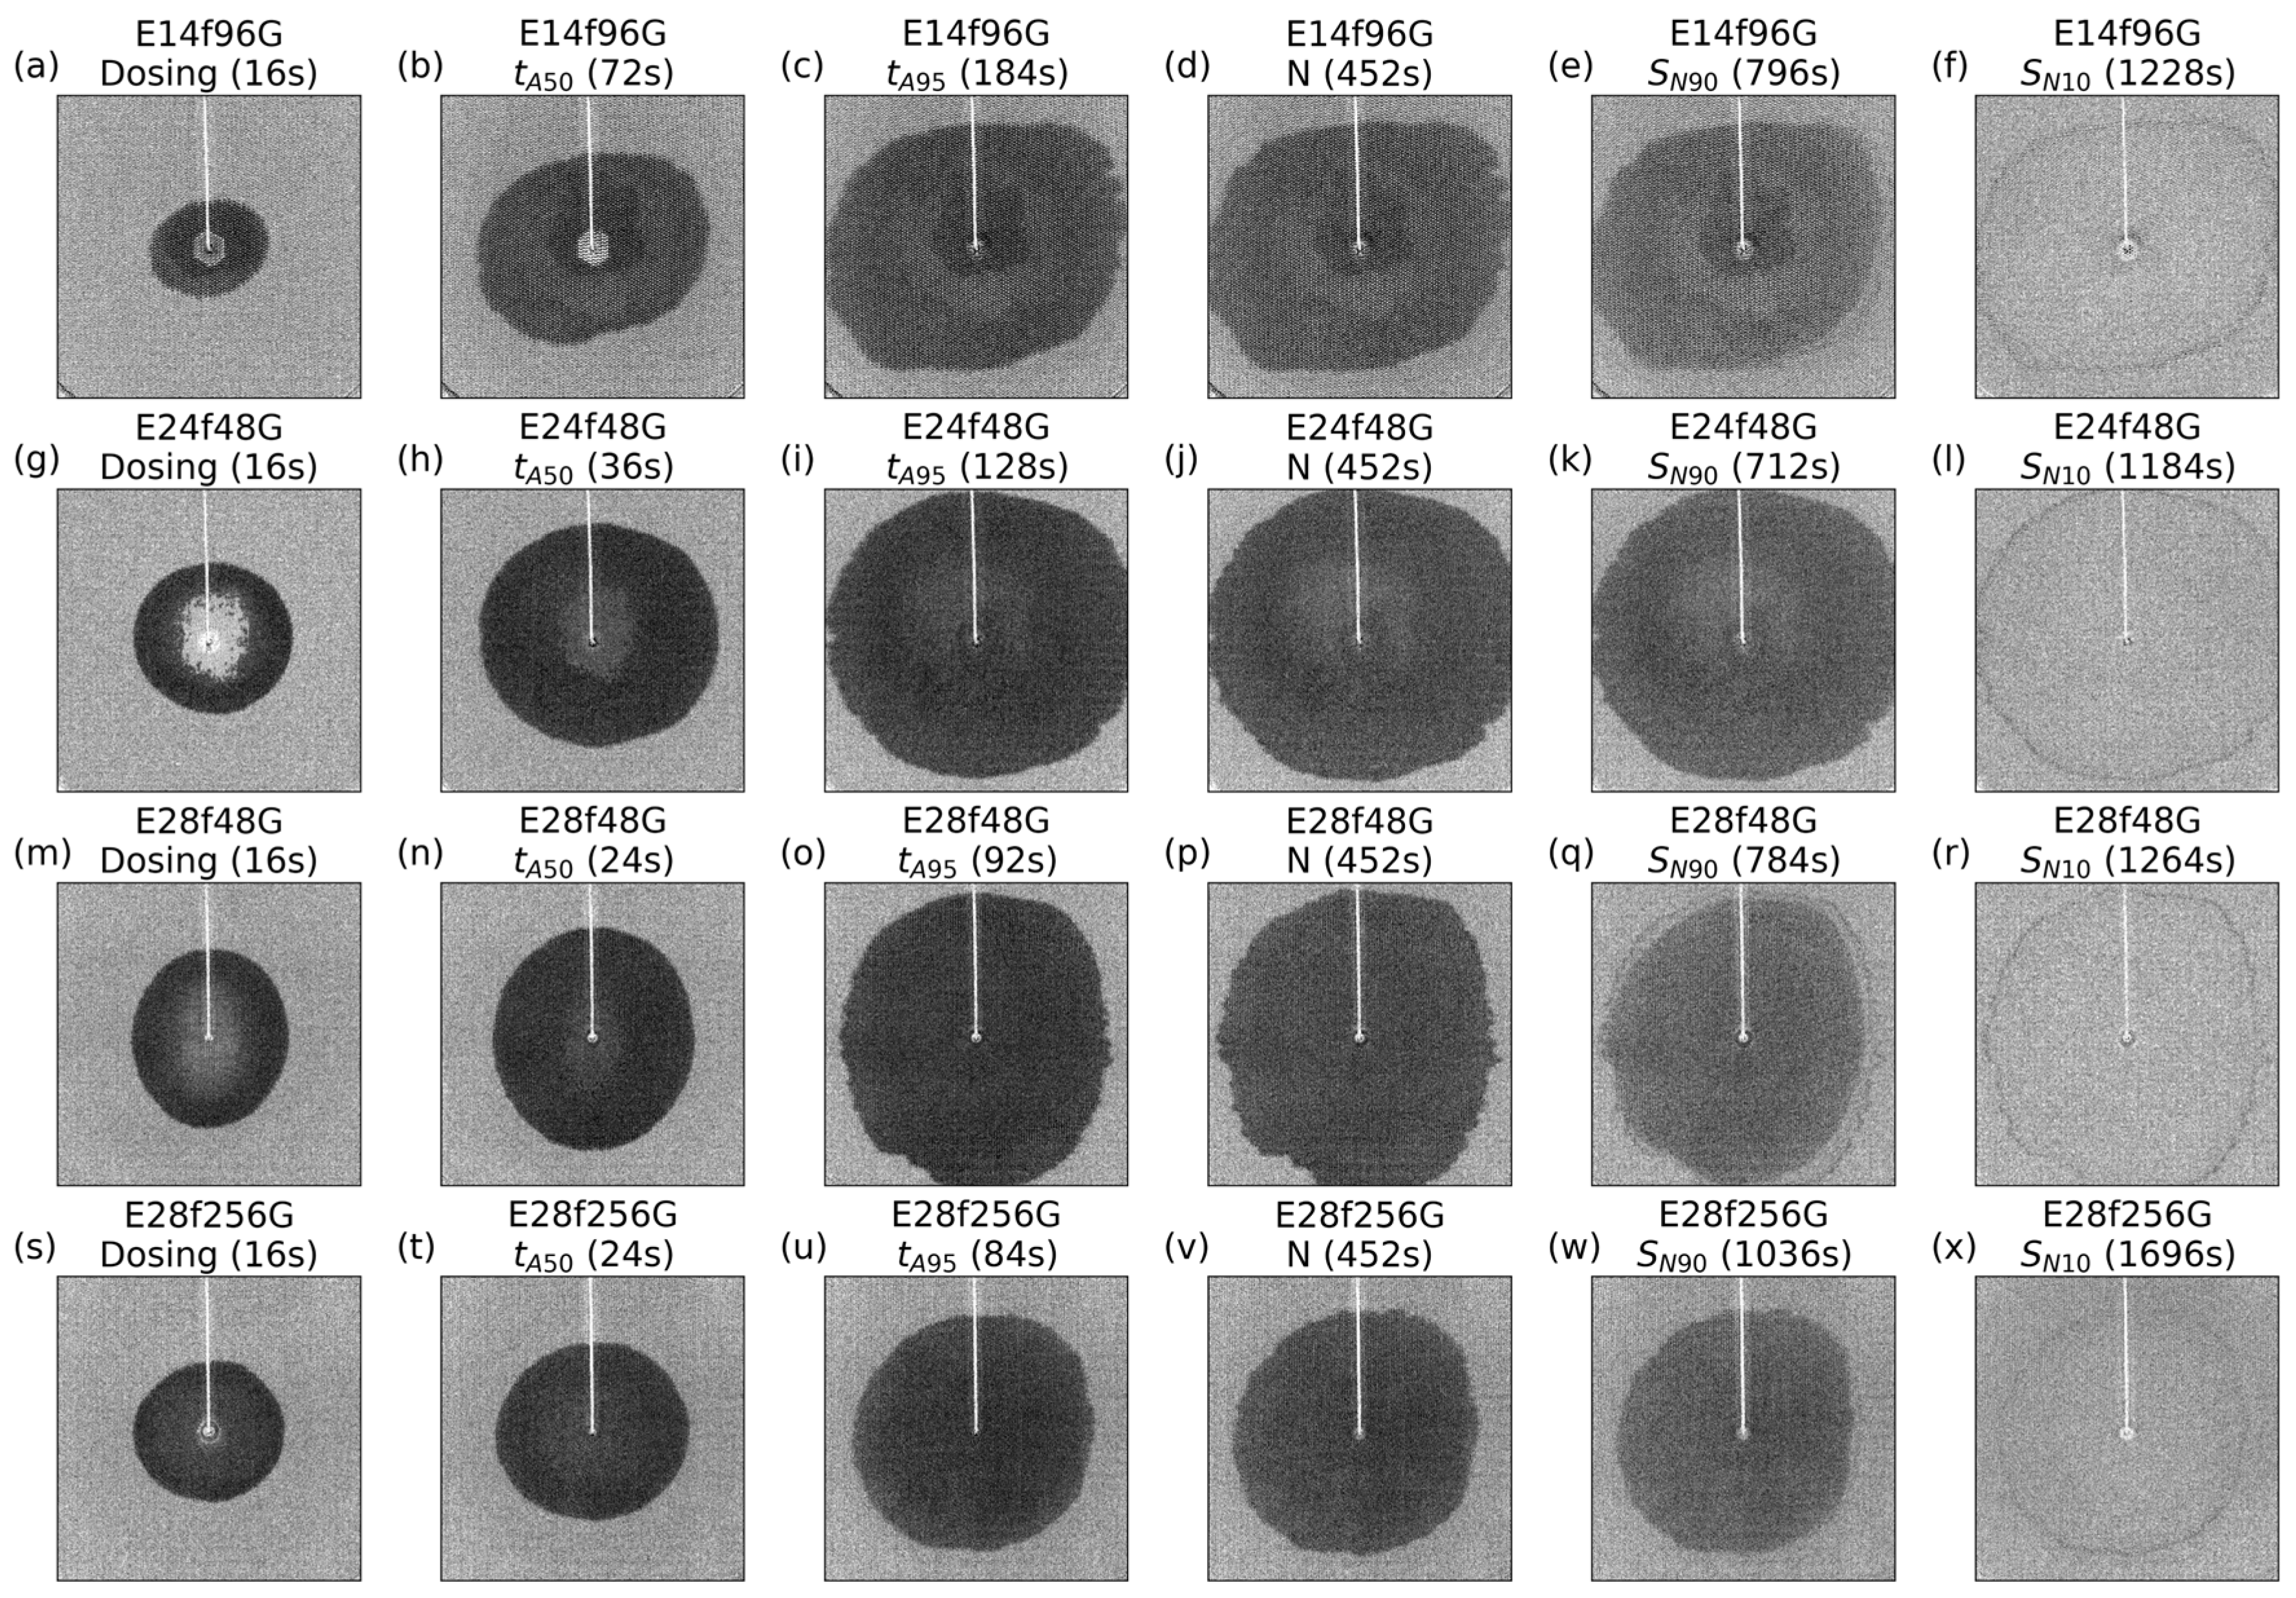
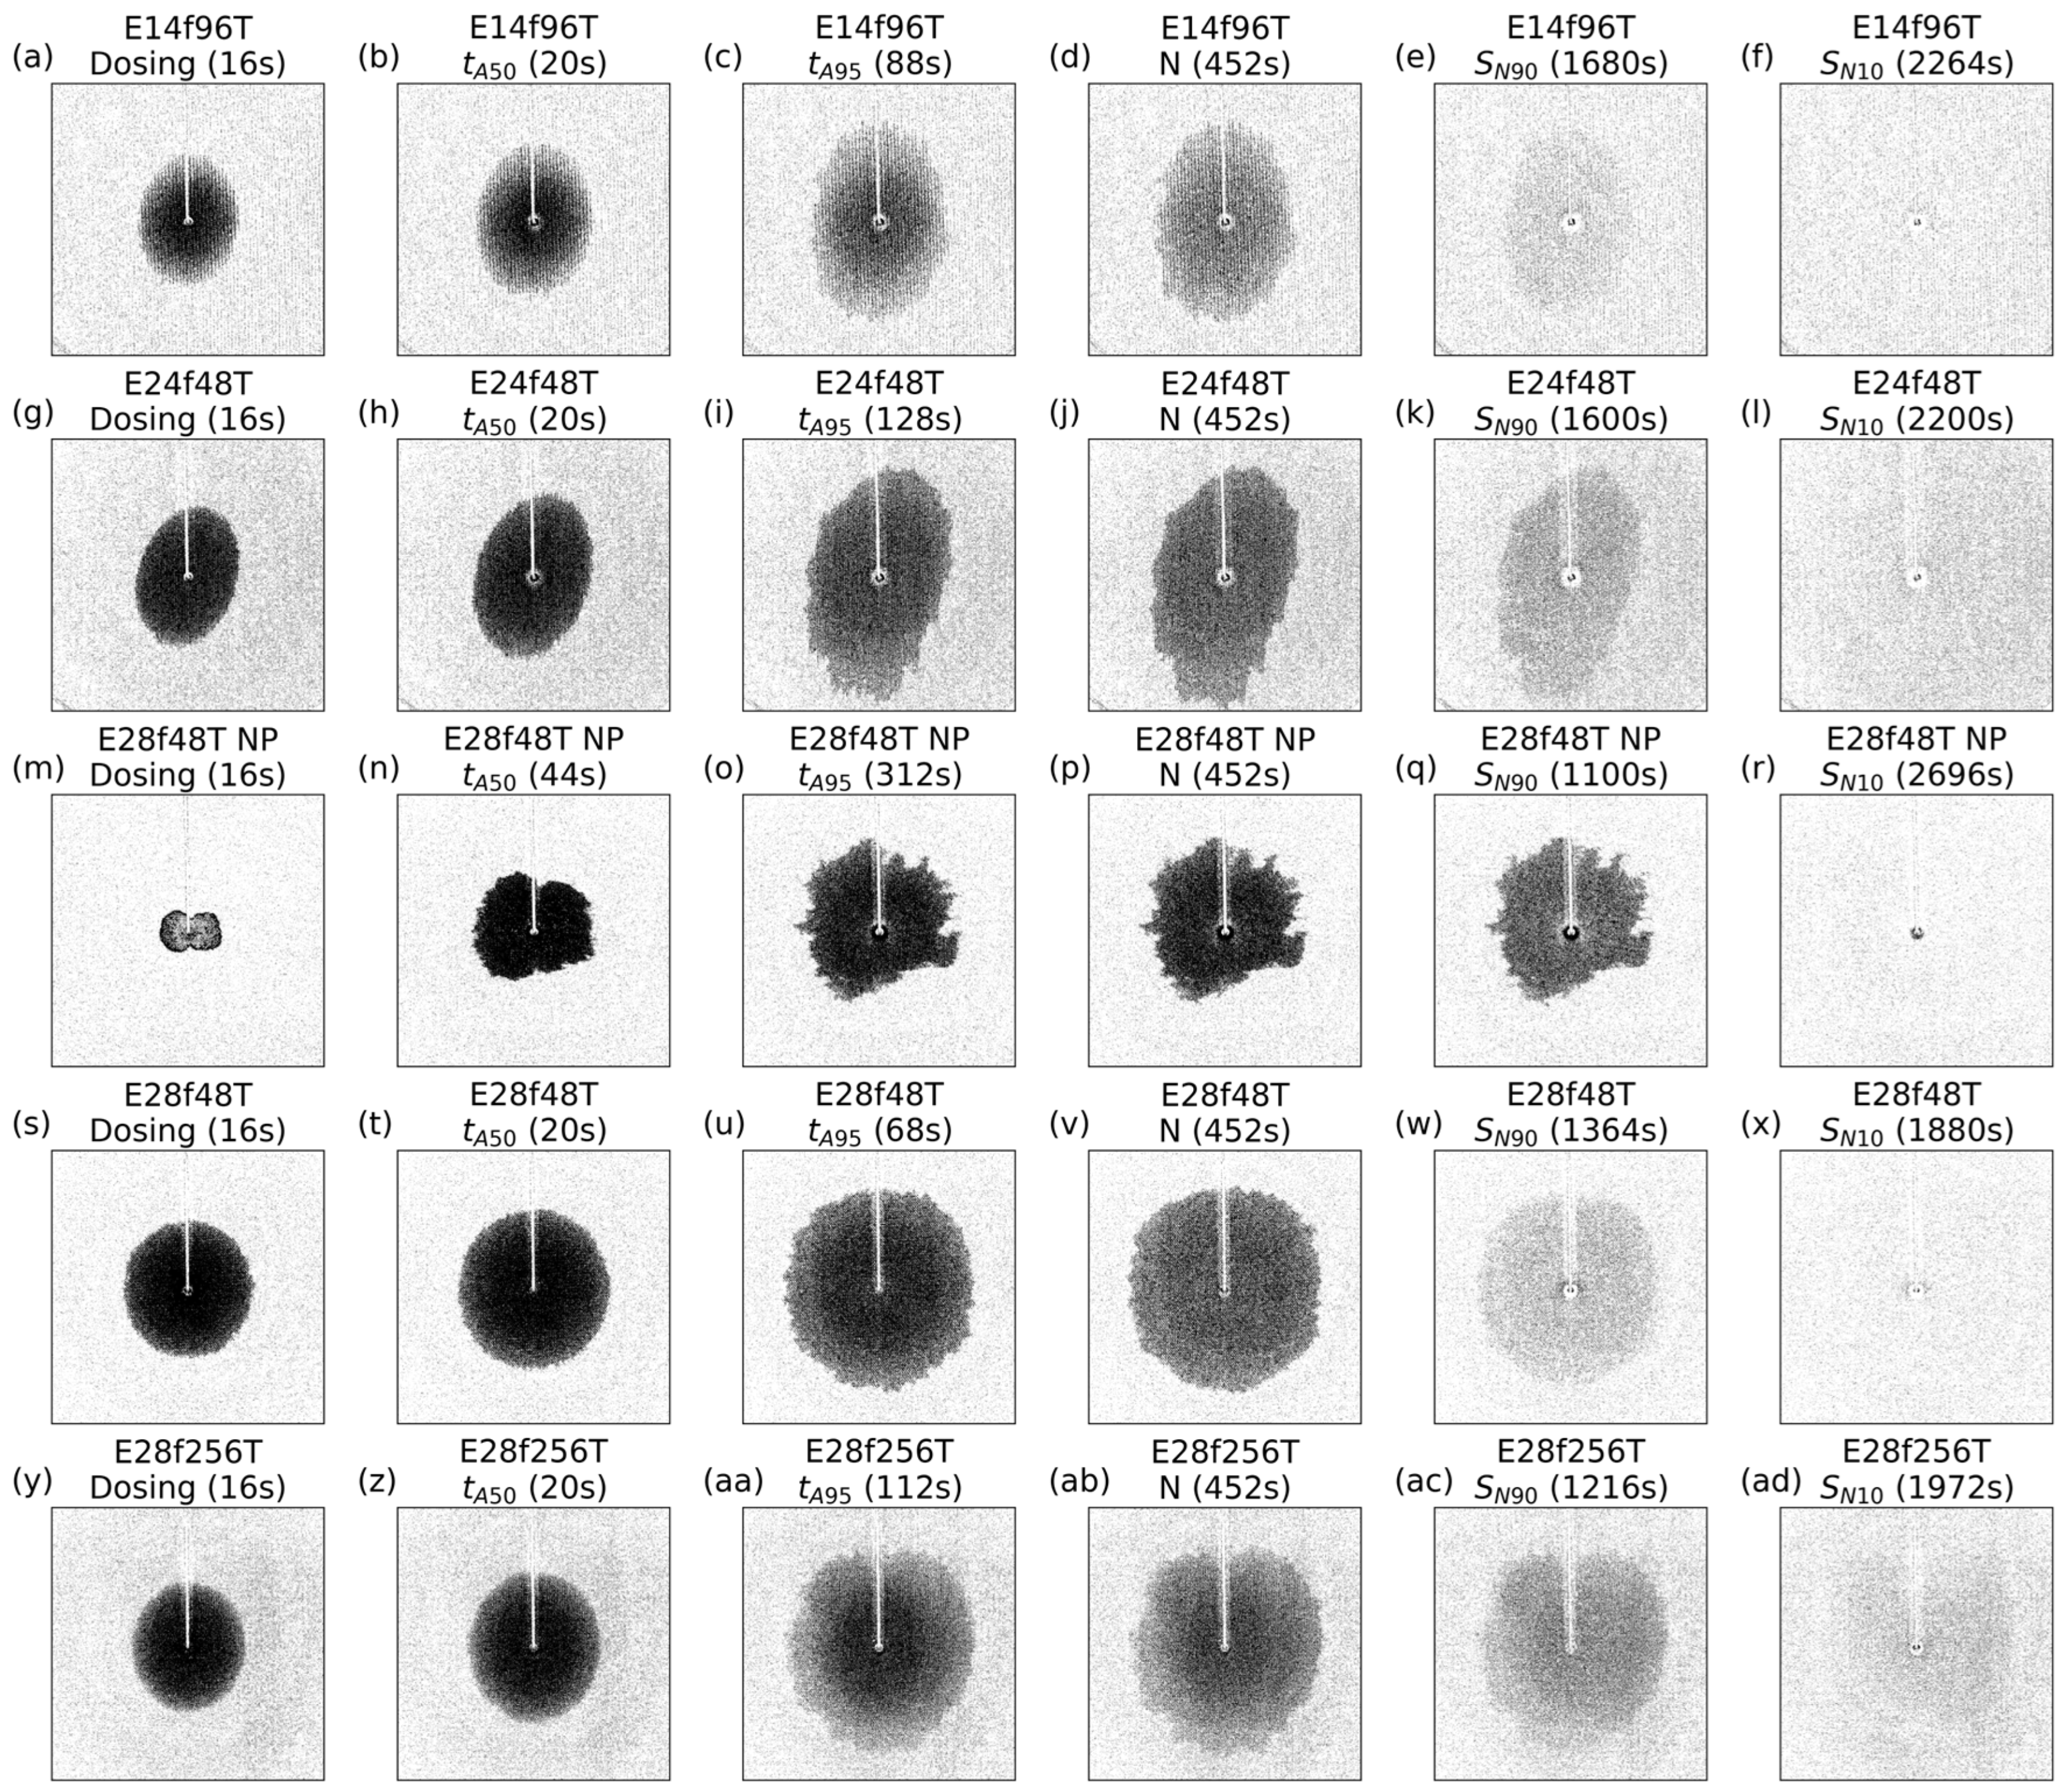
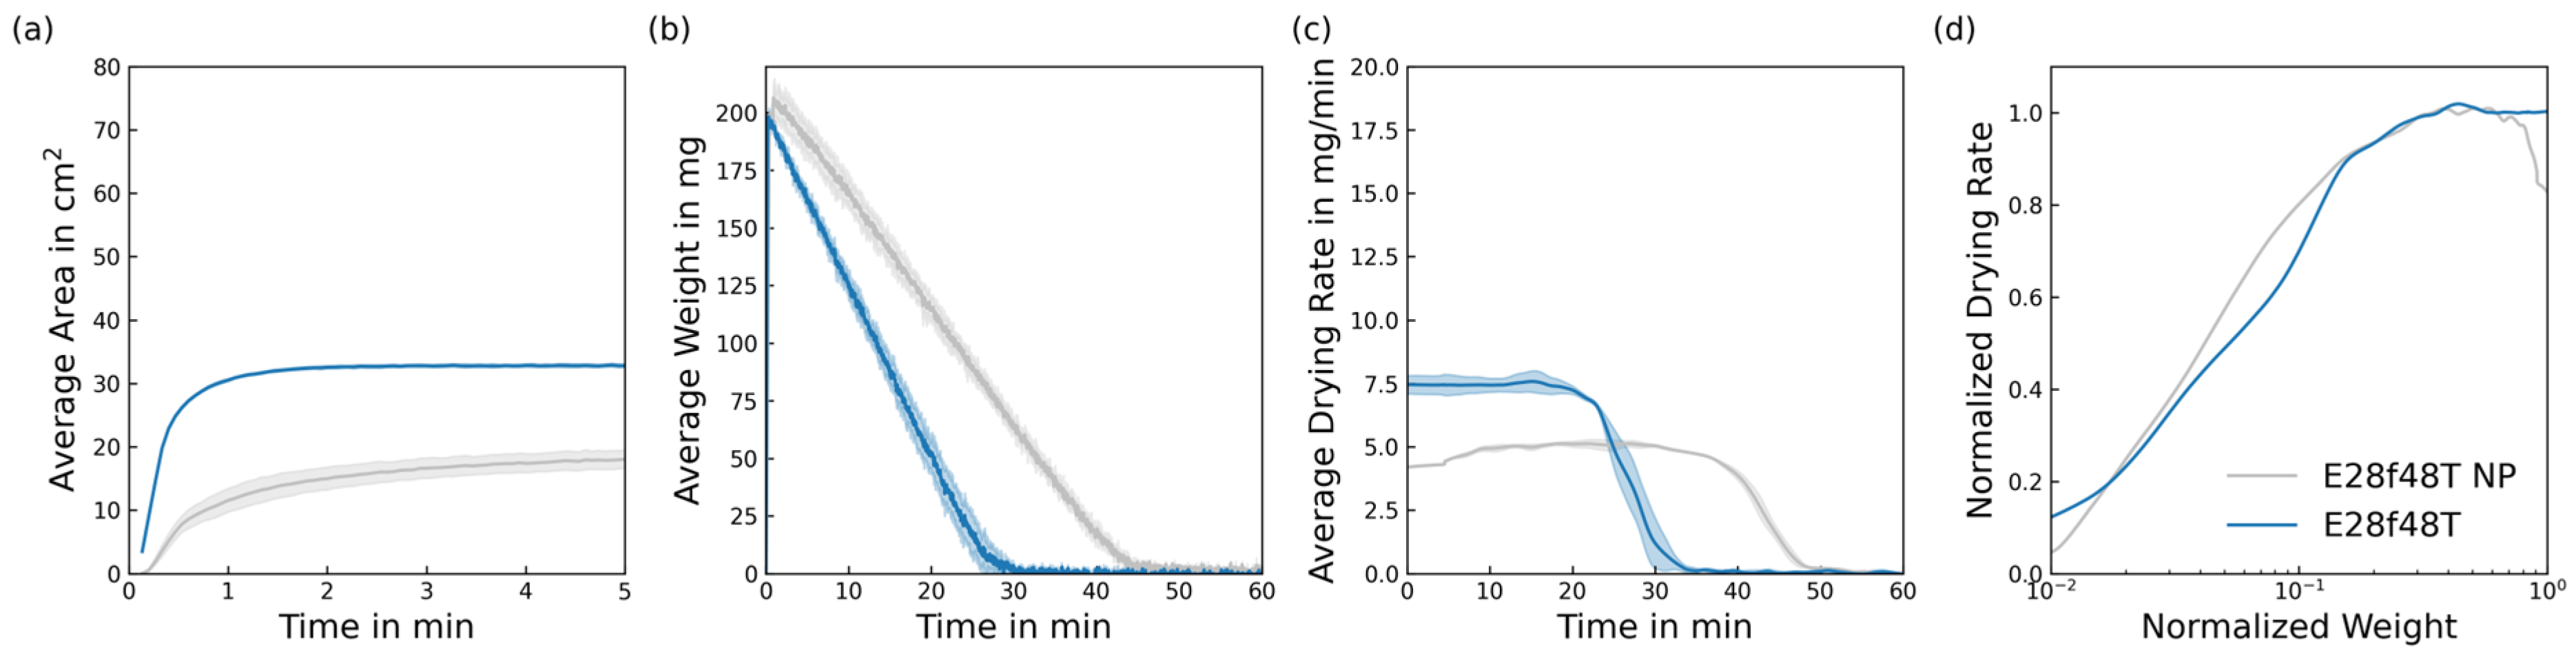
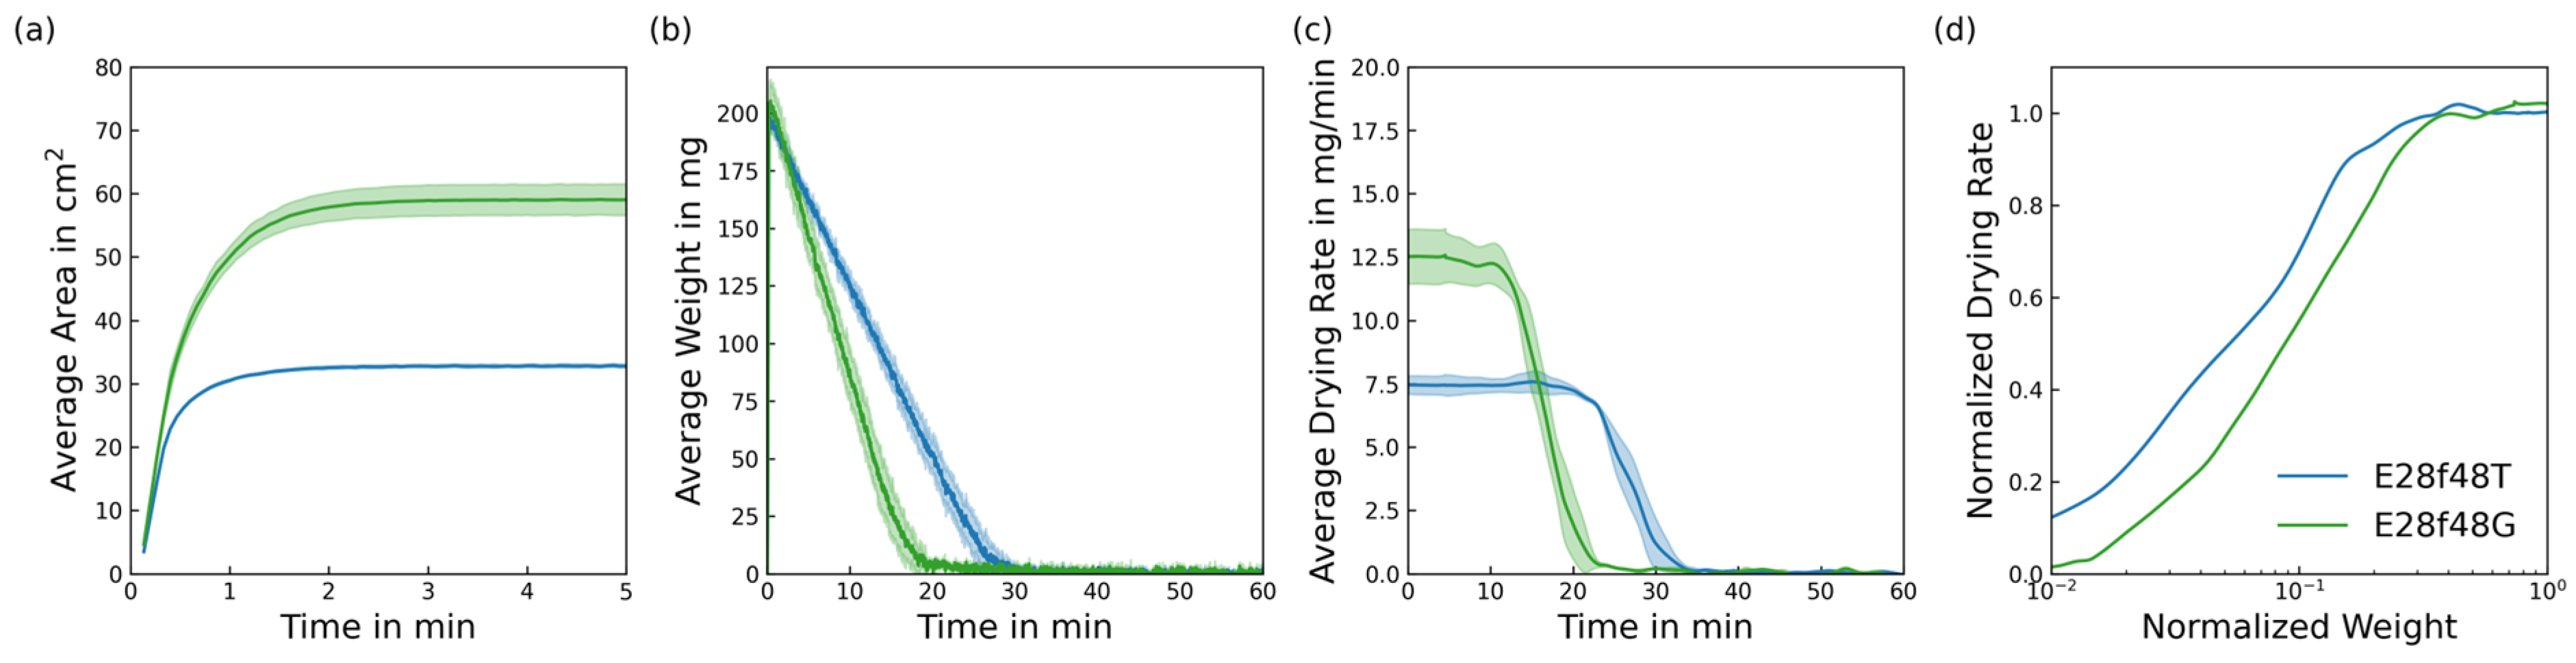
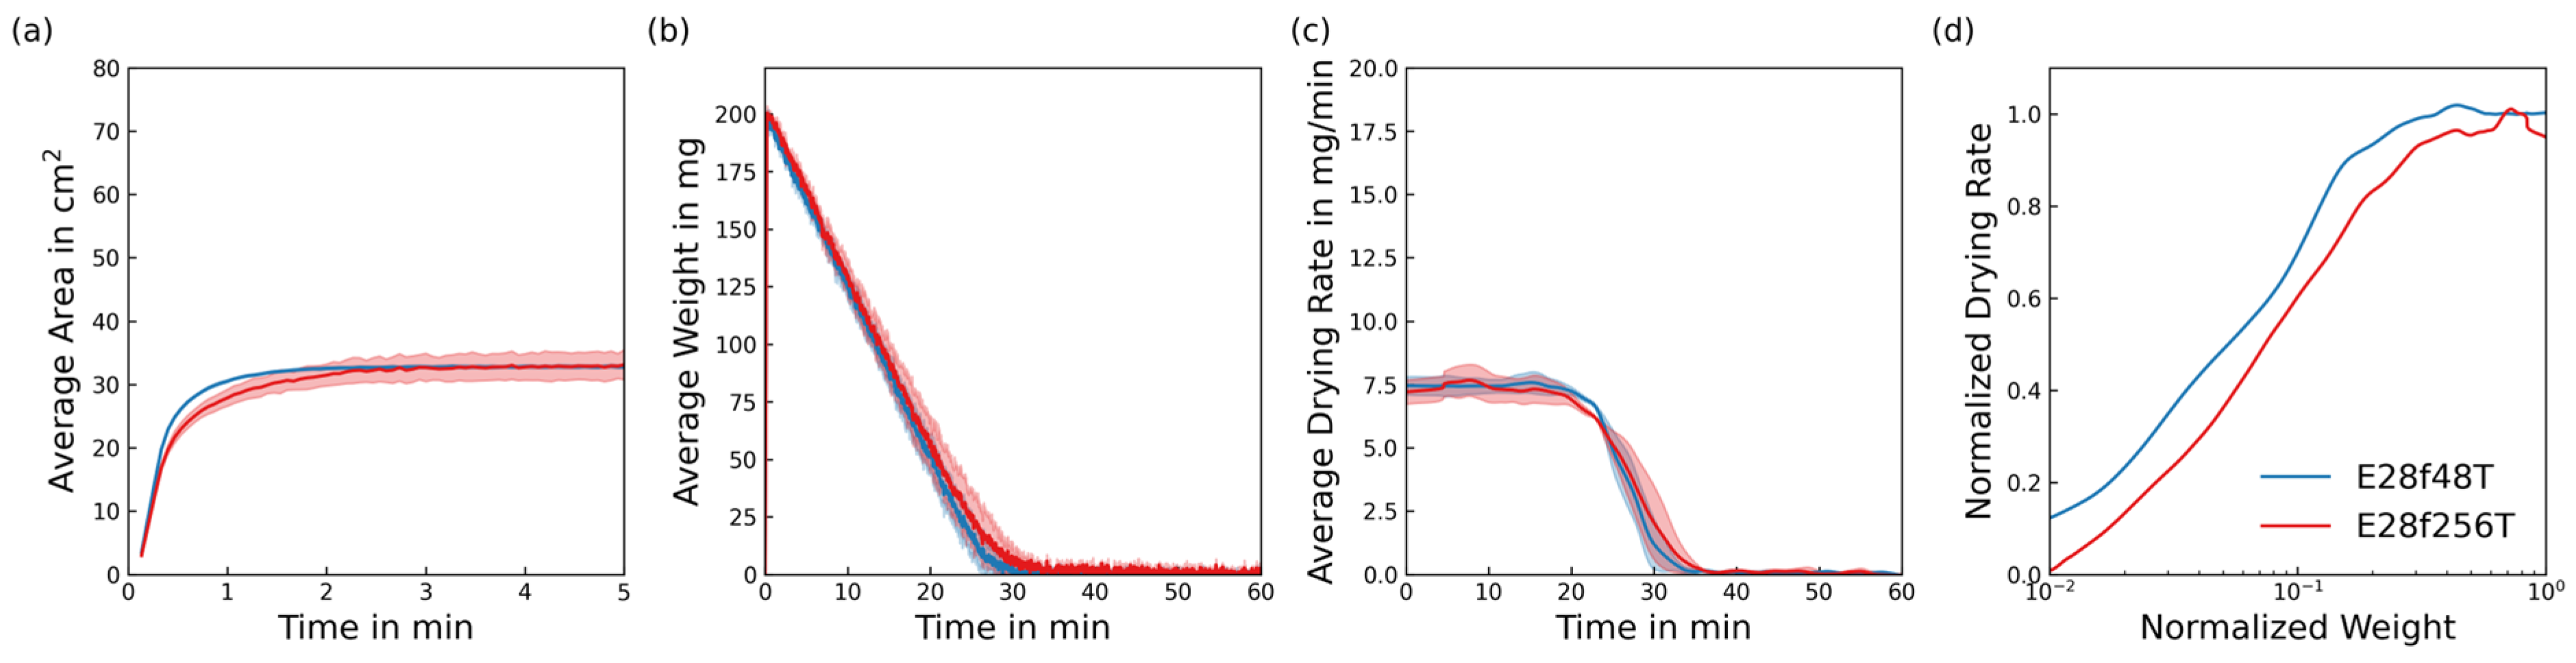
As knitted fabrics are elastic, the geometry of the loops changes under tension. To achieve reproducible loop geometry and prevent the edges of the specimen from curling, the fabrics were stretched to a tension of 10 N/m (3 N across a width of 33 cm, in accordance with EN ISO 13934-1 [32]). In this geometrically fixed condition, the fabrics were glued to an aluminium ring with hot melt. The ring has an inner diameter of 13 cm. Images of the preparation process can be found in prior publications [33].
As polyester exhibits hydrophobic behaviour, the samples were placed in a vacuum plasma chamber (Plasma Processor 500E, Technics Plasma GmbH, Kirchheim, Germany) for three minutes to improve wetting of the fabric. The fabric E28f48T was investigated in two conditions: with plasma treatment (E24f48T) and without plasma treatment (E28f48T NP, No Plasma). This was performed to demonstrate the dramatic effect of wettability on combined wicking and drying behaviour. The fabric E28f48T was chosen for its very closed structure, which makes it comparable to state-of-the-art sportswear fabrics. Three experiments were conducted on different samples of each fabric type to obtain reliable results.
Within 5 min after the plasma treatment, the samples were placed in a combined wicking and drying experiment, as shown in Figure 5. Ambient temperature and relative humidity during the experiments were 24 °C ± 1 °C and 55% ± 10%, respectively.
The experimental setup for the combined wicking and drying consists of a closed housing with two separate compartments. In the lower compartment, a scale (Bosche LB-MC) is lifted with a lab jack, positioning the textile surface 2 cm above the compartment separator. To maintain constant conditions in the upper compartment, two fans generate a slight airflow of around 0.1 m/s through the housing. After placing the sample, the housing is closed, and the setup is left for one minute to obtain constant air flow conditions. Then, 0.203 ± 0.005 mL of distilled water is dispensed at a rate of 1 mL/min to the middle of the specimen. The water is applied through a needle with an inner diameter of 0.2 mm from a height of 2 cm by an automatic dosing device (LA-100, Landgraf Laborsysteme HLL, Langenhagen, Germany), located outside of the housing. The weight loss of the sample is recorded every second. A USB camera (1920 × 1080 px) with a LED ring light takes pictures of the sample from above every four seconds. These images are used to obtain information about the liquid front and the resulting wicking dynamics.
After the experiment, the liquid front is extracted using an imaging algorithm implemented in Python 3.12 [34] using the OpenCV 4.9.0.80 library [35]. Figure 6 shows the steps of the image manipulation algorithm.
Before the dosing begins, a calibration image is taken, and the subsequent images are subtracted from it. As the contrast is not high enough to determine the liquid front, a threshold specific to the fabric is applied. White areas are then dilated and subsequently eroded using fabric-specific kernel sizes. The needle, which was previously extracted from the calibration image, is removed. A median blur filter is applied to remove residual noise. Finally, the contour of the liquid front can be extracted from the image. Details of the filtering functions can be found in the OpenCV documentation [35]. The parameters of the thresholding, dilation and erosion are fabric-specific because inter-yarn pores strongly influence the imaging.

4. Results

4.1. Quantitative Analysis

The combined wicking and drying behaviour is analysed using four graphs. Three different samples of each fabric type were examined, and the mean and standard deviation of these three experiments were then analysed. Figure 7 shows these measures in the corresponding graphs. To quantify the wicking and drying behaviour, multiple measures are extracted from the mean data.
Figure 7a: The imaging algorithm calculates the average area and plots it over time. This graph shows the liquids spread across the fabric surface for the first five minutes of the experiment. A m a x is the maximum area of spread calculated from the data. To quantify the dynamics of the liquid spreading, the times t A 50 and t A 95 are calculated. These times indicate when the spread area reaches 50% and 95% of A m a x , respectively.
Figure 7b: The average weight loss over time is the raw data for calculating the graphs (c) and (d), and shows the overall drying behaviour.
Figure 7c: The average drying rate over time is calculated from the weight loss data using Python 3.12. This involves applying a median filter (kernel value: 5) to the raw data and subsequently applying a LOWESS filter (locally weighted scatterplot smoothing, kernel value: 0.1). The drying rate is then calculated from the gradient of this smoothed data. The constant drying rate N is calculated when the area is almost at its maximum. This is between minutes 5 and 10 for all plasma-treated samples and between minutes 15 and 20 for the non-plasma-treated sample E28f48NP. The specific drying rate n is calculated by dividing the drying rate N by the maximal spread A m a x to
n = N A m a x
Figure 7d: The normalised drying rate over normalised weight is characteristic of a substrate’s drying behaviour. The normalised drying rate is the drying rate at a specific timestamp divided by N. The normalized weight is the average weight at this timestamp divided by the weight of the initially applied liquid mass. Despite saturations not being constant across the spreading area, this graph provides insight into the effect of the structure on drying. This graph uses a logarithmic scale to reflect the logarithmic nature of the FRP reported by Cay [14], and because the behaviour at small normalised weights is particularly interesting for textiles. Normalized weight S N 90 , where the normalized drying rate is reduced to 90%, is calculated as an equivalent to the critical moisture content S c r i t , where the transition between CRP and FRP takes place (see Figure 3a). For effective drying, a low S N 90 is desirable. As an additional measure of the FRP, the saturation at which the normalised drying rate is 10% of the maximum is denoted S N 10 . High values of S N 10 indicate that a large amount of liquid is drying at a low rate, which delays complete drying. The slope m F R P of the decreasing drying rate is calculated using the points S N 90 and S N 10 in order to quantify the FRP.
m F R P = 0.8 S N 90 S N 10
The extracted quantitative drying properties from all experiments are shown in Table 2 and are discussed below.
E28f48G has the highest constant drying rate N of 12.27   m g m i n , which correlates well with its highest maximum spread A m a x of 59.0 cm2 being the highest among all fabrics. Other fabrics made from non-textured yarns have comparable drying rates and spreads, except for E24f256G, which exhibits a lower spread and drying rate. Textured yarns have significantly lower spread and drying rate due to their higher thickness. For the samples made from textured yarns, the finer fabrics E28f48T and E28f256T show the highest spreads and drying rates. The fabric without plasma treatment, E28f48TNP, exhibited the smallest spread and constant drying rate.
The specific drying rate is lowest for fine gauge fabrics made from non-textured yarns E28f48G and E24f48G at 0.21   m g m i n c m 2 and highest for E14f96T at 0.28   m g m i n c m 2 . E14f96T is the thickest of all fabrics, which shows that the thickness does not necessarily inhibit the drying process as reported by Önal [15].
Initially, all plasma-treated fabrics made from textured yarns exhibit similar spreading dynamics with a t A 50 of 20 s. The non-plasma-treated sample E28f48TNP wicks significantly more slowly with a t A 50 of 44 s. Fabric made from non-textured yarns shows significantly higher t A 50 values, ranging from 24 to 72 s. Early wicking dynamics increase with machine gauge and are independent of filament count.
The late dynamics of the spread, as indicated by t A 95 , show a similar trend as that of t A 50 for the non-textured yarns: t A 95 increases with machine gauge. The sample with the fine filaments E28f256G wicks slightly lower than E28f48G. For the textured samples, the dynamics are significantly slower at the finer filaments sample E28f256T at 112 s compared to E28f48T at 68 s. Consequently, the impact of fine filaments on wicking dynamics differs between textured and non-textured yarns. Highest value with a t A 95 of 312 s is shown by the non-plasma treated sample E28f48T NP. This demonstrates the importance of wettability in facilitating the rapid distribution of liquid in fabric, as compared to the impact of structure on liquid spread.
S N 90 is the measure that expresses the transition from CRP to FRP. The highest value is measured with a value of 0.29 for the coarsest fabric from the non-textured yarn E14f96G, indicating a short CRP and a long FRP. Slightly lower values are measured on the samples with the fine filaments, with 0.27 for both E28f256T and E28f256G. Low values of S N 90 are measured for the samples made from textured yarns, with E28f48TNP showing the lowest value of 0.15. The highest values of S N 90 and S N 10 are shown by E14f96G and E28f256G, indicating that a large amount of liquid is wicking into the yarn and is not immediately available for evaporation at the surface. This suggests that fine filaments and thick, compact yarns ultimately slow down fabric drying.
Analysing the slope of the FRP shows that the highest value of m F R P on the non-plasma-treated specimen E24f48T NP. Combined with the lowest S N 90 , this fabric remains in the CRP for the longest at a constant drying rate before dropping quickly to almost zero. Within the fabrics made from the same yarn type (G, T), similar slope values indicate that drying in the FRP is significantly influenced by the yarn structure. For both G and T yarn types, fabrics made from finer filament yarn show similar, significantly lower values of 3.2 for m F R P . This suggests that in the FRP, drying is inhibited by the diffusion-driven liquid transport in the yarn, which is reduced in the smaller intra-yarn pores.

4.2. Qualitative Analysis of Wicking Fronts and Local Saturation

Figure 8 and Figure 9 show images at the imaging step of the thresholding process for non-textured and textured yarns, respectively. Images after the dosing and at the specific timestamps discussed in Section 3.1 are shown to analyse the macroscopic form of the wicking fronts and liquid distribution in the wetted fabrics.
Fabrics made from non-textured yarns, as shown in Figure 8, generally have a larger spread than fabrics made from textured yarns, as shown in Figure 9. The macroscopic shape of the spread area for coarser fabrics made from non-textured yarns, such as E14f96G and E24f48G, is elliptical, with greater spread in the weft direction (see Figure 8c,i). This correlates with the size of the inter-yarn pores, which facilitate the main transport of liquid through the yarn. For the coarser yarn in fabric E24f48G, the main direction of spread is in the warp direction. Liquid transport from yarn to yarn at the binding points is apparently facilitated by the coarser filaments. For the finer filaments in fabric E28f256G, however, no main direction can be observed as the liquid front is almost circular.
The presence of water in the inter-yarn pores creates mirroring effects, resulting in bright spots around the needle (see Figure 8a,g). In the case of fabric E14f96G in particular, the inter-yarn pores remain saturated with liquid for a long time, and a distinct liquid front is visible between the filled and unfilled pores (Figure 8b), as reported by Parada [12]. For finer fabrics, however, this front is more fractal and disappears earlier as the liquid soaks into the intra-yarn pores (see Figure 8h,i).
The fabrics made from textured yarns exhibit significantly different macroscopic shapes of wicking fronts, as can be seen in Figure 9. The skew of the E24f48T knitted fabric appears to influence the direction of wicking (see Figure 9g–l), with the main direction being the warp direction (vertical in the image). This effect is less pronounced for the finer E28f48T and E28f256T fabrics, where the inter-yarn pores are rather small. For all fabrics made from textured yarns, a contrast gradient is visible from the tip of the needle to the wicking front. The local brightness correlates qualitatively with the local saturation in the binarized images after thresholding. Different wicking fronts as reported by Parada can be qualitatively observed for all plasma-treated samples from textured yarns at different times, e.g., E14f96T (Figure 9b,c), E24f48T (Figure 9i), E28f48f48T (Figure 9u), E28f256 (Figure 9aa). The gradient of the local saturation gradient appears wider for the finer filaments of E28f256T (Figure 9aa) and is almost non-existent for the non-plasma-treated specimen, E24f48T NP (Figure 9o). The saturation gradient diminishes at the end of the drying process, while the spread area remains constant (e.g., Figure 9c vs. Figure 9e).

5. Discussion

5.1. Wetting Behaviour

As mentioned in the introduction, wetting and wicking depend on the surface energies of the wetted surface and the wetting liquid. During plasma treatment, the fibre surface becomes more hydrophilic. Figure 10 shows the experimental results for the more hydrophilic sample E28f48T (with plasma treatment) and the more hydrophobic sample E28f48T NP (without plasma treatment).
As can be seen in Figure 10a, the two samples exhibit significant differences in the wicking dynamics. The plasma-treated sample shows faster expansion of the liquid front and a maximum spread area that is almost twice as high. The improved wettability of the plasma-treated sample enhances capillary transport, thereby increasing the area available for evaporation and leading to faster drying (see Figure 10b). Due to slower wicking, it takes longer for the drying rate to stabilise at the beginning of Figure 10c. The slower expansion of the fluid in the non-plasma-treated fabric results in a distinctive phase with an increasing drying rate at high normalised weights, as shown in Figure 10d. Capillary pumping is usually more prevalent for hydrophilic materials [25], which can explain the increased drying rate at low normalised weights for the plasma-treated sample. These findings are consistent with the slower water absorption observed in hydrophobic knitted fabrics by Birrfelder [13].

5.2. Yarn Texturisation and Fabric Structure

Although samples E24f48G and E24f48T have very different yarn structures, they were produced using the same knitting parameters on the same machine. Figure 11 shows the combined drying and wicking behaviour.
The smooth structure of the sample E24f48G creates large inter-yarn pores, whereas the textured structure of E24f48T creates smaller ones. The E24f48G has a spread area that is more than double that of E24f48G, mainly induced by the large inter-yarn pores that are not filled with liquid. Spread areas in Figure 11a correlate well with fabric thickness, which is more than twice as high for fabric made from textured yarn with 0.79 mm for E24f48T in comparison to 0.35 mm for E24f48G. As the wicking path has to follow the yarn around the inter-yarn pores, it takes longer to reach the maximum spread. Drying rates in the CRP correlate well with the spread area, as shown in Figure 11c. The looser structure drying faster matches the findings of Cay [16].
As liquid is not present in the bigger inter-yarn pores of the fabric E28f48G, this surface cannot contribute to evaporation, and the specific drying rate is lower with 0.21 m g m i n c m 2 compared to 0.23 m g m i n c m 2 of E28f48T. For the other machine gauges, the specific drying rate is also higher for the textured yarns. In general, a closed surface with small inter-yarn pores and bigger intra-yarn pores is beneficial for achieving a high specific drying rate in the CRP.
Figure 11d shows that the drying rate decreases at a higher normalised weight for the non-textured yarn in E28f48G at the end of the FRP. The intra-yarn pores are smaller for E24f48G and larger for the textured E24f48T. This indicates that the dense fibre packing in the non-textured yarn of E24f48G inhibits the transport of liquid from the inside of the yarn to the surface.

5.3. Fibre Diameter

Samples of textured yarn with 48 or 256 filaments at comparable yarn linear density are knitted on an E28 circular knitting machine. The resulting fabrics have comparable thicknesses of 0.83 mm for the E28f48T sample and 0.86 mm for the E28f256T sample. While the fabric structures are similar, the E28f256T sample has a slightly more open structure with larger inter-yarn pores (see Figure 4).
The area spread in Figure 12a and the drying in Figure 12b,c are almost identical. Sample E28f256T shows a slightly slower spread in the initial minutes. Even though the area spread is similar, the liquid distribution is different for the two fabrics. This is visible by the more pronounced saturation gradient visible in Figure 9ab for E28f256T compared to Figure 8v at E28f48T. Those differences are probably resulting from smaller intra-yarn pores in E28f256T.
The normalized drying rate in Figure 12d has significantly smaller values in the FRP for the fine filament fabric E28f256T. This drop in the drying rate is caused by the smaller pores in the yarn, which inhibit gas transport from inside the yarn to the surface.
For fabrics made from smooth yarns, the fibre count was 48 and 256 filaments in samples E28f48G and E28f256, respectively. The fabric structure is almost identical, with E28f256G having slightly larger inter-yarn pores with radii of 190 µm compared to E28f48G with 178 µm, due to a more compact yarn structure. The fabric thicknesses, grammage and porosity are comparable.
The liquid front spreads significantly faster in the samples with coarse filaments (E28f48G), visible in Figure 13a. As the intra-yarn pores are larger, the viscous forces inhibiting transport are smaller. However, the maximum spread is smaller for the E28f48G sample at comparable inter-yarn pore radii, suggesting that the E28f256G yarn can hold more liquid. The yarn diameter of the E28f256G sample is visibly larger and is likely to become more saturated due to the high capillary pressure in the fine intra-yarn pores.
Resulting from the spread, the drying finishes faster, and a higher constant drying rate in the CRP (Figure 13c) is reached for the fabric from coarser filaments E24f48G (Figure 13b). E28f48G stays up to higher normalized weights in the CRP (Figure 13d) whereas the drying rate drops slowly from the beginning in the fabric with the finer filaments E28f256G. At the end of the FRP, the fabric E28f256G dries at higher normalized drying rates, which is likely induced by improved capillary pumping to the surface due to the small intra-yarn pores.
The impact of fibre diameter on drying behaviour is significant for both textured and non-textured yarns. For both types of yarn, the spread rate decreases for finer filaments due to increased viscous forces in the relatively smaller inter-yarn pores. For both types of yarn, samples with coarser filaments remain in the CRP up to higher normalized weights. Ultimately, coarser filaments dry at higher normalised drying rates for textured yarns, while finer filaments dry at higher normalised drying rates for non-textured yarns. This contradicts the findings of Chen, who recommended finer filaments, proper fabric tightness, and a thin, plain knitted structure for optimum sports T-shirt fabric with quick-drying properties [17]. This indicates that the optimal fibre diameter for effective drying depends on the structure of the yarn and the structure of the fabric.

5.4. Machine Gauge

The size of the knitted loops and the thickness of the fabric are both affected by the machine gauge. These geometric parameters significantly impact through-plane transport [33]. For the fabrics made from textured yarn, fabric thickness and the radius of the inter-yarn pores increase with machine gauge, while the porosity remains at comparable values between 0.83 and 0.87.
Thinner fabrics have a larger spread area due to their lower thickness and the resulting lower absorption capacity (Figure 14a). The drying behaviour of the fabrics is comparable for fabrics E14f96T and E24f48T (Figure 14b). However, fabric E28f48T, which has significantly smaller inter-yarn pores, dries the fastest. E14f96T has the highest specific drying rate of 0.28, although it is the thickest among all samples. The large inter-yarn pores in this fabric facilitate drying by increasing the surface area available for evaporation. In addition, this fabric type has the most pronounced surface topology, which could also benefit the drying.
Drying rates (Figure 14c) and normalised drying rates exhibit similar behaviour. Normalised drying rates (Figure 14d) show higher values at lower normalised weights for fine E28f48T. This can be explained by a comparably high intra-yarn pore radius combined with the smallest thickness, which leads to a homogeneous open structure with small diffusive resistance and length.
Samples of machine gauge E28f48G, E24f48G and E14f96G have been produced using smooth yarns. The E14f96G fabric made from doubled yarn has slightly higher thickness and porosity. The fabrics’ structure is comparable, with inter-yarn pore radii of 383 µm for E14f96G, 208 µm for E24f48G, and 190 µm for E28f48G, which are significantly larger than those in fabrics made from textured yarns. Intra-yarn pores show comparable small radii ranging from 9 µm to 11 µm.
The spread of the liquid front (see Figure 15a) initially grows more slowly with increasing inter-yarn radius. For fabrics made from non-textured yarns, the liquid only moves through the yarns, so it has to take the longer route around the inter-yarn pores. The maximum area increases slightly for the finer E28f48G. The drying behaviour shown in Figure 15b is qualitatively similar for all fabrics made from non-textured yarns, exhibited by a significant kink between CRP and FRP. After the kink, in the drying curve again is almost linear, which can also be seen by a second phase of constant drying rate at low normalized weights in Figure 15d. This has also been reported in experiments on fabrics made from Coolmax fibres by Onofrei [9]. For his Coolmax fabrics, the kink was observed at a higher normalised weight of about 0.2, as the fractal structure of the fibres can potentially hold more liquid.
Initially, the fabrics exhibit a distinct phase of increasing drying rate, which is most pronounced for the fabric with the slowest spreading rate, E14f96G (Figure 15c). Constant and specific drying rates are comparable for these fabrics, indicating that inter-yarn pores do not significantly impact the CRP for this yarn type. Figure 15d shows the impact of yarn diameter. The fabric with doubled yarn E14f96G exhibits a very steep decrease in FRP, as indicated by its highest S N 10 , value of 0.065. The finest fabric, E28f48G, exhibits a very slight phase of a significantly lower normalised drying rate, which is surprising given that its structure is similar to that of E24f48G and the same yarns have been used. Visible differences in macroscopic spread (see Figure 8k–q) and the smaller inter-yarn pores could explain accelerated drying of the late FRP of fabric E28f48G.
The machine gauge affects the fabric structure, resulting in larger pore radii for both textured and non-textured yarns with a higher gauge. The thickness of the fabrics made from textured yarns increases significantly as well, resulting in different spreads and consequently different drying rates. As the fabric structure and macroscopic spread differ, the results are less clear. However, fabric thickness does not significantly reduce drying speed in the form of the area-specific drying rate. For non-textured yarn samples, the spreading dynamics are greatly affected by smaller intra-yarn pores. A second constant drying phase with a very low absolute drying rate could be observed. Capillary transport in the smaller intra-yarn pores apparent in this yarn type significantly reduces drying in this phase. Drying times increase with thicker yarns due to longer capillary paths.

6. Conclusions

The results and discussion reveal a close relationship between wicking and drying in knitted fabrics, influenced by the structure of the yarn and fabric. The following conclusions can be drawn from the experiments conducted in this study:
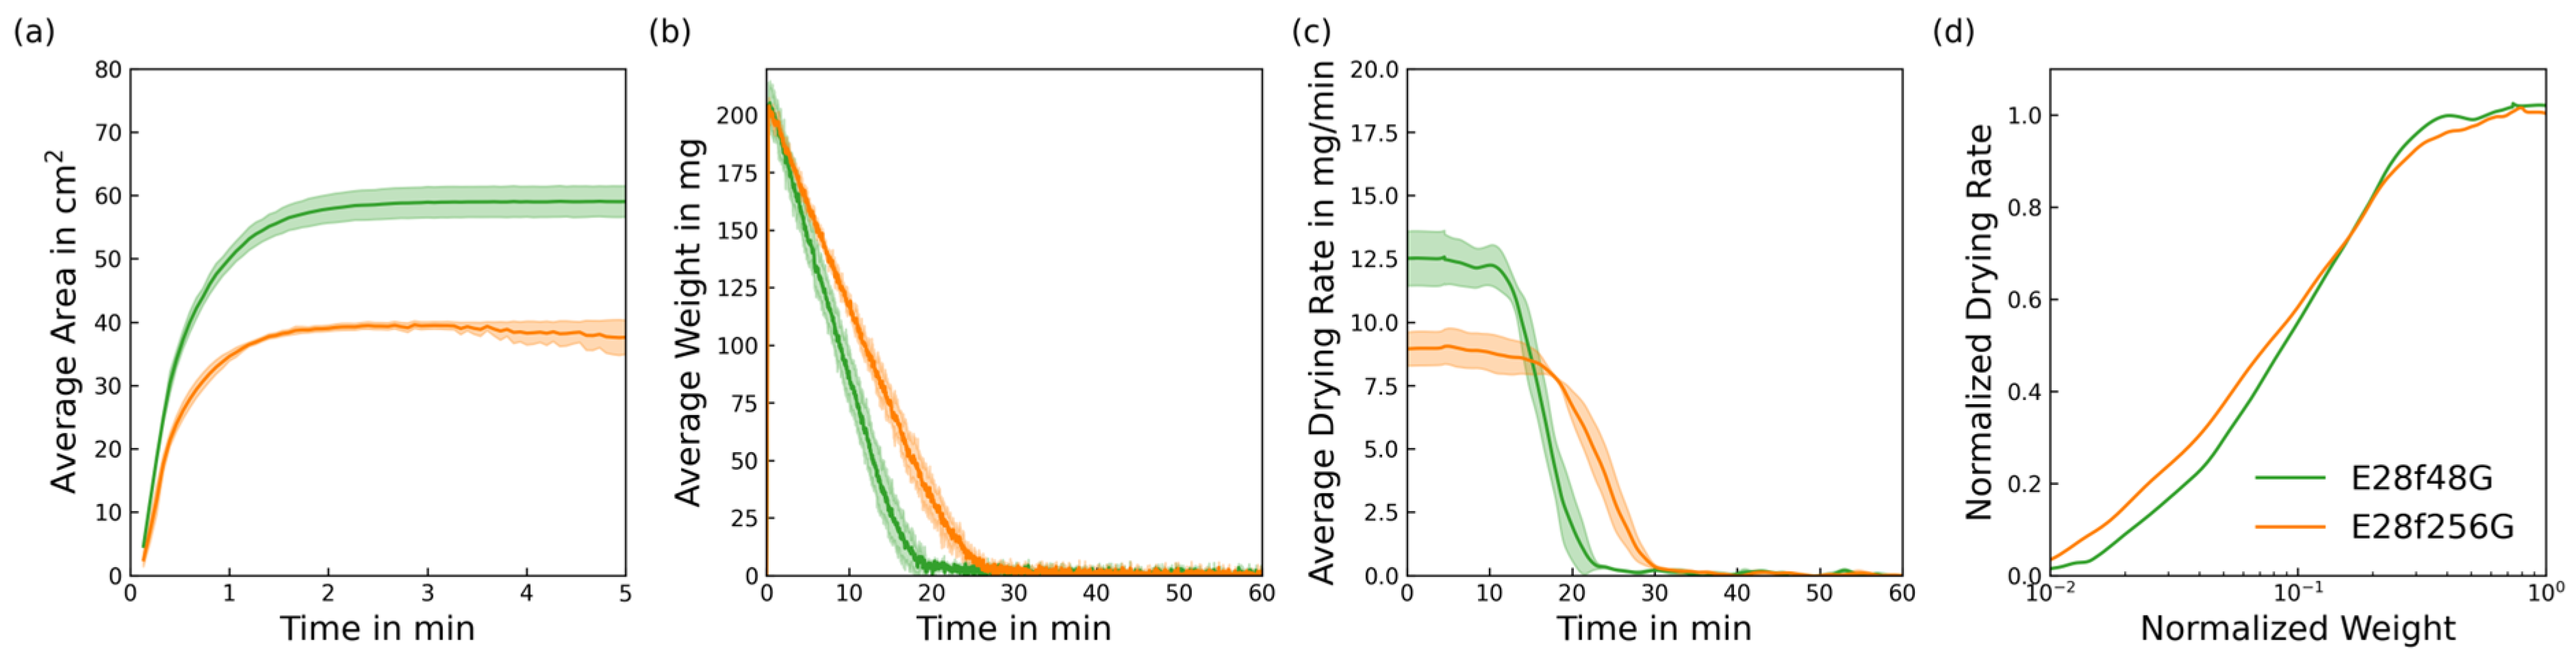
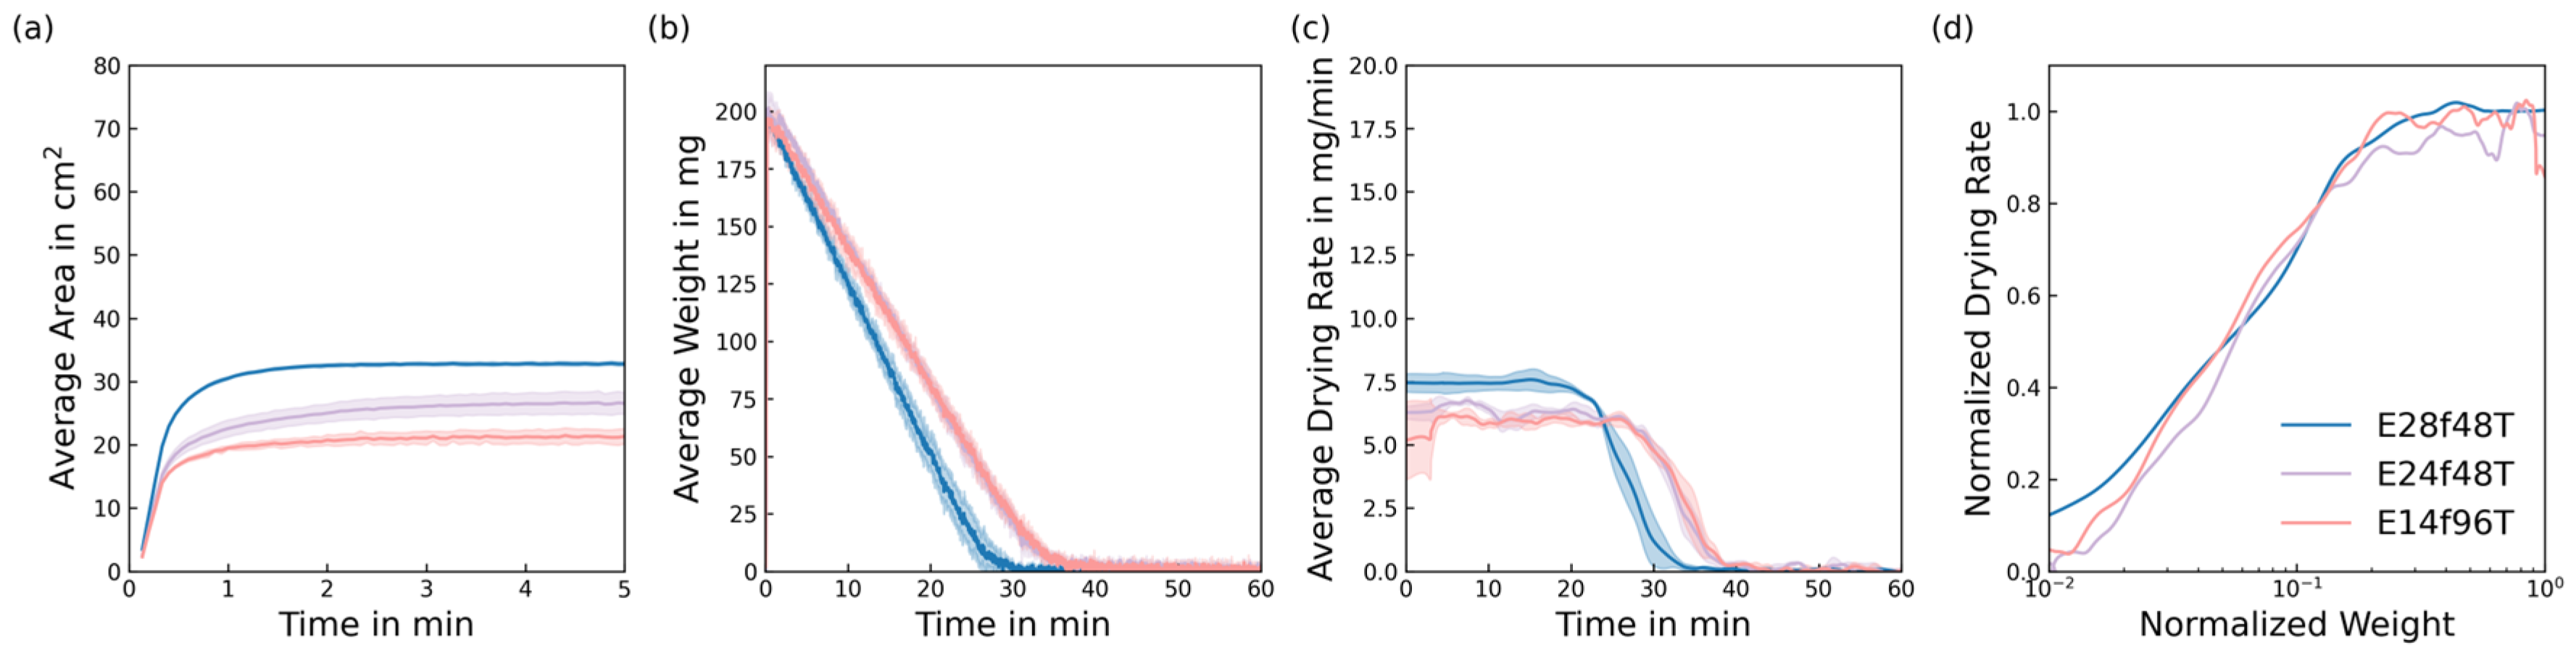
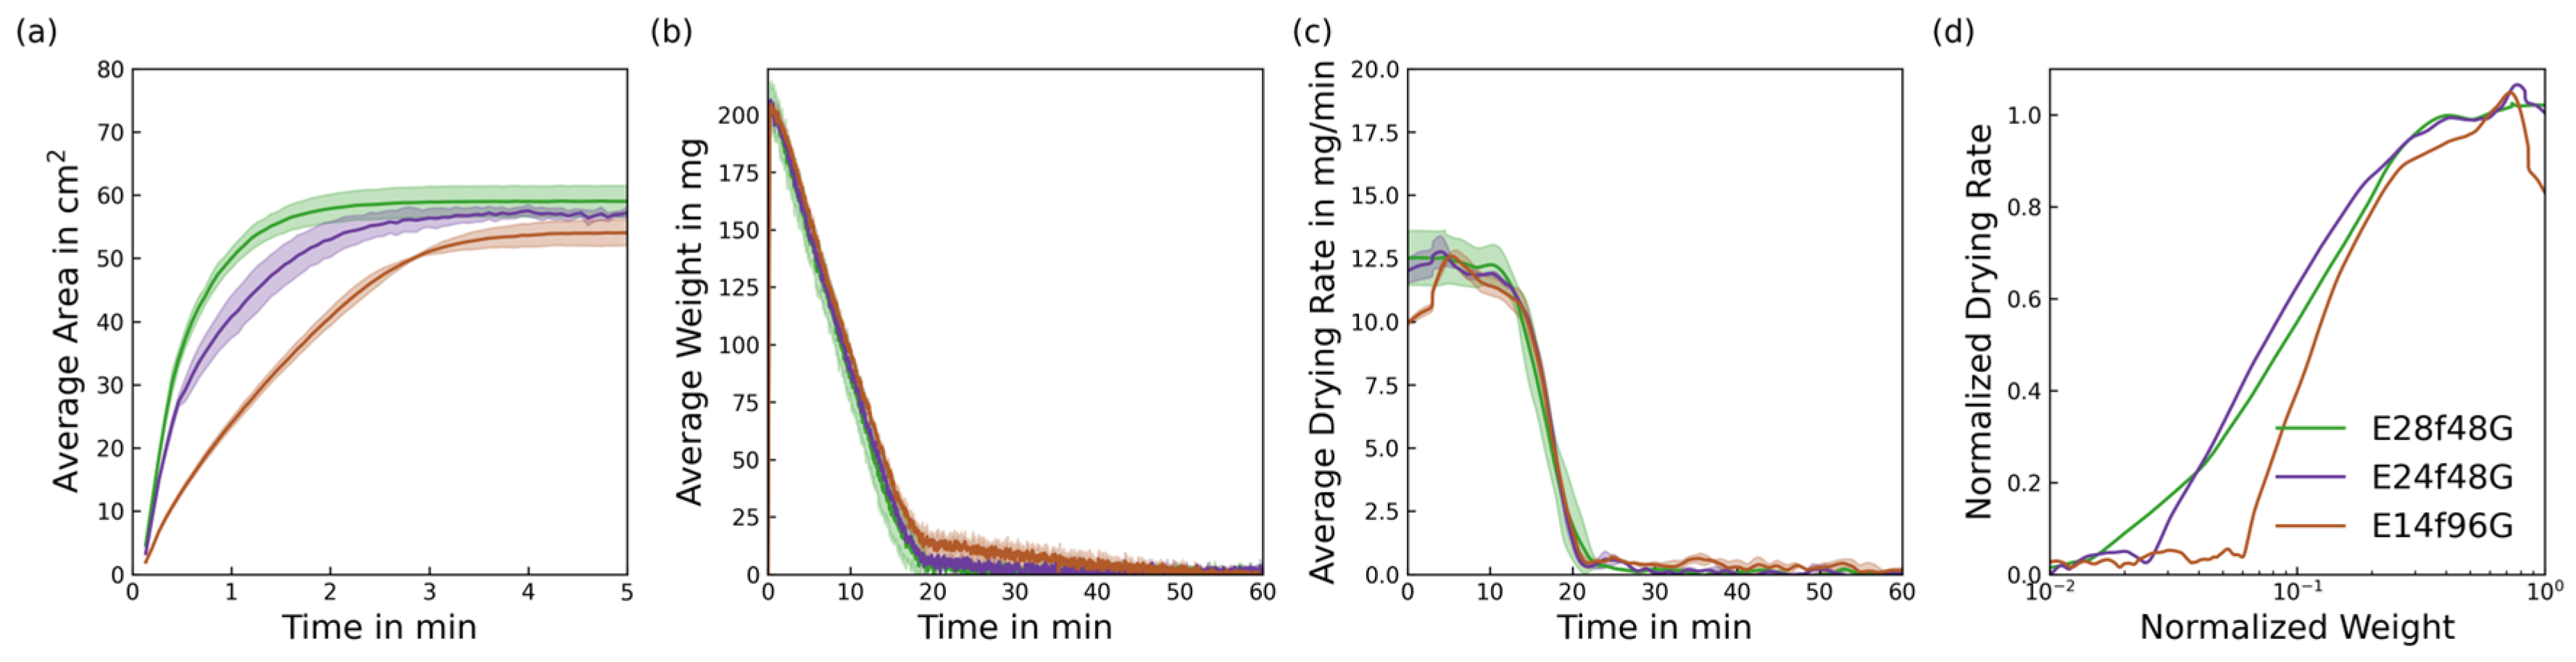
  • Good wettability increases spreading dynamics and maximum spread in the CRP. The spread area determines the effective drying rate in the CRP and the absolute drying time.
  • Fine filaments inhibit the spread of liquid in the fabric and therefore reduce the drying rate in the CRP. However, fine filaments seem to have a contrary impact on the FRP depending on the yarn structure.
  • Fabrics made from textured yarns exhibit the classic FRP behaviour of a constantly falling drying rate, as reported in previous studies on this topic.
  • Fabrics made from non-textured yarns show two phases of constant drying rate. The latter has a significantly lower rate, resulting in long drying times for the final few percentages of residual liquid. The yarn diameter significantly affects the appearance of this phase.
  • The inter-yarn pores have a significant impact on the orientation and size of the macroscopic spread of liquid in knitted fabrics, as liquid cannot pass through inter-yarn pores larger than a certain size, and must follow the tortuous yarn path. This can be observed in fabrics with different yarn structures and machine gauges.
  • Intra-yarn pore sizes affect the liquid spreading dynamics and the late drying stages of the FRP.
  • Ultimately, the structure of the fabric and its combined wicking and drying behaviour are affected by the parameters of the material, the yarn-forming process and the knitting process. It was found that the structural measures of intra-yarn and inter-yarn pore radii assist the comprehension of liquid transport mechanisms in knitted fabrics. Therefore, the mechanisms observed in this study motivate the optimisation of drying behaviour by combining different structures to achieve the desired properties.
The findings of this research are not limited to knitted fabrics but can be applied to woven fabrics, which also exhibit both inter-yarn and intra-yarn pores. The findings in Chapter 5.3 concerning the influence of fibre diameter could be applied to non-woven fabrics. The limitations of this study are the structural differences in fabrics made from textured yarns, which exhibit different loop geometries and skew. A more consistent loop structure would be beneficial for future experiments. Normalised weights are treated as saturations, even though the spread shows an inhomogeneous distribution of the liquid. Conducting experiments with initially fully saturated samples would improve the interpretability of normalised drying curves. However, the values of very low normalised weights are subject to high uncertainty, as the measured values are within the magnitude of the scale’s resolution.
Future research should focus on extracting local saturation from camera images and then identifying regions with saturated and unsaturated inter-yarn pores. Using a high-resolution camera could improve the observation of liquid distribution. Future work on knitted structures should focus on the impact of wettability on different yarn types, as well as the effect of loop length and patterning on wicking and drying processes.

Author Contributions

Conceptualization, L.P.; methodology, L.P. and L.M.; software, L.P.; validation, L.P. and L.M.; formal analysis, L.P. and L.M.; investigation, L.P. and L.M.; resources, L.P.; data curation, L.P.; writing—original draft preparation, L.P.; writing—review and editing, L.P., L.M., S.S., U.N. and G.T.G.; visualization, L.P.; supervision, S.S., U.N. and G.T.G.; project administration, L.P. and L.M.; funding acquisition, U.N. and G.T.G. All authors have read and agreed to the published version of the manuscript.

Funding

The authors gratefully acknowledge the funding of the German Research Council (DFG)–Project Number 453311482.

Data Availability Statement

Data is available upon request.

Acknowledgments

The authors would like to express their gratitude to Benjamin Schnepf for his assistance in the implementation of the experiment and the software.

Conflicts of Interest

The authors declare no conflicts of interest.

References

  1. Pauly, L.; Maier, L.; Schmied, S.; Dinkelmann, A.; Nieken, U.; Gresser, G.T. Modelling Pore Size Distribution Function of Twist-Texturized Yarns and Single-Jersey Knitted Fabrics. Fibers 2025, 13, 48. [Google Scholar] [CrossRef]
  2. Fischer, R.; Schlepütz, C.M.; Rossi, R.M.; Derome, D.; Carmeliet, J. Wicking through Complex Interfaces at Interlacing Yarns. J. Colloid Interface Sci. 2022, 626, 416–425. [Google Scholar] [CrossRef]
  3. Das, B.; Das, A.; Kothari, V.K.; Fangueiro, R.; de Araújo, M. MOISTURE TRANSMISSION THROUGH TEXTILES Part II: Evaluation Methods and Mathematical Modelling. AUTEX Res. J. 2007, 7, 194–216. [Google Scholar] [CrossRef]
  4. Patnaik, A.; Rengasamy, R.S.; Kothari, V.K.; Ghosh, A. Wetting and Wicking in Fibrous Materials. Text. Prog. 2006, 38, 1–105. [Google Scholar] [CrossRef]
  5. Jhanji, Y.; Gupta, D.; Kothari, V.K. Moisture Management and Wicking Properties of Polyester- Cotton Plated Knits. Indian J. Fibre Text. Res. 2017, 42, 183–188. [Google Scholar]
  6. Hussainn, S.; Glombikova, V.; Akhtar, N.; Mazari, A.; Mansoor, T.; Khan, K.A.H. Liquid Moisture Transportation Properties of Functional Underwears: Part 1. Autex Res. J. 2019, 19, 97–103. [Google Scholar] [CrossRef]
  7. Yang, Y.; Chen, L.; Naveed, T.; Zhang, P.; Farooq, A. Influence of Fabric Structure and Finishing Pattern on the Thermal and Moisture Management Properties of Unidirectional Water Transport Knitted Polyester Fabrics. Text. Res. J. 2019, 89, 1983–1996. [Google Scholar] [CrossRef]
  8. Mukhopadhyay, A.; Ishtiaque, S.M.; Uttam, D. Impact of Structural Variations in Hollow Yarn on Heat and Moisture Transport Properties of Fabrics. J. Text. Inst. 2011, 102, 700–712. [Google Scholar] [CrossRef]
  9. Onofrei, E.; Rocha, A.M.; Catarino, A. The Influence of Knitted Fabrics’ Structure on the Thermal and Moisture Management Properties. J. Eng. Fibers Fabr. 2011, 6, 10–22. [Google Scholar] [CrossRef]
  10. Choudhary, A.K. Ramratan the Influence of Yarn and Knit Structure on Moisture Management Properties of Sportswear Fabric. J. Inst. Eng. India Ser. E 2020, 101, 77–90. [Google Scholar] [CrossRef]
  11. Kim, H.; Michielsen, S.; DenHartog, E. Wicking in Textiles at Rates Comparable to Human Sweating. Colloids Surf. A Physicochem. Eng. Asp. 2021, 622, 126726. [Google Scholar] [CrossRef]
  12. Parada, M.; Vontobel, P.; Rossi, R.M.; Derome, D.; Carmeliet, J. Dynamic Wicking Process in Textiles. Transp. Porous Med. 2017, 119, 611–632. [Google Scholar] [CrossRef]
  13. Birrfelder, P.; Dorrestijn, M.; Roth, C.; Rossi, R.M. Effect of Fiber Count and Knit Structure on Intra- and Inter-Yarn Transport of Liquid Water. Text. Res. J. 2013, 83, 1477–1488. [Google Scholar] [CrossRef]
  14. Gurudatt, K.; Nadkarni, V.M.; Khilar, K.C. A Study on Drying of Textile Substrates and a New Concept for the Enhancement of Drying Rate. J. Text. Inst. 2010, 101, 635–644. [Google Scholar] [CrossRef]
  15. Onal, L.; Arslan, C.; Pasayev, N. Relation Between Structural Parameters and Drying Properties of Cotton Knitted Fabrics. Tekst. Ve Konfeksiyon 2013, 23, 357–363. [Google Scholar]
  16. Cay, A.; Gurlek, G.; Oglakcioglu, N. Analysis and Modeling of Drying Behavior of Knitted Textile Materials. Dry. Technol. 2017, 35, 509–521. [Google Scholar] [CrossRef]
  17. Chen, Q.; Tang, K.-P.M.; Ma, P.; Jiang, G.; Xu, C. Thermophysiological Comfort Properties of Polyester Weft-Knitted Fabrics for Sports T-Shirt. J. Text. Inst. 2017, 108, 1421–1429. [Google Scholar] [CrossRef]
  18. Kissa, E. Wetting and Wicking. Text. Res. J. 1996, 66, 660–668. [Google Scholar] [CrossRef]
  19. Kumar, A.; Kleinen, J.; Venzmer, J.; Trybala, A.; Starov, V.; Gambaryan-Roisman, T. Spreading and Imbibition of Vesicle Dispersion Droplets on Porous Substrates. Colloids Interfaces 2019, 3, 53. [Google Scholar] [CrossRef]
  20. Liu, Y.; Kang, Y.; Luo, M.; Ma, P. Unidirectional Wettability Performances of Weft-Knitted Fabric Based on Yarn Structure. Fibers Polym. 2022, 23, 827–835. [Google Scholar] [CrossRef]
  21. Gillespie, T. The Spreading of Low Vapor Pressure Liquids in Paper. J. Colloid Sci. 1958, 13, 32–50. [Google Scholar] [CrossRef]
  22. Kawase, T.; Sekoguchi, S.; Fuj, T.; Minagawa, M. Spreading of Liquids in Textile Assemblies. Text. Res. J. 1986, 56, 409–414. [Google Scholar] [CrossRef]
  23. Gonçalves, M.; Kim, J.Y.; Kim, Y.; Rubab, N.; Jung, N.; Asai, T.; Hong, S.; Weon, B.M. Droplet Evaporation on Porous Fabric Materials. Sci. Rep. 2022, 12, 1087. [Google Scholar] [CrossRef]
  24. Rahimi, A.; Metzger, T.; Kharaghani, A.; Tsotsas, E. Interaction of droplets with porous structures: Pore network simulation of wetting and drying. Dry. Technol. 2016, 34, 1129–1140. [Google Scholar] [CrossRef]
  25. Kharaghani, A. Drying and Wetting of Capillary Porous Materials: Insights from Imaging and Physics-Based Modeling. Ph.D. Thesis, Otto-von-Guericke-University, Magdeburg, Germany, 2020. [Google Scholar]
  26. Sampath, M.; Mani, S.; Nalankilli, G. Effect of Filament Fineness on Comfort Characteristics of Moisture Management Finished Polyester Knitted Fabrics. J. Ind. Text. 2011, 41, 160–173. [Google Scholar] [CrossRef]
  27. Fei, L.; Qin, F.; Zhao, J.; Derome, D.; Carmeliet, J. Pore-Scale Study on Convective Drying of Porous Media. Langmuir 2022, 38, 6023–6035. [Google Scholar] [CrossRef]
  28. Steele, R. Part I: Drying Behavior. Text. Res. J. 1958, 28, 136–144. [Google Scholar] [CrossRef]
  29. Hassan, M.M.; Leighs, S.J. Quick Dry Ability of Various Quick Drying Polyester and Wool Fabrics Assessed by a Novel Method. Dry. Technol. 2017, 35, 585–592. [Google Scholar] [CrossRef]
  30. Chau, K.-H.; Tang, K.-P.M.; Kan, C.-W. Constant Temperature Drying Rate Tester: Real-Time Water Evaporation Measurement of Fabrics. IEEE Trans. Instrum. Meas. 2018, 67, 2635–2648. [Google Scholar] [CrossRef]
  31. Guidoin, R.; King, M.; Marceau, D.; Cardou, A.; De La Faye, D.; Legendre, J.; Blais, P. Textile Arterial Prostheses: Is Water Permeability Equivalent to Porosity? J. Biomed. Mater. Res. 1987, 21, 65–87. [Google Scholar] [CrossRef]
  32. DIN EN ISO 13934-1; Textiles-Tensile Properties of Fabrics-Part 1: Determination of Maximum Force and Elongation at Maximum Force Using the Strip Method. ISO: Geneva, Switzerland, 2013.
  33. Pauly, L.; Maier, L.; Nieken, U.; Gresser, G.T. Physics-Based Modeling of the Effective Gas Transport Properties of Single Jersey Knitted Fabrics Based on Images. Text. Res. J. 2024, 94, 2543–2561. [Google Scholar] [CrossRef]
  34. Python Software Foundation Python Language Reference, Release 3.12. Available online: https://www.python.org (accessed on 28 July 2025).
  35. Bradski, G. The OpenCV Library. Dr. Dobb’s J. Softw. Tools 2000, 120, 122–125. [Google Scholar]
Figure 1. Microscope images of single jersey fabric and a loop stitch with characteristic elements of knitted fabrics. Grey lines indicate neighbouring loops.
Fibers 13 00103 g001
Figure 2. Wetting, imbibition and drying of fibrous media. Schematic wetting and imbibition of partially wetting and non-wetting porous substrate. Arrows indicate liquid transport.
Fibers 13 00103 g002
Figure 3. (a) Typical drying curve of porous media and (b) liquid in a yarn cross-section at different phases of drying. Black dots indicate fibers, blue arrows indicate liquid transport.
Fibers 13 00103 g003
Figure 4. Knitted fabrics samples. The loop structure is similar within the fabrics made from non-textured (suffix G) and textured (suffix T) yarns.
Fibers 13 00103 g004
Figure 5. Experimental setup for combined wicking and drying. During the experiment, the housing was closed with a light-tight front door.
Fibers 13 00103 g005
Figure 6. Extraction of the liquid front from the images.
Fibers 13 00103 g006
Figure 7. Calculation of drying and wicking properties from experimental data. (a) average spread area, (b) mean drying curve, (c) drying rate, (d) characteristic drying curve. Curve denotes mean, shadow denotes standard deviation of the measurements.
Fibers 13 00103 g007
Figure 8. (ax) Images of non-textured yarns after the thresholding step. The weft direction is horizontal and the warp direction is vertical. Air flow direction is horizontal. The white areas around the nozzle are reflections of surface water. Side length of the images is 10 cm × 10 cm.
Fibers 13 00103 g008
Figure 9. (aad) Images of fabrics made from textured yarns after the thresholding step. The weft direction is horizontal and the warp direction is vertical. Air flow direction is horizontal. Side length of the images is 10 cm × 10 cm.
Fibers 13 00103 g009
Figure 10. Experimental results on fabric E28f48T with (hydrophilic) and without plasma treatment (hydrophobic). (a) average spread area, (b) mean drying curve, (c) drying rate, (d) characteristic drying curve. Solid curves denote mean, shadows denote standard deviation of the measurements.
Fibers 13 00103 g010
Figure 11. Experimental results of single jersey knitted fabrics made from textured yarn E28f48T and non-textured yarn E28f48G. (a) average spread area, (b) mean drying curve, (c) drying rate, (d) characteristic drying curve. Solid curves denote mean, shadows denote standard deviation of the measurements.
Fibers 13 00103 g011
Figure 12. Experimental results of single jersey knitted fabrics made from textured yarns with coarse filaments E28f48T and fine filaments E28f256T. (a) average spread area, (b) mean drying curve, (c) drying rate, (d) characteristic drying curve. Solid curves denote mean, shadows denote standard deviation of the measurements.
Fibers 13 00103 g012
Figure 13. Experimental results of single jersey knitted fabrics made from non-textured yarns with coarse filaments E28f48G and fine filaments E28f256G. (a) average spread area, (b) mean drying curve, (c) drying rate, (d) characteristic drying curve. Solid curves denote mean, shadows denote standard deviation of the measurements.
Fibers 13 00103 g013
Figure 14. Experimental results of single jersey knitted fabrics made from textured yarns on fine gauge E24f48T and coarse gauge E14f96T. (a) average spread area, (b) mean drying curve, (c) drying rate, (d) characteristic drying curve. Solid curves denote mean, shadows denote standard deviation of the measurements.
Fibers 13 00103 g014
Figure 15. Experimental results of single jersey knitted fabrics made from non-textured yarns on fine gauge E24f48G and coarse gauge E14f96G. (a) average spread area, (b) mean drying curve, (c) drying rate, (d) characteristic drying curve. Solid curves denote mean, shadows denote standard deviation of the measurements.
Fibers 13 00103 g015
Table 1. Parameters of Materials.
Sample NameYarn d F a b r i c
[mm]
m F a b r i c
[g/m2]
ϕ
[-]
r P , _ Y a r n
[µm]
r P , _ K n i t
[µm]
E28f48T
E28f48T NP
PES dtex 196 f48/10.681480.8330142
E24f48TPES dtex 196 f48/10.791440.8722169
E14f96TPES dtex 196 f48/21.011960.8637215
E28f48GPES dtex 184 f48/10.361290.739190
E24f48GPES dtex 186 f48/10.351110.7711208
E14f96GPES dtex 186 f48/20.471260.8111383
E28f256TPES dtex 180 f256/10.611280.8615153
E28f256GPES dtex 180 f256/10.361350.736178
Table 2. Specific drying quantities of the fabric samples.
Sample Name N
m g m i n
A m a x
[ c m 2 ]
n
m g m i n c m 2
t A 50
[ s ]
t A 95
[ s ]
S N 90
S N 10
m F R P
E28f48T NP5.0819.00.27443120.150.0135.7
E28f48T7.4432.80.2320680.160.0085.3
E24f48T6.6326.50.25201280.190.0184.5
E14f96T6.0321.20.2820880.170.0155.1
E28f48G12.2759.00.2124920.240.0213.6
E24f48G11.9856.90.21321320.230.0293.9
E14f96G12.0154.00.22721840.290.0653.6
E28f256T7.5932.80.23201120.270.0173.2
E28f256G8.9239.50.2324840.270.0163.2
Disclaimer/Publisher’s Note: The statements, opinions and data contained in all publications are solely those of the individual author(s) and contributor(s) and not of MDPI and/or the editor(s). MDPI and/or the editor(s) disclaim responsibility for any injury to people or property resulting from any ideas, methods, instructions or products referred to in the content.

