
Structure and Crystallization of Even–Odd Nylons Derived from Pimelic Acid: Influence of the Number of Methylene Groups in the Diamine Unit


Abstract
1. Introduction
2. Materials and Methods
2.1. Materials
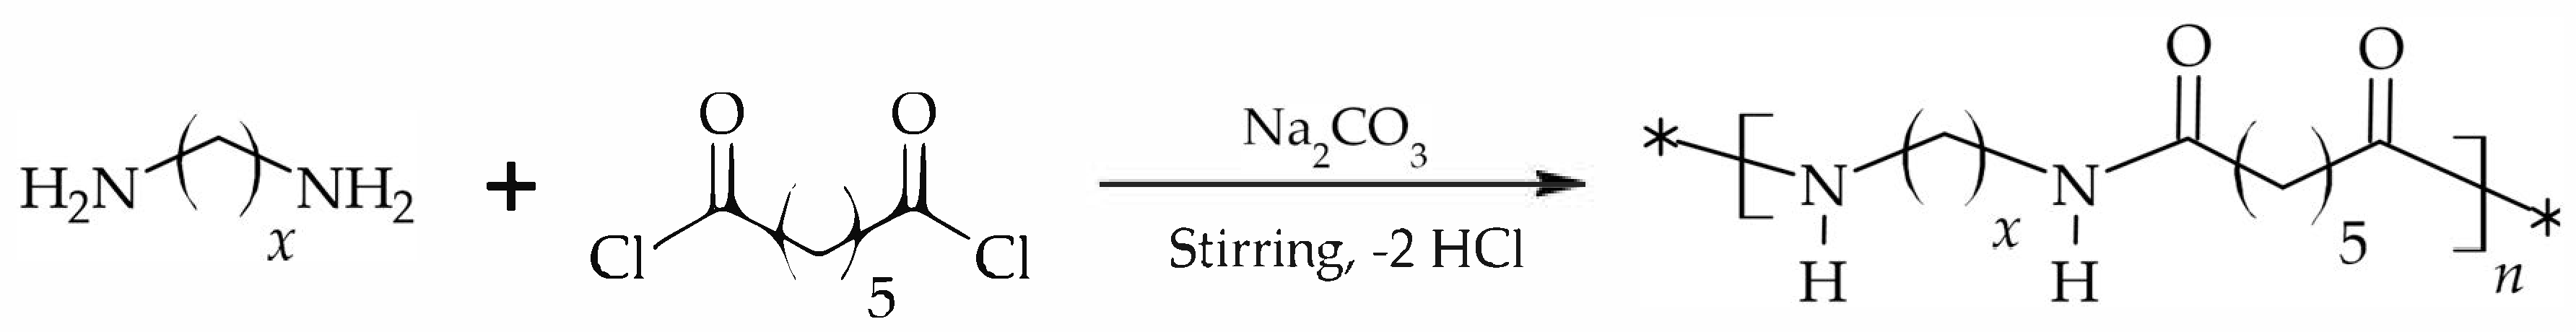
2.2. Synthesis
2.3. Characterization
3. Results
3.1. Synthesis
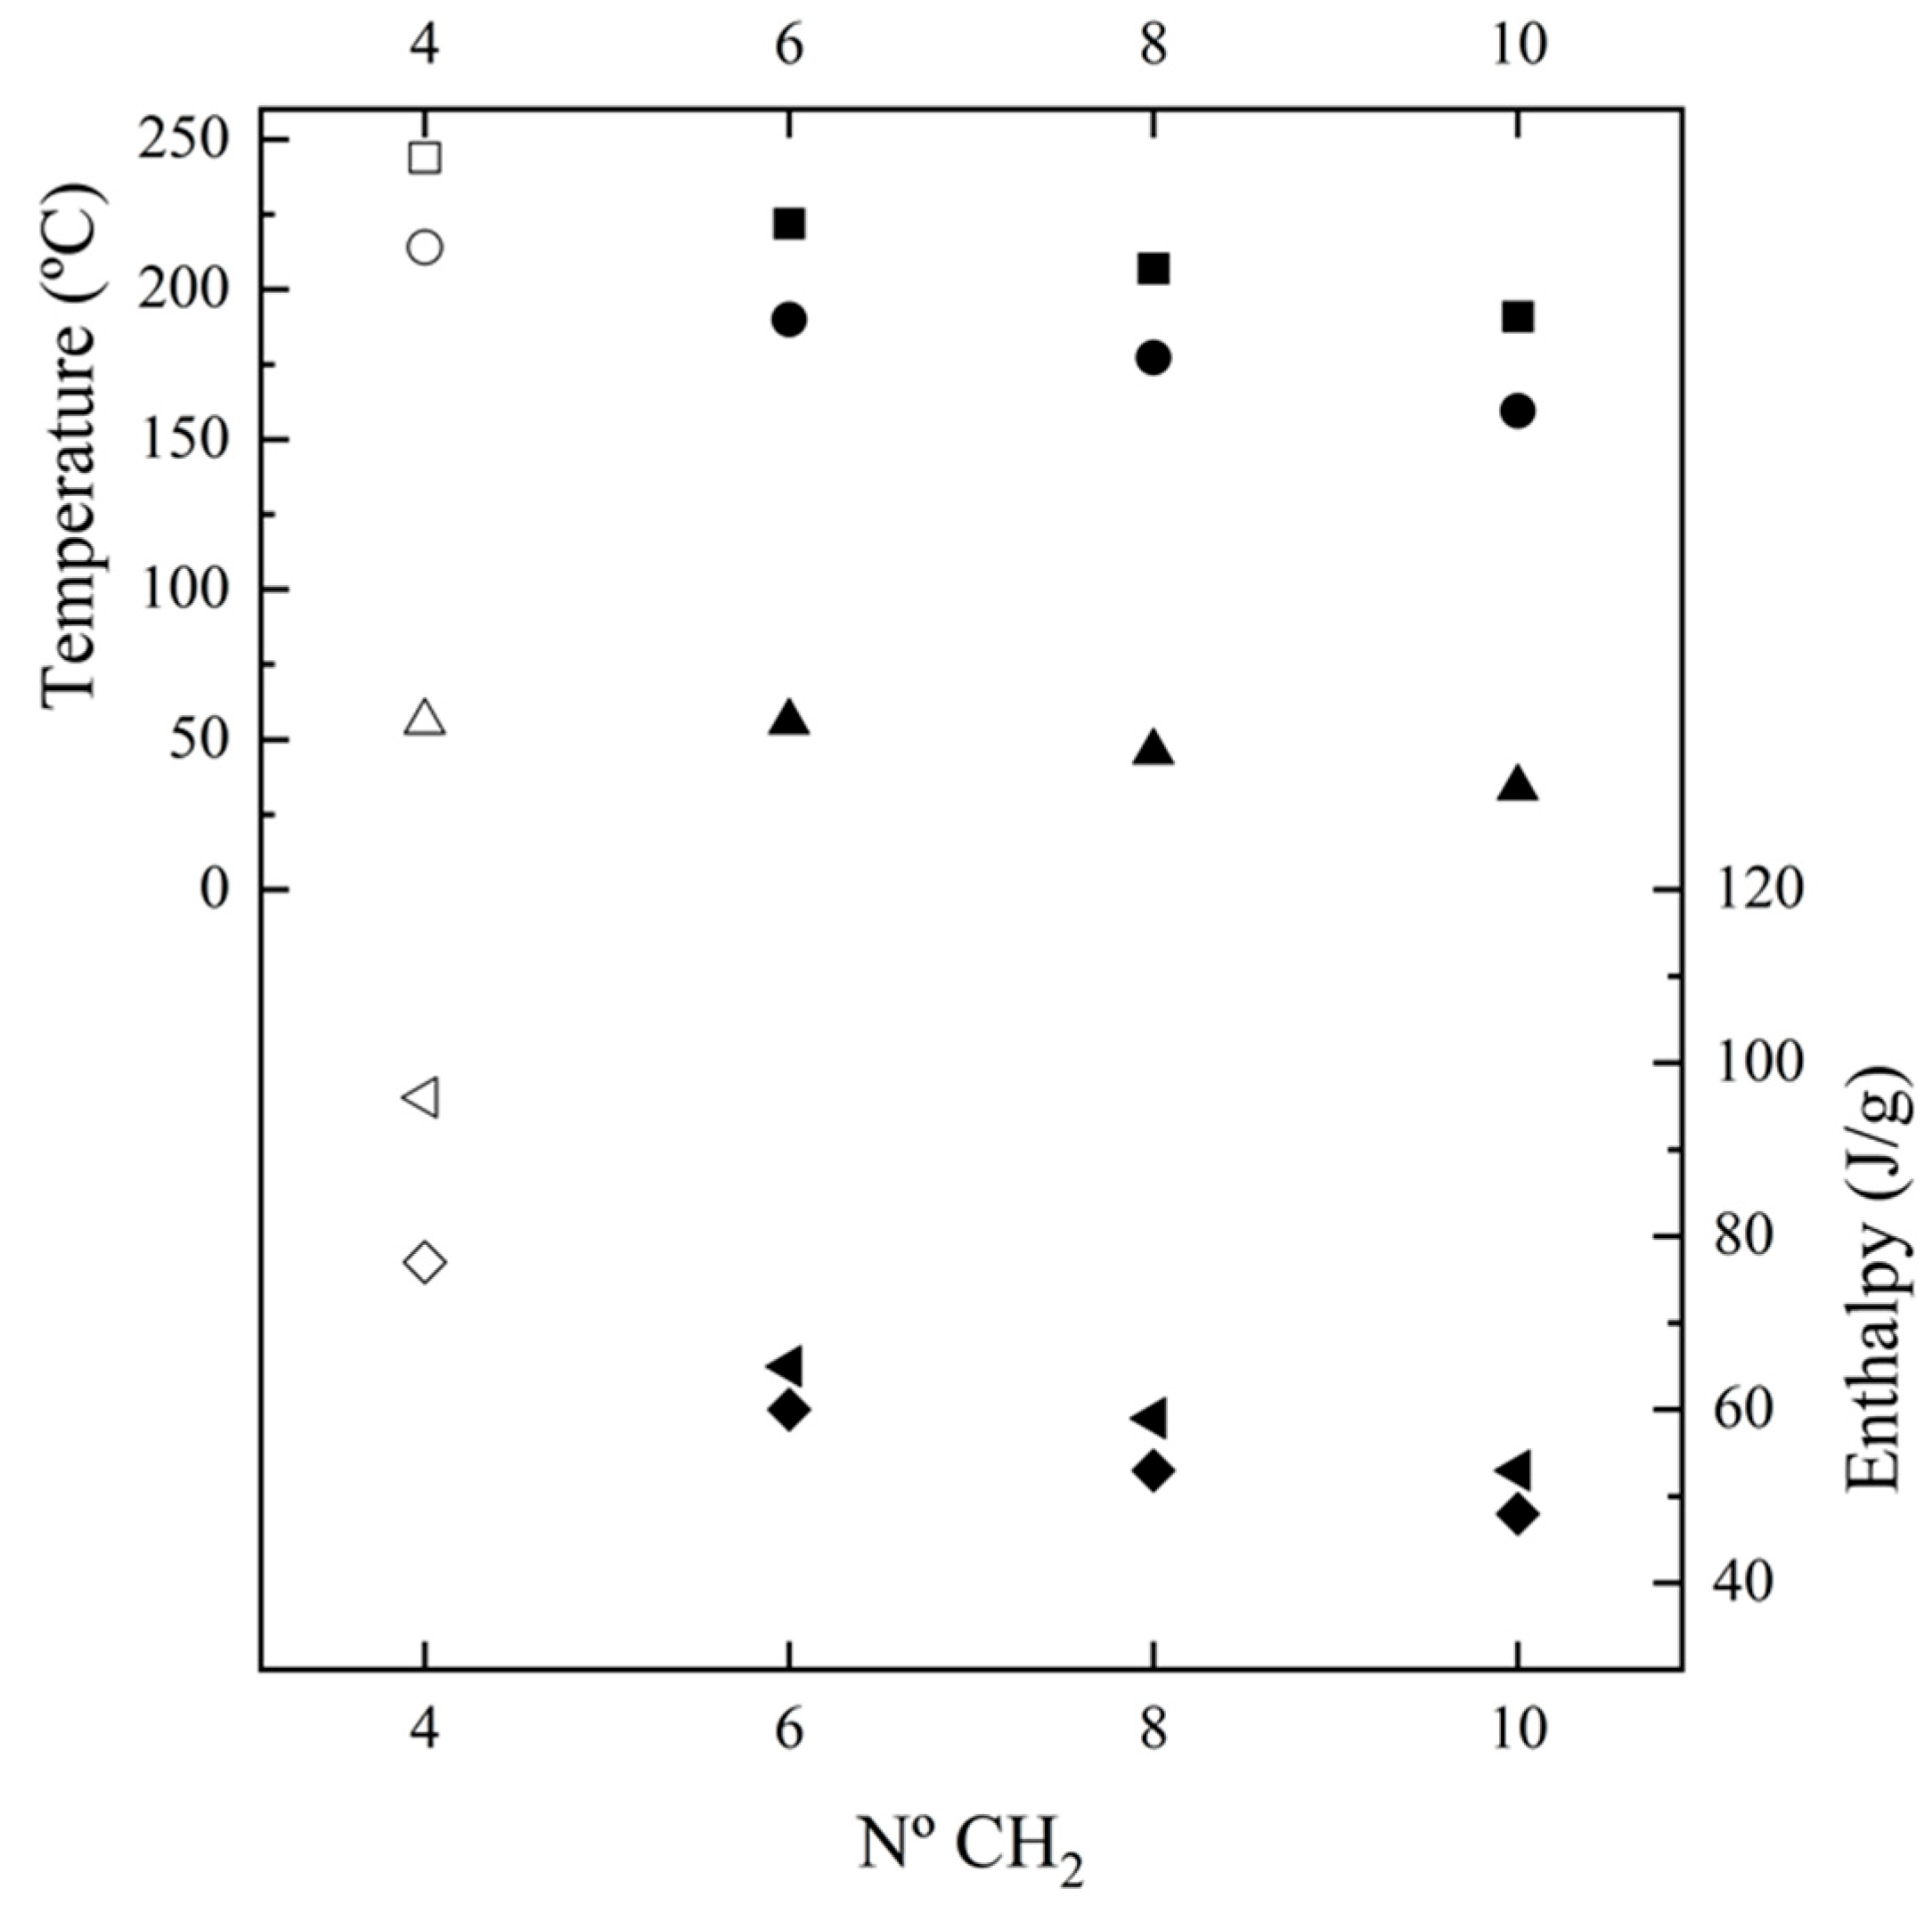
3.2. Calorimetric Analysis
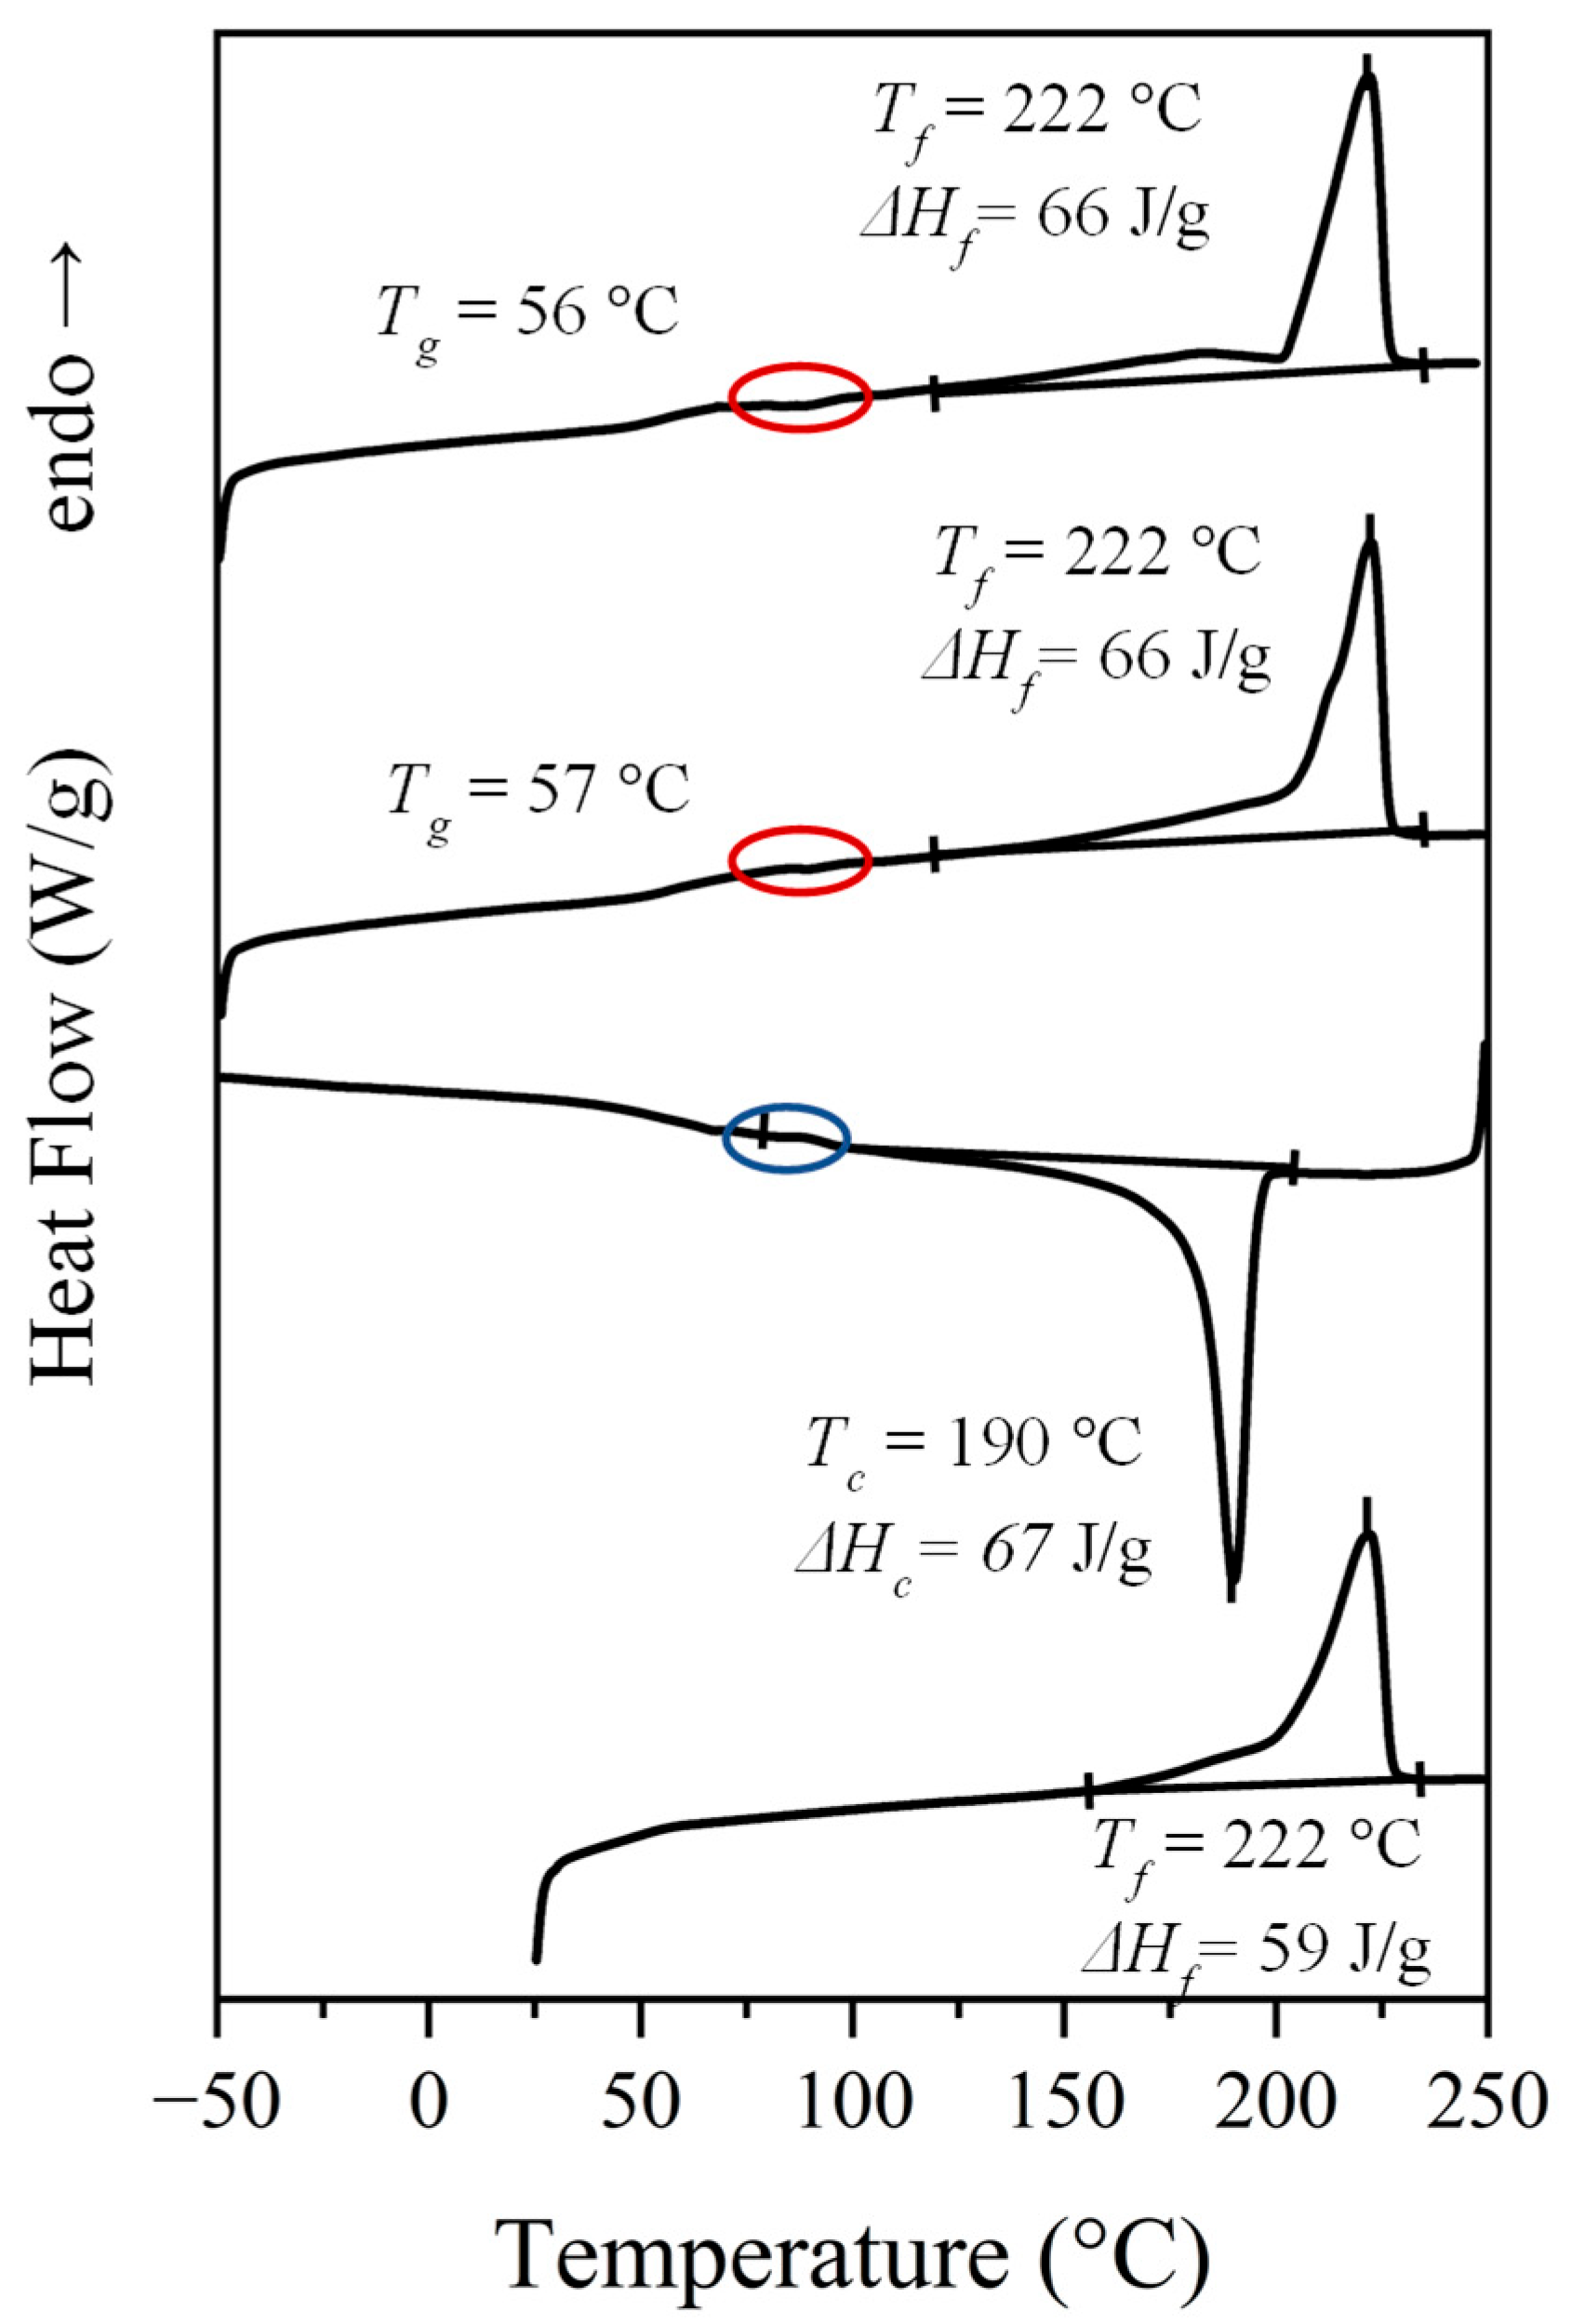
- A complex melting process where a major peak centered at 222 °C, a shoulder around 203 °C and a minor peak/shoulder at 180 °C can be distinguished according to the preparation method (e.g., samples coming from solution precipitation or melt crystallization). The two high-temperature signals may be due to the presence of lamellae with different thicknesses, with the thinner ones susceptible to a folding reorganization during heating. Endothermic processes associated with the fusion of minority phases should be discarded since structural transitions so close to the fusion were not detected in the subsequent synchrotron measurements, as will be explained. This argument is not so clear for the signal around 180 °C since it is a value close to the Brill transition temperature; by contrast, the presence of highly defective crystals with a low melting peak temperature has also been reported for similar nylons. DSC plots also showed a slow recovery of the baseline on both heating and cooling processes, which may be indicative of a continuous structural transition as detected in synchrotron experiments.
- A crystallization process that is characterized by a narrow exothermic peak at an undercooling degree of 30–35 °C (for a cooling rate of 10 °C/min). This peak is followed by a broad exothermic event that practically extends up to the glass transition temperature and that may be associated with a continuous structural transition.
- Some minor events that can be detected in the 80–100 °C interval (see ellipsoids in Figure 4 that point out small exothermic peaks during the second and third heating runs and an endothermic peak during cooling). These hardly integrable and hardly quantifiable peaks could be referred to the conversion of the α-form into the pseudohexagonal one, as later discussed in Section 3.4, and as shown later in Figure 7a.
- A well-defined and reversible glass transition.

| Sample | First Heating | Cooling | Second Heating | Third Heating | ||||||
|---|---|---|---|---|---|---|---|---|---|---|
| Tf (°C) | ΔHf (J/g) | Tc (°C) | ΔHc (J/g) | Tg (°C) | Tf (°C) | ΔHf (J/g) | Tg (°C) | Tf (°C) | ΔHf (J/g) | |
| N. 4,7 b | 214, 227, 244 | 96 | 214 | 77 | - e | 227, 244 | 77 | 56 | 228, 243 | 71 |
| N. 6,7 | 190, 222 | 71 | 190 c | 66 | 57 | 213, 222 | 66 | 56 | 183 c, 222 | 66 |
| N. 8,7 | 154, 207 | 66 | 177 c | 60 | 46 | 208 d | 60 | 46 | 182, 207 | 61 |
| N. 10,7 | 170, 191 d | 62 | 159 c | 55 | 30 | 177, 193 | 57 | 34 | 174, 193 | 54 |
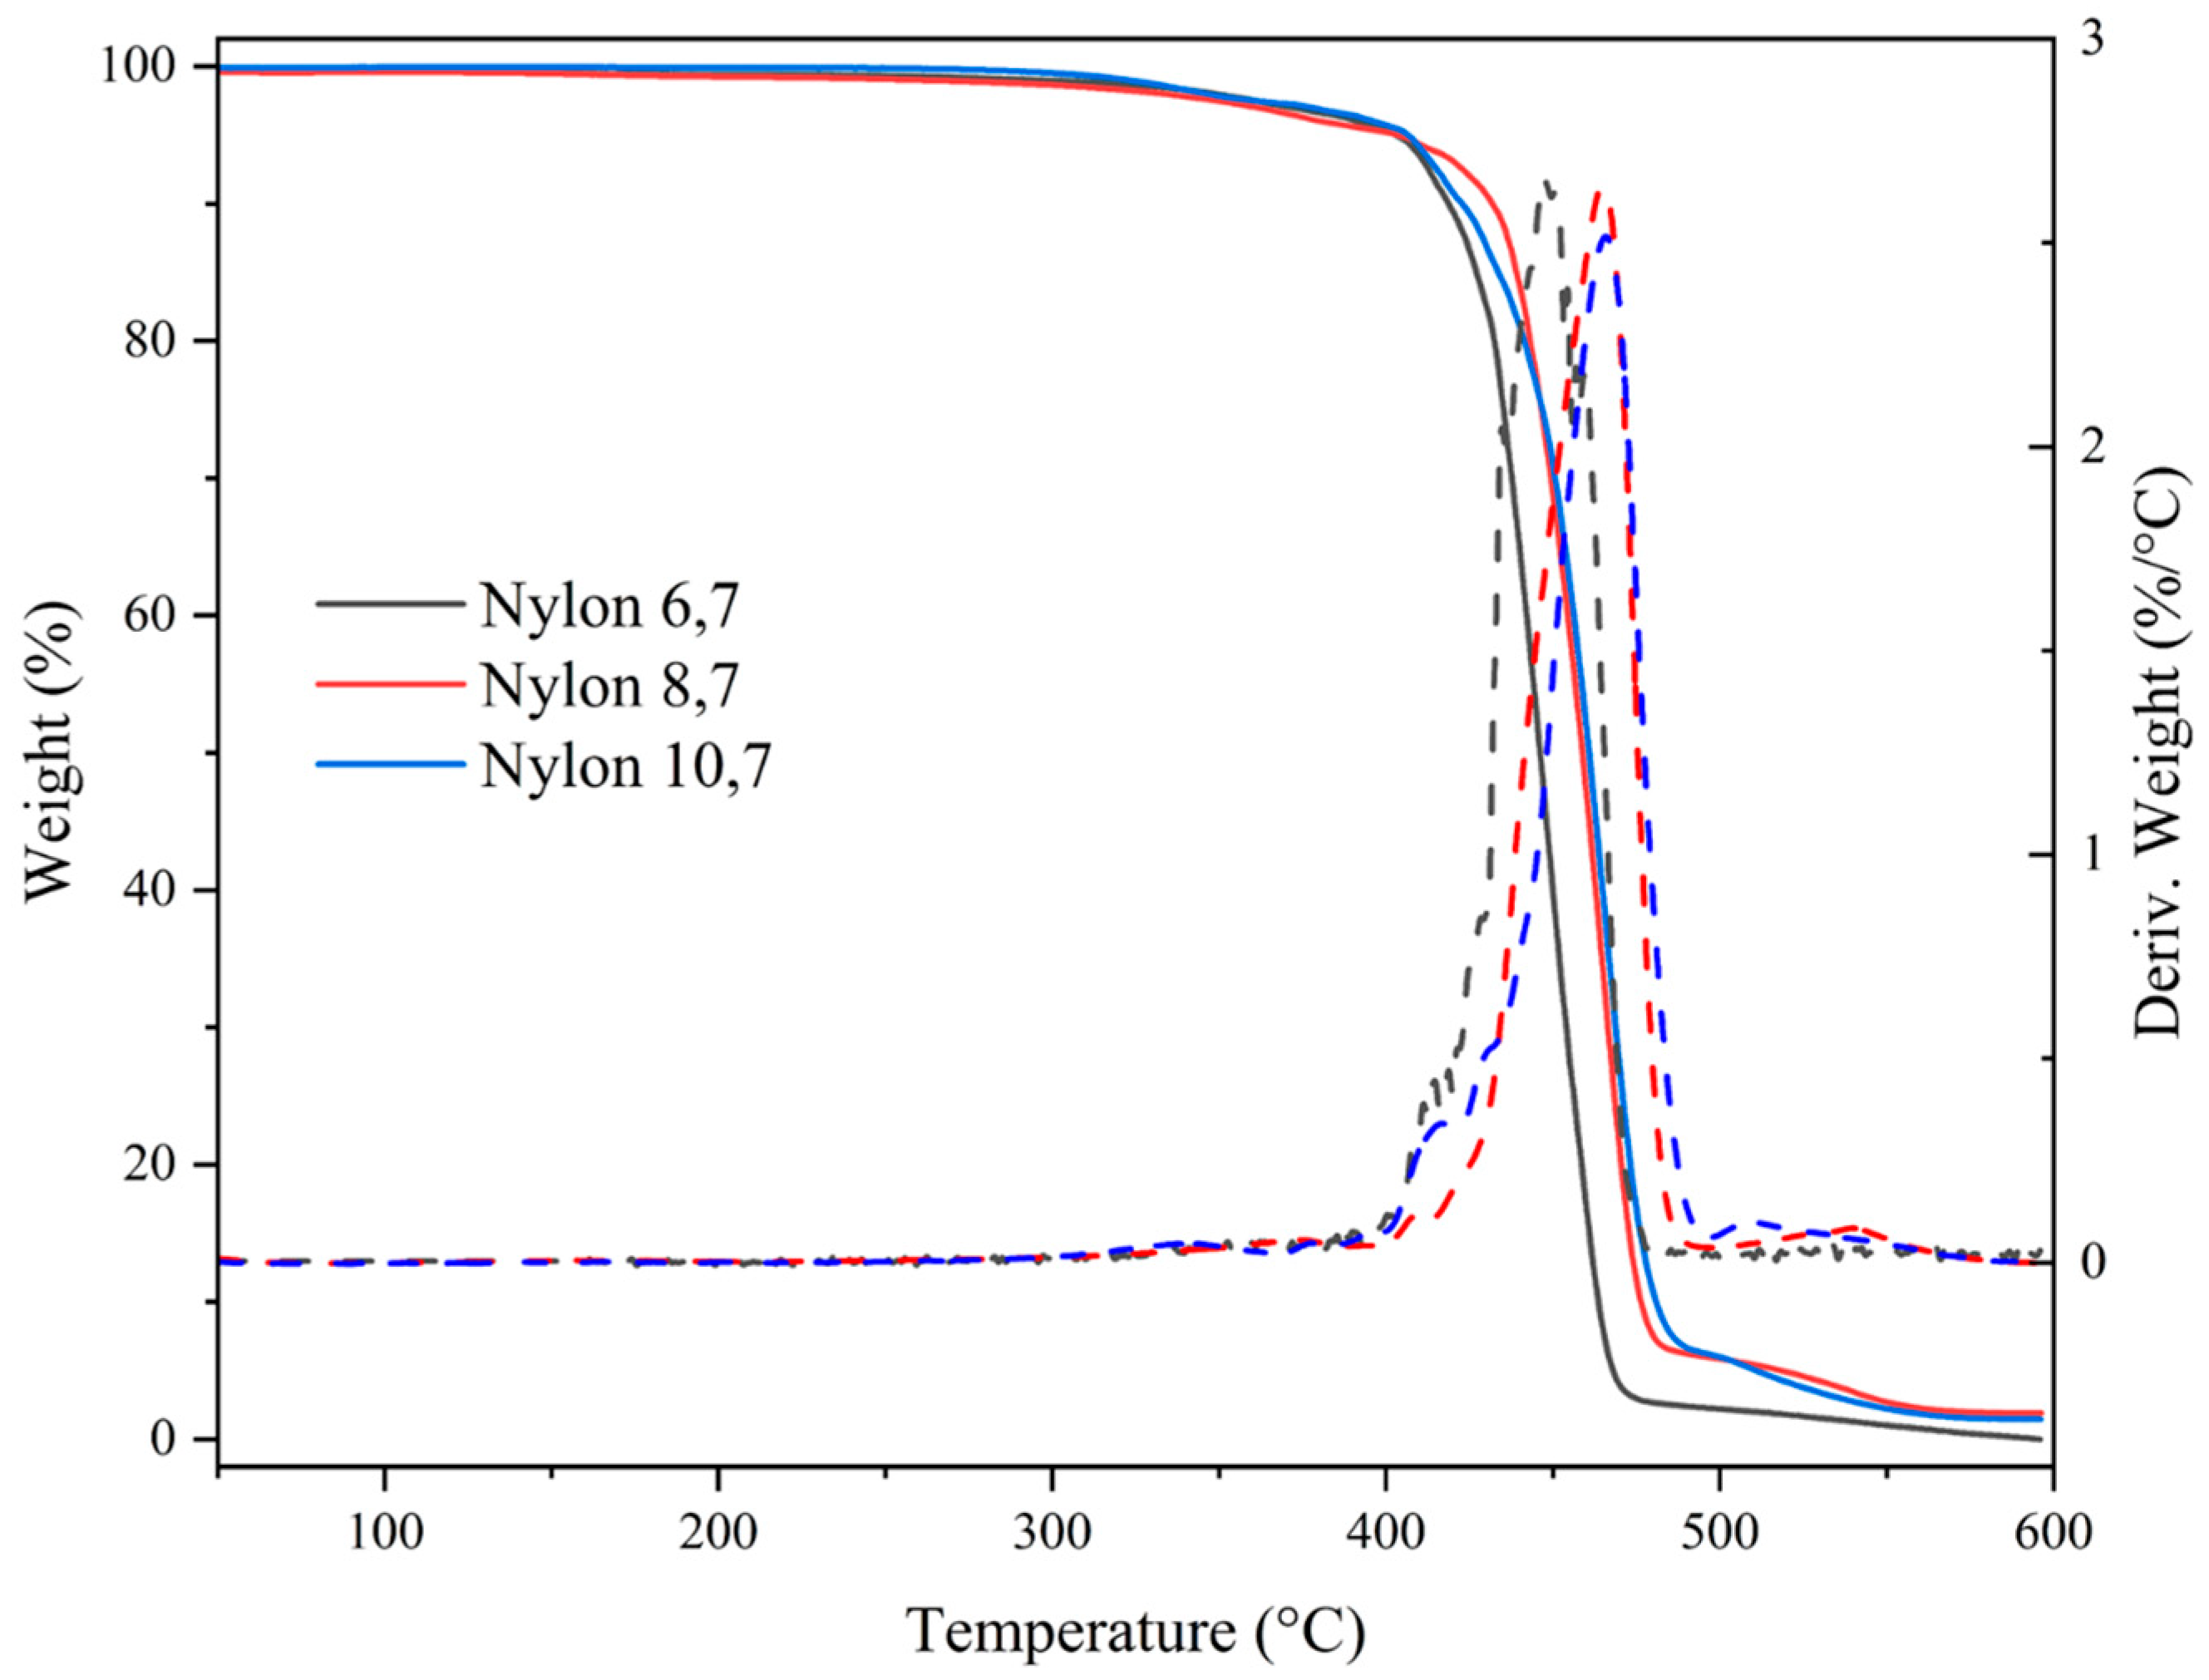
3.3. Thermal Stability
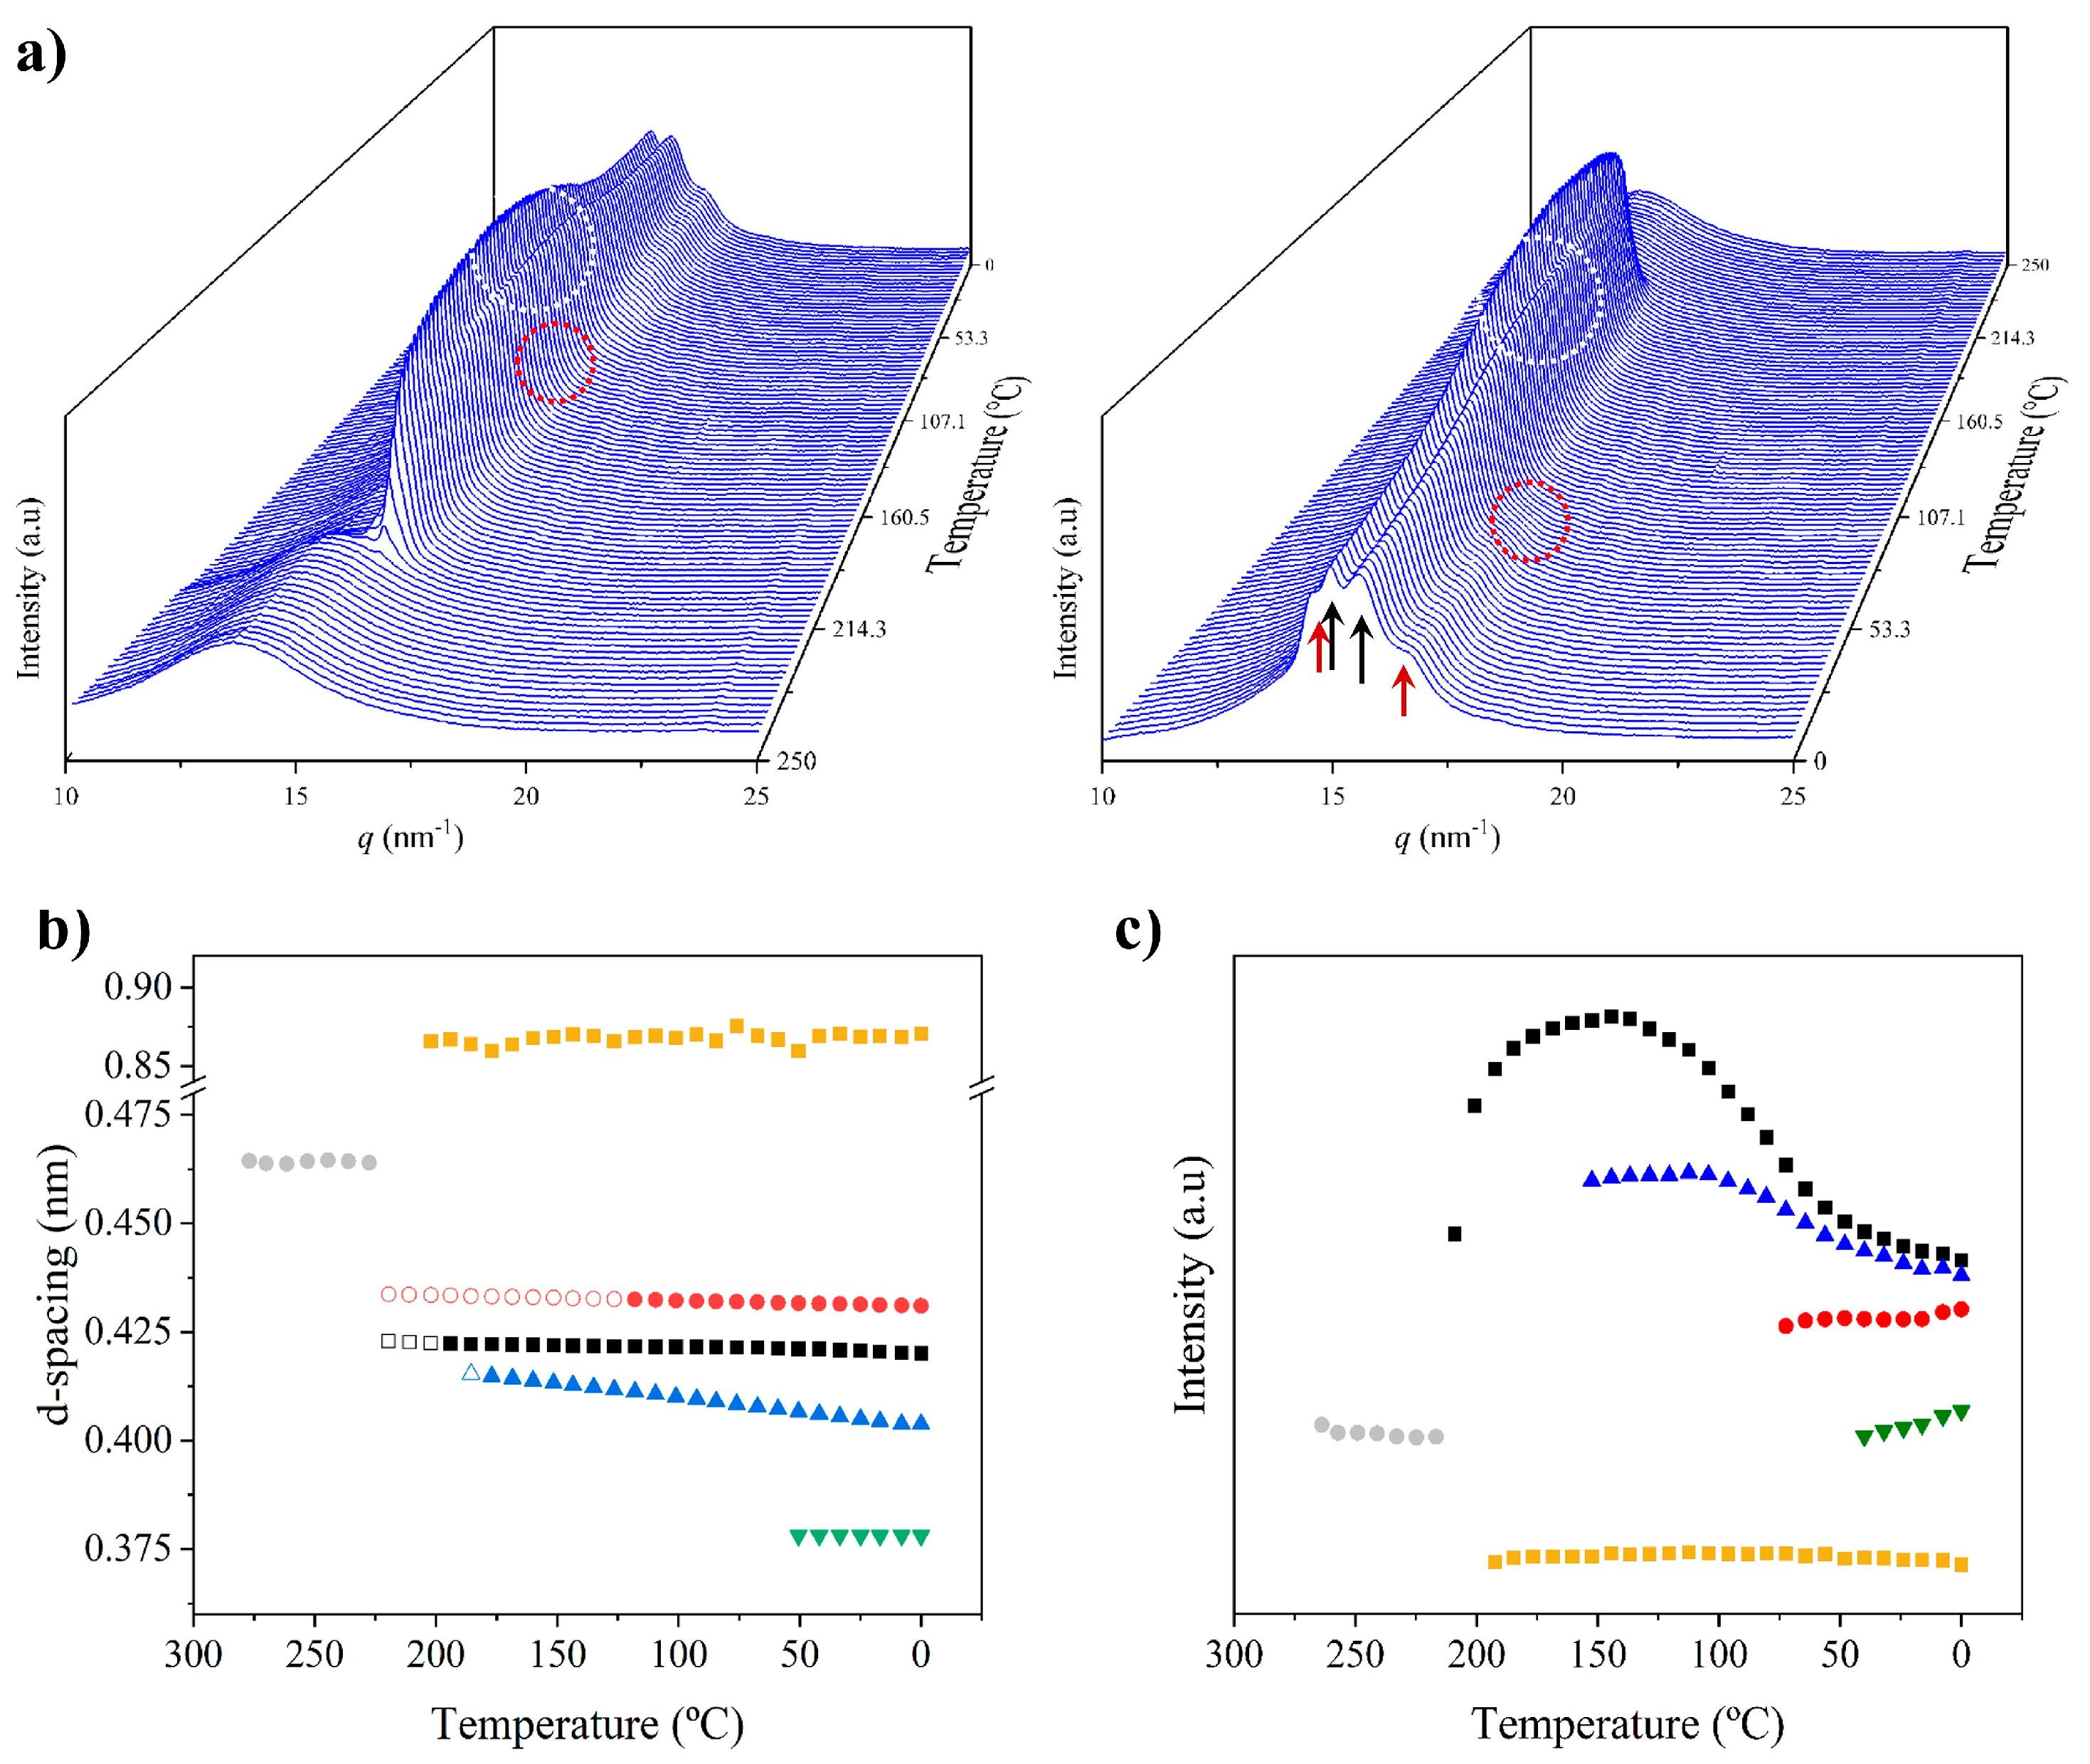
3.4. Structural Transitions of Nylon 6,7 During Heating/Cooling Processes
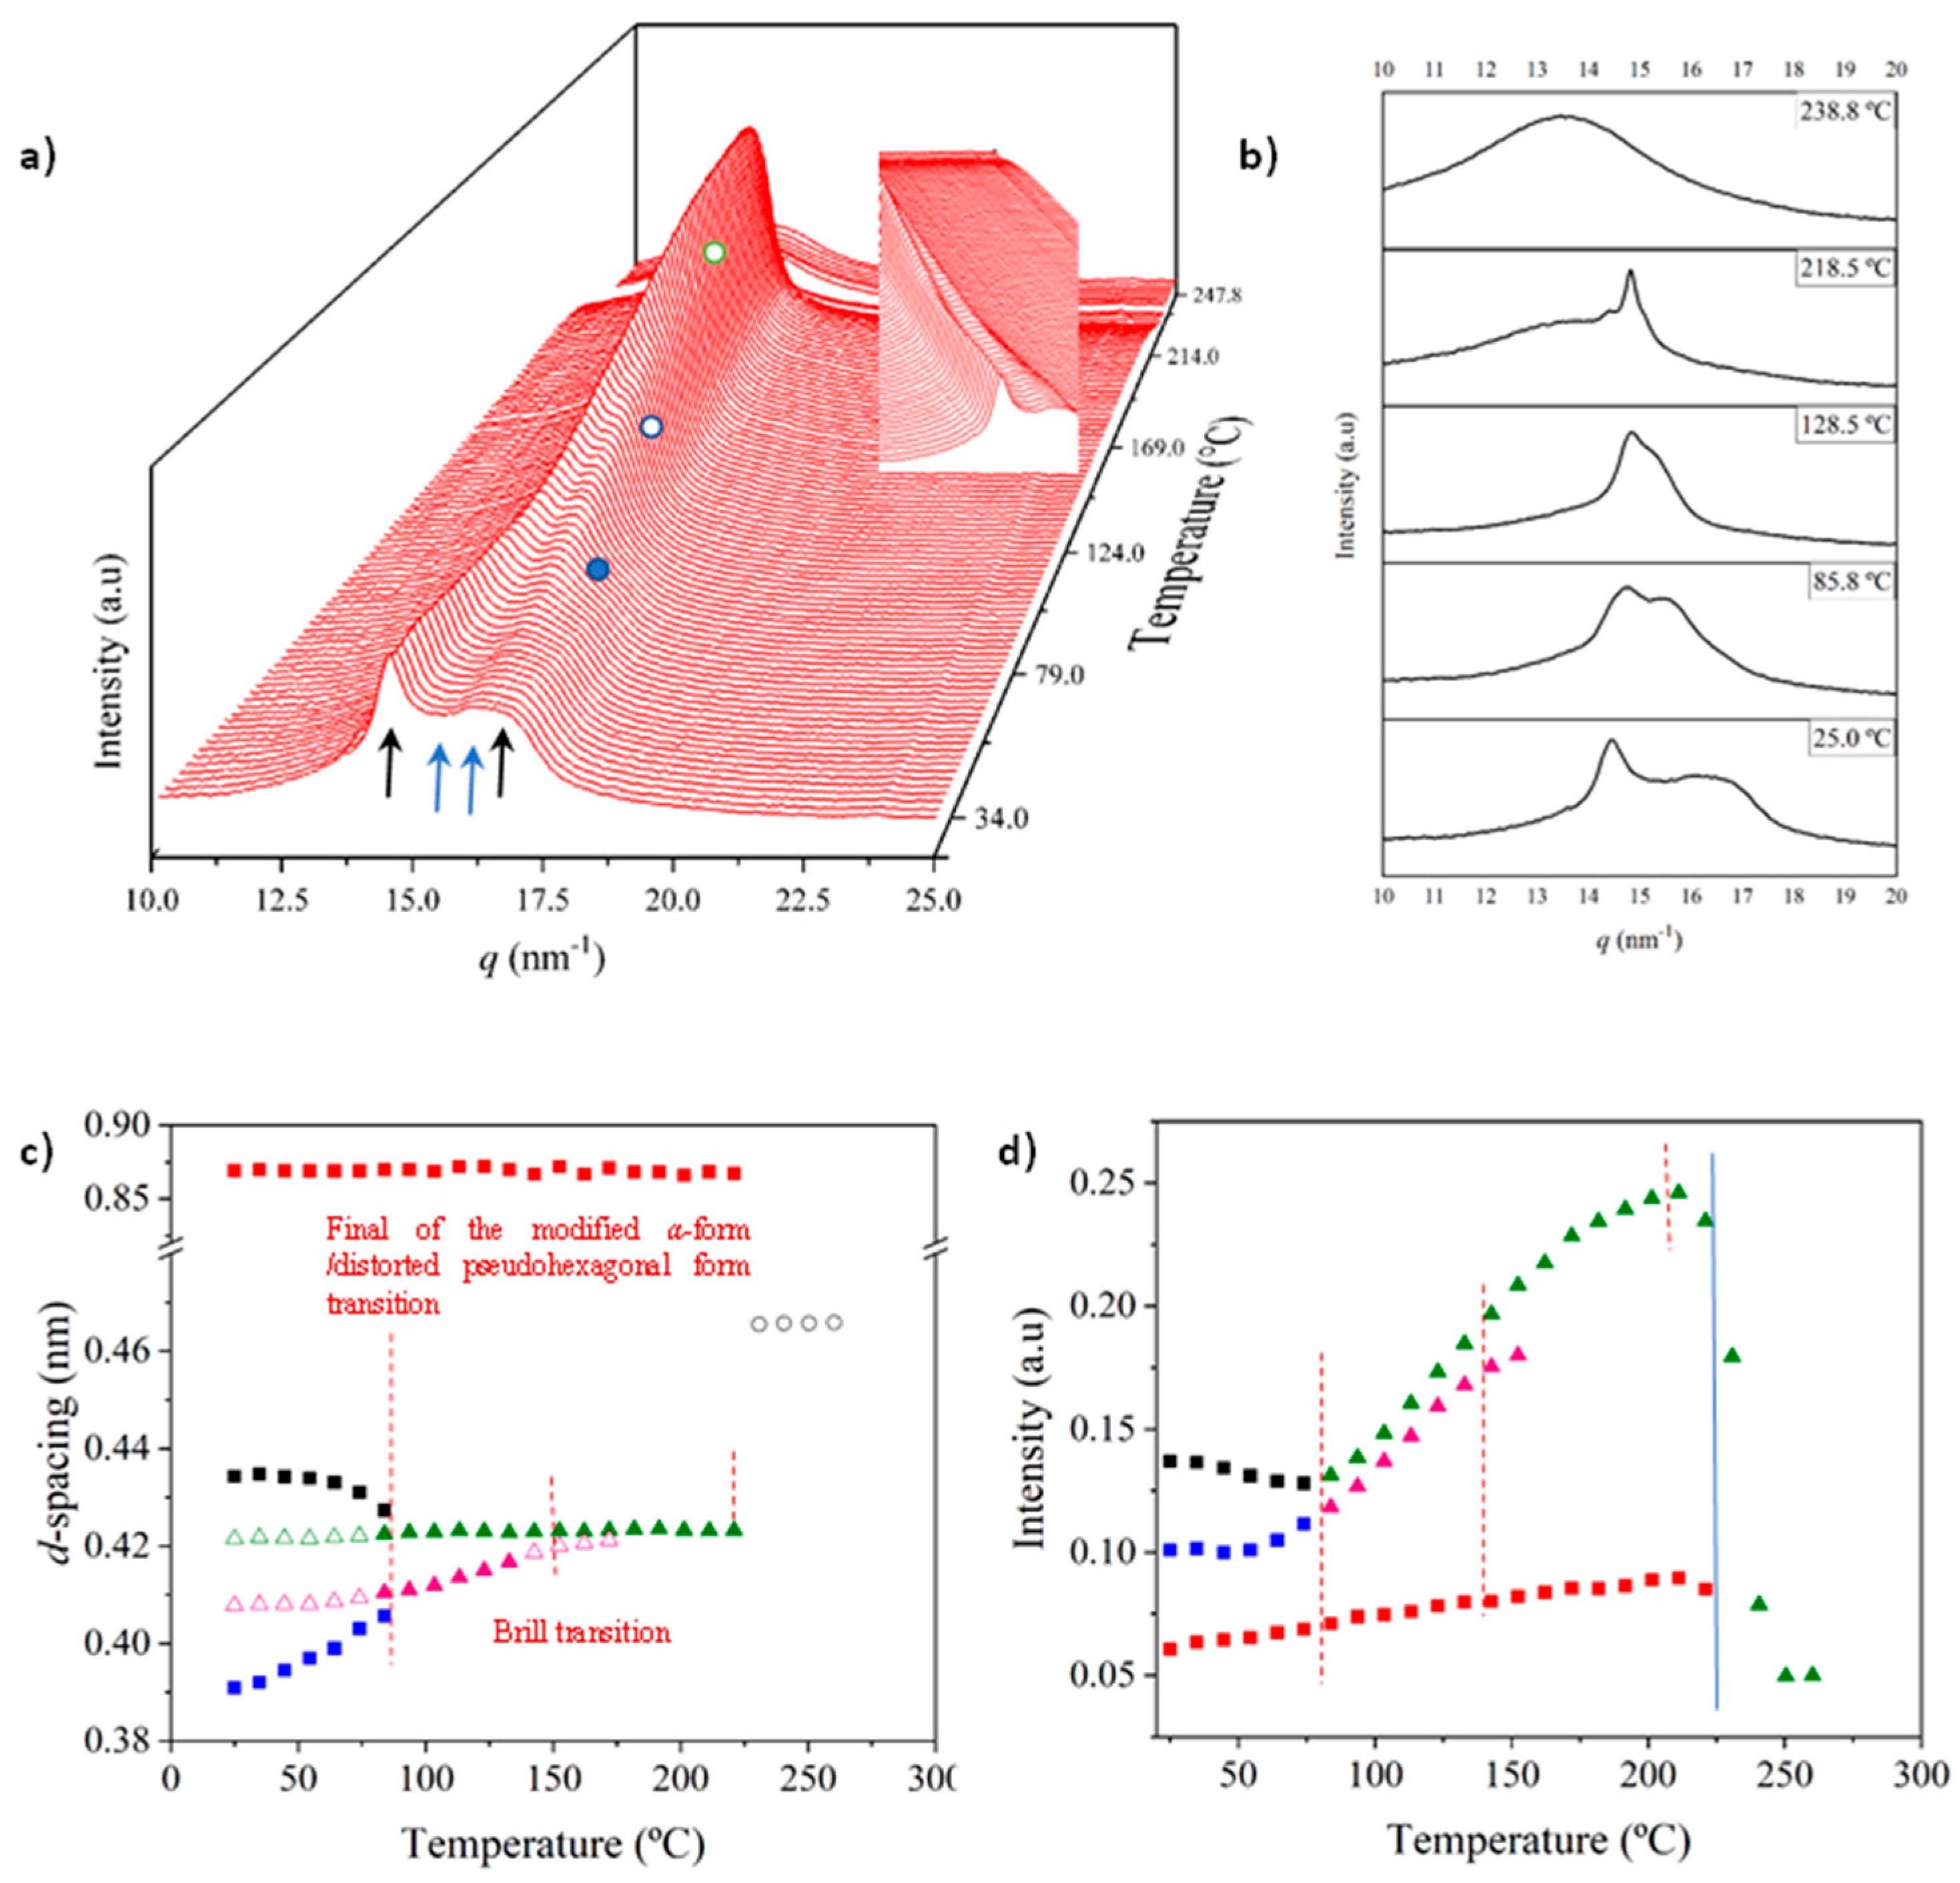
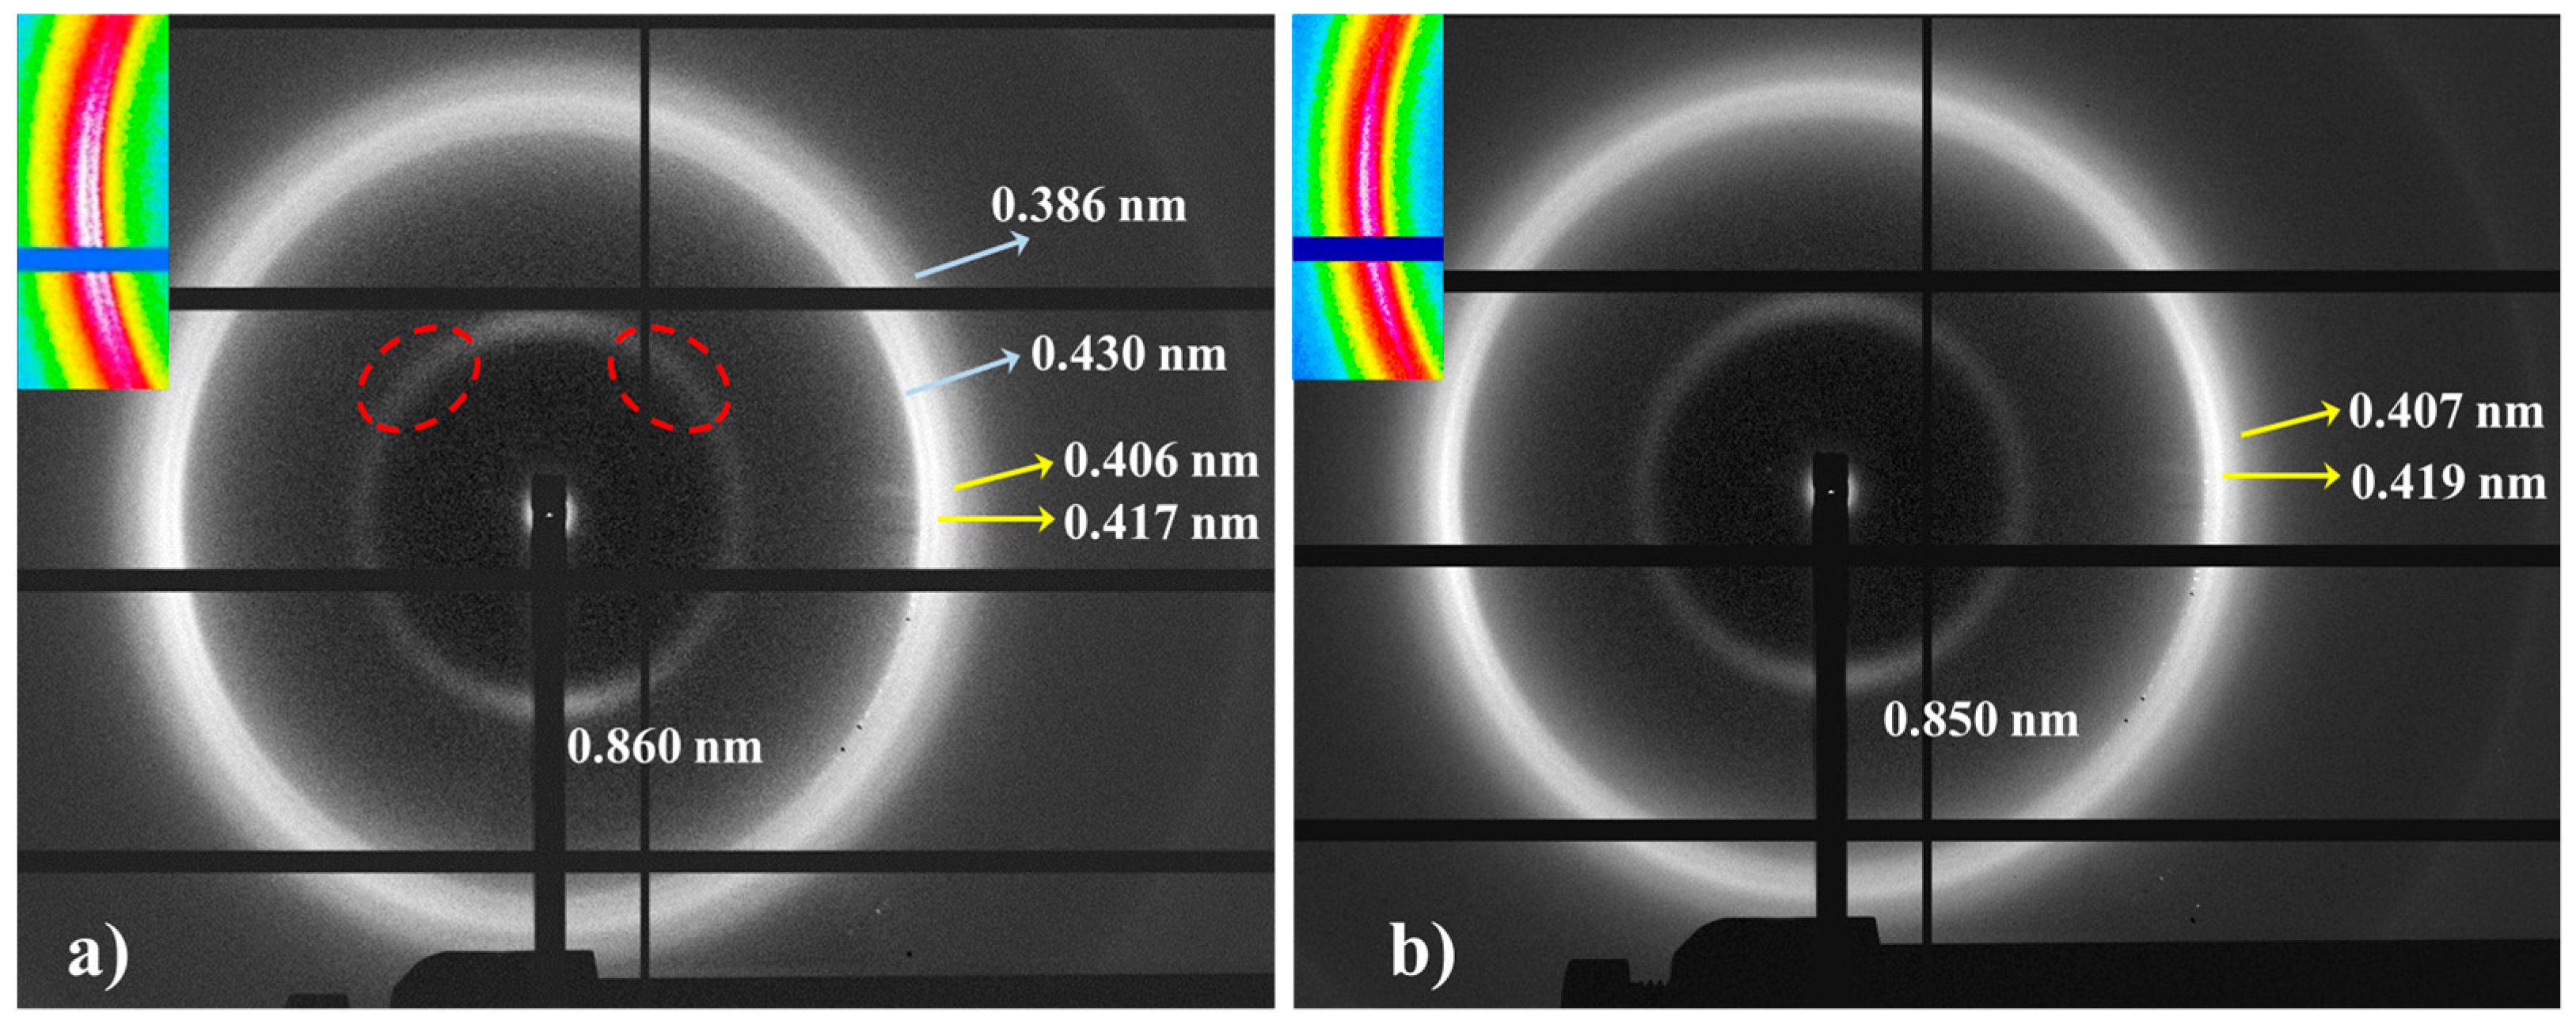
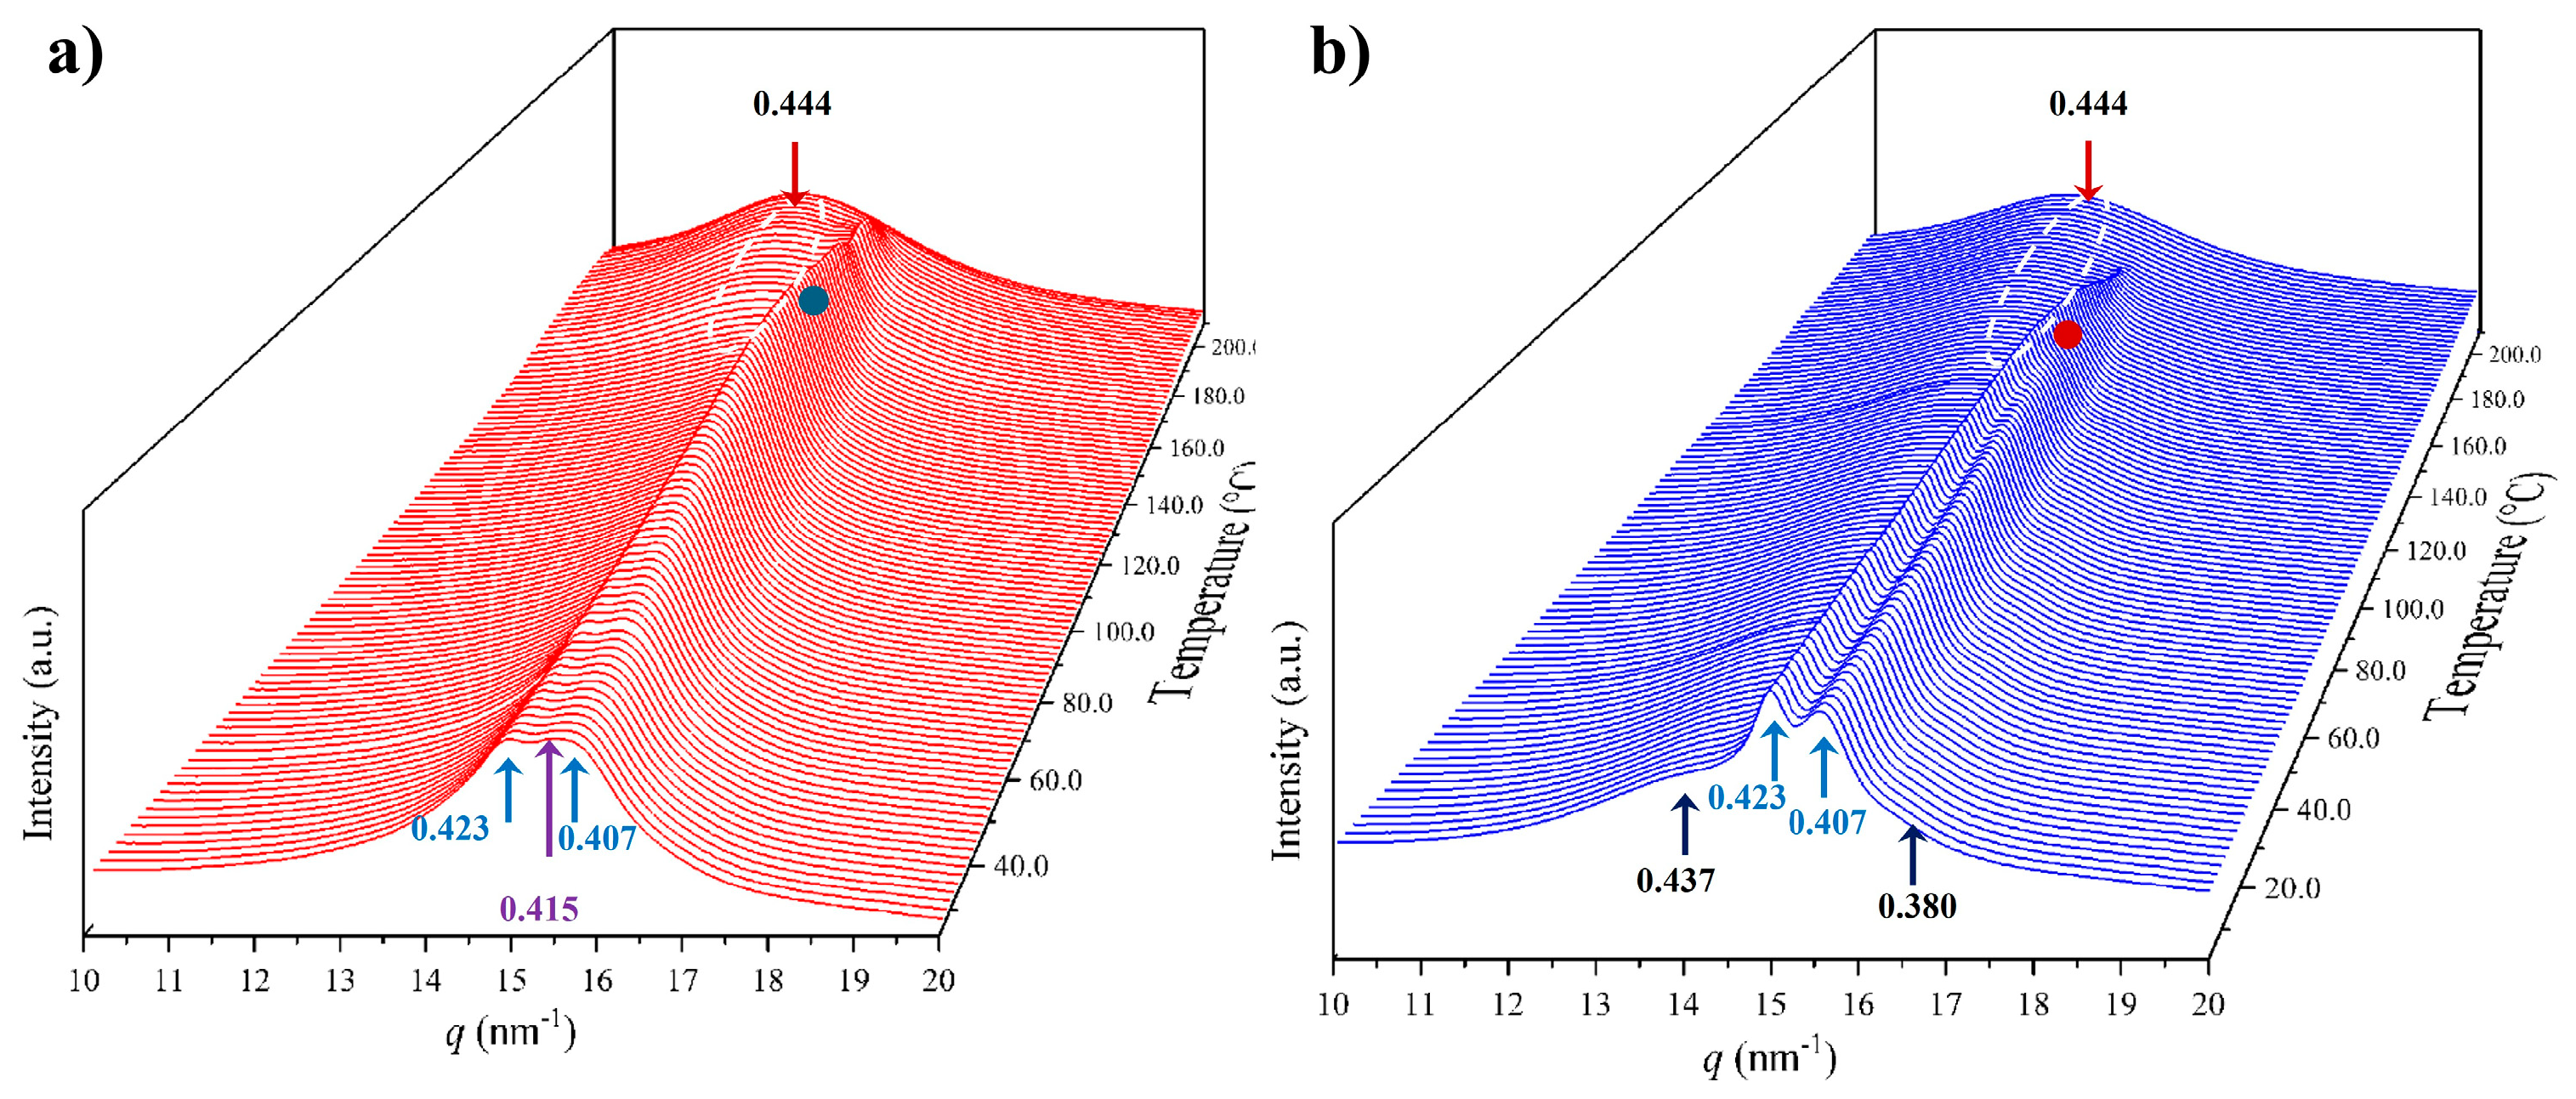
- The initial sample is characterized by the two typical reflections of the α-modified form (i.e., the narrow peak at 0.430 nm and the broad peak at 0.380 nm, see black arrows). In addition, two very small signals at 0.421 nm and 0.404 nm (blue arrows) can be intuited. These indicate a highly distorted pseudohexagonal form due to the clear deviation of a single spacing around 0.415 nm. Observed structures correlate perfectly with forms I and II indicated for nylon 4,7, but for the sake of completeness, will be described in the present paper as a modified α-form (2H-bonding directions) and an intermediate distorted pseudohexagonal form.
- A continuous decrease in the intensity of the two reflections associated with the modified α-form can be observed, while those associated with the distorted pseudohexagonal form also increased in a continuous way. The process seems to end at a temperature close to 91 °C (see profile in Figure 7b and also the intensity evolution indicated in Figure 7d). It is therefore significant that the structural change does not take place at a specific temperature and corresponds to a gradual transformation that involved the arrangement of hydrogen bonds towards the pseudohexagonal form. It was previously suggested that this transformation implied a slight change in conformational angles that led to an angle close to 60° between consecutive amide bonds of the odd–even unit. Note that in disagreement with the structural changes described for conventional nylons, the spacings of 4.30 nm and 0.380 nm reflections remained practically constant. Nevertheless, the increase in temperature is moderate (i.e., from 25 °C to 91 °C) and consequently, changes caused by dilation effects should not be significant. The observed structural transition could not be demonstrated by DSC measurements, since no evidence of exothermic or endothermic events was detected in the DSC trace of the first heating run in the temperature range between 25 °C and 91 °C (Figure 4). Similar observations were previously reported for nylon 4,7 [27].
- The two reflections at 0.421 nm and 0.404 nm progressively approach each other (Figure 7c) and join in a single spacing at 0.420 nm at a temperature of 231 °C (Figure 7b,c). Basically, the less intense reflection at the spacing of 0.404 nm has the higher shift and appears as the shoulder of the main reflection at temperatures close to 130 °C (Figure 7b). Note that the intensity of the main reflection clearly increases as a consequence of the indicated overlapping (Figure 7d).
- When the Brill structure is achieved, the intensity of the single reflection at 0.420 is practically constant (Figure 7d).
- Melting process starts at a temperature of 210 °C as evidenced by the decrease in the Bragg reflection and the appearance of an amorphous halo centered at 0.468 nm (Figure 7b,c).
- Evidence of an increase in crystallinity as a consequence of a lamellar reordering cannot be deduced from the synchrotron profile evolution (Figure 7a). Note that DSC data indicated a complex melting peak that was associated with an increase in the degree of perfection of constitutive lamellae.
- A long spacing (associated with the 004 reflection) is observed at a spacing of 0.860 nm. This spacing is practically constant during all heating processes and consequently is not useful for detecting structural transitions.
3.5. Structural Transitions of Nylon 8,7 During Heating/Cooling Processes
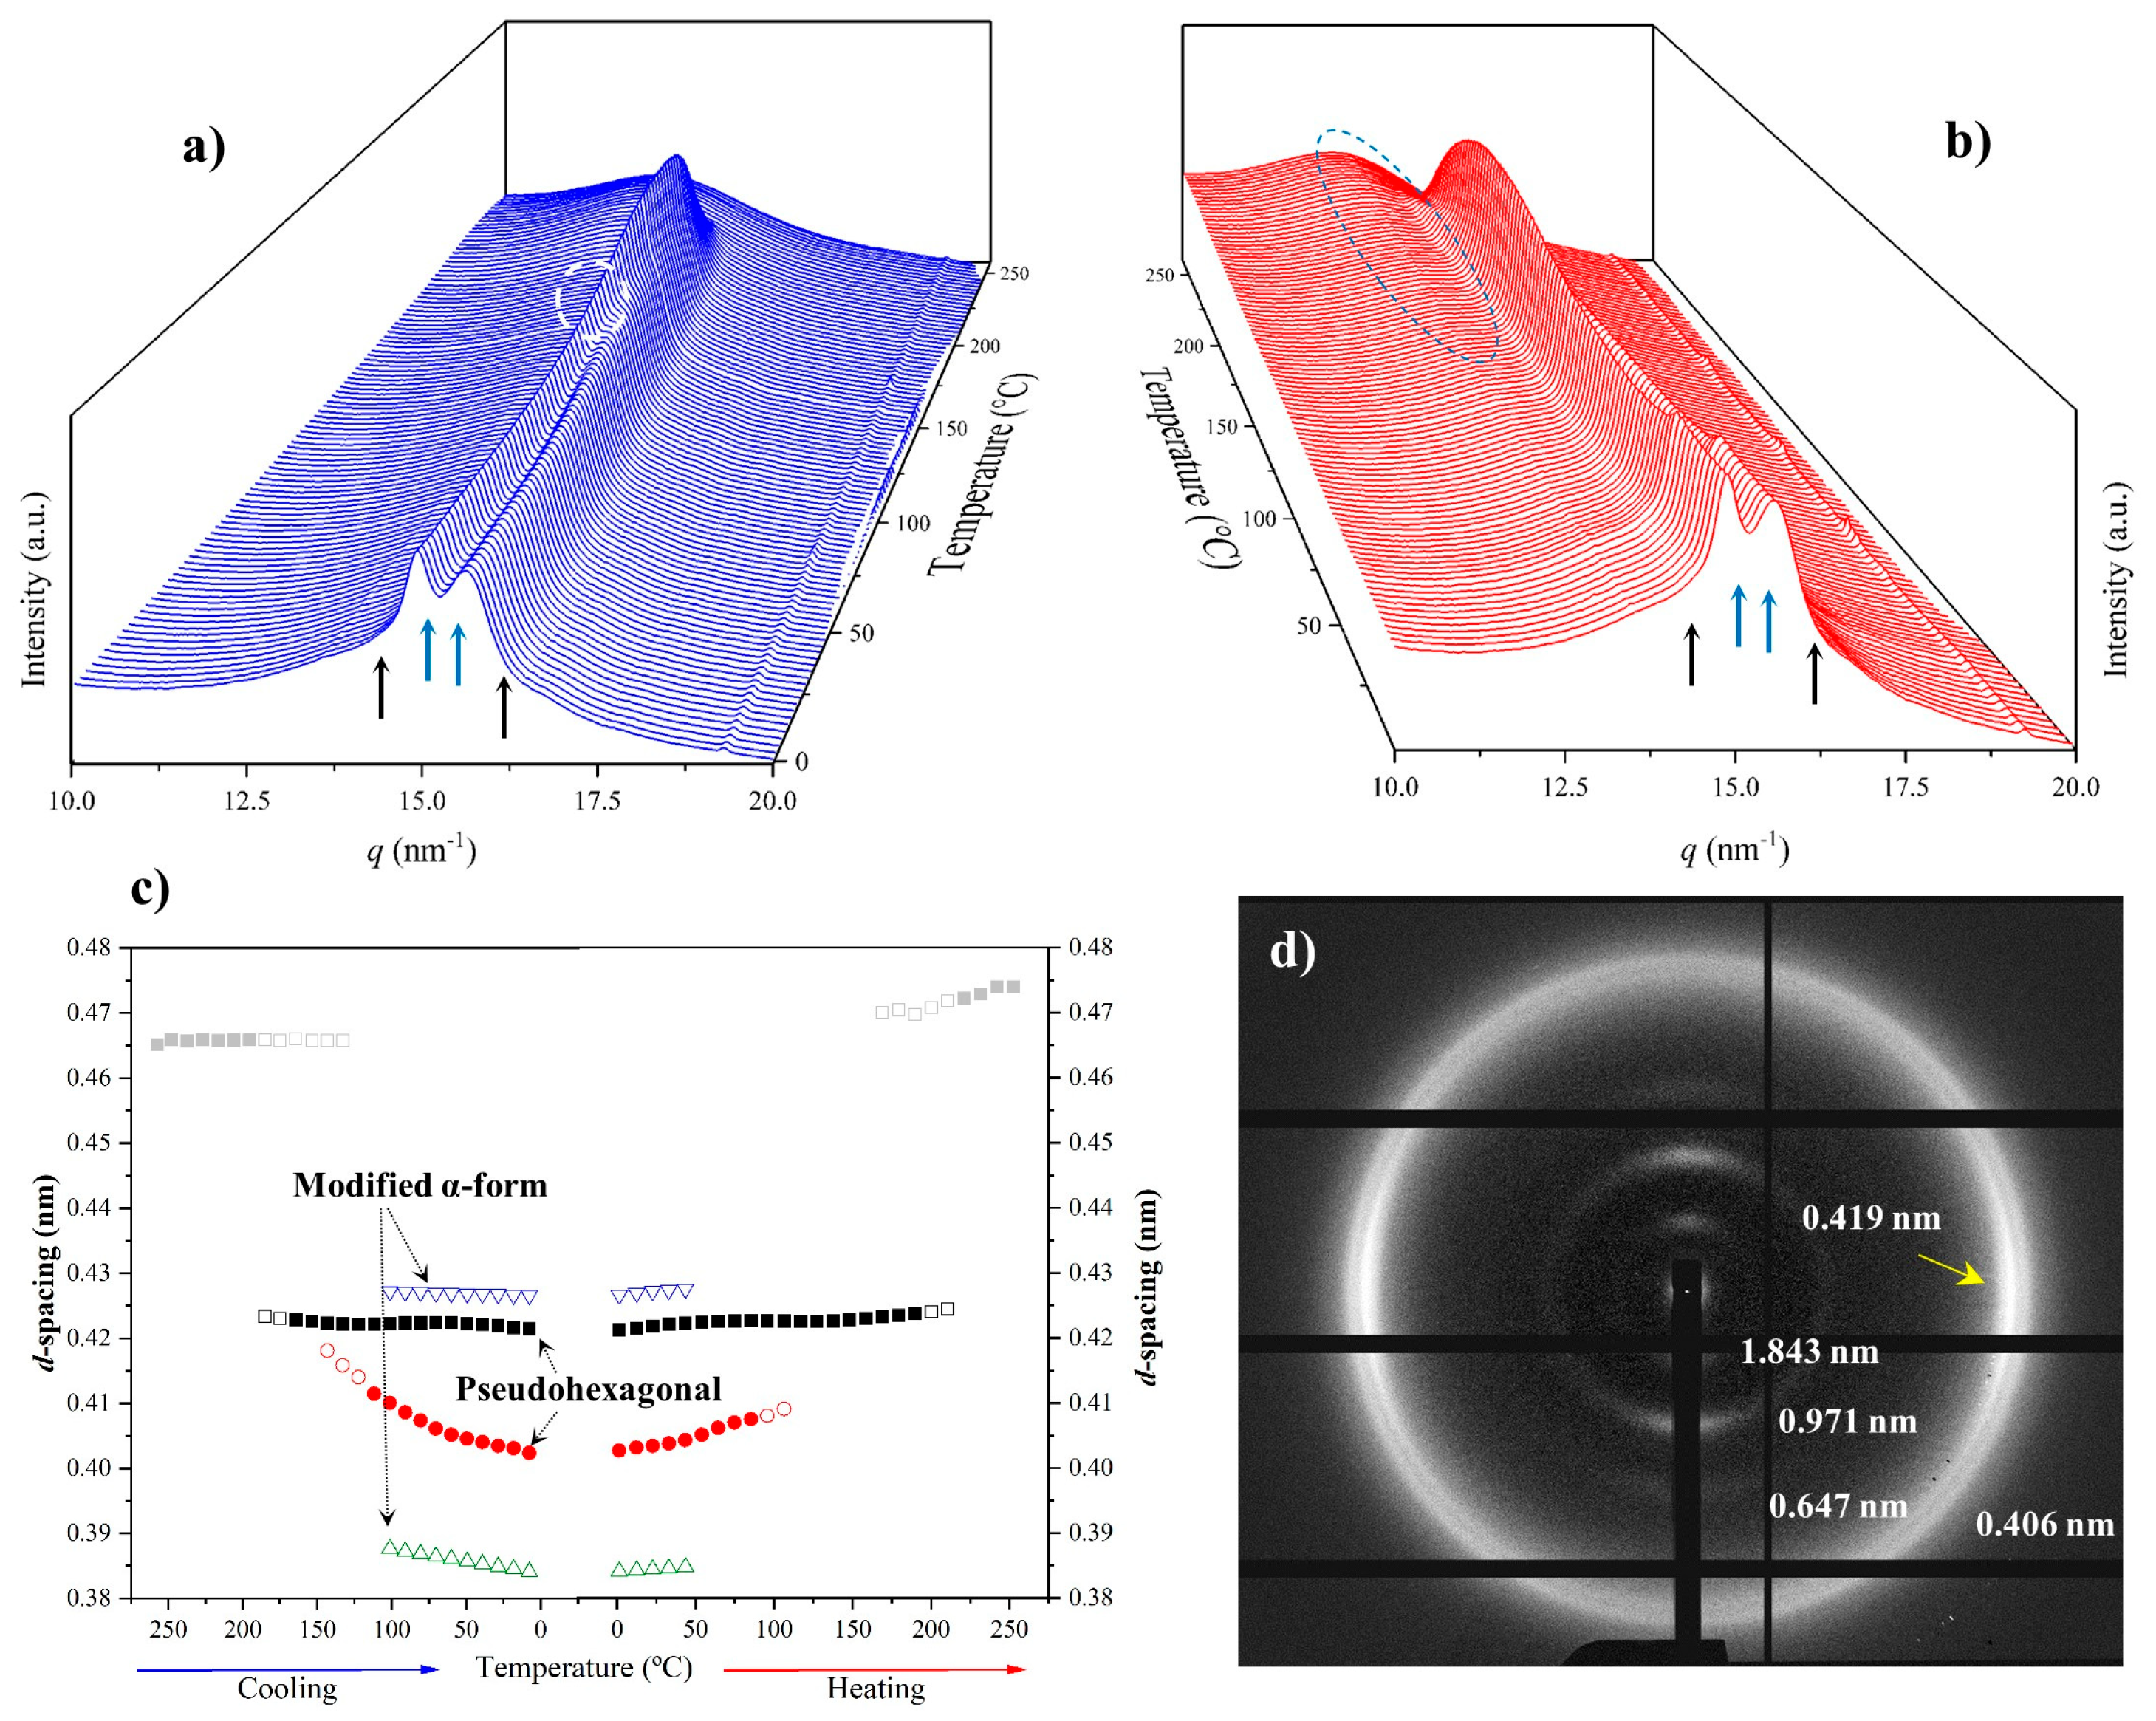
- The initial profile corresponds to a mixture of the α-modified form with reflections at 0.441 nm and 0.371 nm and the distorted pseudohexagonal form with reflections at 0.424 nm and 0.395 nm. The specific ratio between the two polymorphs becomes the main difference between the profiles of nylons 6,7 and 8,7. Thus, the distorted pseudohexagonal form appeared in a minority ratio in nylon 6,7, while it was slightly predominant in nylon 8,7.
- The intensity of the α-modified form reflections gradually decreased and practically disappeared at 115 °C (see the selected profiles in Figure 12b). The spacings of these reflections remained practically constant up to their disappearance (Figure 12c), probably due to the not significant cell dilatation in the relatively small range of temperatures that was assumed.
- The intensity of reflections associated with the distorted pseudohexagonal form increased with temperature, and it was possible to distinguish two steps (Figure 12a). The first one was characterized by a gradual and moderate increase and coincided with the intensity decrease in the modified α-form. Therefore, a gradual transformation from the modified α-form to the distorted pseudohexagonal form seems to take place. The second step corresponded to a greater intensity increase and appeared to be associated with the gradual overlapping of the two characteristic reflections. As shown in Figure 12c, the spacing of the reflection at 0.395 nm experiences a remarkable increase with temperature, while the spacing of the 0.424 nm reflection remained practically constant.
- At a temperature of 170 °C, the Brill transition took place and only a single crystalline reflection at 0.423 nm was observed.
- All crystalline reflections disappeared when the temperature reached 220 °C, with the most distinctive feature being the presence of the broad amorphous halo at 0.465 nm.
- Only a long spacing reflection with a significant intensity was detected. This reflection corresponded to a spacing of 0.972 nm that was also practically constant during the heating process.

3.6. Structural Transitions of Nylon 10,7 During Heating/Cooling Processes
4. Conclusions
Author Contributions
Funding
Data Availability Statement
Acknowledgments
Conflicts of Interest
References
- Xenopoulos, A.; Clark, E. Nylon Plastics Handbook. Kohan, M.I., Ed.; Hanser: New York, NY, USA, 1995. [Google Scholar]
- Wang, L.; Dong, X.; Huang, M.; Müller, A.J.; Wang, D. Self-Associated Polyamide Alloys with Tailored Polymorphism Transition and Lamellar Thickening for Advanced Mechanical Application. ACS Appl. Mater. Interfaces 2017, 9, 19238–19247. [Google Scholar] [CrossRef] [PubMed]
- Arioli, M.; Puiggalí, J.; Franco, L. Nylons with Applications in Energy Generators, 3D Printing and Biomedicine. Molecules 2024, 29, 2443. [Google Scholar] [CrossRef] [PubMed]
- Global Nylon Industry. Available online: https://www.reportlinker.com/report-summary/Plastic/145533/Global-Nylon-Industry.html?autogen=1 (accessed on 17 June 2025).
- Radzik, P.; Leszczyńska, A.; Pielichowski, K. Modern Biopolyamide-Based Materials: Synthesis and Modification. Polym. Bull. 2020, 77, 501–528. [Google Scholar] [CrossRef]
- Kawashima, N.; Yagi, T.; Kojima, K. How Do Bioplastics and Fossil-Based Plastics Play in a Circular Economy? Macromol. Mater. Eng. 2019, 304, 1900383. [Google Scholar] [CrossRef]
- Davis, S.J.; Caldeira, K.; Matthews, H.D. Future CO2 Emissions and Climate Change from Existing Energy Infrastructure. Science 2010, 329, 1330–1333. [Google Scholar] [CrossRef] [PubMed]
- Iwata, T. Biodegradable and Bio-Based Polymers: Future Prospects of Eco-Friendly Plastics. Angew. Chem. Int. Ed. 2015, 54, 3210–3215. [Google Scholar] [CrossRef]
- Anastas, P.; Eghbali, N. Green Chemistry: Principles and Practice. Chem. Soc. Rev. 2010, 39, 301–312. [Google Scholar] [CrossRef]
- Wang, X.; Gao, S.; Wang, J.; Xu, S.; Li, H.; Chen, K.; Ouyang, P. The Production of Biobased Diamines from Renewable Carbon Sources: Current Advances and Perspectives. Chin. J. Chem. Eng. 2021, 30, 4–13. [Google Scholar] [CrossRef]
- Kind, S.; Wittmann, C. Bio-Based Production of the Platform Chemical 1,5-Diaminopentane. Appl. Microbiol. Biotechnol. 2011, 91, 1287–1296. [Google Scholar] [CrossRef]
- Chung, H.; Yang, J.E.; Ha, J.Y.; Chae, T.U.; Shin, J.H.; Gustavsson, M.; Lee, S.Y. Bio-Based Production of Monomers and Polymers by Metabolically Engineered Microorganisms. Curr. Opin. Biotechnol. 2015, 36, 73–84. [Google Scholar] [CrossRef]
- Wendisch, V.F.; Mindt, M.; Pérez-García, F. Biotechnological Production of Mono- and Diamines Using Bacteria: Recent Progress, Applications, and Perspectives. Appl. Microbiol. Biotechnol. 2018, 102, 3583–3594. [Google Scholar] [CrossRef]
- Chae, T.U.; Kim, W.J.; Choi, S.; Park, S.J.; Lee, S.Y. Metabolic Engineering of Escherichia Coli for the Production of 1,3-Diaminopropane, a Three Carbon Diamine. Sci. Rep. 2015, 5, 13040. [Google Scholar] [CrossRef] [PubMed]
- Choi, H.; Kyeong, H.H.; Choi, J.M.; Kim, H.S. Rational Design of Ornithine Decarboxylase with High Catalytic Activity for the Production of Putrescine. Appl. Microbiol. Biotechnol. 2014, 98, 7483–7490. [Google Scholar] [CrossRef] [PubMed]
- Aceituno, J.E.; Tereshko, V.; Lotz, B.; Subirana, J.A. Synthesis and Characterization of Polyamides n,3. Macromolecules 1996, 29, 1886–1893. [Google Scholar] [CrossRef]
- Puiggalí, J.; Aceituno, J.E.; Navarro, E.; Campos, J.L.; Subirana, J.A. Structure of n,3 Polyamides, a Group of Nylons with Two Spatial Hydrogen-Bond Orientations. Macromolecules 1996, 29, 8170–8179. [Google Scholar] [CrossRef]
- Navarro, E.; Alemán, C.; Subirana, J.; Puiggalí, J. On the Crystal Structure of Nylon 55. Macromolecules 1996, 29, 5406–5415. [Google Scholar] [CrossRef]
- Navarro, E.; Franco, L.; Subirana, J.A.; Puiggalí, J. Nylon 65 Has a Unique Structure with Two Directions of Hydrogen Bonds. Macromolecules 1995, 28, 8742–8750. [Google Scholar] [CrossRef]
- Navarro, E.; Subirana, J.A.; Puiggalí, J. The Structure of Nylon 12,5 Is Characterized by Two Hydrogen Bond Directions as Are Other Polyamides Derived from Glutaric Acid. Polymer 1997, 38, 3429–3432. [Google Scholar] [CrossRef]
- Zhou, L.; Cheng, K.; Liu, T.; Li, N.; Zhang, H.; He, Y. Fully Bio-Based Poly (Pentamethylene Glutaramide) with High Molecular Weight and Less Glutaric Acid Cyclization via Direct Solid-State Polymerization. Eur. Polym. J. 2022, 180, 111618. [Google Scholar] [CrossRef]
- Manandhar, M.; Cronan, J.E. Pimelic Acid, the First Precursor of the Bacillus Subtilis Biotin Synthesis Pathway, Exists as the Free Acid and Is Assembled by Fatty Acid Synthesis. Mol. Microbiol. 2017, 104, 595–607. [Google Scholar] [CrossRef]
- Cronan, J.E.; Lin, S. Synthesis of the α,ω-Dicarboxylic Acid Precursor of Biotin by the Canonical Fatty Acid Biosynthetic Pathway. Curr. Opin. Chem. Biol. 2011, 15, 407–413. [Google Scholar] [CrossRef]
- Ohsugi, M.; Miyauchi, K.; Tachibana, K.; Nakao, S. Formation of a Biotin Precursor, Pimelic Acid, in Yeasts from C18 Fatty Acids. J. Nutr. Sci. Vitaminol. 1988, 34, 343–352. [Google Scholar] [CrossRef] [PubMed]
- Bennett, M.J.; Ragni, M.C.; Hood, I.; Hale, D.E. Azelaic and Pimelic Acids: Metabolic Intermediates or Artefacts? J. Inherit. Metab. Dis. 1992, 15, 220–223. [Google Scholar] [CrossRef] [PubMed]
- Medical Dictionary Pimelic Acid. Available online: https://www.merriam-webster.com (accessed on 4 August 2024).
- Morales-Gámez, L.; Casas, M.T.; Franco, L.; Puiggalí, J. Structural Transitions of Nylon 47 and Clay Influence on Its Crystallization Behavior. Eur. Polym. J. 2013, 49, 1354–1364. [Google Scholar] [CrossRef]
- Starkweather, H.W. Transitions and Relaxations. In Nylon Plastic Handbook; Kohan, M.I., Ed.; Hanser: New York, NY, USA, 1995; p. 139. [Google Scholar]
- Seguela, R. Overview and Critical Survey of Polyamide6 Structural Habits: Misconceptions and Controversies. J. Polym. Sci. 2020, 58, 2971–3003. [Google Scholar] [CrossRef]
- Murthy, N.S. Hydrogen Bonding, Mobility, and Structural Transitions in Aliphatic Polyamides. J. Polym. Sci. B Polym. Phys. 2006, 44, 1763–1782. [Google Scholar] [CrossRef]
- Feldman, A.Y.; Wachtel, E.; Vaughan, G.B.M.; Weinberg, A.; Marom, G. The Brill Transition in Transcrystalline Nylon-66. Macromolecules 2006, 39, 4455–4459. [Google Scholar] [CrossRef]
- Lotz, B. Brill Transition in Nylons: The Structural Scenario. Macromolecules 2021, 54, 565–583. [Google Scholar] [CrossRef]
- Mileva, D.; Kolesov, I.; Androsch, R. Morphology of Cold-Crystallized Polyamide 6. Colloid. Polym. Sci. 2012, 290, 971–978. [Google Scholar] [CrossRef]
- Tashiro, K.; Yoshioka, Y. Molecular Dynamics Simulation of the Structural and Mechanical Property Changes in the Brill Transition of Nylon 10/10 Crystal. Polymer 2004, 45, 4337–4348. [Google Scholar] [CrossRef]
- Olf, H.G.; Peterlin, A. NMR Observations of Drawn Polymers. VII. Nylon 66 Fibers. J. Polym. Sci. Part A-2 Polym. Phys. 1971, 9, 1449–1469. [Google Scholar] [CrossRef]
- Lovinger, A.J. Crystallographic Factors Affecting the Structure of Polymeric Spherulites. I. Morphology of Directionally Solidified Polyamides. J. Appl. Phys. 1978, 49, 5003–5013. [Google Scholar] [CrossRef]
- Lovinger, A.J. Crystallographic Factors Affecting the Structure of Polymeric Spherulites. II. X-ray Diffraction Analysis of Directionally Solidified Polyamides and General Conclusions. J. Appl. Phys. 1978, 49, 5014–5028. [Google Scholar] [CrossRef]
- Magill, J.H. Formation of Spherulites in Polyamide Melts: Part III. Even-Even Polyamides. J. Polym. Sci. Part A-2 Polym. Phys. 1966, 4, 243–265. [Google Scholar] [CrossRef]
- Hirami, M. SAXD Studies on Bulk Crystallization of Nylon 6.I. Changes in Crystal Structure, Heat of Fusion, and Surface Free Energy of Lamellar Crystals with Crystallization Temperature. J. Macromol. Sci. Part B 1984, 23, 397–414. [Google Scholar] [CrossRef]
- Lotz, B.; Cheng, S.Z.D.; Li, C.Y. Structure of Negative Spherulites of Even-Even Polyamides. Introducing a Complex Multicomponent Spherulite Architecture. Macromolecules 2018, 51, 5138–5156. [Google Scholar] [CrossRef]
- Bunn, C.W.; Garner, E.V.; Bragg, W.L. The Crystal Structures of Two Polyamides (‘Nylons’). Proc. R. Soc. Lond. A Math. Phys. Sci. 1947, 189, 39–68. [Google Scholar] [CrossRef]
- Holmes, D.R.; Bunn, C.W.; Smith, D.J. The Crystal Structure of Polycaproamide: Nylon 6. J. Polym. Sci. 1955, 17, 159–177. [Google Scholar] [CrossRef]
- Kinoshita, Y. The Crystal Structure of Polyheptamethylene Pimelamide (Nylon 77). Makromol. Chem. 1959, 33, 21–31. [Google Scholar] [CrossRef]
- Morales-Gámez, L.; Ricart, A.; Franco, L.; Puiggalí, J. Study on the Brill Transition and Melt Crystallization of Nylon 65: A Polymer Able to Adopt a Structure with Two Hydrogen-Bonding Directions. Eur. Polym. J. 2010, 46, 2063–2077. [Google Scholar] [CrossRef]
- Olmo, C.; Casas, M.T.; Martínez, J.C.; Franco, L.; Puiggalí, J. Thermally Induced Structural Transitions of Nylon 4 9 as a New Example of Even-Odd Polyamides. Polym. 2018, 10, 198. [Google Scholar] [CrossRef] [PubMed]
- Franco, L.; Cooper, S.J.; Atkins, E.D.T.; Hill, M.J.; Jones, N.A. Nylon 6 9 Can Crystallize with Hydrogen Bonding in Two and in Three Interchain Directions. J. Polym. Sci. B Polym. Phys. 1998, 36, 1153–1165. [Google Scholar] [CrossRef]
- Murase, S.K.; Casas, M.T.; Martínez, J.C.; Estrany, F.; Franco, L.; Puiggalí, J. Reversible Changes Induced by Temperature in the Spherulitic Birefringence of Nylon 6 9. Polymer 2015, 76, 34–45. [Google Scholar] [CrossRef]
- Olmo, C.; Rota, R.; Carlos Martínez, J.; Puiggalí, J.; Franco, L. Temperature-Induced Structural Changes in Even-Odd Nylons with Long Polymethylene Segments. J. Polym. Sci. B Polym. Phys. 2016, 54, 2494–2506. [Google Scholar] [CrossRef]
- Puiggalí, J.; Franco, L.; Alemán, C.; Subirana, J.A. Crystal Structures of Nylon 5,6. A Model with Two Hydrogen Bond Directions for Nylons Derived from Odd Diamines. Macromolecules 1998, 31, 8540–8548. [Google Scholar] [CrossRef]
- Morales-Gámez, L.; Soto, D.; Franco, L.; Puiggalí, J. Brill Transition and Melt Crystallization of Nylon 56: An Odd-Even Polyamide with Two Hydrogen-Bonding Directions. Polymer 2010, 51, 5788–5798. [Google Scholar] [CrossRef]
- Villaseñor, P.; Franco, L.; Subirana, J.A.; Puiggalí, J. On the Crystal Structure of Odd-Even Nylons: Polymorphism of Nylon 5,10. J. Polym. Sci. B Polym. Phys. 1999, 37, 2383–2395. [Google Scholar] [CrossRef]
- Puiggalí, J.; Muñoz-Guerra, S.; Lotz, B. Extended-Chain and Three-Fold Helical Forms of Poly(Glycyl-β-Alanine). Macromolecules 1986, 19, 1119–1124. [Google Scholar] [CrossRef]
- Puiggalí, J.; Muñoz-Guerra, S.; Subirana, J.A. Morphology and Crystalline Structure of Nylon-2/6. Polymer 1987, 28, 209–212. [Google Scholar] [CrossRef]
- Bella, J.; Puiggalí, J.; Subirana, J.A. Glycine Residues Induce a Helical Structure in Polyamides. Polymer 1994, 35, 1291–1297. [Google Scholar] [CrossRef]
- Tormo, J.; Puiggalí, J.; Vives, J.; Fita, I.; Lloveras, J.; Bella, J.; Aymamí, J.; Subirana, J.A. Crystal Structure of a Helical Oligopeptide Model of Polyglycine II and of Other Polyamides: Acetyl-(Glycyl-β-alanyl)2-NH Propyl. Biopolymers 1992, 32, 643–648. [Google Scholar] [CrossRef] [PubMed]
- Arioli, M.; Franco, L.; Puiggalí, J. Non-Isothermal Crystallization and Thermal Degradation Studies on Nylons 7,10 and 10,7 as Isomeric Odd-Even and Even-Odd Polyamides. Thermochim. Acta 2024, 735, 179721. [Google Scholar] [CrossRef]
- van Krevelen, D.W. Properties of Polymers, 3rd ed.; Elsevier Science: Amsterdam, The Netherlands, 1990; ISBN 9780080915104. [Google Scholar]


| Sample | Yield (%) a | Mw (g/mol) a | PDI a | Mw (g/mol) b | PDI b |
|---|---|---|---|---|---|
| Nylon 6,7 | 70 | 22,500 | 4.20 | 27,500 | 2.15 |
| Nylon 8,7 | 67 | 26,100 | 3.70 | 28,100 | 1.65 |
| Nylon 10,7 | 75 | 29,000 | 3.90 | 35,000 | 1.84 |
| Peak | δ (ppm) a | Integral | Assignation | Multiplicity |
|---|---|---|---|---|
| a | 3.51, 3.53, 3.55 | 4H, 4H, 4H | CH2-NH- | t |
| b | 2.69, 2.73, 2.74 | 4H, 4H, 4H | CH2-CO- | t |
| c | 1.82, 1.84, 1.83 | 4H, 4H, 4H | CH2CH2-NH- | m |
| d | 1.70, 1.70, 1.70 | 4H, 4H, 4H | CH2CH2-CO- | m |
| e | 1.51, 1.54, 1.54 | 2H, 2H, 2H | CH2(CH2)2-CO- | m |
| f | 1.44, 1.39, 1.36 | 4H, 8H, 12H | Remainder of methylene protons in diamine unit | m |
| Sample | T Onset (°C) | T Max (°C) | First Step (%) | Last Step (% and °C) |
|---|---|---|---|---|
| Nylon 6,7 | 410 | 447 | 5 | n.p. |
| Nylon 8,7 | 427 | 465 | 1 | 4.7, 539 |
| Nylon 10,7 | 421 | 467 | 5 | 6.6, 510 |
Disclaimer/Publisher’s Note: The statements, opinions and data contained in all publications are solely those of the individual author(s) and contributor(s) and not of MDPI and/or the editor(s). MDPI and/or the editor(s) disclaim responsibility for any injury to people or property resulting from any ideas, methods, instructions or products referred to in the content. |
© 2025 by the authors. Licensee MDPI, Basel, Switzerland. This article is an open access article distributed under the terms and conditions of the Creative Commons Attribution (CC BY) license (https://creativecommons.org/licenses/by/4.0/).
Share and Cite
Arioli, M.; Franco, L.; Puiggalí, J. Structure and Crystallization of Even–Odd Nylons Derived from Pimelic Acid: Influence of the Number of Methylene Groups in the Diamine Unit. Fibers 2025, 13, 86. https://doi.org/10.3390/fib13070086
Arioli M, Franco L, Puiggalí J. Structure and Crystallization of Even–Odd Nylons Derived from Pimelic Acid: Influence of the Number of Methylene Groups in the Diamine Unit. Fibers. 2025; 13(7):86. https://doi.org/10.3390/fib13070086
Chicago/Turabian StyleArioli, Matteo, Lourdes Franco, and Jordi Puiggalí. 2025. "Structure and Crystallization of Even–Odd Nylons Derived from Pimelic Acid: Influence of the Number of Methylene Groups in the Diamine Unit" Fibers 13, no. 7: 86. https://doi.org/10.3390/fib13070086
APA StyleArioli, M., Franco, L., & Puiggalí, J. (2025). Structure and Crystallization of Even–Odd Nylons Derived from Pimelic Acid: Influence of the Number of Methylene Groups in the Diamine Unit. Fibers, 13(7), 86. https://doi.org/10.3390/fib13070086