1. Introduction
Fiber-reinforced composites (FRCs) are an advanced class of cement-based materials designed to enhance flexibility and crack resistance, addressing the brittleness of traditional concrete. When an FRC exhibits a tensile strain-hardening capacity exceeding 3–5%, it qualifies as an engineered cementitious composite (ECC), also known as flexible concrete. Due to its tensile strength and ductility, an ECC is ideal for applications requiring superior durability, seismic resilience, and energy absorption, gaining widespread interest in research and construction for its potential to improve infrastructure longevity and performance [
1,
2].
The mechanical properties of FRCs and ECCs, such as compressive strength, tensile strength, and the modulus of elasticity, are strongly dependent on the constituent’s type, proportions, specimen size, and testing conditions [
3,
4].
FRCs and ECCs exhibit a broad range of compressive strengths. A 50% fly ash content with a 0.25 water/binder ratio yields approximately 60 MPa. Increasing the ratio to 0.35, the compressive strength reduces to 35 MPa. An 80% fly ash content drops the compressive strength to 11 MPa, making it unsuitable for most structural applications. However, a 0.4 water/binder ratio with 80% fly ash can achieve 80 MPa, increasing to 100 MPa when substituting fly ash with rice husk ash [
3,
4]. Testing under negative temperatures or high moisture can elevate the compressive strength from 70 to 110 MPa [
5], 55 to 80 MPa [
6], and 25 to 45 MPa [
7,
8]. Long-term pozzolanic effects enhance strength over time. If other admixtures such as calcium carbonate are utilized, the compressive strength does not exceed 25–35 MPa [
9].
Tensile strength and strain hardening or softening behavior also depend on fiber type and matrix toughness. Basalt fibers provide 6–8 MPa tensile strength with 1–2% strain [
10], PVA fibers typically offer 3–7 MPa tensile strength with 4–6% strain [
11,
12], while PE fibers range from 2.7–8 MPa with 1.95–14% strain [
11,
13,
14,
15]. Other options include polypropylene (PP), glass, plant-based or PET fibers, and steel fibers [
2,
16]. They are typically added at 1.3–2% of cement weight, either alone or in a combination [
15,
17]. The fiber type affects the strain-hardening efficiency. When cracks form, fiber-bridging occurs, distributing stress and enabling stable crack propagation. As crack propagation continues, the fibers separate from the matrix and elongate, causing the bridging stress to intensify, eventually leading to a stable cracking condition. If the bridging stress exceeds the matrix’s cracking stress, further loading does not widen the cracks. Matrix toughness significantly affects the fiber bond strength: lower toughness facilitates pseudo strain-hardening behavior, but excessive reduction may compromise initial crack strength. Toughness depends on the water/cement ratio, aggregate properties, and admixtures [
1]. The coating of the fibers is also an influencing factor for the strain hardening efficiency. A significant challenge with PVA fibers is their strong chemical bond with cement, which often leads to fiber rupture and limits the tensile strain capacity. Therefore, various surface modification methods have been explored. Among these, coating PVA fibers with synthetic or vegetable oils is one of the most practical and easy-to-apply techniques. It effectively reduces the fiber–matrix bond, which can enhance the strain-hardening behavior, provided the type of oil and coating level do not lead to chemical adhesion [
18,
19]. For instance, hydroxyl-treated PVA fibers increase chemical bonding with the matrix, leading to improvements in both compressive and flexural strength in ultra-high-performance concrete [
20]. Although oil-coated PVA fibers are widely studied in engineered cementitious composites (ECCs) and fiber-reinforced concrete (FRC), the use of vegetable oils, such as sunflower oil, as a coating in PVA-ECC remains underexplored. Vegetable oil is more sustainable and cost effective than synthetic oils. However, research on concrete samples impregnated by vegetable oil leads to spontaneous cracking, and the degree of degradation depends on the type of vegetable oil used, as well as its viscosity and concentration [
21]. Research on PVA fibers shows that sunflower oil induces environmental crazing, forming a porous, fibrillar structure that increases the surface area and sorption capacity. As a physically active liquid environment, it also plasticizes the polymer by lowering its elastic modulus and yield strength, thereby enhancing its flexibility [
22].
The modulus of elasticity for ECCs (18–34 GPa) is lower than that of ordinary concrete [
4]. Depending on mixture and testing conditions, values range from 20–40 GPa. Even with special admixtures, such as graphene oxide, it remains around 22 GPa [
8]. However, the high strain capacity of ECCs through fiber-bridging allows for structural elements to share loads with steel reinforcement after cracking, a feature absent in reinforced ordinary concrete. Thus, the actual value of the modulus of elasticity is not of great significance.
FRC and ECC components typically consist of cement, silica sand, water, and admixtures, such as fly ash, slag, silica fume, lime, or metakaolin, and dispersed fibers, particularly PVA fibers.
The type and dosage of the constituents is significant. Conventional concrete is using 300–400 kg/m
3 of Portland Cement. ECC studies are reporting 400–600 kg/m
3, though lower amounts, 126–270 kg/m
3 [
14] have been explored to reduce costs and environmental impact [
23].
Industrial by-products, like fly ash, slag, and silica fume, are often used. Fly ash content typically ranges from 400 kg/m
3 [
6] to 700 kg/m
3 [
24,
25,
26,
27], reaching up to 900 kg/m
3 in some studies [
25]. Slag is used in quantities of 200–700 kg/m
3, while silica fume, essential for high-performance mixes, is added at 60–100 kg/m
3 [
5].
Sand aggregates improve matrix toughness, typically dosed at 400–500 kg/m
3 [
28,
29,
30]. Smaller aggregate sizes reduce matrix toughness, influencing strain-hardening behavior [
1].
ECC water/binder ratios range from 0.25–0.4, necessitating high superplasticizer use, unlike ordinary concrete’s 0.5 ratio [
28,
29,
30].
This research follows the usual dosages of materials needed to develop an ECC but replaces the sand aggregates with unprocessed fly ash from a local thermal plant. The result is a high-volume fly ash fiber-reinforced composite (FRC) with structural, environmental, and economic advantages over ordinary concrete, but with strain hardening below the 3% characteristic low limit of an ECC.
By replacing natural fine aggregates, such as sand, with unprocessed fly ash, the resulting concrete mix offers a combination of structural, economic, and environmental advantages. Fly ash transforms traditional concrete into a lightweight material, reducing the dead load on structural elements, while maintaining the load-bearing capacity and service life, critical factors in seismic regions [
31,
32,
33,
34,
35]. It also lowers the heat of hydration and shrinkage stress, minimizing cracking in large structural elements, and decreasing long-term repair costs [
31]. Fly ash enhances workability by absorbing water during mixing, and gradually releasing it during hydration, which reduces the need for vibration during casting, and cuts labor and execution costs [
31]. Additionally, the mix supports the self-healing of microcracks, a defining feature of ECCs, and improves resistance to chloride ingress and freeze–thaw cycles, enhancing durability in aggressive environments [
15,
32,
36,
37,
38,
39,
40].
Fly ash also influences the rheological behavior of concrete. Substituting fine aggregates with fly ash significantly increases plastic viscosity, with an optimal dosage of around 40% for achieving a balance between workability and strength. At higher substitution levels, the accumulation of unreacted particles can reduce porosity, negatively affecting performance [
41]. However, complete replacement is feasible in non-structural applications. For instance, in road construction, a mix of fly ash with 5% lime has been used to completely substitute the aggregates in granular subbase layers, reducing thickness requirements while improving fatigue life, lowering surface roughness, and cutting total annual greenhouse gas emissions, all without environmental risks [
42]. The pozzolanic reactivity of fly ash also leads to long-term strength gain, and its use as an unprocessed, locally sourced material (e.g., in Romania) further reduces costs and landfill impacts.
As a non-traditional, aggregate-free material, the proposed fiber-reinforced composite demonstrates considerable potential. This study examines key physical and mechanical characteristics, including bulk density, compressive strength, strain at peak, modulus of elasticity, flexural tensile strength, and fracture energy. Additionally, its structural behavior in bending is simulated and compared to traditional reinforced concrete, revealing an increase in the compression zone, an advantage for both sustainability and cost efficiency.
2. Materials and Methods
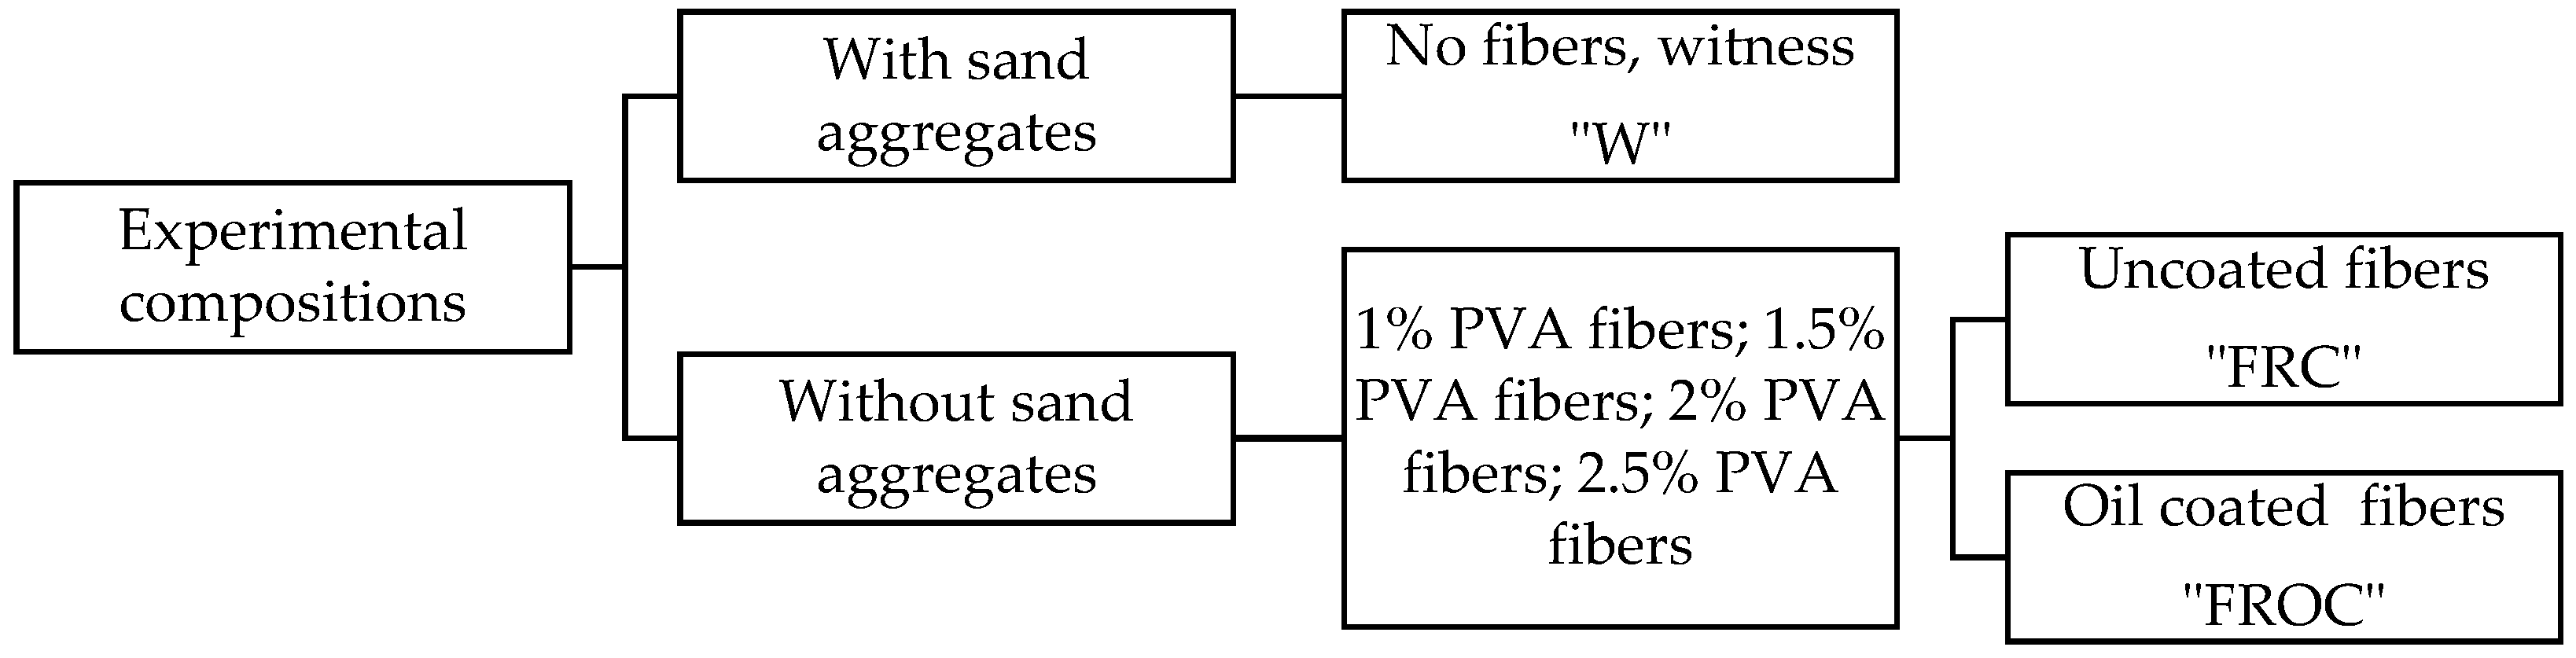
This research aimed to develop a fiber-reinforced composite (FRC) by entirely substituting natural sand aggregates with industrial fly ash and silica fume. Two factors were investigated: incorporating oil-coated PVA fibers and uncoated PVA fibers. To determine the optimal mix, different fiber volumes were tested, yielding eight distinct concrete matrices. Additionally, a reference composition (W) was included, featuring fine aggregates and the same cement dosage as the FRC mixes, but without fibers. The W composition is designed to compare the performance of the FRC compositions against a traditional cementitious matrix with fine aggregates, and to isolate the impact of aggregate replacement alone. In the end, there were nine experimental compositions. Their main characteristics are depicted in
Figure 1.
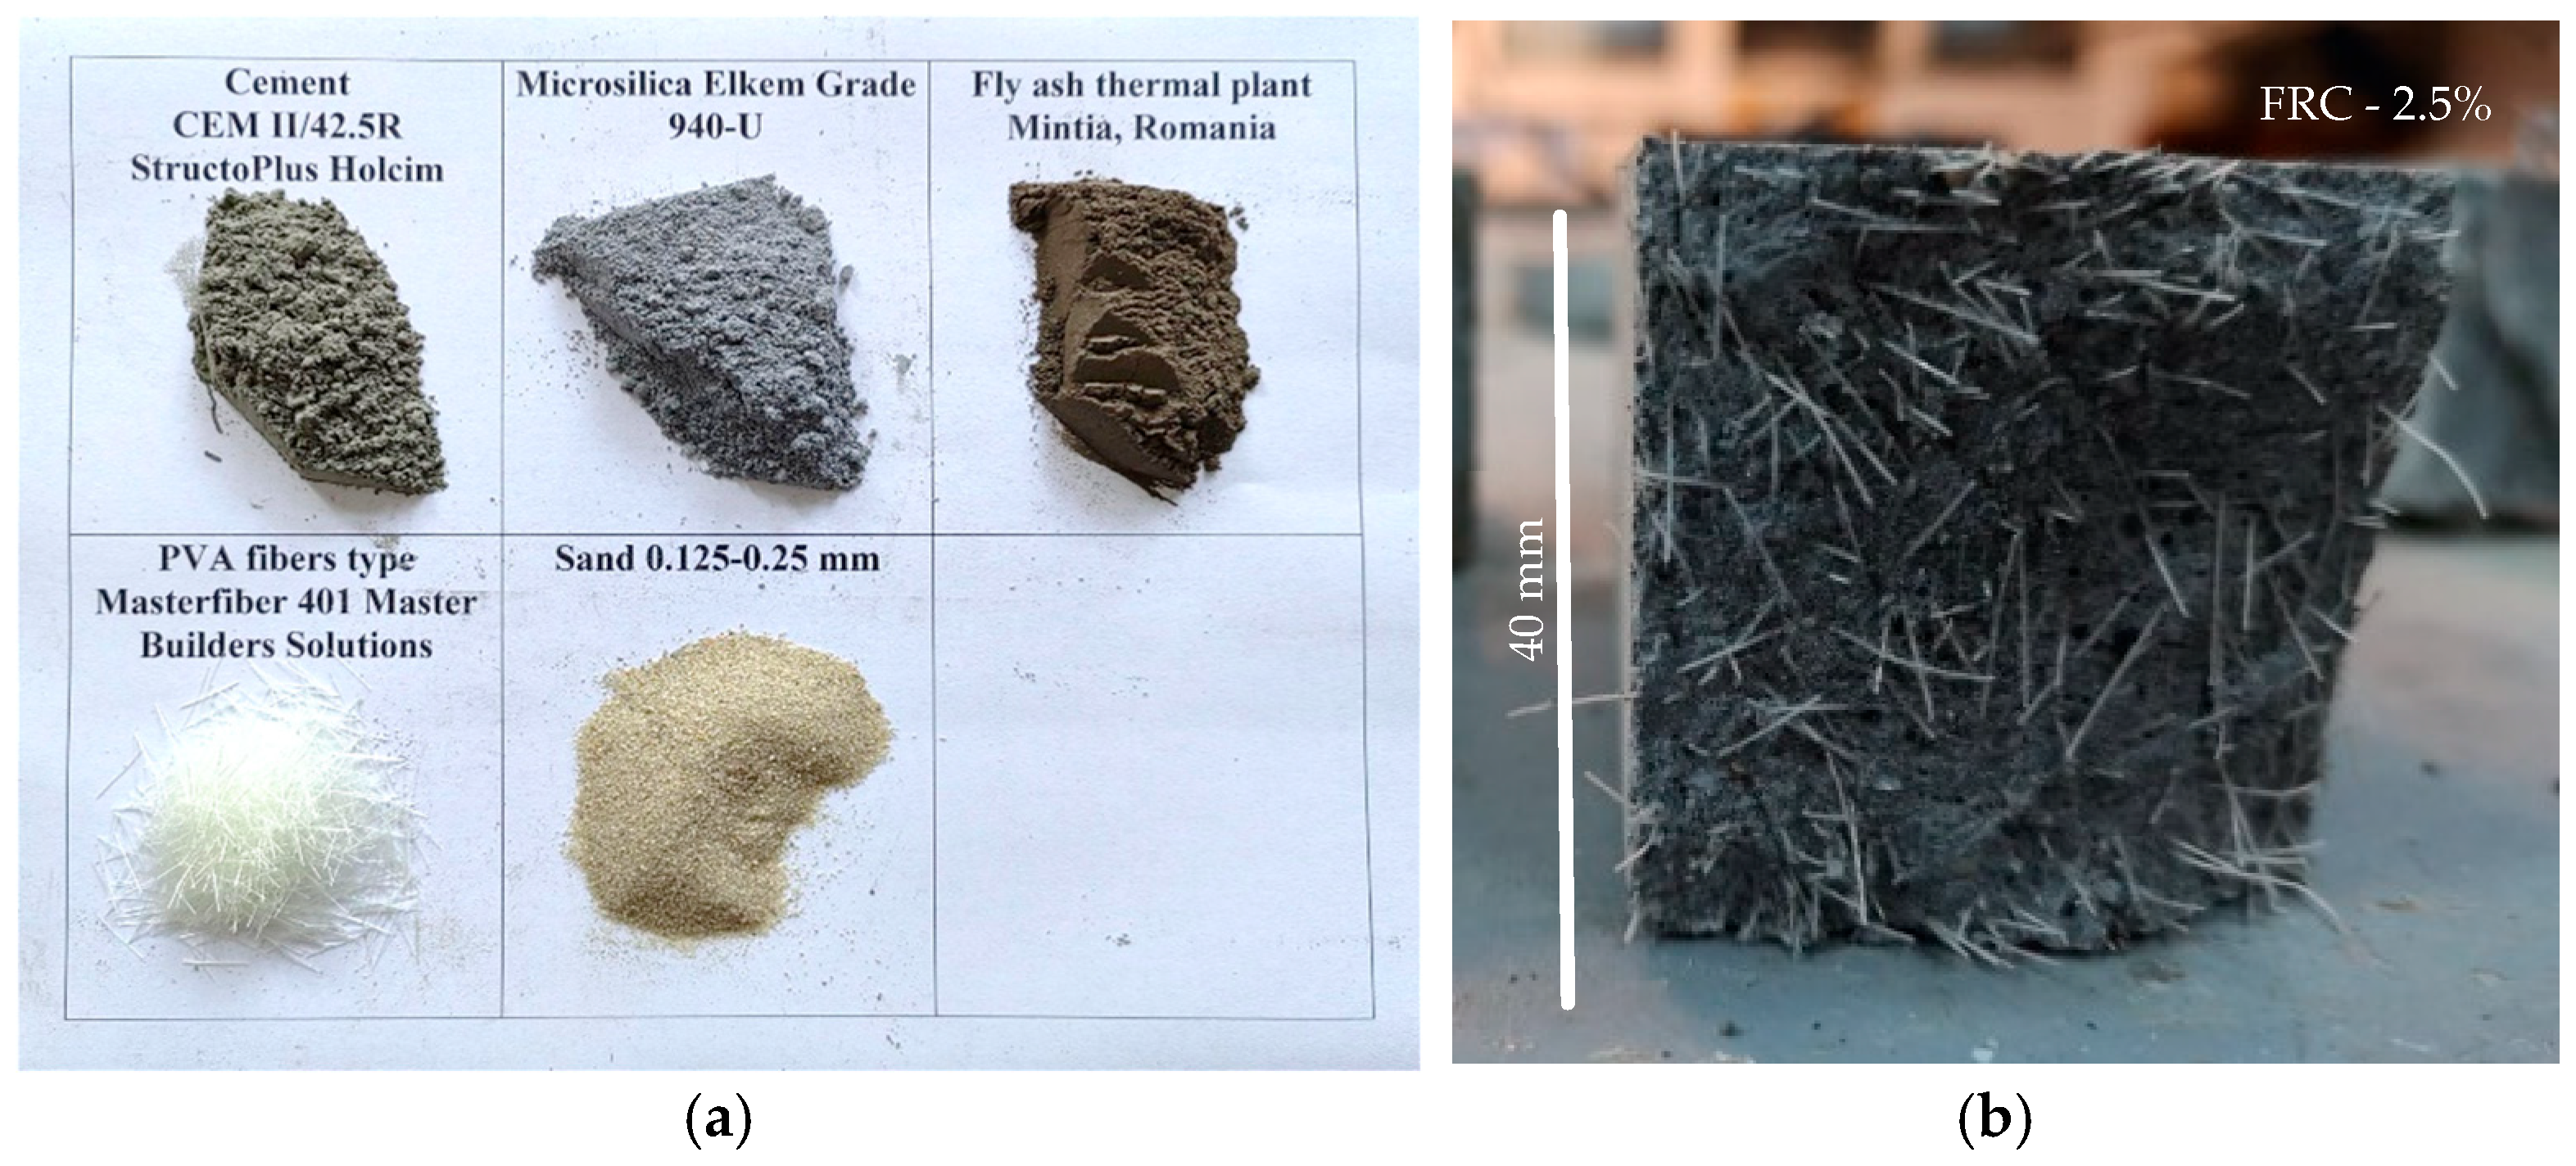
The materials used in the experimental program are as follows: CEM II/42.5R Structo Plus from Holcim Romania, Elkem Microsilica Grade 940-U silica fume, fly ash sourced from the local coal power plant in Mintia, Romania [
43], and PVA fibers of the MasterFiber 401 type, both oil-coated and uncoated. The type of oil is commercially available vegetable sunflower oil (brand name Unisol, Bunge Romania), with a viscosity of approximately 0.05 Pa·s at 25 °C [
44]. Sunflower oil was chosen as an environmentally friendly, non-toxic, low-cost alternative to synthetic mineral oils, motivated by its potential to act as a physical barrier at the fiber–matrix interface. The fibers have a diameter of 8 μm and a length of 12 mm, with a tensile strength ranging from 790 to 1160 MPa and an elastic modulus of 30 GPa. Additionally, water and MAPEI Dynamon SX superplasticizer were used. For the witness composition “W”, natural sand aggregates were incorporated.
The casting procedure is as follows. Dry materials (cement, fly ash, silica fume, fibers) are mixed using a 5-L automated mortar mixer for 5 min. Water and superplasticizer are pre-mixed and gradually added, followed by 8 min of mixing. The mix is poured into molds and covered for 24 h with a polyethylene sheet to prevent water evaporation. No vibration was used to cast the specimens. Due to the selection of materials, random orientation of the PVA fibers was expected, reducing anisotropic effects.
After demolding at 1 day, the specimens were immersed in water at a constant temperature of 20 ± 2 °C until the age of testing at 28 days. This curing method minimizes carbonation risk, and ensures uniform hydration conditions.
The components are illustrated in
Figure 2a, and the fiber distribution in the matrix is illustrated in
Figure 2b. More visual aspects can be found in
Figure S1.
No vibration was required during the casting for the FROC–FRC compositions. The precise workability values are not the primary focus of the present study. The FRC compositions and the reference composition are listed in
Table 1 based on the weight of cement.
For each composition, 4 cubes measuring 50 × 50 × 50 mm and 3 prisms measuring 40 × 40 × 160 mm were cast, resulting in a total of 63 specimens. The mechanical properties were investigated at the age of 28 days, including the bulk density (kg/m
3), the compressive strength f
cm (MPa) and the compressive limit strain ε
c1 (‰), the secant modulus of elasticity E
cm (MPa), the flexural tensile strength f
ct,fl (MPa), and the displacement at peak Δ (mm). All tests were conducted in accordance with European standards [
45,
46]. The testing machine was equipped with force and displacement sensors, connected to a computer (via CatmanAP Version 4.2 Software), to collect the experimental data.
3. Results
3.1. Bulk Density
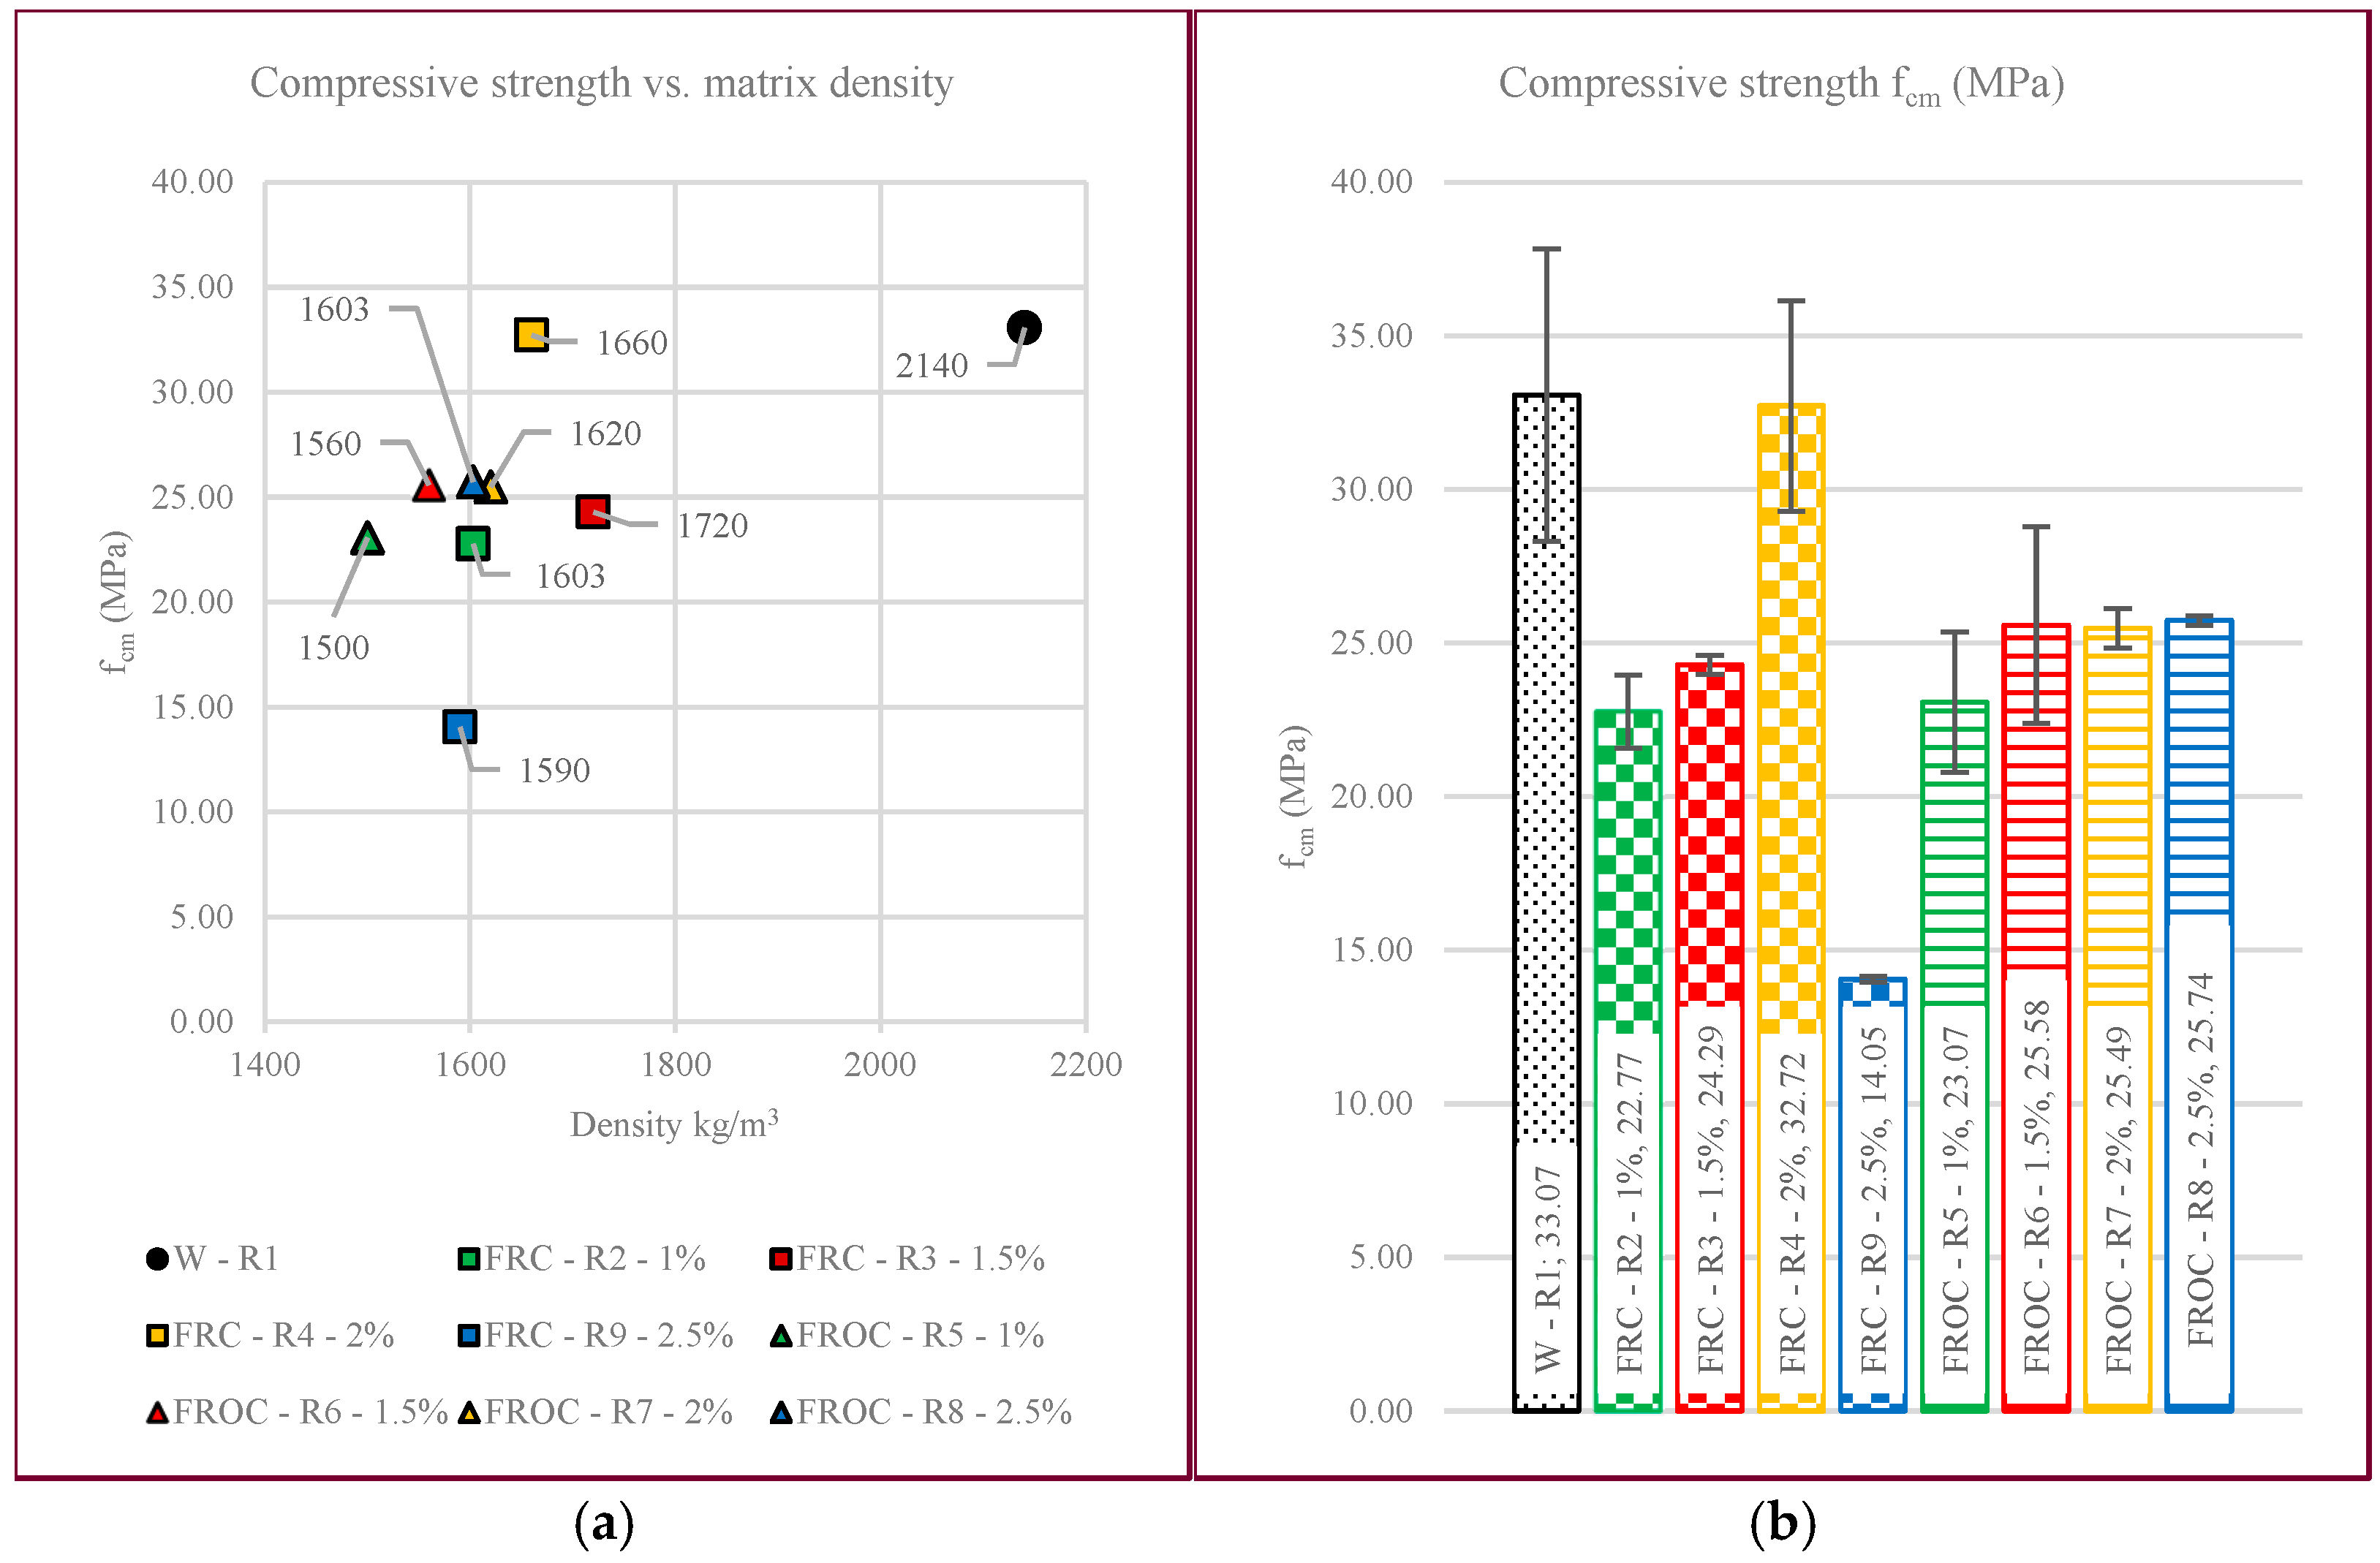
The density of each composition is depicted in
Figure 3a in correlation with the compressive strength. The FRC compositions, which do not contain natural aggregates, exhibit significantly lower weights compared to the witness composition, ranging from 1500 kg/m
3 to 1720 kg/m
3, with a standard deviation of 65.17 kg/m
3. In practical terms, the material might sometimes be denser or lighter than expected, which could affect how it behaves under different conditions. By contrast, the witness composition approaches the bulk density of ordinary concrete, with a value of 2140 kg/m
3.
As for the fiber-reinforced oil-coated polymer compositions (FROCs), their density is approximately 73% the density of the witness material (W), while the density of the fiber-reinforced uncoated polymers (FRCs) is around 77% of the witness material’s density (W). Minor variations in density are observed concerning the percentage of fibers. Specifically, at 1% PVA, the FROC density is 94% of the FRC density, at 1.5% PVA it decreases to 91%, at 2% PVA it increases to 98%, and at 2.5% PVA, it rises to 101%.
When analyzing density values across the same percentages of fibers, FRC and FROC compositions show comparable results, with the FRC/FROC ratios consistently close to 1.00. The values range from 1.02 at 2% to 0.99 at 2.5%, suggesting no substantial difference in mass per unit volume between the two material types, regardless of fiber dosage.
3.2. Compressive Strength fcm
The witness composition with natural aggregates displayed the highest compressive strength, which is also associated with the highest density matrix (
Figure 3a). There is only a negligible 1% difference in compressive strength between FRC-R4-2% and the witness composition (32.74 MPa), however FRC is 22.4% lighter at 1660 kg/m
3. As for the other specimens, FRC exhibited a decrease in compressive strength compared to the witness composition: 31% for FRC-R2-1% and 26% for FRC-R3-1.5%. FRC-R9-2.5% displayed the lowest compressive strength of 14.05 MPa (57%) compared to the witness composition, with the lowest density (1590 kg/m
3). For FROCs, the compressive strength decreased compared to the witness composition, from 22% to 30% (around 23–26 MPa) across densities ranging from 1500–1620 kg/m
3. Standard deviations, as shown in
Figure 3b, range from 0.15 (FROC-R8-2.5%) to 4.76 MPa (W-R1); whereas, in practice, a ±5 MPa variation is commonly accepted within the same concrete strength class (e.g., C25/30 or C30/37), due to natural variability in materials, batching, curing, and testing procedures [
47,
48]. The coefficient of variation (CoV) varies from 0.59% to 14.39%, indicating good consistency. The stress-strain curves in compression are presented in
Figure S2a–f.
At 1% and 1.5% fiber contents, the compressive strength of FRCs is nearly identical or slightly lower than that of FROCs (FRC/FROC ratios of 0.99 and 0.95, respectively). However, at 2%, FRC exhibits a notable increase in compressive strength (FRC/FROC ratios of 1.28), indicating improved performance. This trend reverses at 2.5%, where FRC strength drops significantly to just 55% of the FROC value, possibly due to fiber clustering.
3.3. Compressive Strain εc1
The presence of aggregates in the cementitious matrix is beneficial, and the compression curve is like the standardized curve of traditional concrete, even though the finesse of the material components is greater than that of traditional concrete. For 1%, 1.5%, and 2.5% PVA fiber additions, the compressive strain for oil-coated fibers (FROCs) is smaller than for uncoated fiber composites (FRCs) by approximately 1–1.5‰. The strain at peak load ranges between 1.45‰ and 4.36‰.
Figure 4 illustrates the relationship between compressive strength (f
cm) and compressive strain at peak (ε
c1) for all tested specimens, including the considered deviations. For these specific specimens (deviations), W-R1-1 and 3, FRC-R3-1.5%-1 and 4, FRC-R4-2%-2, and FRC-9-2.5%-2 and 4, the compressive strain at peak load ranges from 5.91‰ to 9.57‰, more than twice the value of most test results. FRC and FROC-1% (shown in green) demonstrate predominant uniformity, with experimental results concentrated in a strain interval ranging from 1.5‰ to 4‰, and a corresponding compressive strength interval from 22 to 26 MPa. The highest compressive strength is exhibited by FRC-2% and the witness specimens.
The equation used for calculating ε
c1 out of f
cm according to Eurocode 2 (EC2) [
48] is as follows:
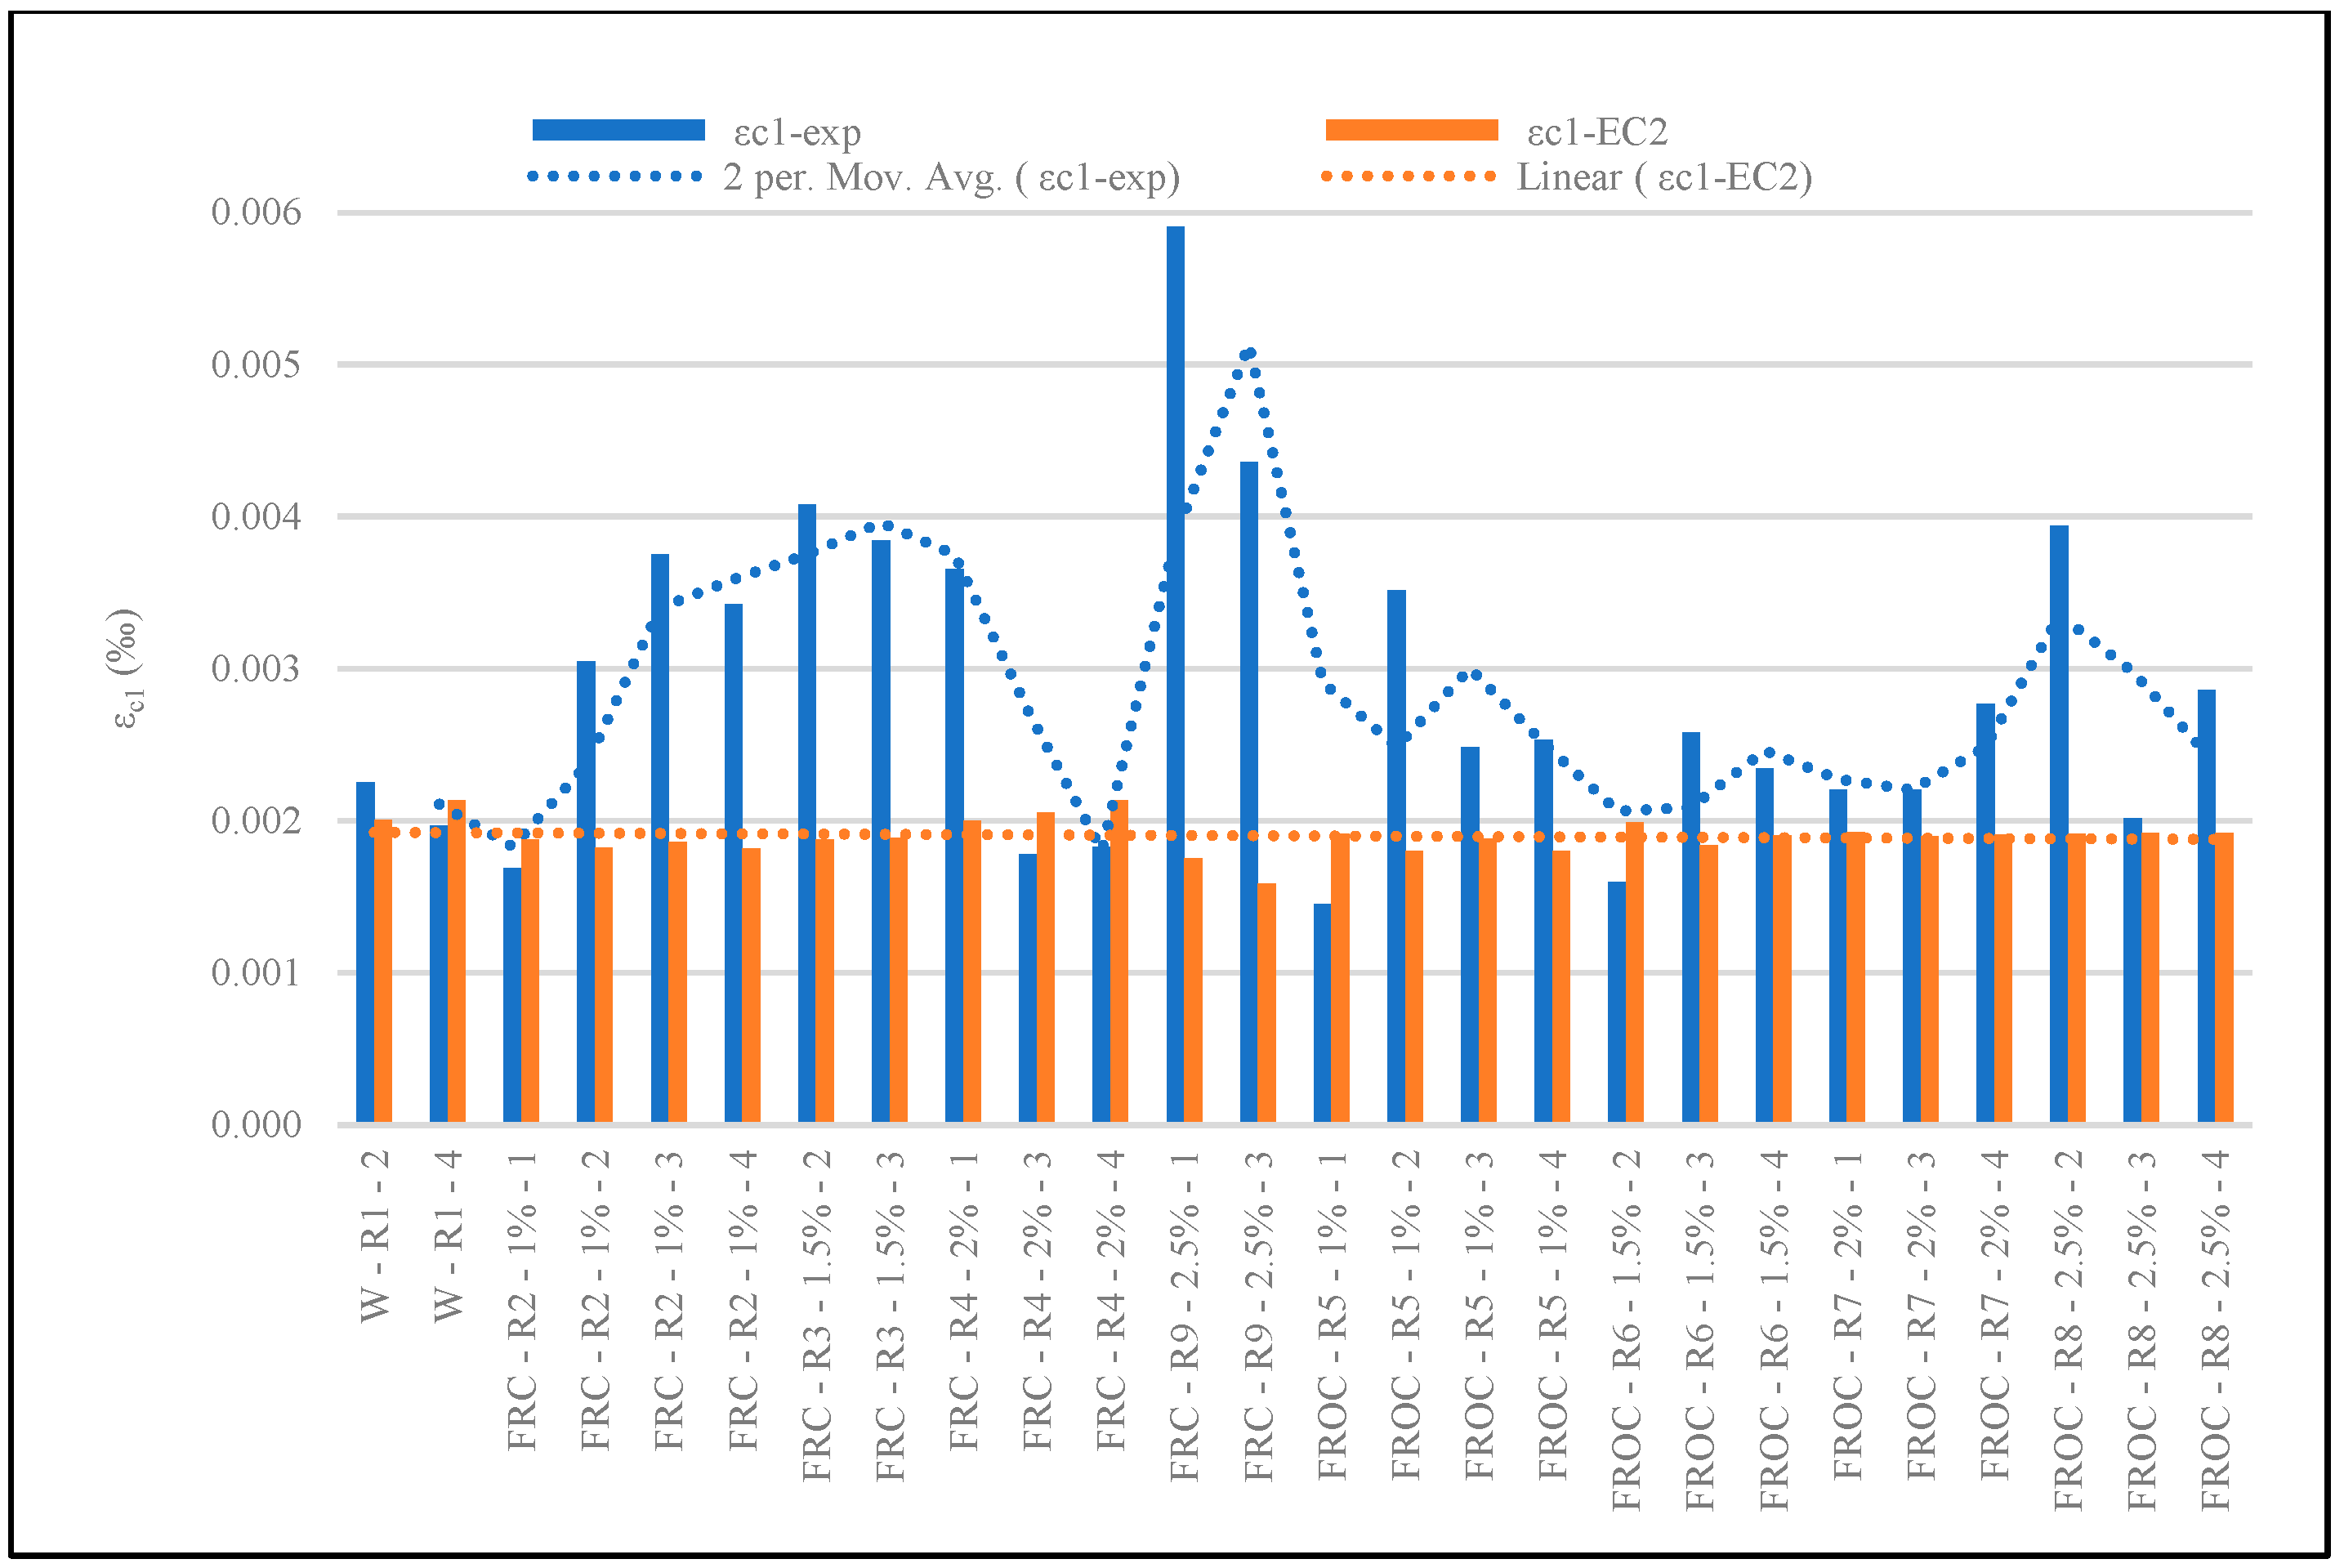
Figure 5 displays the relationship between the compressive strain at peak resulting from the experimental tests and the calculated compressive strain using Equation (1) as a function of compressive strength. FRCs with all PVA percentages have an average compressive strain of 23.46 MPa and a median of 23.53 MPa with a standard deviation of 6.62 MPa. Therefore, the design values of the compressive strain revolve around an average of 1.85‰, with a median of 1.86‰ and a standard deviation of 0.1697‰. Similarly, FROC with all PVA percentages have an average compressive strain of 24.97 MPa and a median of 25.54 MPa with a standard deviation of 1.1 MPa. Therefore, the design values of the compressive strain resolve around an average of 1.89‰, with a median of 1.91‰, and a standard deviation of 0.00264‰.
The calculated values are very dissimilar to the experimental results, even if the deviations were removed from the analysis. In fact, the difference was expected due to fiber percentage. For the witness composition, the ratio (εc1-exp)/(εc1-EC2) takes values between 0.92 and 1.12. For FRC compositions, the ratio (εc1-exp)/(εc1-EC2) depends on the fiber addition percentage, between 0.90 and 2.02 for 1%, between 2.04 and 2.17 for 1.5%, between 0.86 and 1.83 for 2%, and between 2.74 and 3.37 for 2.5%. For FROC compositions, the ratios (εc1-exp)/(εc1-EC2) are as follows: between 0.76 and 1.95 for 1%, between 0.80 and 1.40 for 1.5%, between 1.14 and 1.45 for 2%, and between 1.05 and 2.06 for 2.5%.
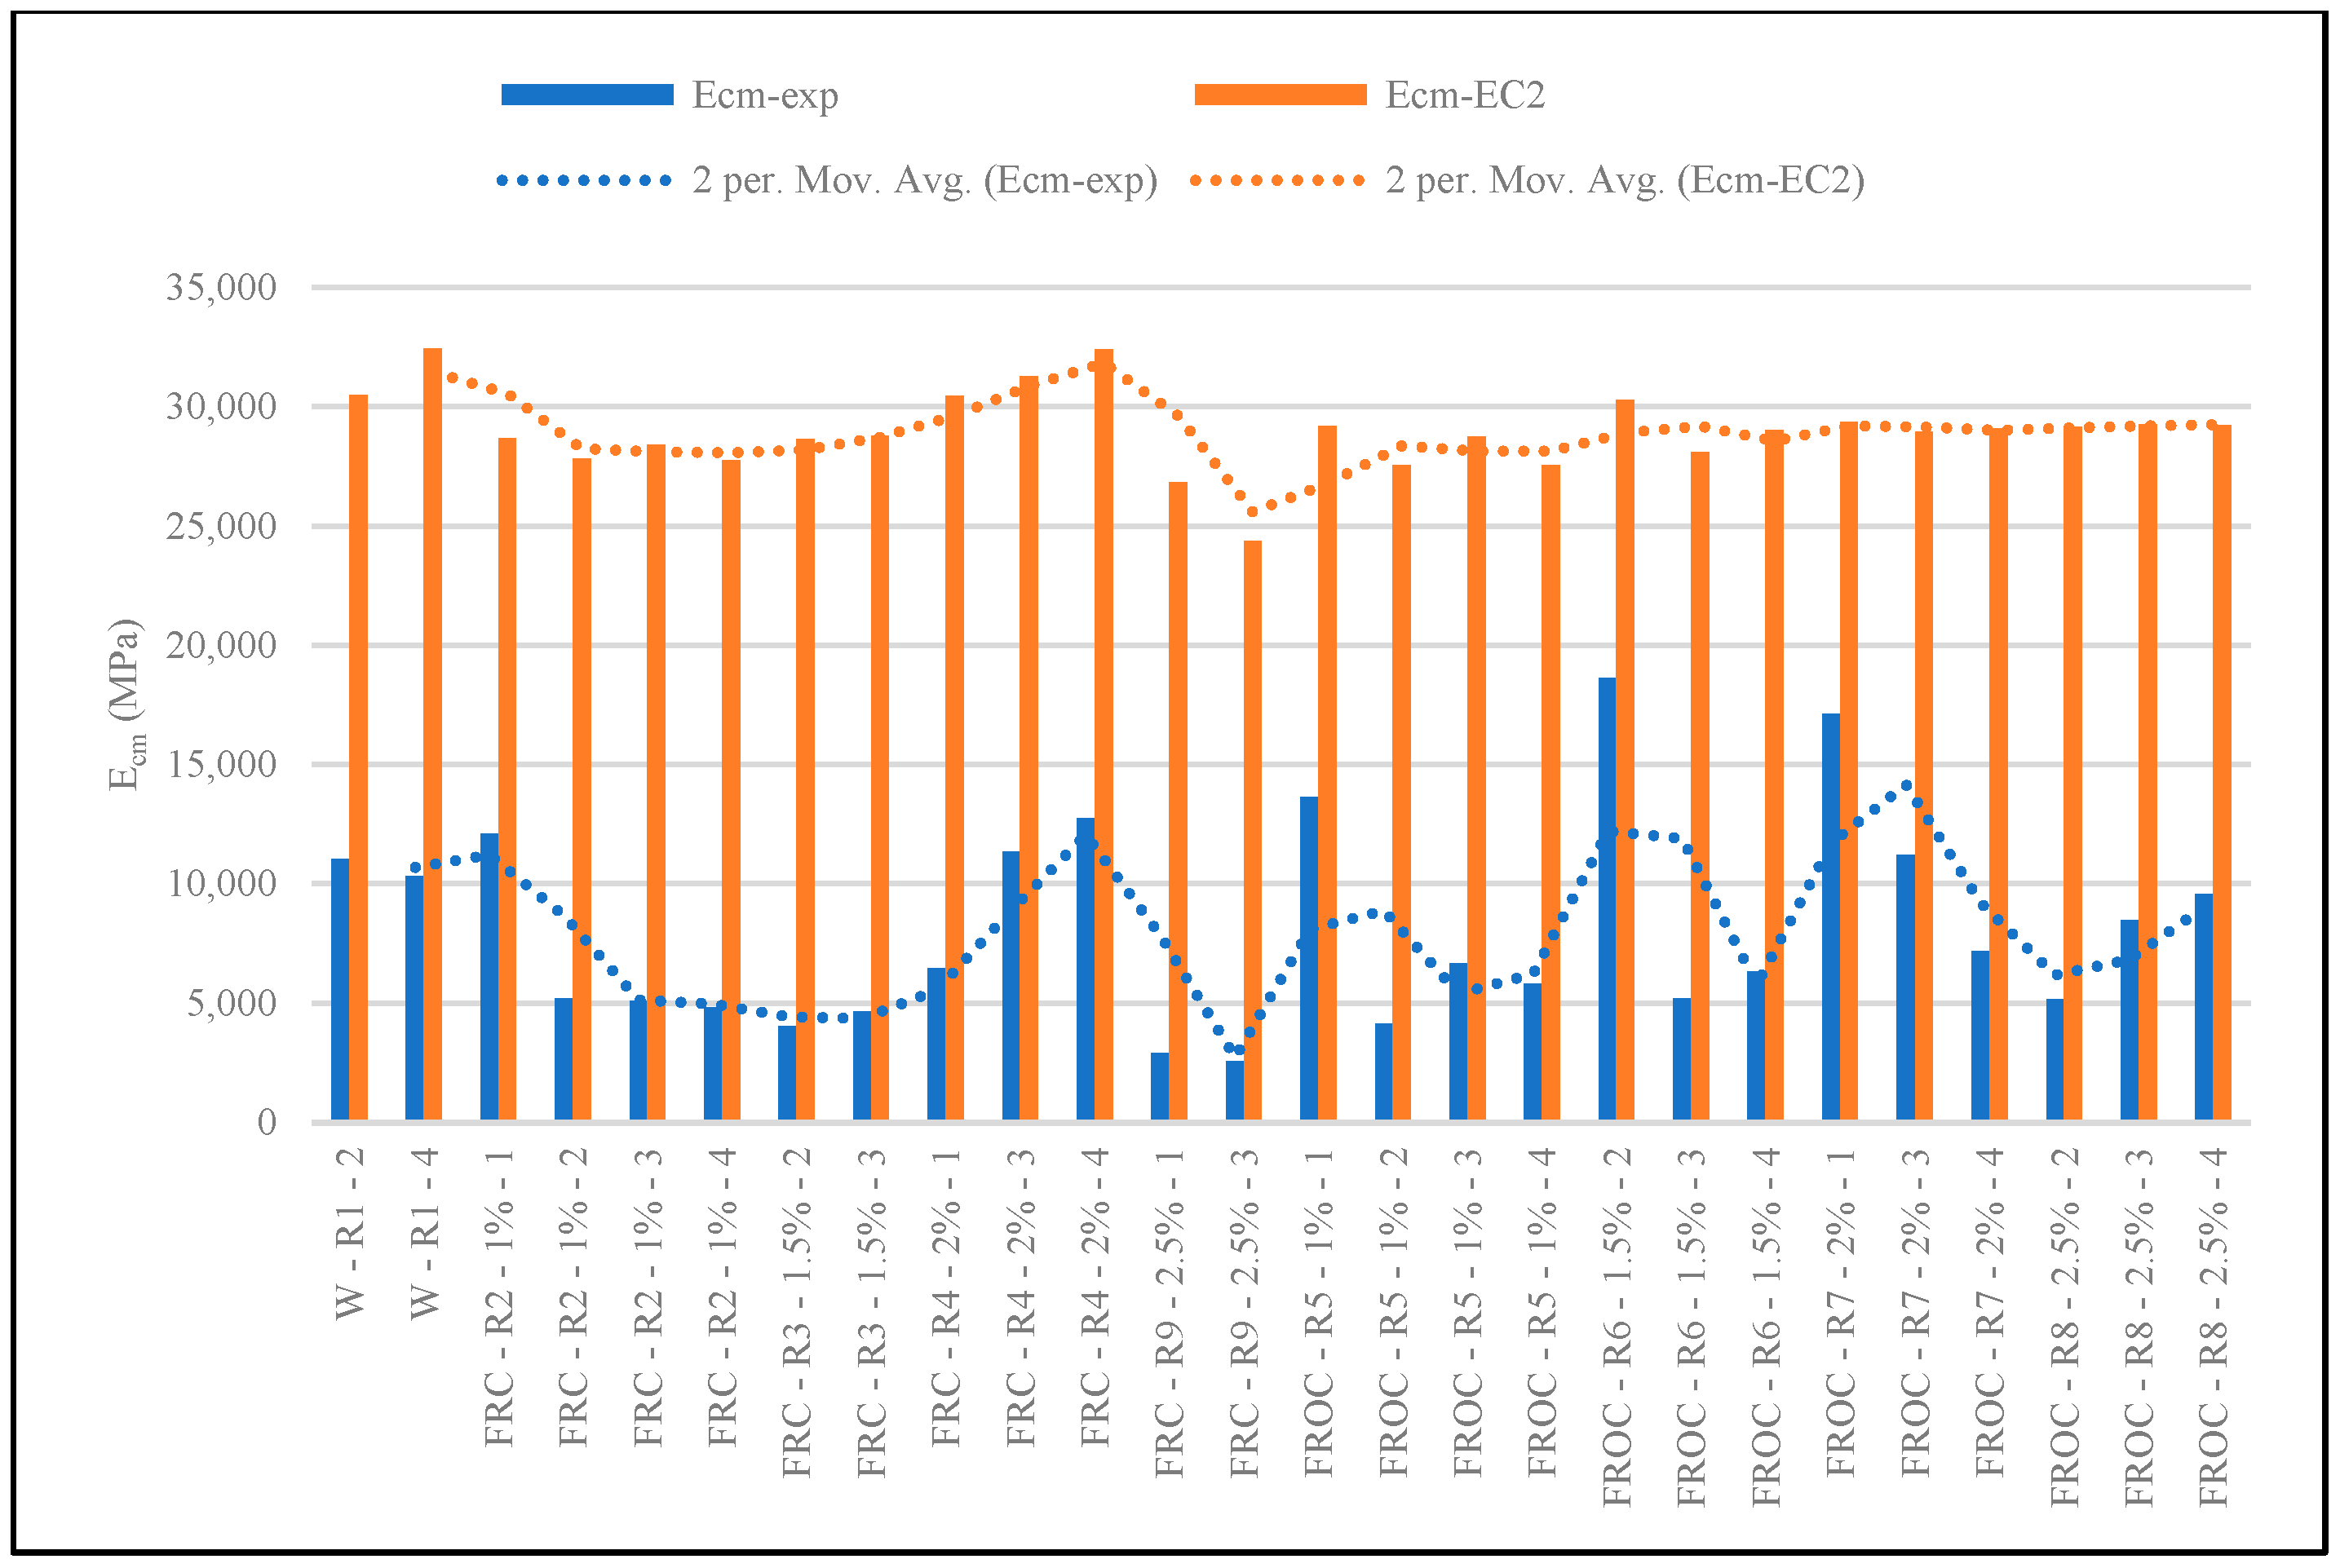
3.4. Secant Modulus of Elasticity Ecm
Figure 6 indicates that the FRC-2% specimens 3 and 4, as well as witness specimens 2 and 4, exhibit the highest values in the relationship between compressive strength and secant elastic modulus. These characteristics are more pronounced in these specimens compared to the others, primarily due to the matrix toughness. The equation used for calculating the secant modulus of elasticity E
cm out of f
cm according to Eurocode 2 (EC2) [
48] is as follows:
Figure 7 displays the relationship between the compressive strain at peak resulting from the experimental tests and the calculated secant modulus of elasticity using Equation (2) as a function of the compressive strength. For the witness composition, the ratio (E
cm-exp)/(E
cm-EC2) takes values between 0.36 and 0.32. Because of the complete lack of aggregates of the FRC and FROC compositions, the elastic modulus measured on the stress–strain curve is smaller than the design values calculated based on the compressive strength. For these, the ratio (E
cm-exp)/(E
cm-EC2) goes as low as 0.10 and as high as 0.40.
When the FRC/FROC ratio across the same fiber percentages are examined, a significant difference appears in stiffness, particularly at lower fiber contents. At 1.5%, FRC exhibits only 30% of the Ecm of FROC, which reflects a loss in internal matrix continuity. Although slightly better at 2% and 2.5% (ratios of 0.69 and 0.37), FRC consistently shows lower stiffness than FROC, pointing to differences in matrix compaction or fiber–matrix interaction.
3.5. Flexural Tensile Strength fct,fl
The witness composition with natural aggregates displayed the largest flexural tensile strength, which is also associated with the highest density matrix (
Figure 8). Nonetheless, there is a notable reduction of up to 1.5 MPa, roughly 5.6%, between the highest flexural strength observed in the FROC-R8-2.5% composition and the other FRC compositions. Furthermore, this same composition’s strength is lower than the witness by 3.4 MPa, representing a significant difference of 38%.
Tensile behavior between the composites with uncoated fibers and oil-coated fibers appears more balanced at the same fiber percentages. At 1% fiber content, FRC shows a 22.5% increase over FROC, while at 1.5% and 2%, the values remain similar (FRC/FROC ratios are 1.04 and 1.15, respectively). A slight dip occurs at 2.5% (0.94), but overall, the tensile strengths suggest that FRCs can match or exceed FROCs in this property depending on the fiber dosage. The flexural strength standard deviations range from 0.07 (good consistency to almost all compositions) to 1.8 MPa for the Witness composition. Also, the coefficients of variation (CoV) show reliable results for FROC-R6 (2.72%) and FROC-R7 (5.52%), and greater variability for FRC-R4 (39.98%) and W-R1 (31.57%). The flexural tensile strength versus the displacement curves of the tested compositions and the average fracture energies are presented in
Figure S3a–e.
3.6. Flexural Displacement Δ and Fracture Energy GF
Equation (3) is used for calculating the fracture energy in the experimental unnotched flexural tests is based on RILEM [
49]. The Japanese standard JCI-S-001-2003 [
50] indicates a similar equation with an additional reduction factor of 0.75.
The displacement can be measured either as CMOD (crack mouth opening displacement) or as a vertical deformation, but it is recommended that G
F be determined on unnotched beams with non-rotatable boundaries [
47], which the experimental tests performed.
where
Wo is the area under the load-displacement curve,
m is the combined weight of the specimen between the supports (kg),
g is the acceleration of gravity = 9.8 N/kg,
δ0 is the displacement corresponding to almost zero load in the softening portion of the load-displacement curve, and
Alig is the area of crack ligament (are of the cross section without the notch)
The witness specimens present an average fracture energy of 0.515 (N/mm). For fiber-reinforced composites (FRCs), that value is 8.1% higher than for the composition with 1% PVA fibers, 55.7% higher than the one with 1.5%, 57.7% higher than the one with 2%, and 17.9% lower than the one with 2.5%. For oil-coated fiber-reinforced composites (FROCs), the average fracture energy of the witness is 59.9% higher than for the composition with 1% PVA fibers, 48.5% higher than the one with 1.5%, 63.9% higher than the one with 2%, and 41.9% higher than the one with 2.5%. FRC shows greater variability in GF, depending on fiber content and dispersion with high standard deviations (0.05–0.2 N/mm). FROCs exhibit more stable and reliable GF values, especially at 1.5% and 2% fiber content, with low standard deviations (as low as 0.034 N/mm).
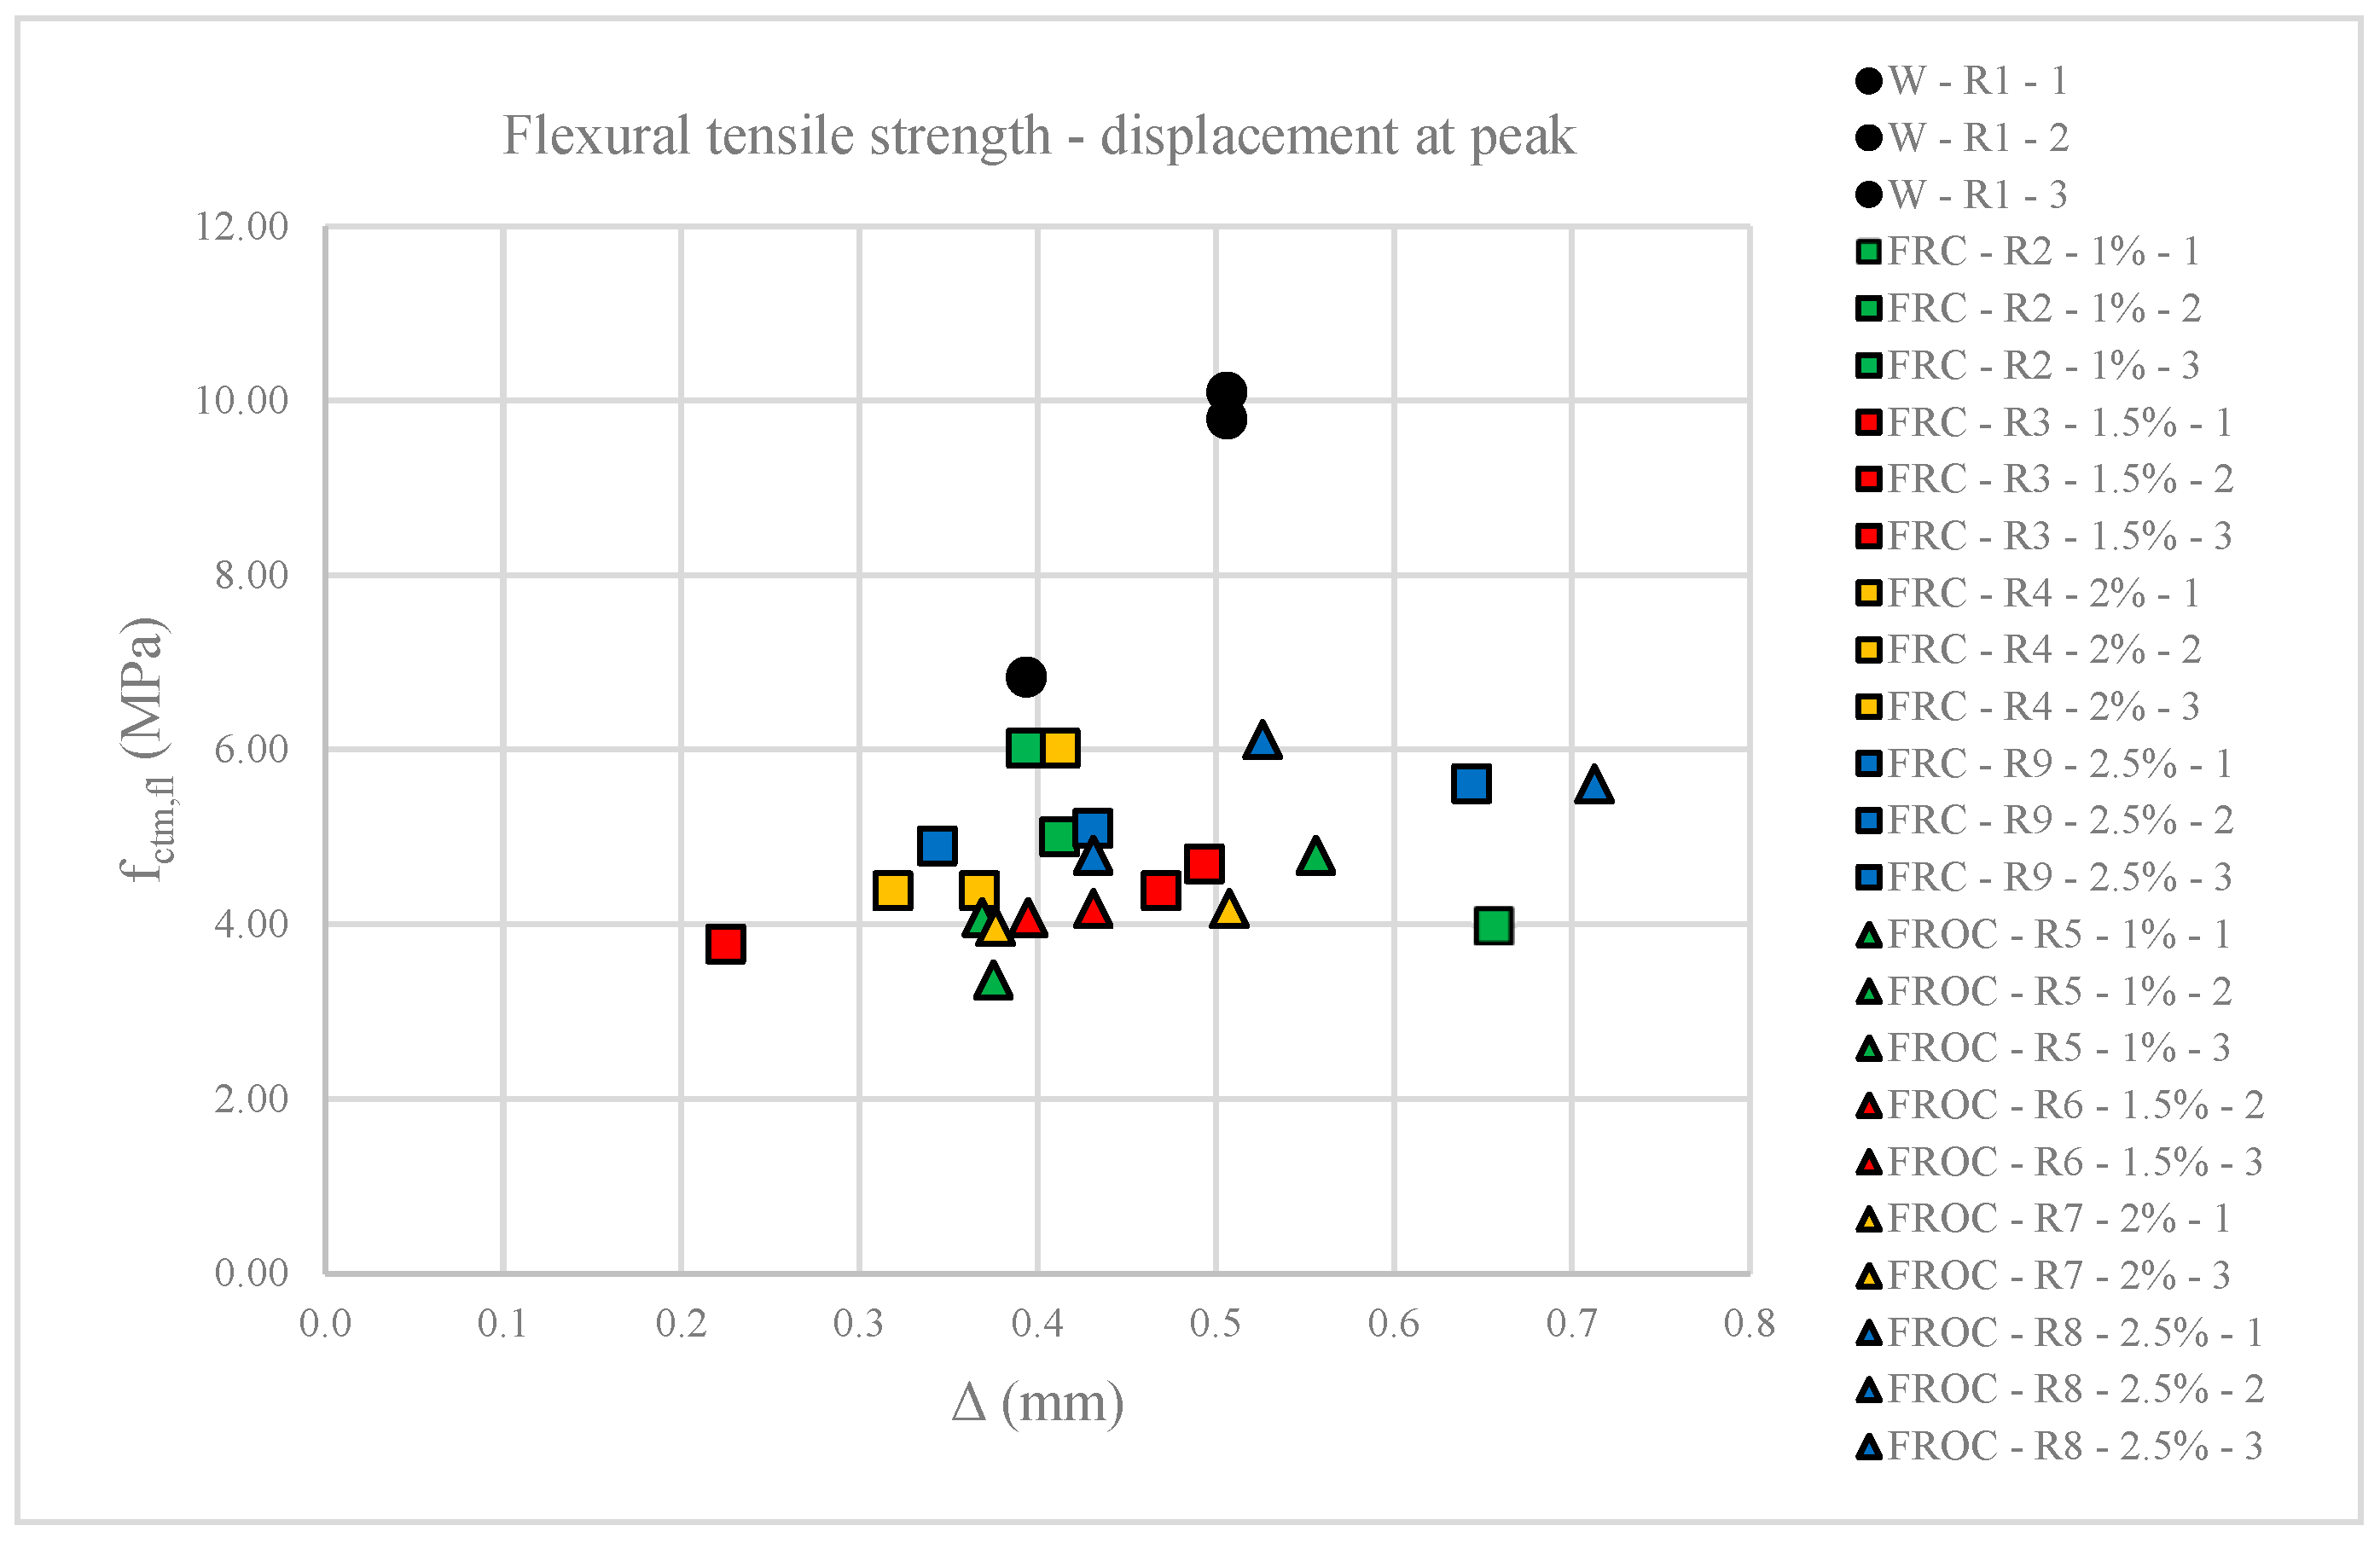
Figure 9 depicts the average flexural tensile strength (f
ct,fl) versus the peak displacement (Δ) for all the experimental compositions. The figure describes the pre-peak behavior which corresponds to the initiation of the first crack. In
Figure 10, only the displacements at the peak are presented, along with their exact values. According to Eurocode 2 [
48], the flexural tensile strength specific to the specimen size f
ctm,fl equals the direct tensile strength f
ctm or 1.56 × f
ctm, whichever is greater. Hence, based on the experimental tests, a direct tensile strength can be estimated between a minimum of 2.16 MPa for FROC-1% specimen 3 and a maximum of 3.92 MPa for FROC-2.5% specimen 3. It is noteworthy that ordinary concrete falls within the limits of C12 and C45, with corresponding direct tensile strengths of f
ctm 1.6 MPa and 3.8 MPa, respectively. The test results demonstrate that the experimental compositions perform similarly in tension to ordinary concrete, despite the complete lack of aggregates. The W composition exhibits a direct tensile strength of 6.47 MPa.
However, despite the relatively low tensile strength, the displacement at peak shows, as depicted in
Figure 10, a significant “bendable” trait, similar to the behavior observed in traditionally reinforced structural elements during bending tests. For functionality reasons during the service life, a deformation limit of 4% of the clear span is usually imposed for reinforced concrete elements. For the experimental specimens, this equals 0.58 mm, with three specimens surpassing this limit and the others being in proximity.
4. Discussion
4.1. Bulk Density Analysis
The replacement of natural aggregates with fly ash significantly reduces material density, making the FRC compositions lighter alternatives to traditional concrete. Fiber type and dosage influence density variations, though the overall impact remains relatively small.
4.2. Compressive Strength fcm Analysis
According to fib Bulletin 42 [
47], the standardized compressive strength of 150 mm cubes is 96.8% of that measured on 100 mm cubes. Further extrapolation suggests that the compressive strength of 150 mm cubes is approximately 93.7% of that obtained for 50 mm cubes, which the present study used. The estimated values for 150 mm cubes of the experimental compositions and their corresponding concrete grades are as follows:
Reference Concrete (W): 30.98 MPa—C25;
1% PVA Fibers: Uncoated (FRC): 21.34 MPa—C16; Oil-coated (FROC): 21.62 MPa—C16;
1.5% PVA Fibers: FRC: 22.76 MPa—C16; FROC: 23.97 MPa—C16;
2% PVA Fibers: FRC: 30.65 MPa—C25; FROC: 23.88 MPa—C16;
2.5% PVA Fibers: FRC: 13.17 MPa—C8; FROC: 24.11 MPa—C16.
In this study, the fiber type (coated vs. uncoated) had a minimal impact on the compressive strength. Even when excluding extreme cases (FRC-2% and FRC-2.5%), the fiber volume fraction did not significantly influence the concrete grade. However, the presence of sand aggregates improves the concrete grade, leading to a stronger matrix while maintaining the same cement dosage, without requiring fly ash or fibers.
Using 2% uncoated PVA fibers (FRC-R4-2%) emerges as a viable alternative to conventional concrete, achieving a compressive strength comparable to W, but with significantly lower weight. However, increasing the fiber content beyond 2% (e.g., 2.5%) negatively affects the compressive strength, likely due to fiber clustering, poor dispersion, or increased porosity. While oil-coated fibers exhibit a slightly more consistent performance, they do not significantly improve the compressive strength.
This study highlights the potential of lightweight fiber-reinforced composites for structural applications, particularly where reducing self-weight is a priority. For example, for a 10-story building, if we replace traditional concrete (density ~2400 kg/m3) with a lightweight FRC/FROC (average density ~1600 kg/m3), that would be a 33% reduction in self-weight. The total deadload drops by approximately 33%, leading to a reduction of 10–20% reinforcement in vertical and horizontal elements, while the foundation depth would be reduced by 30%. Additional benefits include easier handling for prefabricated components, reduced seismic forces in seismic resistant structures, and higher constructions.
4.3. Compressive Strain εc1 Analysis
The variability in the strain and slope patterns observed in the experimental results can be attributed to the heterogeneity of high-volume fly ash and the distribution of PVA fibers within the matrix [
31]. The research suggests that oil-coated fibers improve ductility by reducing the fiber–matrix bond strength, leading to a more uniform behavior [
1,
2,
3,
4]. The standardized values of compressive strain are as follows:
fib 42 [
39]: 1.90‰ (C12), 2.07‰ (C20), 2.23‰ (C30), 3.0‰ (C120);
Eurocode 2 [
40]: 1.80‰ (C12), 1.90‰ (C16), 2.00‰ (C20), 2.10‰ (C25), 2.20‰ (C30), 2.8‰ (C90).
When compared to standardized values, the measured compressive strains in this study reached up to twice the expected limits, indicating a significantly different failure mechanism than that of traditional concrete. While witness specimens recorded compressive strains between 1.97‰ and 2.25‰—consistent with C25–C30 concrete—the fiber-reinforced composites (FRCs) displayed notably higher ductility. At a lower fiber content (1%), both strain and compressive strength showed greater consistency. However, as the fiber content increased, so did variability, likely due to fiber clustering.
Among the tested materials, oil-coated fibers (FROCs) exhibited more uniform behavior than uncoated fibers, suggesting that improved dispersion and reduced local stress concentrations contribute to better performance. Additionally, the inherent heterogeneity of fly ash played a role in mechanical property variations, emphasizing the importance of controlling particle size for improved material reliability.
The discrepancies between experimental and theoretical values underscore the challenge of accurately modeling fiber-reinforced concrete. The presence of fibers alters the material behavior in ways that standard models do not fully capture. As a result, further research is necessary to refine predictive models and to establish a clearer understanding of the relationship between fiber content, strain behavior, and overall performance.
4.4. Secant Modulus of Elasticity Ecm Analysis
The modulus of elasticity, a key parameter in material behavior, is influenced by aggregate stiffness, cement paste, and the transition zone [
47]. Defined as the tangent modulus at the origin of the stress–strain diagram, it corresponds to the slope of the unloading branch. The secant modulus of elasticity, which is used in service life calculations, is determined from the slope connecting the origin to 40% of the compressive strength value, marking the elastic limit where deformations remain reversible.
Aggregate type and size can alter the modulus of elasticity by approximately ±30%. For instance, traditional concrete with sandstone aggregates has an elastic modulus of around 14.4 GPa, while quarzitic aggregates increase this to 20.5 GPa [
47]. In fiber-reinforced materials, microcracking and stress redistribution play a critical role in deformation behavior, particularly in the fracture zone. While ECC materials are designed to optimize these properties, the lower moduli of elasticity of FRCs and FROCs necessitate further structural deformation testing.
The relationship between compressive strain at peak and the secant modulus of elasticity in the tested compositions shows significant deviations from the predictions of Eurocode 2 (EC2). In the FRC and FROC mixtures, the high content of unprocessed, nonuniform fly ash, combined with the absence of traditional aggregates, results in a noticeably low modulus of elasticity. A comparison between the FRC and FROC mixtures highlights the influence of the coating on the elastic modulus. While FRCs exhibit reduced stiffness, particularly at higher fiber contents, this is likely due to inadequate dispersion, poor interfacial bonding, or fiber clustering, which impairs an effective stress transfer. By contrast, oil-coated FROCs demonstrate a significant increase in the elastic modulus across all fiber volumes. This suggests that the fiber coating improves the bond between the fibers and the matrix, enabling better load transfer, and ensuring the fibers contribute positively to the stiffness of the composite.
4.5. Flexural Tensile Strength fct,fl, Displacement δ, and Fracture Energy Gf Analysis
The tensile failure of traditional concrete is a brittle phenomenon due to the formation of microcracking, followed immediately by a singular sudden large crack at approximately 90% of the tensile strength f
ct. The flexural tensile strength on unnotched specimens depends greatly on the same parameters as the compressive strength, especially on the type and size of the aggregates, though it increases more slowly with age. Water storage before testing also leads to a reduction of the tensile strength of concrete compared to the tensile strength determined on dry and sealed specimens [
47].
Fiber addition has a minimal impact on peak tensile and compressive strength [
51], but its primary role emerges when cracking occurs—fibers limit crack opening and enhance post-cracking strength. According to [
51], fibers contribute to either flexural hardening (ECC behavior) or flexural softening (typical of ordinary concrete and most FRCs).
The previous literature has computed the post-cracking strength by considering the area under the load–displacement curve on the descending branch after the peak [
52]. Other research has focused on evaluating the strain energy density in tension using the area under the entire tensile stress–strain curves [
53]. Nevertheless, the most generally utilized measure for flexural hardening is the fracture energy.
The fracture energy (G
F, N/mm) quantifies the energy required for crack propagation per unit area. While traditionally considered constant, it varies with specimen size and initial crack length [
54]. For unreinforced concrete up to 140 MPa, fib 42 [
47] suggests values between 0.10 and 0.25 N/mm.
In the experimental study, the fibers visually improved crack resistance, despite minimal effects on peak tensile and compressive strength. All compositions exhibited flexural softening, with fiber volume, material type, and bond properties affecting the performance. After initial cracking, their ability to carry tensile load gradually decreased as the deformation increased. This contrasts with the typical behavior of engineered cementitious composites (ECCs), which are known for tension hardening, where the material continues to gain tensile strength even after cracking, due to effective fiber-bridging and energy dissipation mechanisms. The use of low elastic modulus PVA fibers, positioned randomly to the applied force, resulted in poor flexural performance, with low displacements at low flexural tensile strengths, compared to ECC behavior. Since testing was stopped before complete specimen separation, the measured fracture energy was limited by the imposed deformation threshold.
In FRCs, fracture energy is likely dominated by random fiber-bridging and fiber pull-out. In FROCs, the mechanism is more controlled, perhaps due to better fiber dispersion and matrix cohesion. This can lead to stable crack propagation, smoother stress redistribution, and higher post-cracking reliability, especially at optimal fiber dosages.
Despite a relatively low tensile strength caused by the curing conditions, the high displacement at peak indicates a “bendable” behavior like traditionally reinforced elements. A 4% deformation limit (0.58 mm for test specimens) was met or exceeded in most cases, suggesting a delayed crack initiation compared to ordinary concrete. It can also mean there could be improved durability by reducing the crack width and limiting the penetration of aggressive substances. The compositions have the potential for structural applications, with FROC-2.5% recommended for further testing in flexure.
The relationships between the characteristics of the tested materials compared to previous literature are presented in
Figure S4a–d, Tables S1 and S2. A basic statistical analysis between the studied properties (e.g., average, standard deviation, CoV and
p-values are presented in
Tables S3 and S4.
4.6. Structural Design
In this section, a comparison is made between the properties of ordinary concrete and FROC-2.5% to evaluate the feasibility of using the experimental composition in structural applications. The results highlight the promising potential of FROC-2.5% for such applications, demonstrating its suitability and performance in comparison to conventional concrete.
4.6.1. General Facts on Traditional and Fiber-Reinforced Composite Structural Design
One of the most critical characteristics of traditional concrete is its compressive strength. In structural applications, this very attribute is balanced by the elasticity of steel to achieve internal equilibrium in the cross-section. At the ultimate limit state, both materials present in the cross-section reach their capacity; for instance, the reinforcement begins its yielding plateau in tension, while the concrete undergoes plasticization in compression before failing.
The more concrete can withstand compression, resulting in higher compressive strength, the longer the reinforcement will yield, thus leading to a more pronounced ductility of the reinforced concrete element. Hence, not only the compressive strength but the ultimate strain in compression governs the ductility of the structural element at the virtual failure point in the ultimate limit state. According to EC2 [
48], for ordinary concrete up to C50/60, an ultimate strain in compression of 3.5‰ is considered in bending, while a limit strain ranging from 1.8 to 2.45‰ is often considered in compression.
FRCs exhibit a slightly different behavior in structural applications. The presence of fibers hardly improves the compressive strength, allowing the classification for ordinary concrete to be used, as per fib 105 [
51]. However, its advantage lies in the post-cracking tensile strength. While standard tests on specimens exhibit tension softening, in a hybrid reinforced beam (combining traditional reinforcement with fibers), tension softening can transform into tension hardening. If FRC toughness is high, it can impact the flexural capacity of the beams. Otherwise, the main effects on structural behavior in bending are the enhancement of ductility in compression and the increased element ductility due to the higher energy absorption of FRCs, provided that the bond between the bar and concrete does not lead to strain localization. A graphic description of the flexural hardening versus flexural softening can be found in
Figure S5.
4.6.2. OC and FROC-2.5% Simulation in Bending
A structural design simulation was performed on a reinforced ordinary concrete beam (OC) in bending in comparison with a hybrid FRC beam. For the latter, the experimental FROC-2.5 composition was chosen, although all the tested FRC compositions behaved similarly in compression and flexure.
The simulation helps assess how individual mechanical properties impact the overall structural behavior, such as bending moment capacity when the experimental FROC is integrated with reinforcement. The simulation can also verify that the experimental composition adheres to design standards, such as those in Eurocode 2, and provides safety and durability under different loading conditions. It also ensures the new composition’s compatibility with traditional reinforcement, as indicated by the similar design tensile strength (fctm) and necessary area of reinforcement (As) values for FROC-2.5% and OC.
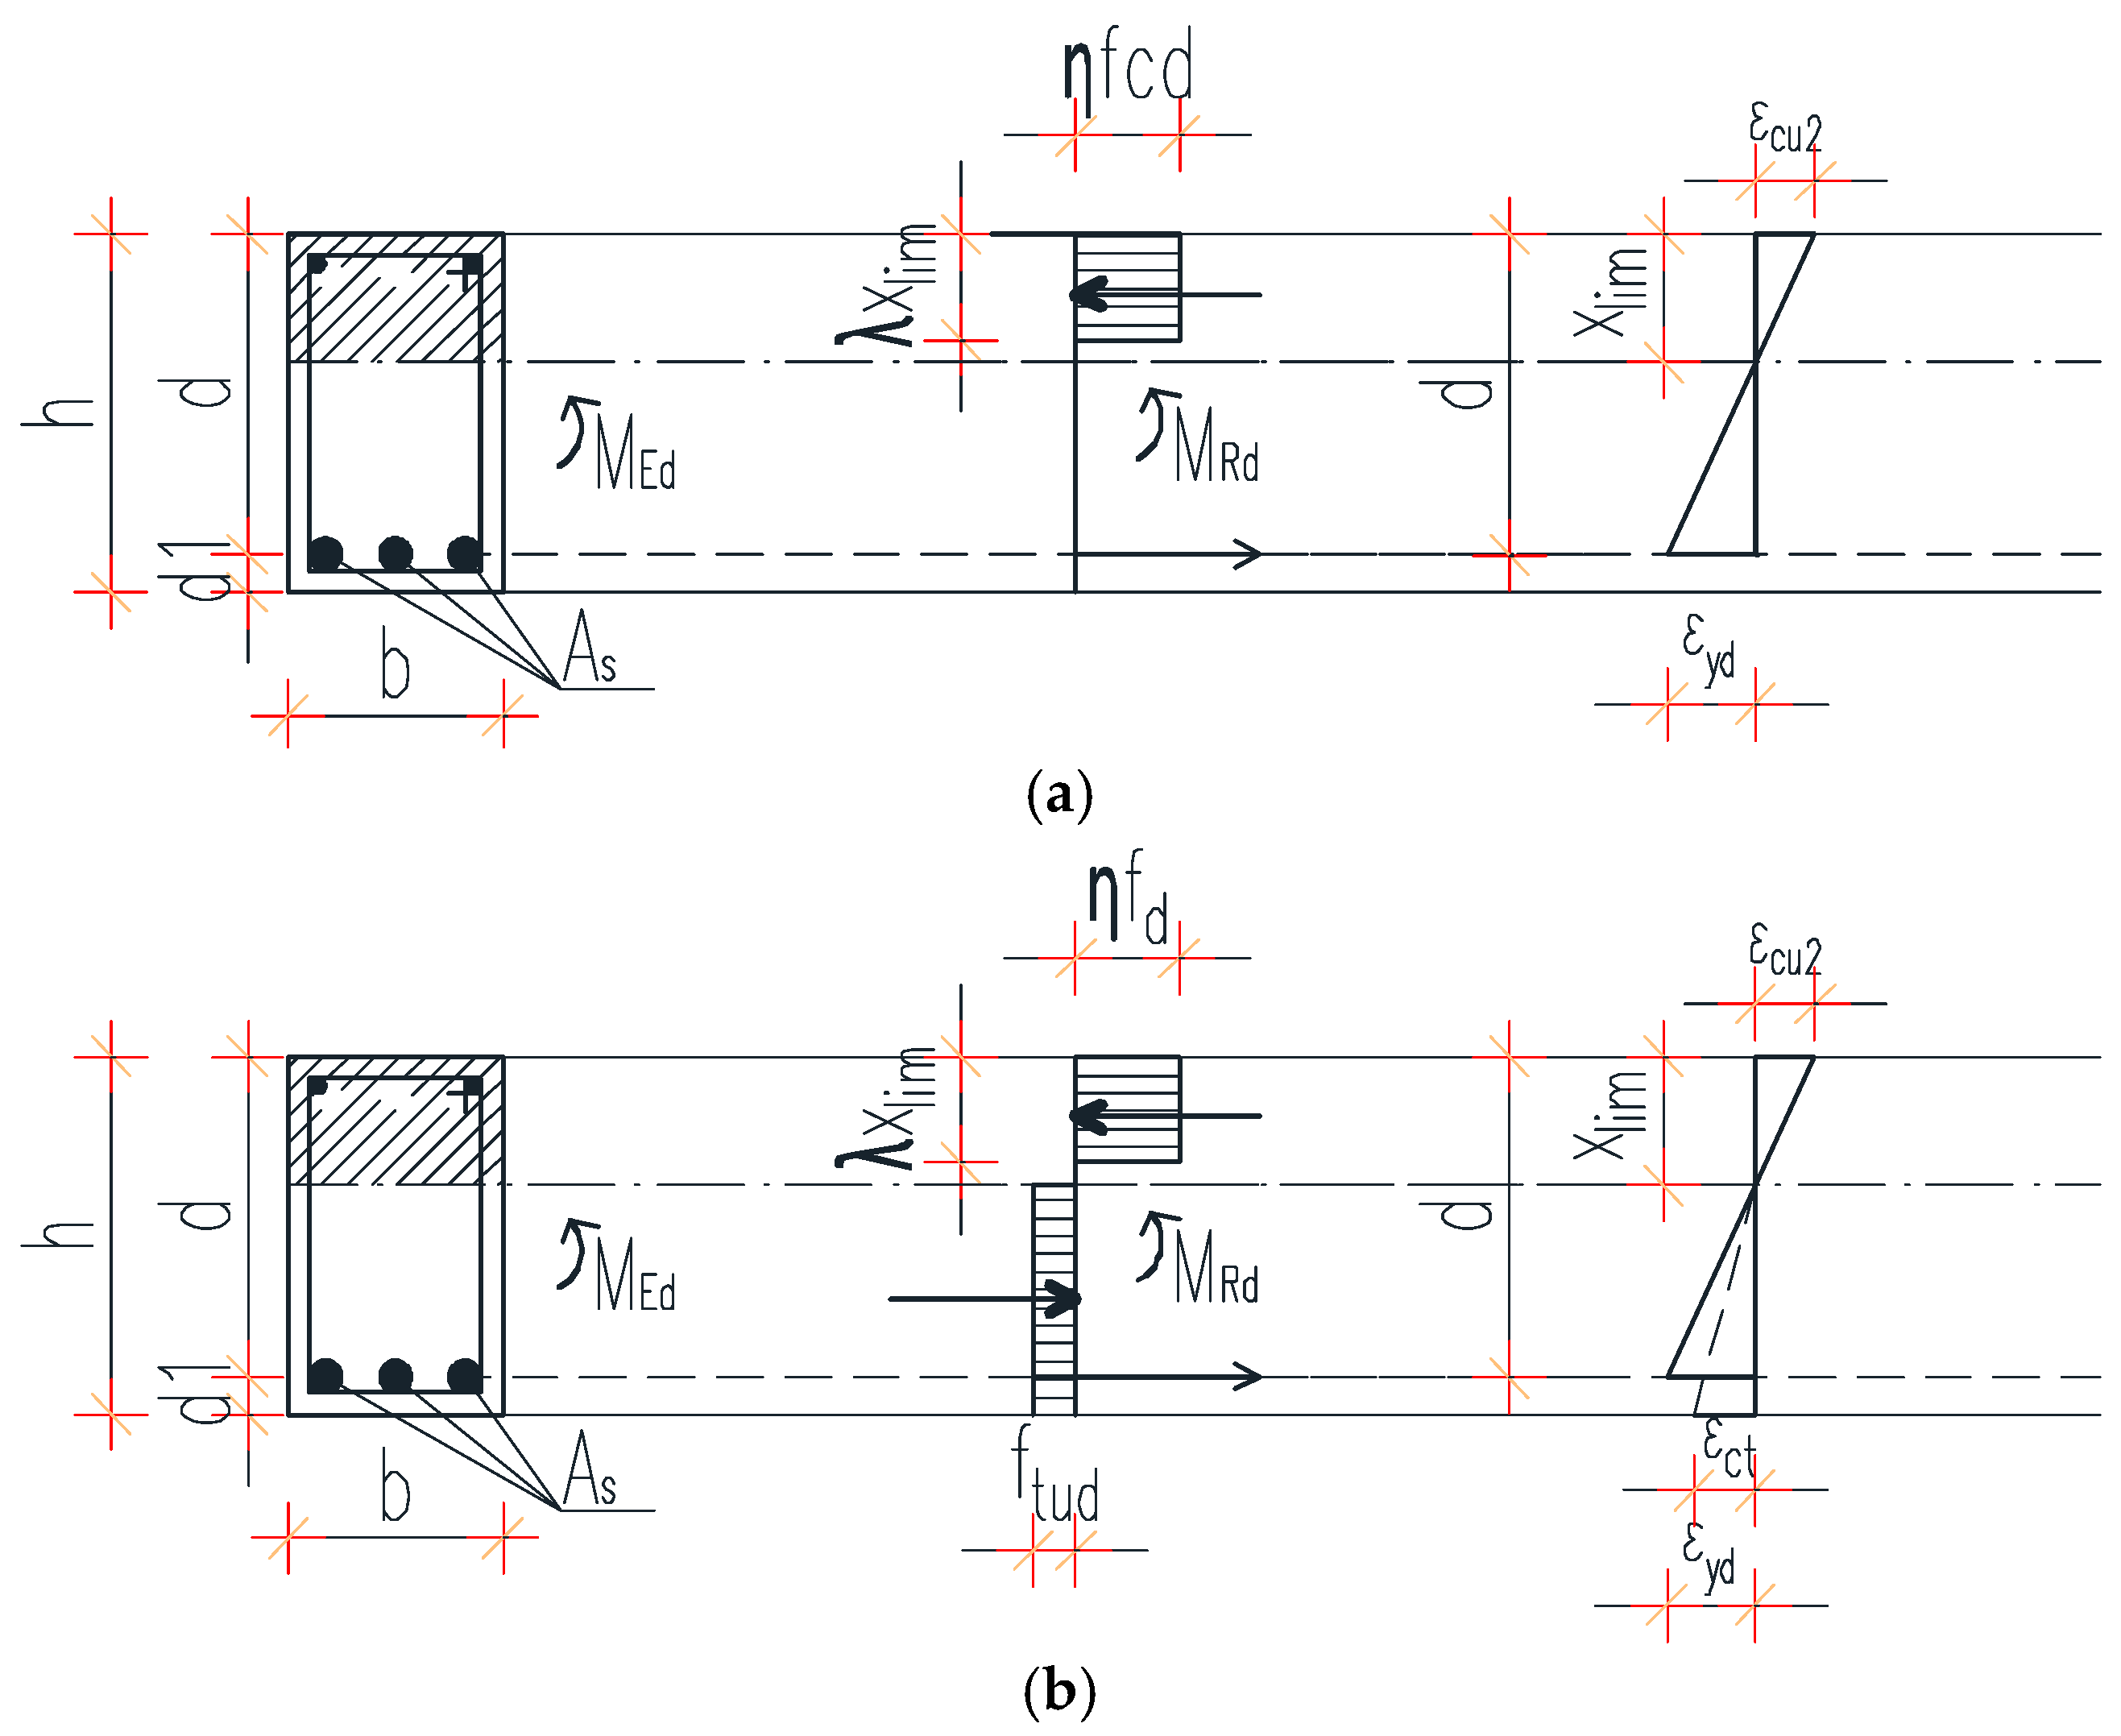
Figure 11 depicts the design diagrams in the ultimate limit state for both the ordinary concrete and the FROC hybrid beams subjected to bending.
Table 2 presents the design characteristics and the correspondent equations according to fib 42 [
47], Eurocode 2 [
48], and fib 105 [
51], which provide design guidance for high performance concrete, ordinary concrete, and fiber-reinforced composites, respectively. The values of the influencing factors are either standardized parameters (for ordinary concrete) or derived from experimental results obtained in the current study (for FROC composition).
The design simulation reveals a 7% difference in the height of the compression zone in bending, favoring the experimental composition FROC-2.5%, when compared to ordinary concrete. Additionally, there is a 2% increase in the required area of reinforcement.
Larger compression zones usually translate into a more ductile behavior, thus ampler crack control and ductility, since both elements have the same dimensions. The small increase in reinforcement (2%) suggests that the additional compression capacity does not drastically change the tensile reinforcement needs, which could mean a more efficient material utilization.
While the design results already demonstrate an advantage in using the experimental composition, it is estimated that, in real-life structural beams, the behavior of the proposed FRC will yield even more promising results, with enhanced ductility and very small crack widths. This hypothesis will be further tested experimentally.
4.7. Recommendations for Future Work
The current experimental program on FRCs with high-volume fly ash replacing sand aggregates revealed both advantages and limitations of this advanced material. Based on the findings, four main directions are recommended for future research:
The fiber–matrix interaction was not directly assessed in the present study. Individual fiber pull-out tests on FRCs and FROCs are needed to clarify the influence of the sunflower oil-coating on bond strength. Additional characterization using optical microscopy and SEM will help visualize the coating and its interaction with the matrix.
Material consistency is mandatory in structural applications. The observed variability in mechanical properties was largely due to inconsistent fly ash particle size and small-scale casting. Future work should focus on stabilizing raw materials, particularly by classifying fly ash by particle size and using larger, standardized casting batches.
Structural performance validation is essential, even though the mechanical properties meet structural criteria. Testing large scale flexural elements with hybrid reinforcement (traditional steel + PVA fibers) will provide insight into tension-hardening or softening behavior, ductility, crack control, and bending and shear resistance under service and ultimate loads.


