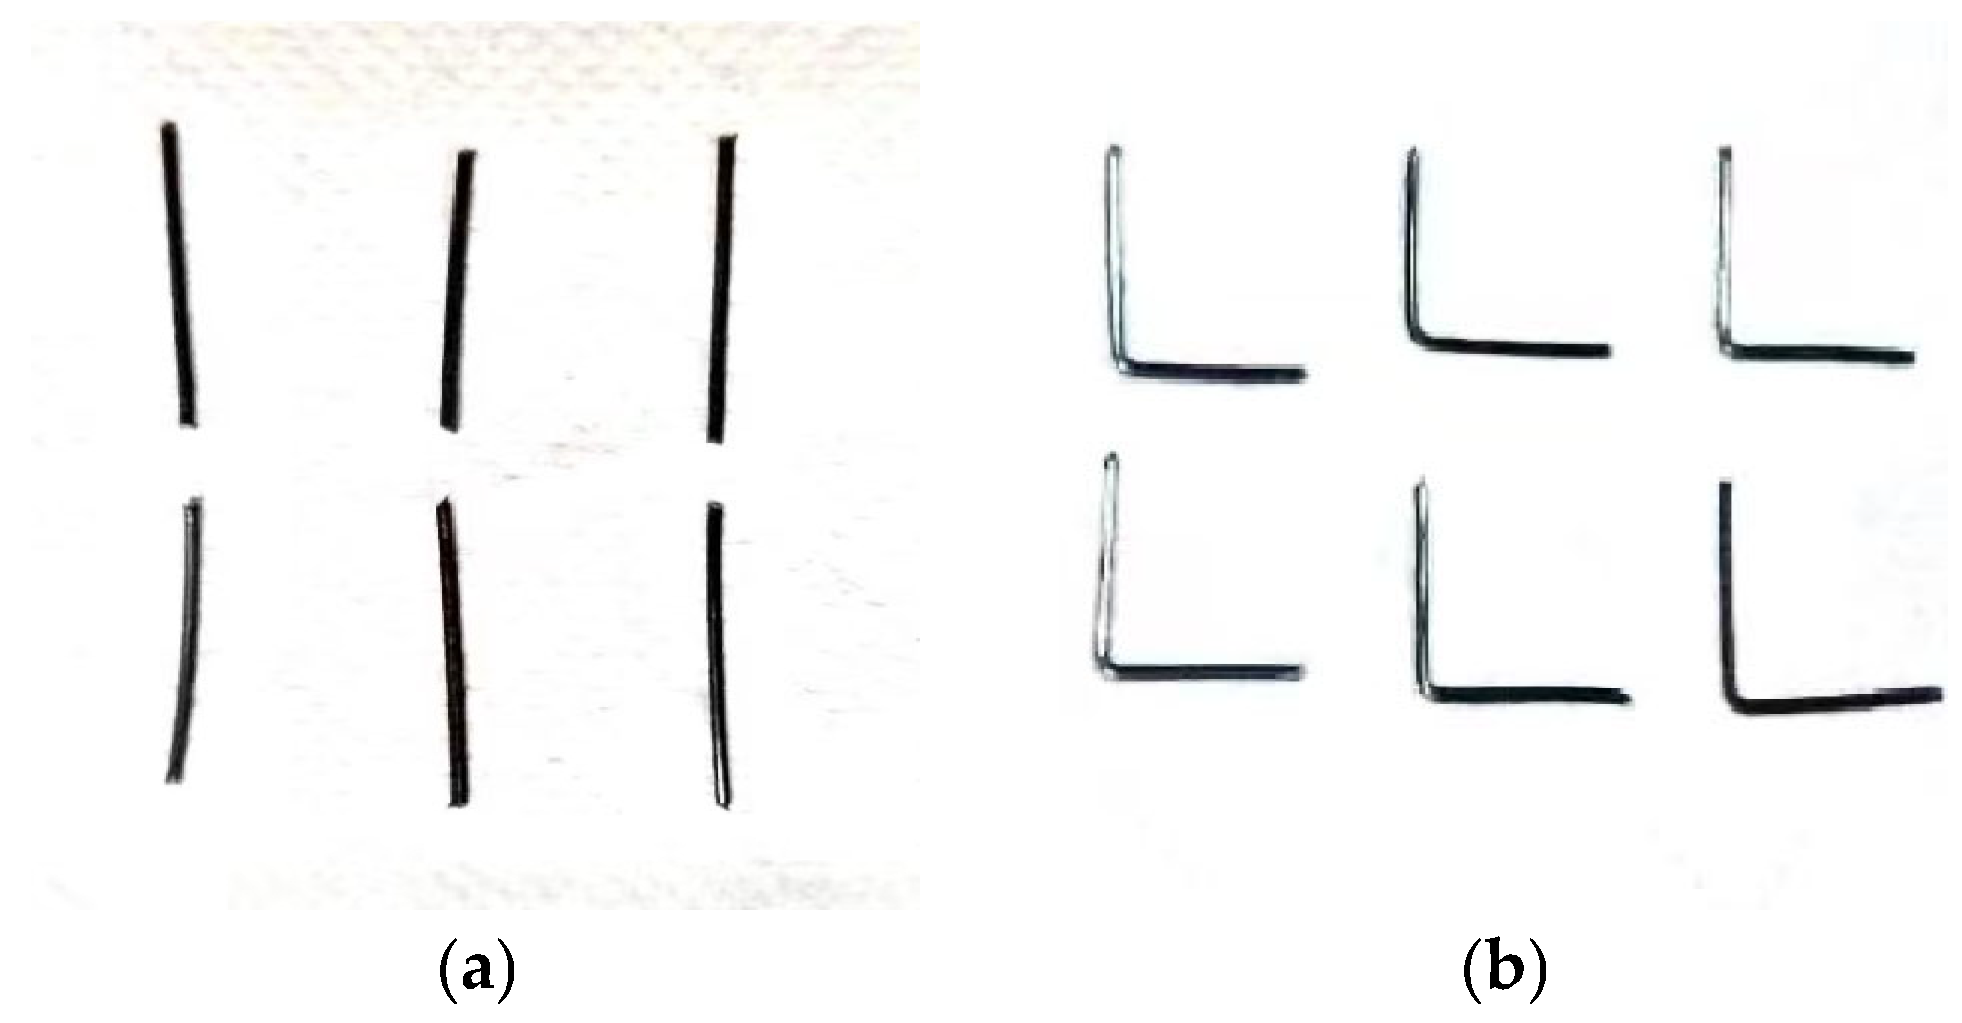
Figure 1.
(a) Straight steel fiber; (b) L-shaped steel fiber.
Figure 1.
(a) Straight steel fiber; (b) L-shaped steel fiber.
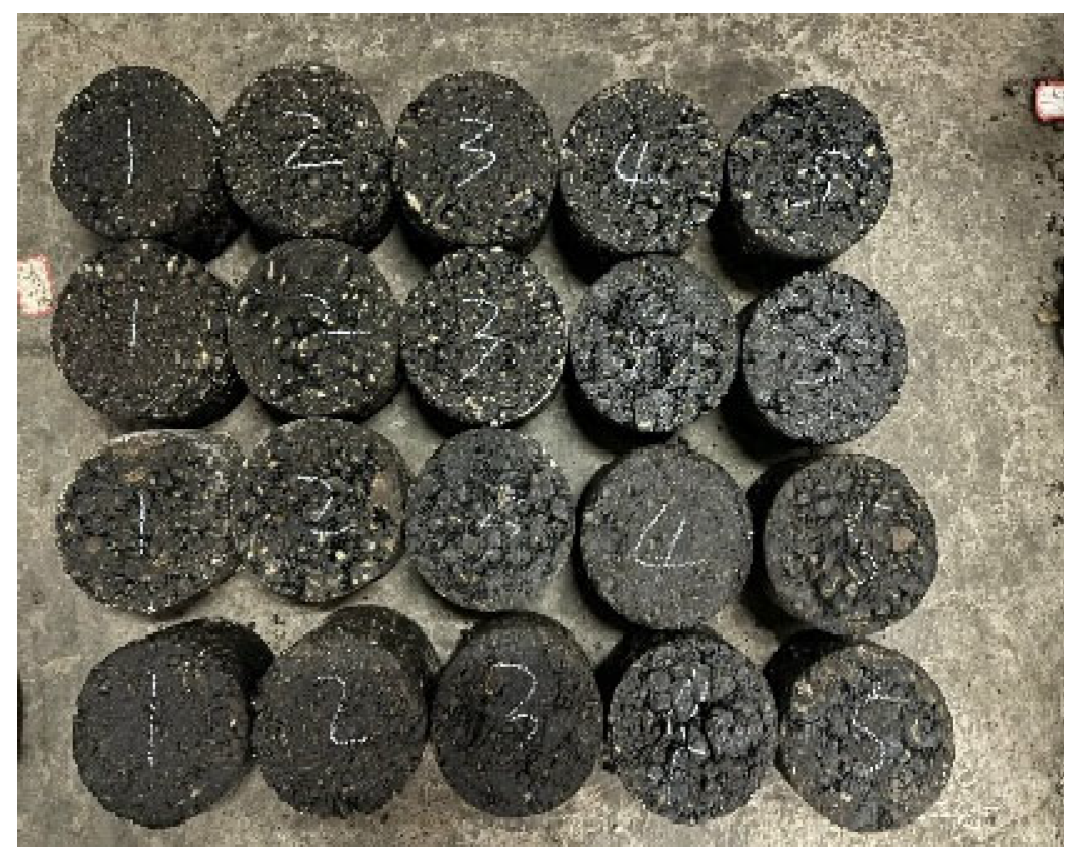
Figure 2.
Marshall specimen.
Figure 2.
Marshall specimen.
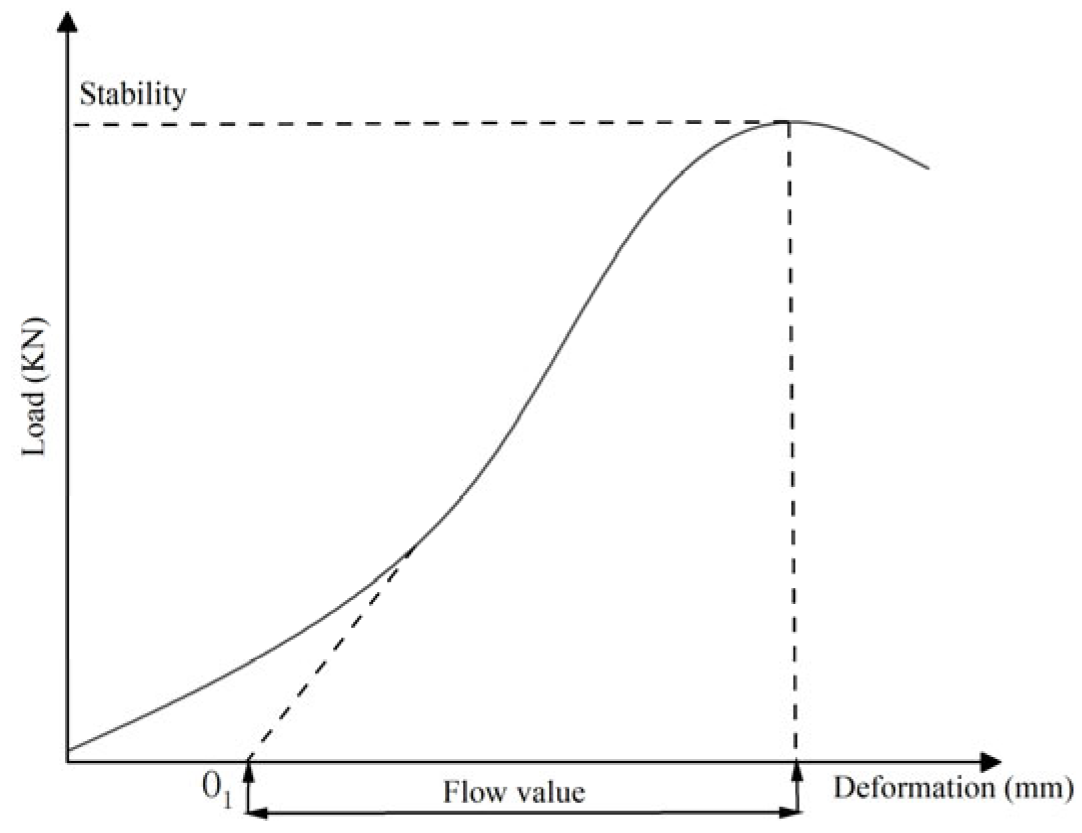
Figure 3.
Load–deformation curve.
Figure 3.
Load–deformation curve.
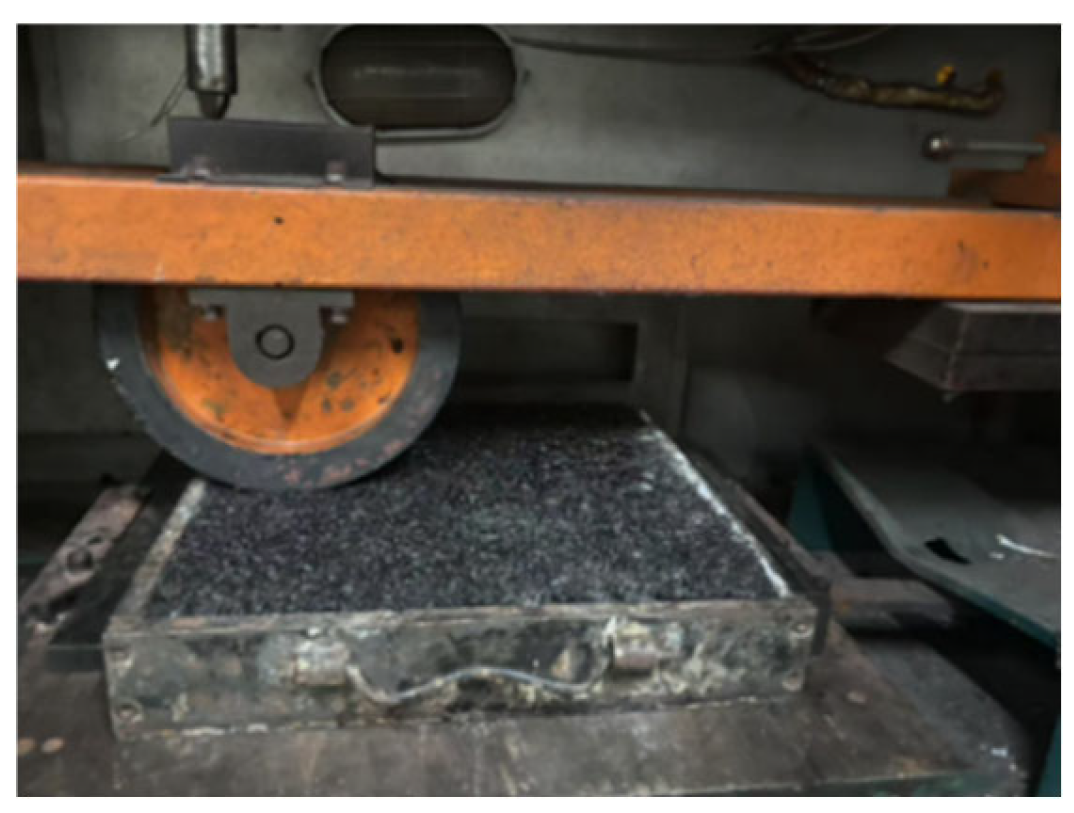
Figure 4.
Wheel rolling of rutting specimens.
Figure 4.
Wheel rolling of rutting specimens.
Figure 5.
Loading of the beam specimens.
Figure 5.
Loading of the beam specimens.
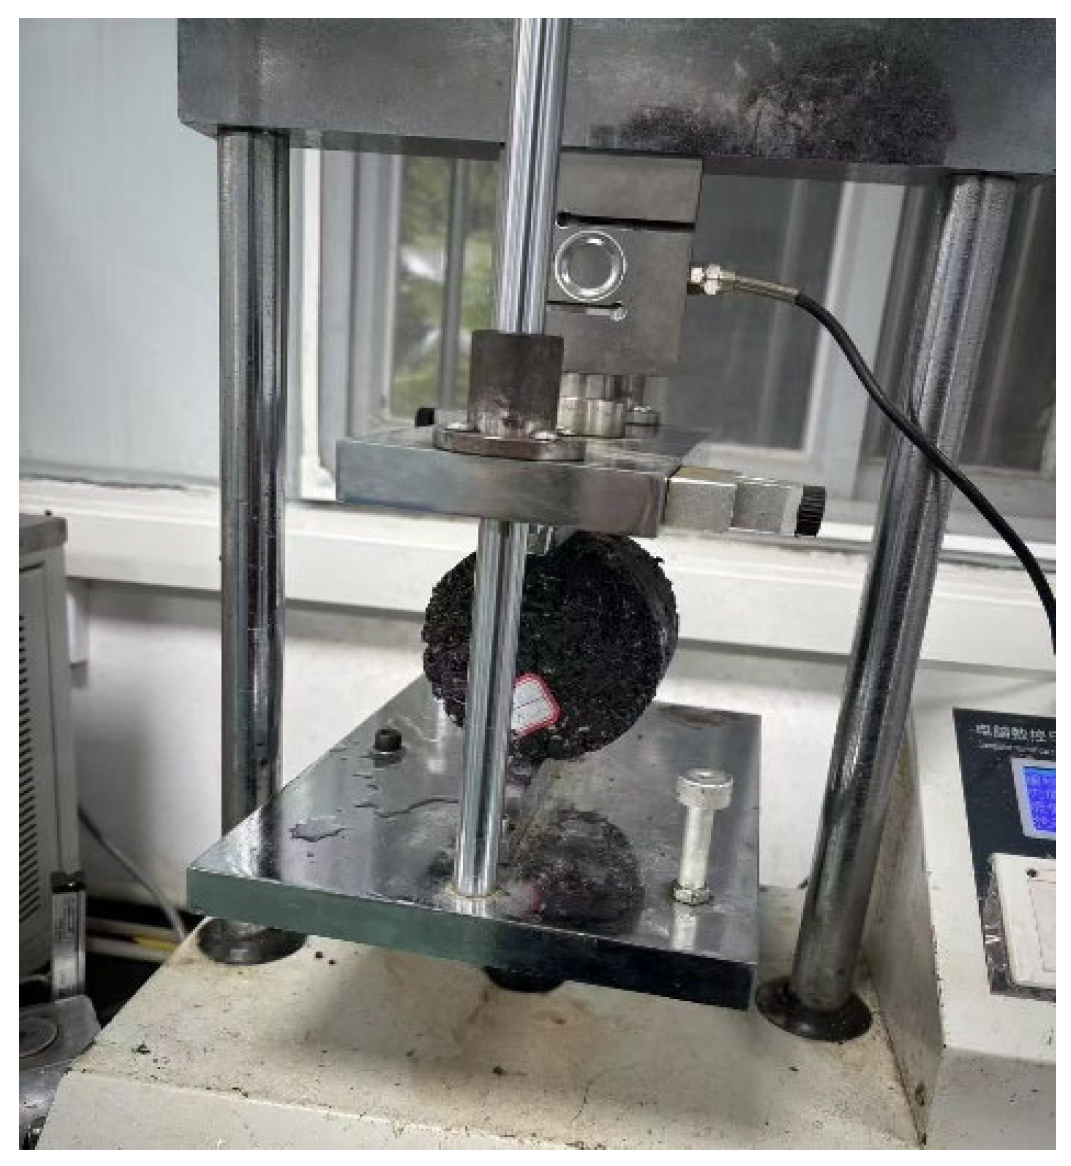
Figure 6.
Loading of Marshall specimens.
Figure 6.
Loading of Marshall specimens.
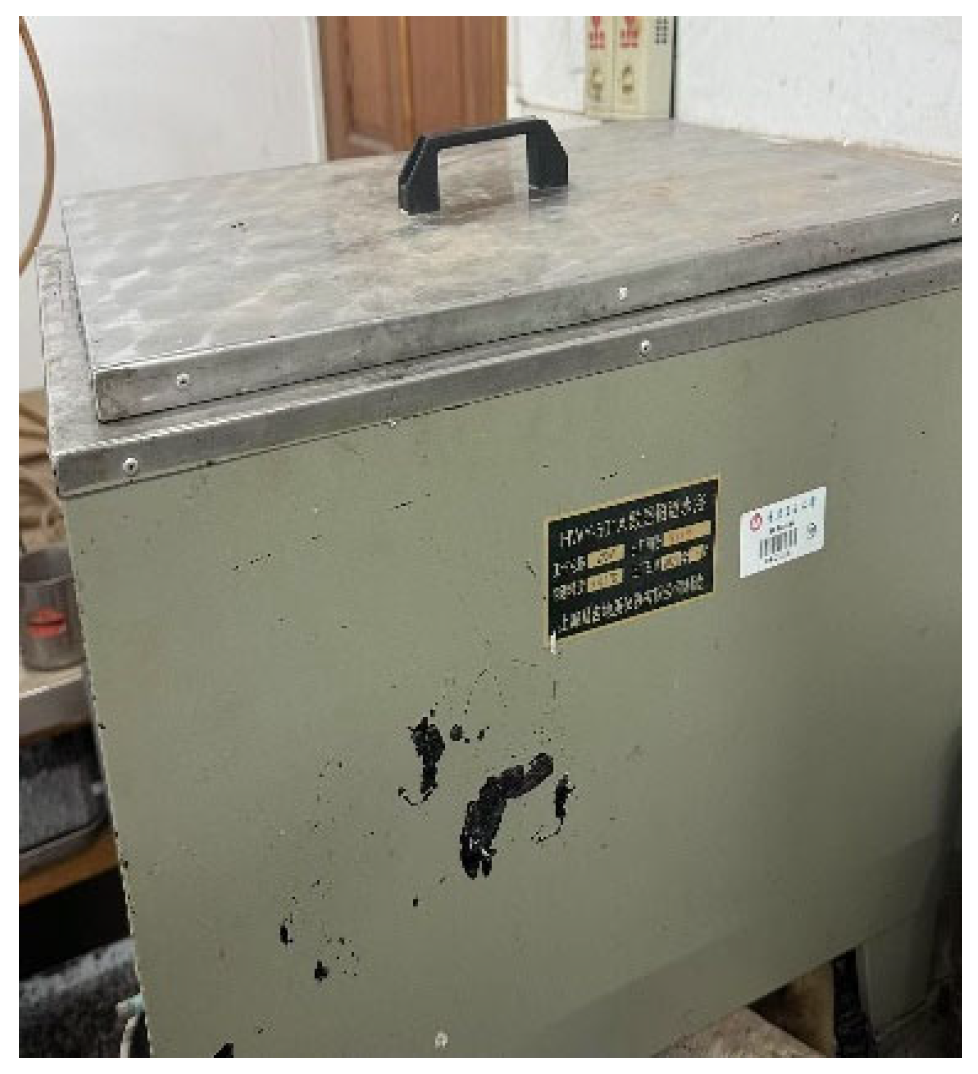
Figure 7.
Thermostatic incubator.
Figure 7.
Thermostatic incubator.
Figure 8.
Loading of test specimens.
Figure 8.
Loading of test specimens.
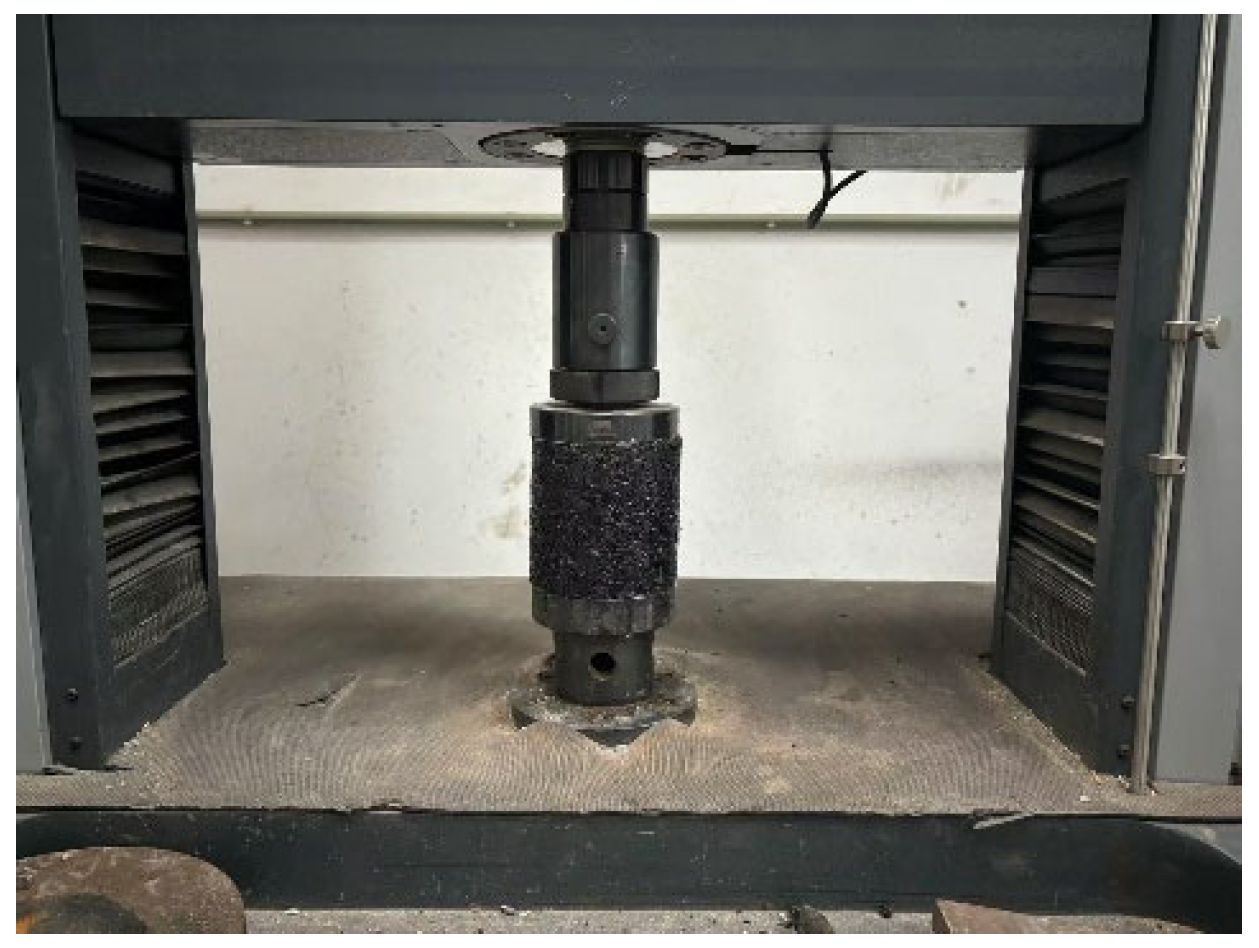
Figure 9.
Uniaxial compression.
Figure 9.
Uniaxial compression.
Figure 10.
Marshall stability test results.
Figure 10.
Marshall stability test results.
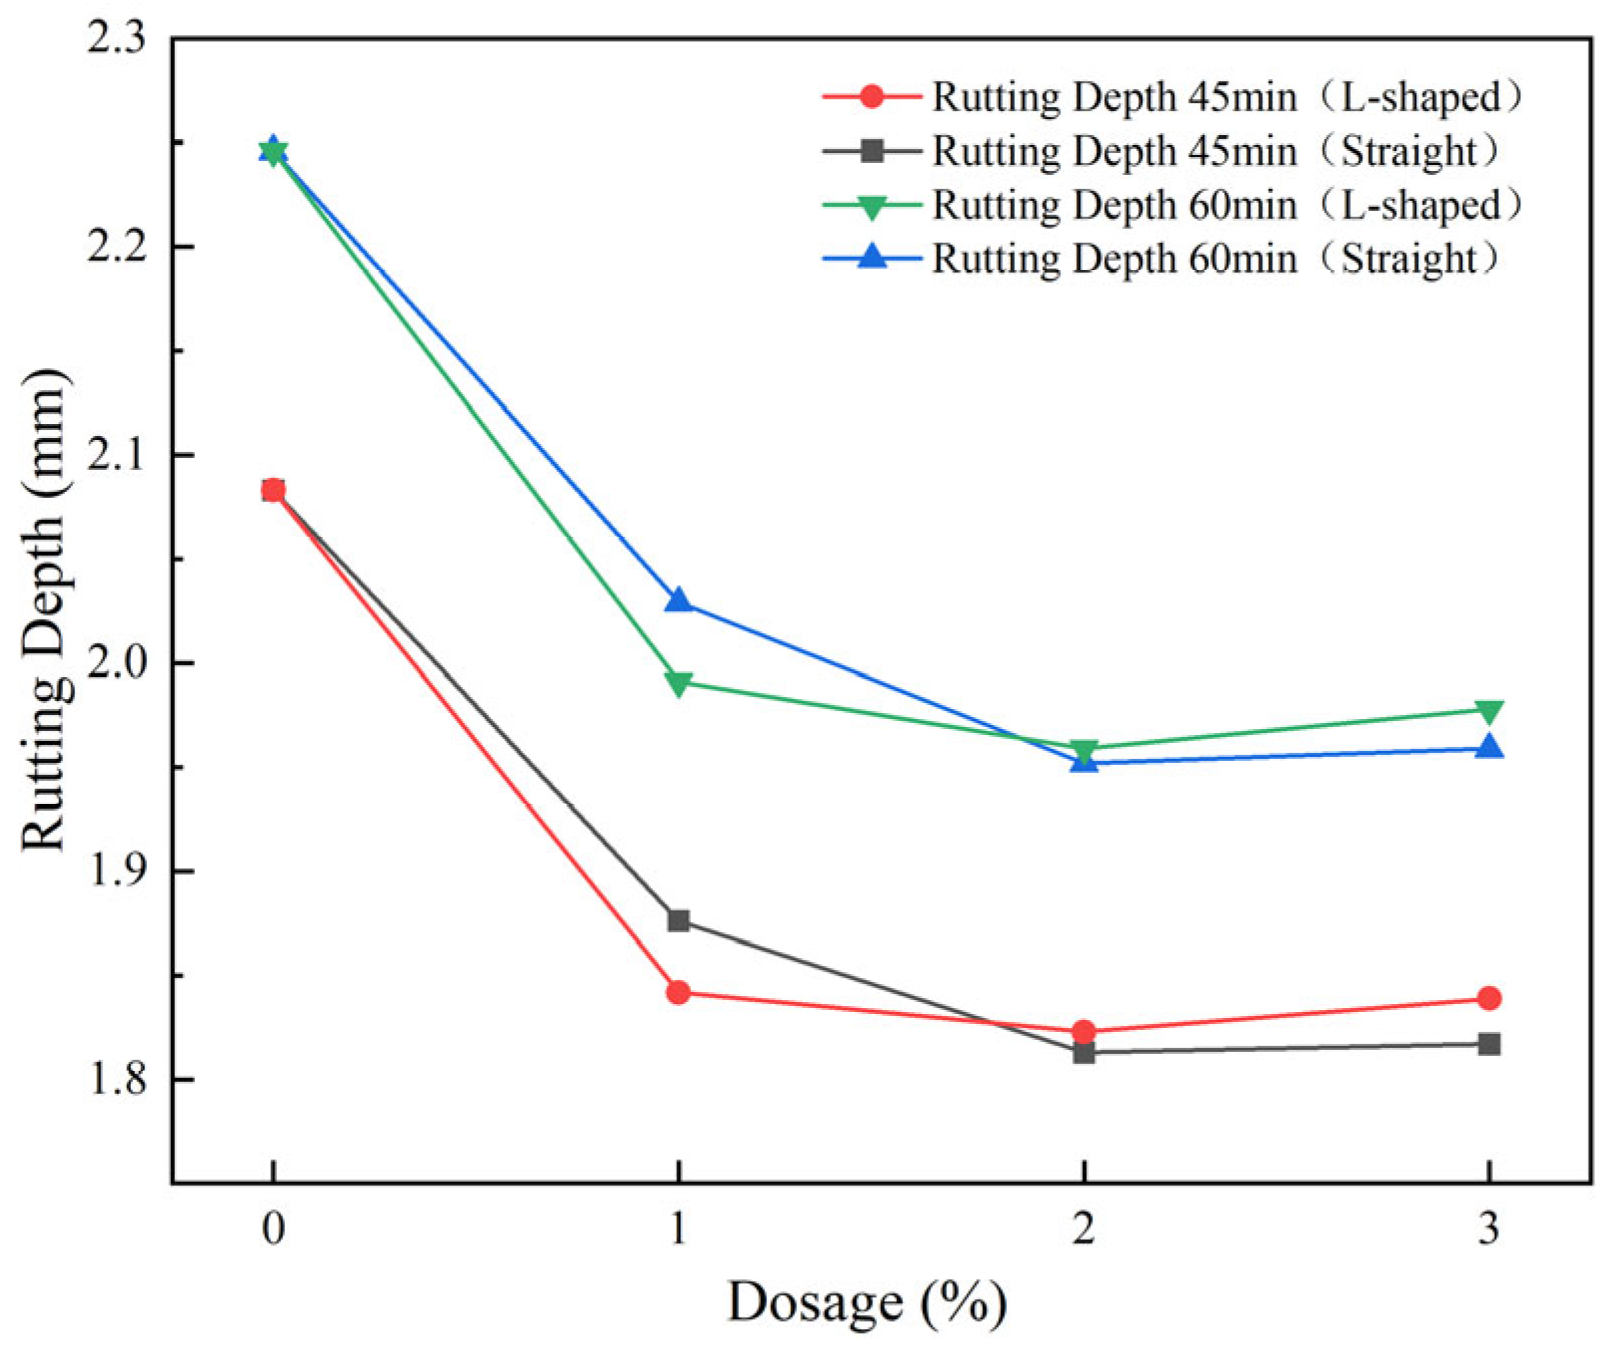
Figure 11.
Comparison of rutting depth between L-shaped and straight steel fibers.
Figure 11.
Comparison of rutting depth between L-shaped and straight steel fibers.
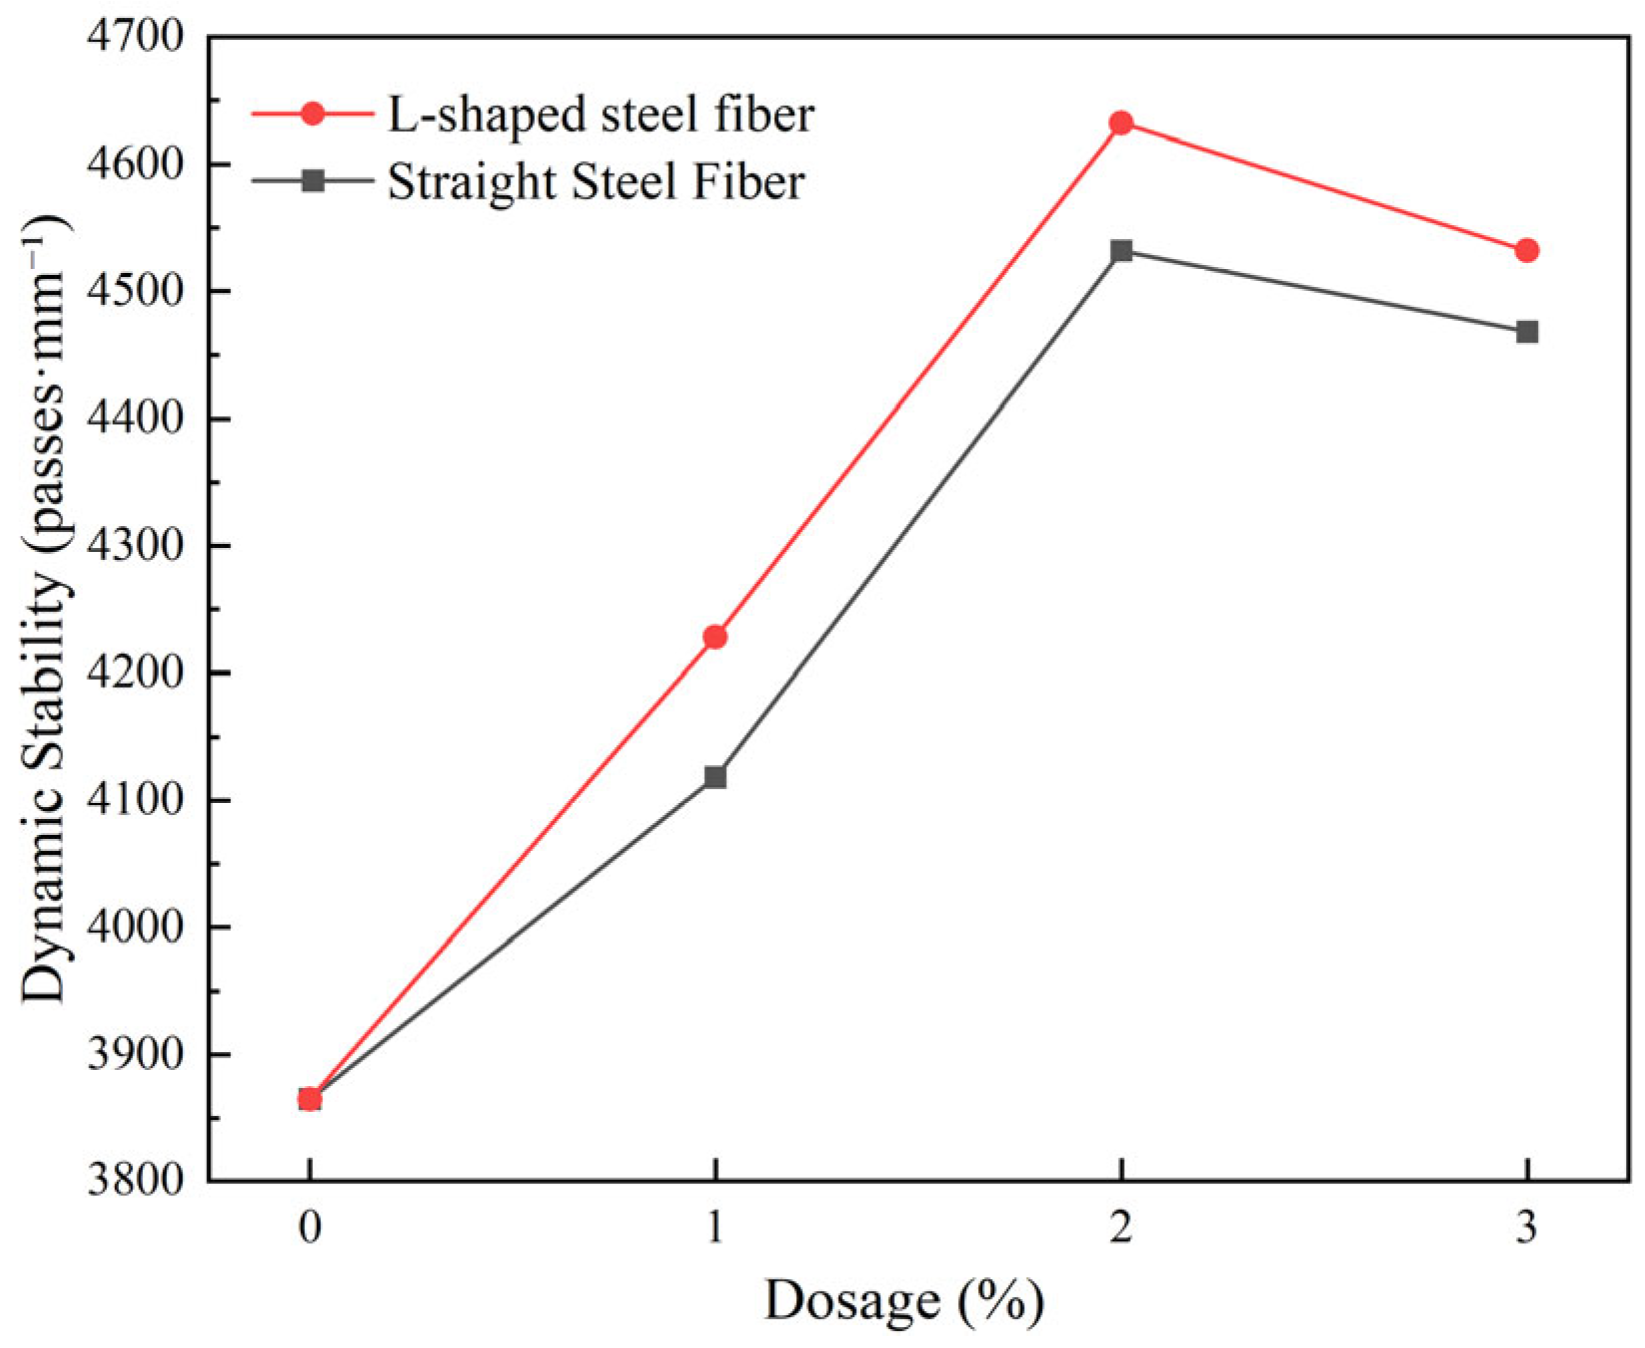
Figure 12.
Comparison of dynamic stability between L-shaped and straight steel fibers.
Figure 12.
Comparison of dynamic stability between L-shaped and straight steel fibers.
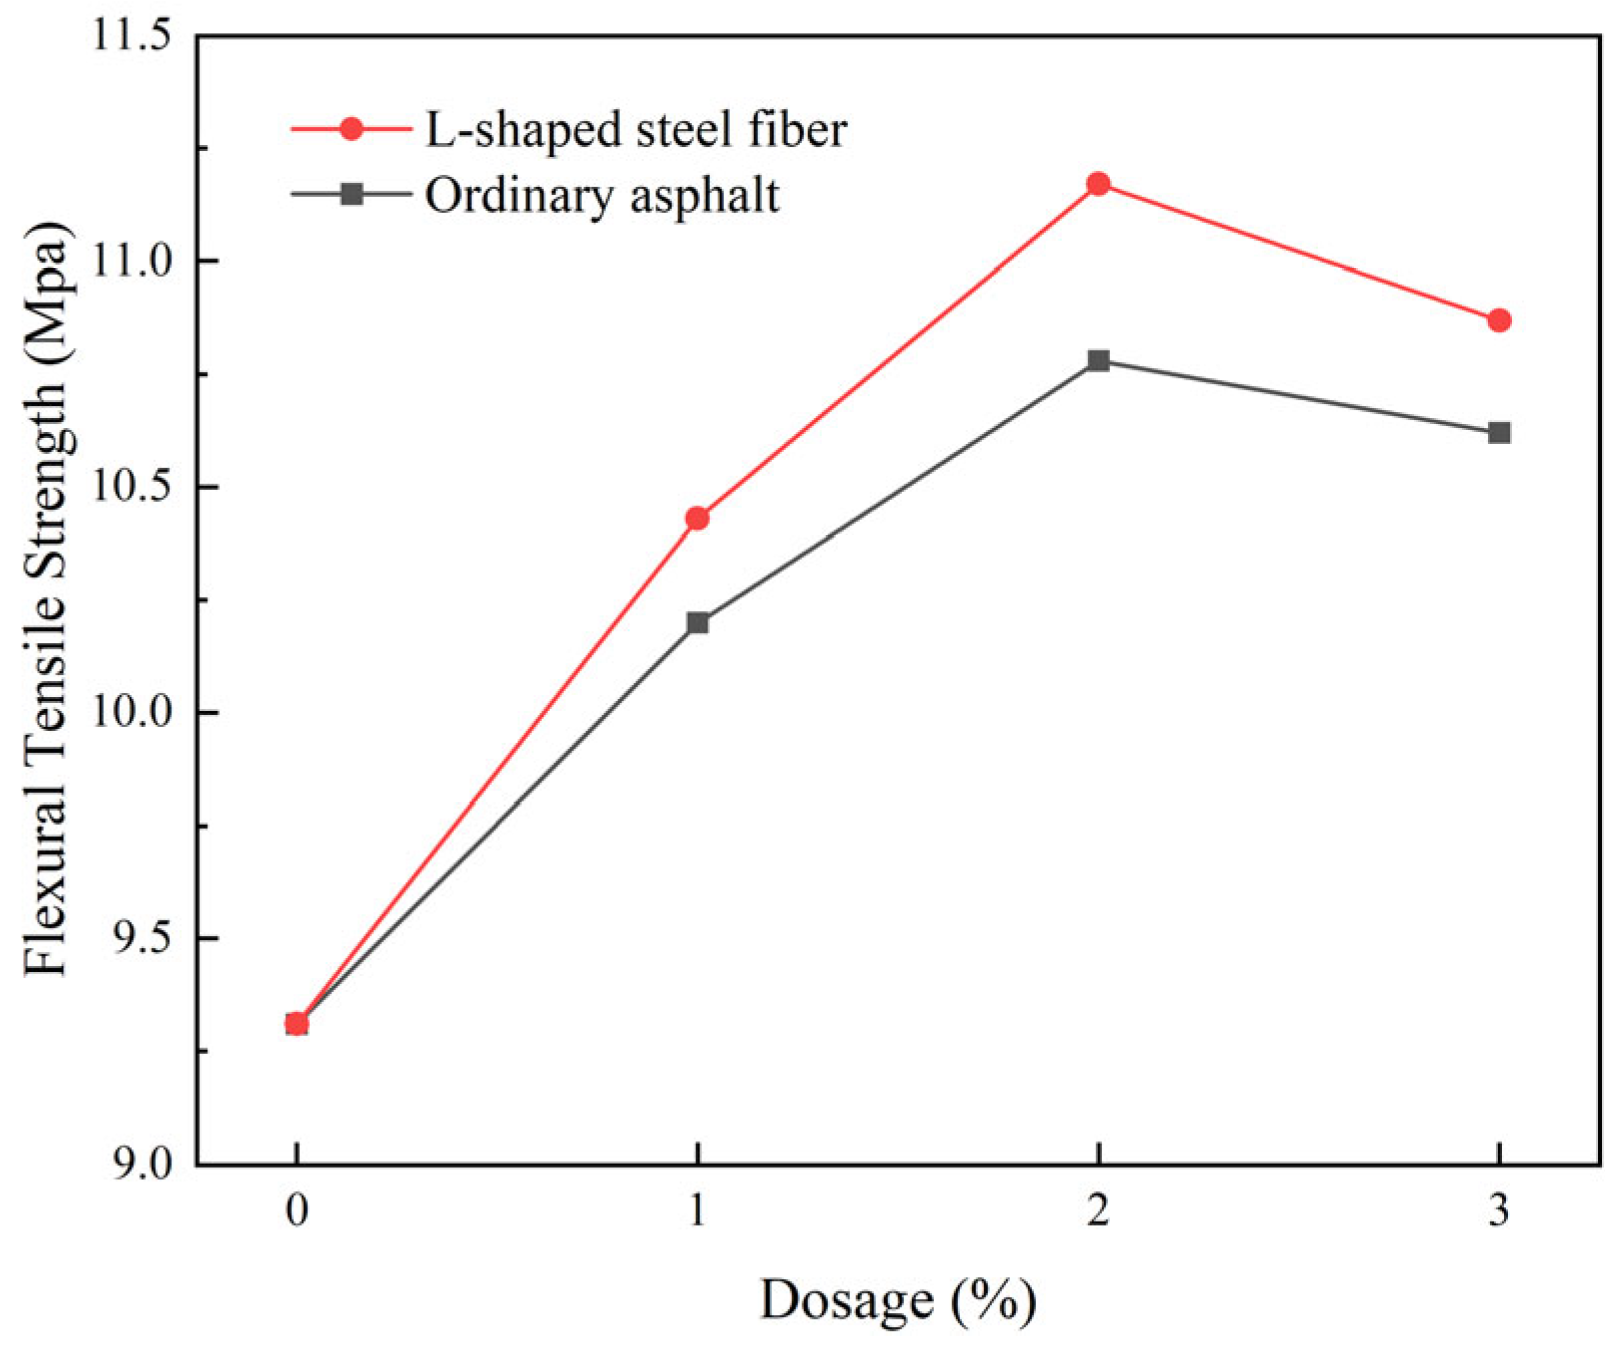
Figure 13.
Comparison of flexural tensile strength between L-shaped and straight steel fibers.
Figure 13.
Comparison of flexural tensile strength between L-shaped and straight steel fibers.
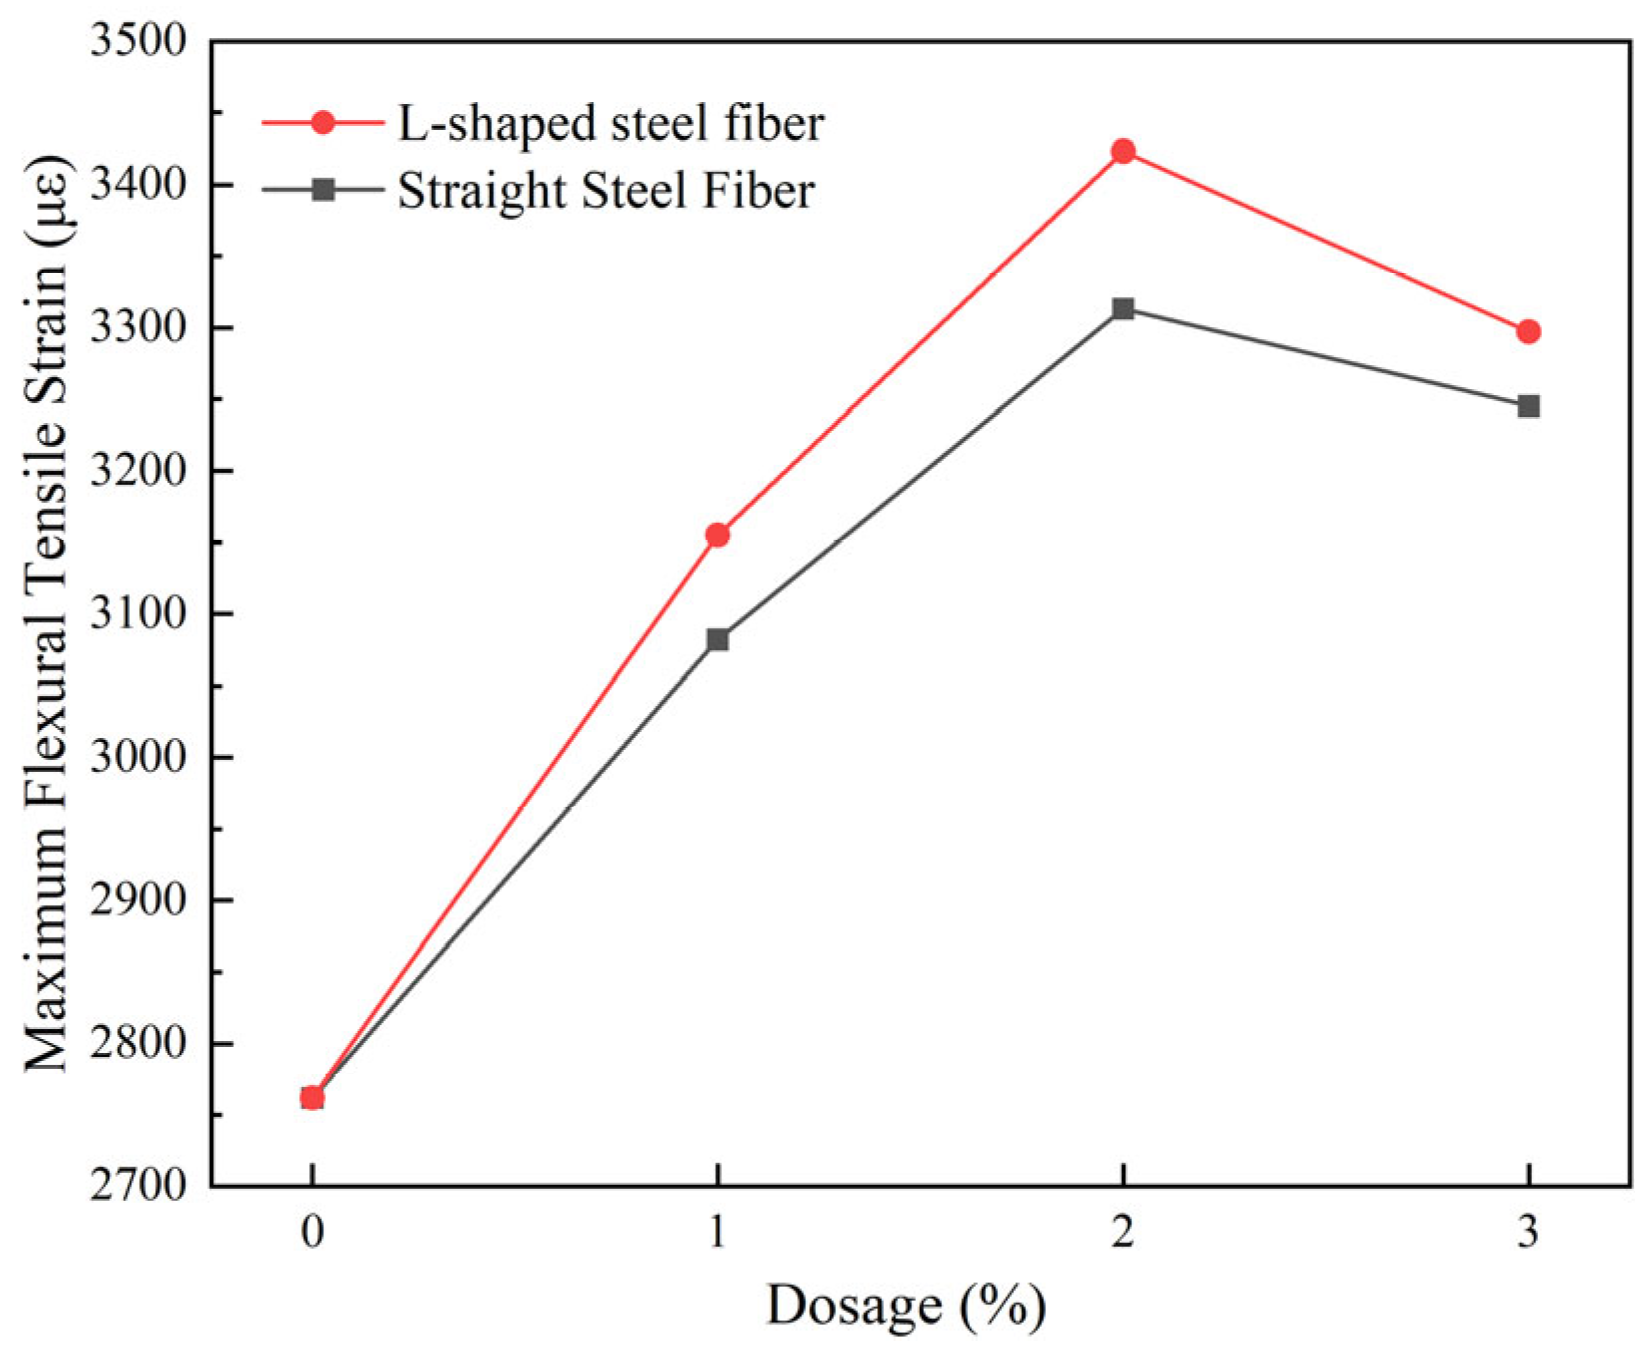
Figure 14.
Comparison of maximum tensile strain between L-shaped and straight steel fibers.
Figure 14.
Comparison of maximum tensile strain between L-shaped and straight steel fibers.
Figure 15.
Comparison of flexural stiffness modulus between L-shaped and straight steel fibers.
Figure 15.
Comparison of flexural stiffness modulus between L-shaped and straight steel fibers.
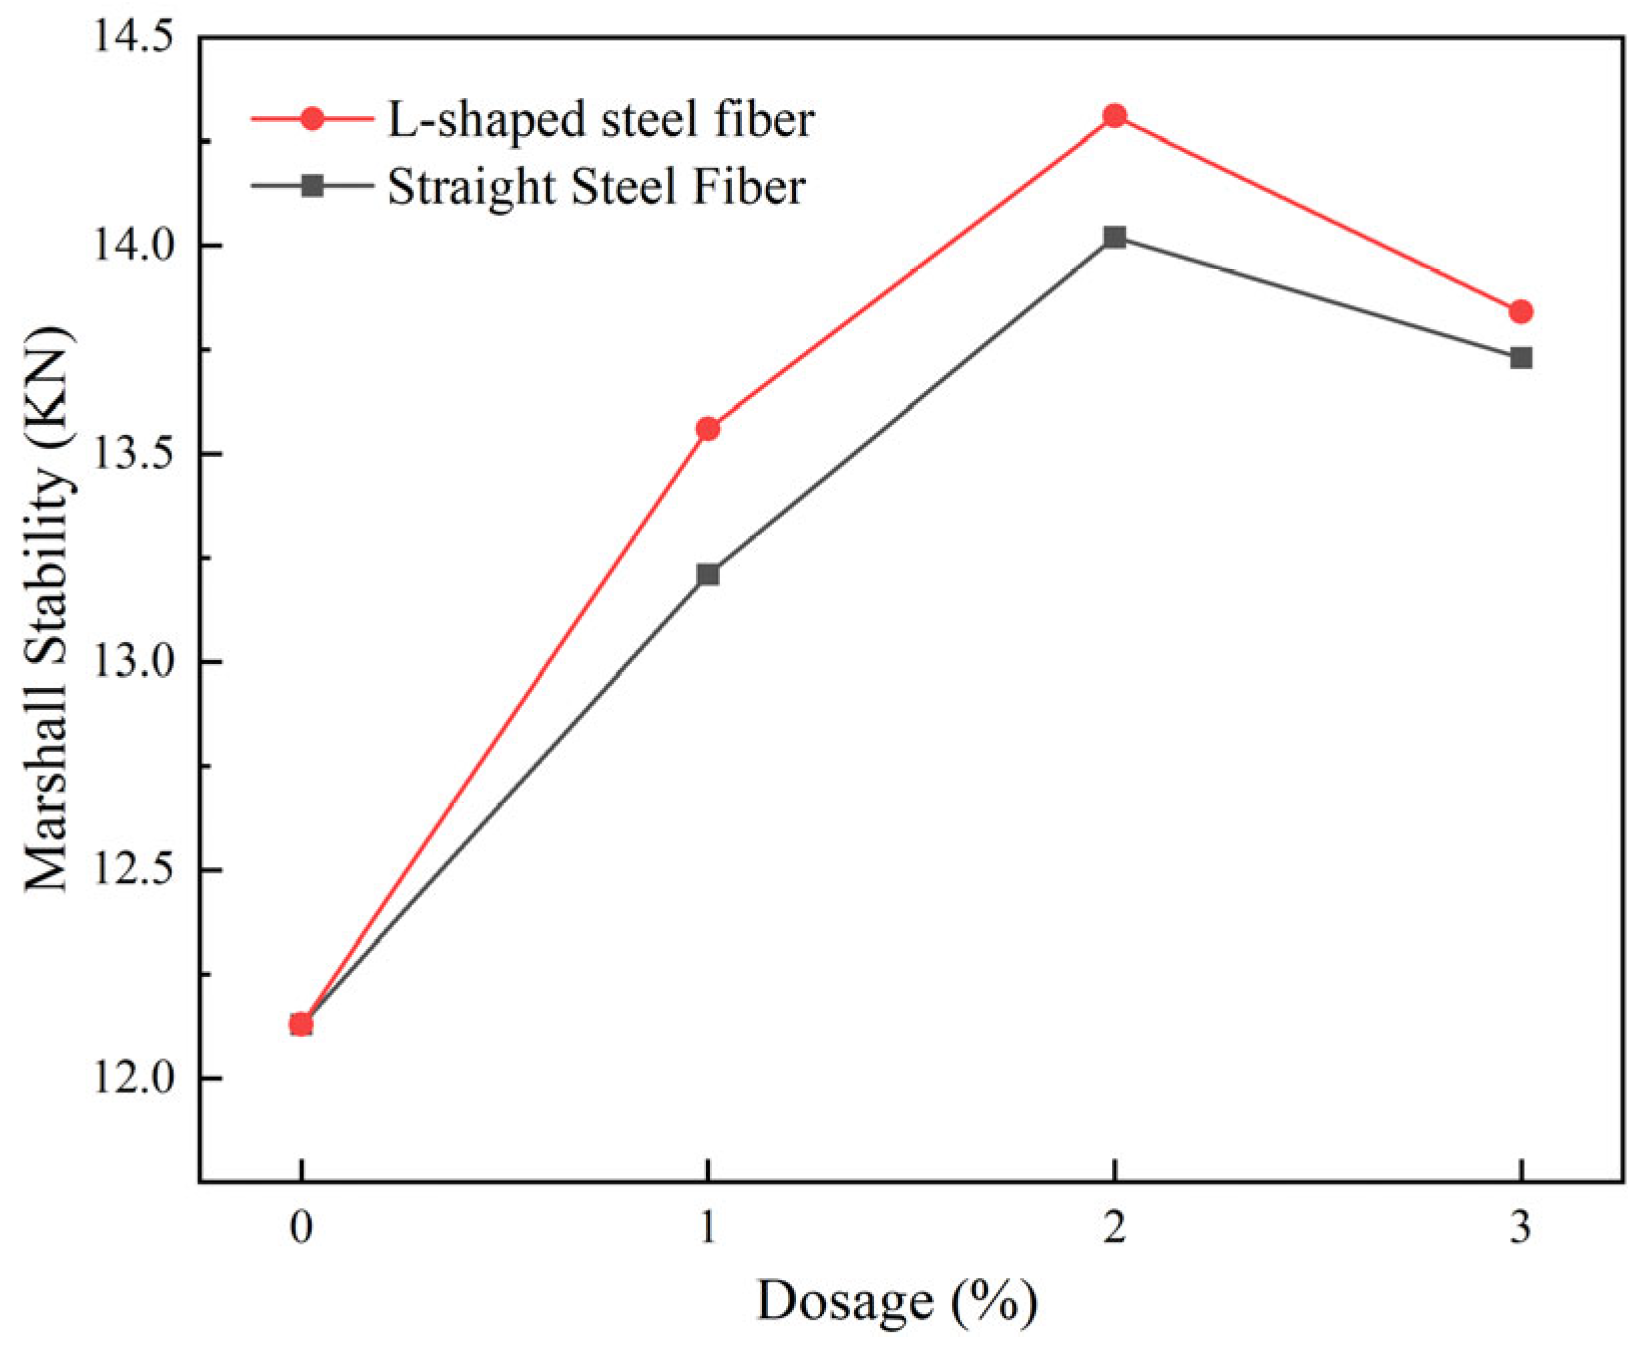
Figure 16.
Comparison of Marshall stability between L-shaped and straight steel fibers.
Figure 16.
Comparison of Marshall stability between L-shaped and straight steel fibers.
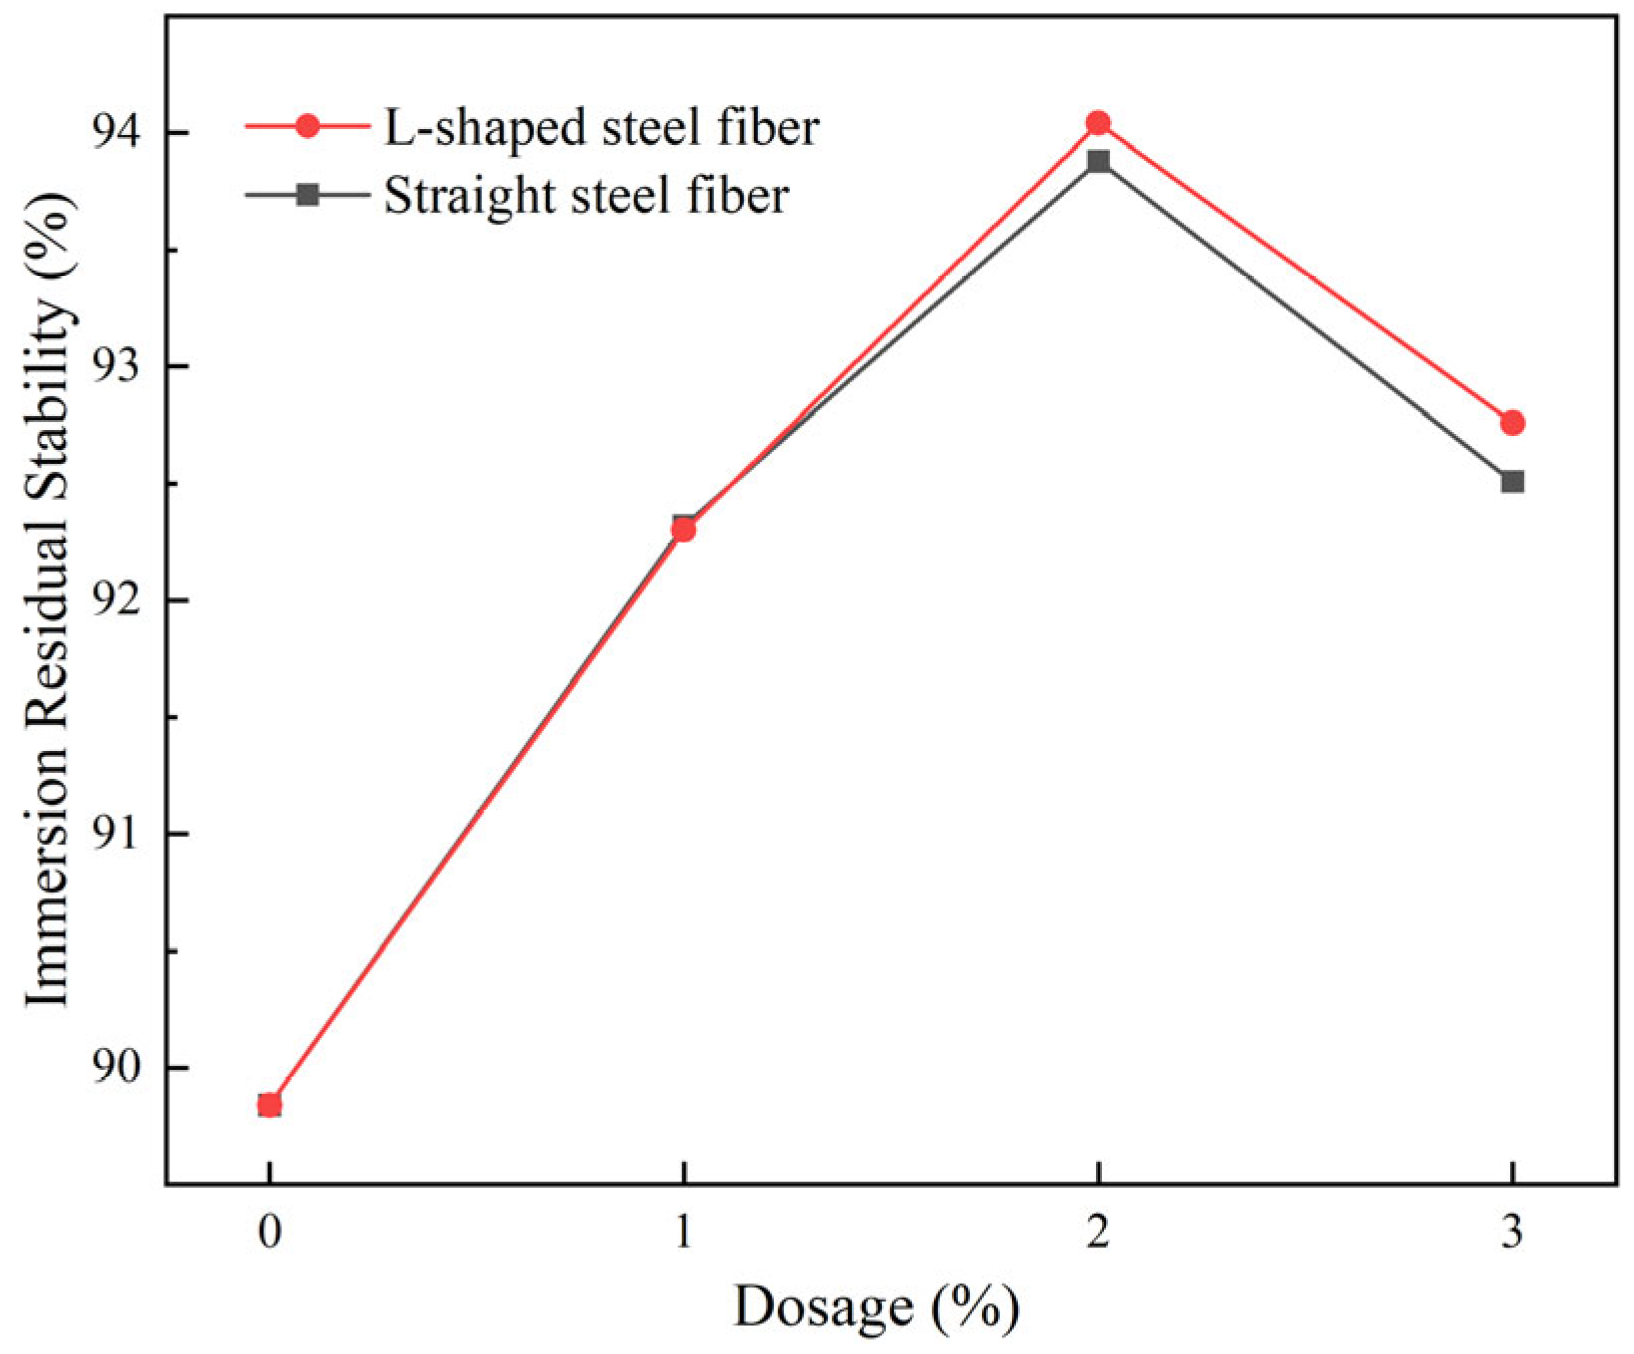
Figure 17.
Comparison of immersion Marshall stability between L-shaped and straight steel fibers.
Figure 17.
Comparison of immersion Marshall stability between L-shaped and straight steel fibers.
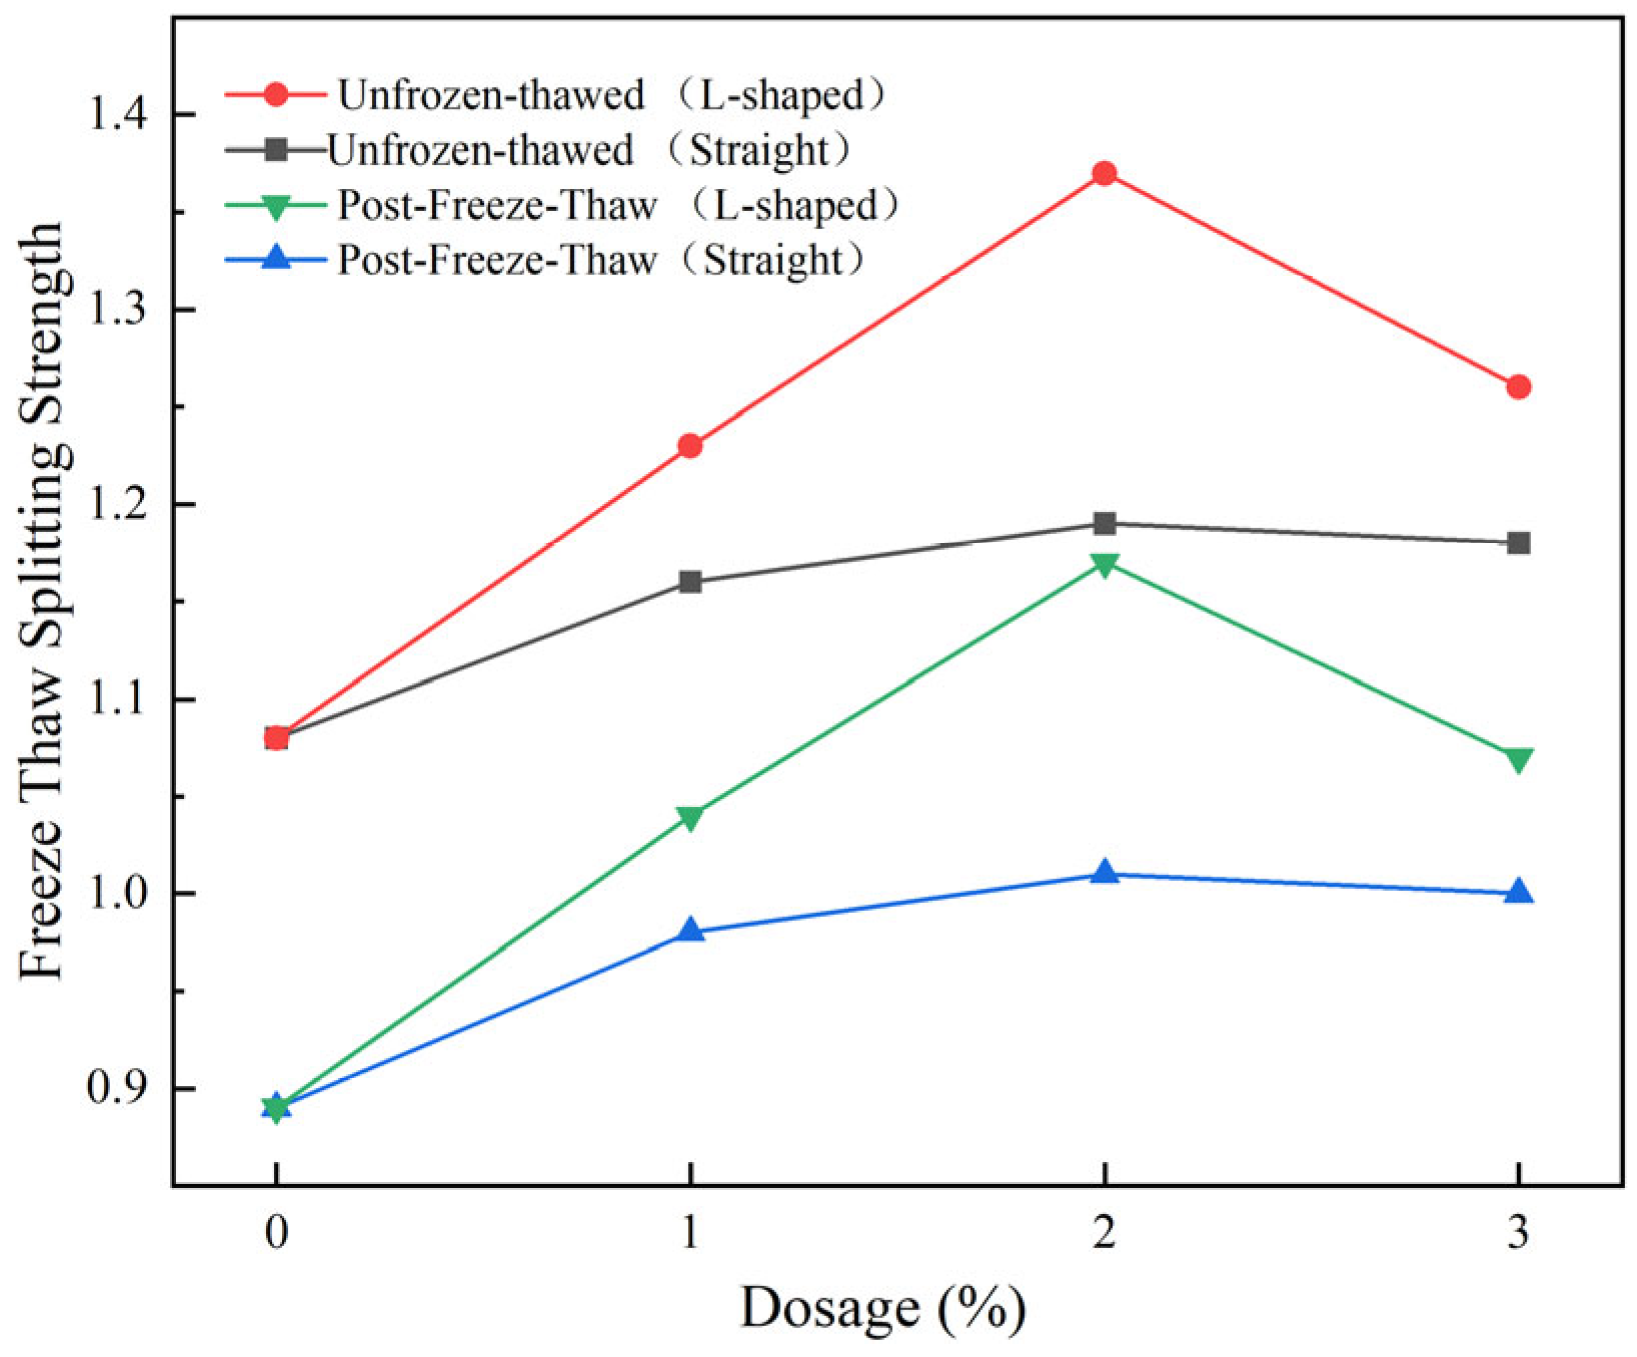
Figure 18.
Comparison of freeze–thaw splitting strength between L-shaped and straight steel fibers.
Figure 18.
Comparison of freeze–thaw splitting strength between L-shaped and straight steel fibers.
Figure 19.
Comparison of freeze–thaw splitting strength ratio between L-shaped and straight steel fibers.
Figure 19.
Comparison of freeze–thaw splitting strength ratio between L-shaped and straight steel fibers.
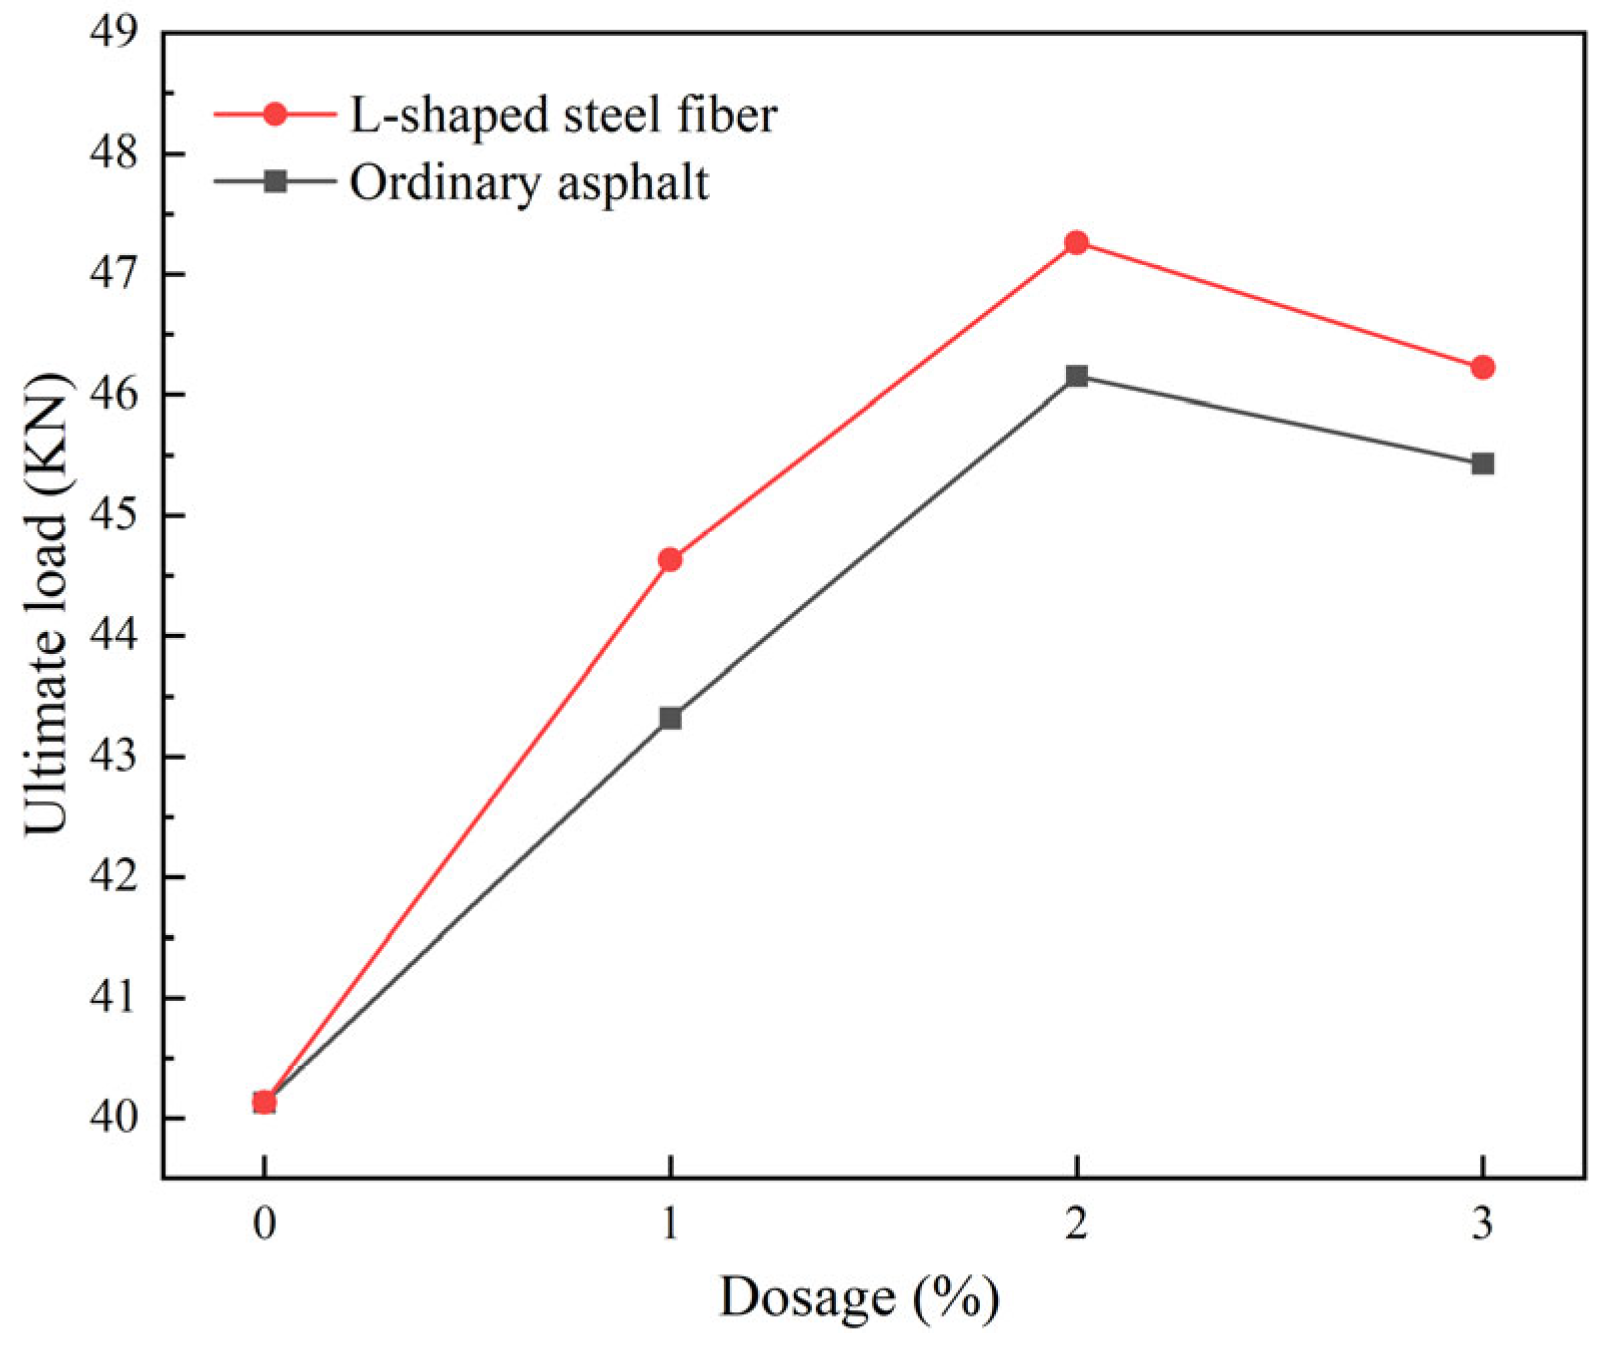
Figure 20.
Comparison of ultimate load between L-shaped and straight steel fibers.
Figure 20.
Comparison of ultimate load between L-shaped and straight steel fibers.
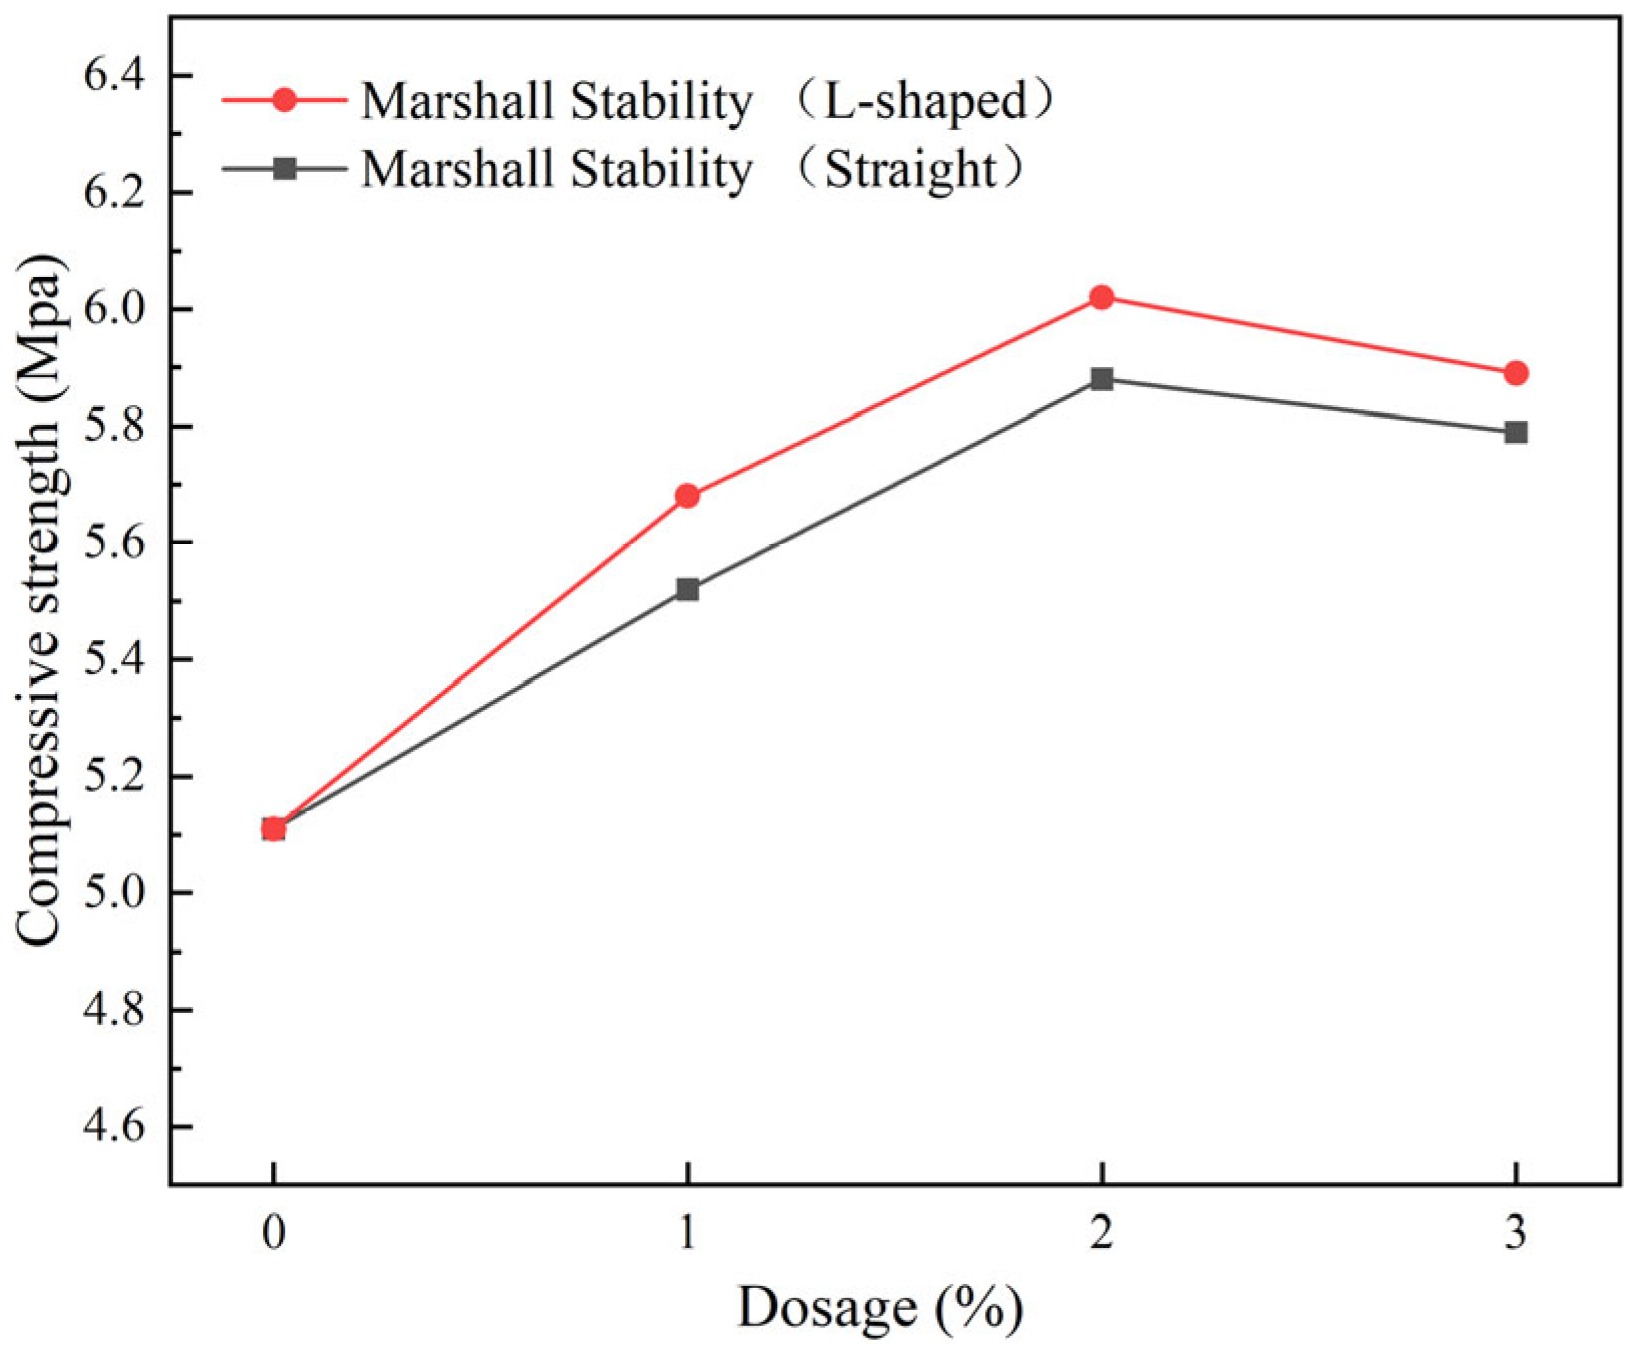
Figure 21.
Comparison of compressive strength between L-shaped and straight steel fibers.
Figure 21.
Comparison of compressive strength between L-shaped and straight steel fibers.
Table 1.
Technical indicators of asphalt.
Table 1.
Technical indicators of asphalt.
| Test Items | Test Results | Specification Requirements | Test Methods |
|---|
| Softening Temperature (%) | 78 | ≥60 | GB/T4507 |
| Plastic Deformation Capacity (cm) | 26.3 | ≥20 | GB/T4508 |
| Needle Penetration Depth (1/10 mm) | 51.4 | 40–60 | GB/4509 |
| Absolute Viscosity (pa.s) | 2.1 | ≤3 | Viscometer method |
| Flash Point (°C) | 281 | ≥230 | GB/T267 |
| Dissolution Capacity (%) | 99.5 | ≥99 | GB/T11148 |
| Segregation, Softening Point Difference (°C) | 1.8 | ≤2.5 | T0660-98 |
Table 6.
Particle size gradation design for AC-13 asphalt mixture.
Table 6.
Particle size gradation design for AC-13 asphalt mixture.
| Sieve Opening Size (mm) | Composite Gradation (%) |
|---|
| 16 | 100 |
| 13.2 | 93.5 |
| 9.5 | 74.3 |
| 4.75 | 49.3 |
| 2.36 | 30.3 |
| 1.18 | 20.2 |
| 0.6 | 14.2 |
| 0.3 | 9.8 |
| 0.15 | 7.8 |
| 0.075 | 5.1 |
Table 2.
Technical indicators of coarse aggregates.
Table 2.
Technical indicators of coarse aggregates.
| Test Items | Particle Size | Test Results | Specification Requirements | Test Methods |
|---|
| Apparent Relative Density | 10–15 mm | 2.841 | | |
| 5–10 mm | 2.834 | ≥2.5 | T0304 |
| 3–5 mm | 2.837 | | |
| Water Absorption Rate (%) | 10–15 mm | 0.53 | | |
| 5–10 mm | 0.56 | ≤3.0 | T0304 |
| 3–5 mm | 0.64 | | |
| Stone Crushing Value (%) | 17.3 | ≤28 | T0316 |
| Los Angeles Abrasion Loss (%) | 20.1 | ≤30 | T0317 |
| Content of Flaky and Elongated Particles (%) | 3.1 | ≤20 | T0312 |
Table 3.
Technical indicators of fine aggregates.
Table 3.
Technical indicators of fine aggregates.
| Test Items | Test Results | Specification Requirements | Test Methods |
|---|
| Apparent Relative Density | 2.741 | ≥2.5 | T0316 |
| Water Absorption Rate (%) | 1.34 | ≤3.0 | T0317 |
| Content of Particles Smaller than 0.075 mm by Water Washing Method (%) | 0.31 | ≤1.0 | T0333 |
Table 4.
Technical indicators of mineral powder.
Table 4.
Technical indicators of mineral powder.
| Test Items | Test Results | Specification Requirements | Test Methods |
|---|
| Apparent Specific Gravity | 2.81 | ≥2.8 | T0352 |
| Hydrophilic Coefficient | 0.75 | ≤1 | T0353 |
| Water Content (%) | 0.42 | ≤1 | T0103 |
| Appearance | Anti-caking | Anti-caking | |
| Particle Size Range | <0.6 mm | 100 | 100 | |
| <0.15 mm | 93.2 | 90–100 | T0351 |
| <0.075 mm | 88.1 | 75–100 | |
Table 5.
Technical indicators of steel fibers.
Table 5.
Technical indicators of steel fibers.
| Testing Performance | Test Results |
|---|
| Diameter | 0.75 mm |
| Length | 35 mm |
| Dimension Ratio | 76.08 |
| Volumetric Mass Density | 7850 kg/m3 |
| Ultimate Tensile Strength | 400–1200 MPa |
Table 7.
Marshall test results of steel fiber-reinforced asphalt mixture (1).
Table 7.
Marshall test results of steel fiber-reinforced asphalt mixture (1).
| Type | Dosage/% | Asphalt–Aggregate Ratio/% | Bulk Specific Gravity/g-cm−3 | Void Ratio/% |
|---|
| Ordinary Asphalt | 0 | 4.9 | 4.176 | 3.94 |
| Straight Steel Fiber | 1 | 4.9 | 4.208 | 3.83 |
| 2 | 4.9 | 4.211 | 3.72 |
| 3 | 4.9 | 4.231 | 3.68 |
| L-shaped Steel Fiber | 1 | 4.9 | 4.205 | 3.88 |
| 2 | 4.9 | 4.216 | 3.76 |
| 3 | 4.9 | 4.235 | 3.73 |
Table 8.
Marshall test results of steel fiber-reinforced asphalt mixture (2).
Table 8.
Marshall test results of steel fiber-reinforced asphalt mixture (2).
| Type | Dosage/% | Voids in Mineral Aggregate/% | Asphalt Saturation/% | Stability/KN | Flow Value/mm |
|---|
| Ordinary Asphalt | 0 | 14.15 | 71.25 | 12.13 | 3.39 |
| Straight Steel Fiber | 1 | 14.12 | 71.81 | 13.21 | 3.51 |
| 2 | 14.06 | 72.47 | 14.02 | 3.64 |
| 3 | 13.92 | 73.05 | 13.73 | 3.69 |
| L-shaped Steel Fiber | 1 | 14.08 | 71.71 | 13.56 | 3.55 |
| 2 | 13.98 | 72.53 | 14.31 | 3.71 |
| 3 | 13.90 | 73.22 | 13.84 | 3.76 |
Table 9.
Rutting test results.
Table 9.
Rutting test results.
| Type | Dosage/% | Rutting Depth/mm
45 min | Rutting Depth/mm
60 min | Dynamic Stability/Times·mm−1 | Specification Requirement |
|---|
| Ordinary Asphalt | 0 | 2.083 | 2.246 | 3865 | Dynamic Stability ≥ 3000 |
| Straight Steel Fiber | 1 | 1.876 | 2.029 | 4118 |
| 2 | 1.813 | 1.952 | 4532 |
| 3 | 1.817 | 1.959 | 4468 |
| L-shaped Steel Fiber | 1 | 1.842 | 1.991 | 4228 |
| 2 | 1.823 | 1.959 | 4632 |
| 3 | 1.839 | 1.978 | 4532 |
Table 10.
The standard deviation of rutting depth and dynamic stability.
Table 10.
The standard deviation of rutting depth and dynamic stability.
| Standard Deviation |
|---|
| Type | Dosage/% | Rutting Depth/45 min | Rutting Depth/60 min | Dynamic Stability |
|---|
| Ordinary Asphalt | 0 | 0.0737 | 0.1027 | 81.2358 |
| Straight Steel Fiber | 1 | 0.0957 | 0.1155 | 163.9399 |
| 2 | 0.0995 | 0.1369 | 179.1118 |
| 3 | 0.1720 | 0.1653 | 229.2627 |
| L-shaped Steel Fiber | 1 | 0.0909 | 0.0784 | 170.1930 |
| 2 | 0.0528 | 0.0577 | 126.2900 |
| 3 | 0.0628 | 0.0306 | 103.7764 |
Table 11.
The coefficient of variation of rutting depth and dynamic stability.
Table 11.
The coefficient of variation of rutting depth and dynamic stability.
| Coefficient of Variation |
|---|
| Type | Dosage/% | Rutting Depth/45 min | Rutting Depth/60 min | Dynamic Stability |
|---|
| Ordinary Asphalt | 0 | 3.54% | 4.57% | 2.10% |
| Straight Steel Fiber | 1 | 5.10% | 5.69% | 3.98% |
| 2 | 5.49% | 7.01% | 3.95% |
| 3 | 9.47% | 8.44% | 5.13% |
| L-shaped Steel Fiber | 1 | 4.93% | 2.43% | 4.02% |
| 2 | 2.90% | 1.41% | 2.73% |
| 3 | 3.41% | 1.55% | 2.29% |
Table 12.
Results of low-temperature beam bending test.
Table 12.
Results of low-temperature beam bending test.
| Type | Dosage/% | Flexural Tensile Strength RB (MPa) | Maximum Flexural Tensile Strain ℇB (μℇ) | Flexural Stiffness Modulus SB (MPa) | Specification Requirement |
|---|
| Ordinary Asphalt | 0 | 9.31 | 2762 | 3373 | Maximum Flexural Tensile Strain ≥ 2500 μℇ |
| Straight Steel Fiber | 1 | 10.20 | 3082 | 3311 |
| 2 | 10.78 | 3313 | 3255 |
| 3 | 10.62 | 3245 | 3273 |
| L-shaped Steel Fiber | 1 | 10.43 | 3155 | 3306 |
| 2 | 11.17 | 3423 | 3262 |
| 3 | 10.87 | 3297 | 3298 |
Table 13.
The standard deviation of flexural tensile, maximum flexural tenstraine strain and flexural stiffness modulus.
Table 13.
The standard deviation of flexural tensile, maximum flexural tenstraine strain and flexural stiffness modulus.
| Standard Deviation |
|---|
| Type | Dosage/% | Flexural Tensile Strength RB | Maximum Flexural Tensile Strain ℇB | Flexural Stiffness Modulus SB |
|---|
| Ordinary Asphalt | 0 | 0.3398 | 37.1179 | 93.4933 |
| Straight Steel Fiber | 1 | 0.6702 | 161.4214 | 176.6974 |
| 2 | 0.8729 | 105.2205 | 154.8879 |
| 3 | 1.2053 | 173.6134 | 283.0499 |
| L-shaped Steel Fiber | 1 | 0.5518 | 102.4214 | 123.2136 |
| 2 | 0.4824 | 108.6620 | 90.1300 |
| 3 | 0.4605 | 90.2205 | 70.9143 |
Table 14.
The coefficient of variation of flexural tensile, maximum flexural tenstraine strain and flexural stiffness modulus.
Table 14.
The coefficient of variation of flexural tensile, maximum flexural tenstraine strain and flexural stiffness modulus.
| Coefficient of Variation |
|---|
| Type | Dosage/% | Flexural Tensile Strength RB | Maximum Flexural Tensile Strain ℇB | Flexural Stiffness Modulus SB |
|---|
| Ordinary Asphalt | 0 | 3.65% | 1.34% | 2.77% |
| Straight Steel Fiber | 1 | 6.57% | 5.24% | 5.34% |
| 2 | 8.11% | 3.18% | 4.76% |
| 3 | 11.35% | 5.35% | 8.65% |
| L-shaped Steel Fiber | 1 | 5.29% | 3.25% | 3.73% |
| 2 | 4.32% | 3.17% | 2.76% |
| 3 | 4.24% | 2.73% | 2.15% |
Table 15.
Results of immersion Marshall test.
Table 15.
Results of immersion Marshall test.
| Type | Dosage/% | Marshall Stability/KN | Immersion Marshall Stability/KN | Immersion Residual Stability/% | Specification Requirement |
|---|
| Ordinary Asphalt | 0 | 12.31 | 11.06 | 89.84 | Immersion Residual Stability ≥ 85% |
| Straight Steel Fiber | 1 | 13.42 | 12.39 | 92.32 |
| 2 | 14.39 | 13.51 | 93.88 |
| 3 | 13.61 | 12.59 | 92.51 |
| L-shaped Steel Fiber | 1 | 13.51 | 12.47 | 92.30 |
| 2 | 14.76 | 13.88 | 94.04 |
| 3 | 14.36 | 13.32 | 92.76 |
Table 16.
The standard deviation of Marshall stability and immersion Marshall stability.
Table 16.
The standard deviation of Marshall stability and immersion Marshall stability.
| Standard Deviation |
|---|
| Type | Dosage/% | Marshall Stability | Immersion Marshall Stability |
|---|
| Ordinary Asphalt | 0 | 0.3106 | 0.4772 |
| Straight Steel Fiber | 1 | 0.6568 | 0.7542 |
| 2 | 0.7105 | 0.9654 |
| 3 | 0.9348 | 0.9253 |
| L-shaped Steel Fiber | 1 | 0.6525 | 0.5852 |
| 2 | 0.6348 | 0.4995 |
| 3 | 0.4995 | 0.6260 |
Table 17.
The coefficient of variation of Marshall stability and immersion Marshall stability.
Table 17.
The coefficient of variation of Marshall stability and immersion Marshall stability.
| Coefficient of Variation |
|---|
| Type | Dosage/% | Marshall Stability | Immersion Marshall Stability |
|---|
| Ordinary Asphalt | 0 | 2.52% | 4.31% |
| Straight Steel Fiber | 1 | 4.89% | 6.10% |
| 2 | 4.93% | 7.15% |
| 3 | 6.87% | 7.35% |
| L-shaped Steel Fiber | 1 | 4.83% | 4.70% |
| 2 | 4.30% | 3.60% |
| 3 | 3.48% | 4.70% |
Table 18.
Results of freeze–thaw splitting test.
Table 18.
Results of freeze–thaw splitting test.
| Type | Dosage/% | Unfrozen–Thawed Splitting Strength Rt1/MPa | Post-Freeze–Thawed Splitting Strength Rt2/MPa | Freeze–Thaw Splitting Strength Ratio/% | Specification Requirement |
|---|
| Ordinary Asphalt | 0 | 1.08 | 0.89 | 82.56 | Freeze–thaw Splitting Strength Ratio ≥ 80% |
| Straight Steel Fiber | 1 | 1.16 | 0.98 | 84.48 |
| 2 | 1.19 | 1.01 | 85.01 |
| 3 | 1.18 | 1.00 | 84.60 |
| L-shaped Steel Fiber | 1 | 1.23 | 1.04 | 84.75 |
| 2 | 1.37 | 1.17 | 85.14 |
| 3 | 1.26 | 1.07 | 84.99 |
Table 19.
The standard deviation of unfrozen–thawed splitting strength and post-freeze–thawed splitting strength.
Table 19.
The standard deviation of unfrozen–thawed splitting strength and post-freeze–thawed splitting strength.
| Standard Deviation |
|---|
| Type | Dosage/% | Unfrozen–Thawed Splitting Strength Rt1 | Post-Freeze–Thawed Splitting Strength Rt2 |
|---|
| Ordinary Asphalt | 0 | 0.0426 | 0.0852 |
| Straight Steel Fiber | 1 | 0.0932 | 0.1245 |
| 2 | 0.1203 | 0.0912 |
| 3 | 0.1348 | 0.1446 |
| L-shaped Steel Fiber | 1 | 0.0821 | 0.0965 |
| 2 | 0.0675 | 0.0522 |
| 3 | 0.0590 | 0.0675 |
Table 20.
The coefficient of variation of unfrozen–thawed splitting strength and post-freeze–thawed splitting strength.
Table 20.
The coefficient of variation of unfrozen–thawed splitting strength and post-freeze–thawed splitting strength.
| Coefficient of Variation |
|---|
| Type | Dosage/% | Unfrozen–Thawed Splitting Strength Rt1 | Post-Freeze–Thawed Splitting Strength Rt2 |
|---|
| Ordinary Asphalt | 0 | 3.94% | 9.57% |
| Straight Steel Fiber | 1 | 8.03% | 12.70% |
| 2 | 10.11% | 9.03% |
| 3 | 11.42% | 14.46% |
| L-shaped Steel Fiber | 1 | 6.68% | 9.28% |
| 2 | 4.93% | 4.46% |
| 3 | 4.68% | 6.31% |
Table 21.
Results of uniaxial compression test.
Table 21.
Results of uniaxial compression test.
| Type | Dosage/% | Ultimate Load/KN | Compressive Strength/MPa |
|---|
| Ordinary Asphalt | 0 | 40.13 | 5.11 |
| Straight Steel Fiber | 1 | 43.32 | 5.52 |
| 2 | 46.15 | 5.88 |
| 3 | 45.43 | 5.79 |
| L-shaped Steel Fiber | 1 | 44.63 | 5.68 |
| 2 | 47.26 | 6.02 |
| 3 | 46.22 | 5.89 |
Table 22.
The standard deviation of ultimate load and compressive strength.
Table 22.
The standard deviation of ultimate load and compressive strength.
| Standard Deviation |
|---|
| Type | Dosage/% | Ultimate Load | Compressive Strength |
|---|
| Ordinary Asphalt | 0 | 2.0082 | 0.2618 |
| Straight Steel Fiber | 1 | 3.1906 | 0.3238 |
| 2 | 2.4314 | 0.3638 |
| 3 | 4.2082 | 0.3638 |
| L-shaped Steel Fiber | 1 | 2.5201 | 0.3103 |
| 2 | 1.6574 | 0.2450 |
| 3 | 1.3586 | 0.1845 |
Table 23.
The coefficient of variation of ultimate Load and compressive strength.
Table 23.
The coefficient of variation of ultimate Load and compressive strength.
| Coefficient of Variation |
|---|
| Type | Dosage/% | Ultimate Load | Compressive Strength |
|---|
| Ordinary Asphalt | 0 | 5.00% | 5.12% |
| Straight Steel Fiber | 1 | 7.37% | 5.87% |
| 2 | 5.27% | 6.19% |
| 3 | 9.26% | 6.28% |
| L-shaped Steel Fiber | 1 | 5.65% | 5.46% |
| 2 | 3.51% | 4.07% |
| 3 | 2.94% | 3.13% |


