Article

Cotton Fiber Micronaire and Relations to Fiber HVI and AFIS Qualities Between Deltapine® and PhytoGen Upland Varieties

by
Yongliang Liu
1,* and
Doug J. Hinchliffe
2
1
Cotton Quality & Innovation Research Unit, Southern Regional Research Center (SRRC), Agricultural Research Service, United States Department of Agriculture, New Orleans, LA 70124, USA
2
Cotton Fiber Bioscience & Utilization Research Unit, Southern Regional Research Center (SRRC), Agricultural Research Service, United States Department of Agriculture, New Orleans, LA 70124, USA
*
Author to whom correspondence should be addressed.
Fibers 2025, 13(4), 41; https://doi.org/10.3390/fib13040041
Submission received: 3 February 2025 / Revised: 14 March 2025 / Accepted: 28 March 2025 / Published: 3 April 2025

Abstract

:

Highlights

What are the main findings?
  • Fiber MIC [EE1] development enhanced some conventional fiber qualities but also increased certain undesirable qualities.
  • The MIC values were positively and significantly correlated with the algorithmic MIR values of the ATR FT-IR spectra.
What is the implication of the main finding?
  • MIC impacts the market price of cotton fiber and influences fiber quality characteristics; therefore, assessing fiber MIC, even before the application of harvesting aids, is essential for ensuring premium fiber quality, [EE2].
  • Due to its ability to sample as little as 0.5 mg of fiber directly without needing to first remove the cotton seeds, the ATR FT-IR method, when used in combination with the MIR approach, possesses the potential for the rapid, non-destructive, and indirect estimation of fiber MIC at any stage in remote or breeding locations.

Abstract

Cotton micronaire (MIC) is an essential fiber quality index that characterizes both fiber maturity and fineness components. This study compared how MIC affects the fiber high volume instrument (HVI) and advanced fiber information system (AFIS) qualities between Deltapine® and PhytoGen upland varieties. There were noticeable differences among HVI and AFIS qualities from Deltapine® fiber samples and PhytoGen samples, with significant differences om HVI strength and elongation. MIC development benefited fiber HVI strength enhancement and also HVI short fiber index (SFI), AFIS neps, AFIS short fiber contents, and AFIS immature fiber content (IFC) reduction, all of which were desired. Adversely, MIC evolution could cause undesired HVI Rd lowering, HVI +b boosting, and AFIS UQL(w), and a decrease in L5%(n) in fiber. Further, MIC values were not related with lint turnout, but they were positively and greatly correlated with algorithmic MIR values of the attenuated total reflection in Fourier transform infrared (ATR FT-IR) spectra. The results demonstrated the applicability of the ATR FT-IR technique combined with the MIR approach for rapid laboratory MIC assessment at early MIC testing in remote/breeding locations.

1. Introduction

The cotton crop is an important agricultural commodity worldwide, mainly due to its use as a naturally produced textile fiber [1]. Cotton fiber quality is essential in cotton production and sustainability and also in the growers and processors’ profitability [2]. To meet the requirements of fiber harvesting from cotton fields using mechanical harvesters, chemical boll openers and leaf defoliants are applied to increase cotton boll opening and reduce plant vegetative growth [3]. Following seed cotton ginning, qualities of acquired fiber or lint are classified officially in U.S. with Uster high volume instrument (HVI) measurements and the classer’s determination of extraneous matter levels [4]. The HVI reports the fiber micronaire (MIC), upper-half mean length (UHML), length uniformity index (UI), strength (STR), color (color grade, Rd, and +b), short fiber index (SFI), and non-lint content (particle count, percentage area (Area%), and leaf grade) by testing a bundle of fibers. Another commercially available and accepted instrument is the Uster advanced fiber information system (AFIS) [5,6,7,8], which generates 20 fiber qualities covering fiber length and distribution, trash content, nep content, fineness, and maturity by testing the individualized (or single) fibers. Both HVI and AFIS properties are well recognized by the cotton industry, breeders, and researchers.
Cotton MIC reflects the fiber maturity (degree of secondary cell wall development) and fineness (weight per unit length) of a sample indirectly and simultaneously [9,10]. To determine the MIC value, a conditioned fiber sample with a constant weight (10.0 g) is compressed to a fixed volume and then measured by an airflow instrument that quantifies the permeability of cotton fiber by passing compressed air through a compressed fiber sample. In general, high MIC cottons are coarse with fewer fibers per unit weight, and vice versa, low MIC cottons are fine and have more fibers, producing a higher fiber surface area. MIC values are graded into five ranges from premium to discount range, and each range is related to the cotton market price [4] and also impacts the yarn manufacturing process and the finished products [11]. For example, cotton fibers are assigned as “Discount Range”, “Base Range”, and “Premium Range” classes if their MIC values are in respective ranges of ≥5.0 and ≤3.4, 4.3–4.9 and 3.5–3.6, and 3.7–4.2. Although MIC is not an ideal parameter to describe the inherent maturity-fineness complexity since cottons having identical MICs may have very different distributions of perimeter and theta (that is defined as the ratio of the area of the cell wall to the area of a circle having the same perimeter as the fiber section) [12], it is commonly used by textile manufacturers as a substitute for describing fiber maturity.
Clearly, from seed cotton field harvesting to cotton ginning to fiber quality laboratory test, quality testing is a lengthy process. This process could take days to complete and therefore obtain fiber quality data, because fiber production or ginning locations and quality test laboratories are not necessarily in close proximity. Hence, there have been studies on the rapid and accurate analysis of some cotton fiber qualities (i.e., MIC, maturity, and fineness), even in seed cottons and unopened cotton bolls, using low-cost and portable systems with the least fiber preparation steps. Researchers at the Agricultural Research Service (ARS) of the USDA investigated the potential of portable near infrared (NIR) and attenuated total reflection Fourier transform infrared (ATR FT-IR) spectroscopic techniques to measure fiber maturity and MIC in the laboratory and outside the laboratory (e.g., field or green house) through partial least squares (PLS) regression analysis or simple algorithmic analysis [13,14,15,16,17]. Long and Bange [18] evaluated the feasibility of the portable NIR technique as a non-destructive and rapid replacement for the manual boll cutting technique by calibrating the NIR spectral measurement with two levels of boll maturity (immature and mature). Wang et al. [19] examined the optical properties of cotton fibers with different MIC values using Monte Carlo (MC) simulations in the 400–1100 nm range, and established regression prediction models of the optical parameters and MIC component. The principle is based on NIR spectral intensities (750 to 2500 nm or 13,300 to 4000 cm–1) that originate from the overtones and combinations of fundamental group vibrations [20], and also FT-IR absorptions (2500 nm to 25,000 nm or 4000 to 400 cm–1) that represent those fundamental group vibrations (i.e., C–H, O–H, C–O) in fiber cellulose (a major constituent in cotton fiber) [13,21]. The recent and rapid developments in machine learning (ML) technology and nanomaterials could be explored for potential use in this area [22,23].
To help cotton producers in their decision-making time frame for crop managements (i.e., harvest aid application) just prior to harvesting, fiber MIC testing at any developmental stage might be important to optimize fiber production and quality since, MIC represents fiber secondary cell wall (SCW) development and is a rapidly measurable fiber attribute. The main objective of this study was to compare how fiber MIC influences conventional HVI and AFIS qualities between Deltapine® and PhytoGen upland cotton varieties, and also to relate fiber MIC with FT-IR spectral measurement. Comparison of fiber MIC with FT-IR properties would facilitate the development of the FT-IR technique as a rapid, non-destructive, and low-cost system that can be utilized away from laboratories to measure fiber MIC directly on seed cottons (cotton fibers that are still attached to seeds). The novelty of this study lies in distinctive impacts of fiber HVI on some HVI and AFIS qualities between the two brand cotton varieties, and also in the potential of estimating fiber MIC from FT-IR measurement.

2. Materials and Methods

2.1. Seed Cotton Samples

The seed cotton samples consisted of four commercial Deltapine® and eleven commercial PhytoGen upland cotton samples that were harvested by cotton mechanical harvesters. These samples were from four crop years (2016, 2020, 2021, and 2022) and were grown in one U.S. state (MS). They were kept under laboratory conditions for at least 2 days before ginning.

2.2. Seed Cotton Ginning

After removing apparent non-lint materials (such as large sticks and burrs), 250.0 g of each seed cotton was ginned using a 10-saw Dennis laboratory saw gin (saw diameter = 12.7 cm, teeth per saw = 137, saw speed = 870 revolutions per minute (RPM), and saw tip speed = 347 m/min) and feeding the sample within three minutes. The lint collected from each seed cotton sample was weighed on a balance to determine lint turnout by dividing the lint weight with the original weight of seed cotton, and subsequently was analyzed by HVI, AFIS, and FT-IR method for fiber qualities.

2.3. Fiber Quality Measurement

Following the lint samples being conditioned at 21 ± 1 °C temperature and 65 ± 2% relative humidity for least 24 h [4], their HVI properties were determined by an HVI 1000 (USTER Technologies Inc., Knoxville, TN, USA) with five replications per sample, and AFIS values were assessed by an AFIS Pro 2 (USTER Technologies Inc., Knoxville, TN, USA) with three replications of 5000 fibers per measurement. Averages of individual qualities were used for each sample. All measurements were performed at the Southern Regional Research Center of USDA’s Agricultural Research Service (USDA-ARS-SRRC).

2.4. Fiber ATR FT-IR Spectral Collection and Analysis

A Nicolet iS20 FT-IR spectrometer (Thermo Electron North America LLC, Madison, WI, USA) equipped with a KBr/Ge coated beamsplitter, a deuterated triglycine sulfate (DTGS) detector, and an ATR attachment was used to scan the fiber spectra. To overcome the disadvantages of the KBr-pellet method in FT-IR transmission measurement, the ATR device as a rapid, non-destructive, and routine technique has been used extensively in cotton fiber FT-IR studies [24,25,26,27,28,29,30]. The use of the ATR device makes fiber sampling easier and simpler than the KBr-pellet method; thus, it is time-efficient when analyzing a large number of samples. The ATR sampling device consisted of an anti-reflectance (AR) coated single reflection diamond crystal, and a consistent contact pressure was applied by a stainless steel rod. The sampling depth of the ATR device was from 2 to 15 µm [31,32] and the thickness of mature cotton fiber SCW varies from 2 to 7 µm [33]. The ATR method is capable of representing the information inside mature cotton fibers with the use of a low refractive index crystal (i.e., diamond). The background was recorded without the presence of samples before scanning the samples. The spectra were collected over the range of 4000–600 cm−1 at 4 cm−1 alongside 16 co-added scans in the absorbance unit. During the data collection, cautions were taken to make sure that the window (2 mm in diameter) of the ATR sampling device was covered completely by fiber samples. Six spectra were collected on each sample by subsampling different locations and the mean spectrum was obtained for analysis.
Spectral analyses of fiber MIR and CIIR values were performed by applying simple algorithmic analyses to the ATR FT-IR spectra, as shown in Figure 1, with the proposed procedure [13,28]. These algorithms were used by independent cotton researchers with different ATR, FT-IR, and imaging instruments [26,34]. Briefly, after loading the spectra into Microsoft® Excel® for Office 365, the first algorithmic R1 equation was used to calculate the R1 value for an unknown sample:
R1 = (I956I1500)/(I1032I1500)
where I1500, I1032, and I956 are each a multi-point intensity average at a respective wavenumber. The I1032 characterized the large and positive intensity variation, while the I956 represented the large and negative intensity variation in the difference spectrum between immature and mature cottons [13,28]. The I1500 was used to offset two readings because of its minimum absorbance.
Next, the second algorithm, MIR, was used to convert the R1 value into the MIR index:
MIR = (R1 − 0.14)/0.45
Separately, CIIR was computed using two algorithms, with the first algorithm R2 utilizing three respective IR intensities at 800, 730, and 708 cm−1, and the second algorithm CIIR (%) changing the R2 values into fiber CIIR [13,28].
R2 = (I708I800)/(I730I800)
CIIR (%) = ((R2 − 1.4)/2.0) × 100

2.5. Data Analysis

Regression analyses on any quality pair between two varieties were conducted using Microsoft® Excel® for Office 365. Statistical analyses were also performed on the data using analysis of variance (ANOVA) function under Data Analysis in Microsoft® Excel® for Office 365 with a 95% confidence level, and using analysis of covariance (ANCOVA), available from http://www.biostathandbook.com/ancova.html (accessed 18 November 2024). Although Excel® is powerful and accessible easily, it may have limitations where it comes to large datasets with complex property traits. In such cases, other professional statistical software (e.g., R, SPSS, or SAS) is an option.

3. Results and Discussion

3.1. HVI and AFIS Qualities, Lint Turnout, and ATR FT-IR Characteristics Variability Between Deltapine® and PhytoGen Cotton Fibers

Table 1 shows a list of the descriptive statistics of HVI and AFIS qualities between two cotton brand varieties. There were no statistically significant differences (p-value > 0.05) for these HVI and AFIS properties besides HVI STR and elongation (ELO). In other words, both HVI STR and ELO properties were impacted by fiber brands or genotypes. Deltapine® fibers had a significantly lower HVI STR and a significantly greater HVI ELO than PhytoGen fibers. HVI STR is measured by clamping the beard of fibers tightly and applying external force until the fibers break. With applied force, the fibers also stretch or elongate to the point that they break, termed as elongation. However, HVI ELO is not part of the official classification of cotton, even if it is reported in routine HVI tests at laboratories [4,35].
There were statistically insignificant differences in specific HVI and AFIS qualities between the two cotton varieties (Table 1). Mean MIC, UHML, ELO, SFI, neps, L(w), UQL(w), SFC(w), L(n), L5%(n), and IFC decreased from Deltapine® fiber samples to PhytoGen samples. Further, there were noticeable differences for some properties, with distinctions in standard deviation (SD) or coefficient of variation (CV%) between the two varieties. For example, MIC, SFI, neps, SFC(w), SFC(n), fineness, and IFC values of Deltapine® fibers suggested a greater CV% than those of PhytoGen fibers, varying from 15.2 to 80.4 CV% within Deltapine® fibers and from 5.4 to 35.0 among PhytoGen fibers. These results imply that the variability of these properties within Deltapine® fibers were more apparent than those within PhytoGen fibers. In contrast, despite representing statistically significant differences between Deltapine® fibers and PhytoGen fibers, STR and ELO properties did not exhibit a large difference in CV% between the two cotton brands.
There were statistically insignificant differences in the lint turnout, MIR, and CIIR values between the two cotton varieties, but mean MIR increased while mean lint turnout and CIIR reduced from Deltapine® fiber samples to PhytoGen samples. Unlike the small difference found in CV% for lint turnout between the two varieties (3.1 to 5.4), MIR and CIIR values of Deltapine® fibers indicated a greater CV% (18.5 to 18.8) than those of PhytoGen fibers (6.6 to 7.4), suggesting a larger variability of MIR and CIIR indices within Deltapine® fibers than within PhytoGen fibers.

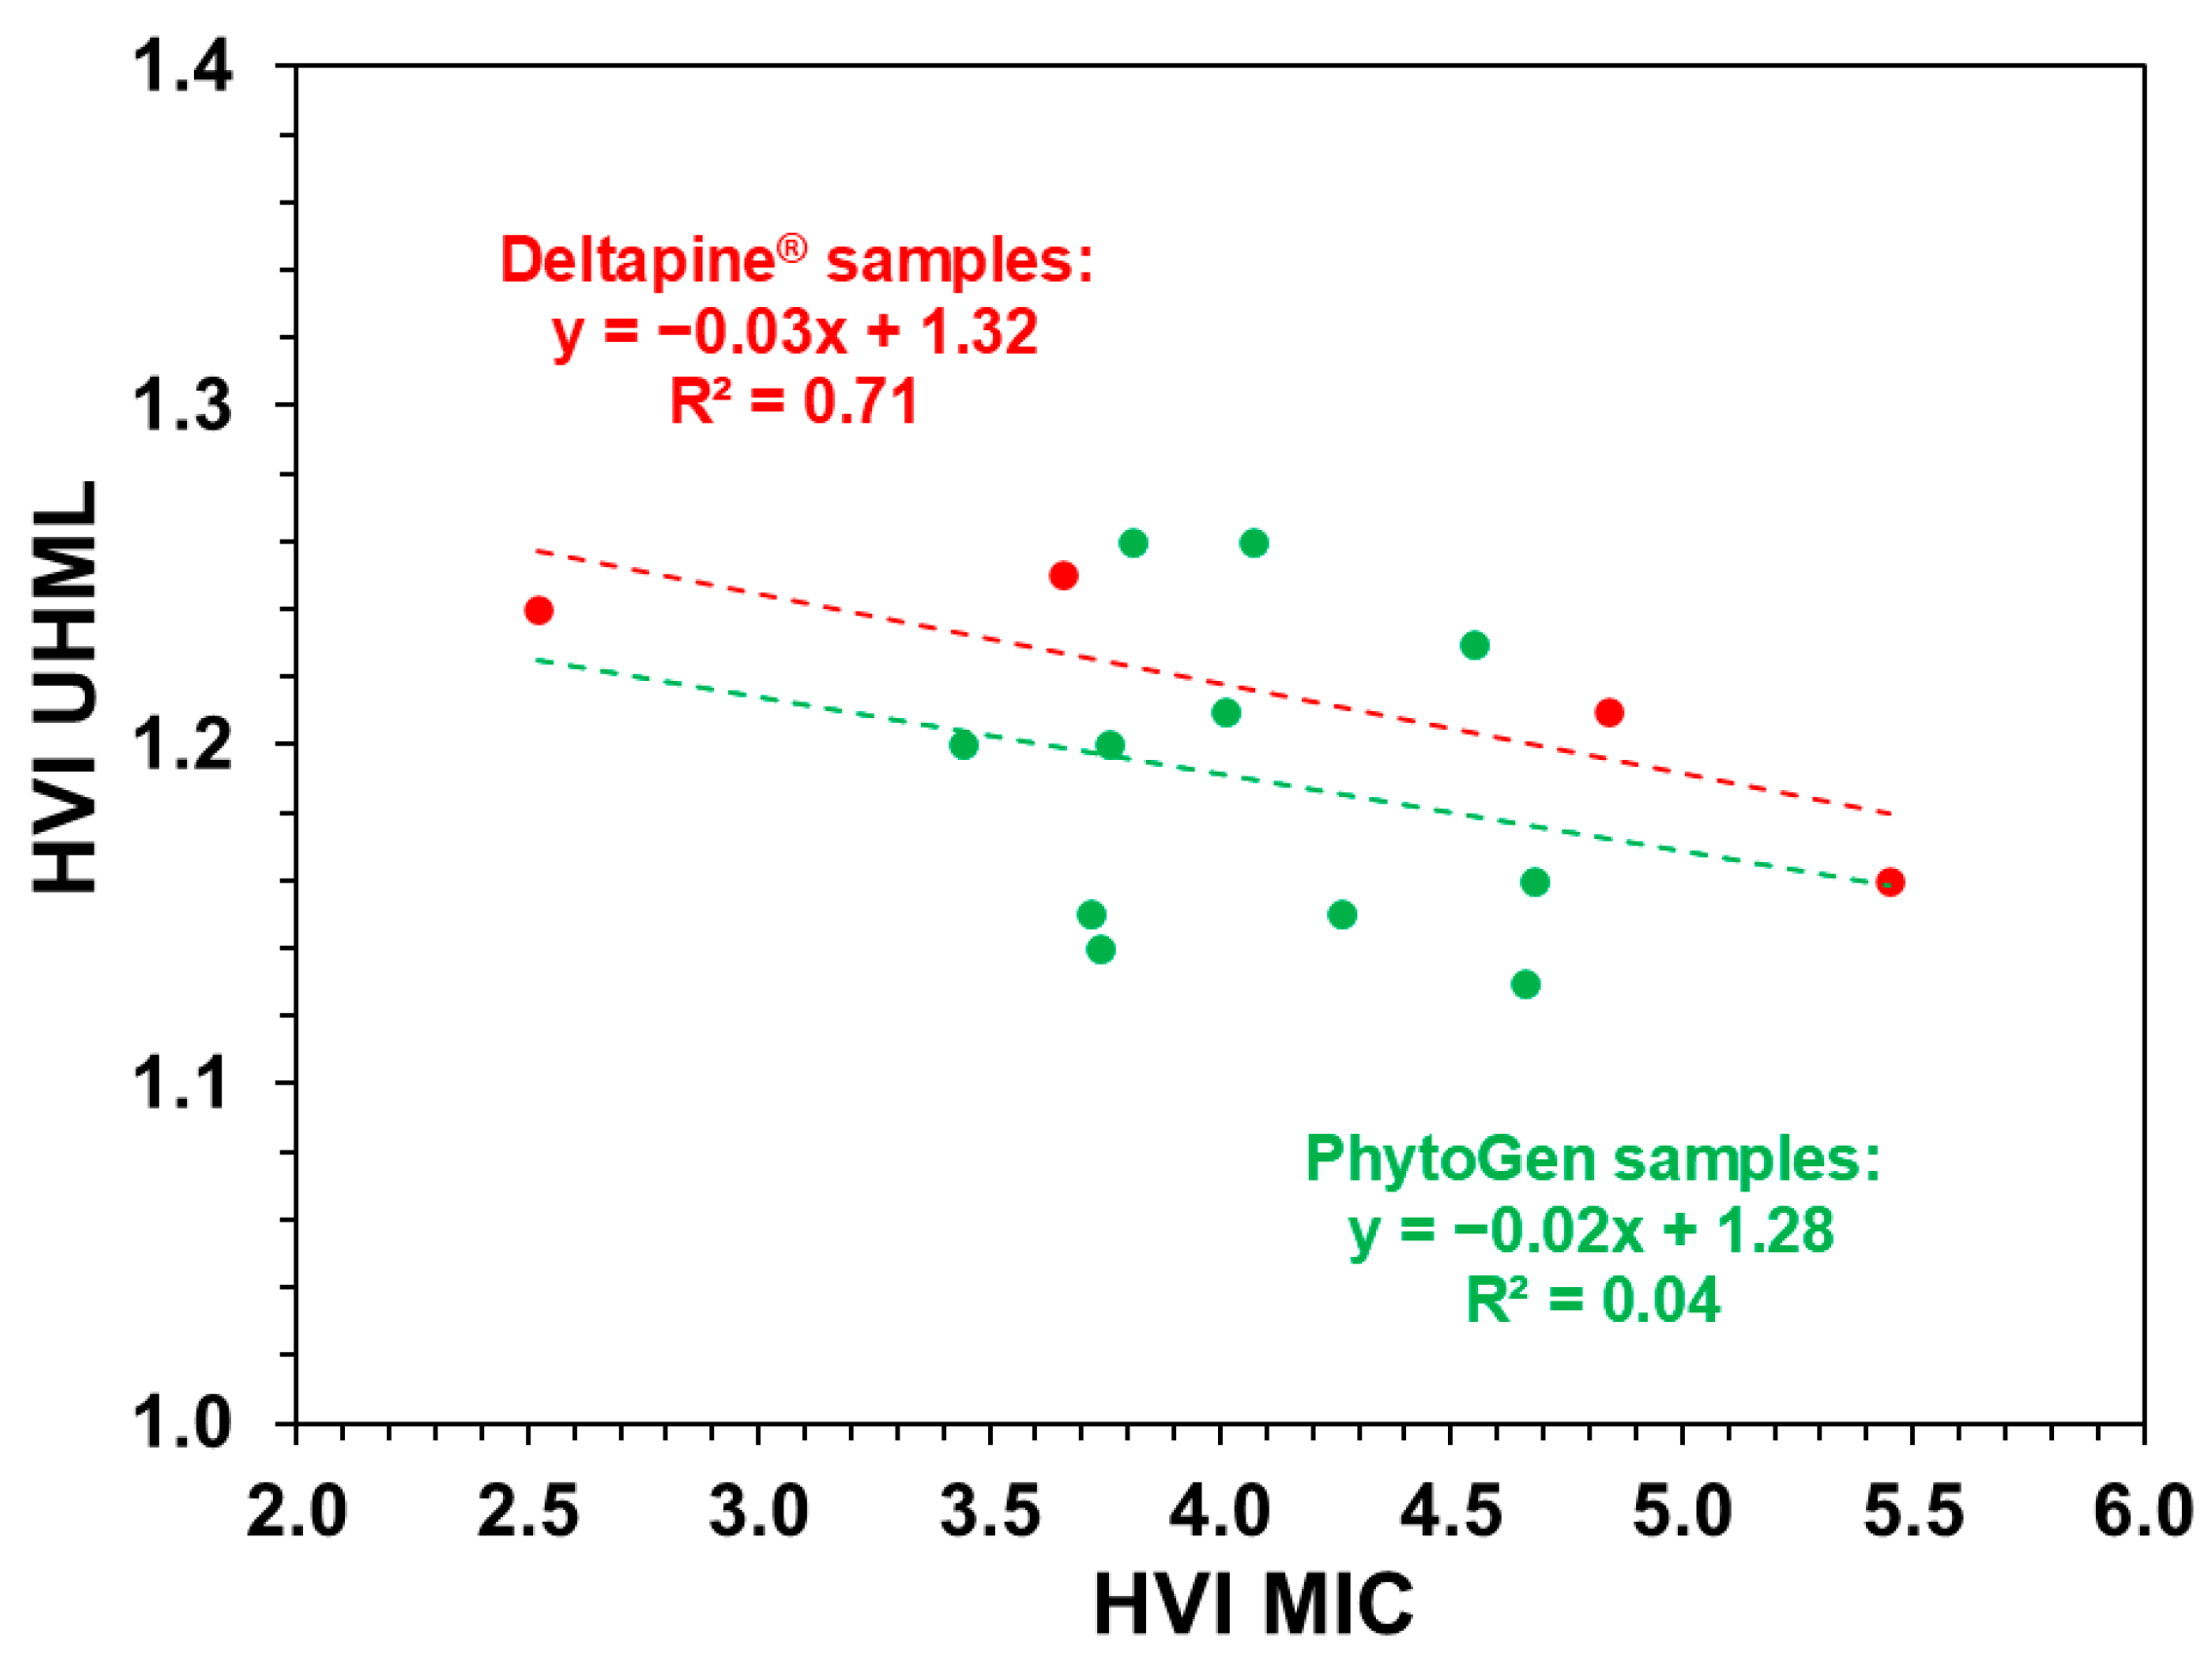
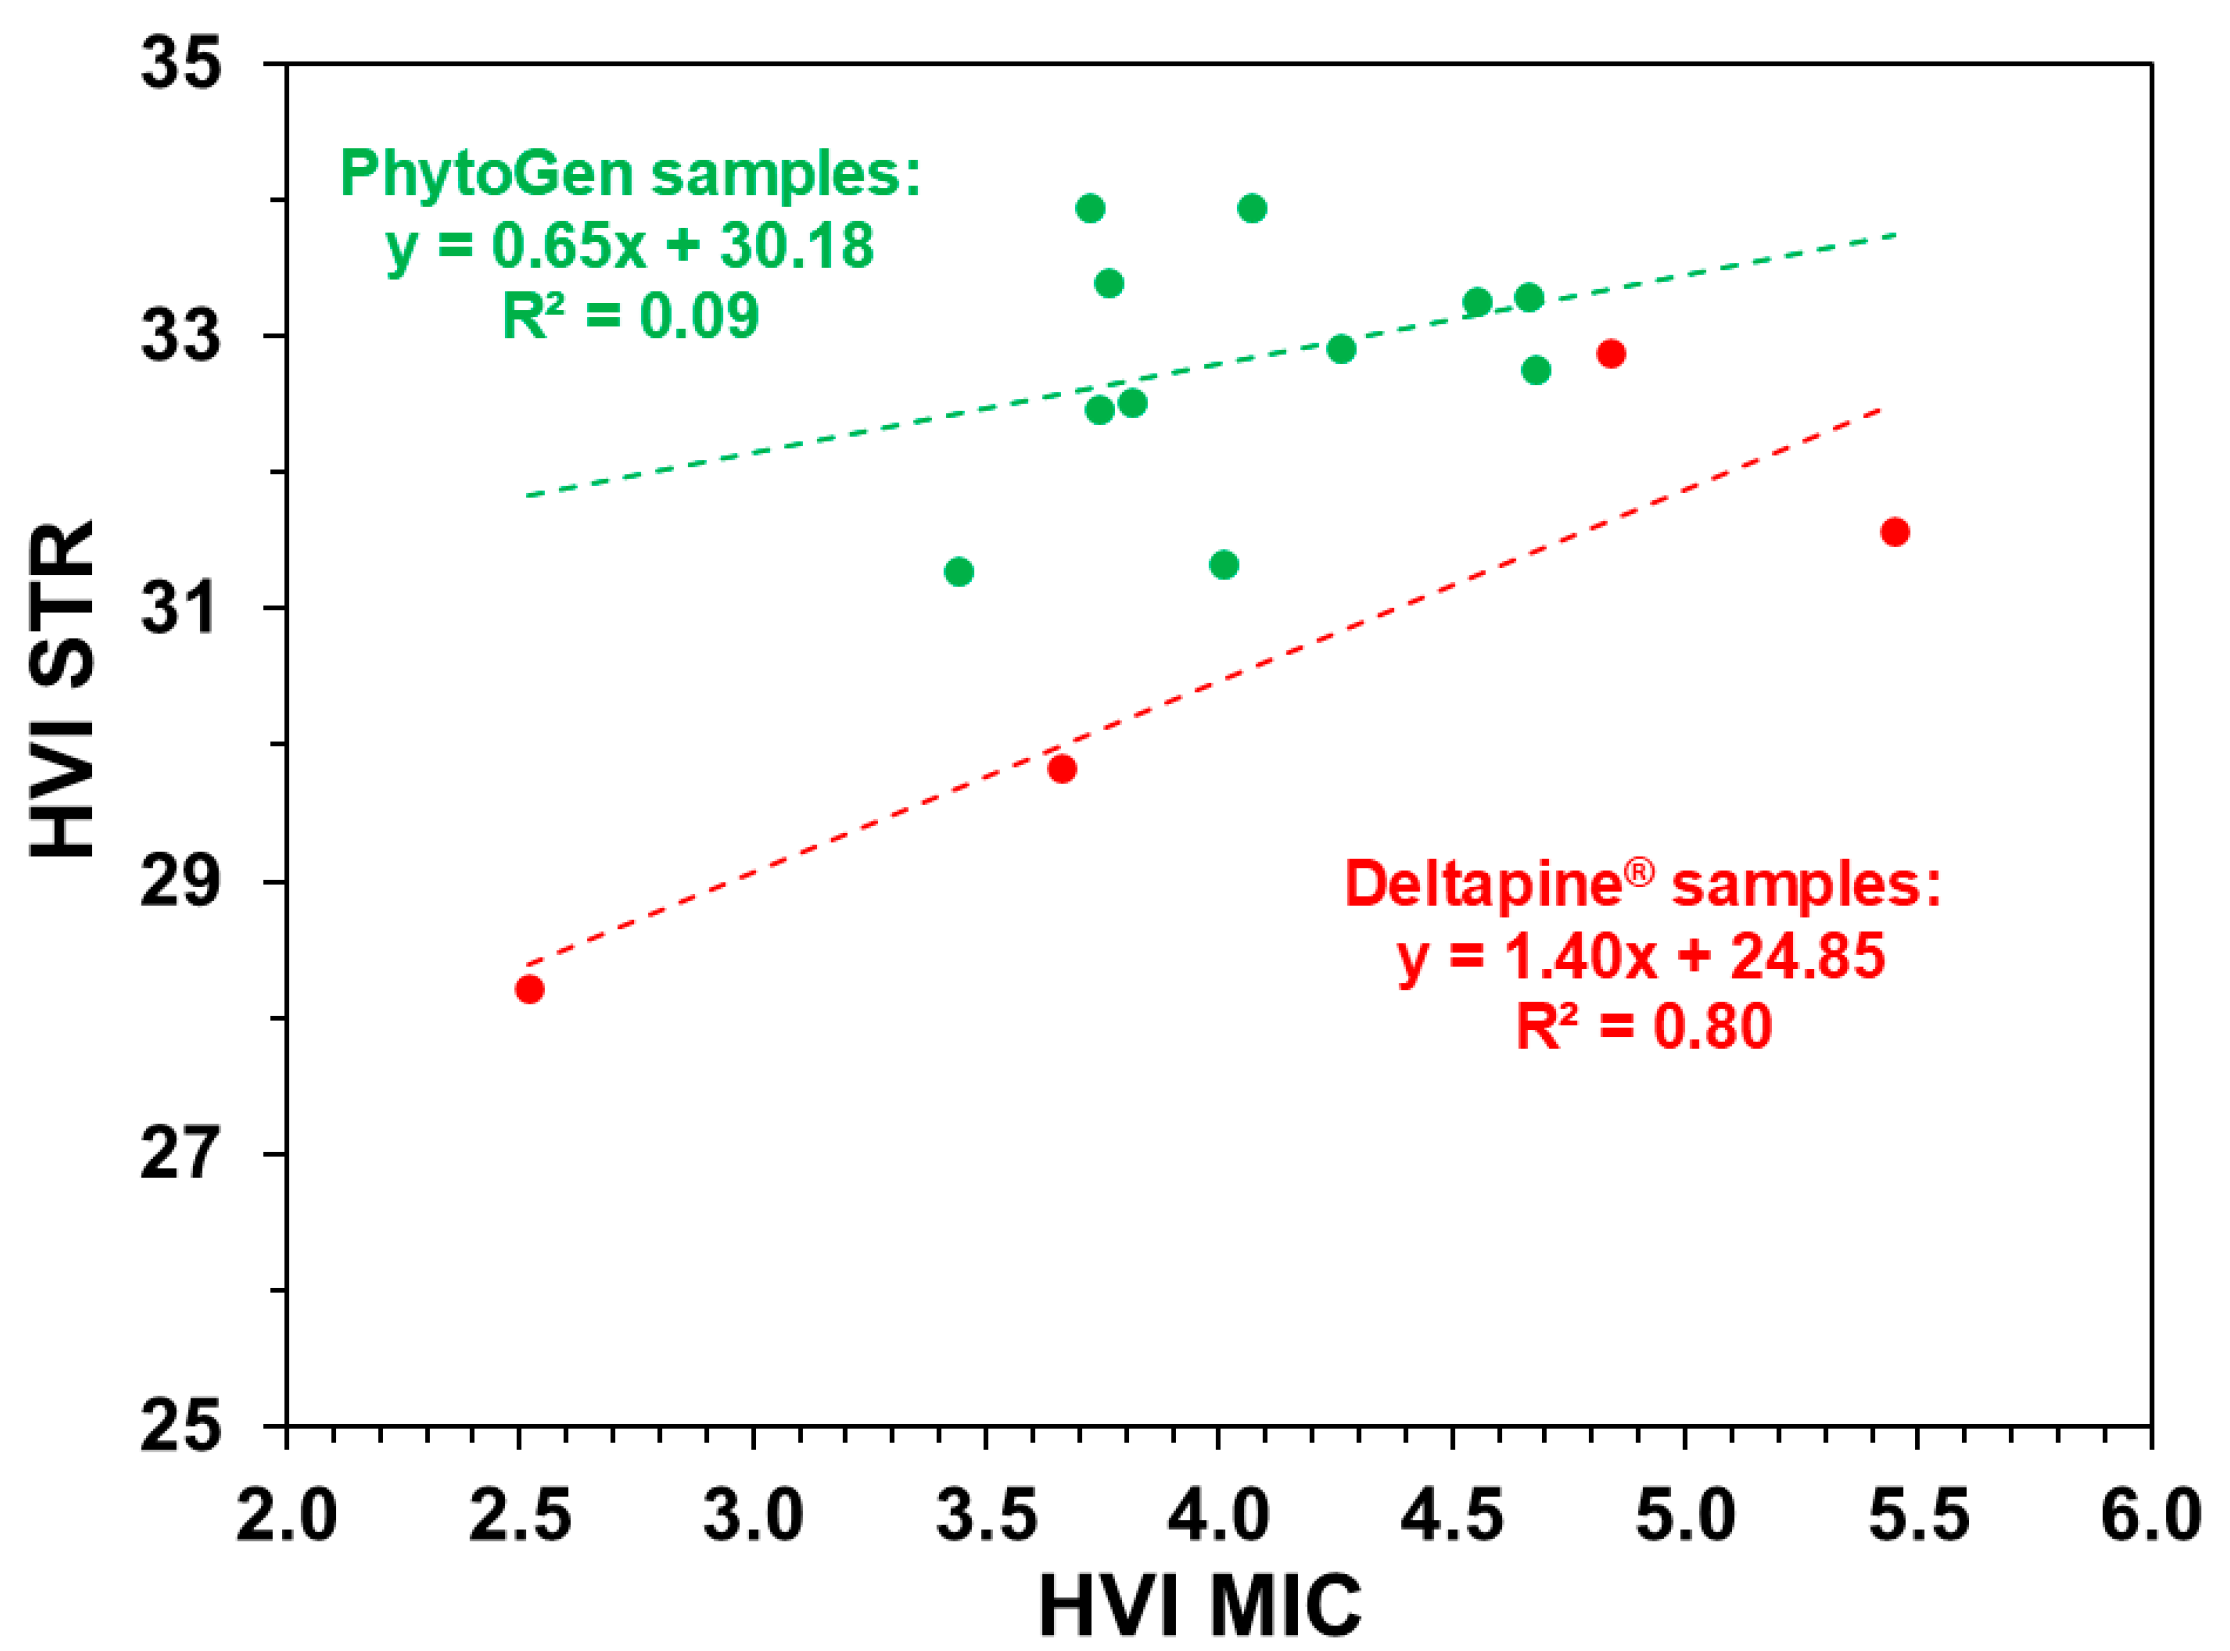
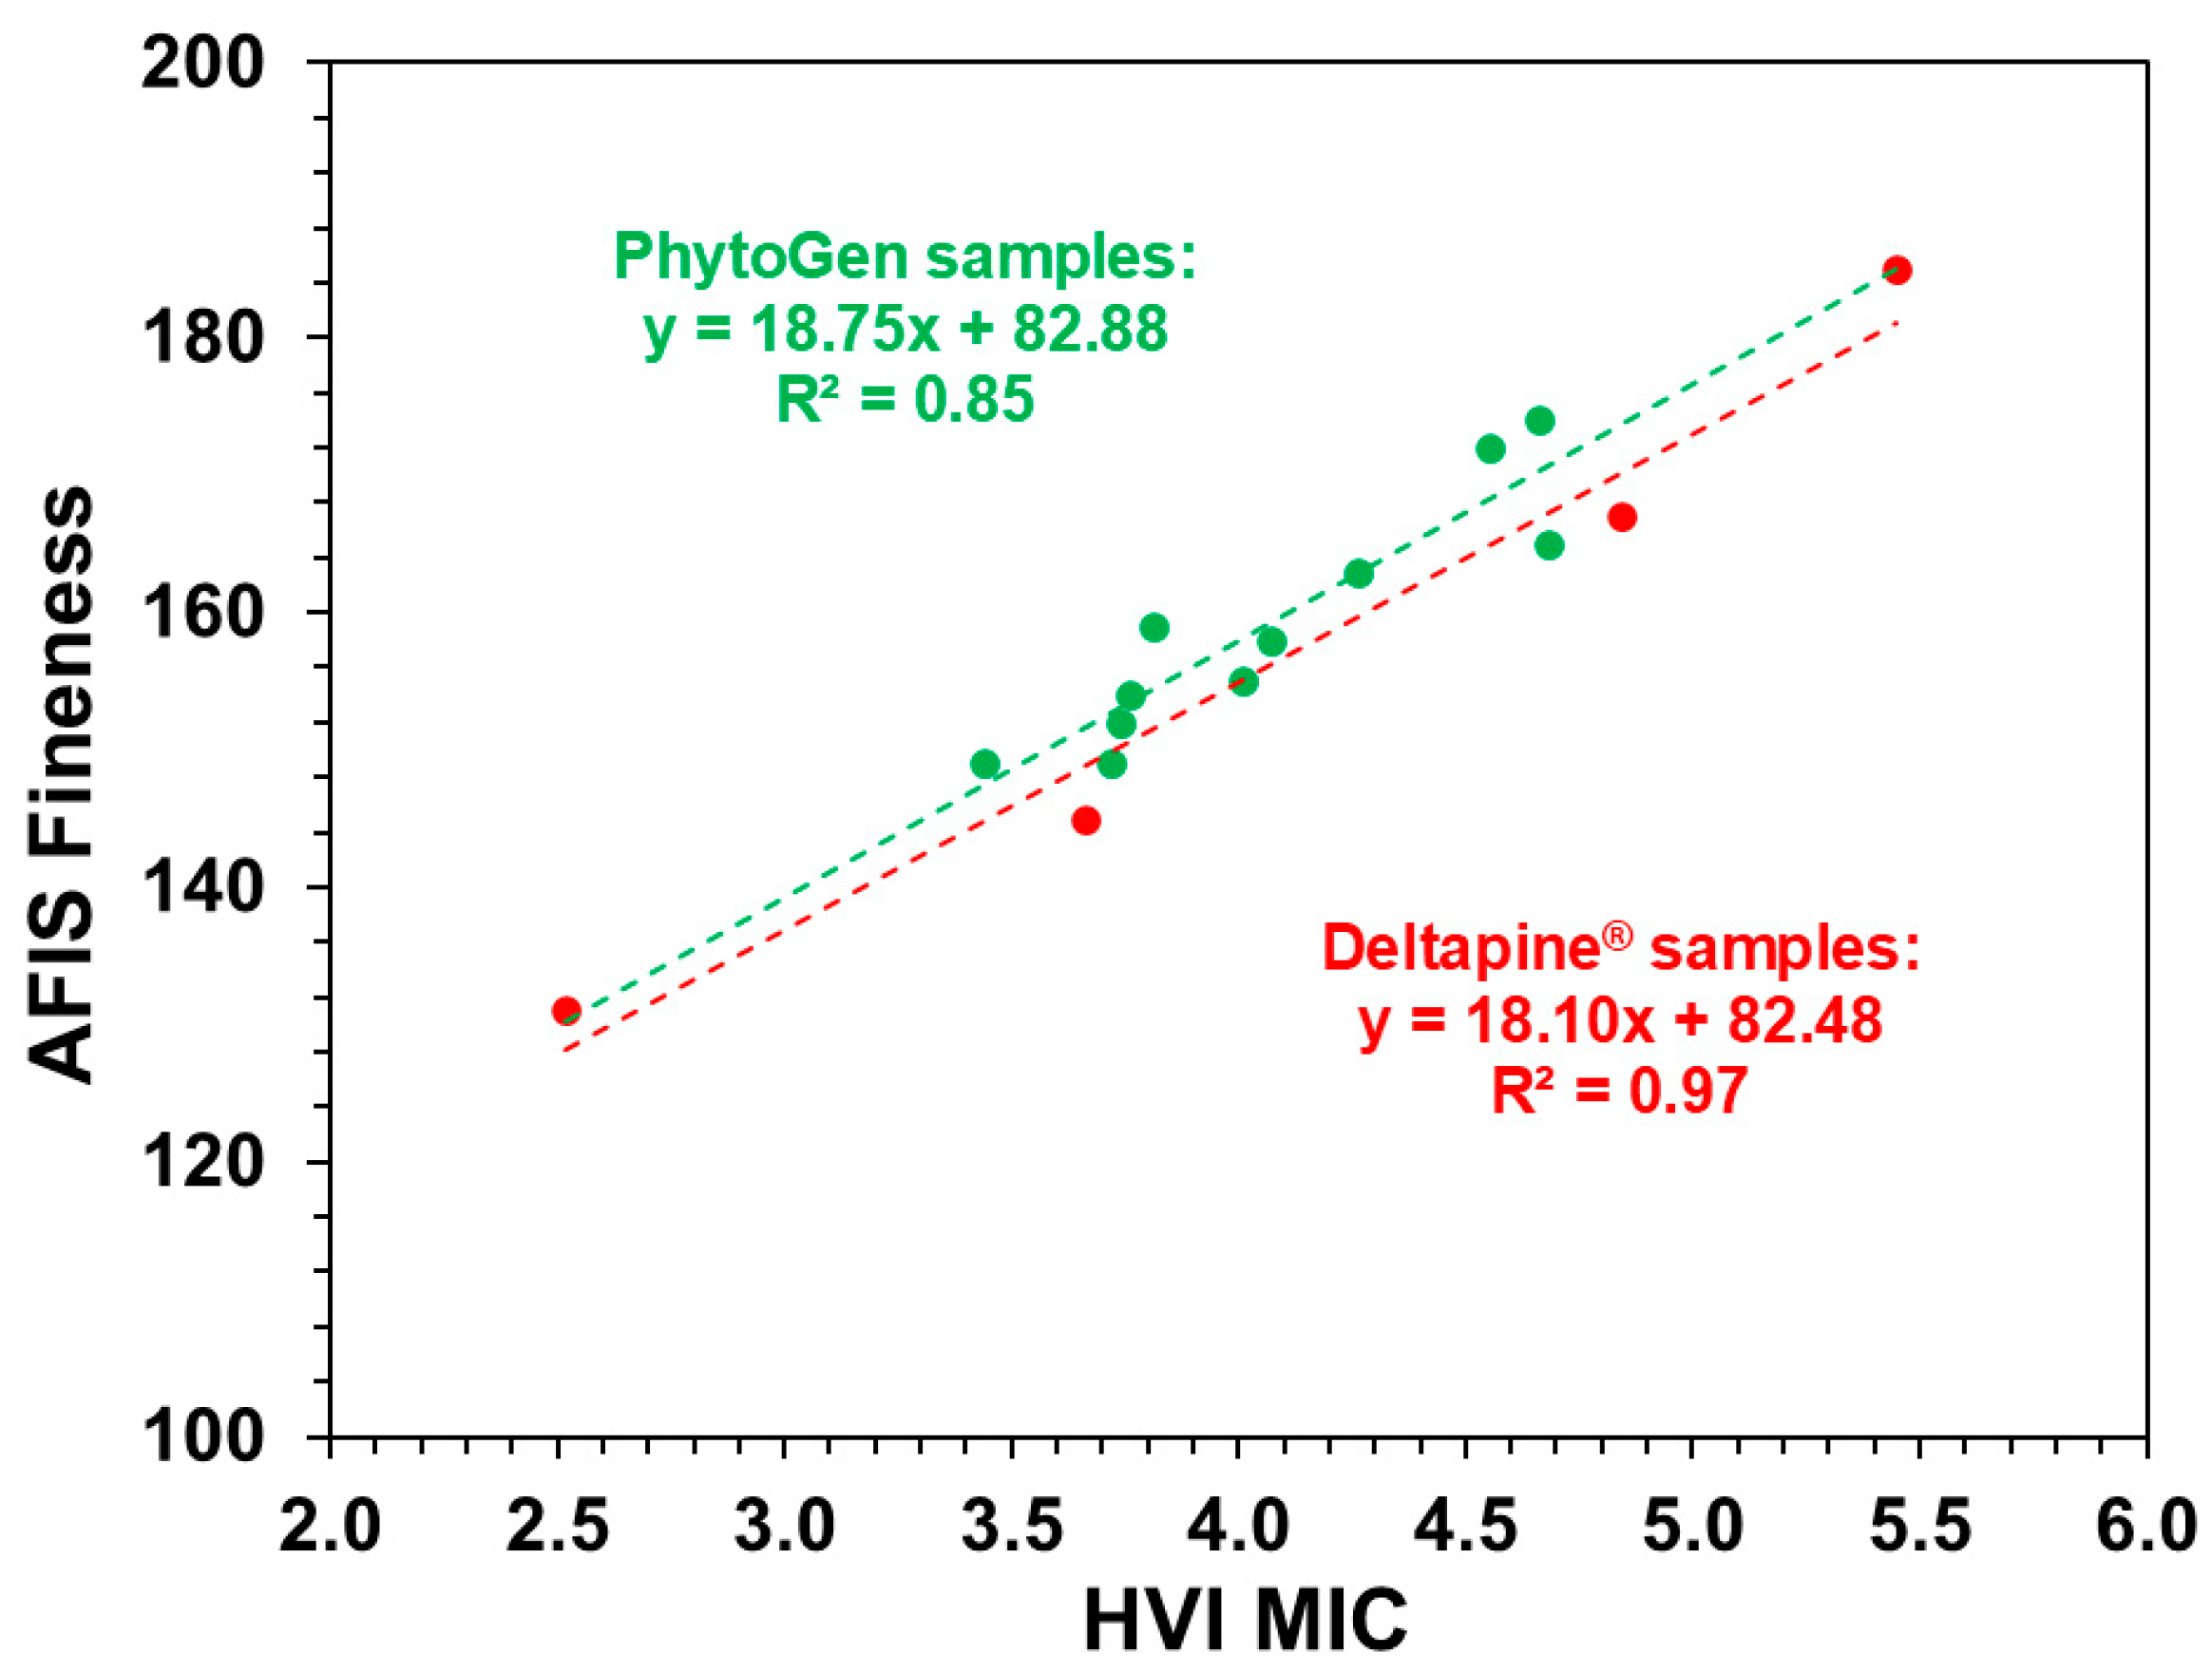
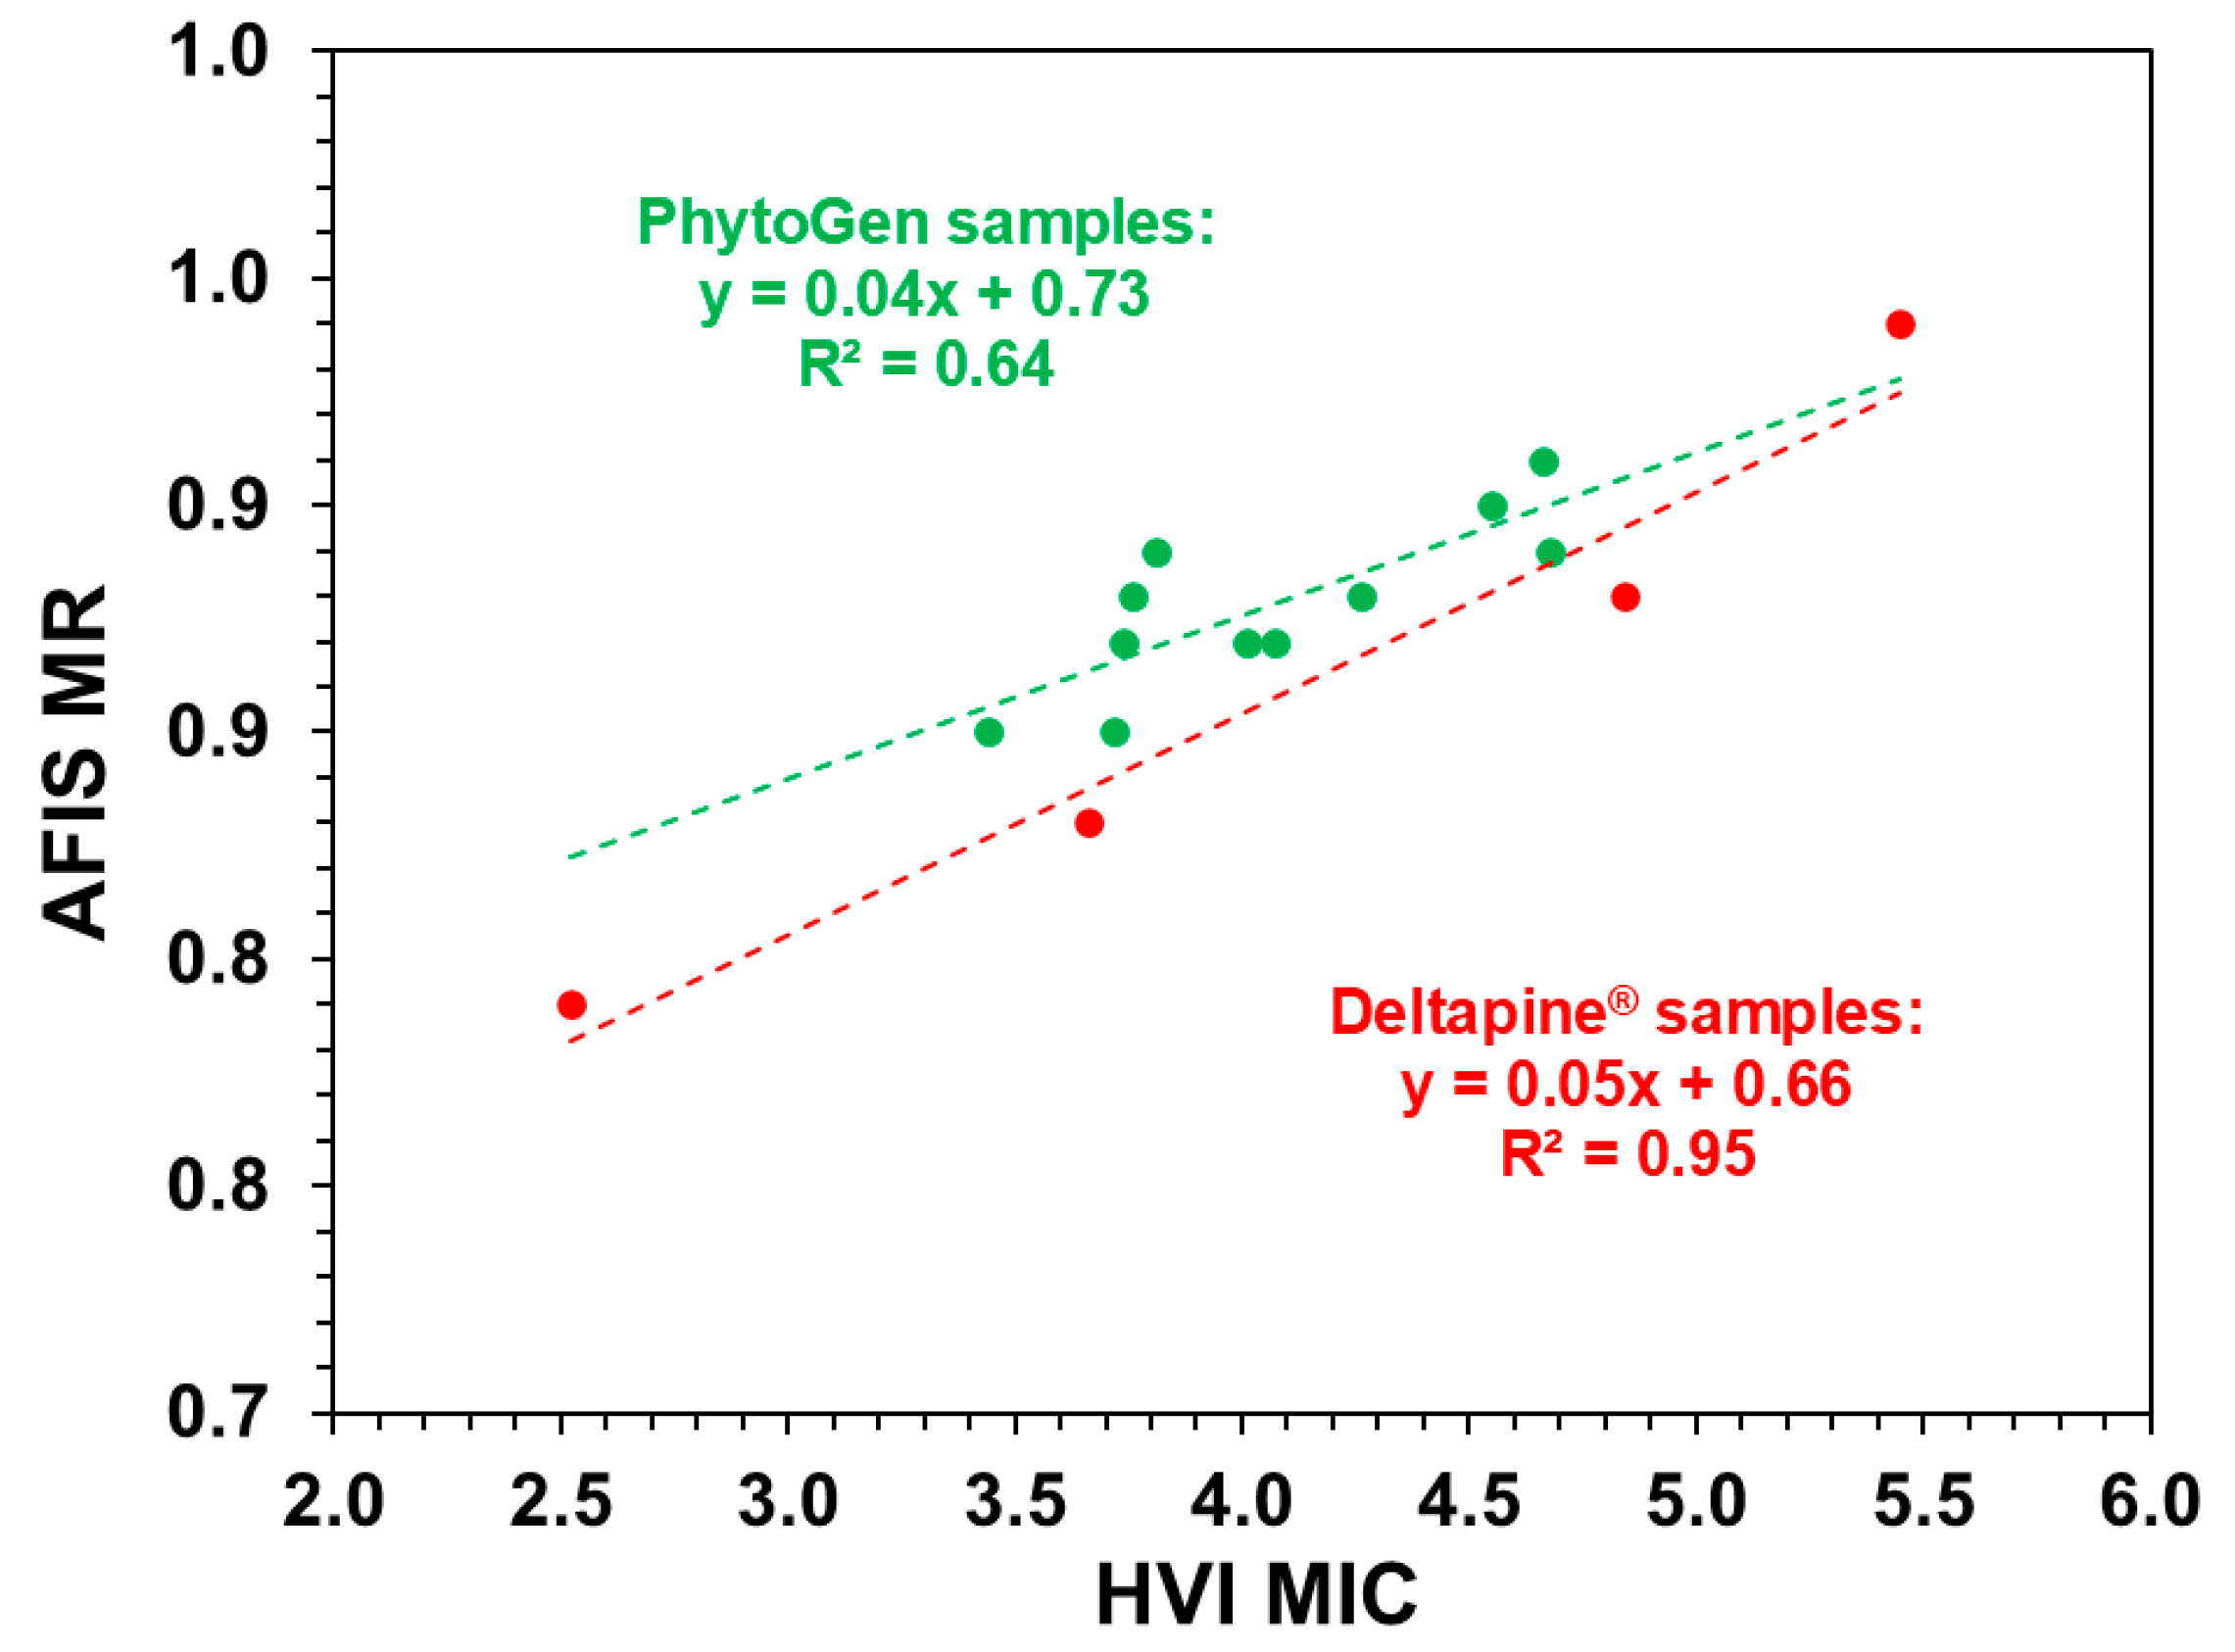
3.2. Correlations of HVI MIC vs. HVI and AFIS Qualities, Lint Turnout, and ATR FT-IR Characteristics Between Two Cotton Varieties

As MIC reflects essential fiber maturity and fineness components simultaneously, it is of interest to compare how MIC is related with other fiber qualities between the two cotton varieties. As given in Table 2, the regression lines of plotting MIC against other HVI indices indicated the variations in the adjusted slope and R2 between two varieties. In general, the adjusted slope revealed a range of less than 0.05 for the pairs of MIC against UHML, UI, and ELO, followed by a range of greater than 0.05 for the pairs of MIC against STR, Rd, +b, and SFI. A lesser slope value might indicate a smaller change in the y-axis variable than in the x-axis variable (i.e., MIC). Hence, UHML, UI, and ELO values, on the y-axis, varied less than STR, Rd, +b, and SFI values in alignment with increasing MIC among both varieties. In other words, UHML, UI, and ELO values of both Deltapine® and PhytoGen fibers were less dependent on MIC, and in contrast, STR, Rd, +b, and SFI values were more associated with MIC progression. Furthermore, negative slopes revealed a decreasing UHML, Rd, and SFI with increasing MIC, while positive slopes suggested an increasing UI, STR, and +b. Meanwhile, five of seven pairs in Table 2 indicated a higher R2 among Deltapine® samples (0.15~0.80) than among PhytoGen fibers (0.01~0.29), likely due to a wider MIC range for the Deltapine® fiber set (2.52~5.45) than for the PhytoGen fiber set (3.44~4.66). Overall, fiber MIC development prior to harvest might benefit fiber STR enhancement and SFI reduction (due to strong fibers), but it could lead to undesired Rd lowering and +b boosting.
On the basis of two correlation lines plotting MIC against other HVI qualities between the two varieties, the analysis of covariance (ANCOVA) results in Table 2 highlight the statistically significant differences in intercept for the pairs of MIC vs. STR and MIC vs. ELO, and insignificant differences in both slope and intercept for other pairs. This observation implies the differing influences of fiber MIC development on STR, ELO, and other HVI qualities between two types of cotton fibers.
Figure 2 and Figure 3 show the selected relationships of MIC vs. UHML and MIC vs. STR between two varieties. Although Figure 2 suggests weak MIC vs. UHML correlations, it hints toward a tendency for UHML to decrease with increasing MIC for the two fiber sets, underscoring the effect of MIC on UHML quality. Interestingly, in Figure 3, the STR of the Deltapine® samples (slope = 1.40) increased more than that of PhytoGen fibers (slope = 0.65) with elevating MIC, indicating more effect of MIC development on the STR of Deltapine® samples than that of PhytoGen fibers. This pattern agrees with a previous report [36], in which three Upland cultivars exhibited an increase in fiber HVIstr along with MIC, but three other cultivars exhibited a decrease in fiber HVIstr with increasing MIC.
Table 3 outlines the correlations between HVI MIC and AFIS qualities, in which L(w), UQL(w), L(n), L5%(n), and MR values of both Deltapine® and PhytoGen fibers are shown to be less dependent on fiber MIC, due to their small absolute adjusted slopes (<0.05), than neps, SFC(w), SFC(n), fineness, and IFC (absolute adjusted slopes > 0.05). Negative slopes revealed a decrease in neps, UQL(w), SFC(w), L5%(n), SFC(n), and IFC with increasing MIC, while positive slopes suggest augmentations in L(w), L(n), and fineness with increasing MIC. Analysis of six pairs involving AFIS lengths and SFCs (i.e., MIC vs. L(w), MIC vs. UQL(w), MIC vs. SFC(w), MIC vs. L(n), MIC vs. L5%(n), and MIC vs. SFC(n)) revealed a higher R2 among Deltapine® samples (0.46~0.93) than among PhytoGen fibers (0.01~0.35), whereas four pairs involving AFIS neps and maturity (i.e., MIC vs. neps, MIC vs. fineness, MIC vs. IFC, and MIC vs. MR) indicated a close R2 despite some differences between Deltapine® samples (0.95~0.97) and PhytoGen fibers (0.59~0.85). Regardless of R2, MIC development led to minimized fiber neps, SFC(w) and SFC(n), and IFC (which wasdesired), but also reduced UQL(w) and L5%(n) (which was not desired). Meanwhile, MIC increment favored fiber length ((L(w) and L(n)), fineness, and MR, although the influences were less for L(w), L(n), and MR, as shown by their small adjusted slopes (<0.05).
The ANCOVA test indicated statistically significant differences in intercept for the three pairs (MIC vs. neps, MIC vs. IFC, and MIC vs. MR) only, implying the different and significant impacts of fiber MIC development on neps, IFC, and MR quality between two varieties. As one example, Figure 4 shows the pattern of neps reduction with MIC for the two varieties, with neps of Deltapine® samples (slope = −151.48) reducing quickly compared to PhytoGen samples (slope = −126.99). Neps are tightly tangled knot-like masses (or clusters) of unorganized fibers, and their presences adversely influence the appearance of cotton yarns and fabrics as well as dyed or printed fabrics [29].
Unlike the lesser effect of fiber varieties (or genotypes) on the relationship of MIC vs. fineness (Figure 5), Figure 6 exhibits a significant effect of varieties on fiber MR, which was accompanied by a larger MR difference when MIC tended to the lower end. These different MR responses might be due to the fact that MR is calculated from the percentages of both mature fiber content (Ɵ ≥ 0.5) and immature fiber content (Ɵ ≤ 0.25) by measuring the fiber shape, whereas fineness is determined by the algorithm based on the shape and form of the fibers and also their specific weight. For given samples with an identical MIC, Deltapine® samples were prone to have smaller fineness and MR values than PhytoGen samples.
Table 4 shows that the lint turnouts of both Deltapine® and PhytoGen fibers were less dependent on fiber MIC (absolute adjusted slopes < 0.05) and that the R2 (0.02~0.04) between lint turnout and MIC was weak, implying fiber MIC development did not prompt fiber lint turnout. On the contrary, positive slopes in Table 4 indicate a synchronous change between either MIR or CIIR and MIC for both Deltapine® and PhytoGen fibers, owing to their positive and great adjusted slopes (≥0.05). The ANCOVA test did not suggest statistically significant differences in intercept or slope for the two pairs (MIC vs. MIR and MIC vs. CIIR), as illustrated in Figure 7, which shows the pattern of MIR increasing with MIC increasing for the two varieties. This observation agrees well with previous studies, which also observed that the average MIR and CIIR values of fibers at a single boll level were highly correlated with fiber MIC [27], and that the mean MIR values of diverse fibers from 104 well-defined reference materials and seed cotton samples were greatly related with fiber MIC [29].

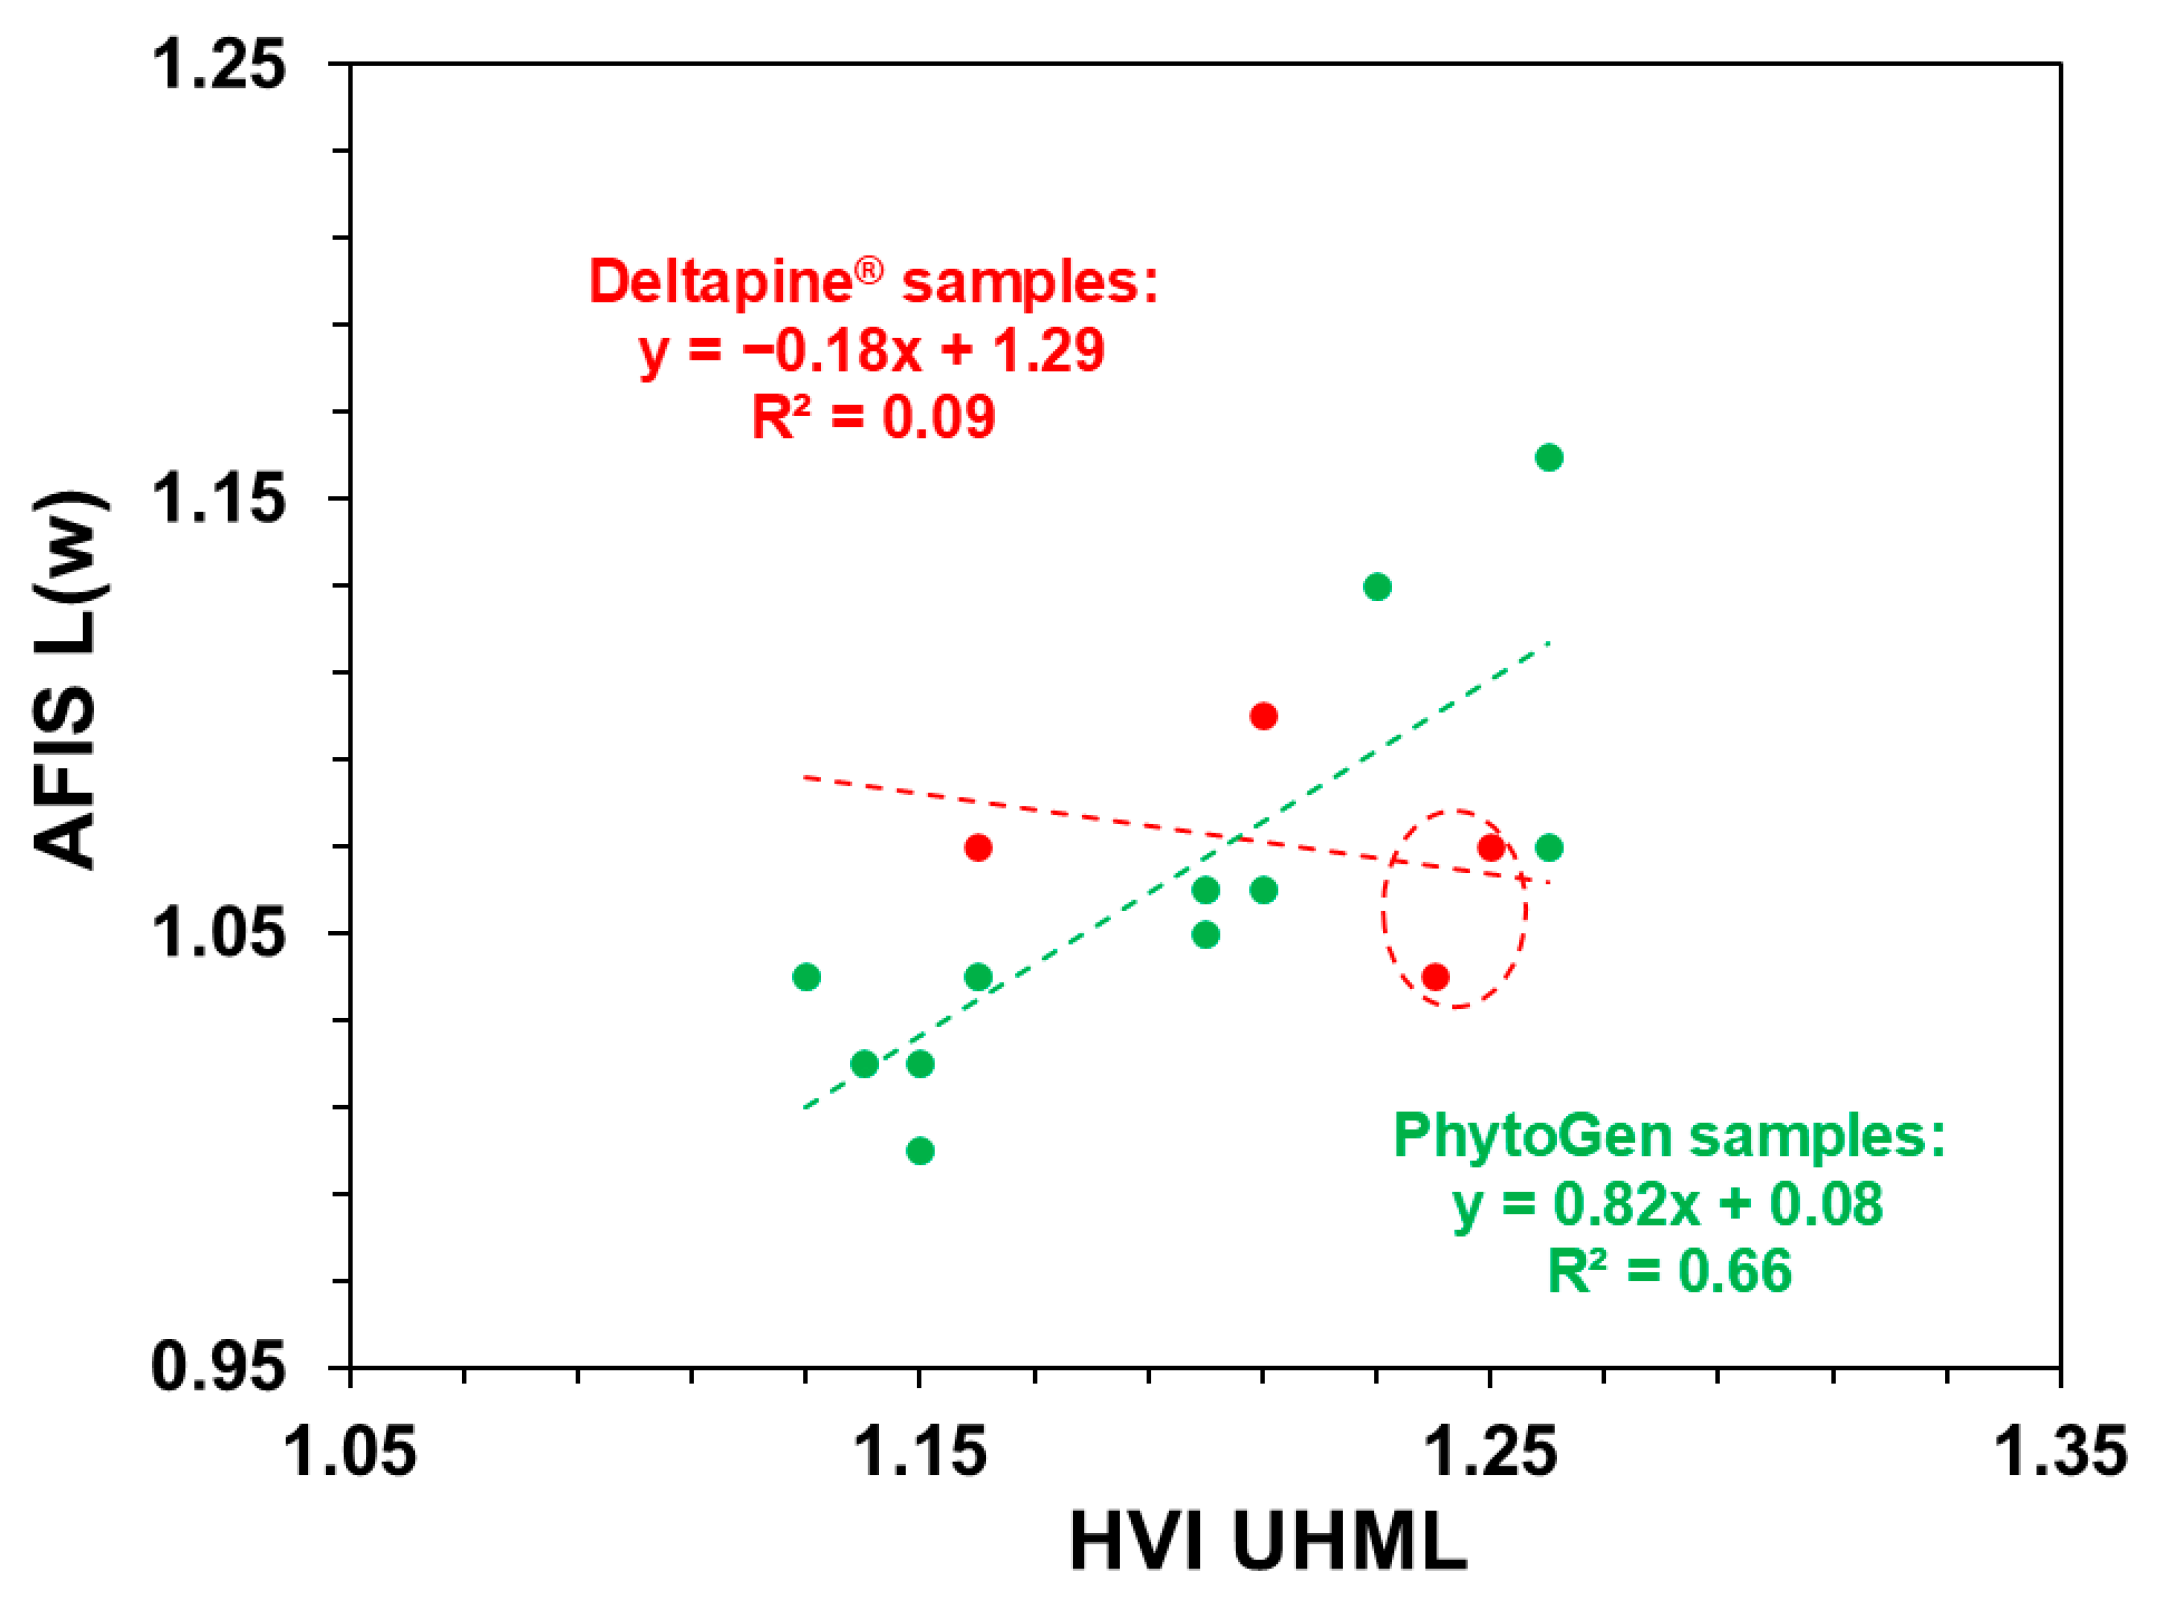
3.3. Correlations of HVI Qualities vs. Relevant AFIS Qualities Between Two Cotton Varieties

Effects of cotton varieties on the correlations between HVI qualities and relevant AFIS properties are tabulated in Table 5. Comparison of HVI UHML to AFIS lengths is of great interest, since HVI UHML determines the fiber length from the fibrogram generated as a result of scanning a fiber beard in which many short fibers may not protrude far enough to be scanned, while AFIS lengths characterize the complete within-sample distribution of all single fibers either by weight or by number. Similar to HVI UHML, which reflects the average length by number of the longer half of the fibers by weight, AFIS UQL(w) characterizes the fiber lengths of the longer 25% of all fibers by weight and L5%(n) measures the fiber lengths of the longer 5% of all fibers by number. Therefore, both positive greater adjusted slopes (0.61~1.03) and high R2s (0.86 to 0.99) between UHML and UQL(w) or L5%(n) respective to those of 0.16 to 0.96 and 0.09 to 0.66 between UHML and L(w) or L(n) were expected. In contrary to a reasonable L(w) or L(n) increase with UHML in PhytoGen fibers due to their positive slopes, L(w) or L(n) decreased with UHML in Deltapine® samples (Figure 8). Further examination revealed that two Deltapine® samples, with a greater UHML but lower L(w) value, had more IFC (8.83% on average) than another two Deltapine® samples (6.08% on average) and all PhytoGen fibers (6.80% on average). The ANCOVA result indicated statistically insignificant differences in slope or intercept for the four pairs (UHML vs. L(w), UHML vs. UQL(w), UHML vs. L(n), and UHML vs. L5%(n)).
Similar to L(w) vs. L(n) possessing positive slopes and moderate R2s of 0.77 to 0.82, the pair (UQL(w) vs. L5%(n)) showed positive slopes, but strong R2s of 0.97 to 0.98. Cotton variety did not affect the correlations of the two pairs, as the quality data were reported by the weight or the number of the fibers in a sample from one measurement.
Independent of cotton varieties, HVI SFI was observed to have both positive slopes (0.20 to 0.22) and moderate R2s (0.38 to 0.56) correlations with SFC(w) and SFC(n), and SFC(w) was also correlated with SFC(n) positively and strongly (R2 = 0.97 to 0.98).
The ANCOVA results did not suggest statistically significant differences in slope and in intercept for the nine pairs in Table 5.

3.4. Implication of Fiber HVI MIC Assessment at Early Stages

Considering the influence of MIC value on cotton market price and its effect on HVI and AFIS qualities, it is of interest to assess fiber MIC even before the application of harvesting aid for premium fiber quality. Notably, direct HVI MIC measurement in seed cottons is not feasible, mainly because it requires at least a 10.0 g fiber sample per measurement (or a minimum 3.24 g sample with the Fibronaire MIC test) that is sourced from multiple ginned seed cotton bolls (approx. 2 g fiber each). The ATR FT-IR method may be an alternative option for estimating fiber MIC from seed cottons to ginned fiber, because of its capability of sampling as little as 0.5 mg fiber directly without the need to remove any cotton seeds first. Linear conversion of MIR to MIC between the two varieties in Figure 7 resembled each other, and the relationship for the combined samples was MIC = 7.65 × MIR − 2.08 with R2 = 0.86, which is nearly identical to the obtained MIC = 7.618 × MIR − 1.589 with R2 = 0.80 for the well-defined 104 reference materials reported by Liu and Delhom [29]. In the analysis, they compared partial least squares (PLS) multivariate regression models and the algorithmic MIR approach in assessing fiber MIC from cotton maturity reference materials to cotton locule fibers, and concluded that the use of the algorithmic MIR approach abstained from re-developing calibration models with new samples. Hence, the FT-IR method possesses good potential for a rapid, non-destructive, and indirect estimation of cotton fiber MIC at any stages, even before fiber harvesting, in remote/breeding locations that are away from a fiber HVI testing laboratory.

4. Conclusions

This study compared how HVI MIC relates to the fiber HVI and AFIS qualities between Deltapine® and PhytoGen upland cotton varieties. Although there were noticeable differences in HVI and AFIS qualities from Deltapine® fiber samples to PhytoGen samples, there were significant differences for HVI STR and ELO between the two varieties. When MIC was correlated with HVI and AFIS data, it was found that MIC values were related with fiber HVI STR positively and also with HVI SFI, AFIS neps, AFIS SFC(w), AFIS SFC(n), and IFC negatively, all of which are desired for optimum fiber quality. Adversely, MIC values were associated with fiber HVI Rd, AFIS UQL(w), and AFIS L5%(n) negatively and also with HVI +b positively, all of which are not desired. Fiber MIC was not clearly connected with lint turnout, but it was greatly correlated with both MIR and CIIR based on ATR FT-IR measurements. This result validated the applicability of the ATR FT-IR spectroscopy method for rapidly assessing fiber MIC properties through an algorithmic MIR approach in early testing at remote sites.
When HVI and AFIS qualities were correlated to examine how relevant properties from HVI and AFIS measurements responded between two cotton varieties, it was found that two pairs (UHML vs. UQL(w) and UHML vs. L5%(n)) showed expected stronger correlations (R2 = 0.86 to 0.99), along with the pairs of UQL(w) vs. L5%(n) and SFC(w) vs. SFC(n) (R2 = 0.97 to 0.98). Meanwhile, HVI SFI was observed to have moderate correlations with SFC(w) and SFC(n) (R2 = 0.38 to 0.56).

Author Contributions

Conceptualization, Y.L.; methodology, Y.L. and D.J.H.; formal analysis, Y.L.; writing—original draft preparation, Y.L.; writing—review and editing, Y.L. and D.J.H. All authors have read and agreed to the published version of the manuscript.

Funding

This research was funded by the USDA-ARS Research Projects #6054-44000-080-00D (14 July 2020 to 13 July 2025).

Data Availability Statement

All data are presented here and are available upon request.

Acknowledgments

The authors wish to acknowledge the ARS Cotton Ginning laboratory (Stoneville, MS, USA) for providing partial seed cotton samples, M Dunn for cotton ginning, and H King for coordinating fiber HVI and AFIS quality measurement. Mention of a product or specific equipment does not constitute a guarantee or warranty by the U.S. Department of Agriculture (USDA) and does not imply its approval to the exclusion of other products that may also be suitable. USDA is an equal opportunity provider and employer.

Conflicts of Interest

The authors declare no conflicts of interest.

Abbreviations

AFISadvanced fiber information system
Area%percentage area
ATR FT-IRattenuated total reflection Fourier transform infrared
+byellowness
CIIRinfrared crystallinity
ELOelongation
HVIhigh volume instrument
IFCimmature fiber content
MICmicronaire
MIRinfrared maturity
MRmaturity ratio
NIRnear infrared
Rdreflectance
SCWsecondary cell wall
SFC(w)short fiber content by weight
SFC(n)short fiber content by number
SFIshort fiber index
STRstrength
UHMLupper-half mean length
UIuniformity index
UQL(w)upper quartile length by weight

References

  1. Robertson, W.; Roberts, B. Integrated crop management for cotton production in the 21st century. In Cotton: Technology for the 21st Century; First International Cotton Advisory Committee: Washington, DC, USA, 2010; pp. 63–98. [Google Scholar]
  2. Bradow, J.M.; Davidonis, G.H. Quantitation of fiber quality and the cotton production-processing interface: A physiologist’s perspective. J. Cotton Sci. 2000, 4, 34–64. [Google Scholar]
  3. Brecke, B.J.; Banks, J.C.; Cothren, J.T. Harvest-aid treatments: Products and application timing. In Cotton Harvest Management: Use and Influence of Harvest Aids; Supak, J.R., Snipes, C.E., Eds.; The Cotton Foundation: Memphis, TN, USA, 2001; pp. 119–142. [Google Scholar]
  4. Delhom, C.D.; Knowlton, J.; Martin, V.B.; Blake, C. The classification of cotton. J. Cotton Sci. 2020, 24, 189–196. [Google Scholar]
  5. Delhom, C.D.; Kelly, B.; Martin, V. Physical properties of cotton fiber and their measurement. In Cotton Fiber: Physics, Chemistry and Biology; Fang, D.D., Ed.; Springer: Cham, Switzerland, 2018; pp. 41–73. [Google Scholar]
  6. Kelly, B.; Abidi, N.; Ethridge, D.; Hequet, E.F. Fiber to fabric. In Cotton, 2nd ed.; Fang, D.D., Percy, R.G., Eds.; American Society of Agronomy, Crop Science Society of America, and Soil Science Society of America: Madison, WI, USA, 2015; pp. 665–744. [Google Scholar]
  7. Kelly, C.M.; Hequet, E.F.; Dever, J.K. Interpretation of AFIS and HVI fiber property measurements in breeding for cotton fiber quality improvement. J. Cotton Sci. 2012, 16, 1–16. [Google Scholar]
  8. Paudel, D.; Hequet, E.; Abidi, N. Evaluation of cotton fiber maturity measurements. Ind. Crop Prod. 2013, 45, 435–441. [Google Scholar]
  9. Lord, E. Air flow through plugs of textile fibers part II. The micronaire test for cotton. J. Text. Inst. 1956, 47, T16–T47. [Google Scholar]
  10. Montalvo, J.G. Relationships between micronaire, fineness and maturity. Part I. Fundamentals. J. Cotton Sci. 2005, 9, 81–88. [Google Scholar]
  11. Gordon, S.; Rodgers, J. Cotton fiber cross-section properties. In Cotton Fibers: Characteristics, Uses and Performance; Gordon, S., Abidi, N., Eds.; Nova Science Publishers, Inc.: New York, NY, USA, 2017; pp. 65–86. [Google Scholar]
  12. Hequet, E.; Wyatt, B.; Abidi, N.; Thibodeaux, D.P. Creation of a set of reference material for cotton fiber maturity measurements. Text. Res. J. 2006, 76, 576–586. [Google Scholar]
  13. Liu, Y.; Thibodeaux, D.; Gamble, G. Development of FTIR spectroscopy in direct, non-destructive, and rapid determination of cotton Fiber maturity. Text. Res. J. 2011, 81, 1559–1567. [Google Scholar]
  14. Liu, Y.; Thibodeaux, D.; Gamble, G.; Bauer, P.; VanDerveer, D. Comparative investigation of Fourier transform infrared (FT-IR) spectroscopy and X-ray diffraction (XRD) in the determination of cotton fiber crystallinity. Appl. Spectrosc. 2012, 66, 983–986. [Google Scholar]
  15. Rodgers, J.; Montalvo, J.; Davidonis, G.; VonHoven, T. Near infrared measurement of cotton fiber micronaire, maturity and finesses—A comparative investigation. Text. Res. J. 2010, 80, 780–793. [Google Scholar]
  16. Rodgers, J.; Zumb, J.; Fortier, C. Measurement comparison of cotton fiber micronaire and its components by portable near infrared spectroscopy instruments. Text. Res. J. 2017, 87, 57–69. [Google Scholar] [CrossRef]
  17. Zumba, J.; Rodgers, J.; Indest, M. Fiber micronaire, fineness, and maturity predictions using NIR spectroscopy instruments on seed cotton and cotton fiber, in and outside the laboratory. J. Cotton Sci. 2017, 21, 247–258. [Google Scholar] [CrossRef]
  18. Long, R.L.; Bange, M.P. Measuring the maturity of unopened cotton bolls with near infrared spectroscopy. J. Near Infrared Spectrosc. 2020, 28, 204–213. [Google Scholar] [CrossRef]
  19. Wang, S.; Zhang, M.; Zhao, Z.; Qiu, X.; Zhang, R. Optical properties and Monte Carlo simulation of cotton fibers with different micronaire. Ind. Crop Prod. 2025, 223, 120254. [Google Scholar] [CrossRef]
  20. Burns, A.; Ciurczak, E.W. (Eds.) Handbook of Near-Infrared Analysis; Marcel Dekker: New York, NY, USA, 2001. [Google Scholar]
  21. Abidi, N.; Cabrales, L.; Haigler, C.H. Changes in the cell wall and cellulose content of developing cotton fibers investigated by FTIR spectroscopy. Carbohydr. Polym. 2014, 100, 9–16. [Google Scholar] [CrossRef]
  22. Wang, H.; Cao, H.; Yang, L. Machine learning-driven multidomain nanomaterial design: From bibliometric analysis to applications. ACS Appl. Nano Mater. 2024, 7, 26579–26600. [Google Scholar] [CrossRef]
  23. Yang, L.; Wang, H.; Leng, D.; Feng, S.; Yang, Y.; Du, Y. Machine learning applications in nanomaterials: Recent advances and future perspectives. Chem. Eng. J. 2024, 500, 15668. [Google Scholar] [CrossRef]
  24. Abidi, N.; Manike, M. X-ray diffraction and FTIR investigations of cellulose deposition during cotton fiber development. Text. Res. J. 2018, 88, 719–730. [Google Scholar] [CrossRef]
  25. Abidi, N.; Cabrales, L.; Hequet, E. Fourier transform infrared spectroscopic approach to the study of the secondary cell wall development in cotton fibers. Cellulose 2010, 17, 309–320. [Google Scholar] [CrossRef]
  26. He, Z.; Nam, S.; Fang, D.D.; Cheng, H.N.; He, J. Surface and thermal characterization of cotton fibers of phenotypes differing in fiber length. Polymers 2021, 13, 994. [Google Scholar] [CrossRef]
  27. Kim, H.-J.; Liu, Y.; Zeng, L. Fourier transform infrared (FT-IR) spectroscopy and simple algorithm analysis for rapid and non-destructive assessment of cotton fiber maturity and crystallinity for plant mapping. Sensors 2024, 24, 2888. [Google Scholar] [CrossRef] [PubMed]
  28. Liu, Y.; Delhom, C.D. Investigation of fiber maturity and crystallinity information in Upland seed cottons by Fourier transform infrared spectroscopy. Text. Res. J. 2023, 93, 2507–2519. [Google Scholar]
  29. Liu, Y.; Delhom, C.D. Investigation of Fourier transform infrared spectroscopy potential in cotton fiber micronaire measurement and distribution. Text. Res. J. 2024, 94, 2178–2188. [Google Scholar] [CrossRef]
  30. Santiago, C.M.; Hinchliffe, D.J. FT-IR examination of the development of secondary cell wall in cotton fibers. Fibers 2015, 3, 30–40. [Google Scholar] [CrossRef]
  31. Averett, L.A.; Griffiths, P.A.; Nishikida, K. Effective path length in attenuated total reflection spectroscopy. Anal. Chem. 2008, 80, 3045–3049. [Google Scholar]
  32. Larkin, P. Infrared and Raman Spectroscopy: Principles and Spectral Interpretation; Elsevier: Amsterdam, The Netherlands, 2011; pp. 27–54. [Google Scholar]
  33. Van der Sluijs, M.H.J. Cotton appearance. In Cotton Fibers: Characteristics, Uses and Performance; Gordon, S., Abidi, N., Eds.; Nova Science Publishers, Inc.: New York, NY, USA, 2017; pp. 135–158. [Google Scholar]
  34. Santiago, C.M.; Von Hoven, T.; Hinchliffe, D.J.; Hron, R. Examination of cotton maturity and maturity distribution using infrared focal plane array imaging system. AATCC J. Res. 2021, 8, 14–24. [Google Scholar]
  35. Mathangadeera, R.W.; Hequet, E.F.; Kelly, B.; Dever, J.K.; Kelly, C.M. Importance of cotton fiber elongation in fiber processing. Ind. Crop Prod. 2020, 147, 112217. [Google Scholar]
  36. Liu, Y. Cotton fiber strength measurement and its relation to structural properties from Fourier transform infrared spectroscopic characterization. Textiles 2024, 4, 126–137. [Google Scholar] [CrossRef]
Figure 1. Representation of normalized ATR FT-IR spectra of cotton fibers with different HVI MIC values and ATR FT-IR band assignments [13,21]. Each spectrum was normalized by dividing the intensity of individual bands in the 1800–600 cm−1 region with the average intensity in this 1800–600 cm−1 region.
Fibers 13 00041 g001
Figure 2. Comparison of HVI MIC vs. HVI UHML correlations between Deltapine® samples and PhytoGen samples.
Fibers 13 00041 g002
Figure 3. Comparison of HVI MIC vs. HVI STR correlations between Deltapine® samples and PhytoGen samples.
Fibers 13 00041 g003
Figure 4. Comparison of HVI MIC vs. AFIS neps correlations between Deltapine® samples and PhytoGen samples.
Fibers 13 00041 g004
Figure 5. Comparison of HVI MIC vs. AFIS fineness correlations between Deltapine® samples and PhytoGen samples.
Fibers 13 00041 g005
Figure 6. Comparison of HVI MIC vs. AFIS MR correlations between Deltapine® samples and PhytoGen samples.
Fibers 13 00041 g006
Figure 7. Comparison of HVI MIC vs. FT-IR MIR correlations between Deltapine® samples and PhytoGen samples.
Fibers 13 00041 g007
Figure 8. Comparison of HVI UHML vs. AFIS L(w) correlations between Deltapine® samples and PhytoGen samples. Encircled 2 Deltapine® samples showed a greater IFC (8.33% to 9.33% with an average of 8.83%) than another two Deltapine® samples (5.27% to 6.90% with a 6.08% in average).
Fibers 13 00041 g008
Table 1. HVI and AFIS qualities, lint turnout, and ATR FT-IR spectral statistics for Deltapine® and PhytoGen cotton brand varieties 1.
Fiber PropertiesDeltapine® VarietiesPhytoGen Varieties
RangeMean ± SD (CV, %)RangeMean ± SD (CV, %)
HVIMIC2.52–5.454.12 ± 1.30 (31.6)3.44–4.664.06 ± 0.42 (10.3)
UHML, in1.16–1.251.22 ± 0.04 (3.3)1.13–1.261.19 ± 0.05 (4.2)
UI, %81.5–85.883.45 ± 1.77 (2.1)82.0–85.083.62 ± 0.87 (1.0)
STR, g/tex28.22–32.8830.63 ± 2.03 (6.6) b31.28–33.9432.83 ± 0.90 (2.7) a
ELO, %5.80–6.105.95 ± 0.13 (2.2) a4.60–5.705.28 ± 0.33 (6.3) b
Rd, %70.2–76.673.4 ± 2.7 (3.7)64.1–78.574.3 ± 4.1 (5.5)
+b5.90–9.107.89 ± 1.42 (18.0)5.90–9.407.89 ± 1.05 (13.3)
SFI, %4.70–7.906.28 ± 1.31 (20.9)4.00–7.206.05 ± 0.92 (15.2)
AFISNeps, gm103–539270 ± 217 (80.4)115–365217 ± 70 (35.0)
L(w), in1.04–1.101.07 ± 0.02 (1.9)1.00–1.161.06 ± 0.05 (4.7)
UQL(w)), in1.25–1.321.29 ± 0.03 (2.3)1.22–1.381.28 ± 0.06 (4.7)
SFC(w), %4.63–9.576.91 ± 2.50 (36.2)4.70–8.906.83 ± 1.36 (19.9)
L(n), in0.80–0.930.86 ± 0.06 (7.0)0.78–0.960.85 ± 0.05 (5.9)
L5%(n), in1.40–1.491.46 ± 0.04 (2.7)1.35–1.571.43 ± 0.07 (4.9)
SFC(n), %17.27–28.5723.18 ± 5.90 (25.5)18.30–28.4723.33 ± 3.34 (14.3)
Fineness, mTex131.0–185.0157.0 ± 23.8 (15.2)149.0–174.0159.1 ± 8.6 (5.4)
IFC, %5.27–9.337.46 ± 1.77 (23.7)5.67–7.576.79 ± 0.56 (8.2)
MR0.79–0.940.86 ± 0.06 (7.0)0.85–0.910.88 ± 0.02 (2.3)
Lint turnout, %41.3–44.142.5 ± 1.3 (3.1)38.5–44.941.4 ± 2.2 (5.4)
FT-IRMIR0.58–0.930.80 ± 0.15 (18.8)0.72–0.900.81 ± 0.06 (7.4)
CIIR63.5–100.082.1 ± 15.2 (18.5)73.4–90.881.3 ± 5.4 (6.6)
1 Mean is the average of multiple samples within each cotton variety. Lowercase letters (a, b) indicate that values in the same row are significantly different (p ≤ 0.05); where no letter is present there are no differences.
Table 2. Correlations between MIC (x-axis) and other HVI qualities (y-axis) between Deltapine® fibers and PhytoGen fibers (adjusted slope = slope/average (x-axis + y-axis)).
MIC vs. HVI QualityAdjusted SlopeR2ANCOVA
MIC vs. UHMLDeltapine® fibers −0.010.710.92 (Slope)
PhytoGen fibers −0.010.040.32 (Intercept)
MIC vs. UI Deltapine® fibers 0.020.430.81 (Slope)
PhytoGen fibers 0.020.290.70 (Intercept)
MIC vs. STRDeltapine® fibers 0.080.80.38 (Slope)
PhytoGen fibers 0.040.09<0.01 (Intercept)
MIC vs. ELODeltapine® fibers −0.010.570.76 (Slope)
PhytoGen fibers 00.01<0.01 (Intercept)
MIC vs. RdDeltapine® fibers −0.020.150.29 (Slope)
PhytoGen fibers −0.110.210.78 (Intercept)
MIC vs. +bDeltapine® fibers 0.170.841.00 (Slope)
PhytoGen fibers 0.170.160.92 (Intercept)
MIC vs. SFIDeltapine® fibers −0.130.460.71 (Slope)
PhytoGen fibers −0.070.020.66 (Intercept)
Table 3. Correlations between HVI MIC (x-axis) and AFIS qualities (y-axis) between Deltapine® fibers and PhytoGen fibers (adjusted slope = slope/average (x-axis + y-axis)).
HVI MIC vs. AFIS QualityAdjusted SlopeR2ANCOVA
MIC vs. nepsDeltapine® fibers −1.110.970.56 (Slope)
PhytoGen fibers−1.150.590.04 (Intercept)
MIC vs. L(w) Deltapine® fibers 0.010.530.92 (Slope)
PhytoGen fibers 0.010.010.70 (Intercept)
MIC vs. UQL(w)Deltapine® fibers −0.010.930.77 (Slope)
PhytoGen fibers −0.010.060.59 (Intercept)
MIC vs. SFC(w)Deltapine® fibers −0.330.911.00 (Slope)
PhytoGen fibers −0.350.350.78 (Intercept)
MIC vs. L(n)Deltapine® fibers 0.020.751.00 (Slope)
PhytoGen fibers 0.020.110.84 (Intercept)
MIC vs. L5%(n)Deltapine® fibers −0.010.80.75 (Slope)
PhytoGen fibers −0.020.080.37 (Intercept)
MIC vs. SFC(n) Deltapine® fibers −0.30.460.92 (Slope)
PhytoGen fibers −0.320.021.00 (Intercept)
MIC vs. finenessDeltapine® fibers 0.220.970.84 (Slope)
PhytoGen fibers 0.230.850.17 (Intercept)
MIC vs. IFCDeltapine® fibers −1.330.950.57 (Slope)
PhytoGen fibers −1.120.72<0.01 (Intercept)
MIC vs. MRDeltapine® fibers 0.020.950.28 (Slope)
PhytoGen fibers0.010.640.02 (Intercept)
Table 4. Correlations between HVI MIC (x-axis) and lint turnout and also ATF FT-IR analysis (y-axis) between Deltapine® fibers and PhytoGen fibers (adjusted slope = slope/average (x-axis + y-axis)).
HVI MIC vs. Adjusted SlopeR2ANCOVA
Lint Turnout and FT-IR Analysis
MIC vs. Lint turnoutDeltapine® fibers −0.030.040.66 (Slope)
PhytoGen fibers 0.010.020.38 (Intercept)
MIC vs. MIRDeltapine® fibers 0.060.910.92 (Slope)
PhytoGen fibers 0.050.750.63 (Intercept)
MIC vs. CIIRDeltapine® fibers 0.260.890.84 (Slope)
PhytoGen fibers 0.240.660.92 (Intercept)
Table 5. Correlations between HVI or AFIS (x-axis) and AFIS qualities (y-axis) between Deltapine® fibers and PhytoGen fibers (adjusted slope = slope/average (x-axis + y-axis)).
HVI or AFIS vs. AFIS QualitiesAdjusted SlopeR2ANCOVA
UHML vs. L(w)Deltapine® fibers −0.160.090.06 (Slope)
PhytoGen fibers 0.730.660.81 (Intercept)
UHML vs. UQL(w) Deltapine® fibers 0.610.990.21 (Slope)
PhytoGen fibers 0.920.890.32 (Intercept)
UHML vs. L(n)Deltapine® fibers −0.960.440.06 (Slope)
PhytoGen fibers 0.550.291.00 (Intercept)
UHML vs. L5%(n)Deltapine® fibers 0.780.990.46 (Slope)
PhytoGen fibers 1.030.860.92 (Intercept)
L(w) vs. L(n)Deltapine® fibers 2.250.770.07 (Slope)
PhytoGen fibers 0.970.820.81 (Intercept)
UQL(w) vs. L5%(n)Deltapine® fibers 1.090.980.49 (Slope)
PhytoGen fibers 0.970.970.09 (Intercept)
SFI vs. SFC(w)Deltapine® fibers 0.220.560.87 (Slope)
PhytoGen fibers 0.20.40.78 (Intercept)
SFI vs. SFC(n)Deltapine® fibers 0.220.520.89 (Slope)
PhytoGen fibers 0.20.380.89 (Intercept)
SFC(w) vs. SFC(n)Deltapine® fibers 0.160.980.72 (Slope)
PhytoGen fibers 0.160.970.41 (Intercept)
Disclaimer/Publisher’s Note: The statements, opinions and data contained in all publications are solely those of the individual author(s) and contributor(s) and not of MDPI and/or the editor(s). MDPI and/or the editor(s) disclaim responsibility for any injury to people or property resulting from any ideas, methods, instructions or products referred to in the content.

