Highlights
- This study provides a comprehensive review of the geometrical characterization of stochastic fibrous networks, combining results from the literature with original research findings.
- This review focuses on the main parameters used to describe such networks, including basis weight, orientation distribution function, crimp, porosity, spatial distribution of fibres, and fibre intersections.
Abstract
Fibrous networks are porous materials that can have stochastic and uniform microstructures. Various fibrous networks can be found in nature (e.g., collagens, hydrogels, etc.) or manufactured (e.g., composites and nonwovens). This study focuses on the geometrical characterisation of stochastic fibrous networks with continuous fibres in a 2D domain, discussing their main relevant parameters: basis weight, orientation distribution function, crimp, porosity, spatial distribution of fibres (uniformity), and fibre intersections. The comprehensive review of the literature is combined with original results to understand the effect of the analysed parameters on various features of fibrous networks such as mechanical performance, filtration, insulation, etc.
1. Introduction
Fibrous networks are common materials characterised by their discrete microstructures formed by constituent fibres, with nonwovens being a typical example. In contrast to continuous microstructures such as metals, etc., the discontinuous microstructures of fibrous networks make them porous materials. The type of this porosity, defined by the microstructure, affects several performance parameters of fibrous networks, e.g., mechanical performance, filtration, insulation, etc. Therefore, an adequate understanding of the microstructure of such networks is key to the assessment and optimisation of their performance parameters. To achieve this, various geometric parameters are proposed in the literature to characterise their microstructures, e.g., basis weight, orientation distribution function (ODF), crimp, spatial distribution of fibres (uniformity), porosity, and fibre-to-fibre interactions; they are summarised in this analysis based on nonwoven fibrous networks as an example.
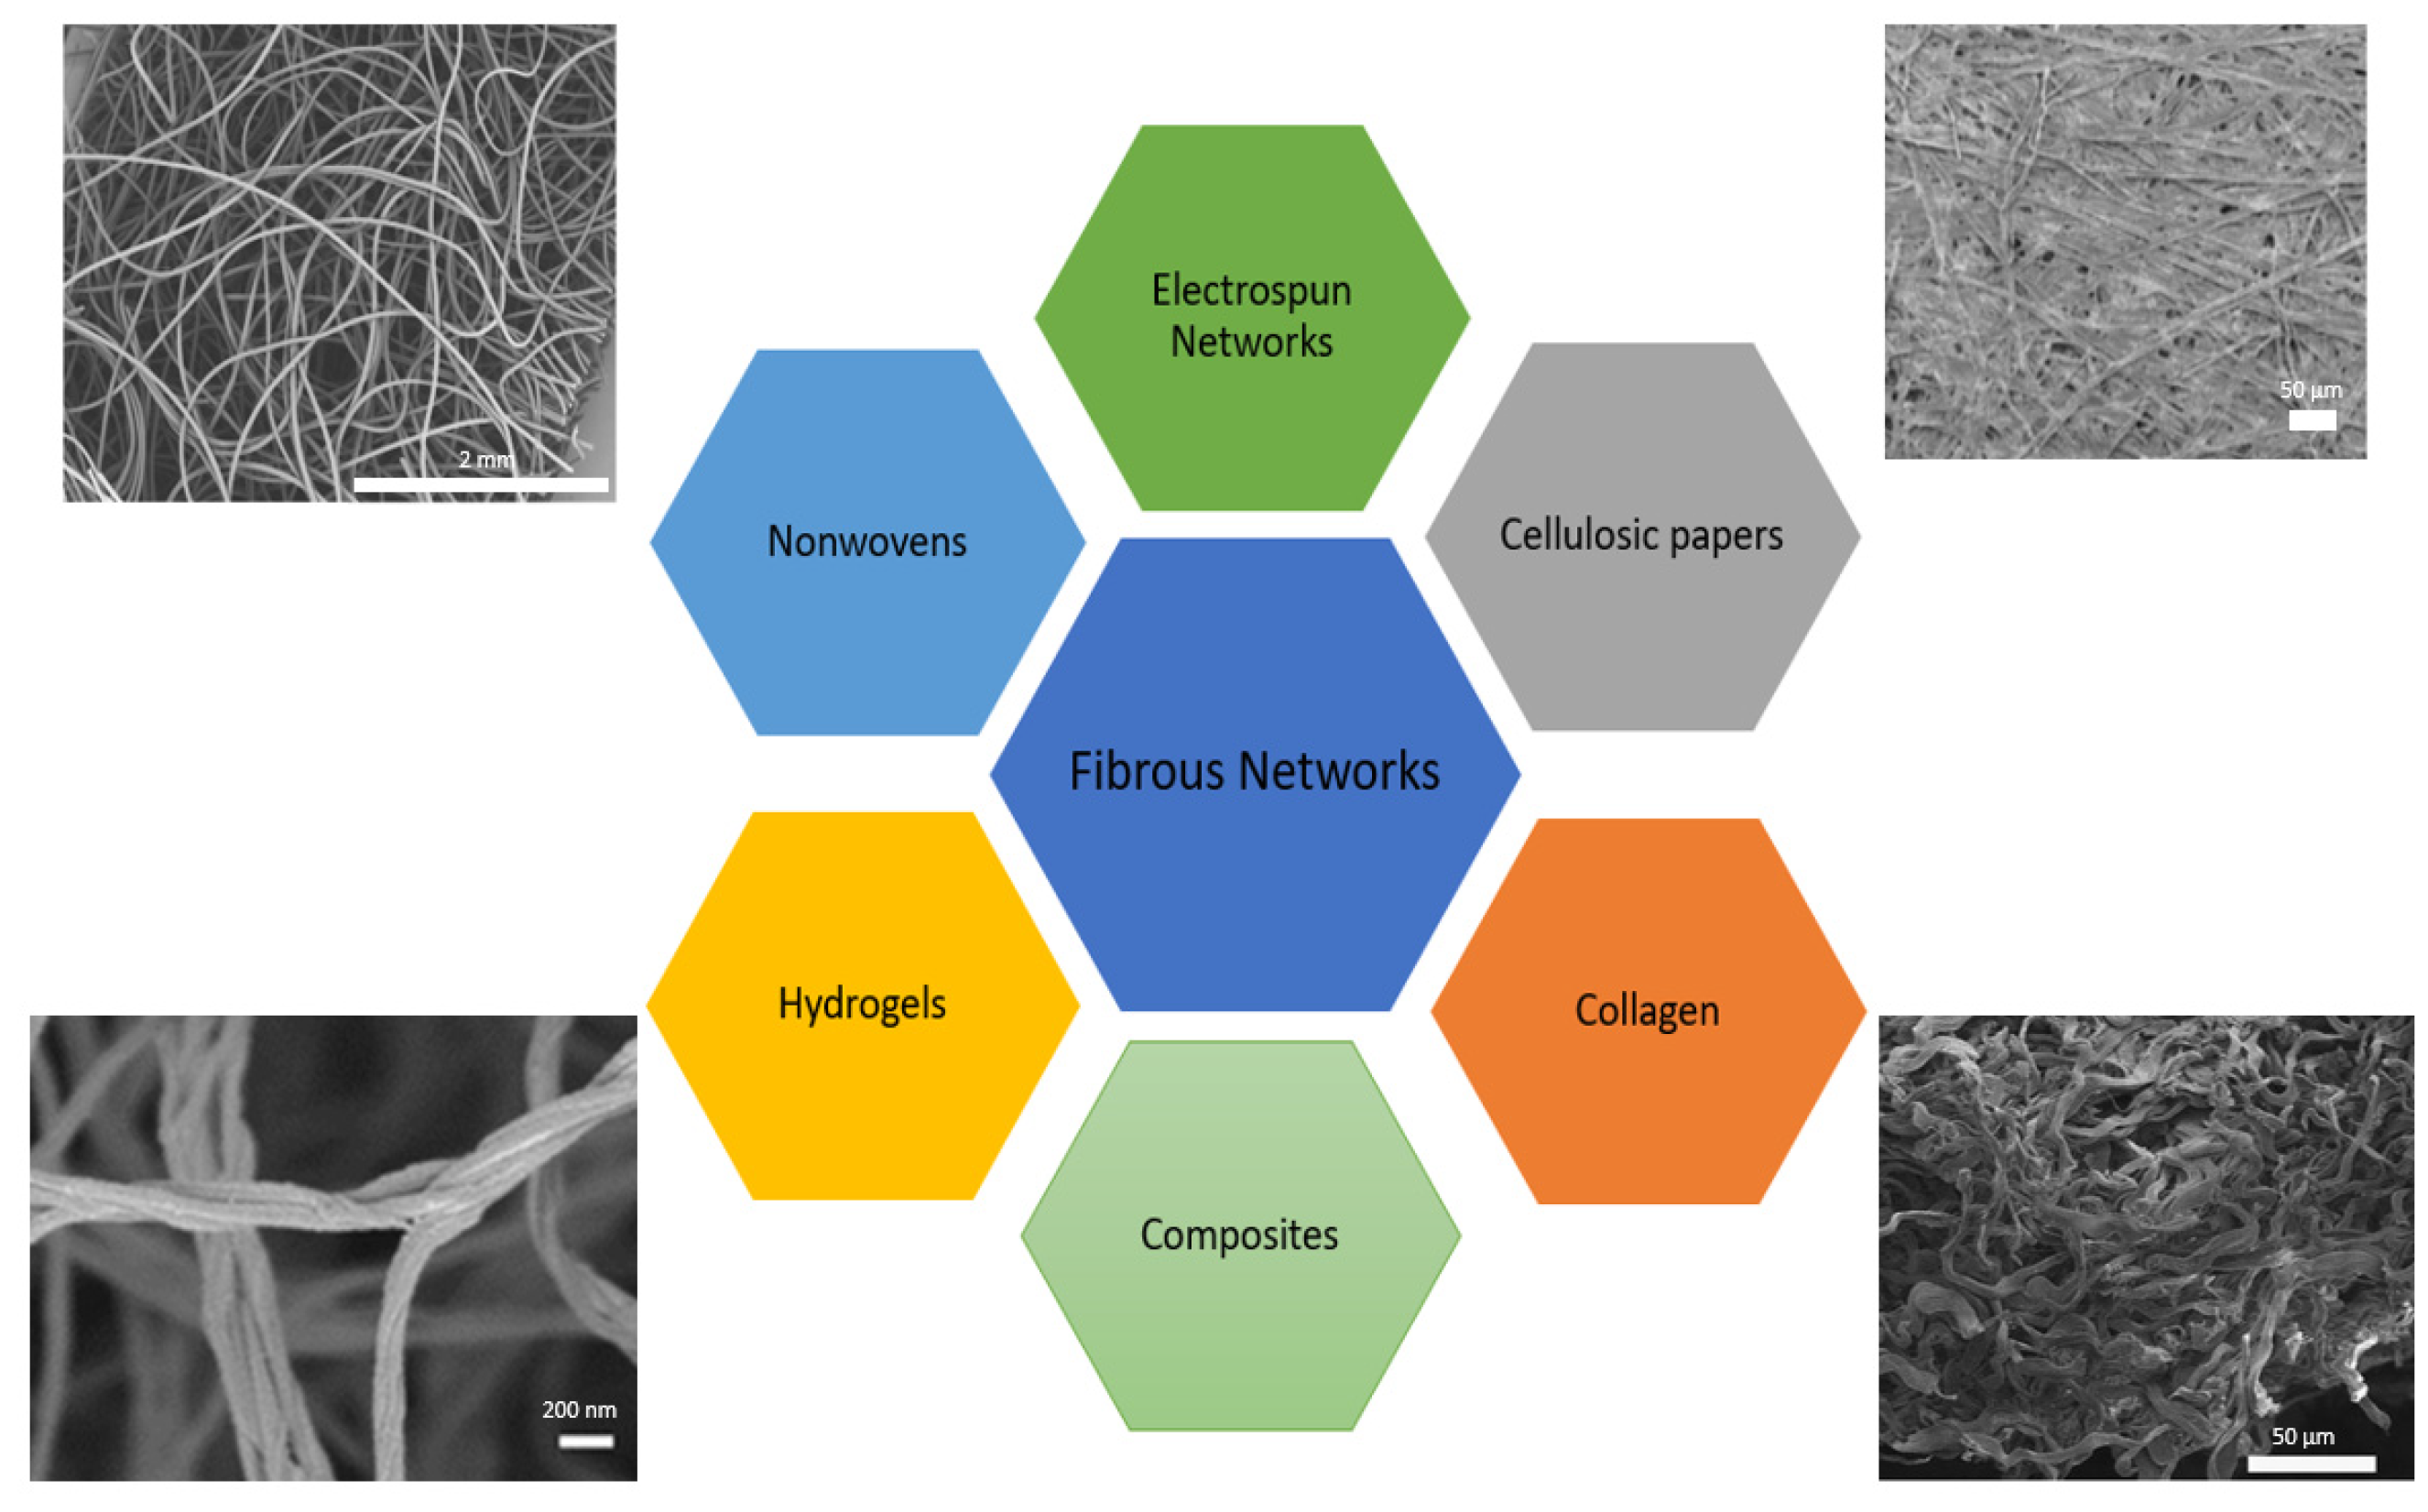
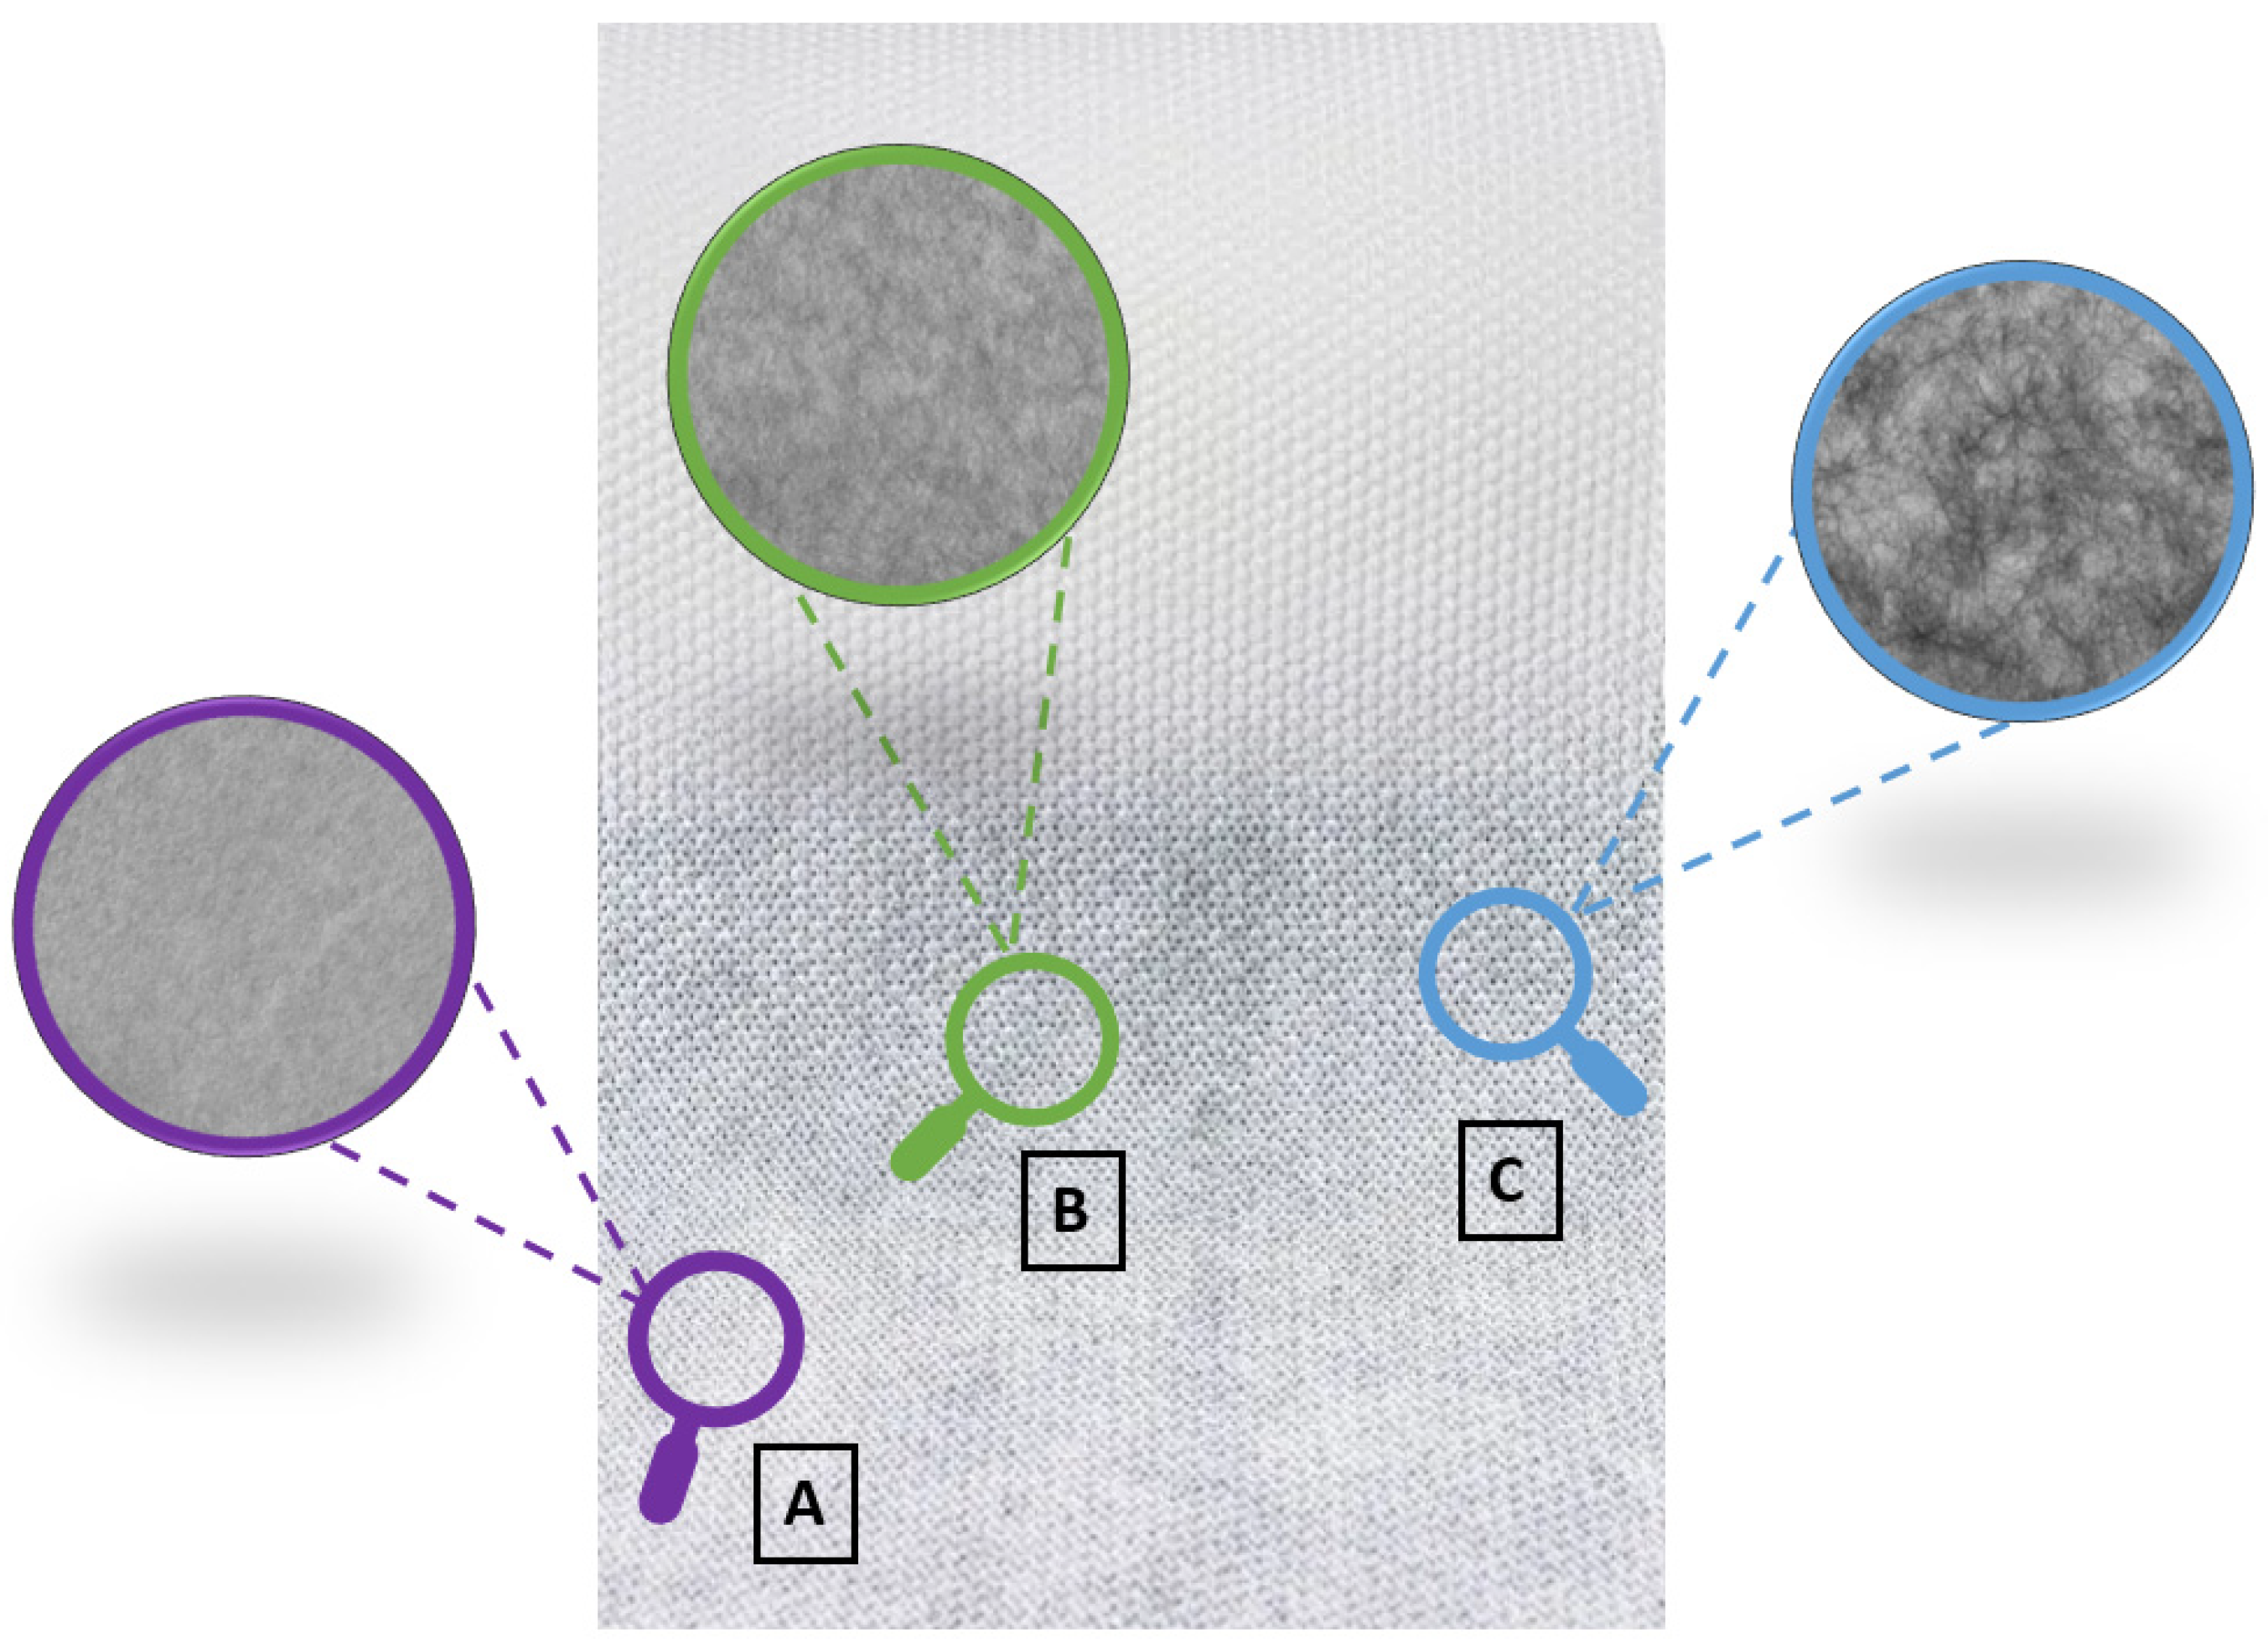
Fibrous networks are abundant in nature; for example, the skin of mammals contains collagen fibres [1]. Human arteries also contain collagen fibres, which add significant elasticity to blood vessels [2]. Also, marine animals have natural collagen fibres as structural materials in their bodies [3]. Similar to animals, wood, for instance, also has a fibrous structure, i.e., its hemicellulose and lignin fibrous structures exhibit exceptional mechanical properties [4,5]. Although there are many natural fibrous networks, various synthetic fibrous networks also exist. Electrospun networks [6,7,8,9] and polymer-based nonwoven [10,11,12] fibrous networks are typical examples of such synthetic networks. Moreover, bacteria-based synthesised hydrogels can also be used as examples of synthetic fibrous networks [13,14,15]. Fibre-reinforced composites can also be treated as synthetic fibrous networks with a matrix [16,17,18,19,20]. Cellulosic paper is another group of fibrous networks [21,22]. An overview of the fibrous networks and their detailed microstructures is shown in Figure 1.
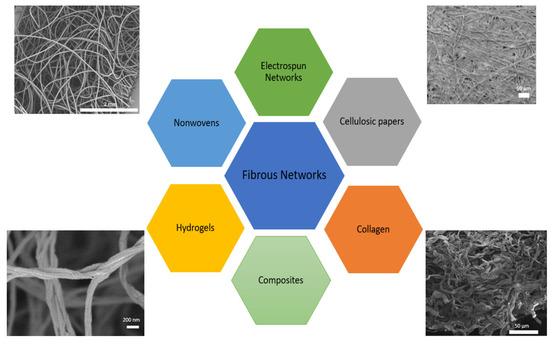
Figure 1.
Various fibrous networks with selected microstructures (microstructure of cellulosic paper based on [23], microstructure of collagen-fibrous network based on [1], and microstructure of hydrogels based on [24]).
One of the unique features of all the fibrous networks mentioned in the previous part is their microstructure. In contrast to bulk materials with continuous microstructures, fibrous networks have discontinuous microstructures, making them porous [25]. Owing to the porous microstructure of the fibrous networks, their filtration performance is exceptional. As a result, they can be used in various products such as filters for automobiles [26], for the filtration of pathogens [27], and in personal protective equipment [28]. In particular, polymer-based nonwoven fibrous networks attracted considerable attention during the COVID-19 pandemic [29,30].
Another interesting feature is the specific strength of fibrous networks. In contrast to their continuous counterparts, fibrous networks have a high strength-to-weight ratio. Hence, especially for weight-critical applications such as in aerospace engineering, fibrous networks, forming an important part of fibre-reinforced composites, find vast application areas [31,32].
Moreover, porous structures and light weights make nonwoven fibrous networks suitable for geotextiles [33,34,35]. Their porous structures are crucial for filtration and separation applications; protection, drainage, and reinforcement are also application fields for nonwoven geotextiles in civil engineering. Although geotextiles can be produced as woven, knitted, or nonwoven structures, nonwoven geotextiles attracted significant interest owing to their design flexibility and low manufacturing cost. Owing to their light weight, nonwoven geotextiles are usually preferred because of their ease of transportation and installation. Also, design flexibility is another advantage of these materials, i.e., nonwoven geotextiles can be manufactured in various sizes and with different properties.
Several review articles are available in the literature [9,36,37,38], but according to the authors’ knowledge, there is no study systematically reviewing the geometric characterisation of fibrous networks. Therefore, this review investigates the geometric characterisation parameters of stochastic fibrous networks with continuous fibres, i.e., with fibres crossing the entire 2D domain, using mostly polymer-based nonwoven fibrous networks as examples. Therefore, all the geometric characterisation parameters discussed in this review are for the assessment of continuous fibres in 2D. This review does not consider 3D fibrous networks.
2. Regular Versus Random Microstructures
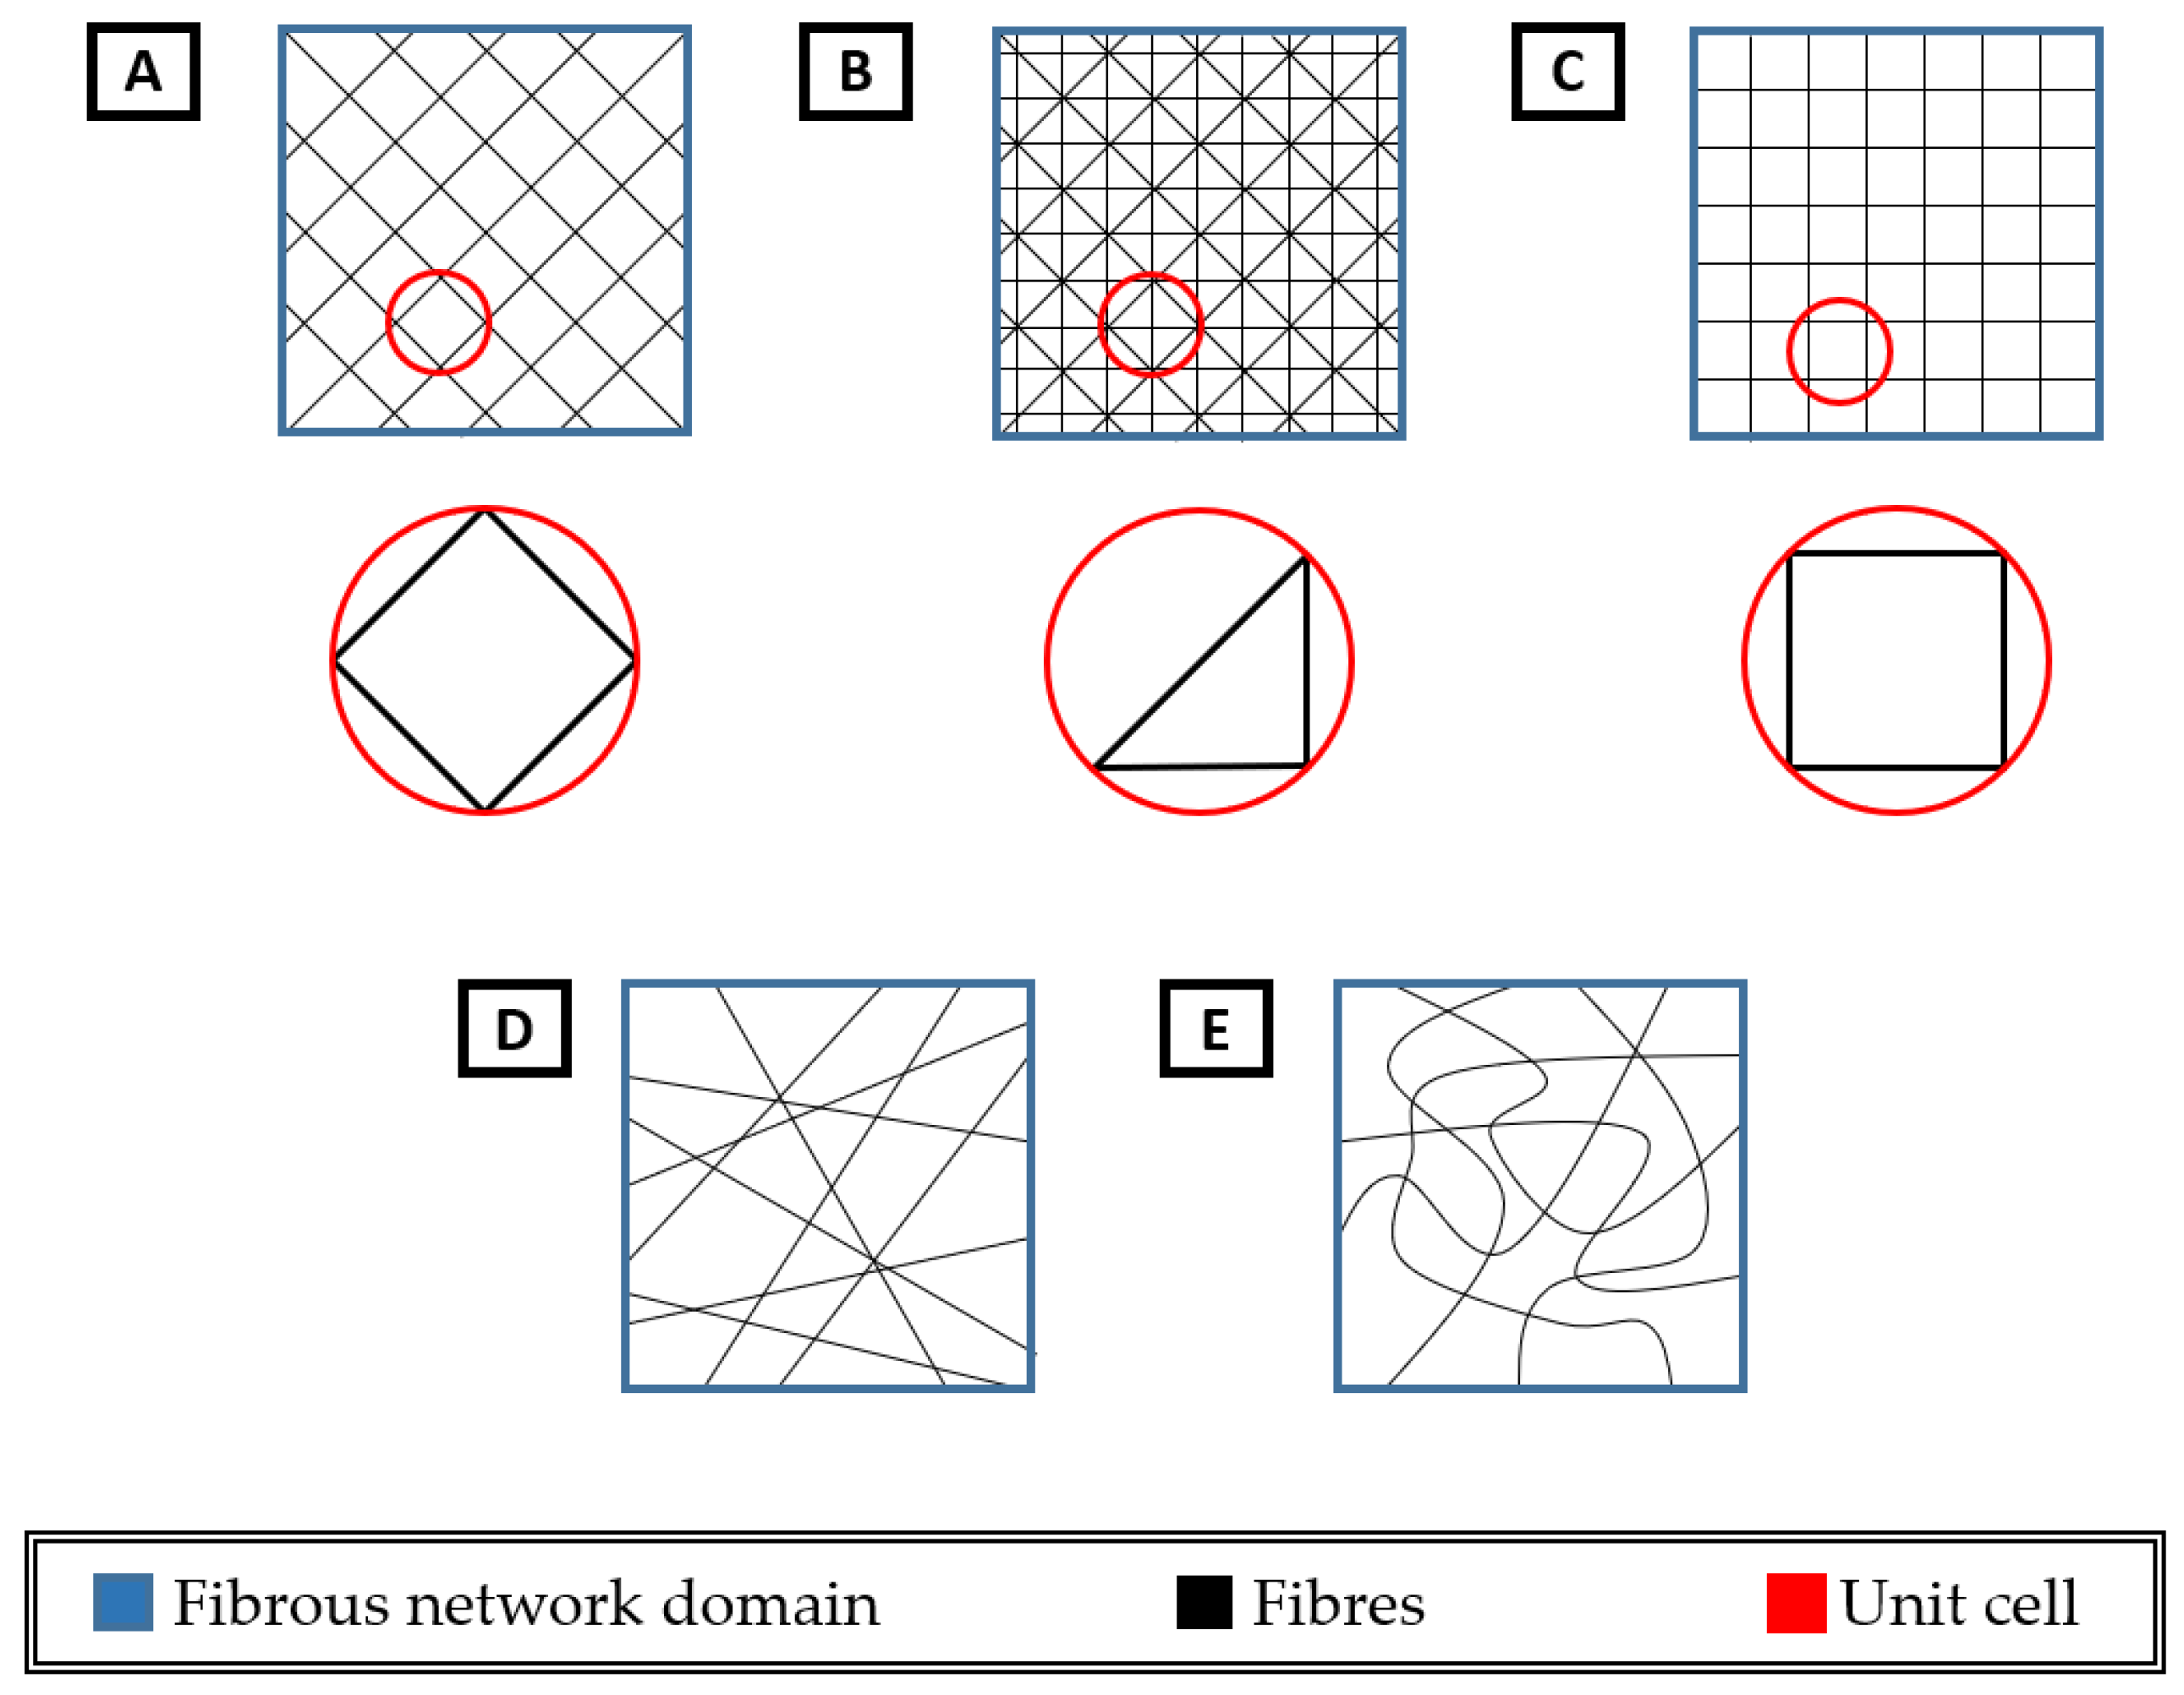
Many materials can be considered to have regular microstructures; a typical example is lattice structures [39,40,41,42]. In this kind of microstructure, a pattern called a unit cell repeats itself throughout the structure multiple times to generate the microstructure [43]. However, a unit cell cannot be used to describe a pattern of, or to generate a whole geometry for, stochastic microstructures such as those observed in nonwovens. A comparison of regular and random microstructures is given in Figure 2. It is apparent that regular microstructures (Figure 2A–C) can be expressed with a simplified structure (that is, a unit cell, as shown in the red circles in Figure 2), while for stochastic microstructures, there is no unit cell that can be employed for a geometric description of the whole geometry.
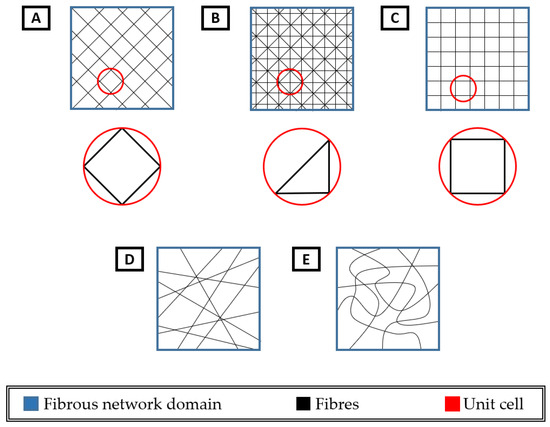
Figure 2.
Examples of regular and random microstructures: tetragonal (A), triangular (B), and square (C) lattice microstructures with their unit cells; straight (D) and curly (E) random fibrous networks.
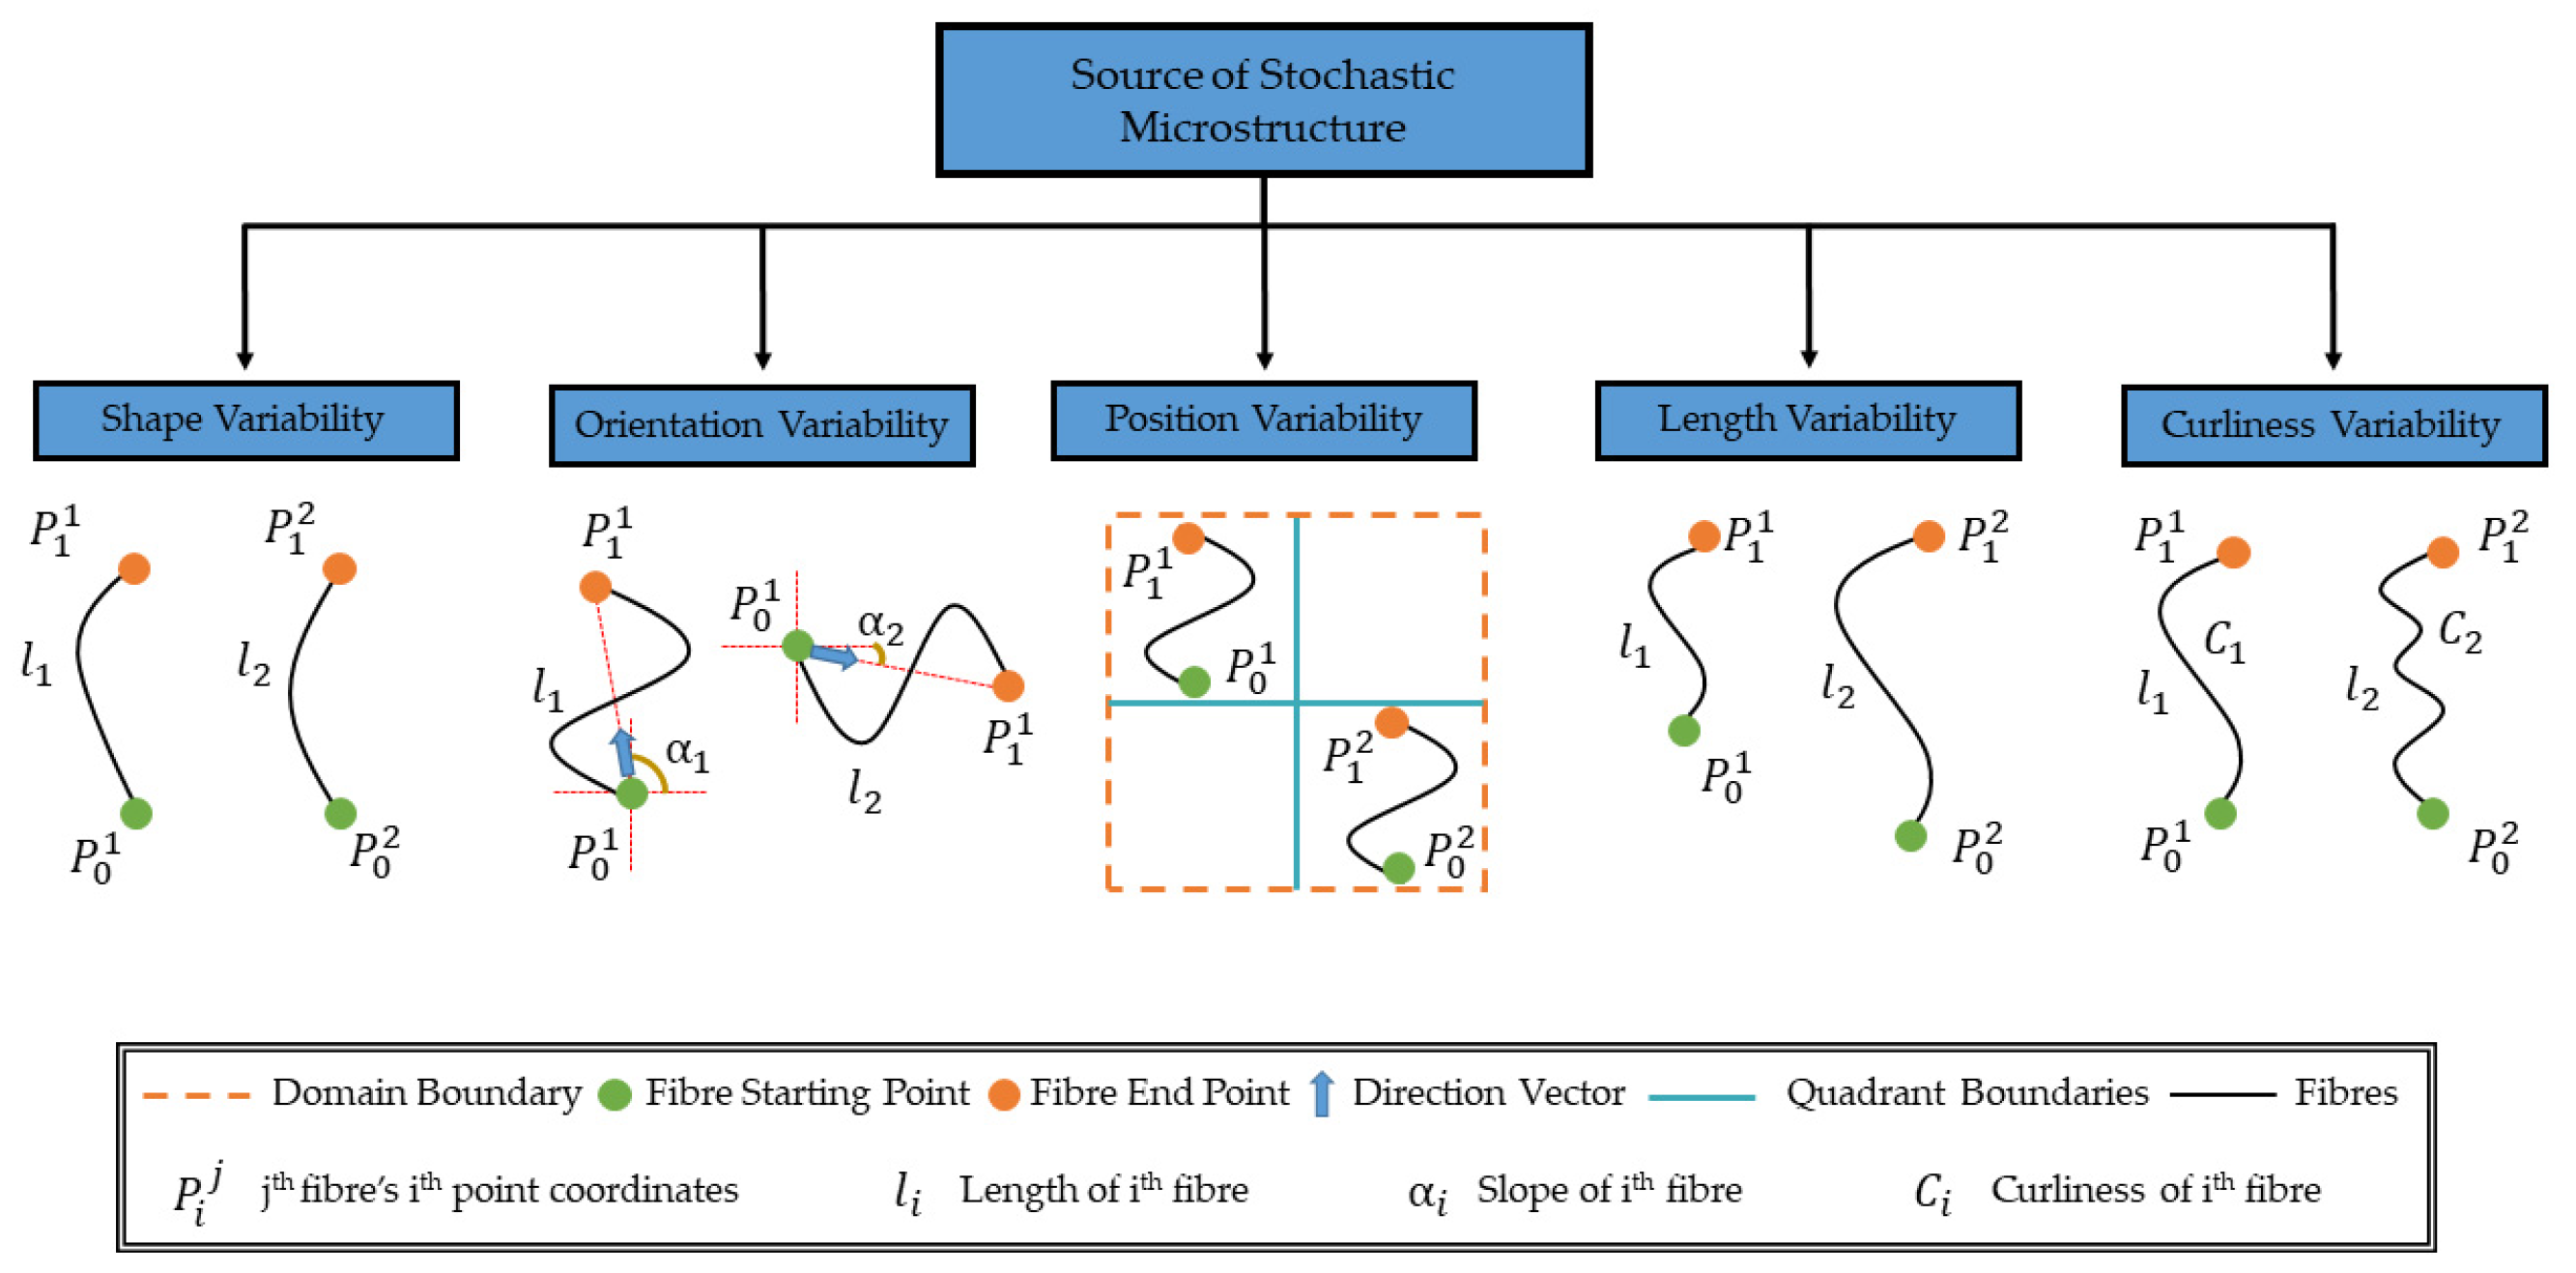
Random microstructures make it challenging to estimate the performance parameters of fibrous networks, such as their mechanical behaviour, filtration performance, etc. This is due to non-trivial geometric characterisation procedures for cases with an inherent lack of pattern, i.e., the impossibility of deriving a unit cell that defines the geometry of the microstructure. Therefore, the stochastic nature of the microstructure is one of the main challenges for the evaluation of these parameters. Several phenomena contribute to the stochastic nature of the microstructure, such as variations in shape, orientation, position, length, and curliness, as given in Figure 3.
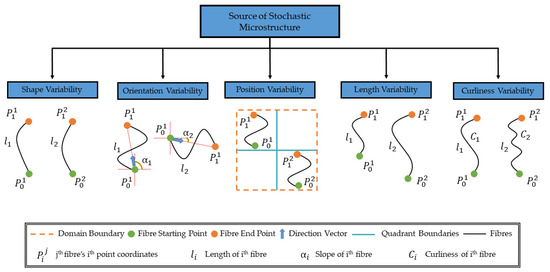
Figure 3.
Parameters contributing to the stochastic microstructure of fibrous networks with curly fibres.
The variability of fibre shapes is one of the major parameters that results in stochastic microstructures. For instance, nonwovens with random curly fibres are some of the most notable examples, with each fibre having a different shape while creating a fibrous network (Figure 1). Therefore, even if all other parameters such as length, curliness, orientation, and starting and end points of fibres are the same, the geometries (i.e., shapes) of the fibres can still differ. In this way, generated geometrically different fibres make the microstructure of the fibrous networks stochastic. However, the shape of the fibres is not the only parameter that generates or contributes to the stochastic microstructure. The orientation of the fibres (alignment or slope of fibres, as shown in Figure 3) also contributes to the stochastic nature of the microstructure of fibrous networks. In this case, fibres can be aligned in different directions (except the perfectly aligned fibrous networks, i.e., those where all the fibres are aligned in the exact preferential direction). Thus, this random alignment of fibres can generate another stochastic character for the microstructure of fibrous networks.
Positional variability, on the other hand, can be explained by the character of spatial distribution of fibres. For instance, a fibre can be placed in any position within the domain’s boundary, while all the parameters of the fibre (e.g., shape, orientation, length, curliness) remain the same, apart from its location. Therefore, the locations of fibres can vary, e.g., the same fibre can be located in different parts of the fibrous network (see Figure 3). Such locational variability is also a source of the stochastic microstructure of a fibrous network.
In addition to the positional variability, the length of fibres can change significantly in fibrous networks. Similar to the fibre length, the curliness of fibres can vary for each fibre in a network. The curliness variability of fibres is the main source of stochastic behaviour of fibrous networks that consist of curly fibres, such as nonwovens or collagens [1,44,45,46]. In contrast, fibrous networks formed by straight fibres only do not have this factor contributing to microstructure randomness, since the curliness of the fibres is zero.
3. Geometric Characterisation Parameters
3.1. Basis Weight
Several parameters can be used to characterise the macroscopic (effective) properties of fibrous networks and single fibres. One of the main parameters for fibrous networks is their basis weight, which is the ratio of the fibrous network’s weight to its surface area. According to Russell [47], basis weight is given as mass per unit area of the fabric. The mathematical expression used to compute the basis weight of fibrous networks has the following form:
where is the density of the fibre material, is the total length of fibres in the fibrous porous network, is the average cross-sectional area of fibres, and and are the width and length of the fibrous porous network, respectively.
The experimental measurement of basis weight is described in the ISO 9073 standard [48]. According to this document, the basis weight measurement of nonwoven fibrous networks should be performed on areas with a minimum size of 50,000 mm2. For instance, the width and height of the cut sample can be chosen as 250 mm × 200 mm. On the other hand, sample collection can be performed according to the ISO 186 standard [49].
The local basis weight of manufactured fibrous networks such as nonwovens can vary within the networks due to several reasons; during web formation, fibres can accumulate in some locations more than in others for spunbond fabrics [11]. Therefore, the evaluation of local variations in basis weight is crucial. Several different methods are proposed in the literature to measure basis weight locally; they are investigated in detail below.
3.2. Orientation Distribution Function
In stochastic fibrous networks, fibres are aligned randomly in different directions. This alignment of fibres is typically the primary driving mechanism of the anisotropic mechanical behaviour of fibrous networks. Therefore, quantifying anisotropy is crucial to understanding the mechanical behaviour of fibrous networks. Cox performed a pioneering study for the quantification of anisotropy for fibrous networks [50], introducing an orientation distribution function (ODF) in this work. The ODF is a function that quantifies the distribution of fibres according to their directions. Following the introduction of the ODF, several researchers implemented this concept in their research to assess the anisotropy of fibrous networks [51,52,53,54,55,56].
Researchers developed various experimental techniques to measure the ODF for fibrous networks: (i) visual methods [57]; (ii) optical methods [58]; (iii) skeletonization algorithm [59]; (iv) fast Fourier transformation (FFT) [60]; (v) Hough transformation [61]; (vi) edge detection with Bezier fitting [62]; (vii) image quality improvement [63]. The historical development of these techniques is summarised in Figure 4.

Figure 4.
Historical development of techniques for ODF quantification.
The early methods developed to evaluate the ODF of fibrous networks were based on visual inspection of the alignment of the fibres; e.g., 2D images of fibrous networks were taken with visual methods such as optical microscopy to evaluate the alignment of the fibres according to reference directions (for instance, for spunbonded nonwovens, the so-called machine direction, which is the movement direction of the conveyor belt during the manufacturing process, can be such a direction) [57]. However, this technique was challenging to implement due to the extensive requirement of human efforts, which limited the application of this technique on an industrial scale. Therefore, some new techniques based on image processing were developed to decrease the labour costs.
Early image-processing methods implemented the FFT technique to analyse the ODF of fibrous networks [64]. Sander and Barocas [65] compared different techniques used to assess the ODF for artificially created fibrous networks in 2D. Their research compared different methods, i.e., mean intercept length, line fraction deviation, and discrete Fourier transform. Due to the sensitivity of FFT techniques to noise in captured images, techniques based on Hough transform became more popular [62].
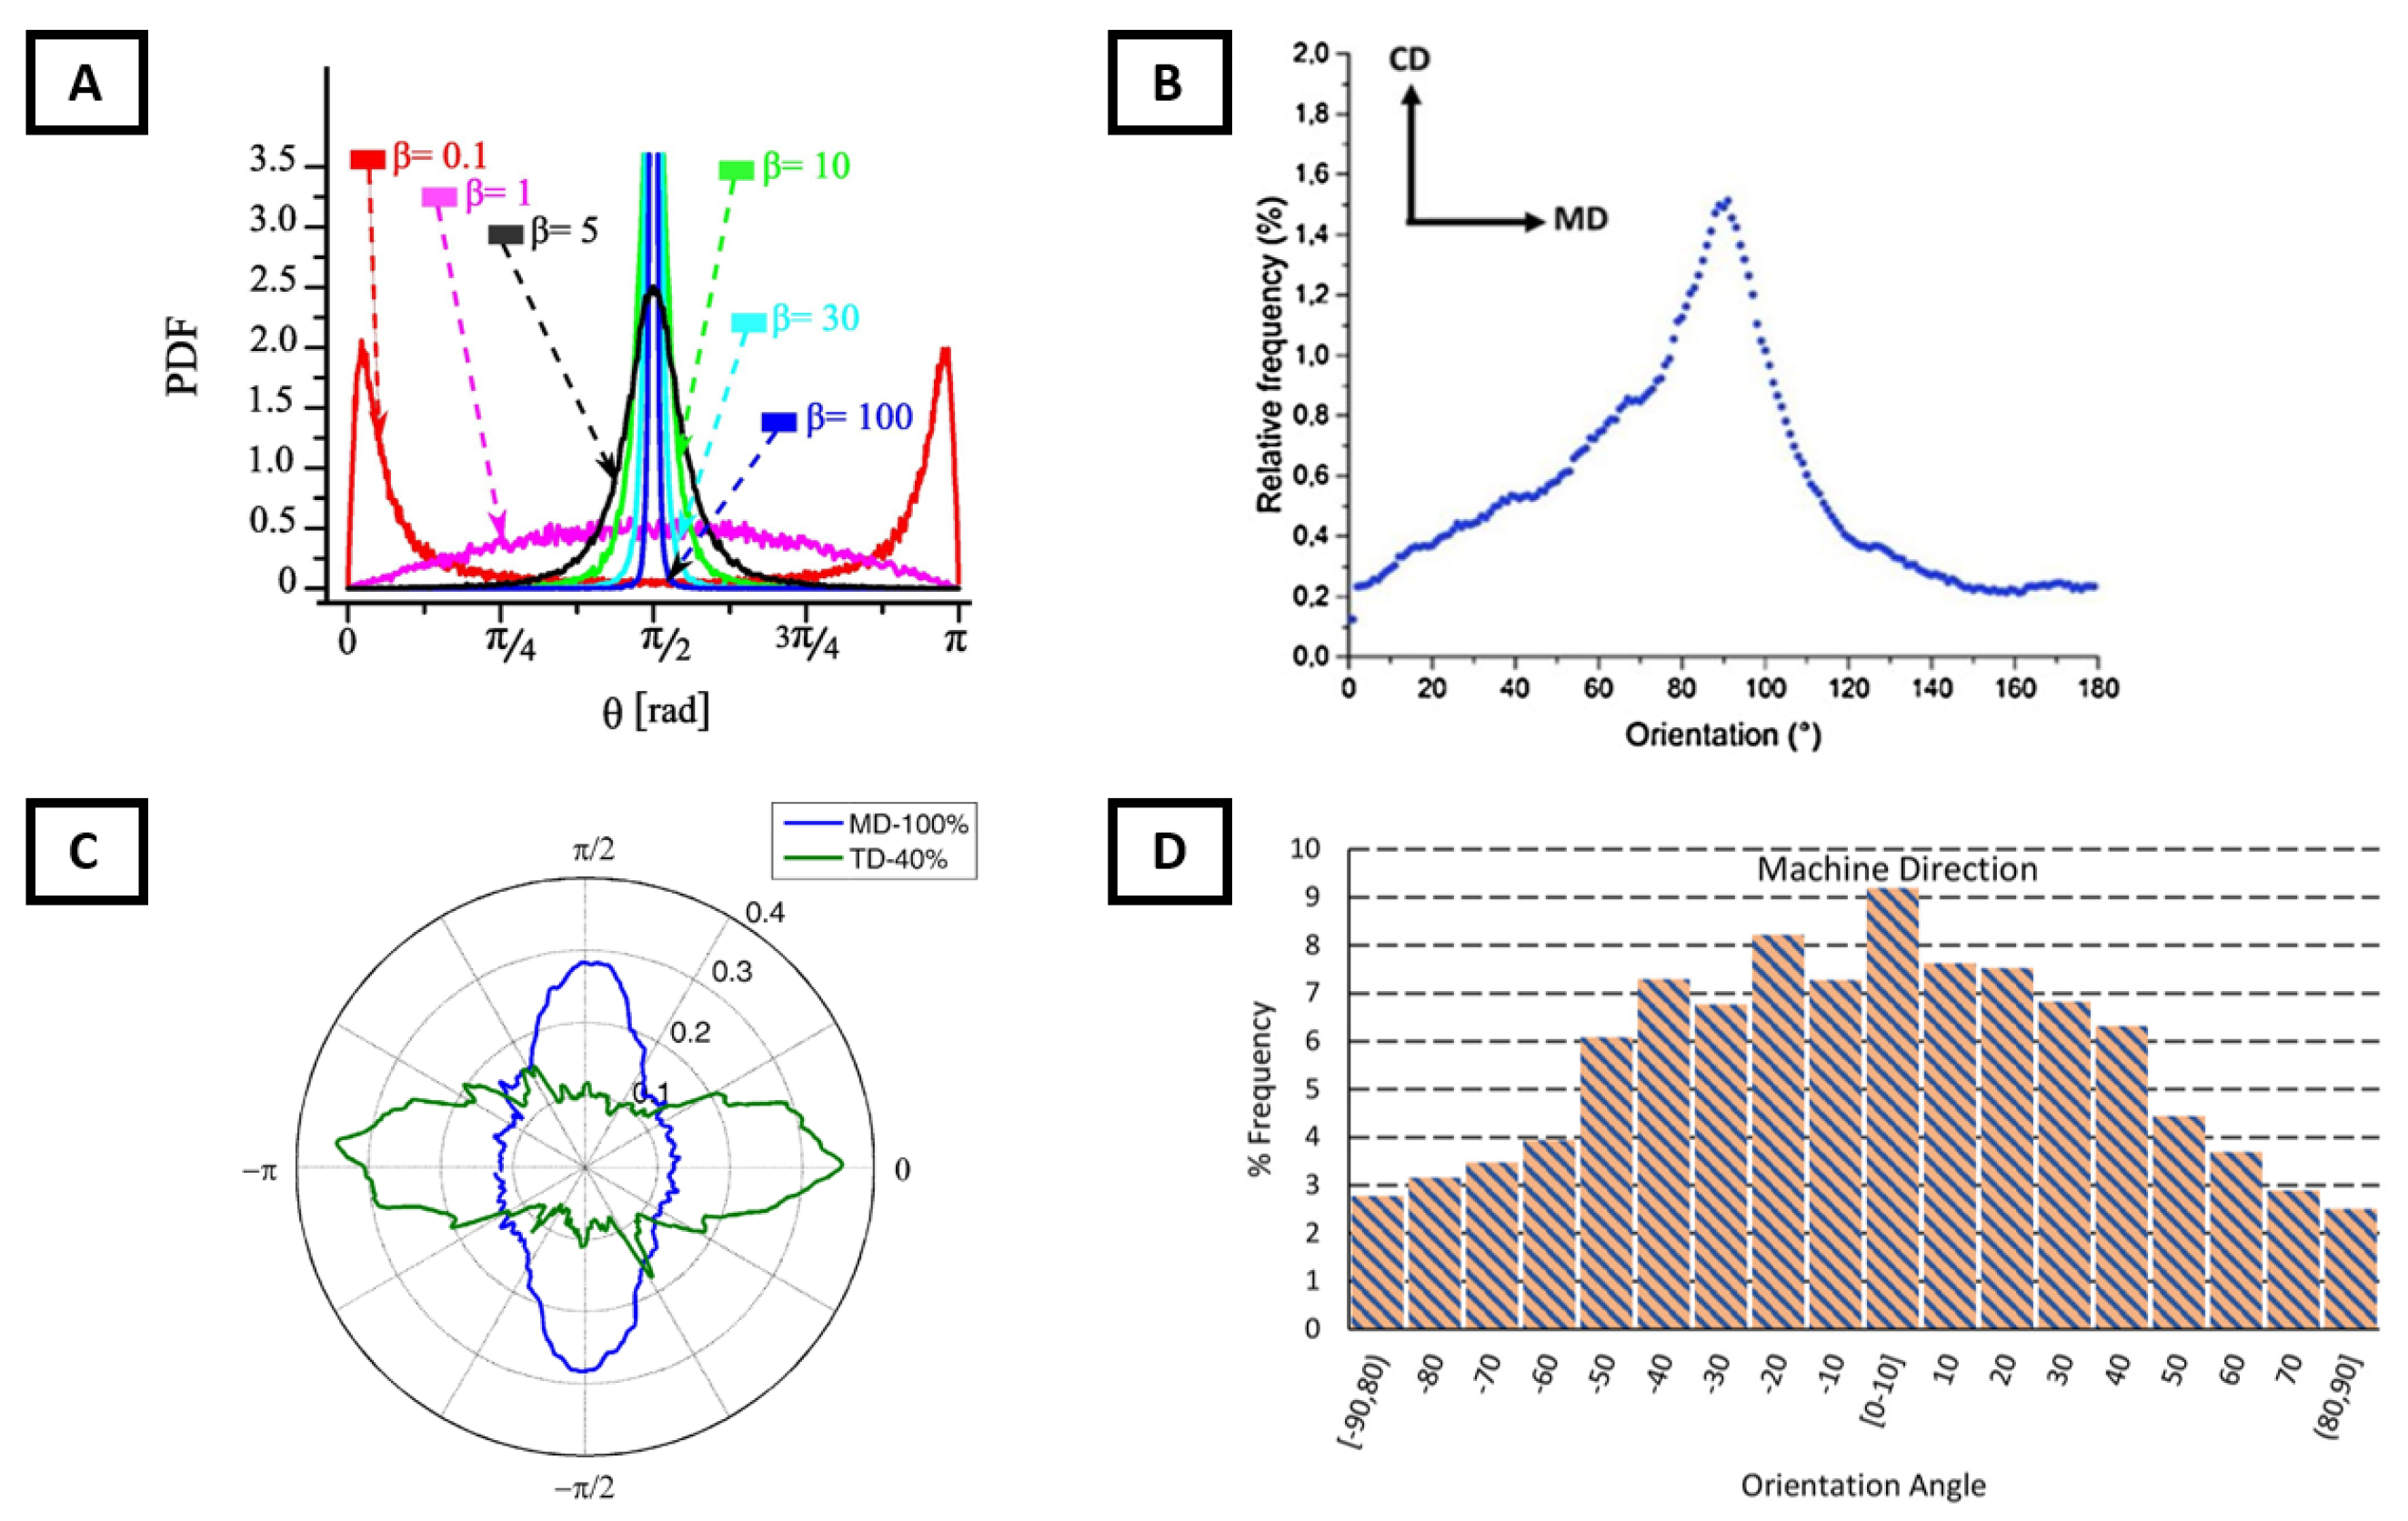
Several different methods were introduced to display the measured ODF values. The most common way to illustrate ODF is to present a fraction of fibres aligned in a certain direction in the form of a histogram, as shown in Figure 5. Apart from the fraction of the fibres, the probability density function (PDF) can also account for a portion of the fibres falling in a certain direction [54]. Other approaches were developed in the literature to graphically present the ODF, e.g., (i) fraction or frequency [55,61,66]; (ii) probability [54]; (iii) polar [52,65,67]. Examples of the most common techniques are shown in Figure 5.
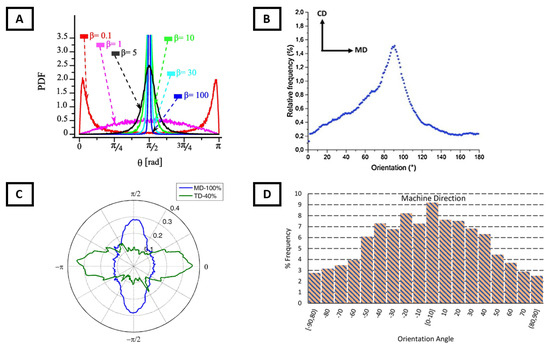
Figure 5.
Different options for the graphical presentation of ODF: (A) probability density function (PDF) [54]; (B) relative frequency [66]; (C) radar representation based on PDF [51]; (D) frequency [55] (CD: cross-direction; MD: machine direction; TD: thickness direction).
3.3. Crimp
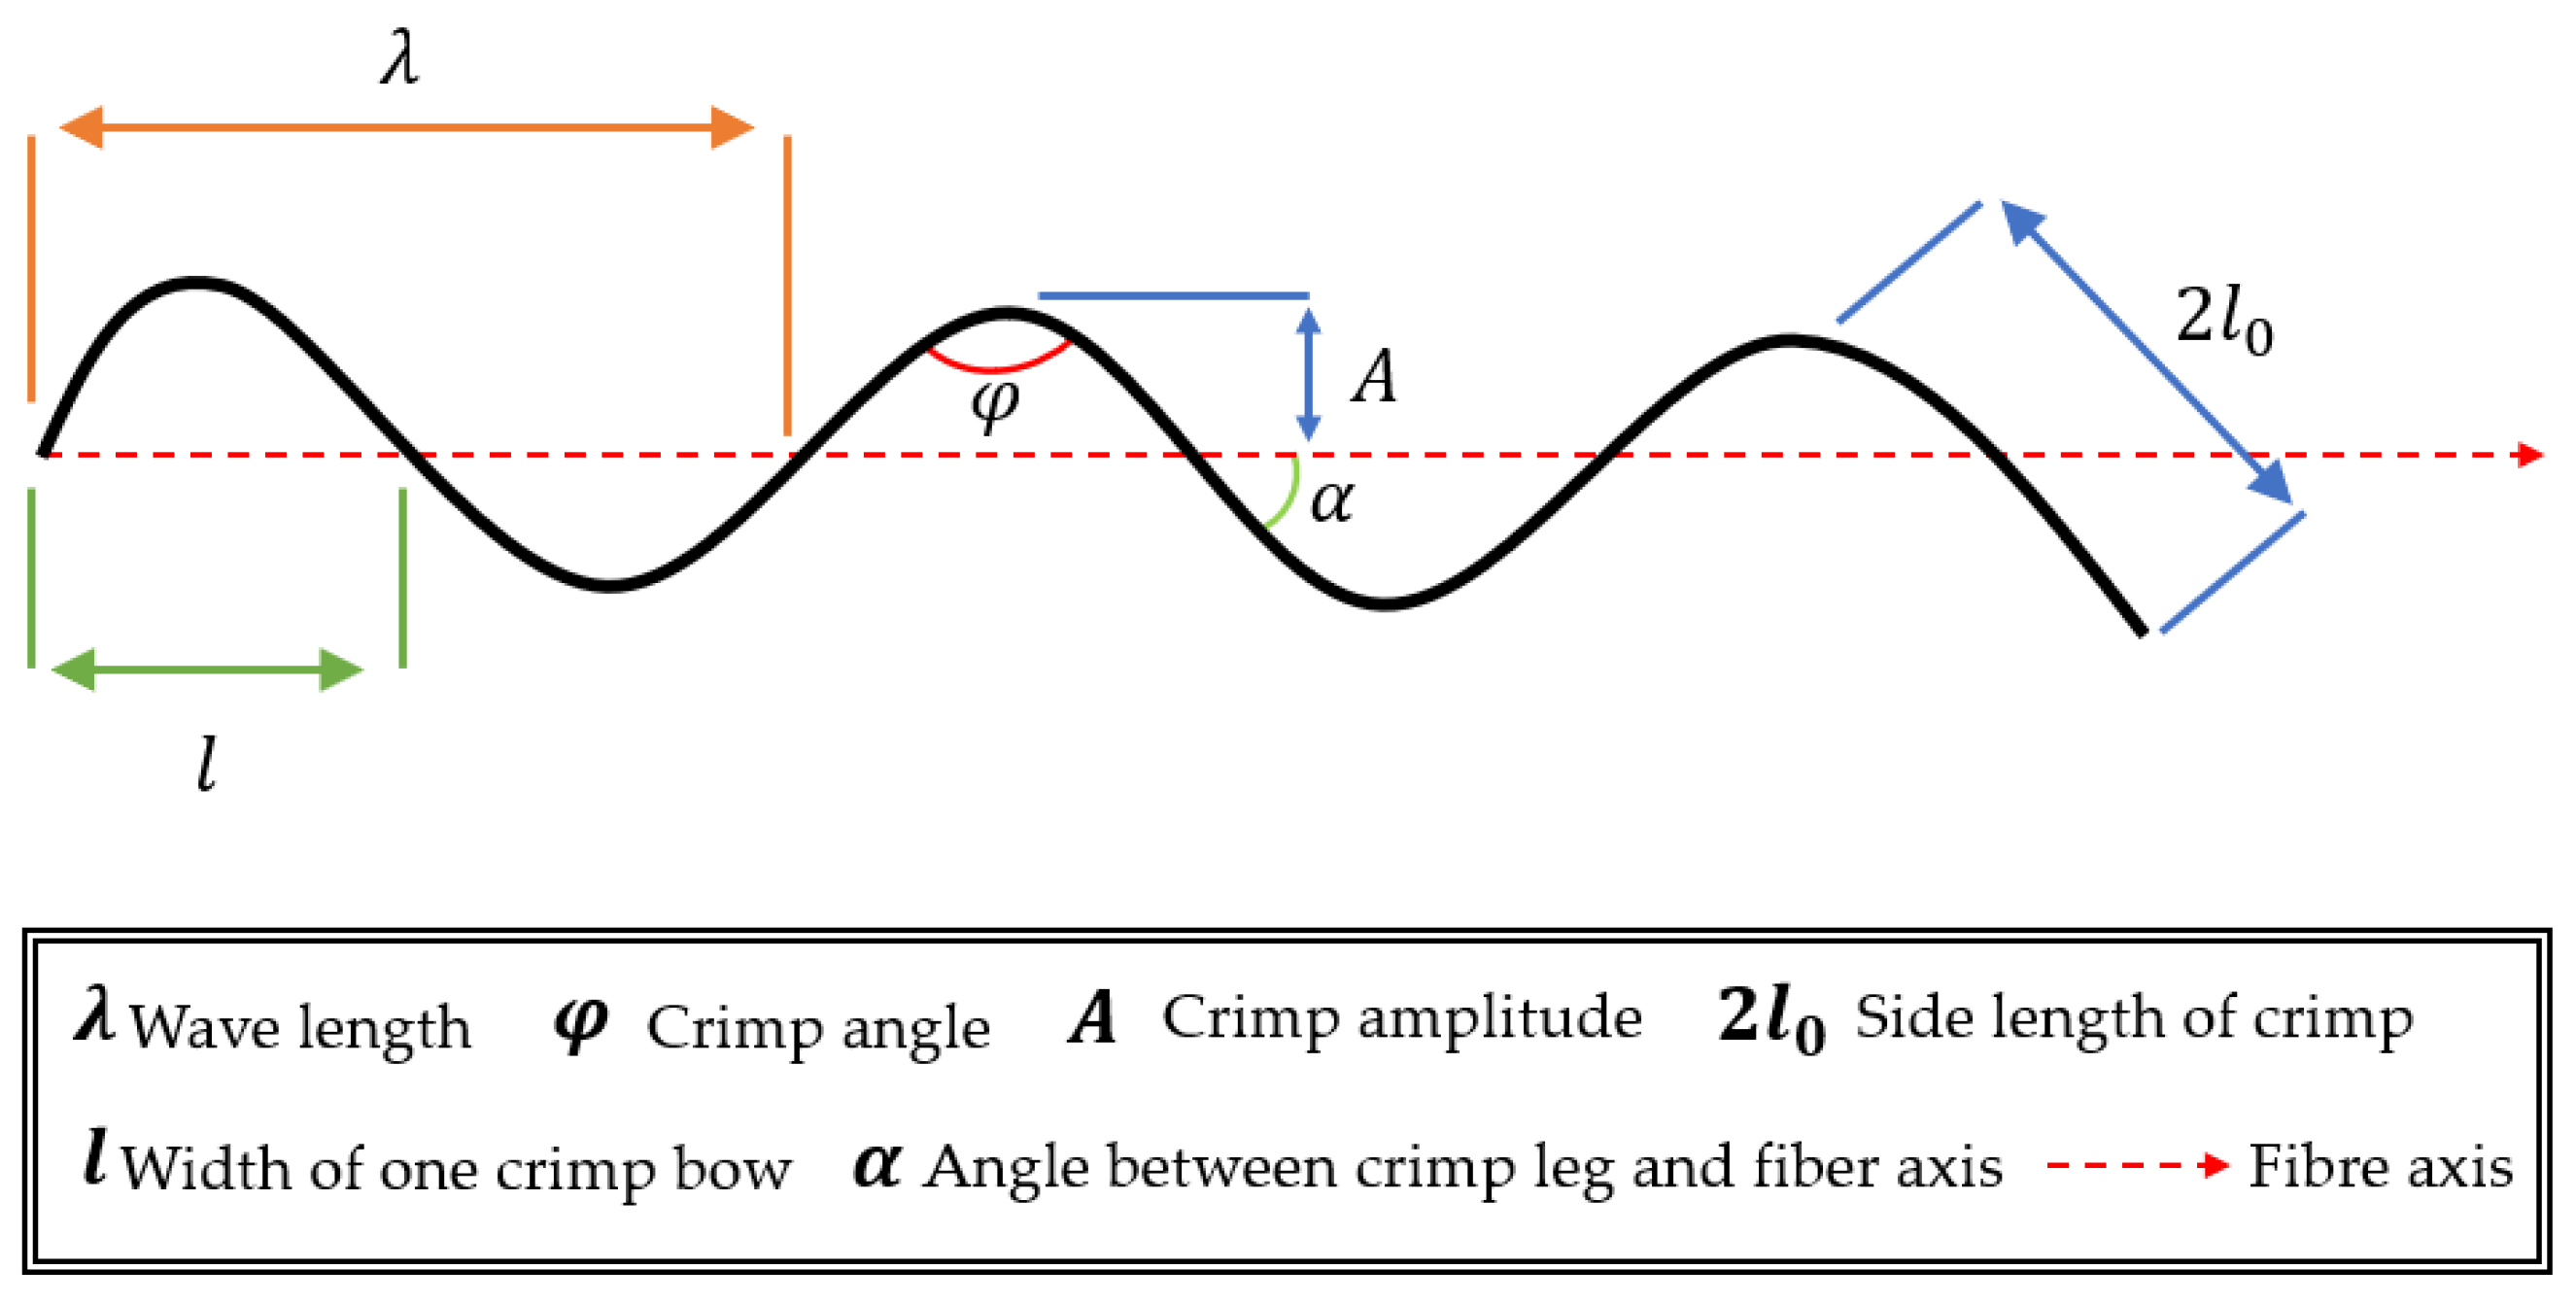
Crimp (also known as fibre curliness, fibre curvature, or tortuosity), the waviness of fibres, is a dominant parameter that should be accounted for to fully understand the various features of fibrous networks, e.g., appearance, mechanical performance, quality of product, etc. [68,69,70]. Several natural fibrous networks have fibres with crimp; for example, wool has helical crimp, a three-dimensional crimp type that is the major reason for its good thermal insulation [71]. On the other hand, manufactured fibrous networks such as nonwovens can control the fibre crimp by adjusting the manufacturing parameters [47,72]. Since crimp is an important factor contributing to the final performance parameters of fibrous networks, it is vital to characterise it. However, quantifying fibre crimp is a challenging process due to its complexity. As a result of complex crimp patterns, there is no universal consensus on the procedure for its characterisation [73,74,75]. Several parameters (as shown in Figure 6) were introduced to characterise fibre crimp: (i) crimp length (), (ii) number of crimp waves per unit length (), and (iii) crimp index () or curliness.
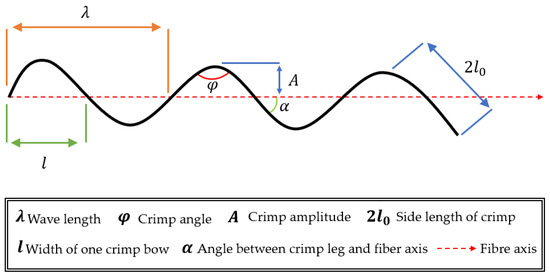
Figure 6.
Geometry of fibre crimp with characterisation parameters (modified after [76]).
The crimp length is the total length of a crimp fibre. It can be calculated mathematically as follows:
where is the number of crimp waves for a fibre, and is the width of an individual crimp bow. The number of crimps per unit length () (which is equal to 1 inch for USA, 1000 mm or 1 cm for Europe) can be calculated as follows:
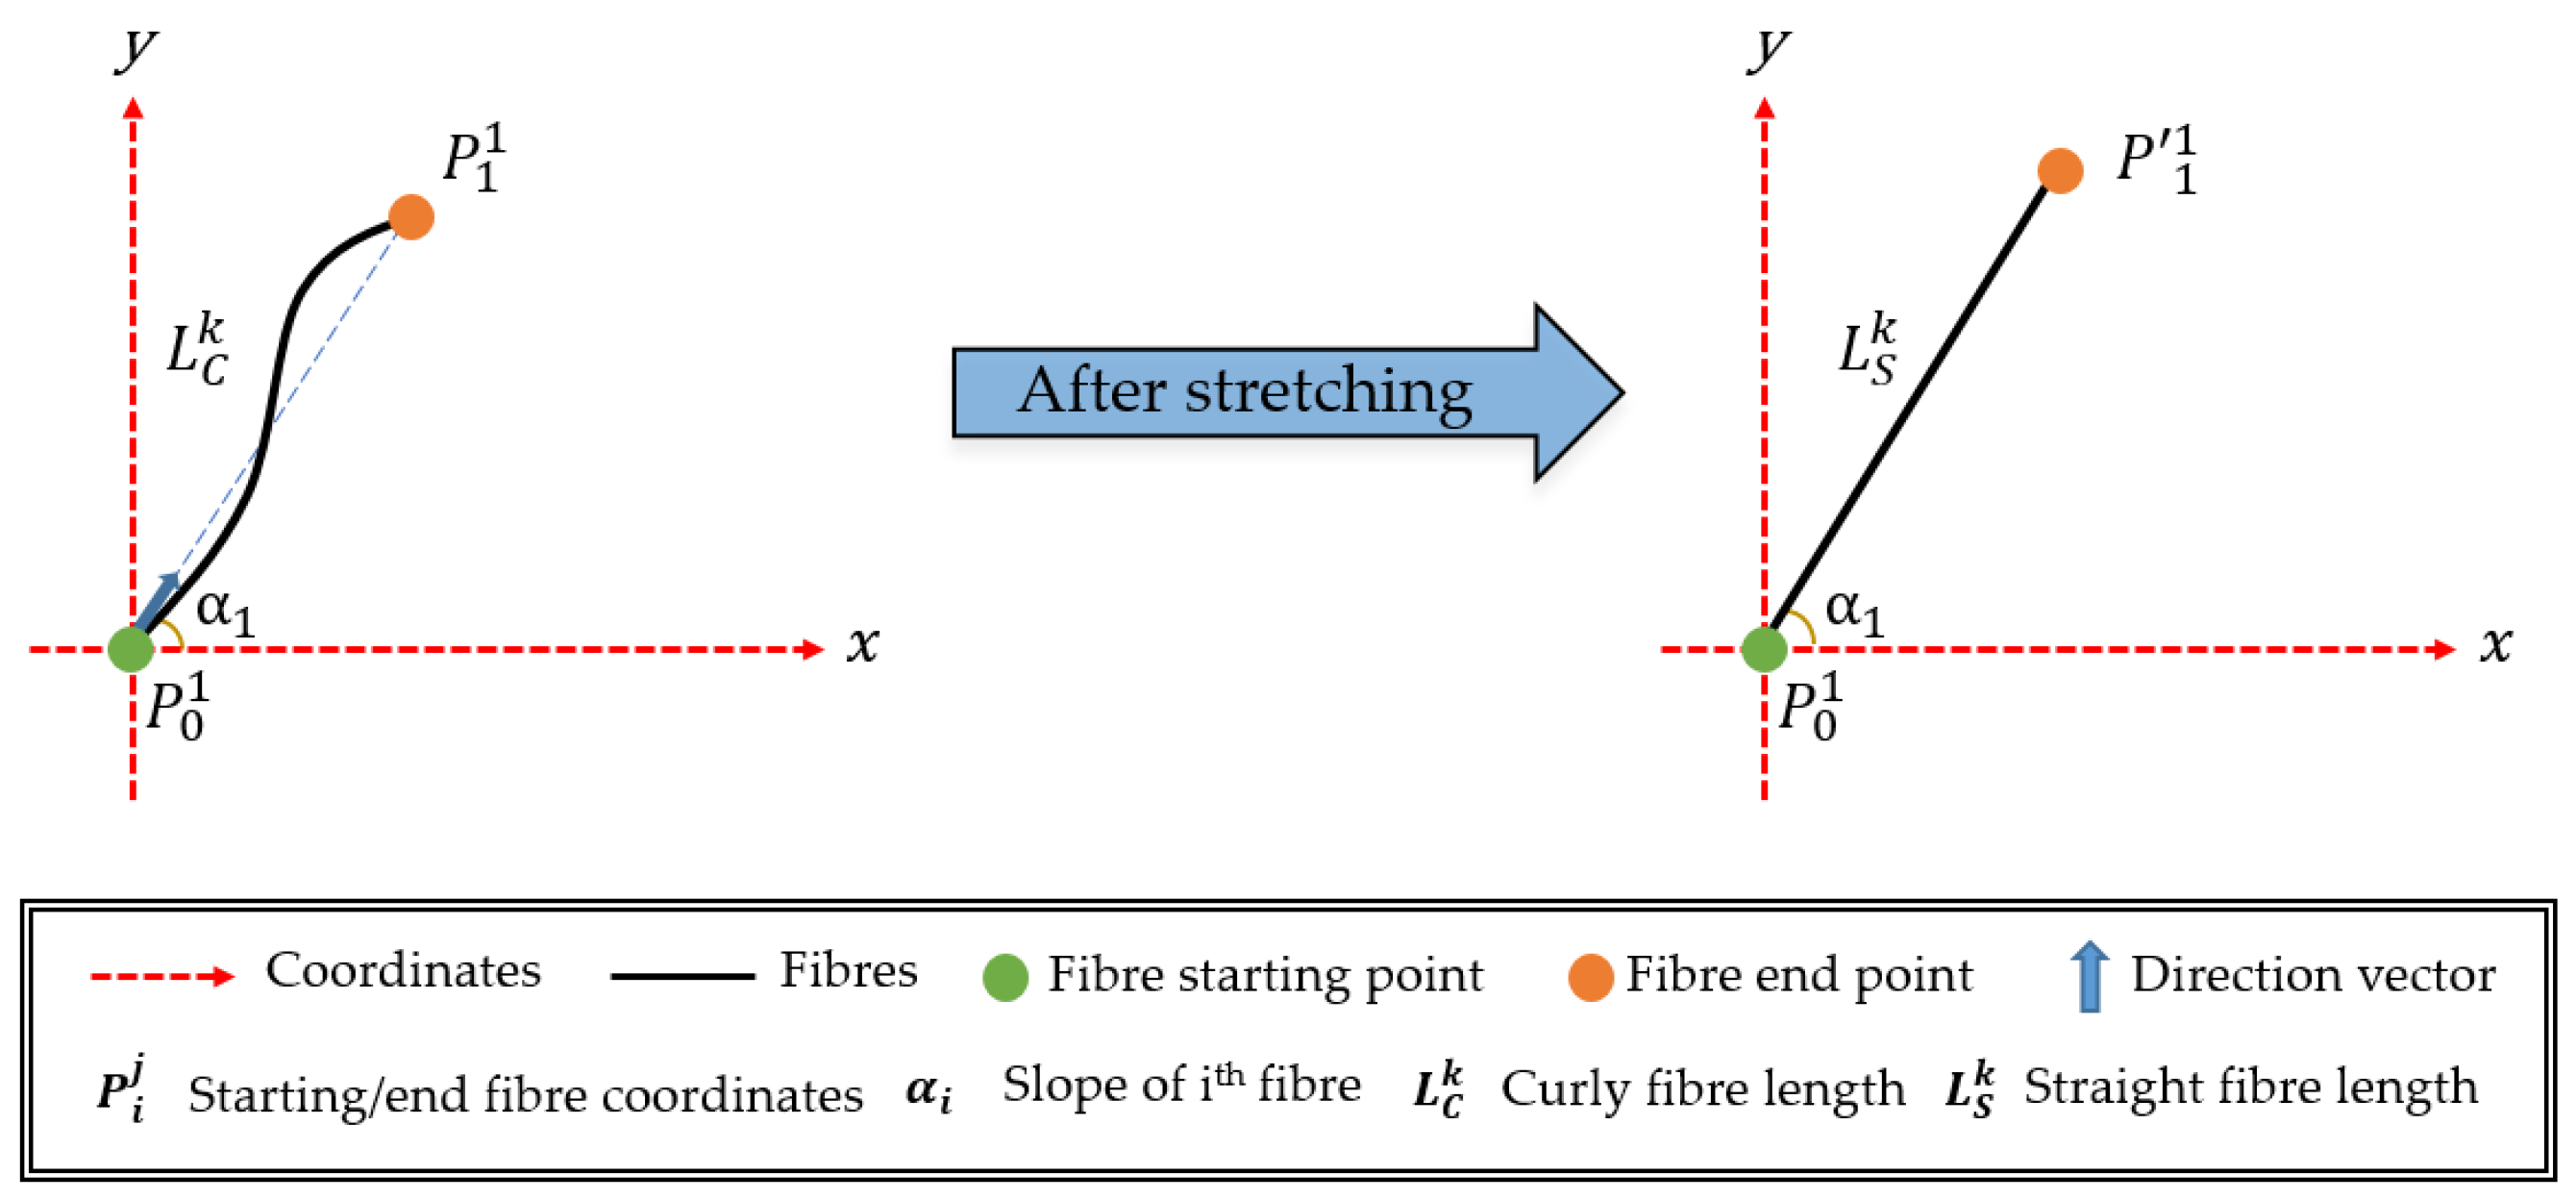
Mathematically, curliness can be calculated with the following formula [76]:
where is the average curliness (in percent), is the total number of fibres, and and are the curly and straight lengths of the kth fibre, respectively, as shown in Figure 7.
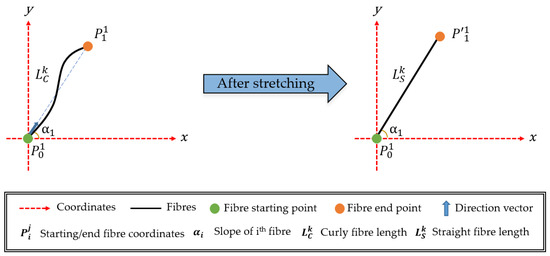
Figure 7.
Stretching a curly fibre.
Several methods (e.g., online and offline) were proposed in the literature to measure the crimp of fibrous networks. Online measurement techniques based on digital image processing are popular methods to evaluate the curliness of fibrous networks in the industry [77]. In image-based techniques, a light source with a high-resolution industrial camera is used to collect images of fibrous networks. Image processing software is employed after sample collection to evaluate the curvature data. Although industrial cameras are relatively affordable solutions, X-ray micro-computed tomography (micro-CT) is also a popular method to assess the curliness [78]. The data collection approach and the image-processing technique for X-ray micro-CT are similar to those based on industrial cameras. However, X-ray micro-CT allows researchers to investigate the fibres through the thickness direction, while industrial cameras can investigate only the in-plane features (i.e., 2D domains).
3.4. Spatial Distribution of Fibres
A characteristic of the spatial distribution of fibres, or uniformity, is the measure of the distribution order of the fibres in networks. Typically, stochastic fibrous networks can be divided into three major uniformity classes: (i) uniform, (ii) random, and (iii) clustered. The perfect uniform distribution of fibres is found in the lattice or grid structures (Figure 2A–C). On the other hand, the perfect cluster case occurs when all the fibres are collected in the same location of a fibrous network. However, comparing different fibrous networks and evaluating their uniformity levels relative to each other can also yield important results. In this case, relative uniformity should be considered instead of fully uniform or clustered cases; some examples of relatively uniform and nonuniform fibrous networks are given in Figure 8.
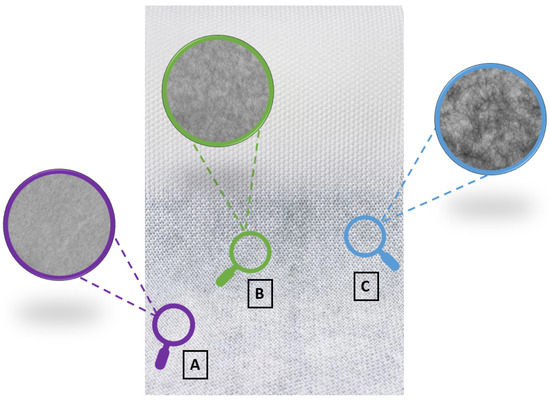
Figure 8.
Different uniformity levels: (A) relatively high uniformity; (B) relatively medium uniformity; (C) relatively low uniformity (modified after [55]).
The properties of fibrous networks, such as appearance [79], basis weight [80], and mechanical behaviour (e.g., tensile properties) [81], can also vary locally throughout the network. The spatial distribution of fibres in networks directly influences the variability of pore sizes and shapes in their microstructure [82]. Due to the variation in sizes and shapes of pores, the permeability and filtration performance of fibrous networks can change depending on the spatial distribution of fibres [79], the main reason being nonuniform distribution of fibres. This nonuniformity is caused by the manufacturing method; for instance, web formation of nonwovens, e.g., spunbonded ones, has both a preferential distribution of fibres along the moving direction of the conveyor belt and a varying local spatial density of fibres.
The importance of evaluating the filtration performance increased significantly in the last decade due to new application areas for fibrous networks in modern industry [83,84,85,86]. Especially during the COVID-19 pandemic, personal face masks became vital for the healthcare industry, increasing the demand for fibrous networks and introducing strict regulations for the evaluation of filtration performance [87]. Therefore, measuring the uniformity of fibrous networks is crucial. To achieve this, several approaches, including both online and offline methods, were developed. Offline uniformity measurement methods were developed first; they visually evaluated the spatial distribution of fibres based on samples collected from the manufacturing line. On the other hand, online techniques do not require physical collection of samples. Instead, all the manufactured networks can be instantaneously evaluated with the online techniques, using cameras. Therefore, online techniques allow manufacturers to capture any manufacturing-related issues, e.g., directly clustering fibres, and, if needed, interrupt the manufacturing process, while offline techniques are not agile. Due to the advantages of online techniques, several suitable measurement methods were developed and reported in the literature. The history of publications and classifications of both methods are given in Figure 9.

Figure 9.
Historical development of offline and online methods (see references in the text).
The earliest online uniformity measurement technique used beta (β) and gamma (γ) rays to measure the fibre mass variation over fibrous networks and was proposed by Boeckerman [88]. The developed approach was employed to measure the mass variability of fibrous networks and evaluate their uniformity. A laser scanning method was proposed by Aggarwal et al. [89] to evaluate the uniformity of fibrous networks. Based on the variations in optical density, uniformity was measured with an optical instrument by Veerbadran et al. [90]. Uniformity of the cellulosic fibrous network was also assessed with a method based on an image-processing technique by Trepanier et al. [91]. Another image-processing-based technique to measure the uniformity of fibrous networks was developed by Lien and Liu [92].
Different approaches to measure the uniformity of fibrous networks are available in the literature: (i) coefficient of variation (); (ii) quadrant; (iii) Fourier power spectrum; (iv) co-occurrence matrix; (v) fractal dimension. A comparison of these methods is summarised in Table 1 in terms of their maturity, accuracy, robustness, and efficiency. Maturity is related to the popularity of the technique, while accuracy is the measure of the technique’s precision. Robustness measures the sensitivity of the measurement parameters to several factors, e.g., light or noise. Efficiency, on the other hand, is related to the analysis time.

Table 1.
Comparison of different uniformity measurement techniques (adopted from [93]).
Quadrant-based methods are the most popular schemes, according to the literature [50,80,94,95,96], owing to their high accuracy, low sensitivity to measurement parameters (robustness), and quick analysis time. Owing to these advantages, Pourdeyhimi and Kohel [94] implemented a quadrant-based method to measure the uniformity of nonwoven fibrous networks. In this method, the fibrous domain was divided into square subsections, i.e., quadrants, to overcome the domain-size problem, an unavoidable limitation of the quadrant methods. After dividing the fibrous domain into quadrants, the uniformity index was computed based on binarised images of quadrants to evaluate the spatial distribution of fibres by implementing a statistical hypothesis testing technique, a Chi-square test.
A standardised index (), which can take a value between −1.0 (for a completely uniform fibrous network) and +1.0 (for a completely random fibrous network), was suggested by Chhabra [95] to assess the spatial distribution of fibres. An image-processing technique—the surface relief method—was applied to images prior to the statistical analysis assessing the uniformity of networks with this index.
Amirnasr et al. [80] improved the uniformity index proposed by Pourdeyhimi and Kohel. The new method used grey-value images instead of binarized ones to compute the uniformity-index value. Similar to Pourdeyhimi and Kohel, the Chi-square test was implemented to classify the fibrous networks.
Another method, proposed by Tascan and Nohut [96], was developed to overcome the limitation of the method using a coefficient of variation,
where is the standard deviation of the basis weight, and μ is the mean basis weight. This was achieved by combining this method with the quadrant-based scheme. In this way, one of the most important drawbacks of the coefficient of variation method, namely, the sample-size dependence, was resolved.
All the proposed techniques covered in the previous parts were evaluated by Moll et al. [93]. According to the reported results, the following could be concluded:
- The uniformity index based on grey-value images developed by Amirnasr et al. has challenges with consistency in the medium range of the index.
- Similar to the uniformity index developed by Amirnasr et al., Chhabra’s method, i.e., the standardised index, is also inconsistent in the medium range.
- On the other hand, the uniformity index developed by Pourdeyhimi and Kohel has a resolution problem; for example, it cannot differentiate between highly uniform fibrous networks.
- The quadrant-based coefficient of variation developed by Tascan and Nohut is the most reliable method compared with the other alternatives owing to its consistently high resolution and robustness, which prevent errors generated due to the influence of basis weight, thickness, and fibre-material-related parameters.
However, all these techniques were developed to evaluate fibrous networks using data from the manufacturing process. In contrast, there was limited research focused on the evaluation of uniformity in the computer environment, which allows researchers to optimise the stochastic microstructures of virtual fibrous networks. Therefore, Kayali et al. [55] developed an algorithm to compute the uniformity of digitally generated networks with varying basis weights employing the quadrant-based coefficient of variation without dealing with experimental constraints such as noise.
Different methods for the assessment and calculation of uniformity are also discussed in [55].
3.5. Fibre Diameter
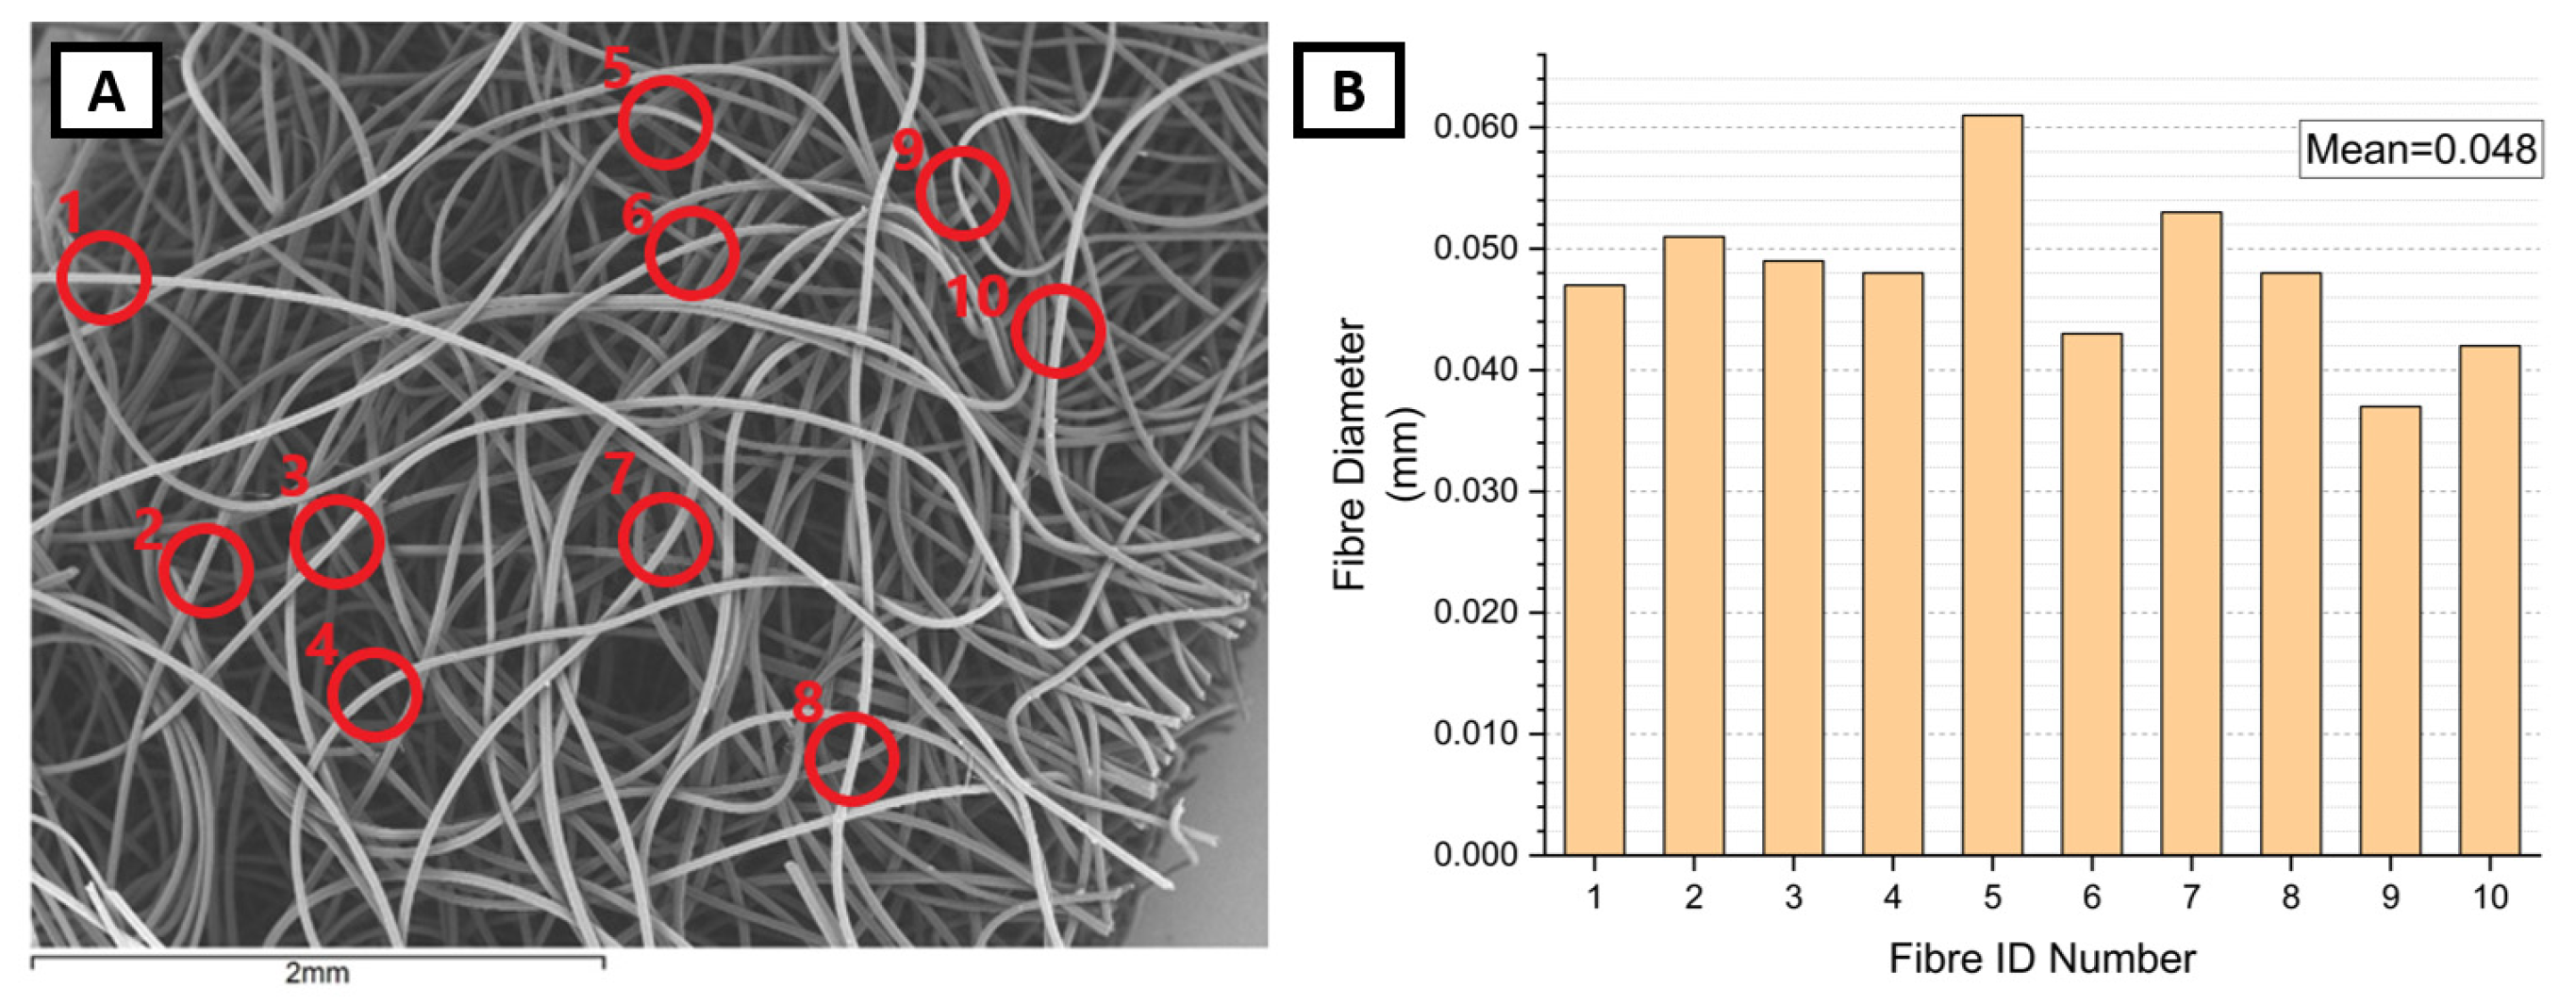
Diameters of fibres can vary in a stochastic fibrous network. The physical background of the fibre diameter is linked to the manufacture or origin of the fibrous network. The microstructure of a 90 gsm nonwoven manufactured with a spunbonding method is given in Figure 10A. Based on the captured microstructure image, the result of the performed measurements of fibre diameters are given in Figure 10B. It is apparent that the fibre diameter is not constant within the same fibrous network. Therefore, it is important to measure the variations in fibre diameter to fully characterise a fibrous network, especially its mechanical properties.
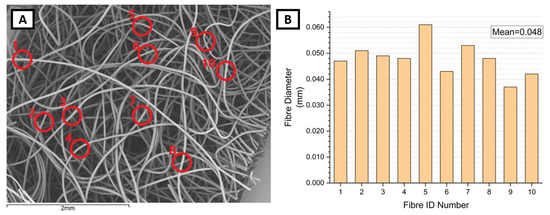
Figure 10.
Variation in fibre diameters: (A) scanning electron microscopy images of 90 (gsm) polymer-based nonwoven fibrous network; (B) measured fibre diameters (locations of measurements are denoted in (A) by red circles with respective fibre ID number).
Variation in the fibre diameter also has a strong influence on the filtration performance of fibrous networks. Therefore, various researchers have measured the fibre diameter with experimental methods, e.g., visual techniques such as microscopy [97,98,99,100,101]. Details of the fibre-diameter effect are given below in more detail.
3.6. Porosity and Pore Size Distribution
The porous microstructure of fibrous networks makes them an exceptional candidate for a wide range of filtration applications [102,103,104], e.g., including (but not restricted to) filtering particles [105] or viruses and bacteria [106,107,108]. Therefore, characterising their porous stochastic microstructure by accounting for porosity, pore shape, pore size, and distribution is vital to improving the filtration performance. Generally, porosity in 2D is the ratio of pore areas to the total area. The respective mathematical description is as follows:
where is the overall area occupied by pores, and is the total area of the fibrous network (fabric).
According to ASTM C 830, the porosity level of fibrous networks can be measured under vacuum conditions based on the amount of liquid absorbed by the fibrous network [109]. This method was implemented by some researchers to evaluate the porosity of fibrous networks [110]. Another experimental method for the assessment of porosity and analysis of the distribution of pore sizes is the liquid expulsion technique, performed by wetting the fibrous network with non-wetting liquid and measuring the pressure required for airflow to pass throughout the wet network [111]. Due to the importance of pore characteristics, several studies in the literature focused on characterisation of the porosity of fibrous networks by evaluating the pore-size distribution by implementing different methods, as shown in Table 2.

Table 2.
Selected studies for characterisation of the pores of fibrous networks.
One of the earliest studies that aimed to develop a theoretical model for the pore-size distribution in fabrics with capillary pressure methods, which accounts for geometries that augment fluids in the pores with the capillary effect, was conducted by Steele [112]. Following this, Bhatia and Smit [116] presented another method to conduct the distribution analysis of pore sizes for fibrous networks, e.g., geotextiles, based on the capillary effect. Later, fibrous networks generated with straight fibres based on Monte Carlo simulations were used to evaluate the pore-size distribution using the numerical method developed by Abdel-Gani and Davies [113]. This analytical process calculates the number of pores as
where is the number of pores, is the free layer area, A is the total surface area, and is the fibre diameter. This model was developed for low-basis-weight fibrous networks, i.e., the area occupied by fibres was assumed to be significantly smaller than the void area ().
Following this approach, Lombard et al. [114] and Faure and his colleagues [115] developed other analytical models to characterise the pose size and its distribution in fibrous networks. In the model suggested in [114], fibrous networks with randomly distributed straight fibres were generated based on the Poisson polyhedral theory. The thickness of these networks was assumed to be a single-fibre diameter in Lombard’s model, while it was two times higher in Faure’s model [115]. All the models mentioned above are based on an analytical approach (see, e.g., [112,113,114,115,116]). However, Giroud [117] suggested an early semi-empirical model based on experimental results to overcome the limitations of existing techniques.
The image-based model that employed beta radiography to characterise the pore size and its variation throughout cellulose networks was developed by Dodson et al. [118]. In this study, pore-size variation was expressed using two approaches: (i) group of continuous probability and (ii) gamma distribution. In the developed model, effects of the fibres’ alignment were not accounted for. Therefore, a new model that accounts for this factor by implementing the ODF was developed by Rawal [119]. This study proved that the alignment of fibres is important for pore-size distribution. Following Rawal, a more advanced model considering the effects of fibre diameter, the basis weight of fibrous porous network, fibre curliness, and the ODF was developed by Sozumert et al. [121] based on an image-processing technique.
According to the literature, the basis weight of fibrous networks significantly affects the pore-size distribution; for instance, an increase in the basis weight results in smaller pores. Therefore, fibrous networks with higher basis weights can filter smaller particles [114,115,119,122]. Alongside the basis weight, the thickness of fibrous networks is also important for the pore size. According to the literature results, a higher basis weight also increases the thickness of fibrous networks (for a constant fibre diameter). As a result, the number of fibrous layers throughout the thickness direction increases, decreasing the size of pores [69,114,115]. The effect of fibre diameter on the pore size was also investigated in the literature. The higher fibre diameter decreases the number of fibres in a unit volume. Therefore, the number of fibre-to-fibre interactions decreases drastically, resulting in a decreasing number of pores and an increase in their size [114,115,122].
3.7. Fibre-to-Fibre Interactions
Fibre-to-fibre interactions are crucial for defining the load-transfer (both tensile and shear) mechanism in fibrous networks. Therefore, the mechanical performance of fibrous networks is directly related to the interactions of fibres; e.g., increasing fibre-to-fibre interactions improves the effective modulus of fibrous networks [123], with their strength also dependent on these interactions, while the strength of fibre-to-fibre interactions has a considerable effect on these parameters [6,124,125,126,127,128]. Fibre-to-fibre contacts can be defined in terms of the following joint types: (i) pin joints, which allow only axial force transfer between fibres without allowing the transfer of bending moments; (ii) rotating joints that allow the transfer of bending moments; (iii) welding joints that allow bending-moment transfer but restrict the angles between the contacting fibres [37].
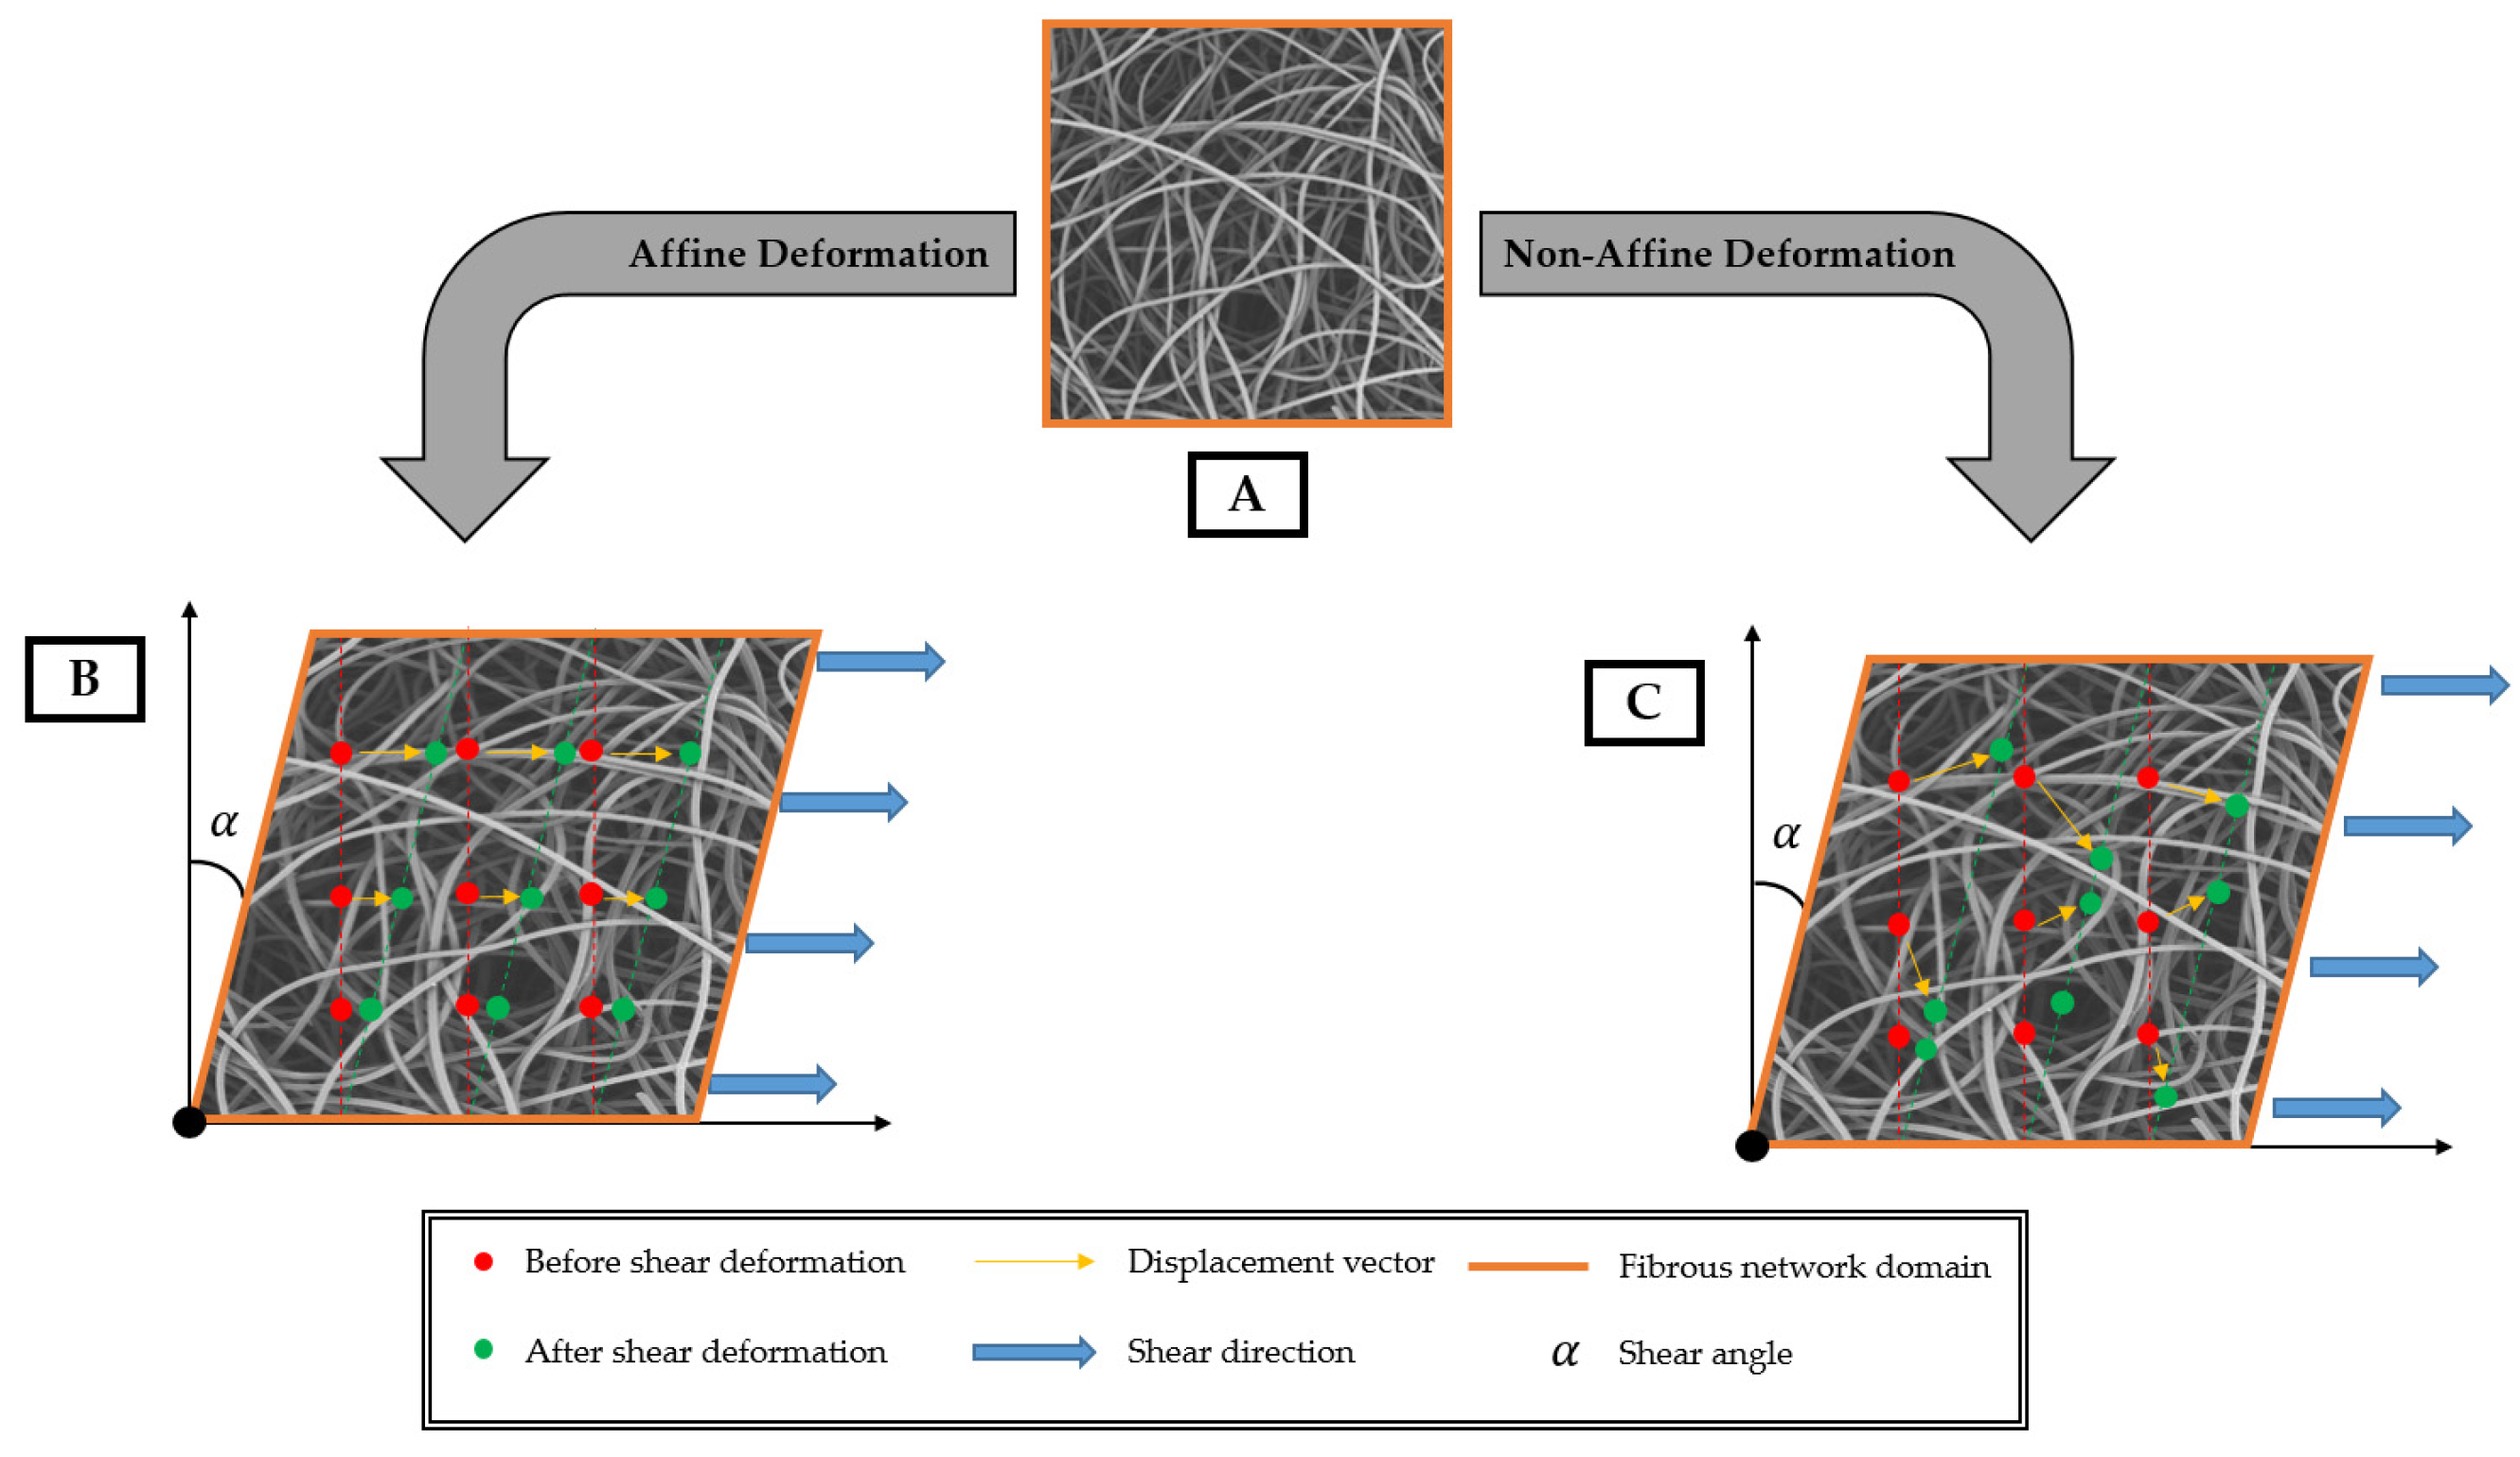
The load-transfer mechanism can be affected by the character of distribution of fibre-to-fibre interactions in a network [129]. As a result, in contrast with conventional materials (e.g., metals), local strain variability can be observed in fibrous networks and is the primary reason for their non-affine deformation. This is a typical feature of stochastic fibrous networks that are characterised by nonlinear correlation of position vectors under uniform loading [130]. A comparison of affine and non-affine deformation behaviours of networks is presented in Figure 11. Non-affine deformations of stochastic fibrous networks in elastic regimes were investigated based on a scaling theory [131,132,133,134]. The obtained results demonstrated that the orientation distribution of fibres also played a considerable role in the deformation affinity; e.g., the level of non-affine behaviour was decreased by increasing the alignment of fibres in networks [134].
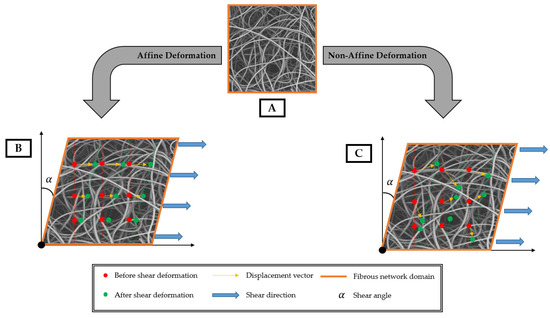
Figure 11.
Affine and non-affine deformation comparison: (A) fibrous network before deformation; (B) affine deformation; (C) non-affine deformation.
4. Conclusions
Fibrous networks are a broad group of materials that have natural (e.g., collagen or bacterial cellulose fibrous networks) and manmade (e.g., polymer-based nonwovens) examples. The primary difference between fibrous networks and conventional bulk materials is their discrete microstructures, which are the primary reason for their porous microstructures. Owing to the discrete microstructures, the strength-to-weight ratio of fibrous networks is higher than that of conventional materials with continuous microstructures. Although discrete microstructures improve the performance of fibrous networks in various fields, including (but not restricted to) mechanical and filtration performance, the geometrical characterisation of such microstructures is still a challenging task. Due to their complex microstructures, several parameters, e.g., basis weight, ODF, crimp, uniformity, porosity, etc., were suggested to characterise stochastic fibrous networks in 2D. Therefore, the main parameters used in the literature to characterise such networks were covered in this research. The study briefly covered the principles of characterisation, analytical expression for parameters, different methods to measure them, and the links between the microstructural parameters and the performance of networks (e.g., mechanical behaviour or filtration).
Although various geometric parameters were presented and used in different studies, there is no consensus about the set of parameters that should be assessed to fully characterise the stochastic microstructures of fibrous networks. Moreover, there are several different methods to measure the same parameters, which can yield different results. Hence, the performance of different techniques used to measure the geometrical parameters should be investigated to evaluate their precision. Also, the measurement results vary depending on the implementation of the methodologies (e.g., ODF results); this can also cause some confusion. Finally, there is a lack of experimental techniques to measure some important parameters, especially at the micro scale, such as fibre-to-fibre interactions. Their development could be the next step in the geometric characterisation of stochastic fibrous networks.
Author Contributions
Conceptualization Y.K., A.G. and V.V.S.; methodology Y.K., A.G. and V.V.S.; validation Y.K., A.G. and V.V.S.; investigation, Y.K.; writing—original draft, Y.K.; writing—review and editing, A.G. and V.V.S. All authors have read and agreed to the published version of the manuscript.
Funding
This research received no external funding.
Data Availability Statement
All the data are present within the article.
Conflicts of Interest
Author Yagiz Kayali was employed by the company Advanced Technologies and Systems Division, Roketsan Inc. The remaining authors declare that the research was conducted in the absence of any commercial or financial relationships that could be construed as a potential conflict of interest.
References
- Yang, W.; Sherman, V.R.; Gludovatz, B.; Schaible, E.; Stewart, P.; Ritchie, R.O.; Meyers, M.A. On the Tear Resistance of Skin. Nat. Commun. 2015, 6, 6649. [Google Scholar] [CrossRef]
- Gasser, T.C.; Ogden, R.W.; Holzapfel, G.A. Hyperelastic Modelling of Arterial Layers with Distributed Collagen Fibre Orientations. J. R. Soc. Interface 2006, 3, 15–35. [Google Scholar] [CrossRef]
- Ovaska, M.; Bertalan, Z.; Miksic, A.; Sugni, M.; Di Benedetto, C.; Ferrario, C.; Leggio, L.; Guidetti, L.; Alava, M.J.; La Porta, C.A.M.; et al. Deformation and Fracture of Echinoderm Collagen Networks. J. Mech. Behav. Biomed. Mater. 2017, 65, 42–52. [Google Scholar] [CrossRef]
- Jin, K.; Qin, Z.; Buehler, M.J. Molecular Deformation Mechanisms of the Wood Cell Wall Material. J. Mech. Behav. Biomed. Mater. 2015, 42, 198–206. [Google Scholar] [CrossRef]
- Youssefian, S.; Rahbar, N. Molecular Origin of Strength and Stiffness in Bamboo Fibrils. Sci. Rep. 2015, 5, 11116. [Google Scholar] [CrossRef]
- Domaschke, S.; Zündel, M.; Mazza, E.; Ehret, A.E. A 3D Computational Model of Electrospun Networks and Its Application to Inform a Reduced Modelling Approach. Int. J. Solids Struct. 2019, 158, 76–89. [Google Scholar] [CrossRef]
- Xue, J.; Wu, T.; Dai, Y.; Xi, Y. Electrospinning and Electrospun Nanofibers: Methods, Materials, and Applications. Chem. Rev. 2019, 119, 5298–5415. [Google Scholar] [CrossRef]
- Moon, J.; Bui, T.T.; Jang, S.; Ji, S.; Park, J.T.; Kim, M.-G. A Highly Efficient Nanofibrous Air Filter Membrane Fabricated Using Electrospun Amphiphilic PVDF-g-POEM Double Comb Copolymer. Sep. Purif. Technol. 2021, 279, 119625. [Google Scholar] [CrossRef]
- Borojeni, I.A.; Gajewski, G.; Riahi, R.A. Application of Electrospun Nonwoven Fibers in Air Filters. Fibers 2022, 27, 15. [Google Scholar] [CrossRef]
- Albrecht, W.; Fuchs, H.; Kittelmann, W. Nonwoven Fabrics: Raw Materials, Manufacture, Applications, Characteristics, Testing Processes; Wiley: Hoboken, NJ, USA, 2002. [Google Scholar] [CrossRef]
- Chapman, R. Applications of Nonwovens in Technical Textiles; Elsevier: Amsterdam, The Netherlands, 2010. [Google Scholar]
- Ajmeri, J.R.; Ajmeri, C.J. Developments in Nonwovens as Agrotextiles. In Advances in Technical Nonwovens; Kellie, G., Ed.; Woodhead Publishing Series in Textiles; Woodhead Publishing: Sawston, UK, 2016; pp. 365–384. ISBN 978-0-08-100575-0. [Google Scholar]
- Guhados, G.; Wan, W.; Hutter, J.L. Measurement of the Elastic Modulus of Single Bacterial Cellulose Fibers Using Atomic Force Microscopy. Langmuir 2005, 21, 6642–6646. [Google Scholar] [CrossRef]
- Torres, F.; Commeaux, S.; Troncoso, O. Biocompatibility of Bacterial Cellulose Based Biomaterials. J. Funct. Biomater. 2012, 3, 864–878. [Google Scholar] [CrossRef]
- Gao, X.; Sözümert, E.; Shi, Z.; Yang, G.; Silberschmidt, V.V. Mechanical Modification of Bacterial Cellulose Hydrogel under Biaxial Cyclic Tension. Mech. Mater. 2020, 142, 103272. [Google Scholar] [CrossRef]
- Xu, F.; Du, X.; Liu, H.; Mai, Y.; Wang, X. Interlaminar Toughening Effects and Mechanisms of Non-Woven Carbon Fiber Tissue on CFRP Laminates. Fuhe Cailiao Xuebao Acta Mater. Compos. Sin. 2015, 32, 1784–1790. [Google Scholar] [CrossRef]
- Tse, B.; Yu, X.; Gong, H.; Soutis, C. Flexural Properties of Wet-Laid Hybrid Nonwoven Recycled Carbon and Flax Fibre Composites in Poly-Lactic Acid Matrix. Aerospace 2018, 5, 120. [Google Scholar] [CrossRef]
- Xu, F.; Huang, D.; Du, X. Improving the Delamination Resistance of Carbon Fiber/Epoxy Composites by Brushing and Abrading of the Woven Fabrics. Constr. Build. Mater. 2018, 158, 257–263. [Google Scholar] [CrossRef]
- Dhanakodi, A.K.P.; Hemamalini, T.; Navamithra, A.B.; Arun, T.; Swetha, G.; Giri Dev, V.R. Effect of Carbon Fillers as Fibres on the Flexural and Impact Performance of Wet Laid Polypropylene Nonwoven Composites. J. Text. Inst. 2022, 113, 589–594. [Google Scholar] [CrossRef]
- Yang, L.; Wang, H.; Leng, D.; Fang, S.; Yang, Y.; Du, Y. Machine Learning Applications in Nanomaterials: Recent Advances and Future Perspectives. Chem. Eng. J. 2024, 500, 156687. [Google Scholar] [CrossRef]
- Soszyn’ski, R.M. Simulation of Two-Dimensional Random Fiber Networks. Nord. Pulp Pap. Res. J. 1992, 7, 160–162. [Google Scholar] [CrossRef]
- Lavrykov, S.; Ramarao, B.; Lindström, S.; Singh, K. 3D Network Simulations of Paper Structure. Nord. Pulp Pap. Res. J. 2012, 27, 256–263. [Google Scholar] [CrossRef]
- Considine, J.M.; Vahey, D.W.; Evans, J.W.; Turner, K.T.; Rowlands, R.E. Evaluation of Strength-Controlling Defects in Paper by Stress Concentration Analyses. J. Compos. Mater. 2012, 46, 1323–1334. [Google Scholar] [CrossRef]
- Moreno-Arotzena, O.; Meier, J.G.; Del Amo, C.; García-Aznar, J.M. Characterization of Fibrin and Collagen Gels for Engineering Wound Healing Models. Materials 2015, 8, 1636–1651. [Google Scholar] [CrossRef]
- Gültekin, E.; Çelik, H.İ.; Nohut, S.; Elma, S.K. Predicting Air Permeability and Porosity of Nonwovens with Image Processing and Artificial Intelligence Methods. J. Text. Inst. 2020, 111, 1641–1651. [Google Scholar] [CrossRef]
- Zobel, S.; Gries, T. The Use of Nonwovens as Filtration Materials. In Applications of Nonwovens in Technical Textiles; Chapman, R.A., Ed.; Woodhead Publishing Series in Textiles; Woodhead Publishing: Sawston, UK, 2010; pp. 160–183. ISBN 978-1-84569-437-1. [Google Scholar]
- Mu, J.; Pei, X.; Dai, W.; Zhang, J.; Luo, T.; He, Y.; Luo, W. A Novel Biodegradable Fibrous Membrane with Remarkable Filtration and Antibacterial Properties. J. Polym. Environ. 2021, 29, 4040–4047. [Google Scholar] [CrossRef]
- Wang, P.; Cutts, W.D.; Ning, H.; Pillay, S.; Liu, S. Effects of Chemical and Autoclave Sterilization Treatments on Medical Personal Protective Equipment Made of Nonwoven Polypropylene Fibers for Recycling. J. Polym. Res. 2022, 29, 360. [Google Scholar] [CrossRef]
- Adanur, S.; Jayswal, A. Filtration Mechanisms and Manufacturing Methods of Face Masks: An Overview. J. Ind. Text. 2020, 51, 3683S–3717S. [Google Scholar] [CrossRef]
- Karmacharya, M.; Kumar, S.; Gulenko, O.; Cho, Y.-K. Advances in Facemasks during the COVID-19 Pandemic Era. ACS Appl. Bio Mater. J. 2021, 4, 3891–3908. [Google Scholar] [CrossRef]
- Fereiduni, E.; Yakout, M.; Elbestawi, M. Laser-Based Additive Manufacturing of Lightweight Metal Matrix Composites. In Additive Manufacturing of Emerging Materials; AlMangour, B., Ed.; Springer International Publishing: Cham, Switzerland, 2019; pp. 55–109. ISBN 978-3-319-91713-9. [Google Scholar]
- Li, Y.; Xiao, Y.; Yu, L.; Ji, K.; Li, D. A Review on the Tooling Technologies for Composites Manufacturing of Aerospace Structures: Materials, Structures and Processes. Compos. Part A Appl. Sci. Manuf. 2022, 154, 106762. [Google Scholar] [CrossRef]
- Jeon, H.Y.; Kim, S.H.; Chung, Y.I.; Park, Y.M.; Chung, C.G. Analysis of the Drainage Performance of Geotextile Composites under Confined Loads. Polym. Test. 2004, 23, 239–244. [Google Scholar] [CrossRef]
- Rawal, A.; Anandjiwala, R. Comparative Study between Needlepunched Nonwoven Geotextile Structures Made from Flax and Polyester Fibres. Geotext. Geomembr. 2007, 25, 61–65. [Google Scholar] [CrossRef]
- Rawal, A.; Anand, S.; Shah, T. Optimization of Parameters for the Production of Needlepunched Nonwoven Geotextiles. J. Ind. Text. 2008, 37, 341–356. [Google Scholar] [CrossRef]
- Michielsen, S.; Pourdeyhimi, B.; Desai, P. Review of Thermally Point-Bonded Nonwovens: Materials, Processes, and Properties. J. Appl. Polym. Sci. 2006, 99, 2489–2496. [Google Scholar] [CrossRef]
- Picu, R. Mechanics of Random Fiber Networks—A Review. Soft Matter 2011, 7, 6768–6785. [Google Scholar] [CrossRef]
- Horoshenkov, K.V. A Review of Acoustical Methods for Porous Material Characterisation. Int. J. Acoust. Vib. 2017, 22, 92–103. [Google Scholar] [CrossRef]
- Zhang, X.Z.; Leary, M.; Tang, H.P.; Song, T.; Qian, M. Selective Electron Beam Manufactured Ti-6Al-4V Lattice Structures for Orthopedic Implant Applications: Current Status and Outstanding Challenges. Curr. Opin. Solid State Mater. Sci. 2018, 22, 75–99. [Google Scholar] [CrossRef]
- Zadpoor, A.A. Mechanical Performance of Additively Manufactured Meta-Biomaterials. Acta Biomater. 2019, 85, 41–59. [Google Scholar] [CrossRef]
- Maconachie, T.; Leary, M.; Lozanovski, B.; Zhang, X.; Qian, M.; Faruque, O.; Brandt, M. SLM Lattice Structures: Properties, Performance, Applications and Challenges. Mater. Des. 2019, 183, 108137. [Google Scholar] [CrossRef]
- Kayali, Y.; Ding, M.; Hamdallah, S.; Qi, S.; Bibb, R.; Gleadall, A. Effect of Printing Parameters on Microscale Geometry for 3D Printed Lattice Structures. Mater. Today Proc. 2022, 70, 31–37. [Google Scholar] [CrossRef]
- Pan, C.; Han, Y.; Lu, J. Design and Optimization of Lattice Structures: A Review. Appl. Sci. 2020, 10, 6374. [Google Scholar] [CrossRef]
- Fratzl, P. (Ed.) Collagen: Structure and Mechanics; Springer: New York, NY, USA, 2008; ISBN 978-0-387-73905-2. [Google Scholar]
- Sherman, V.R.; Tang, Y.Z.; Zhao, S.T.; Yang, W.; Meyers, M.A. Structural Characterization and Viscoelastic Constitutive Modeling of Skin. Acta Biomater. 2017, 53, 460–469. [Google Scholar] [CrossRef]
- Coradin, T.; Wang, K.; Law, T.; Trichet, L. Type I Collagen-Fibrin Mixed Hydrogels: Preparation, Properties and Biomedical Applications. Gels 2020, 6, 36. [Google Scholar] [CrossRef]
- Russell, S. Handbook of Nonwovens; Woodhead Publishing: Sawston, UK, 2006. [Google Scholar]
- ISO 9073-1:2023; Nonwovens—Test Methods—Part 1: Determination of Mass per Unit Area. International Organization for Standardization: Geneva, Switzerland, 2023.
- ISO 186:2002; Sampling to Determine Average Quality. International Organization for Standardization: Geneva, Switzerland, 2022.
- Cox, H.L. The Elasticity and Strength of Paper and Other Fibrous Materials. Br. J. Appl. Phys. 1952, 3, 72–79. [Google Scholar] [CrossRef]
- Martínez-Hergueta, F.; Ridruejo, A.; Gálvez, F.; González, C.; LLorca, J. Influence of Fiber Orientation on the Ballistic Performance of Needlepunched Nonwoven Fabrics. Mech. Mater. 2016, 94, 106–116. [Google Scholar] [CrossRef]
- Ivars, J.; Labanieh, A.R.; Soulat, D. Effect of the Fibre Orientation Distribution on the Mechanical and Preforming Behaviour of Nonwoven Preform Made of Recycled Carbon Fibres. Fibers 2021, 9, 82. [Google Scholar] [CrossRef]
- Sozumert, E.; Cucumazzo, V.; Silberschmidt, V.V. Deformation and Damage of Random Fibrous Networks. In Mechanics of Fibrous Networks; Silberschmidt, V.V., Ed.; Elsevier Series in Mechanics of Advanced Materials; Elsevier: Amsterdam, The Netherlands, 2022; pp. 203–219. ISBN 978-0-12-822207-2. [Google Scholar]
- Kallel, H.; Joulain, K. Design and Thermal Conductivity of 3D Artificial Cross-Linked Random Fiber Networks. Mater. Des. 2022, 220, 110800. [Google Scholar] [CrossRef]
- Kayali, Y.; Balci, M.N.; Gleadall, A.; Silberschmidt, V.V.; Demirci, E. Numerical Characterisation of Uniformity of Fibrous Networks. Powder Technol. 2022, 408, 117783. [Google Scholar] [CrossRef]
- Kayali, Y.; Gleadall, A.; Silberschmidt, V.V.; Demirci, E. Advance Algorithm for Two-Dimensional Fibrous-Network Generation. J. Comput. Des. Eng. 2023, 10, 1790–1803. [Google Scholar] [CrossRef]
- Hearle, J.; Stevenson, P. Nonwoven Fabric Studies: Part III: The Anisotropy of Nonwoven Fabrics. Text. Res. J. 1963, 33, 877–888. [Google Scholar] [CrossRef]
- Chudleigh, P. Image Formation by Fibers and Fiber Assemblies. Text. Res. J. 1984, 54, 813–820. [Google Scholar] [CrossRef]
- Xu, B.; Ting, Y.-L. Measuring Structural Characteristics of Fiber Segments in Nonwoven Fabrics. Text. Res. J. 1995, 65, 41–48. [Google Scholar]
- Kim, H.S.; Pourdeyhimi, B.; Desai, P.; Abhiraman, A.S. Anisotropy in the Mechanical Properties of Thermally Spot-Bonded Nonwovens: Experimental Observations. Text. Res. J. 2001, 71, 965–976. [Google Scholar] [CrossRef]
- Yu, B.; Zhao, X.; Zeng, Y.; Qi, D. The Influence of Process Parameters on Needle Punched Nonwovens Investigated Using Image Analysis. RSC Adv. 2017, 7, 5183–5188. [Google Scholar] [CrossRef]
- Hou, J.; Xu, B.; Gao, H.; Wang, R. Measuring Fiber Orientations in Nonwoven Web Images Using Corner Detection by Bézier Fitting Curves. Text. Res. J. 2018, 88, 2120–2131. [Google Scholar] [CrossRef]
- Chen, Y.; Deng, N.; Xin, B.-J.; Xing, W.-Y.; Zhang, Z.-Y. Structural Characterization and Measurement of Nonwoven Fabrics Based on Multi-Focus Image Fusion. Measurement 2019, 141, 356–363. [Google Scholar] [CrossRef]
- Kim, H.; Pourdeyhimi, B.; Abhiraman, A.; Desai, P. Effect of Bonding Temperature on Load-Deformation Structural Changes in Point-Bonded Nonwoven Fabrics. Text. Res. J. 2002, 72, 645–653. [Google Scholar] [CrossRef]
- Sander, E.A.; Barocas, V.H. Comparison of 2D Fiber Network Orientation Measurement Methods. J. Biomed. Mater. Res. Part A 2009, 88A, 322–331. [Google Scholar] [CrossRef]
- Gager, V.; Legland, D.; Bourmaud, A.; Le Duigou, A.; Pierre, F.; Behlouli, K.; Baley, C. Oriented Granulometry to Quantify Fibre Orientation Distributions in Synthetic and Plant Fibre Composite Preforms. Ind. Crops Prod. 2020, 152, 112548. [Google Scholar] [CrossRef]
- Jlassi, S.; Berthet, F.; Bernhart, G. Investigation of Mechanical Properties of Nonwoven Second Generation Composite Material Elaborated through a Mixture of Carbon Fibers and Filament Lengths. In Proceedings of the 18th European Conference on Composite Materials, Athènes, Greece, 25–28 June 2018; ISBN 978-151089693-2. [Google Scholar]
- Cacho, F.; Elbischger, P.J.; Rodríguez, J.F.; Doblaré, M.; Holzapfel, G.A. A Constitutive Model for Fibrous Tissues Considering Collagen Fiber Crimp. Int. J. Non-Linear Mech. 2007, 42, 391–402. [Google Scholar] [CrossRef]
- Ban, E.; Barocas, V.H.; Shephard, M.S.; Picu, C.R. Effect of Fiber Crimp on the Elasticity of Random Fiber Networks with and Without Embedding Matrices. J. Appl. Mech. 2016, 83, 041008–0410087. [Google Scholar] [CrossRef]
- Kumar, V.; Rawal, A. Elastic Moduli of Electrospun Mats: Importance of Fiber Curvature and Specimen Dimensions. J. Mech. Behav. Biomed. Mater. 2017, 72, 6–13. [Google Scholar] [CrossRef]
- Barach, J.L.; Rainard, L.W. Effect of Crimp on Fiber Behavior: Part II: Addition of Crimp to Wool Fibers and Its Effect on Fiber Properties. Text. Res. J. 1950, 20, 308–316. [Google Scholar] [CrossRef]
- Tanchis, G. Reference Books of Textiles Technologies: The Nonwovens, 1st ed.; Fondazione Acimit: Biella, Italy, 2008. [Google Scholar]
- Alexander, E.; Lewin, M.; Muhsam, H.V.; Shiloh, M. Definition and Measurement of Crimp of Textile Fibers. Text. Res. J. 1956, 26, 606–617. [Google Scholar] [CrossRef]
- Matsudaira, M.; Kawabata, S.; Niwa, M. 29—The Effect of Fibre Crimp on Fabric Quality. J. Text. Inst. 1984, 75, 273–277. [Google Scholar] [CrossRef]
- Xu, B.; Pourdeyhimi, B.; Sobus, J. Characterizing Fiber Crimp by Image Analysis: Definitions, Algorithms, and Techniques. Text. Res. J. 1992, 62, 73–80. [Google Scholar] [CrossRef]
- Maity, S. Characteristics and Effects of Fibre Crimp in Nonwoven Structure. J. Text. Assoc. 2014, 76, 360–366. [Google Scholar]
- Products|Lenzing Instruments|Upper Austria & Austria. Available online: https://lenzing-instruments.com/ (accessed on 13 January 2025).
- Huang, X.; Wen, D.; Zhao, Y.; Wang, Q.; Zhou, W.; Deng, D. Skeleton-Based Tracing of Curved Fibers from 3D X-Ray Microtomographic Imaging. Results Phys. 2016, 6, 170–177. [Google Scholar] [CrossRef][Green Version]
- Ericson, C.W.; Baxter, J.F. Spunbonded Nonwoven Fabric Studies: I: Characterization of Filament Arrangement in the Web. Text. Res. J. 1973, 43, 371–378. [Google Scholar] [CrossRef]
- Amirnasr, E.; Shim, E.; Yeom, B.-Y.; Pourdeyhimi, B. Basis Weight Uniformity Analysis in Nonwovens. J. Text. Inst. 2014, 105, 444–453. [Google Scholar] [CrossRef]
- Emadi, M.; Tavanaie, M.A.; Payvandy, P. Measurement of the Uniformity of Thermally Bonded Points in Polypropylene Spunbonded Non-Wovens Using Image Processing and Its Relationship with Their Tensile Properties. Autex Res. J. 2018, 18, 405–418. [Google Scholar] [CrossRef]
- Mohammadi, M.; Banks-Lee, P. Air Permeability of Multilayered Nonwoven Fabrics: Comparison of Experimental and Theoretical Results. Text. Res. J. 2002, 72, 613–617. [Google Scholar] [CrossRef]
- Schweers, E.; Löffler, F. Realistic Modelling of the Behaviour of Fibrous Filters through Consideration of Filter Structure. Powder Technol. 1994, 80, 191–206. [Google Scholar] [CrossRef]
- Hosseini, S.A.; Tafreshi, H.V. 3-D Simulation of Particle Filtration in Electrospun Nanofibrous Filters. Powder Technol. 2010, 201, 153–160. [Google Scholar] [CrossRef]
- Huang, X.; Wang, Q.; Zhou, W.; Deng, D.; Zhao, Y.; Wen, D.; Li, J. Morphology and Transport Properties of Fibrous Porous Media. Powder Technol. 2015, 283, 618–626. [Google Scholar] [CrossRef]
- Sheng, Y.; Wang, M.; Zhang, L.; Ren, Q. Analysis of Filtration Process of 3-D Mesh Spacer Filter by Using CFD-DEM Simulation. Powder Technol. 2022, 396, 785–793. [Google Scholar] [CrossRef]
- Avinash Patil, N.; Macchindra Gore, P.; Shanmugrajan, D.; Patil, H.; Kudav, M.; Kandasubramanian, B. Functionalized Non-Woven Surfaces for Combating the Spread of the COVID-19 Pandemic. Interface Focus 2021, 12, 20210040. [Google Scholar] [CrossRef]
- Boeckerman, P.A. Meeting the Special Requirements for On-Line Basis Weight Measurement of Lightweight Nonwoven Fabrics. In Proceedings of the 1992 Nonwovens Conference, Marco Island, FL, USA, 10–14 May 1992. [Google Scholar]
- Aggarwal, R.; Kennon, W.; Porat, I. A Scanned-Laser Technique for Monitoring Fibrous Webs and Nonwoven Fabrics. J. Text. Inst. 1992, 83, 386–398. [Google Scholar] [CrossRef]
- Veerabadran, R.; Davis, H.A.; Batra, S.K.; Bullerwell, A.C. Devices for On-Line Assessment of Nonwovens’ Basis Weights and Structures. Text. Res. J. 1996, 66, 257–264. [Google Scholar] [CrossRef]
- Trepanier, R.; Jordan, B.; Nguyen, N. Specific Perimeter: A Statistic for Assessing Formation and Print Quality by Image Analysis. Tappi J. 1998, 81, 191–196. [Google Scholar]
- Lien, H.-C.; Liu, C.-H. A Method of Inspecting Non-Woven Basis Weight Using the Exponential Law of Absorption and Image Processing. Text. Res. J. 2006, 76, 547–558. [Google Scholar] [CrossRef]
- Moll, P.; Wang, S.; Coutandin, S.; Fleischer, J. Analysis of Basis Weight Uniformity Indexes for the Evaluation of Fiber Injection Molded Nonwoven Preforms. Autex Res. J. 2021, 21, 341–351. [Google Scholar] [CrossRef]
- Pourdeyhimi, B.; Kohel, L. Area-Based Strategy for Determining Web Uniformity. Text. Res. J. 2002, 72, 1065–1072. [Google Scholar] [CrossRef]
- Chhabra, R. Nonwoven Uniformity—Measurements Using Image Analysis. Int. Nonwovens J. 2003, os-12, 1558925003os-1200112. [Google Scholar] [CrossRef]
- Tascan, M.; Nohut, S. Nondestructive Prediction of Areal Weight, Grab Tensile Strength and Elongation at Break of Polypropylene (PP) Spunbond Nonwoven Fabrics Using Digital Image Analysis. Tekst. Ve Konfeksiyon 2015, 25, 24. [Google Scholar]
- Pourdehyhimi, B.; Dent, R.; Jerbi, A.; Tanaka, S.; Deshpande, A. Measuring Fiber Orientation in Nonwovens Part V: Real Webs. Text. Res. J. 1999, 69, 185–192. [Google Scholar] [CrossRef]
- Pourdeyhimi, B.; Dent, R. Measuring Fiber Diameter Distribution in Nonwovens. Text. Res. J. 1999, 69, 233–236. [Google Scholar] [CrossRef]
- Barella, A. Measuring Fiber Diameter Distribution in Nonwovens. Text. Res. J. 2000, 70, 277. [Google Scholar] [CrossRef]
- Zhao, B. Experimental Study and Numerical Analysis for Prediction of the Fibre Diameter of Polylactic Acid (PLA) Spunbonded Nonwovens. Fibres Text. East. Eur. 2009, 17, 82–86. [Google Scholar]
- Singha, K.; Maity, S.; Singha, M.; Paul, P.; Gon, D.P. Effects of Fiber Diameter Distribution of Nonwoven Fabrics on Its Properties. Int. J. Text. Sci. 2012, 1, 7–14. [Google Scholar]
- Manickam, S.S.; McCutcheon, J.R. Characterization of Polymeric Nonwovens Using Porosimetry, Porometry and X-Ray Computed Tomography. J. Membr. Sci. 2012, 407–408, 108–115. [Google Scholar] [CrossRef]
- Song, Y.; Shim, E. Structure Characterization of the Clogging Process of Coarse Fibrous Filter Media during Solid Particle Loading with X-Ray Micro-Computed Tomography. Sep. Purif. Technol. 2021, 273, 118980. [Google Scholar] [CrossRef]
- Zhou, M.; Shi, L.; Dai, H.; Obed, A.; Liu, P.; Wu, J.; Qin, X.; Wang, R. Facile Fabrication of Reinforced Sub-Micron Fibrous Media with Hierarchical Structure Compounded Thermally for Effective Air Purification in Application. Sep. Purif. Technol. 2022, 289, 120726. [Google Scholar] [CrossRef]
- Allam, S.; Elsaid, A.M. Parametric Study on Vehicle Fuel Economy and Optimization Criteria of the Pleated Air Filter Designs to Improve the Performance of an I.C Diesel Engine: Experimental and CFD Approaches. Sep. Purif. Technol. 2020, 241, 116680. [Google Scholar] [CrossRef]
- Mueller, A.V.; Eden, M.J.; Oakes, J.M.; Bellini, C.; Fernandez, L.A. Quantitative Method for Comparative Assessment of Particle Removal Efficiency of Fabric Masks as Alternatives to Standard Surgical Masks for PPE. Matter 2020, 3, 950–962. [Google Scholar] [CrossRef] [PubMed]
- Du, W.; Iacoviello, F.; Fernandez, T.; Loureiro, R.; Brett, D.J.L.; Shearing, P.R. Microstructure Analysis and Image-Based Modelling of Face Masks for COVID-19 Virus Protection. Commun. Mater. 2021, 2, 69. [Google Scholar] [CrossRef]
- Borgelink, B.T.H.; Carchia, A.E.; Hernández-Sánchez, J.F.; Caputo, D.; Gardeniers, J.G.E.; Susarrey-Arce, A. Filtering Efficiency Model That Includes the Statistical Randomness of Non-Woven Fiber Layers in Facemasks. Sep. Purif. Technol. 2022, 282, 120049. [Google Scholar] [CrossRef]
- ASTM C830-00 2016; Standard Test Methods for Apparent Porosity, Liquid Absorption, Apparent Specific Gravity, and Bulk Density of Refractory Shapes by Vacuum Pressure. ASTM: West Conshohocken, PA, USA, 2016.
- Yilmaz, N.D.; Banks-Lee, P.; Powell, N.B.; Michielsen, S. Effects of Porosity, Fiber Size, and Layering Sequence on Sound Absorption Performance of Needle-Punched Nonwovens. J. Appl. Polym. Sci. 2011, 121, 3056–3069. [Google Scholar] [CrossRef]
- Habibi, M.; Ruiz, É.; Lebrun, G.; Laperrière, L. Effect of Surface Density and Fiber Length on the Porosity and Permeability of Nonwoven Flax Reinforcement. Text. Res. J. 2018, 88, 1776–1787. [Google Scholar] [CrossRef]
- Steele, R. Part II: Capillary Size Distribution. Text. Res. J. 1958, 28, 144–147. [Google Scholar] [CrossRef]
- Abdel-Ghani, M.; Davies, G. Simulation of Non-Woven Fibre Mats and the Application to Coalescers. Chem. Eng. Sci. 1985, 40, 117–129. [Google Scholar] [CrossRef]
- Lombard, G.; Rollin, A.; Wolff, C. Theoretical and Experimental Opening Sizes of Heat-Bonded Geotextiles. Text. Res. J. 1989, 59, 208–217. [Google Scholar] [CrossRef]
- Faure, Y.H.; Gourc, J.P.; Gendrin, P. Structural Study of Porometry and Filtration Opening Size of Geotextiles. In Geosynthetics: Microstructure and Performance; Peggs, I.D., Ed.; ASTM International: West Conshohocken, PA, USA, 1990. [Google Scholar] [CrossRef]
- Bhatia, S.K.; Smith, J.L. Application of the Bubble Point Method to the Characterization of the Pore-Size Distribution of Geotextiles. Geotech. Test. J. 1995, 18, 94–105. [Google Scholar] [CrossRef]
- Giroud, J.-P. Granular Filters and Geotextile Filters. In Proceedings of the 2nd International Conference “Geo-filters”; A.A. Balkema: Cape Town, South Africa, 1996; pp. 565–680. [Google Scholar]
- Dodson, C.; Handley, A.; Oba, Y.; Sampson, W. The Pore Radius Distribution in Paper. Part I: The Effect of Formation and Grammage. Appita J. 2003, 56, 275–280. [Google Scholar]
- Rawal, A. Structural Analysis of Pore Size Distribution of Nonwovens. J. Text. Inst. 2010, 101, 350–359. [Google Scholar] [CrossRef]
- Sozumert, E.; Kiyak, Y.; Demirci, E.; Silberschmidt, V.V. Effect of Microstructure on Porosity of Random Fibrous Networks. J. Text. Inst. 2020, 111, 1713–1723. [Google Scholar] [CrossRef]
- Karakoç, A.; Miettinen, A.; Sözümert, E.; Evans, L.; Yiğitler, H.; Bostanci, B.; Taciroğlu, E.; Jäntti, R. Microstructural Evaluation and Recommendations for Face Masks in Community Use to Reduce the Transmission of Respiratory Infectious Diseases. Comput. Methods Programs Biomed. 2022, 226, 107154. [Google Scholar] [CrossRef]
- Anandjiwala, R.D.; Boguslavsky, L. Development of Needle-Punched Nonwoven Fabrics from Flax Fibers for Air Filtration Applications. Text. Res. J. 2008, 78, 614–624. [Google Scholar] [CrossRef]
- Mao, R.; Goutianos, S.; Tu, W.; Meng, N.; Chen, S.; Peijs, T. Modelling the Elastic Properties of Cellulose Nanopaper. Mater. Des. 2017, 126, 183–189. [Google Scholar] [CrossRef]
- Goutianos, S. Effect of Inter-Fibre Bonding on the Fracture of Fibrous Networks with Strong Interactions. Int. J. Solids Struct. 2018, 8, 271–278. [Google Scholar] [CrossRef]
- Borodulina, S.; Motamedian, H.R.; Kulachenko, A. Effect of Fiber and Bond Strength Variations on the Tensile Stiffness and Strength of Fiber Networks. Int. J. Solids Struct. 2018, 154, 19–32. [Google Scholar] [CrossRef]
- Yang, M.; Ji, M.; Taghipour, E.; Soghrati, S. Cross-Linked Fiberglass Packs: Microstructure Reconstruction and Finite Element Analysis of the Micromechanical Behavior. Comput. Struct. 2018, 209, 182–196. [Google Scholar] [CrossRef]
- Domaschke, S.; Morel, A.; Fortunato, G.; Ehret, A.E. Random Auxetics from Buckling Fibre Networks. Nat. Commun. 2019, 10, 4863. [Google Scholar] [CrossRef]
- Chen, G.; Rastak, R.; Wang, Y.; Yan, H.; Feig, V.; Liu, Y.; Jiang, Y.; Chen, S.; Lian, F.; Molina-Lopez, F.; et al. Strain- and Strain-Rate-Invariant Conductance in a Stretchable and Compressible 3D Conducting Polymer Foam. Matter 2019, 1, 205–218. [Google Scholar] [CrossRef]
- Picu, C.R. Network Materials: Structure and Properties; Cambridge University Press: Cambridge, UK, 2022; ISBN 978-1-108-80134-8. [Google Scholar]
- Sozumert, E.; Kayali, Y.; Karakoc, A.; Silberschmidt, V.V. 4.08—Mechanics of Nonwovens. In Comprehensive Mechanics of Materials, 1st ed.; Silberschmidt, V., Ed.; Elsevier: Oxford, UK, 2024; pp. 150–193. ISBN 978-0-323-90647-0. [Google Scholar]
- Heussinger, C.; Frey, E. Floppy Modes and Nonaffine Deformations in Random Fiber Networks. Phys. Rev. Lett. 2006, 97, 105501. [Google Scholar] [CrossRef] [PubMed]
- Hatami-Marbini, H.; Picu, R.C. Scaling of Nonaffine Deformation in Random Semiflexible Fiber Networks. Phys. Rev. E 2008, 77, 062103. [Google Scholar] [CrossRef]
- Hatami-Marbini, H.; Picu, R.C. Effect of Fiber Orientation on the Non-Affine Deformation of Random Fiber Networks. Acta Mech. 2009, 205, 77–84. [Google Scholar] [CrossRef]
- Basu, A.; Wen, Q.; Mao, X.; Lubensky, T.C.; Janmey, P.A.; Yodh, A.G. Nonaffine Displacements in Flexible Polymer Networks. Macromolecules 2011, 44, 1671–1679. [Google Scholar] [CrossRef]
Disclaimer/Publisher’s Note: The statements, opinions and data contained in all publications are solely those of the individual author(s) and contributor(s) and not of MDPI and/or the editor(s). MDPI and/or the editor(s) disclaim responsibility for any injury to people or property resulting from any ideas, methods, instructions or products referred to in the content. |
© 2025 by the authors. Licensee MDPI, Basel, Switzerland. This article is an open access article distributed under the terms and conditions of the Creative Commons Attribution (CC BY) license (https://creativecommons.org/licenses/by/4.0/).

