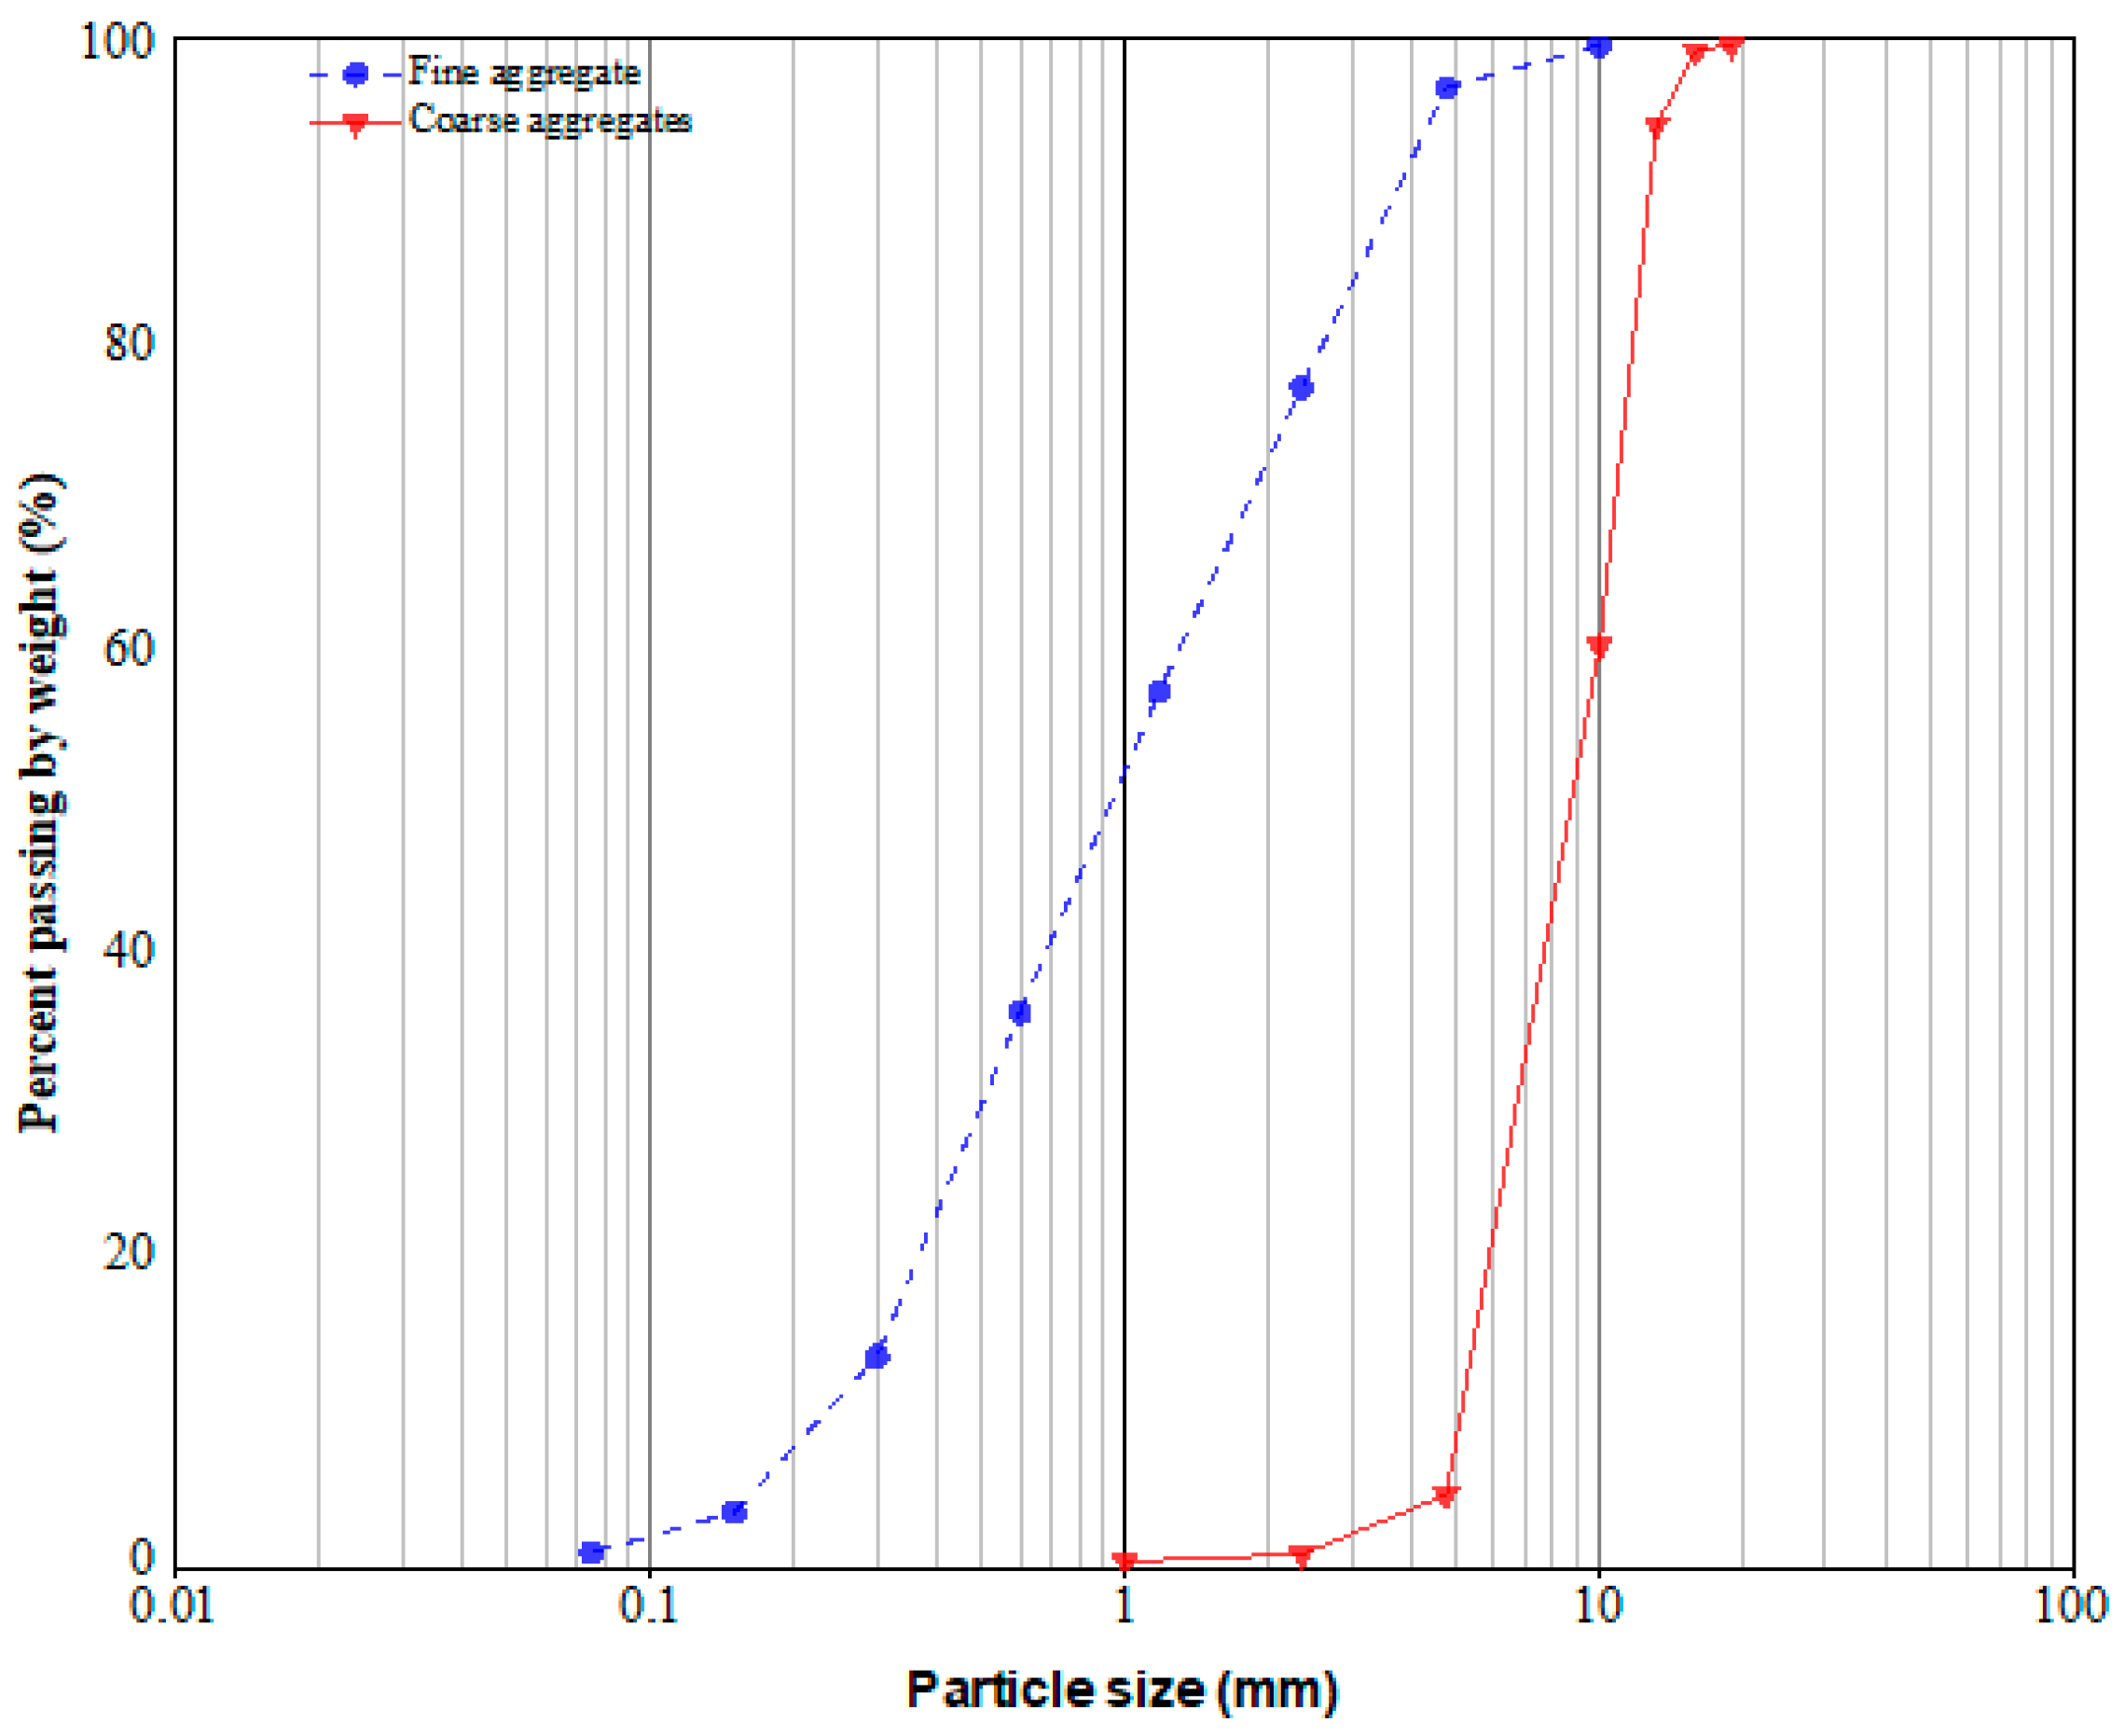
Figure 1.
Particle size distribution of fine and coarse aggregates.
Figure 1.
Particle size distribution of fine and coarse aggregates.
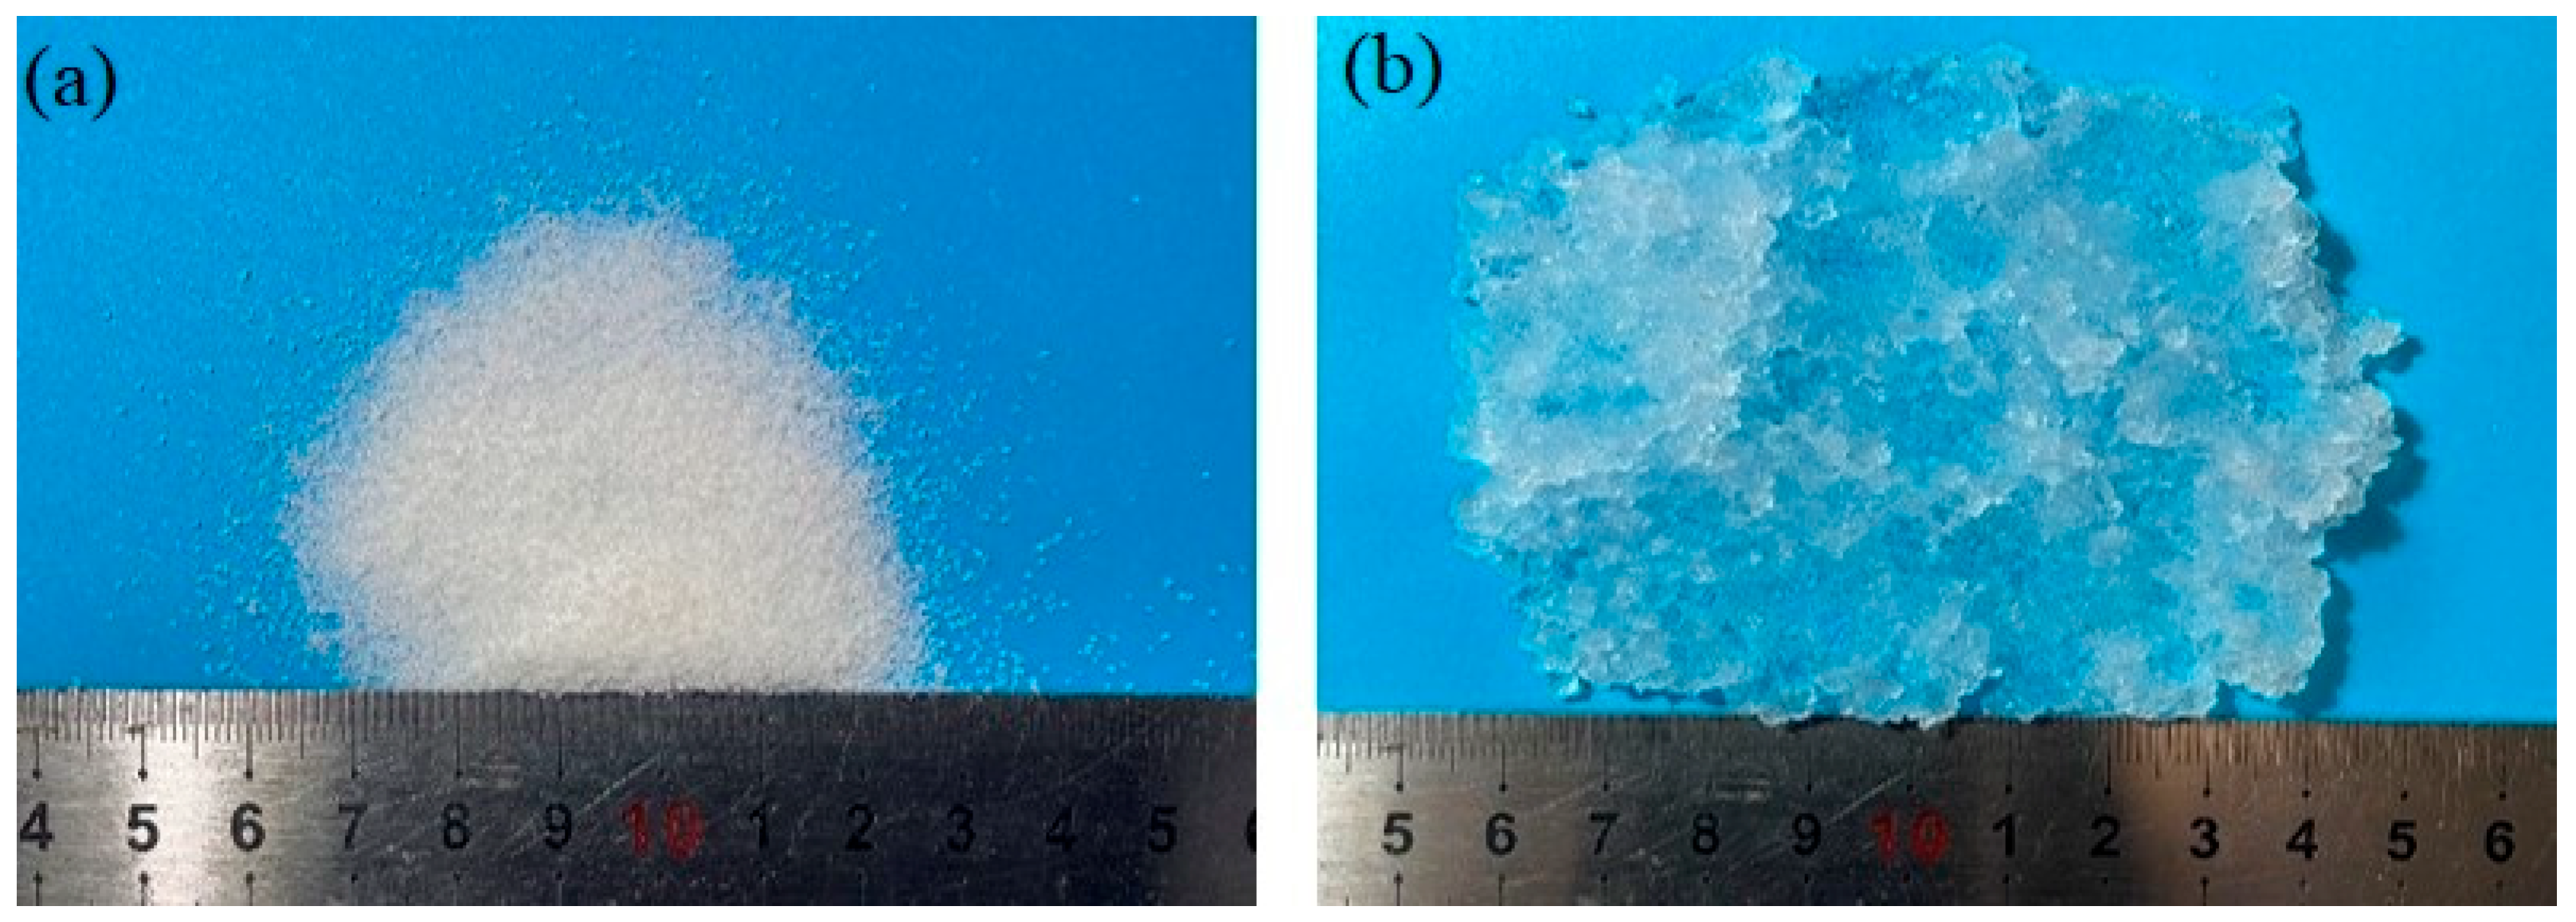
Figure 2.
BFs used (SAP-a) in (a) dry and (b) swollen state.
Figure 2.
BFs used (SAP-a) in (a) dry and (b) swollen state.
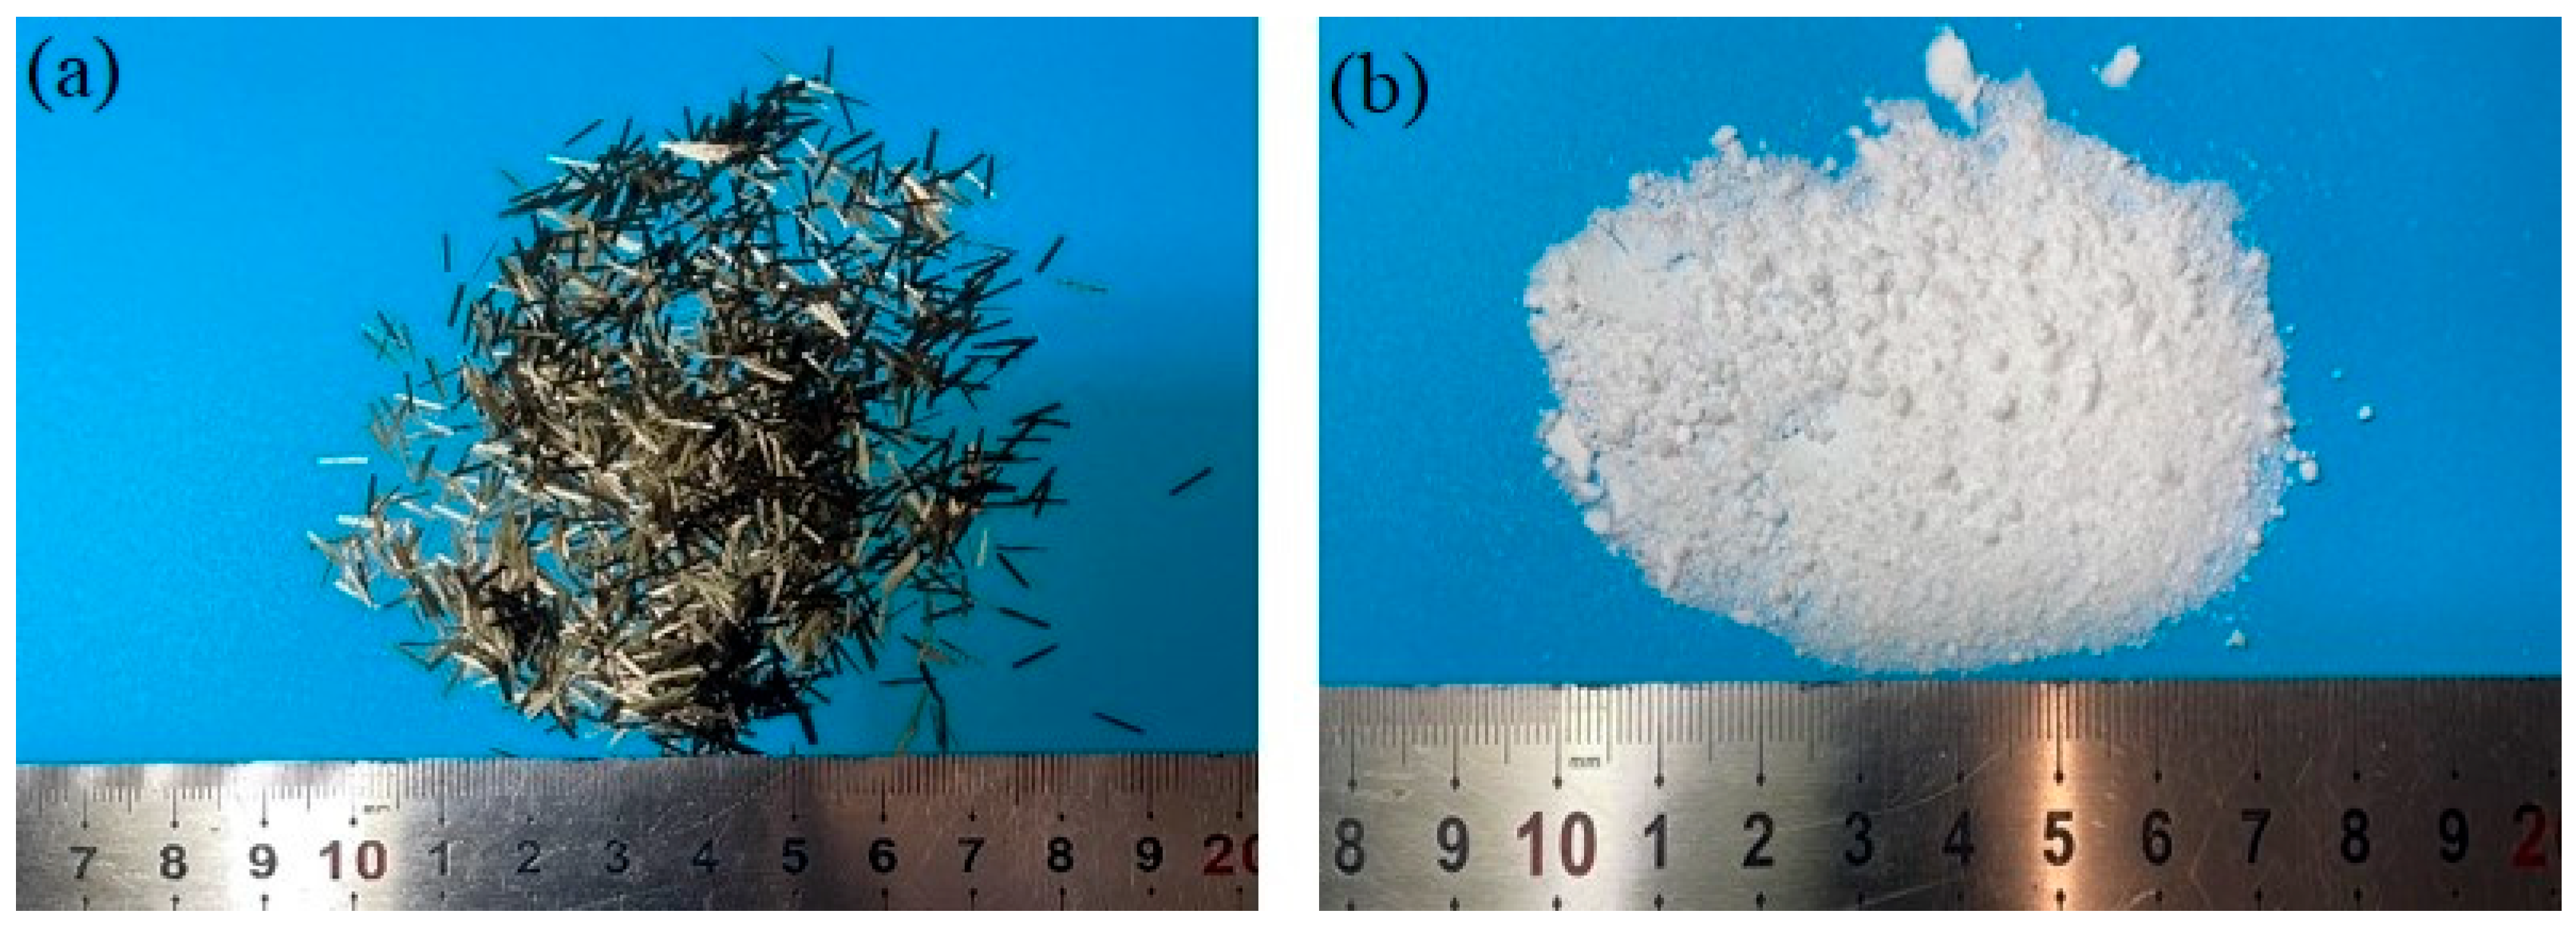
Figure 3.
NS powder and short chopped BF used in this study: (a) BF and (b) NS.
Figure 3.
NS powder and short chopped BF used in this study: (a) BF and (b) NS.
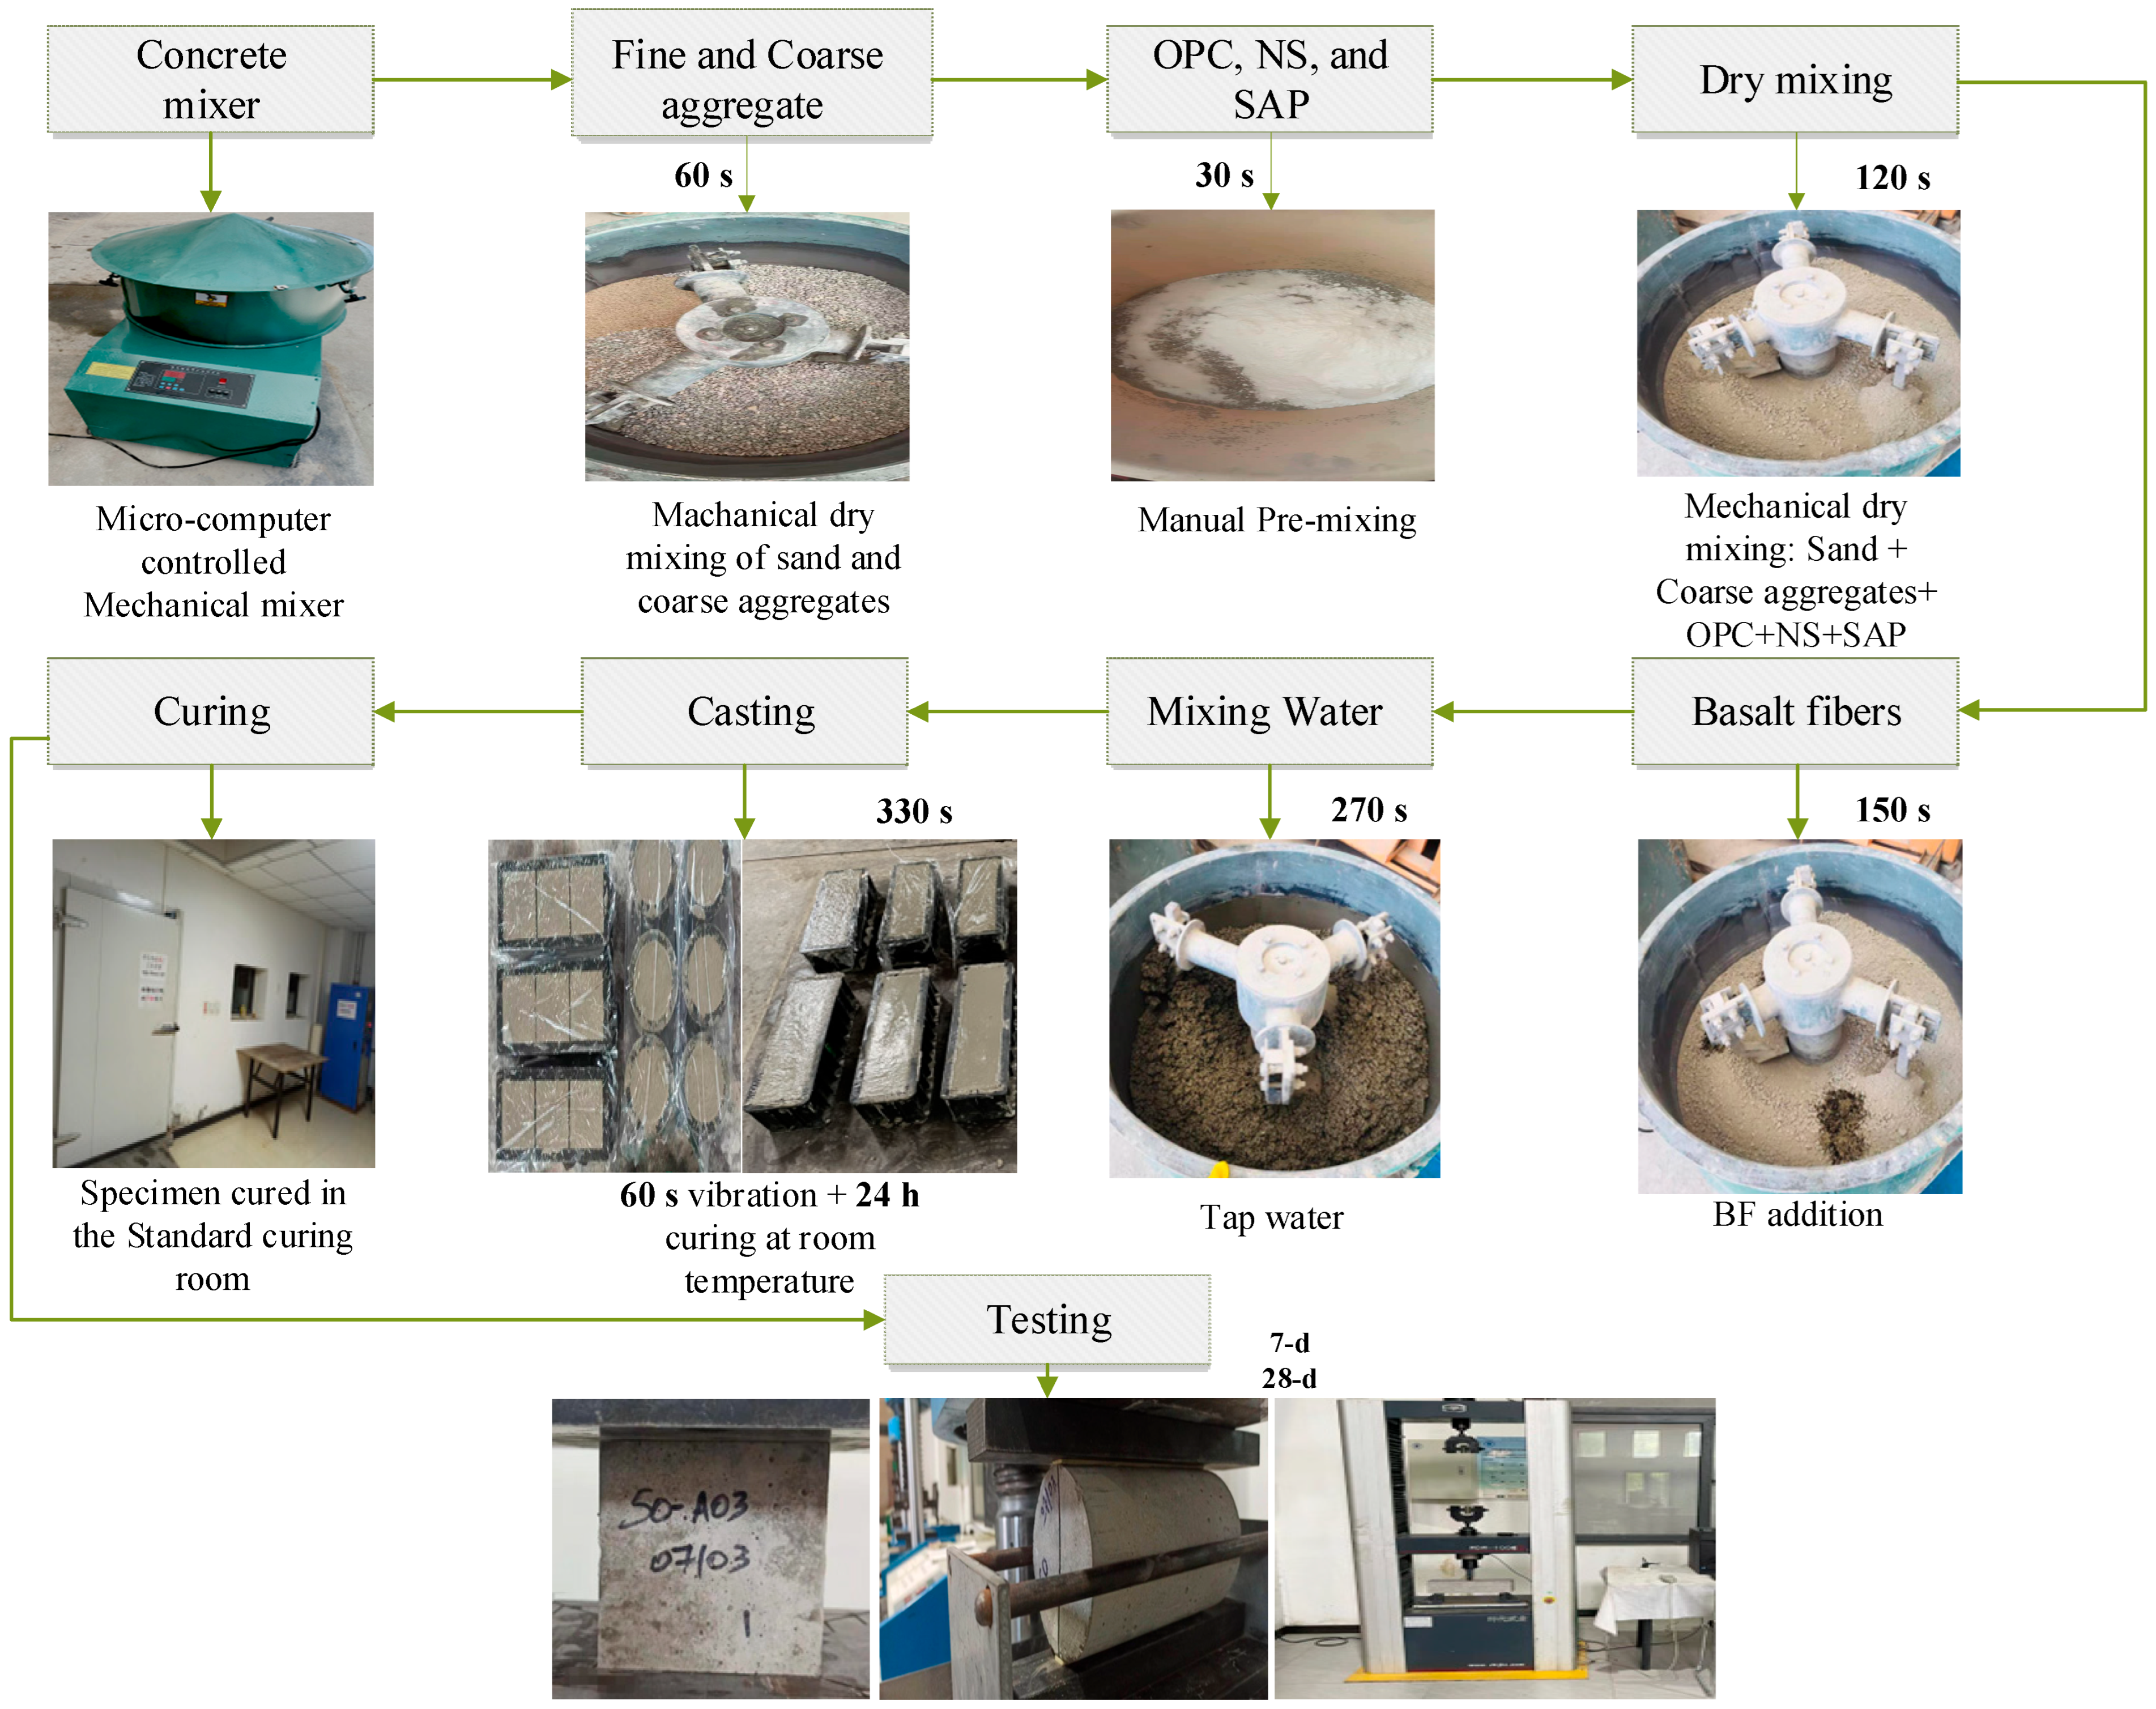
Figure 4.
Schematic illustration of the mixing process of NSBF-ICC.
Figure 4.
Schematic illustration of the mixing process of NSBF-ICC.
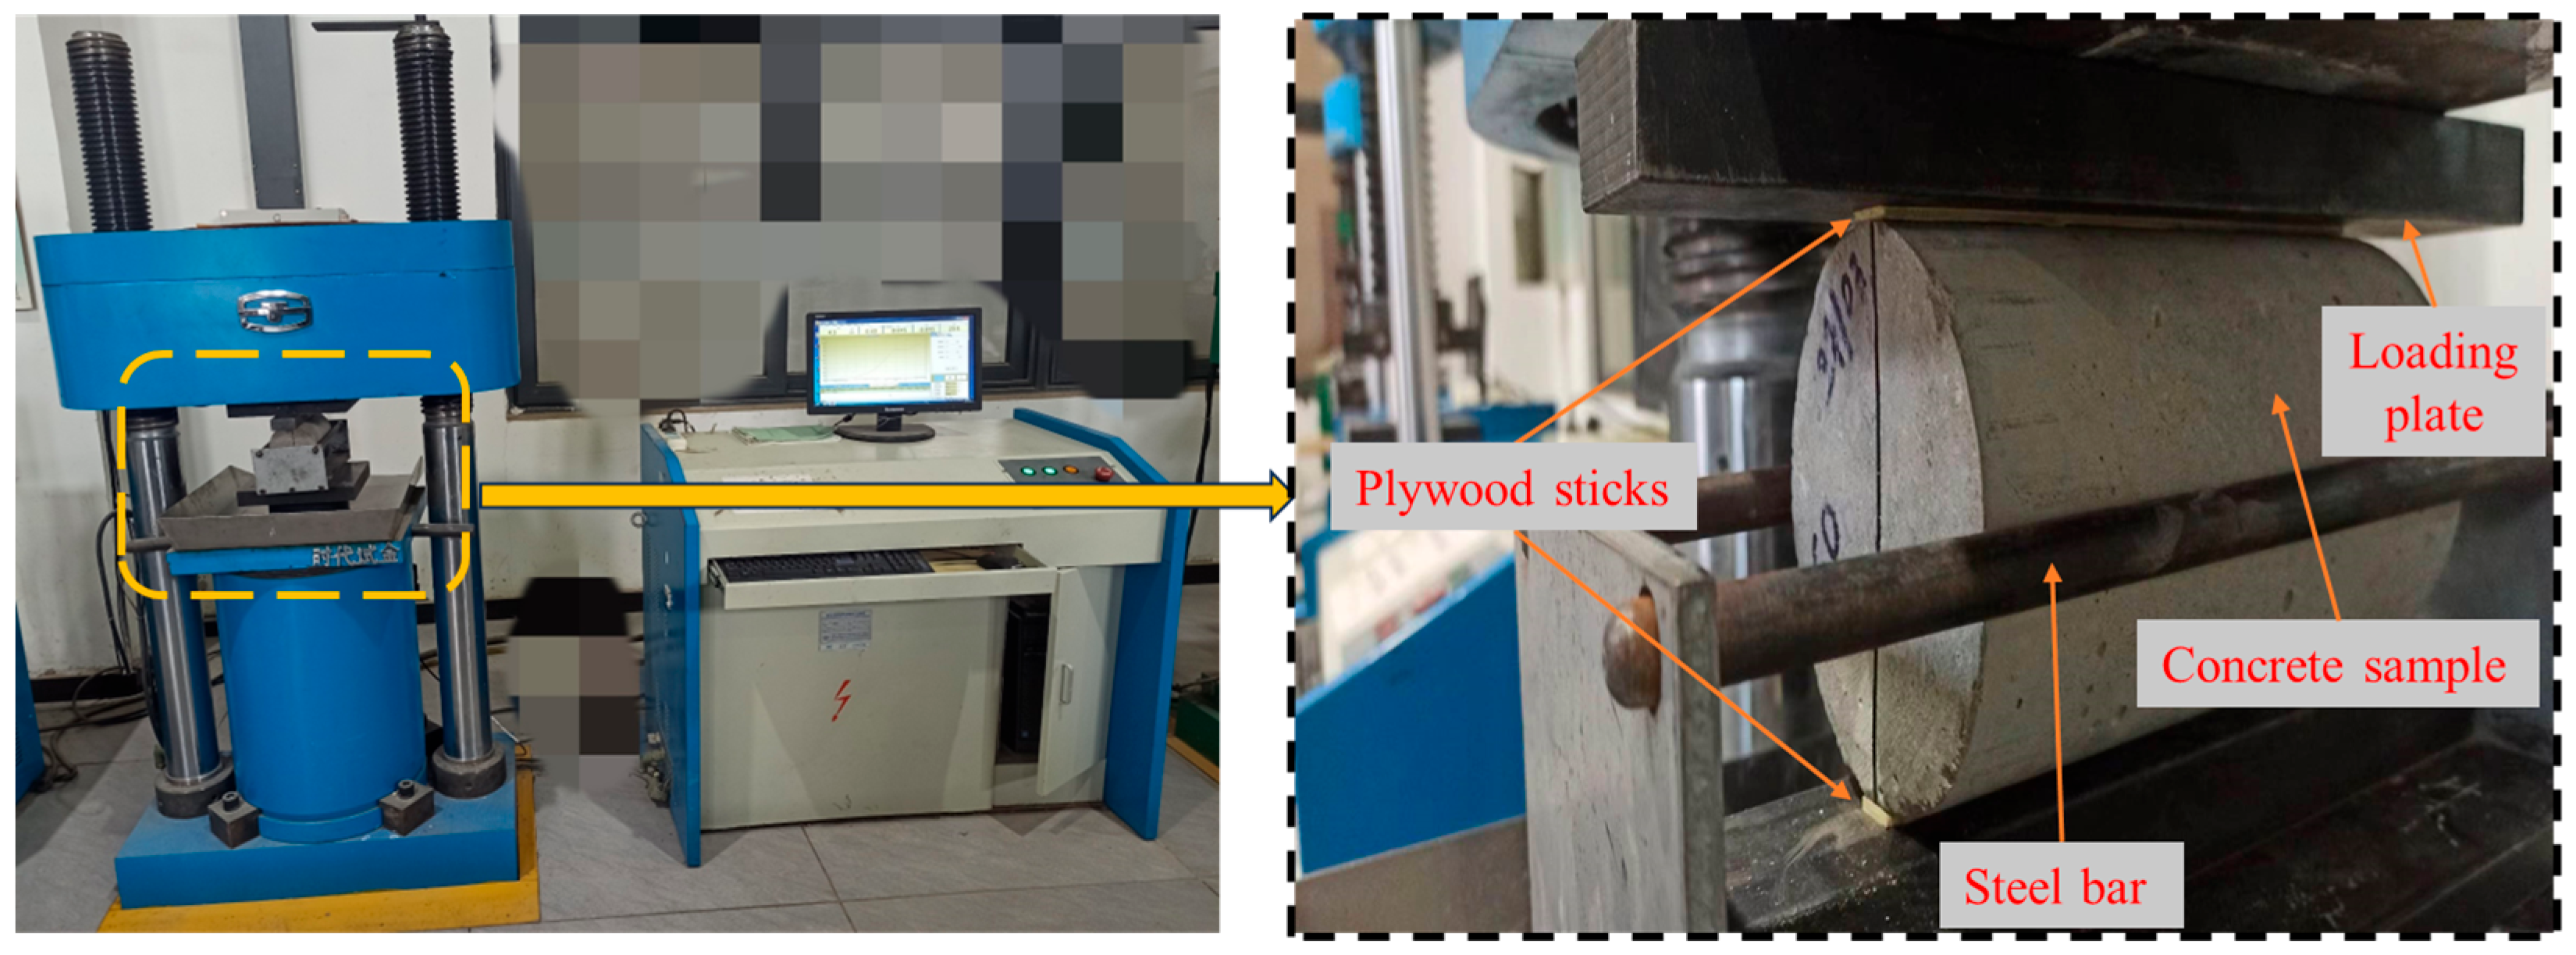
Figure 5.
Splitting tensile test equipment illustration.
Figure 5.
Splitting tensile test equipment illustration.
Figure 6.
Experimental setup of flexural strength test with DIC equipment of concrete specimens under (a) compression and (b) 3-point bending test.
Figure 6.
Experimental setup of flexural strength test with DIC equipment of concrete specimens under (a) compression and (b) 3-point bending test.
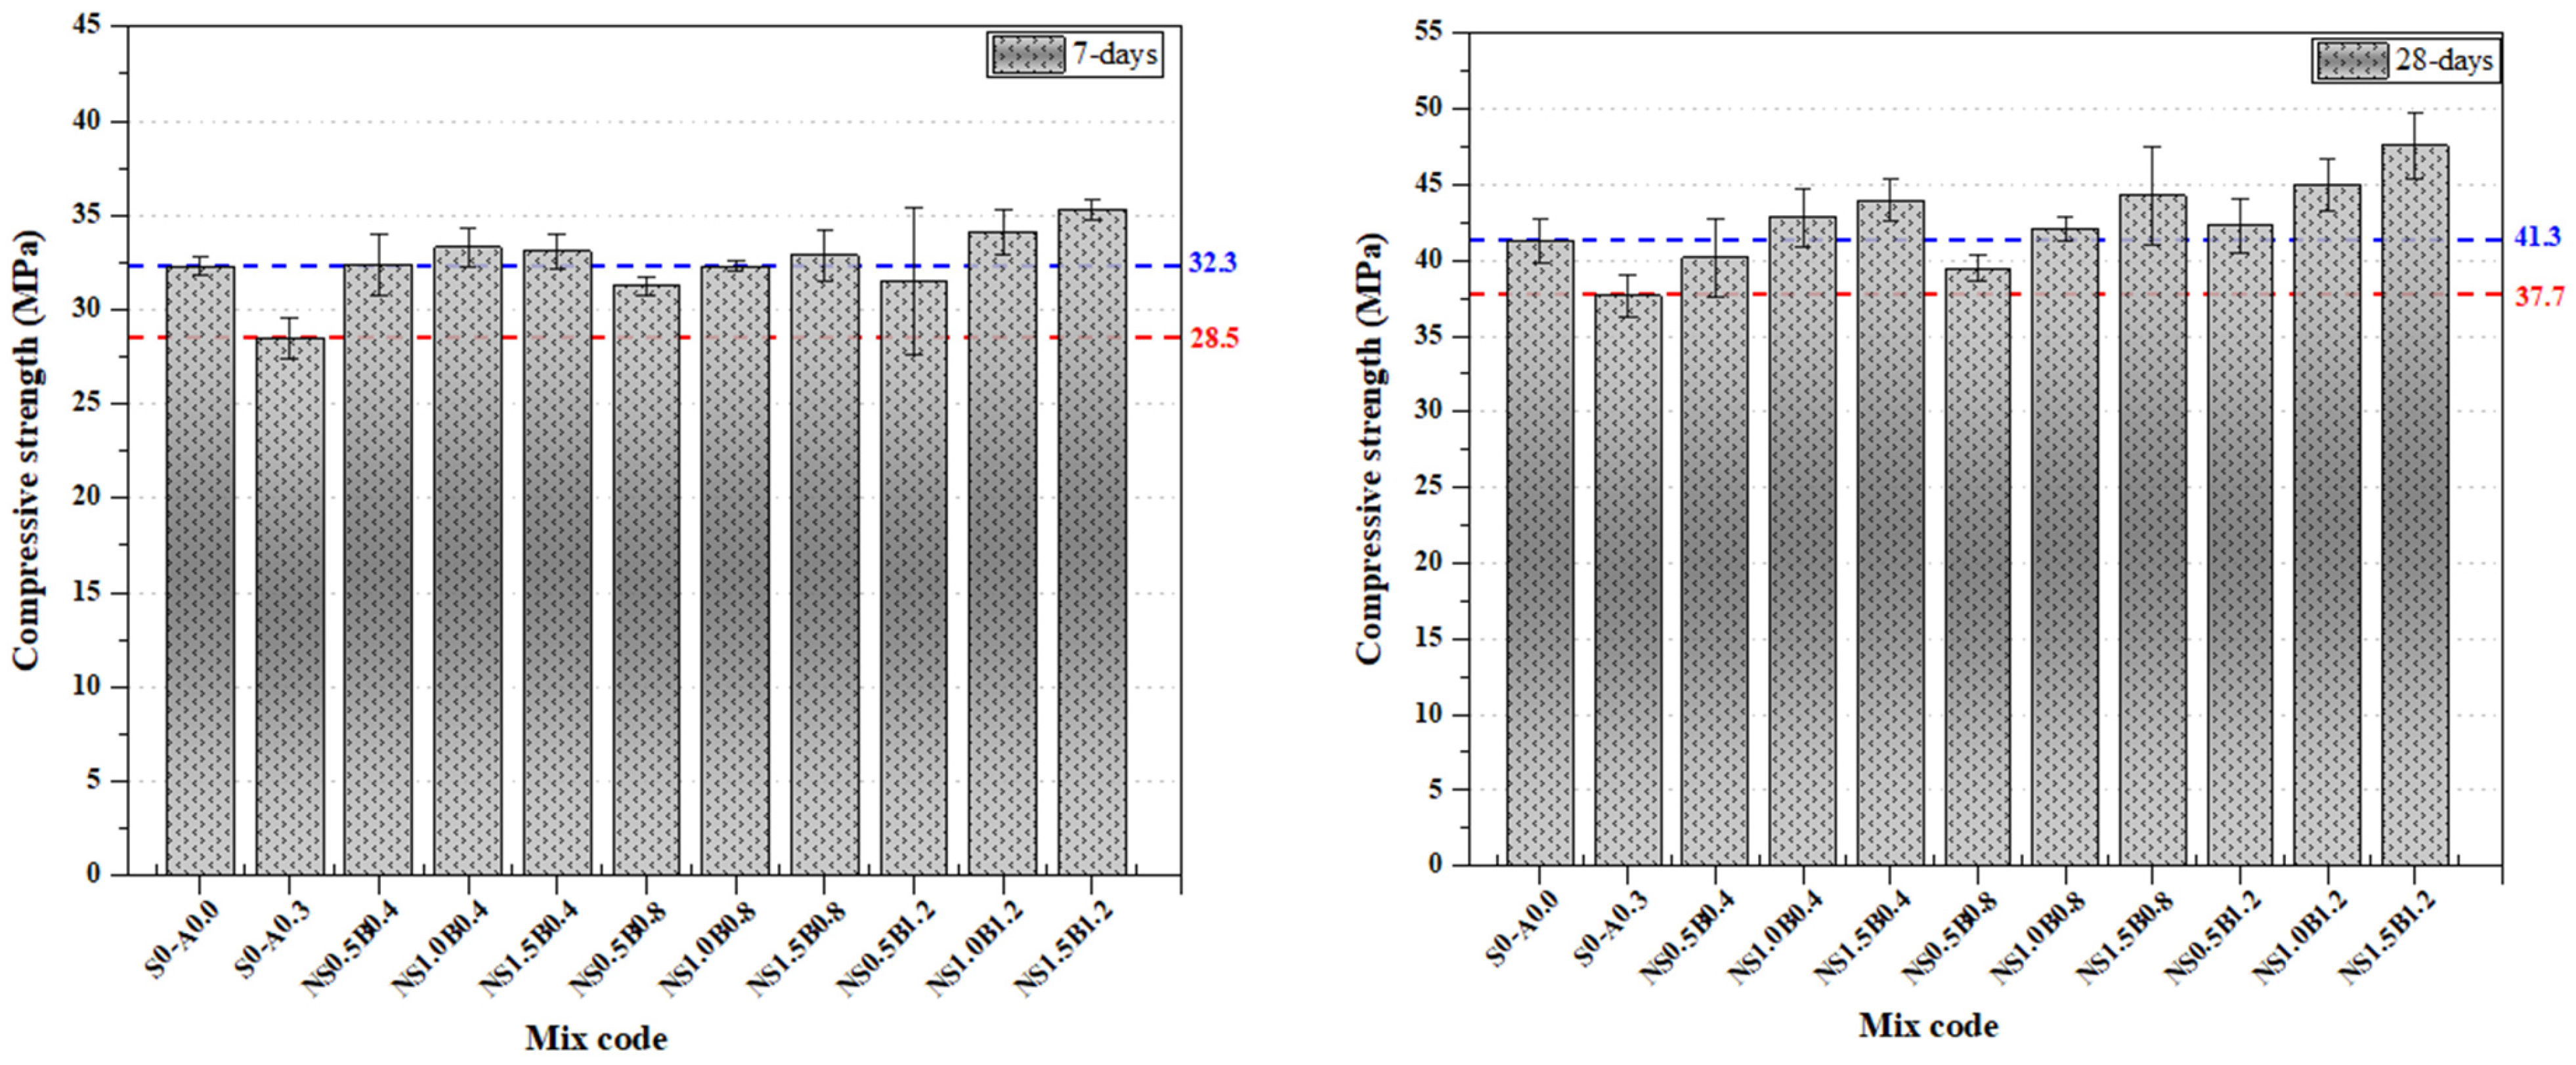
Figure 8.
Compressive strength variation of NSBF-ICC at 7 and 28 days. The dotted lines represent the maximum compressive strength values at 7 and 28 days for S0-A0.0 (blue) and S0-A0.3 (red).
Figure 8.
Compressive strength variation of NSBF-ICC at 7 and 28 days. The dotted lines represent the maximum compressive strength values at 7 and 28 days for S0-A0.0 (blue) and S0-A0.3 (red).
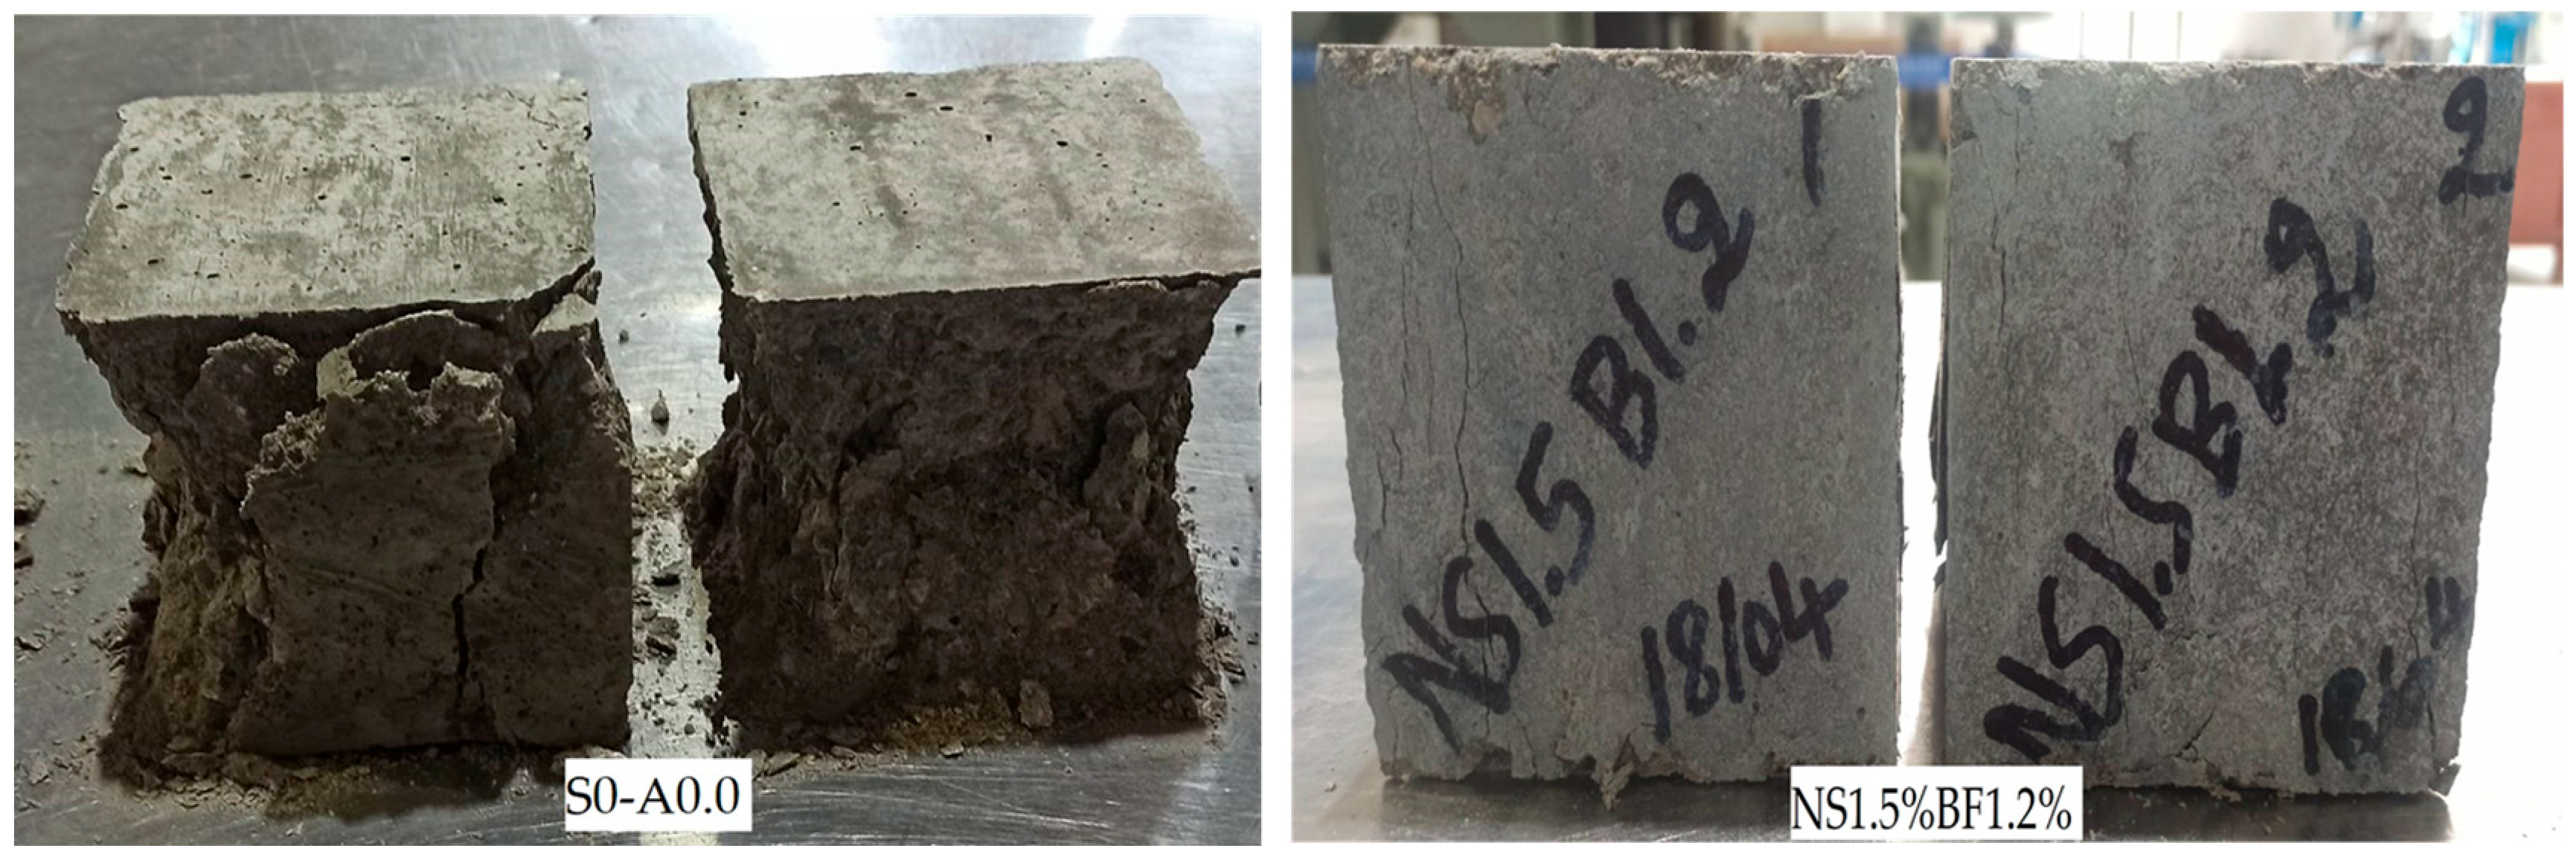
Figure 9.
Failure behavior of NSBF-ICC specimens under compression loading at 28 days.
Figure 9.
Failure behavior of NSBF-ICC specimens under compression loading at 28 days.
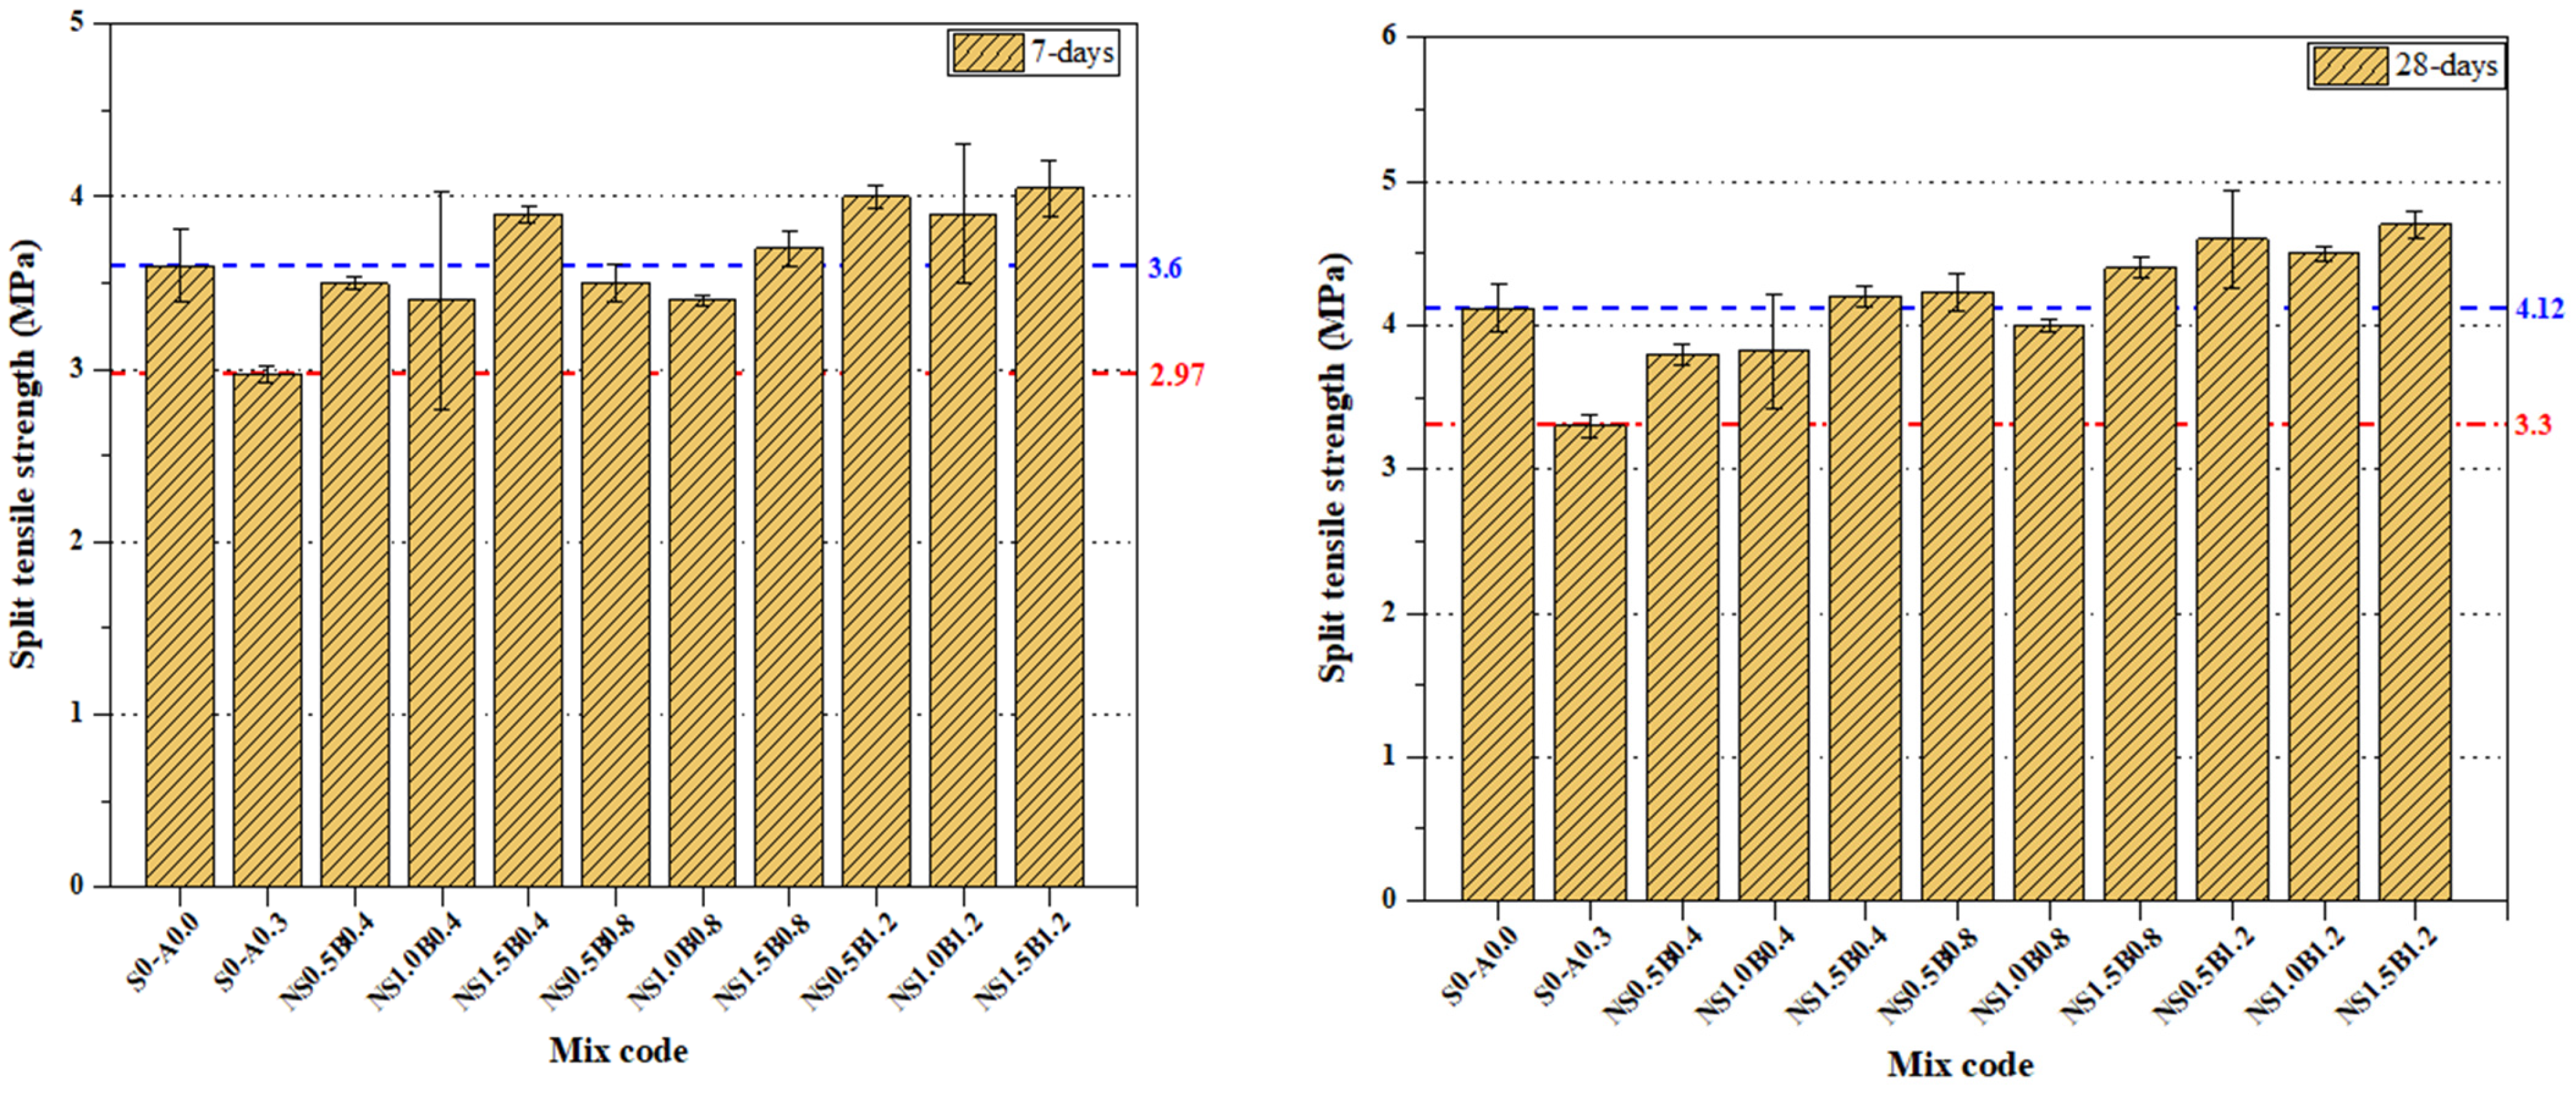
Figure 10.
Split-tensile strength graph of NSBF-ICC specimens after 7 and 28 days. The dotted lines represent the maximum compressive strength values at 7 and 28 days for S0-A0.0 (blue) and S0-A0.3 (red).
Figure 10.
Split-tensile strength graph of NSBF-ICC specimens after 7 and 28 days. The dotted lines represent the maximum compressive strength values at 7 and 28 days for S0-A0.0 (blue) and S0-A0.3 (red).
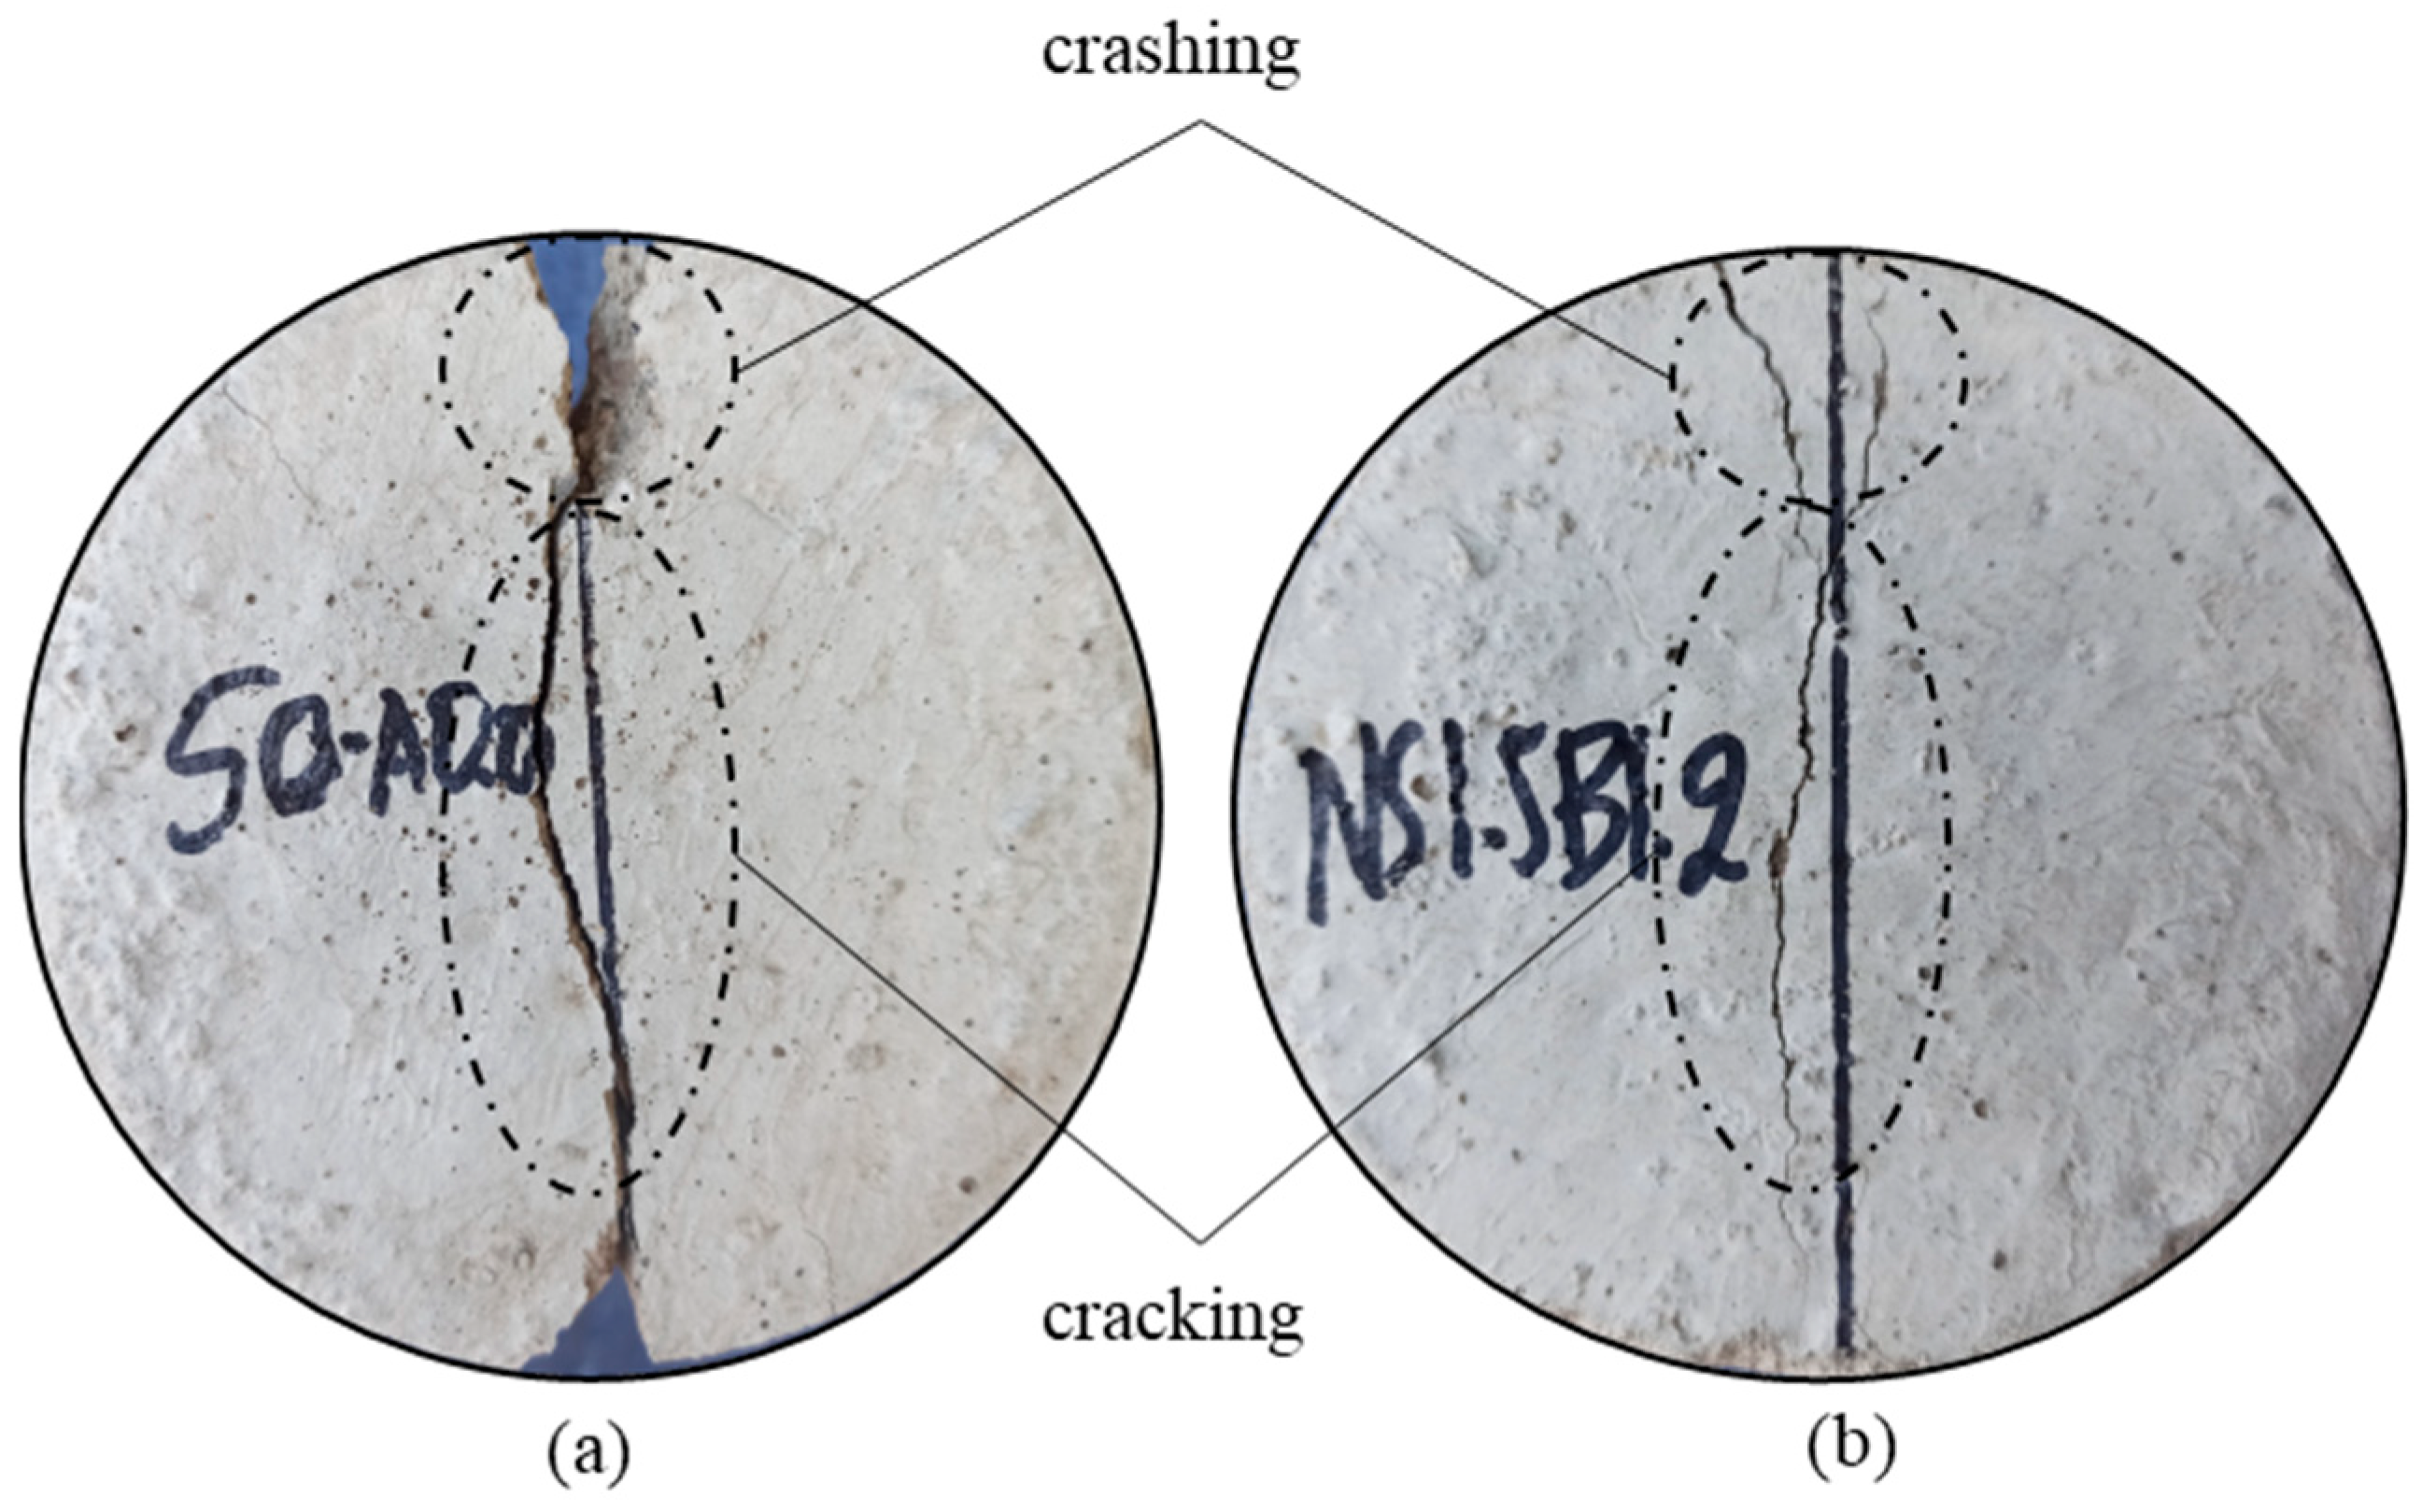
Figure 11.
Fractural behavior of (a) ordinary concrete specimen (S0-A0.0) and (b) NSBF-ICC (NS1.5B1.2) specimen under splitting-tensile test.
Figure 11.
Fractural behavior of (a) ordinary concrete specimen (S0-A0.0) and (b) NSBF-ICC (NS1.5B1.2) specimen under splitting-tensile test.
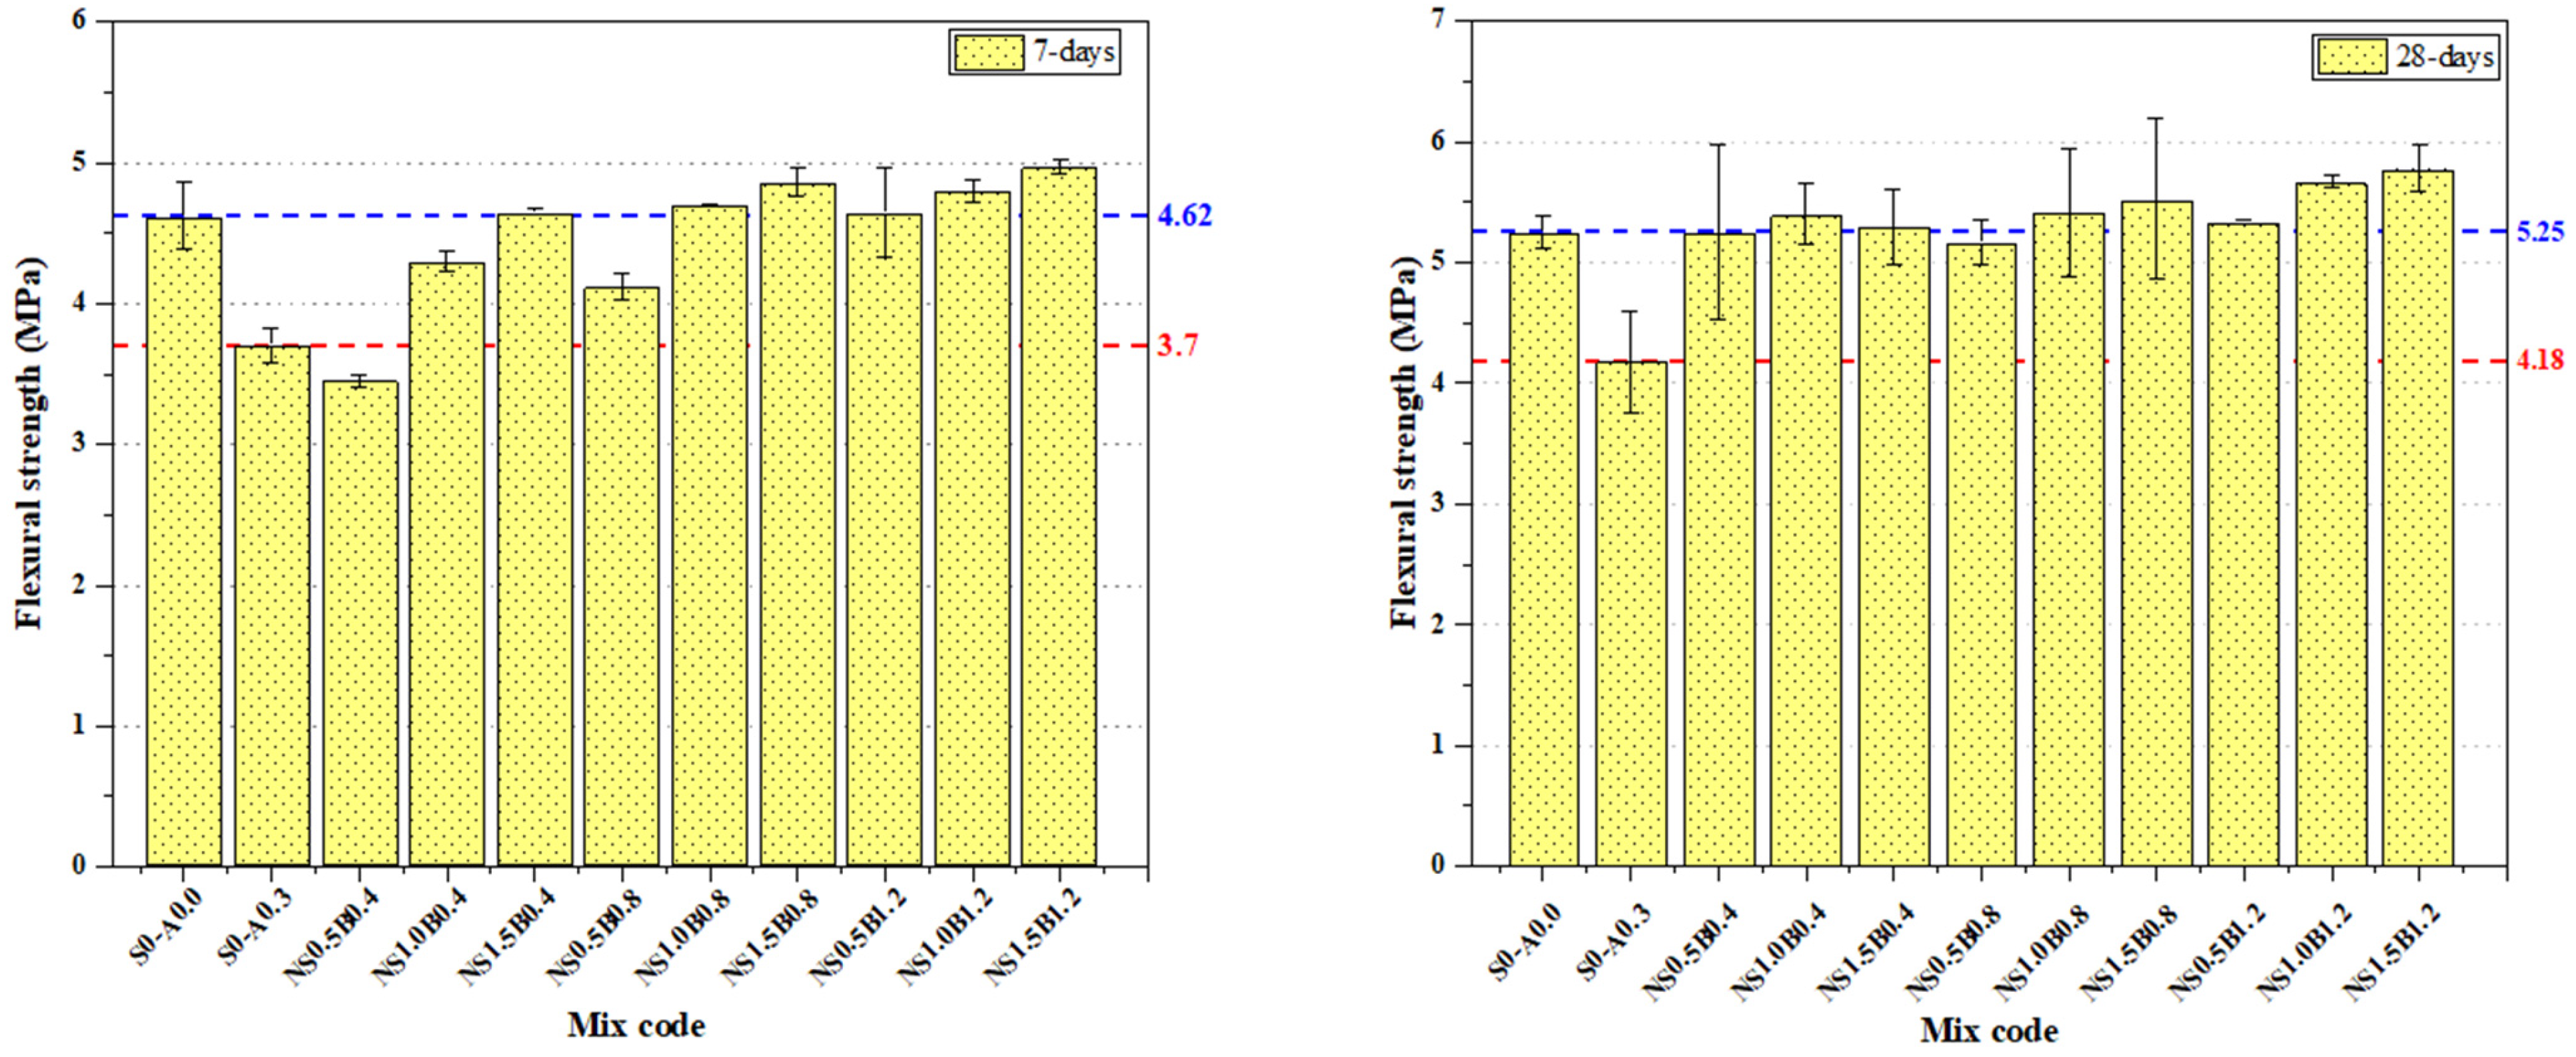
Figure 12.
Synergetic influence of NS and BF on the flexural strength properties of internal curing concrete after 7 and 28 days. The dotted lines represent the maximum compressive strength values at 7 and 28 days for S0-A0.0 (blue) and S0-A0.3 (red).
Figure 12.
Synergetic influence of NS and BF on the flexural strength properties of internal curing concrete after 7 and 28 days. The dotted lines represent the maximum compressive strength values at 7 and 28 days for S0-A0.0 (blue) and S0-A0.3 (red).
Figure 13.
Failure behavior of NSBF-ICC under flexure loading at 28 days.
Figure 13.
Failure behavior of NSBF-ICC under flexure loading at 28 days.
Figure 14.
Compressive failure mode of the reference concrete (S0-A0.0) specimen with no additives.
Figure 14.
Compressive failure mode of the reference concrete (S0-A0.0) specimen with no additives.
Figure 15.
Compressive failure mode of the NS- and BF-modified internal curing concrete (NS1.5B1.2) specimen.
Figure 15.
Compressive failure mode of the NS- and BF-modified internal curing concrete (NS1.5B1.2) specimen.
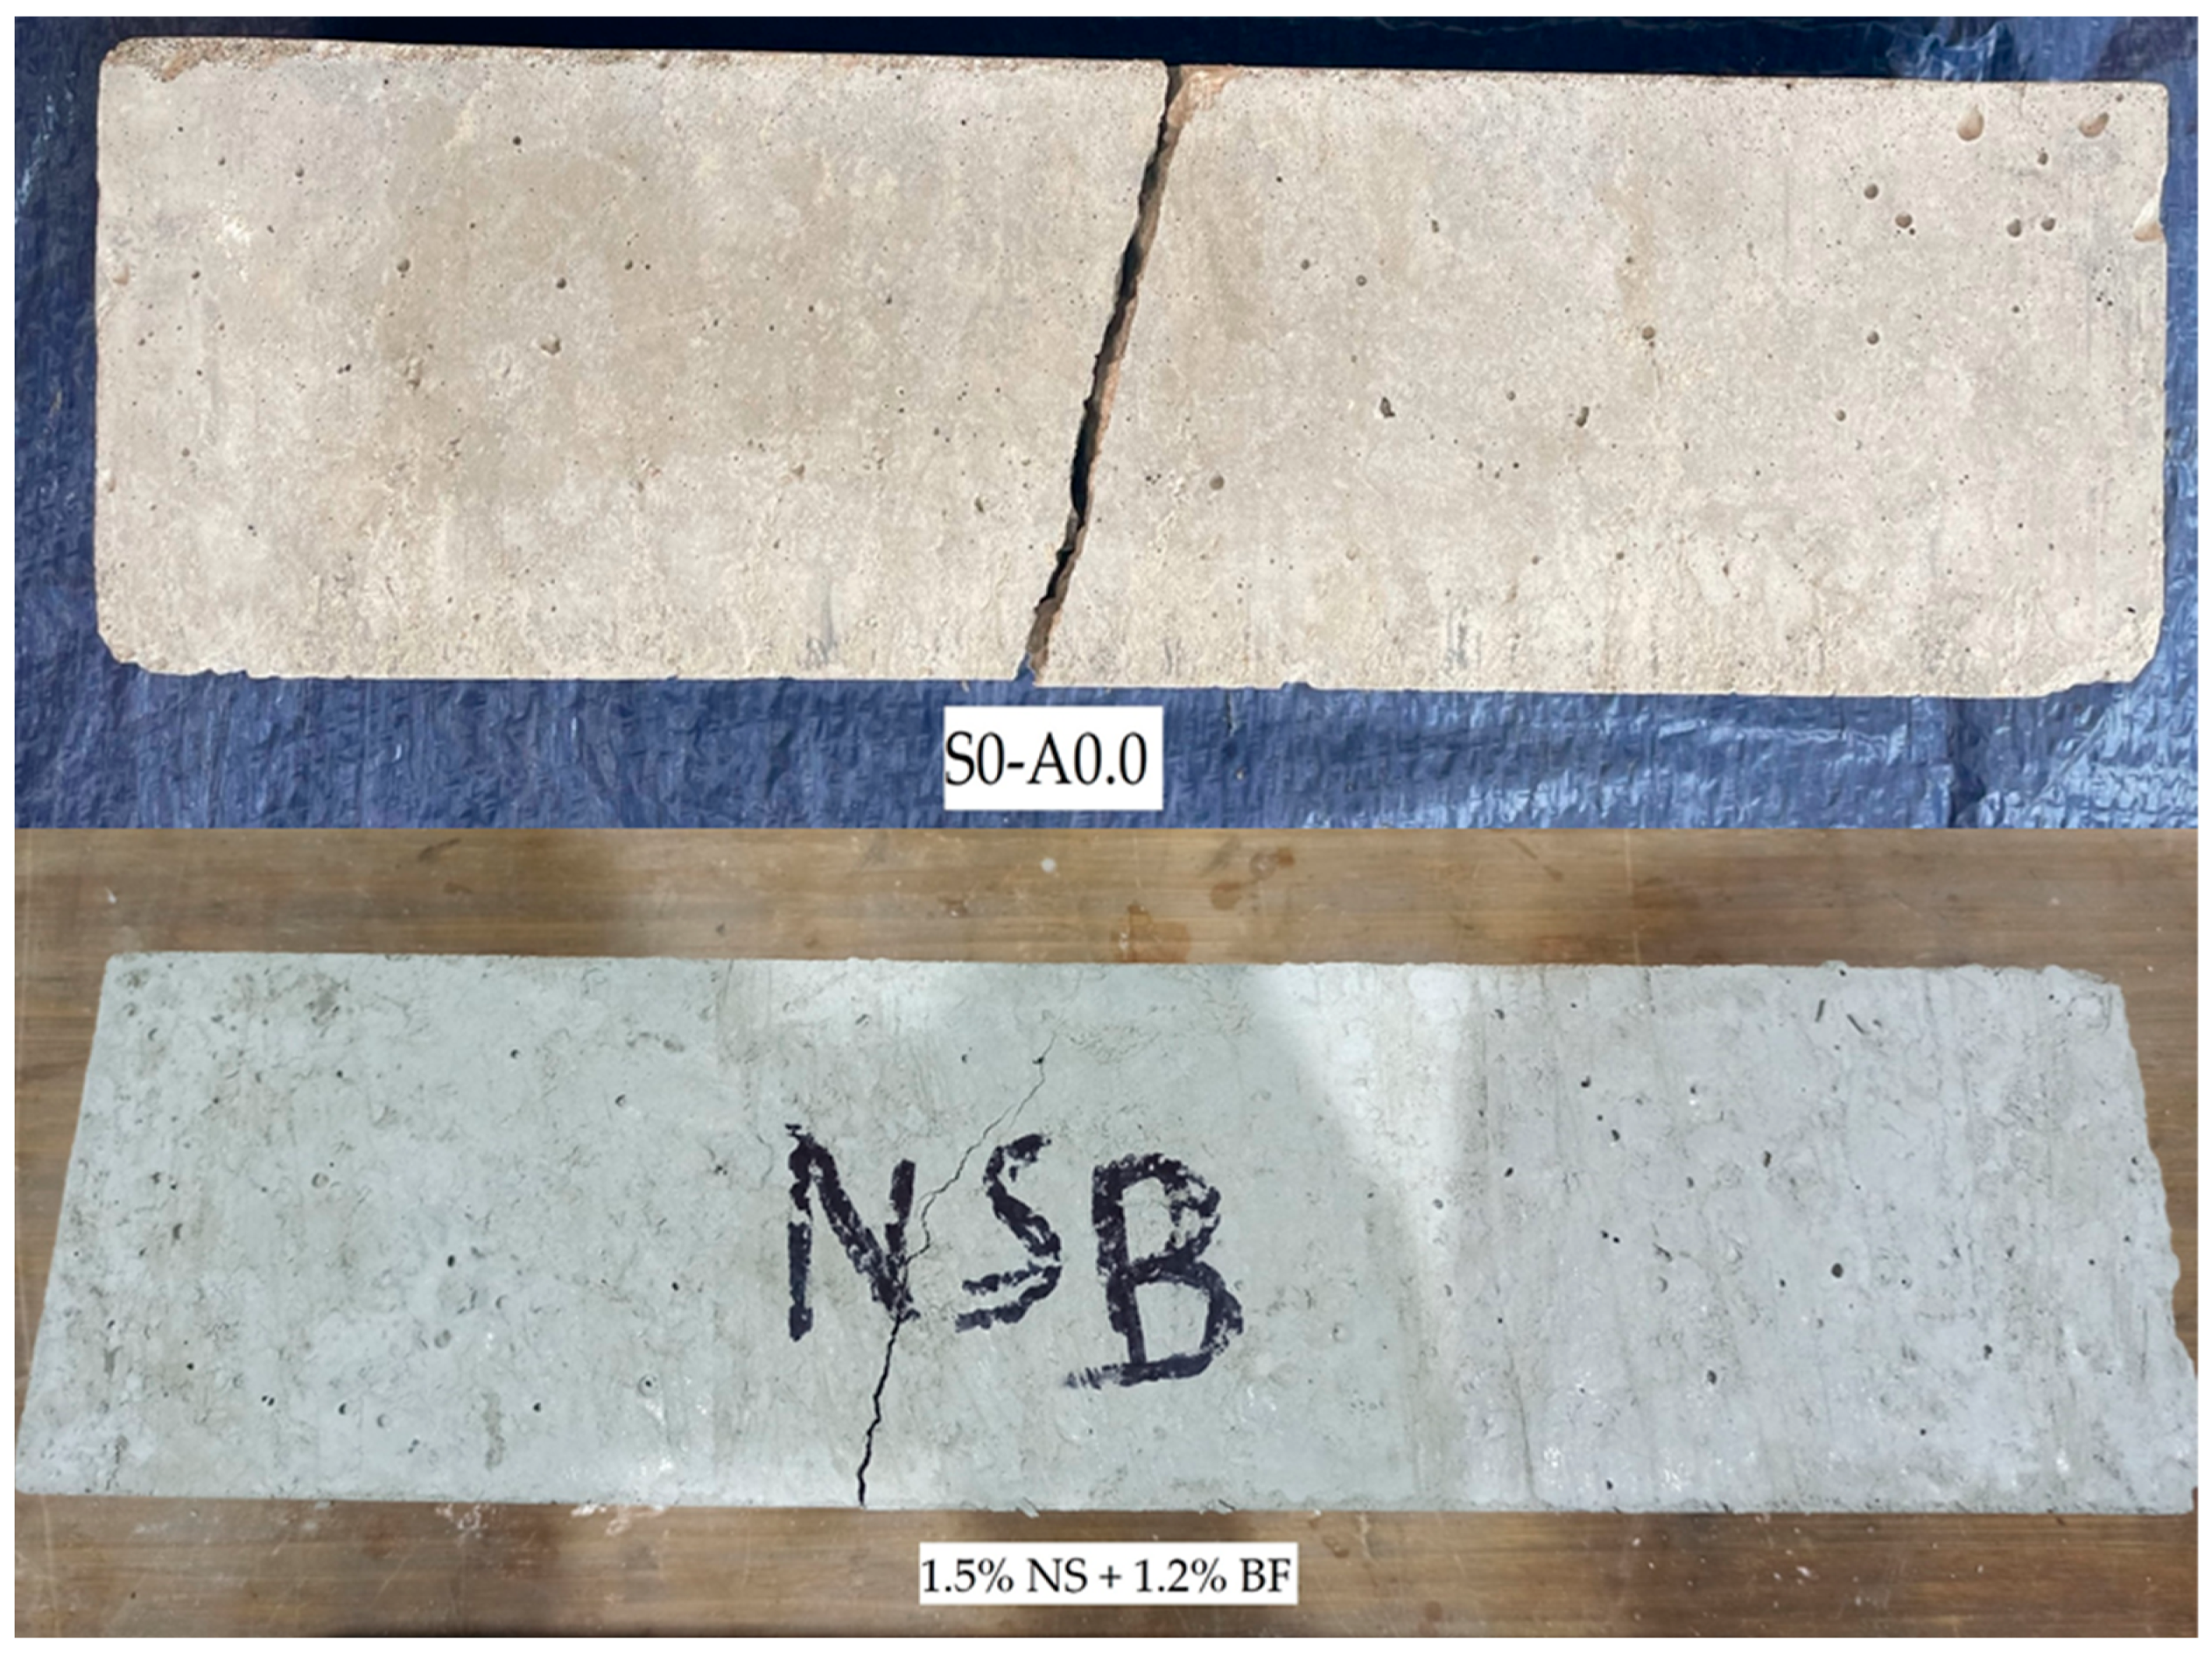
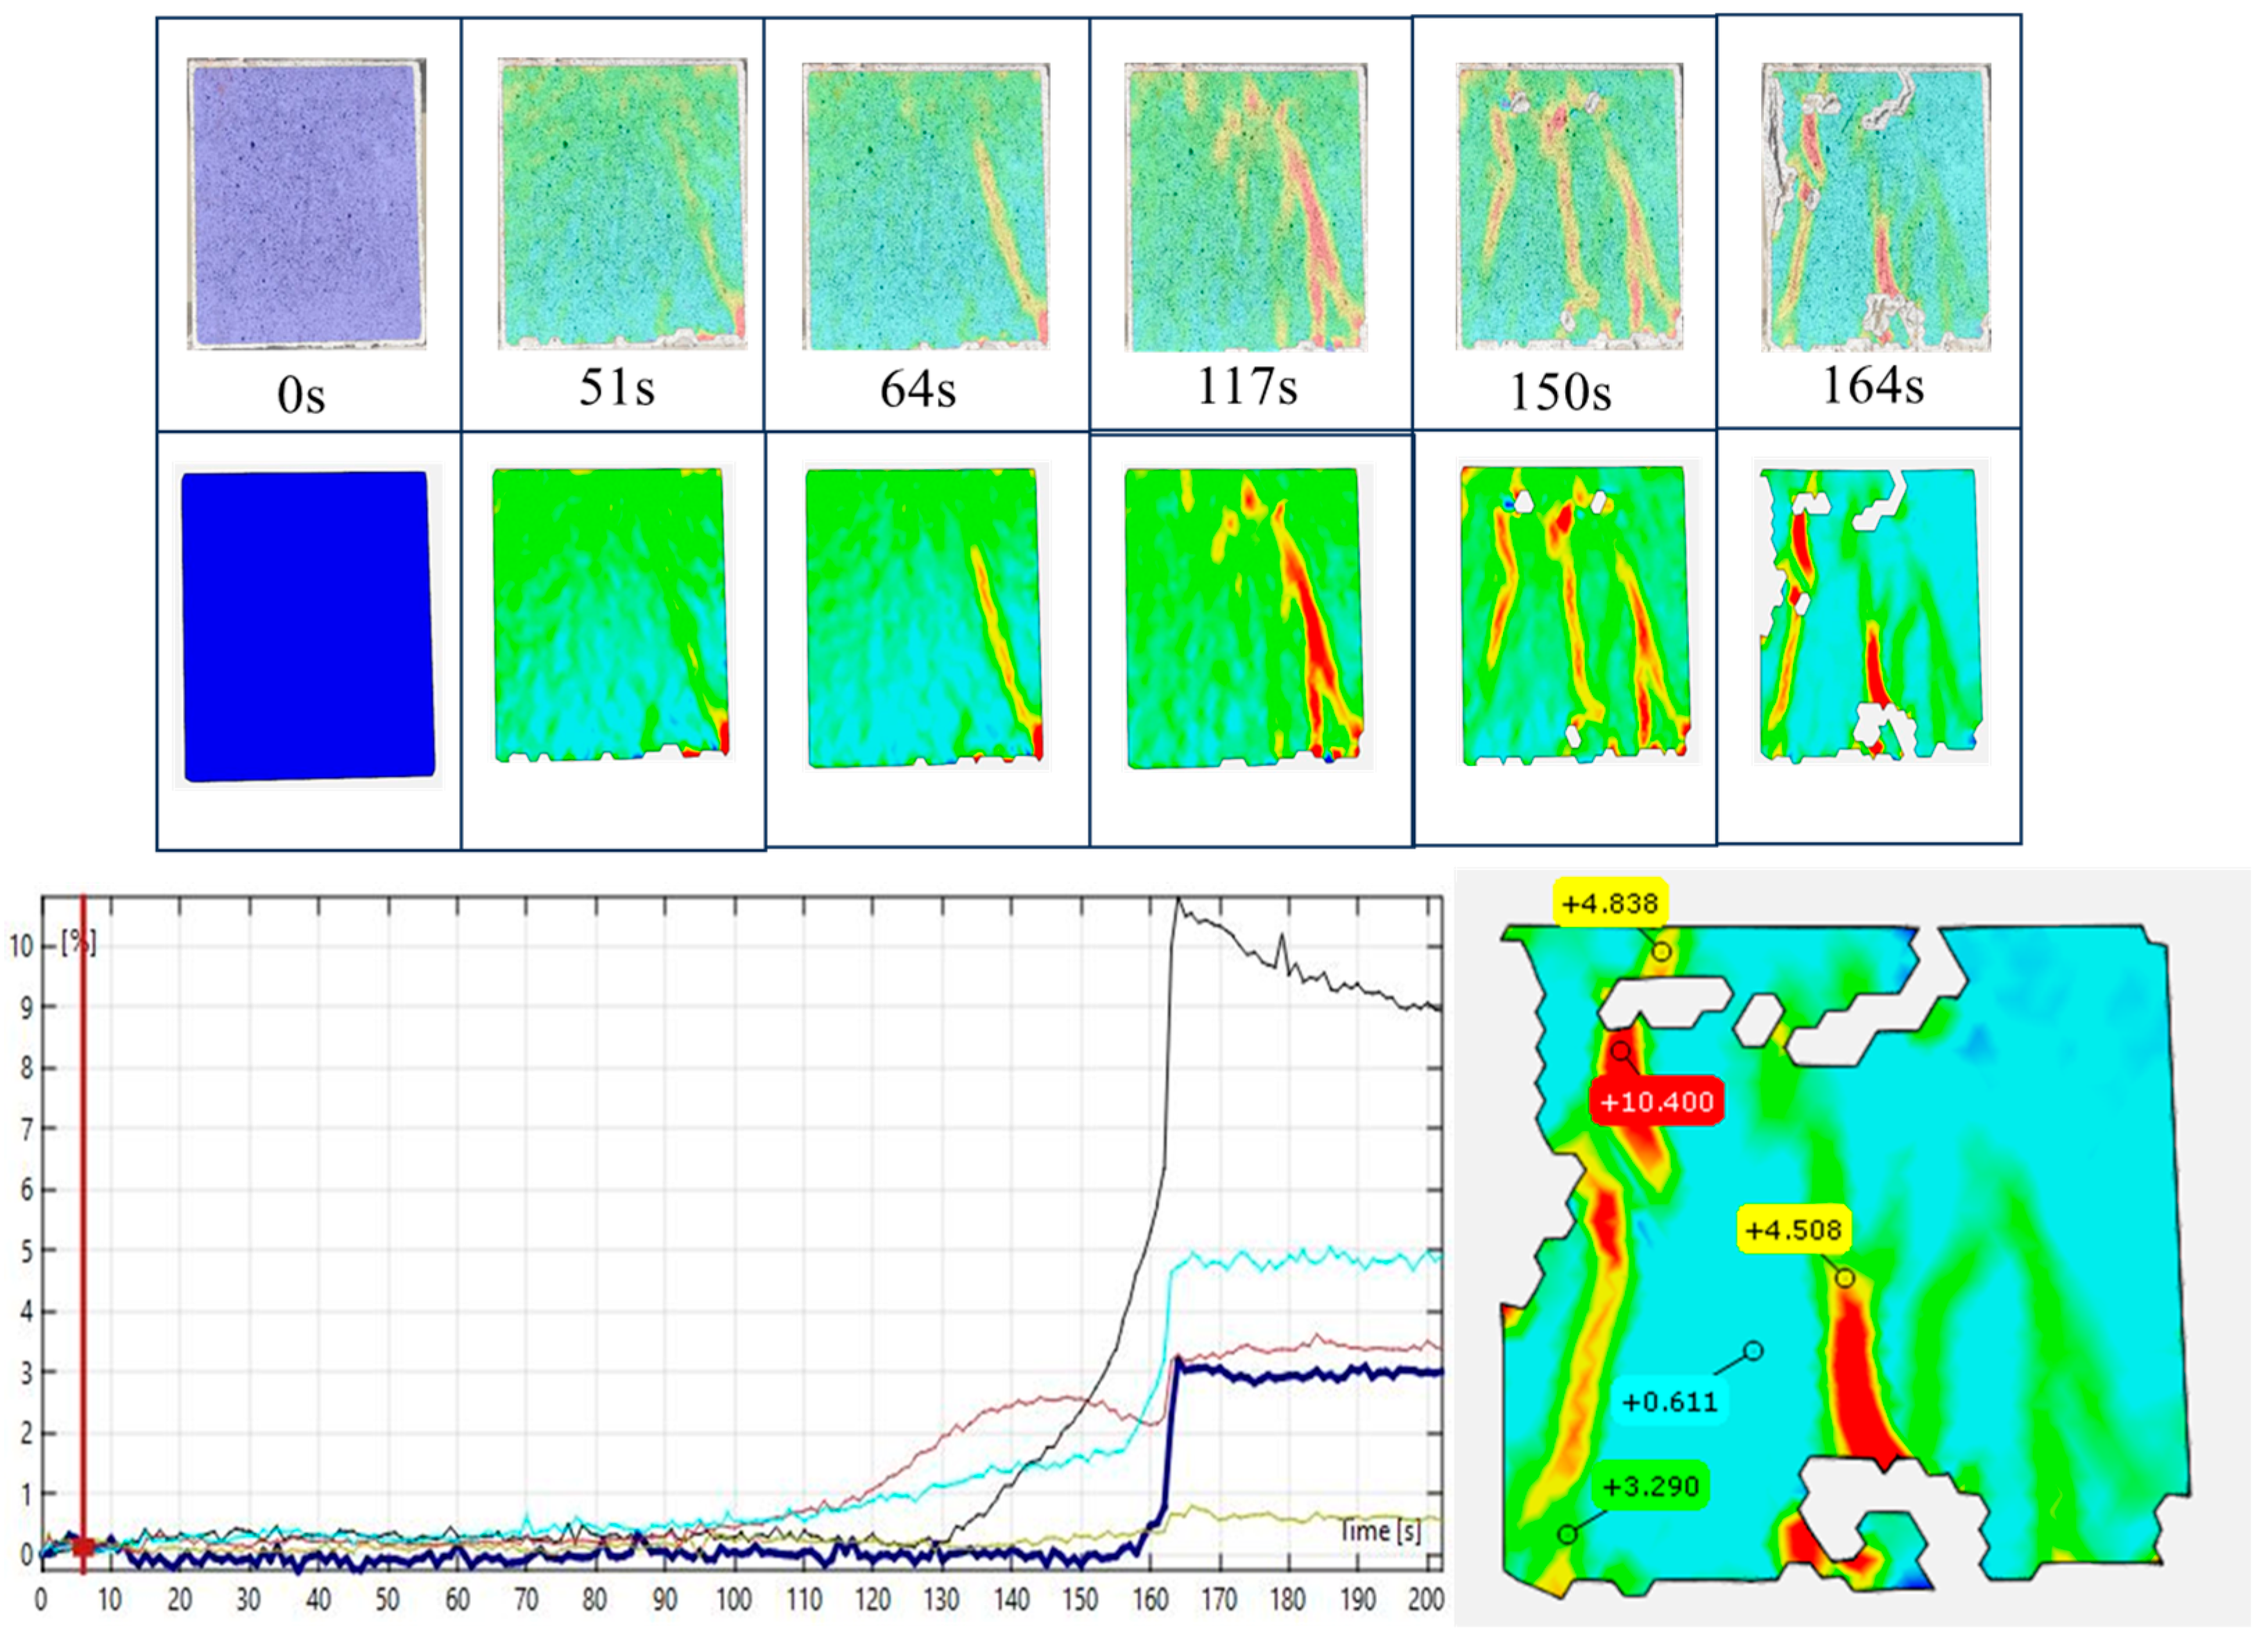
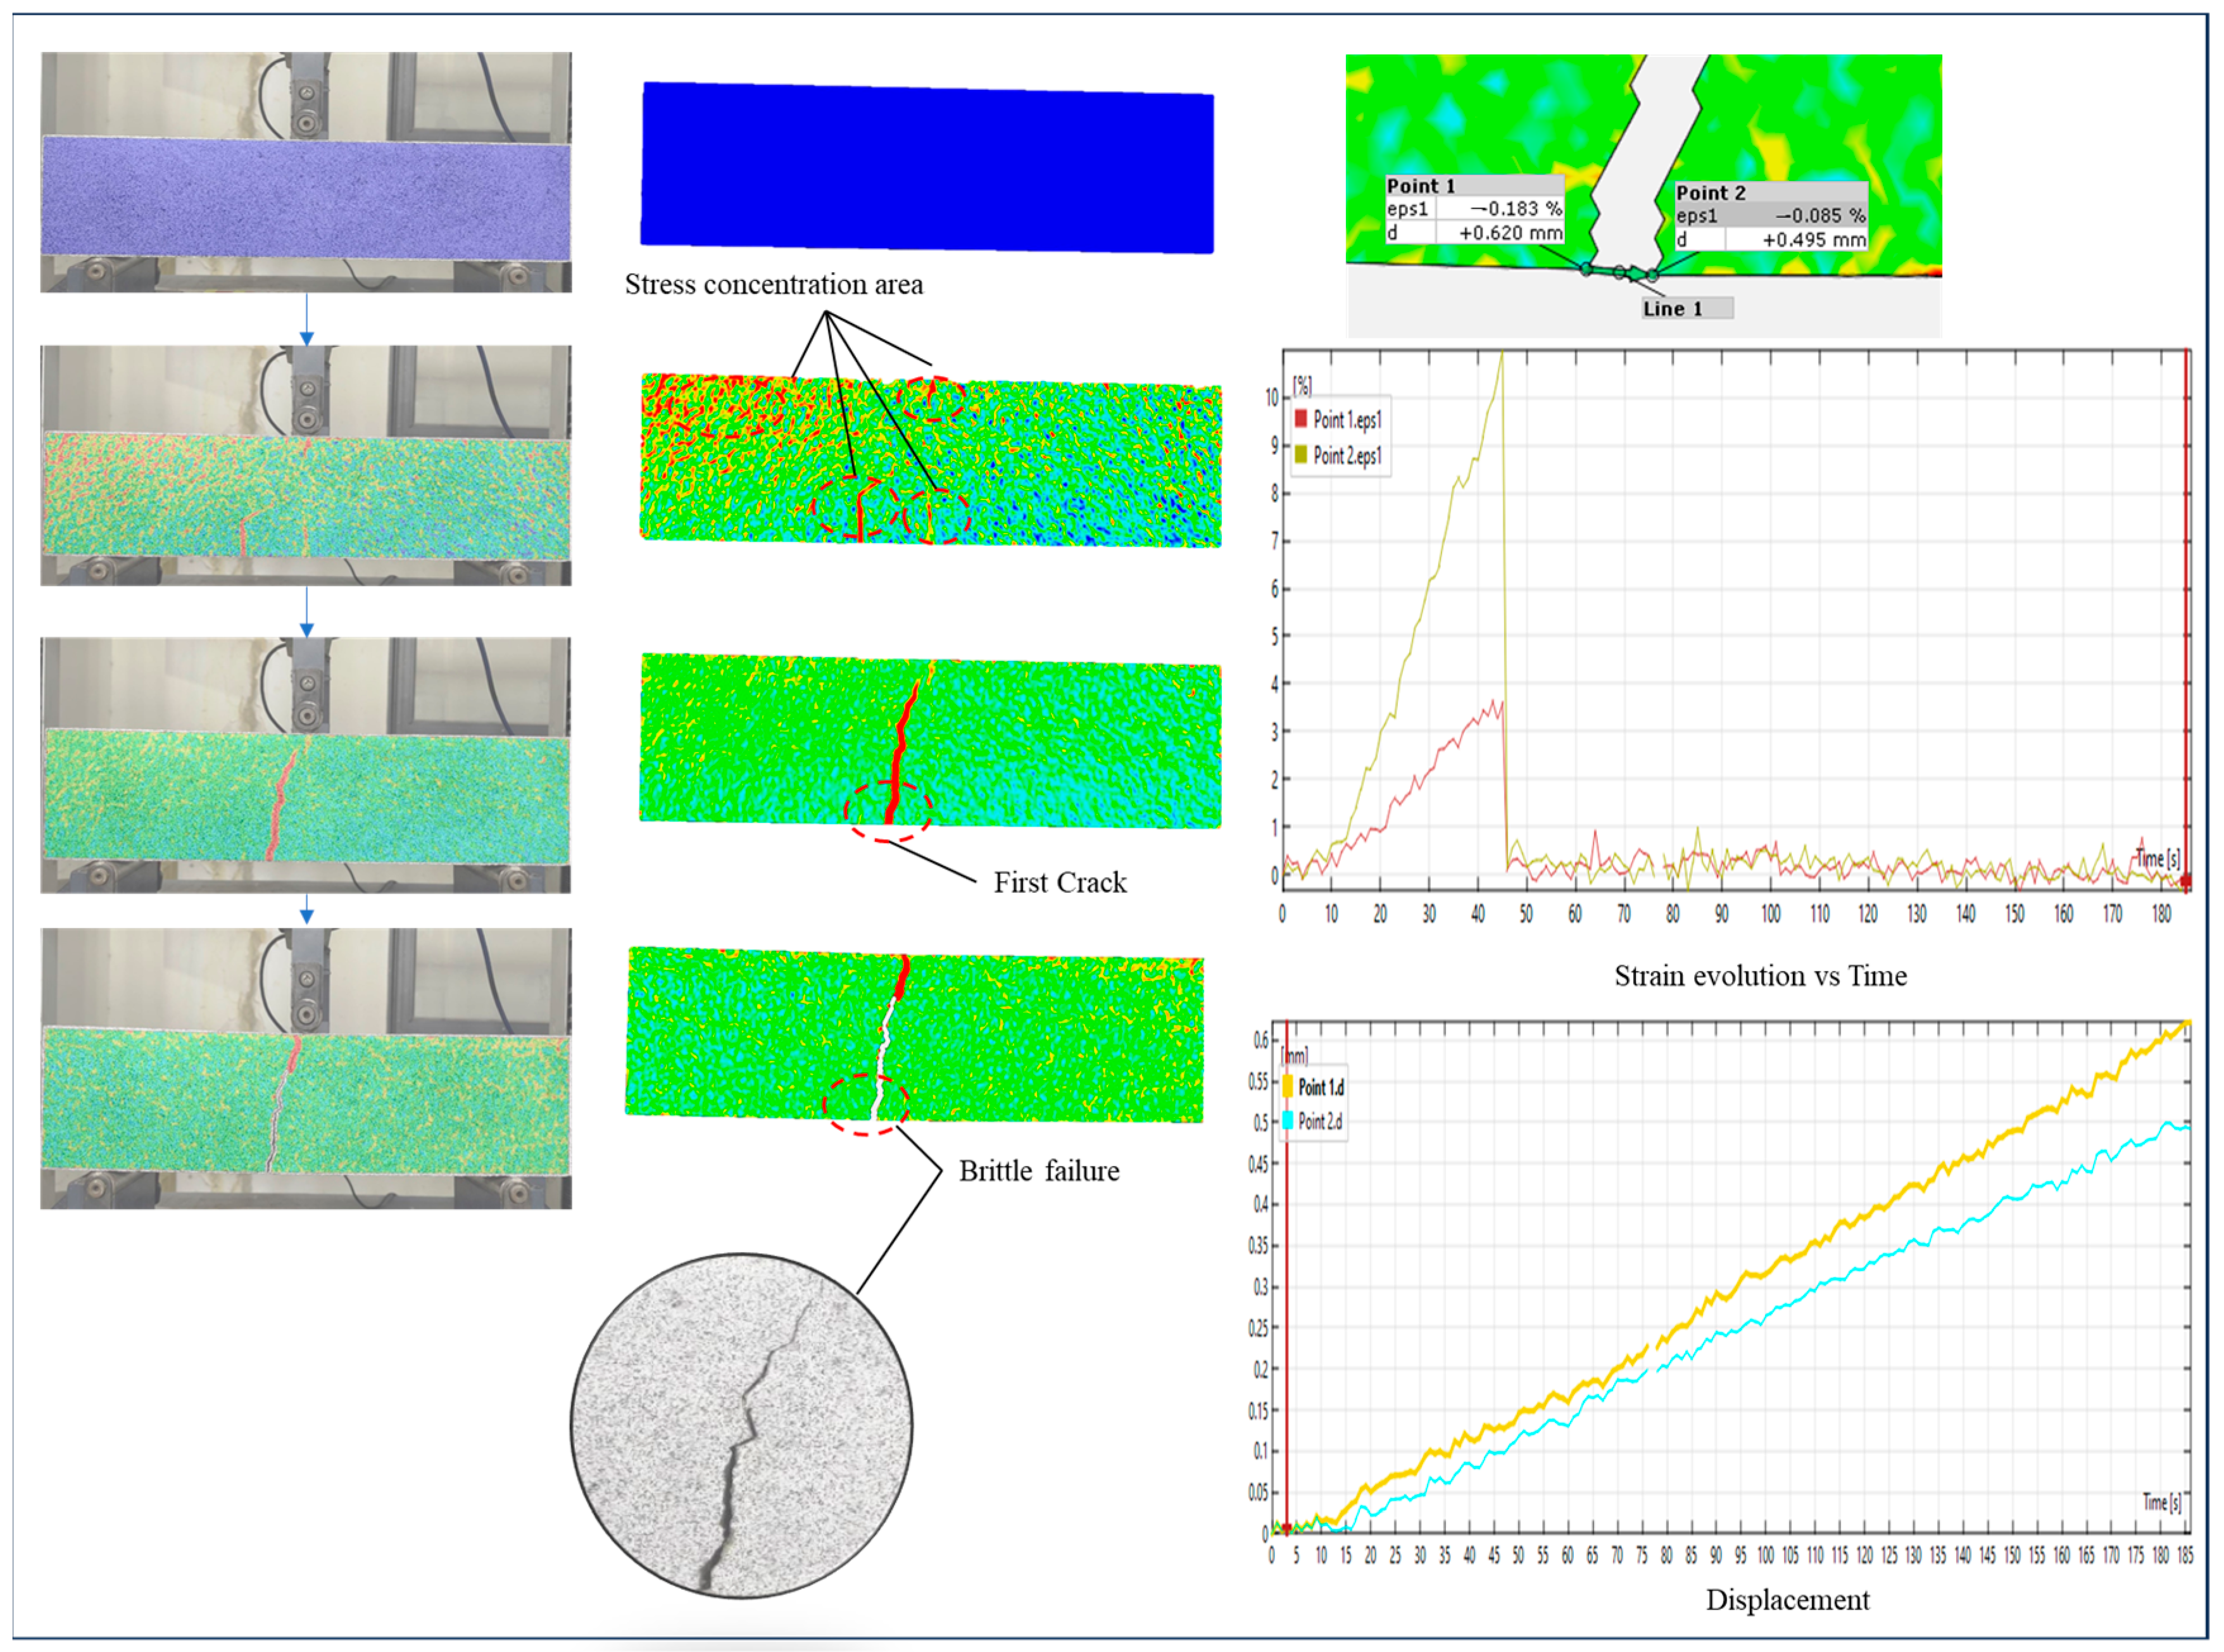
Figure 16.
Typical failure mode of the reference concrete beam (S0-A0.0) under three-point bending test.
Figure 16.
Typical failure mode of the reference concrete beam (S0-A0.0) under three-point bending test.
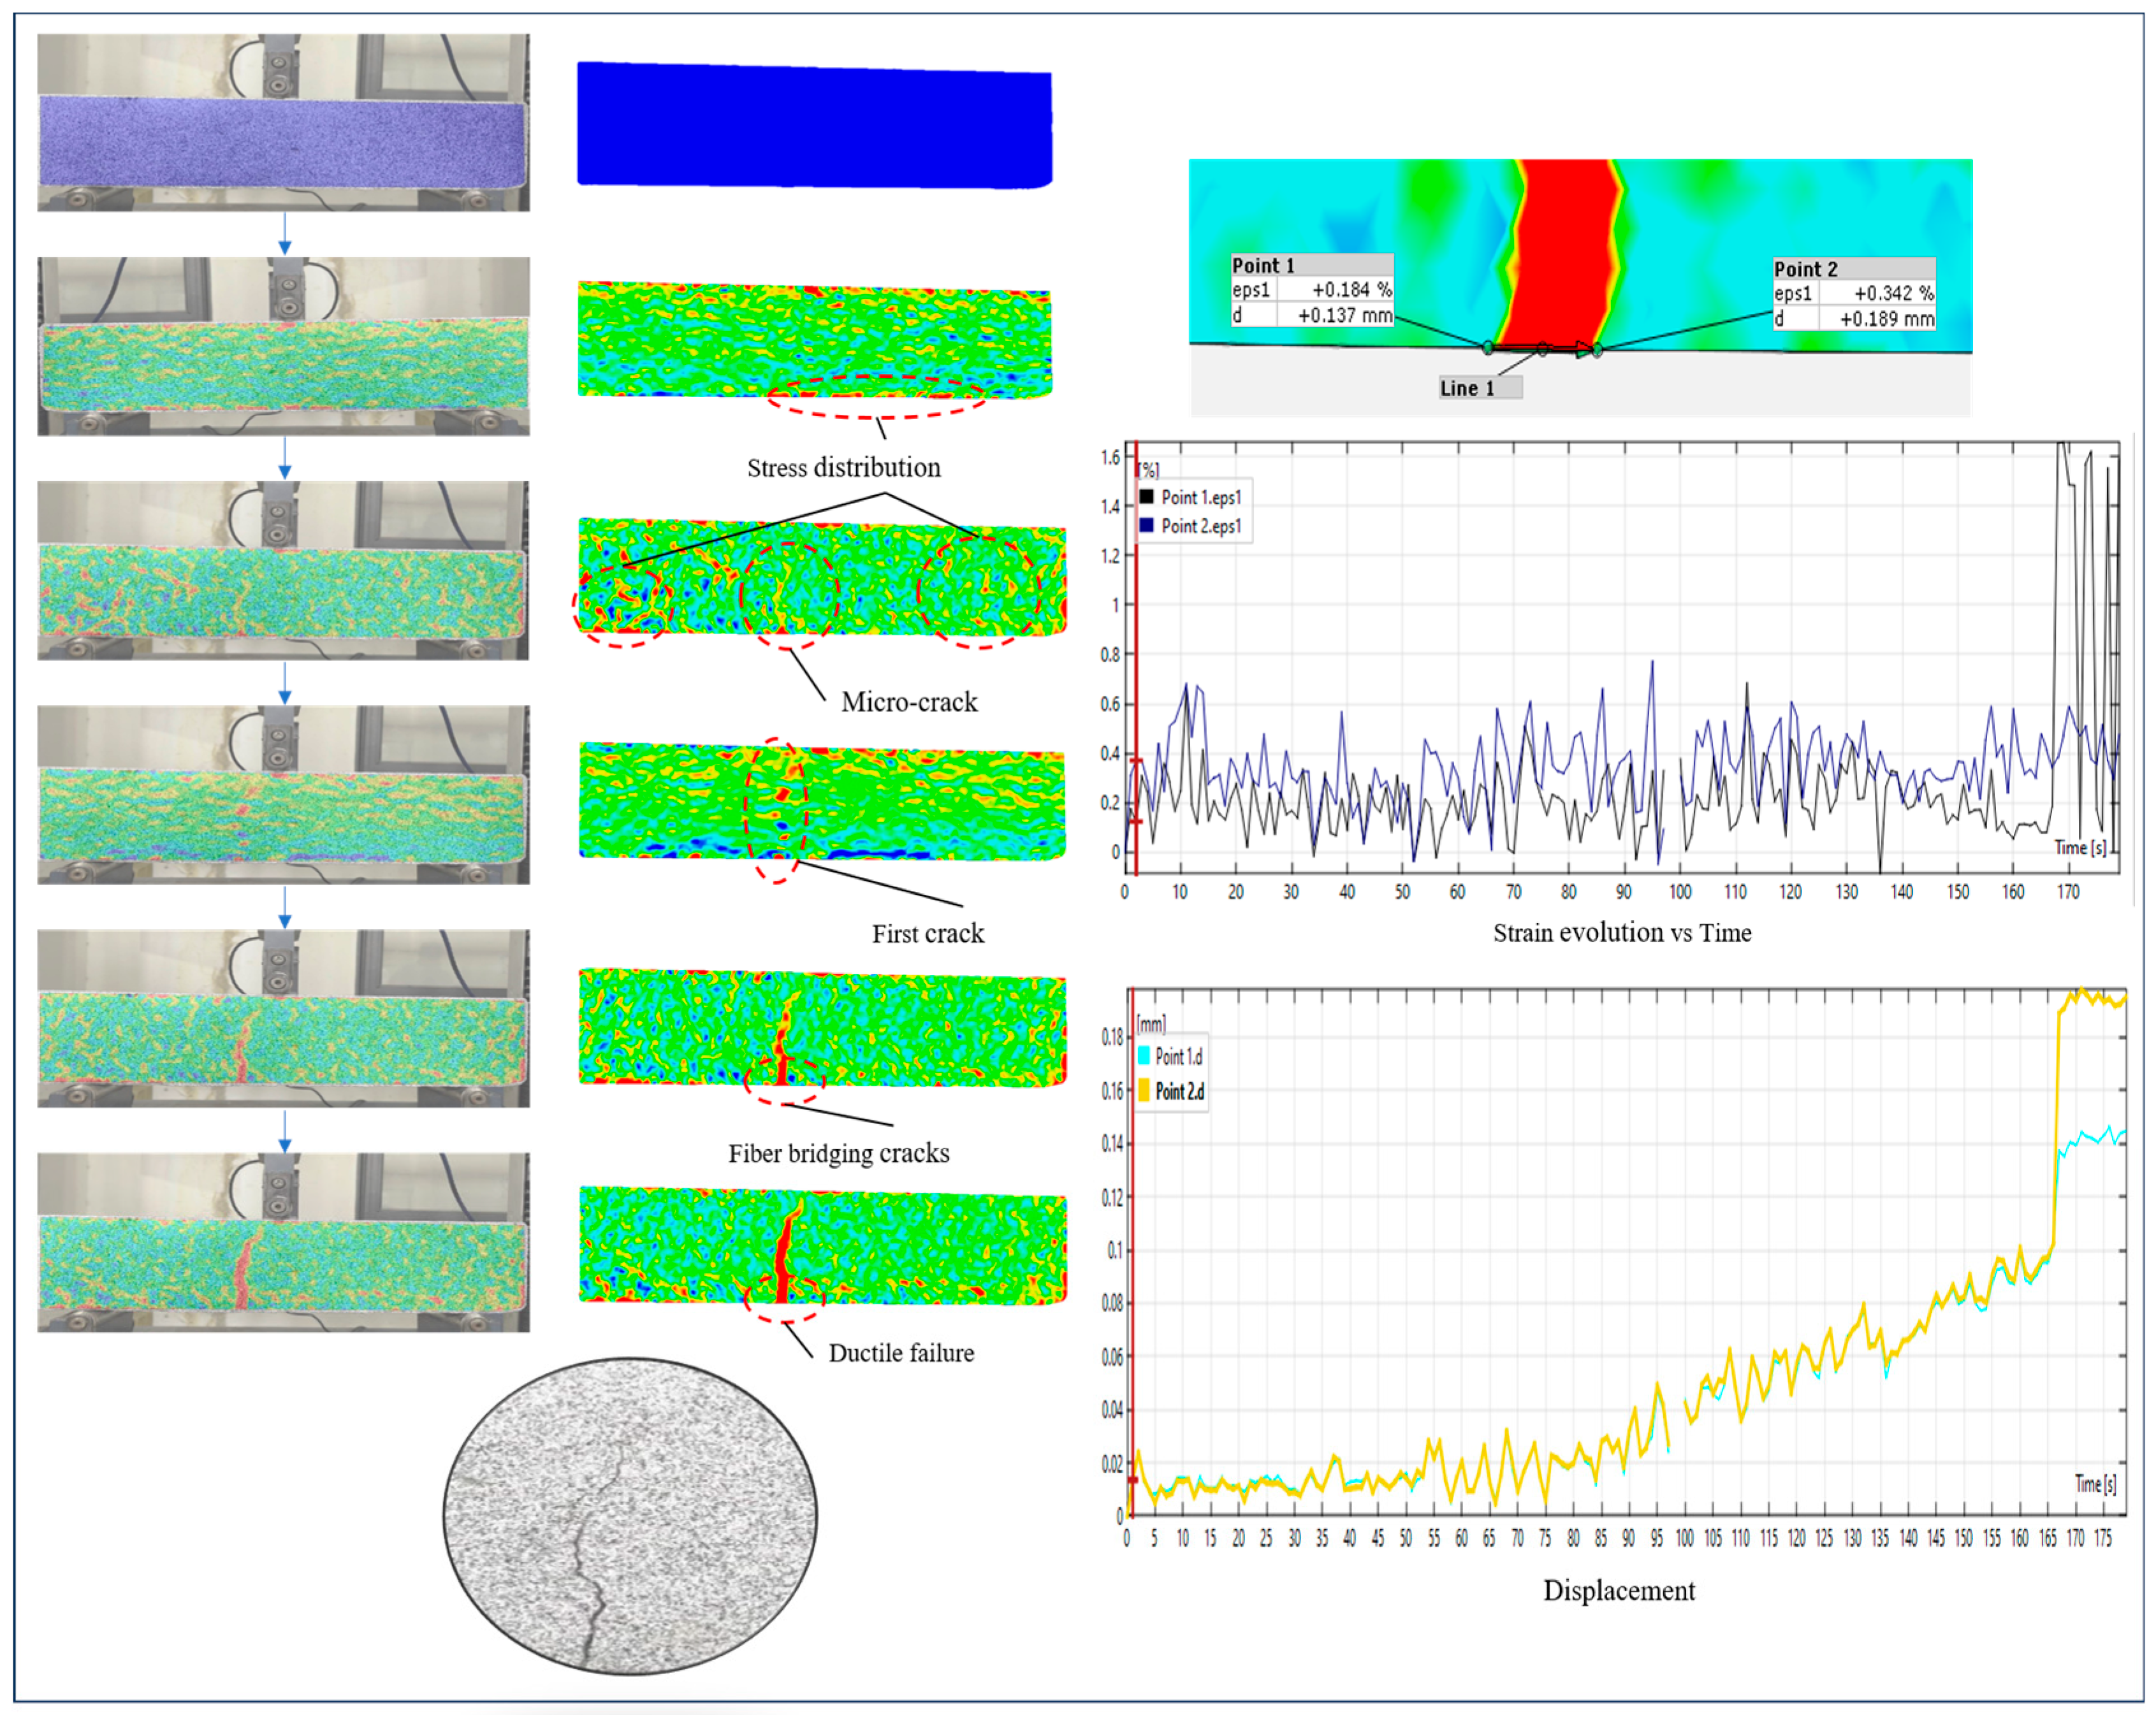
Figure 17.
Failure mode of NSBF-ICC beam (NS1.5B1.2) under three-point bending test.
Figure 17.
Failure mode of NSBF-ICC beam (NS1.5B1.2) under three-point bending test.
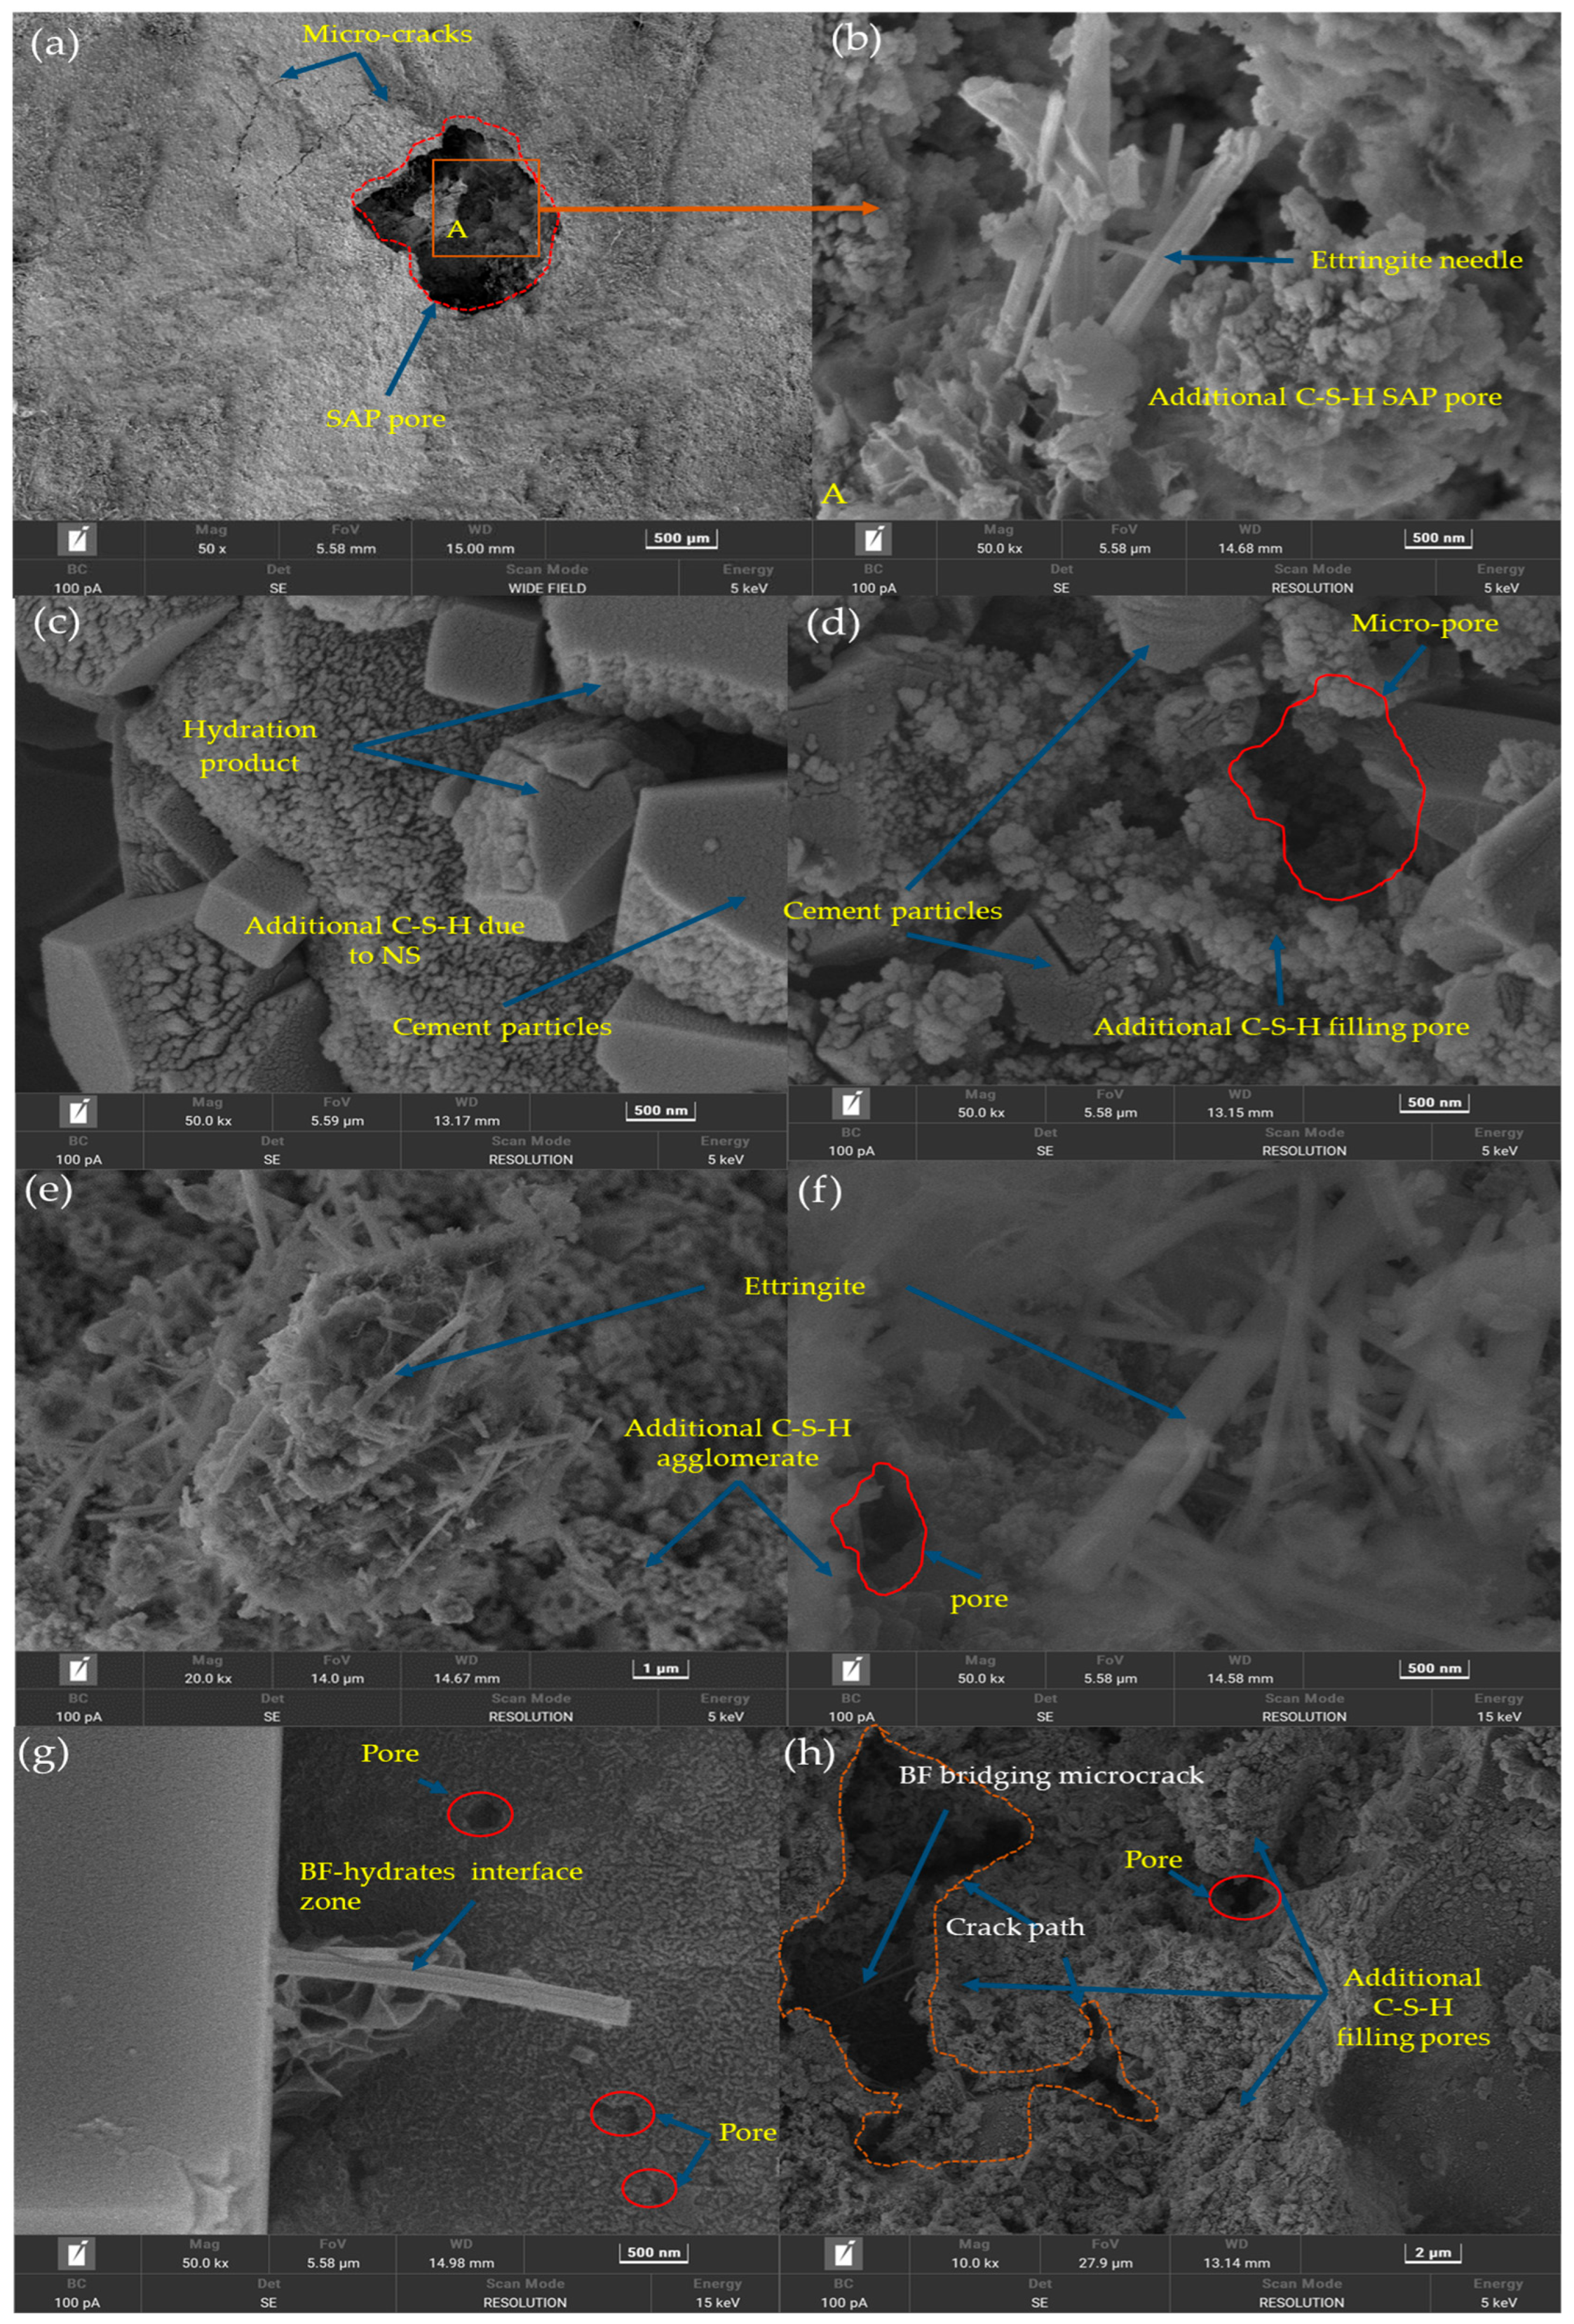
Figure 18.
SEM observation of NSBF-ICC mixture at 28 days (NS1.5B1.2 mix). (a) SAP pore formation after water release; (b) hydrates inside SAP pore; (c–f) additional C–S–H formation and ettringite due to NS addition; (g) fiber interface with hydrates; (h) crack propagation and BF bridging effect.
Figure 18.
SEM observation of NSBF-ICC mixture at 28 days (NS1.5B1.2 mix). (a) SAP pore formation after water release; (b) hydrates inside SAP pore; (c–f) additional C–S–H formation and ettringite due to NS addition; (g) fiber interface with hydrates; (h) crack propagation and BF bridging effect.
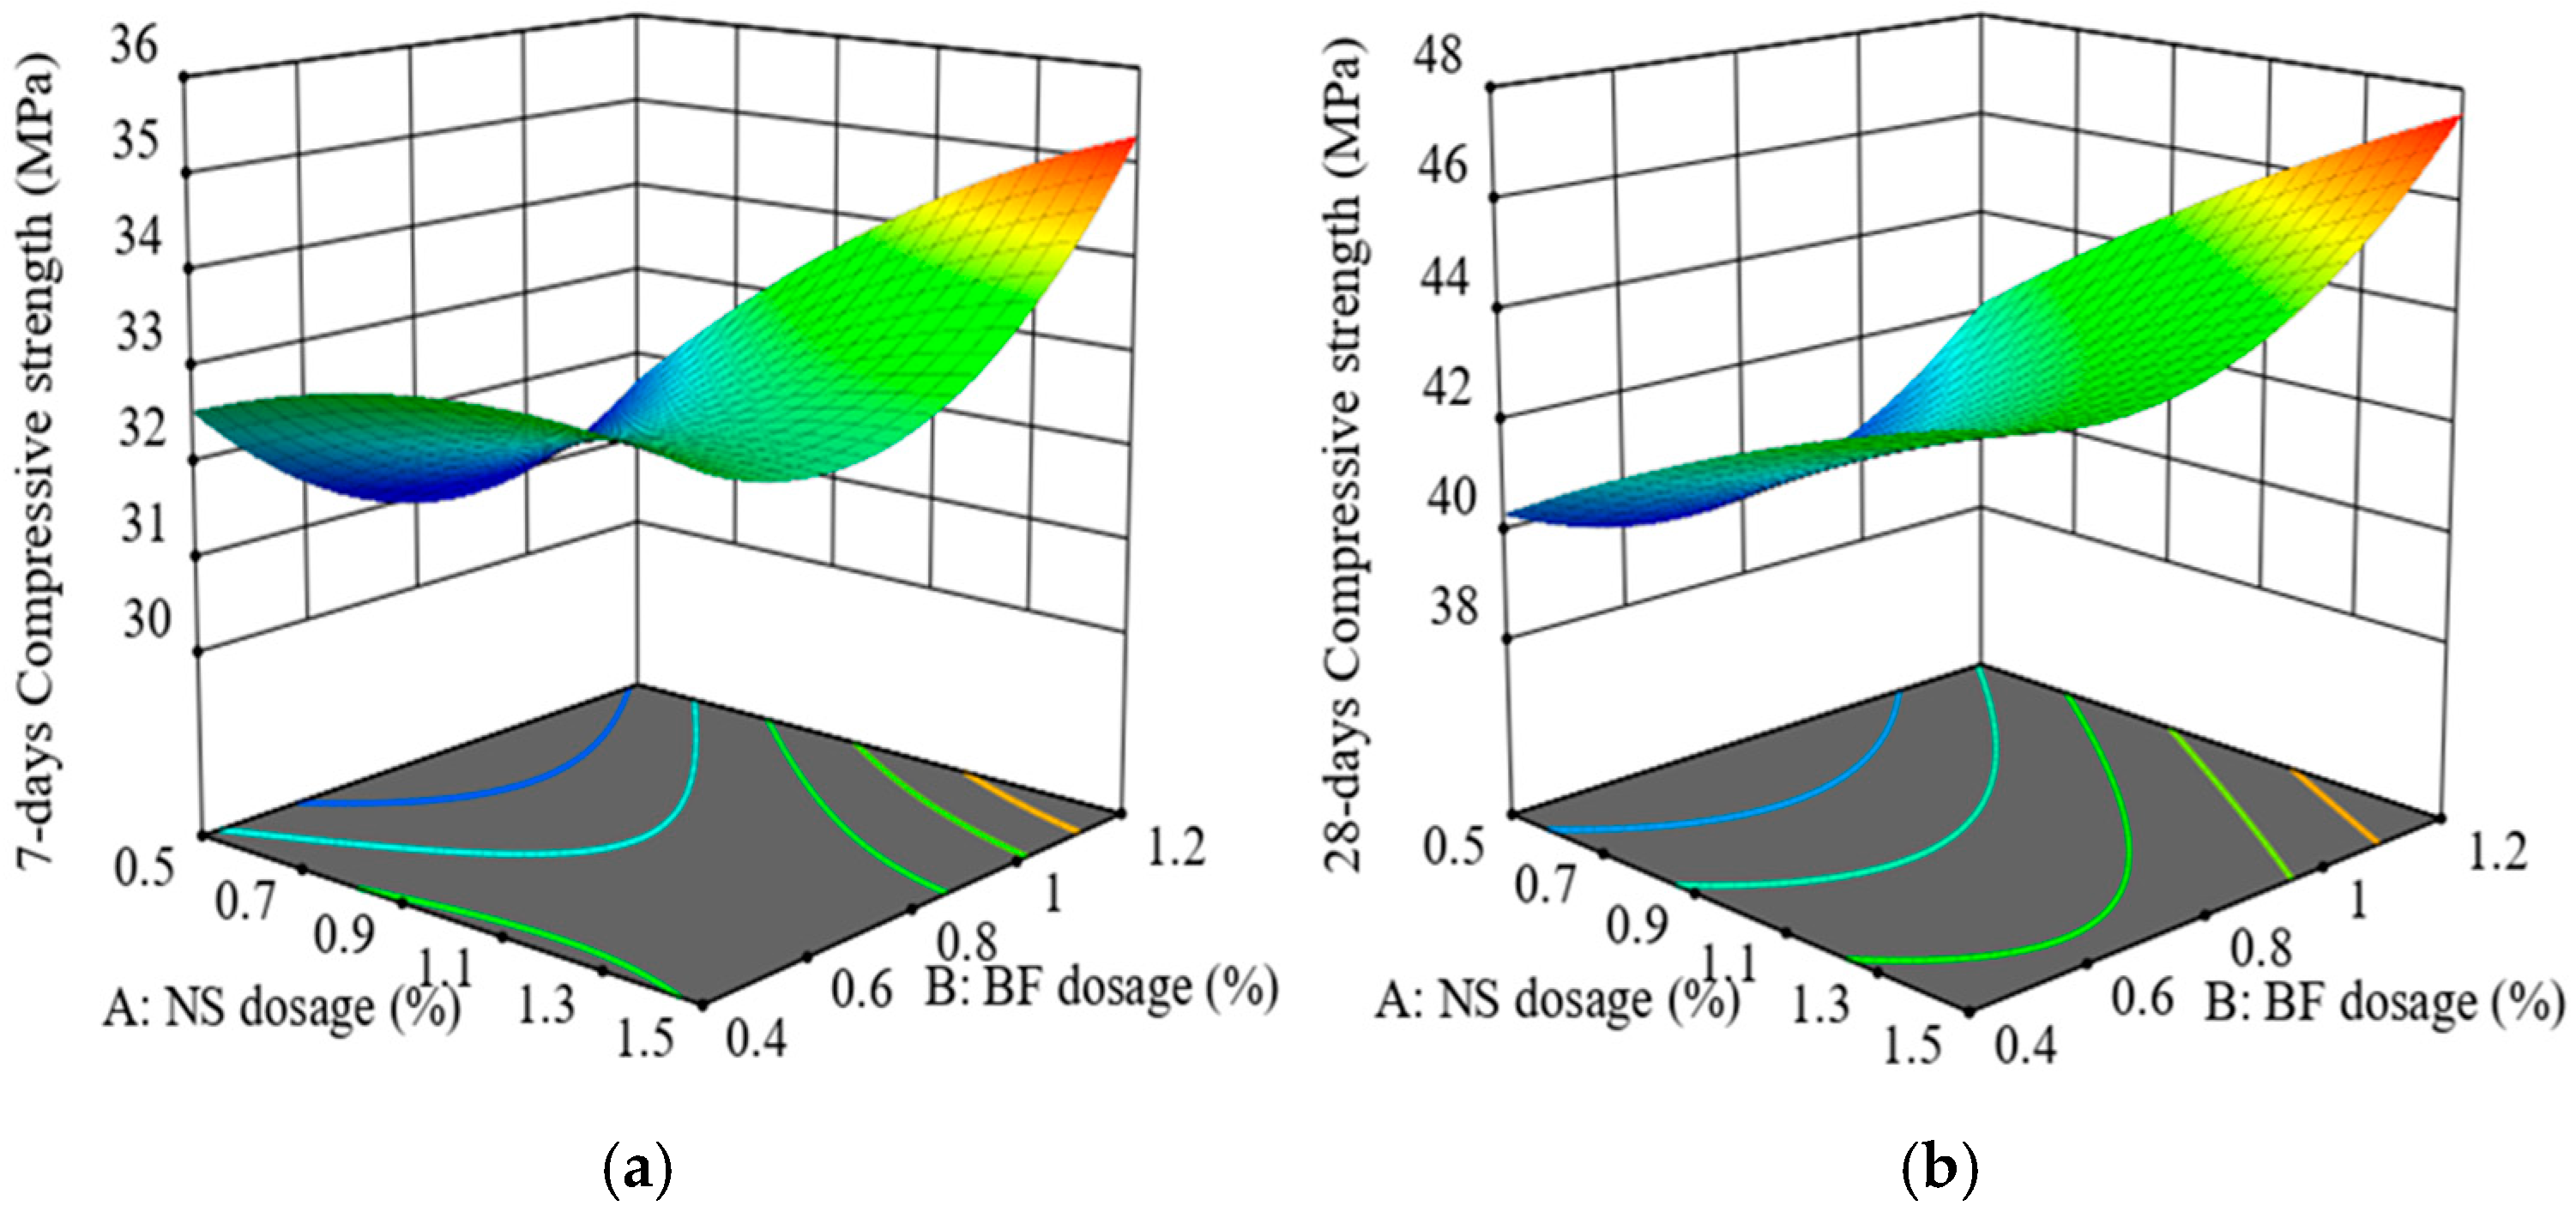
Figure 19.
Three-dimensional surface plots of the combined effect of NS and BF on the compressive strength of ICC at (a) 7 days, and (b) 28 days. The color scale represents the variation in compressive strength, with red indicating higher strength values and blue indicating lower strength values.
Figure 19.
Three-dimensional surface plots of the combined effect of NS and BF on the compressive strength of ICC at (a) 7 days, and (b) 28 days. The color scale represents the variation in compressive strength, with red indicating higher strength values and blue indicating lower strength values.
Figure 20.
Two-dimensional contour plots of synergetic influence of NS and BF on compressive strength of ICC: (a) 7 days, and (b) 28 days. The color scale represents the variation in compressive strength, with red indicating higher strength values and blue indicating lower strength values.
Figure 20.
Two-dimensional contour plots of synergetic influence of NS and BF on compressive strength of ICC: (a) 7 days, and (b) 28 days. The color scale represents the variation in compressive strength, with red indicating higher strength values and blue indicating lower strength values.
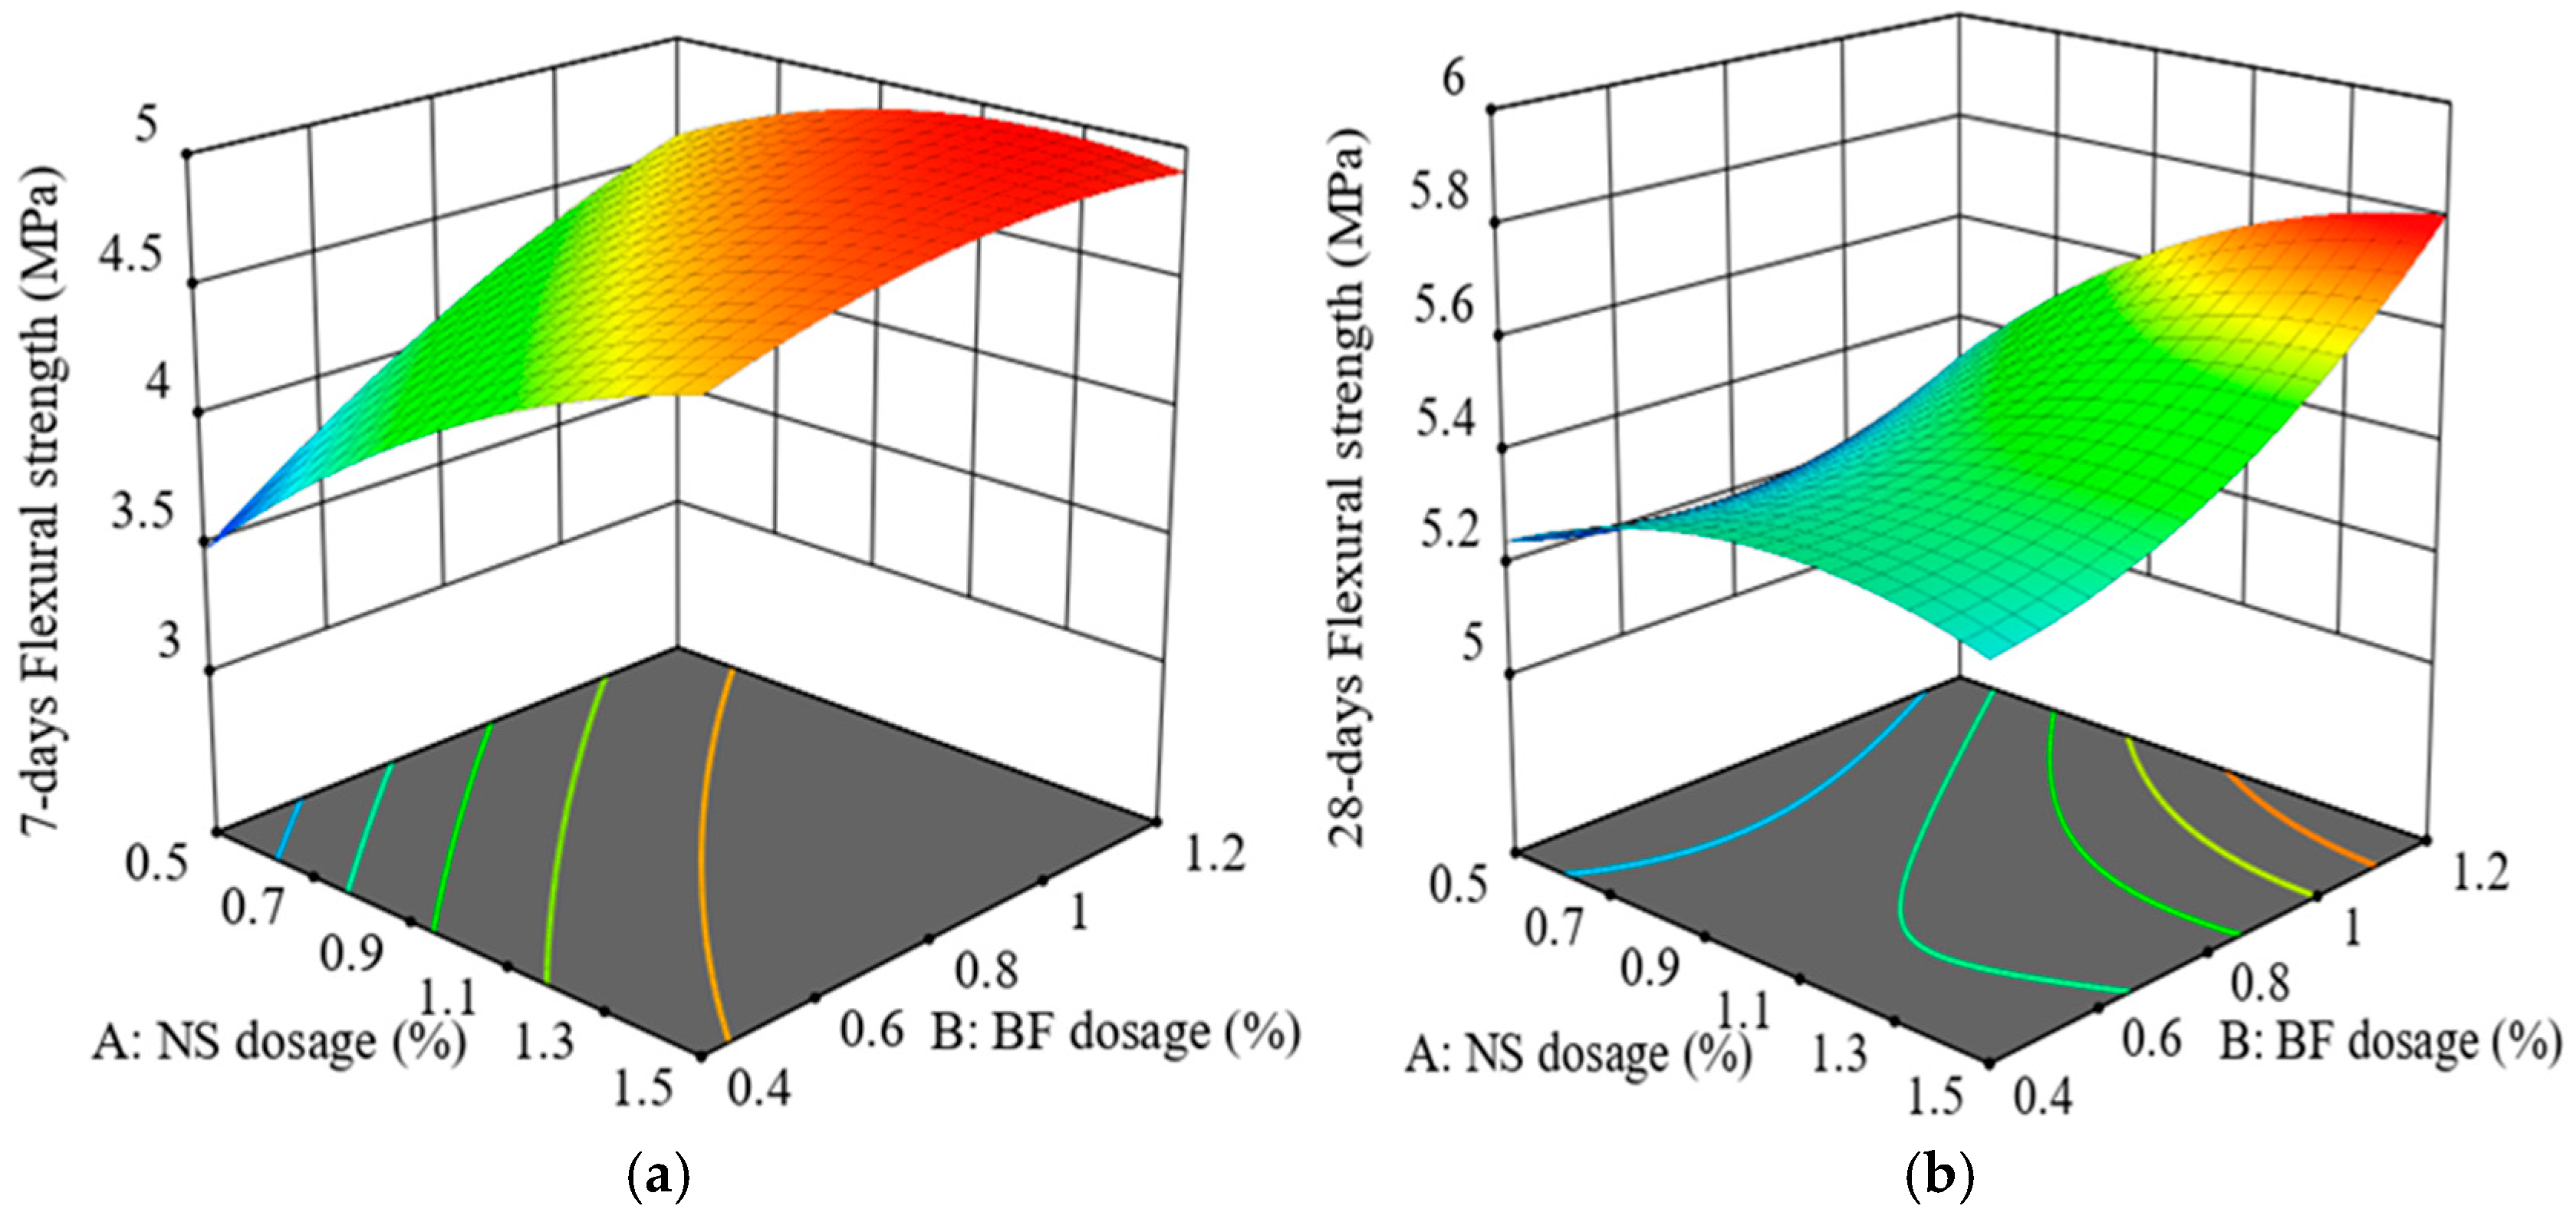
Figure 21.
Three-dimensional surface plots of the combined effect of NS and BF on the flexural strength of NSBF-ICC with NS at (a) 7 days, and (b) 28 days. The color scale represents the variation in flexural strength, with red indicating higher strength values and blue indicating lower strength values.
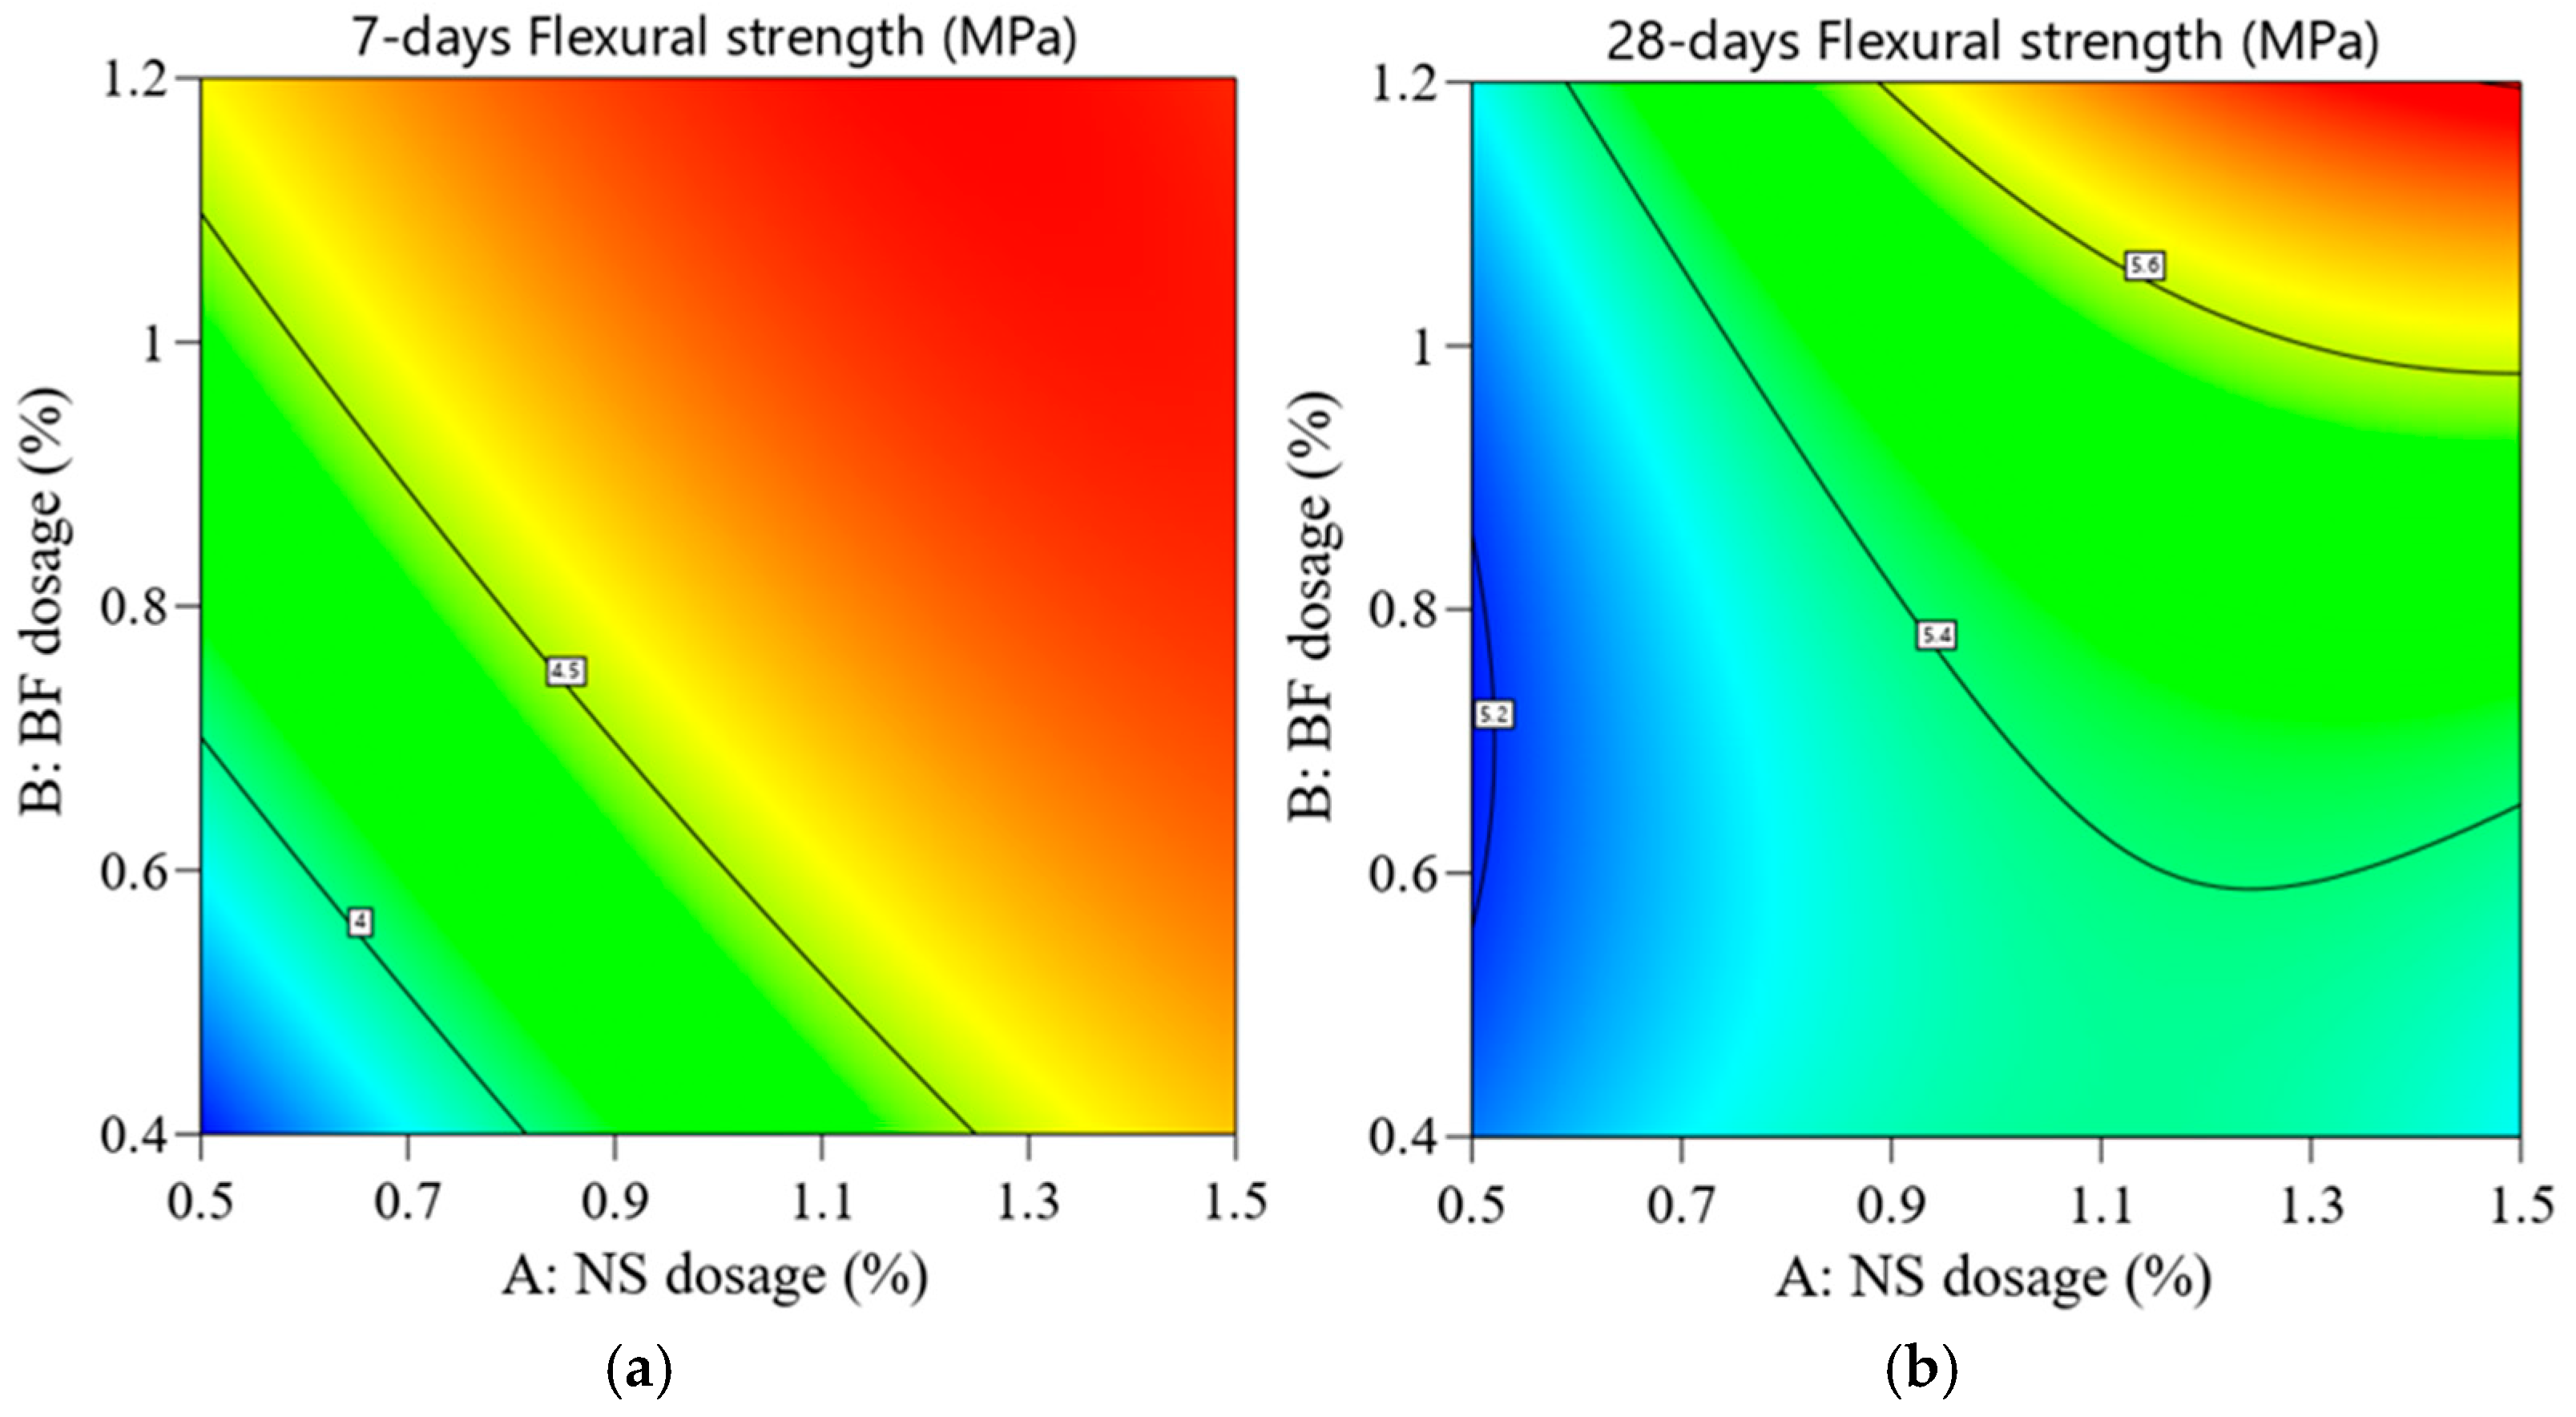
Figure 22.
Two-dimensional contour plots of synergetic influence of NS AND BF on flexural strength of NSBF-ICC: (a) 7 days, and (b) 28 days. The color scale represents the variation in flexural strength, with red indicating higher strength values and blue indicating lower strength values.
Figure 22.
Two-dimensional contour plots of synergetic influence of NS AND BF on flexural strength of NSBF-ICC: (a) 7 days, and (b) 28 days. The color scale represents the variation in flexural strength, with red indicating higher strength values and blue indicating lower strength values.
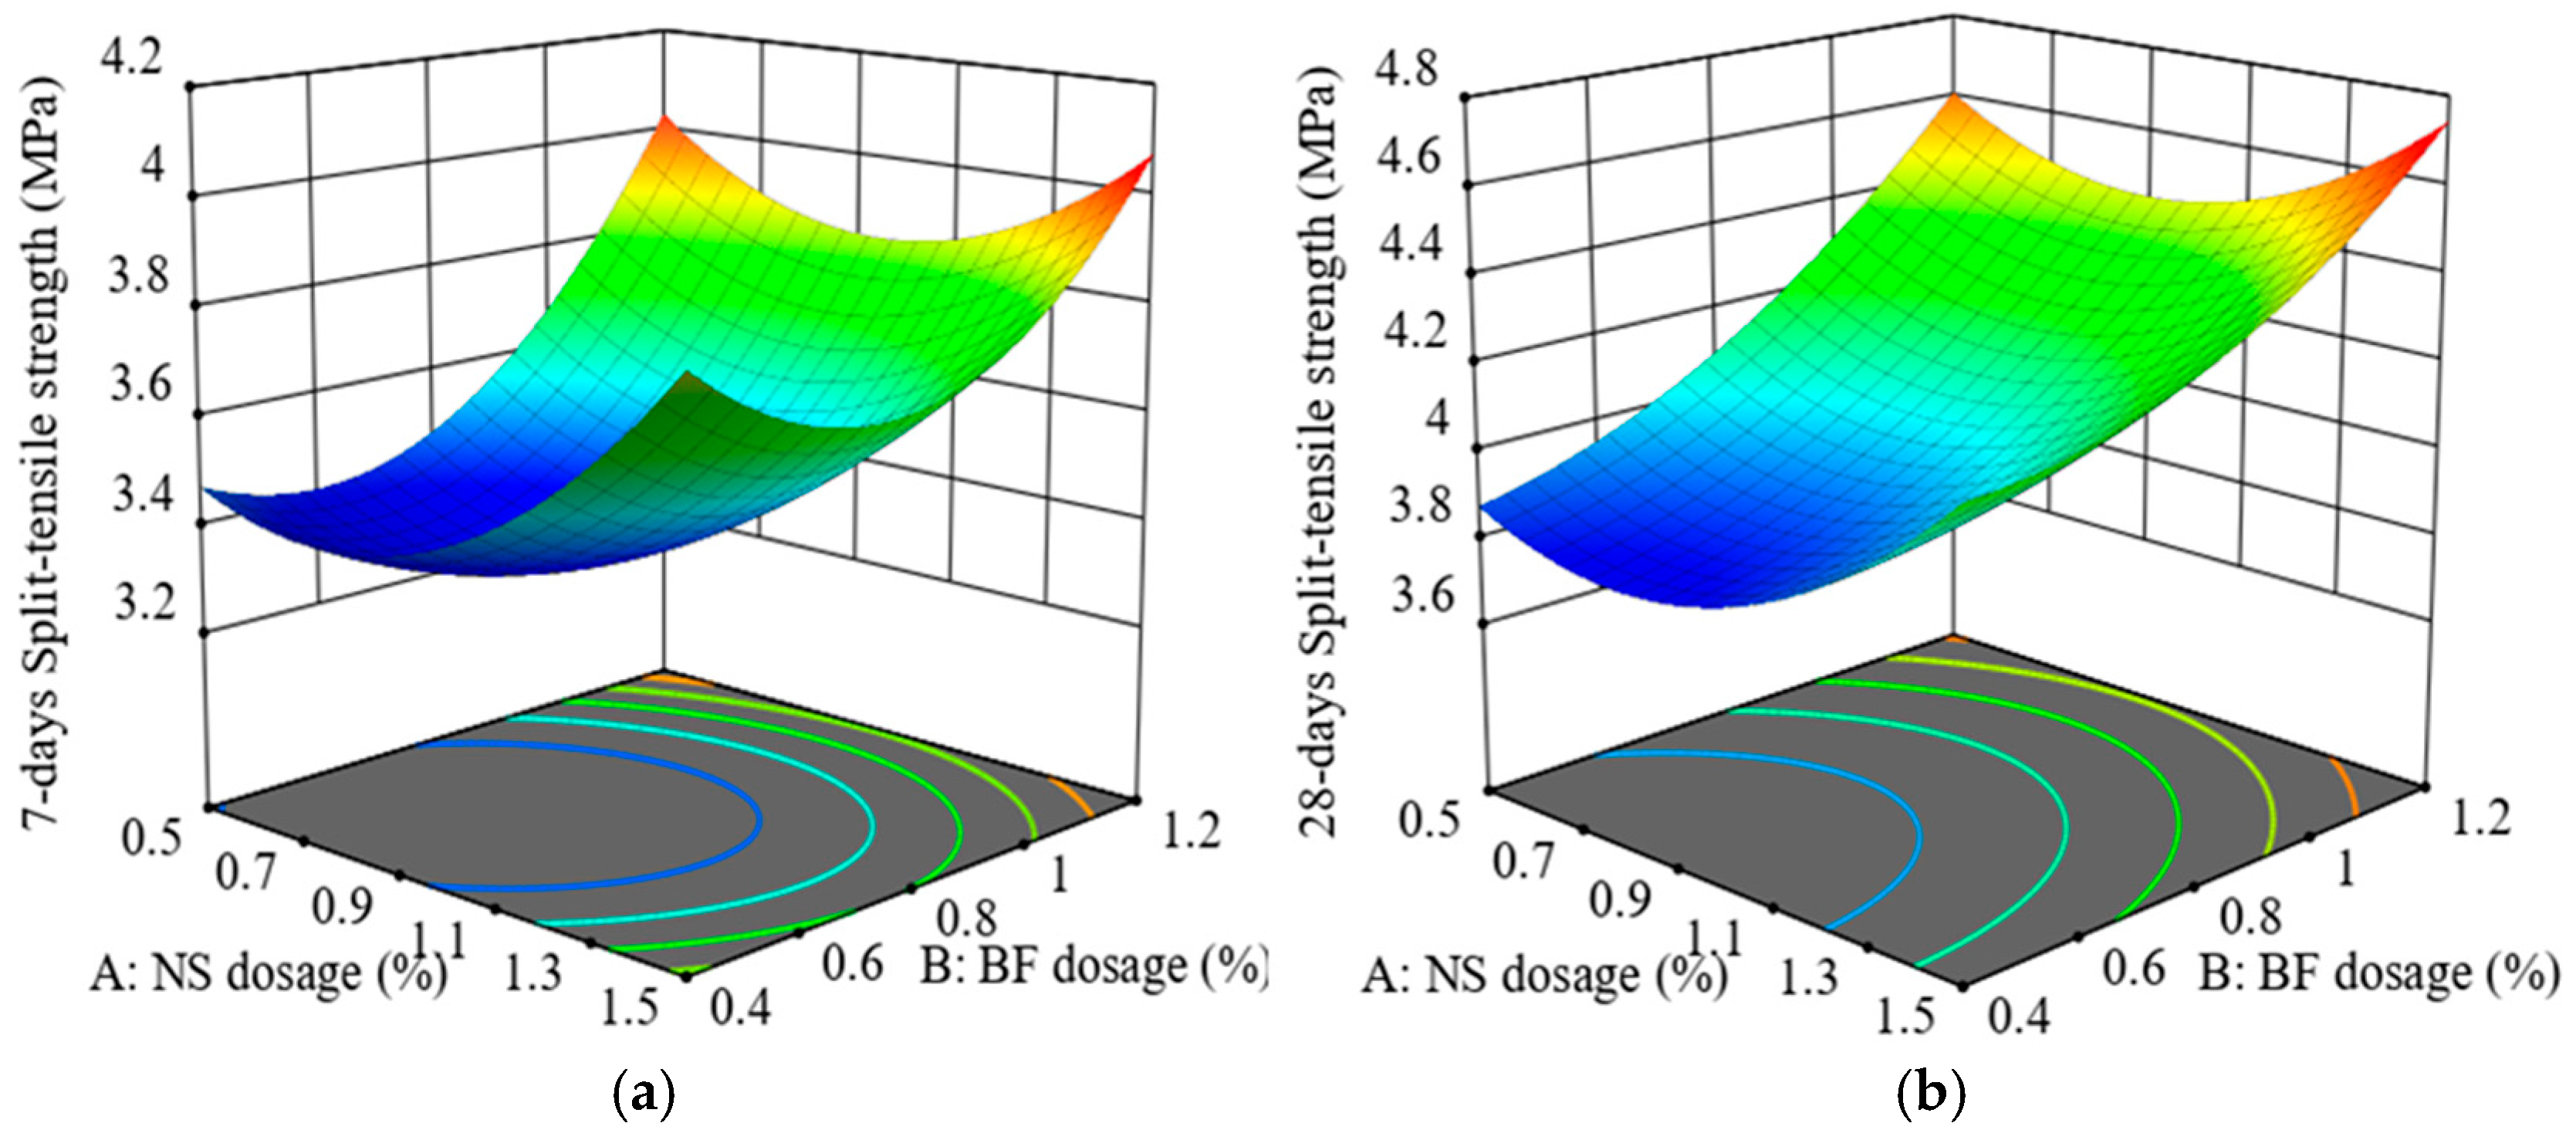
Figure 23.
Three-dimensional surface plots of the combined effect of NS and BF on the split-tensile strength of NSBF-ICC with NS at (a) 7 days, and (b) 28 days. The color scale represents the variation in split-tensile strength, with red indicating higher strength values and blue indicating lower strength values.
Figure 24.
Two-dimensional contour plots of synergetic influence of NS and BF on split-tensile strength of NSBF-ICC: (a) 7 days, and (b) 28 days. The color scale represents the variation in split-tensile strength, with red indicating higher strength values and blue indicating lower strength values.
Figure 24.
Two-dimensional contour plots of synergetic influence of NS and BF on split-tensile strength of NSBF-ICC: (a) 7 days, and (b) 28 days. The color scale represents the variation in split-tensile strength, with red indicating higher strength values and blue indicating lower strength values.
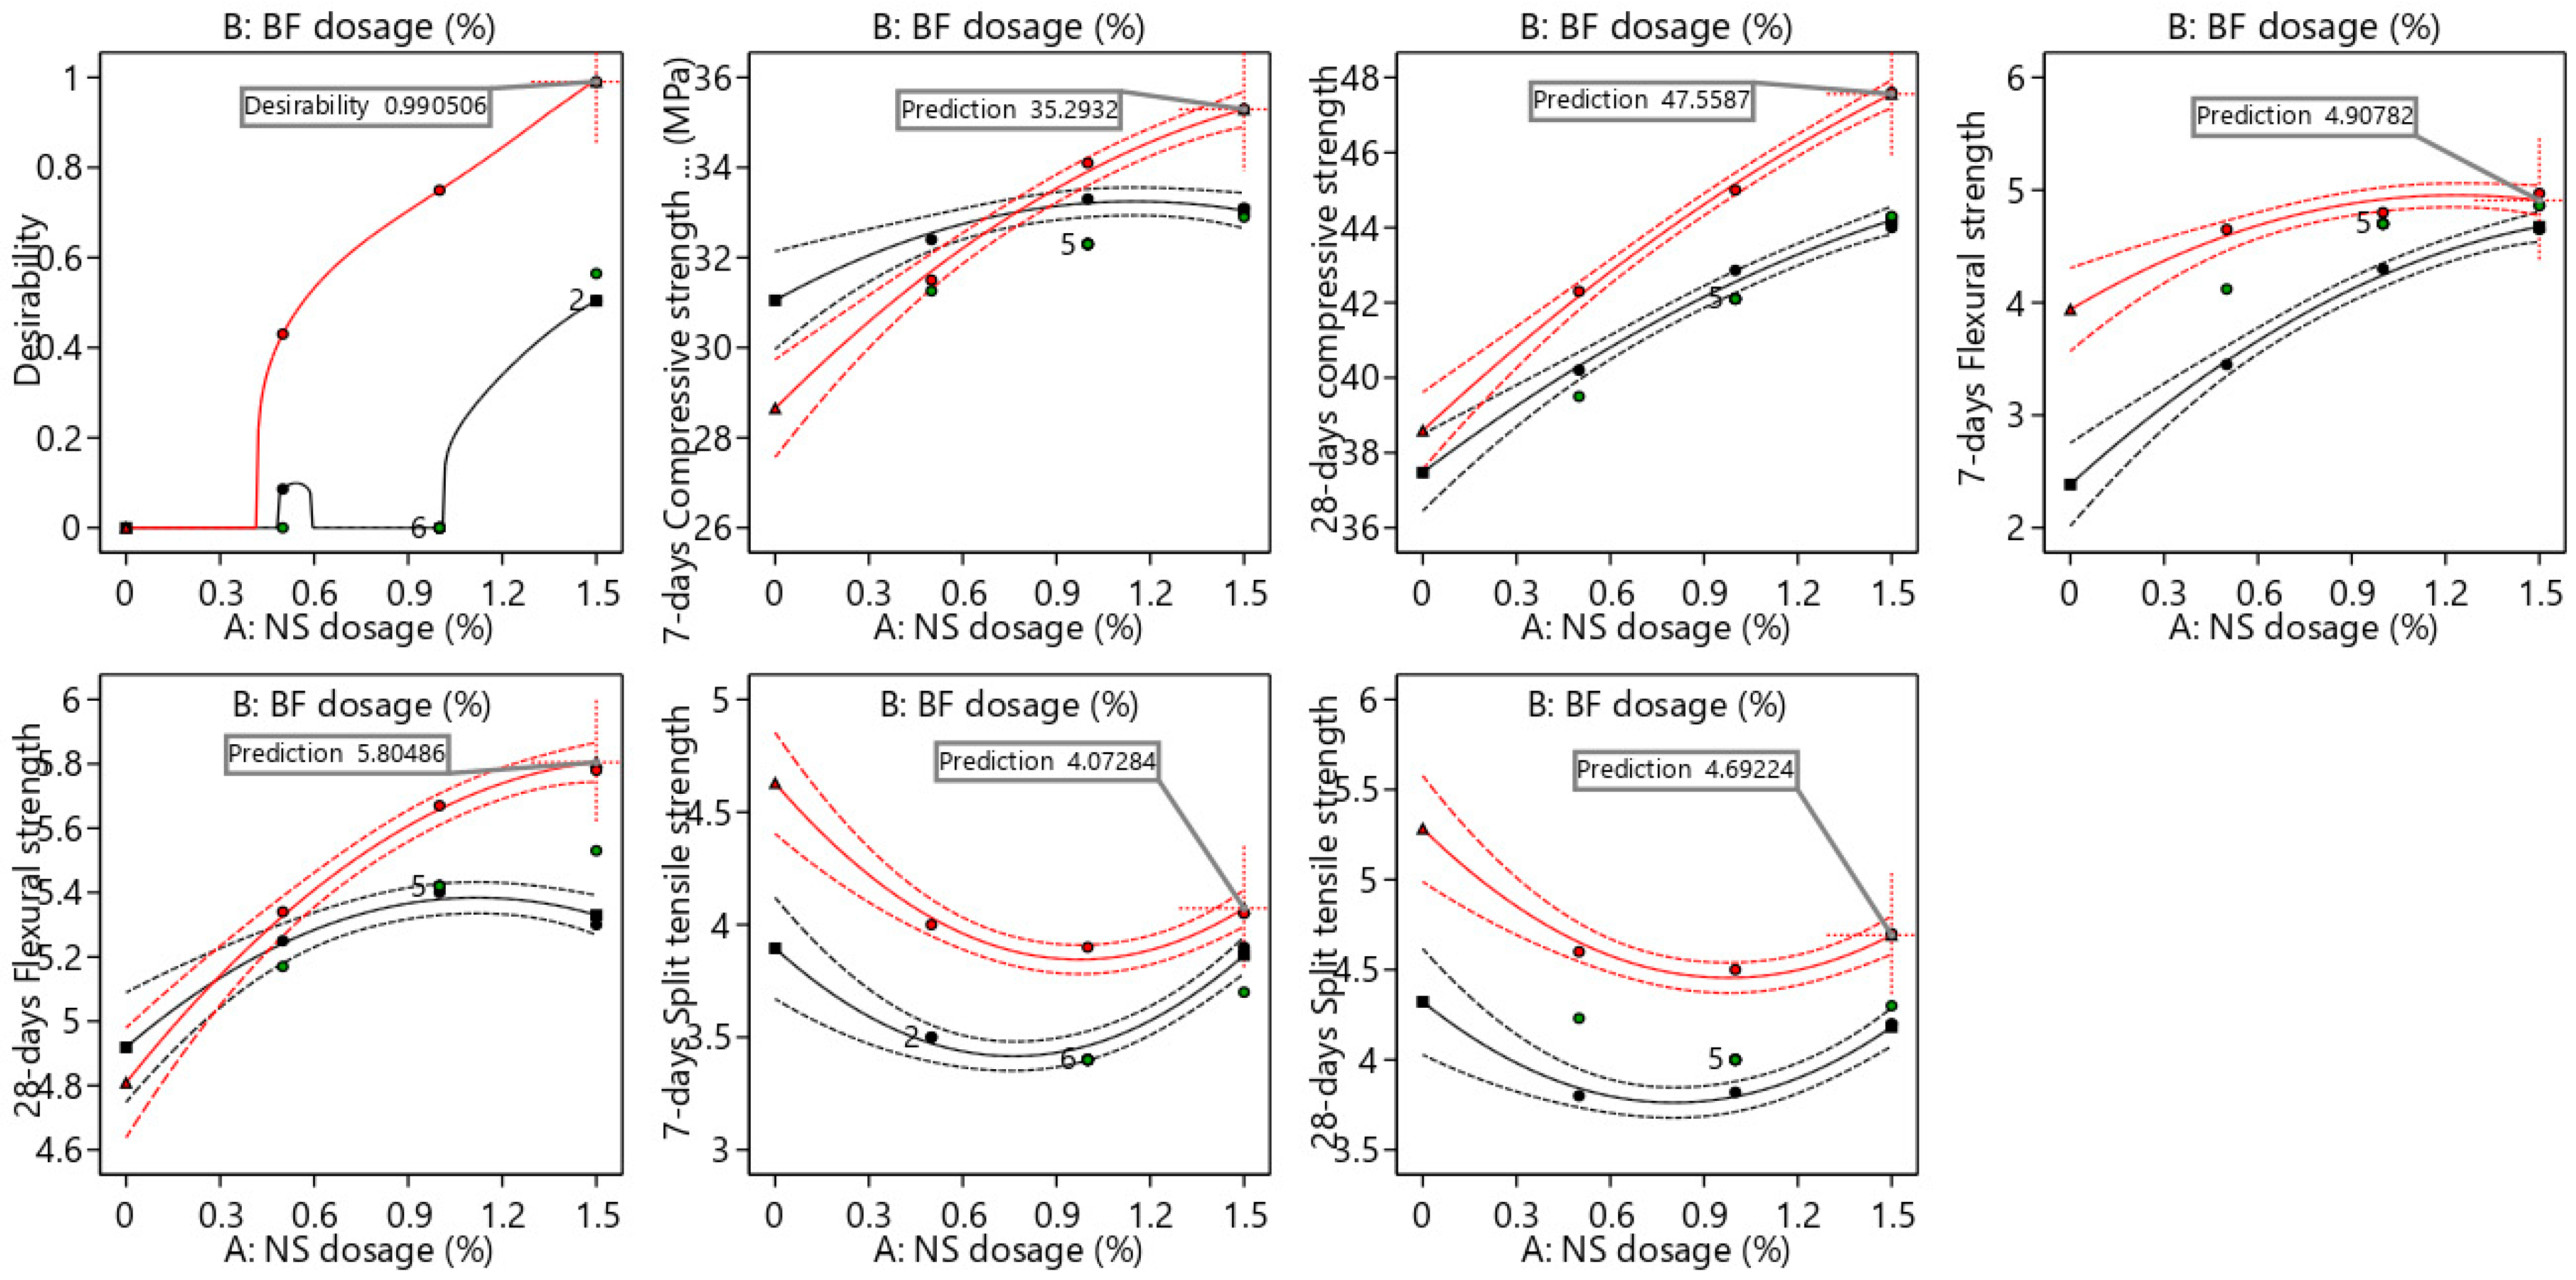
Figure 25.
Interaction plots of NSBF-ICC mixture from RSM analysis. The red and black curves represent the interaction effects between NS and BF dosages on the mechanical strength, with dashed lines indicating confidence intervals. The color-coded items (red, green, black) correspond to different levels or conditions of the variables analyzed.
Table 1.
SAP water absorption and physical properties.
Table 1.
SAP water absorption and physical properties.
| Mesh Size | Particle Size (μm) | WAC (g/g) | WRC (g/g) | WAUP (g/g) | PH | Appearance |
|---|
| 30–60 | 280–600 | ≥200 | ≥60 | ≥26 | 5.5–6.5 | White |
Table 2.
Physical properties of BF.
Table 2.
Physical properties of BF.
| Density (g/cm3) | Length (mm) | Diameter (µm) | Tensile Strength (MPa) | Elastic Modulus (GPa) | Elongation (%) |
|---|
| 2.63~2.65 | 6.0 | 7~15 | 3000~4800 | 91~110 | 2.7 |
Table 3.
Mix proportions of NSBF-ICC mixtures (kg/m3).
Table 3.
Mix proportions of NSBF-ICC mixtures (kg/m3).
| Mix No. | Mix Code | Cement | Sand | Gravel | SAP | Percentage Replacement of NS | NS | BF Volume Fraction Ratio (%) | BF | Water |
|---|
| 1 | S0-A0.0 | 364 | 815 | 1019.2 | 0 | 0 | 0 | 0 | 0 | 200.2 |
| 2 | S0-A0.3 | 364 | 815 | 1019.2 | 1.092 | 0 | 0 | 0 | 0 | 200.2 |
| 3 | NS0.5B0.4 | 362.2 | 815 | 1019.2 | 1.092 | 0.5 | 1.82 | 0.4 | 1.456 | 199.2 |
| 4 | NS1.0B0.4 | 360.4 | 815 | 1019.2 | 1.092 | 1.0 | 3.64 | 0.4 | 1.456 | 198.2 |
| 5 | NS1.5B0.4 | 358.5 | 815 | 1019.2 | 1.092 | 1.5 | 5.5 | 0.4 | 1.456 | 197.2 |
| 6 | NS0.5B0.8 | 362.2 | 815 | 1019.2 | 1.092 | 0.5 | 1.82 | 0.8 | 2.912 | 199.2 |
| 7 | NS1.0B0.8 | 360.4 | 815 | 1019.2 | 1.092 | 1.0 | 3.64 | 0.8 | 2.912 | 198.2 |
| 8 | NS1.5B0.8 | 358.5 | 815 | 1019.2 | 1.092 | 1.5 | 5.5 | 0.8 | 2.912 | 197.2 |
| 9 | NS0.5B1.2 | 362.2 | 815 | 1019.2 | 1.092 | 0.5 | 1.82 | 1.2 | 4.368 | 199.2 |
| 10 | NS1.0B1.2 | 360.4 | 815 | 1019.2 | 1.092 | 1.0 | 3.64 | 1.2 | 4.368 | 198.2 |
| 11 | NS1.5B1.2 | 358.5 | 815 | 1019.2 | 1.092 | 1.5 | 5.5 | 1.2 | 4.368 | 197.2 |
Table 5.
Mechanical performance of NSBF-ICC.
Table 5.
Mechanical performance of NSBF-ICC.
| Mix Code | fc (MPa) | ff (MPa) | ft (MPa) |
|---|
| 7d | COV (%) | 7d | COV (%) | 7d | COV (%) |
|---|
| S0-A0.0 | 32.30 ± 0.48 | 1.49 | 4.62 ± 0.24 | 5.19 | 3.6 ± 0.21 | 5.83 |
| S0-A0.3 | 28.50 ± 1.1 | 3.86 | 3.70 ± 0.12 | 3.24 | 2.96 ± 0.05 | 1.69 |
| NS0.5B0.4 | 32.40 ± 1.63 | 5.03 | 3.45 ± 0.04 | 1.22 | 3.5 ± 0.04 | 1.14 |
| NS1.0B0.4 | 33.30 ± 0.99 | 2.97 | 4.30 ± 0.07 | 1.67 | 3.4 ± 0.63 | 18.52 |
| NS1.5B0.4 | 33.10 ± 0.9 | 2.72 | 4.65 ± 0.02 | 0.43 | 3.9 ± 0.05 | 1.28 |
| NS0.5B0.8 | 31.26 ± 0.48 | 1.53 | 4.12 ± 0.09 | 2.18 | 3.5 ± 0.11 | 3.14 |
| NS1.0B0.8 | 32.30 ± 0.29 | 0.90 | 4.70 ± 0.01 | 0.21 | 3.4 ± 0.03 | 0.88 |
| NS1.5B0.8 | 32.90 ± 1.36 | 4.13 | 4.86 ± 0.09 | 1.85 | 3.7 ± 0.1 | 2.70 |
| NS0.5B1.2 | 31.50 ± 3.9 | 12.38 | 4.65 ± 0.32 | 6.88 | 4.0 ± 0.07 | 1.75 |
| NS1.0B1.2 | 34.10 ± 1.2 | 3.52 | 4.80 ± 0.08 | 1.67 | 3.9 ± 0.4 | 10.25 |
| NS1.5B1.2 | 35.30 ± 0.51 | 1.44 | 4.97 ± 0.05 | 1.00 | 4.05 ± 0.16 | 3.95 |
| Mix code | fc (MPa) | ff (MPa) | ft (MPa) |
| 28d | COV (%) | 28d | COV (%) | 28d | COV (%) |
| S0-A0.0 | 41.30 ± 1.41 | 3.41 | 5.25 ± 0.13 | 2.47 | 4.11 ± 0.17 | 4.14 |
| S0-A0.3 | 37.70 ± 1.39 | 3.70 | 4.18 ± 0.42 | 10.04 | 3.30 ± 0.08 | 2.42 |
| NS0.5B0.4 | 40.20 ± 2.57 | 6.40 | 5.25 ± 0.72 | 13.71 | 3.80 ± 0.07 | 1.84 |
| NS1.0B0.4 | 42.86 ± 1.92 | 4.47 | 5.40 ± 0.25 | 4.63 | 3.82 ± 0.4 | 10.47 |
| NS1.5B0.4 | 44.00 ± 1.32 | 3.00 | 5.30 ± 0.31 | 5.85 | 4.20 ± 0.07 | 1.70 |
| NS0.5B0.8 | 39.50 ± 0.83 | 2.10 | 5.17 ± 0.18 | 3.48 | 4.23 ± 0.13 | 3.07 |
| NS1.0B0.8 | 42.10 ± 0.85 | 2.02 | 5.42 ± 0.53 | 9.78 | 4.00 ± 0.04 | 1.00 |
| NS1.5B0.8 | 44.30 ± 3.2 | 7.22 | 5.53 ± 0.67 | 12.11 | 4.40 ± 0.07 | 1.60 |
| NS0.5B1.2 | 42.30 ± 1.8 | 4.25 | 5.34 ± 0.02 | 0.41 | 4.60 ± 0.34 | 7.39 |
| NS1.0B1.2 | 45.00 ± 1.7 | 3.78 | 5.67 ± 0.05 | 0.88 | 4.50 ± 0.05 | 1.11 |
| NS1.5B1.2 | 47.60 ± 2.2 | 4.62 | 5.78 ± 0.19 | 3.28 | 4.70 ± 0.09 | 1.91 |
Table 6.
Summary of normalized data of NSBF-ICC mixture.
Table 6.
Summary of normalized data of NSBF-ICC mixture.
| Mix Code | fc (%) | ff (%) | ft (%) |
|---|
| 7d | 28d | 7d | 28d | 7d | 28d |
|---|
| S0-A0.0 | 0.00 | 0.00 | 0.00 | 0.00 | 0.00 | 0.00 |
| S0-A0.3 | −11.78 | −8.71 | −19.91 | −20.38 | −17.78 | −19.71 |
| NS0.5B0.4 | 0.31 | −2.66 | −25.32 | 0.00 | −2.78 | −7.55 |
| NS1.0B0.4 | 3.10 | 3.78 | −6.93 | 2.86 | −5.56 | −7.06 |
| NS1.5B0.4 | 2.48 | 6.53 | 0.65 | 0.95 | 8.33 | 2.19 |
| NS0.5B0.8 | −3.23 | −4.36 | −10.82 | −1.52 | −2.78 | 2.92 |
| NS1.0B0.8 | 0.00 | 1.94 | 1.73 | 3.24 | −5.56 | −2.68 |
| NS1.5B0.8 | 1.86 | 7.27 | 5.19 | 5.33 | 2.78 | 7.08 |
| NS0.5B1.2 | −2.48 | 2.42 | 0.65 | 1.71 | 11.11 | 11.92 |
| NS1.0B1.2 | 5.57 | 8.96 | 3.90 | 8.00 | 8.33 | 9.49 |
| NS1.5B1.2 | 9.28 | 15.25 | 7.57 | 10.00 | 12.50 | 14.37 |
Table 7.
Summary of existing literature on the use of SAP, NS, and BF in concrete mixtures.
Table 7.
Summary of existing literature on the use of SAP, NS, and BF in concrete mixtures.
| Study | Additives Used | Physical Characteristics of Fiber | Additive Percentages | Comp. Gain | Flex. Gain | Tens. Gain | Notable Findings |
|---|
| Length (mm) | Diameter (µm) | Elastic Modulus (GPa) |
|---|
| Fan J et al. [38] | SAP + Hybrid Fibers | 18 | 16.5 | 93~110 | 0.5% SAP + Hybrid Fibers | 10–20% | +105.95% (Fracture Energy) | - | Superior fracture resistance |
| Lyu et al. [39] | SAP + BF | 18 | 16.5 | 93~110 | 0.15% SAP, 0.15% BF | 4.6% | Moderate improvement | - | 50.52% reduction in autogenous shrinkage |
| Zheng et al. [55] | NS + BF | 6, 8, and 12 | 13 | 91~110 | 2% Nano-SiO2, 0.125% BF | 34.28% | 54.5% | 40.55% | Enhanced ITZ and toughness |
| Ghadikolaee et al. [56] | Nano-SiO2 + BF | 20 | - | 82 | 1% Nano-SiO2, 0.125% BF | 37% | 29% | 27% | Improved microstructure and crack resistance |
| This study | SAP + Nano-Silica + BF | 6.0 | 7~15 | 91~110 | 0.3% SAP, 0.5–1.5% Nano-Silica, 0.4–1.2% BF | Moderate (up to 15%) | Stable improvement | Stable tensile strength at 28 days | Balanced strength and cracking control |
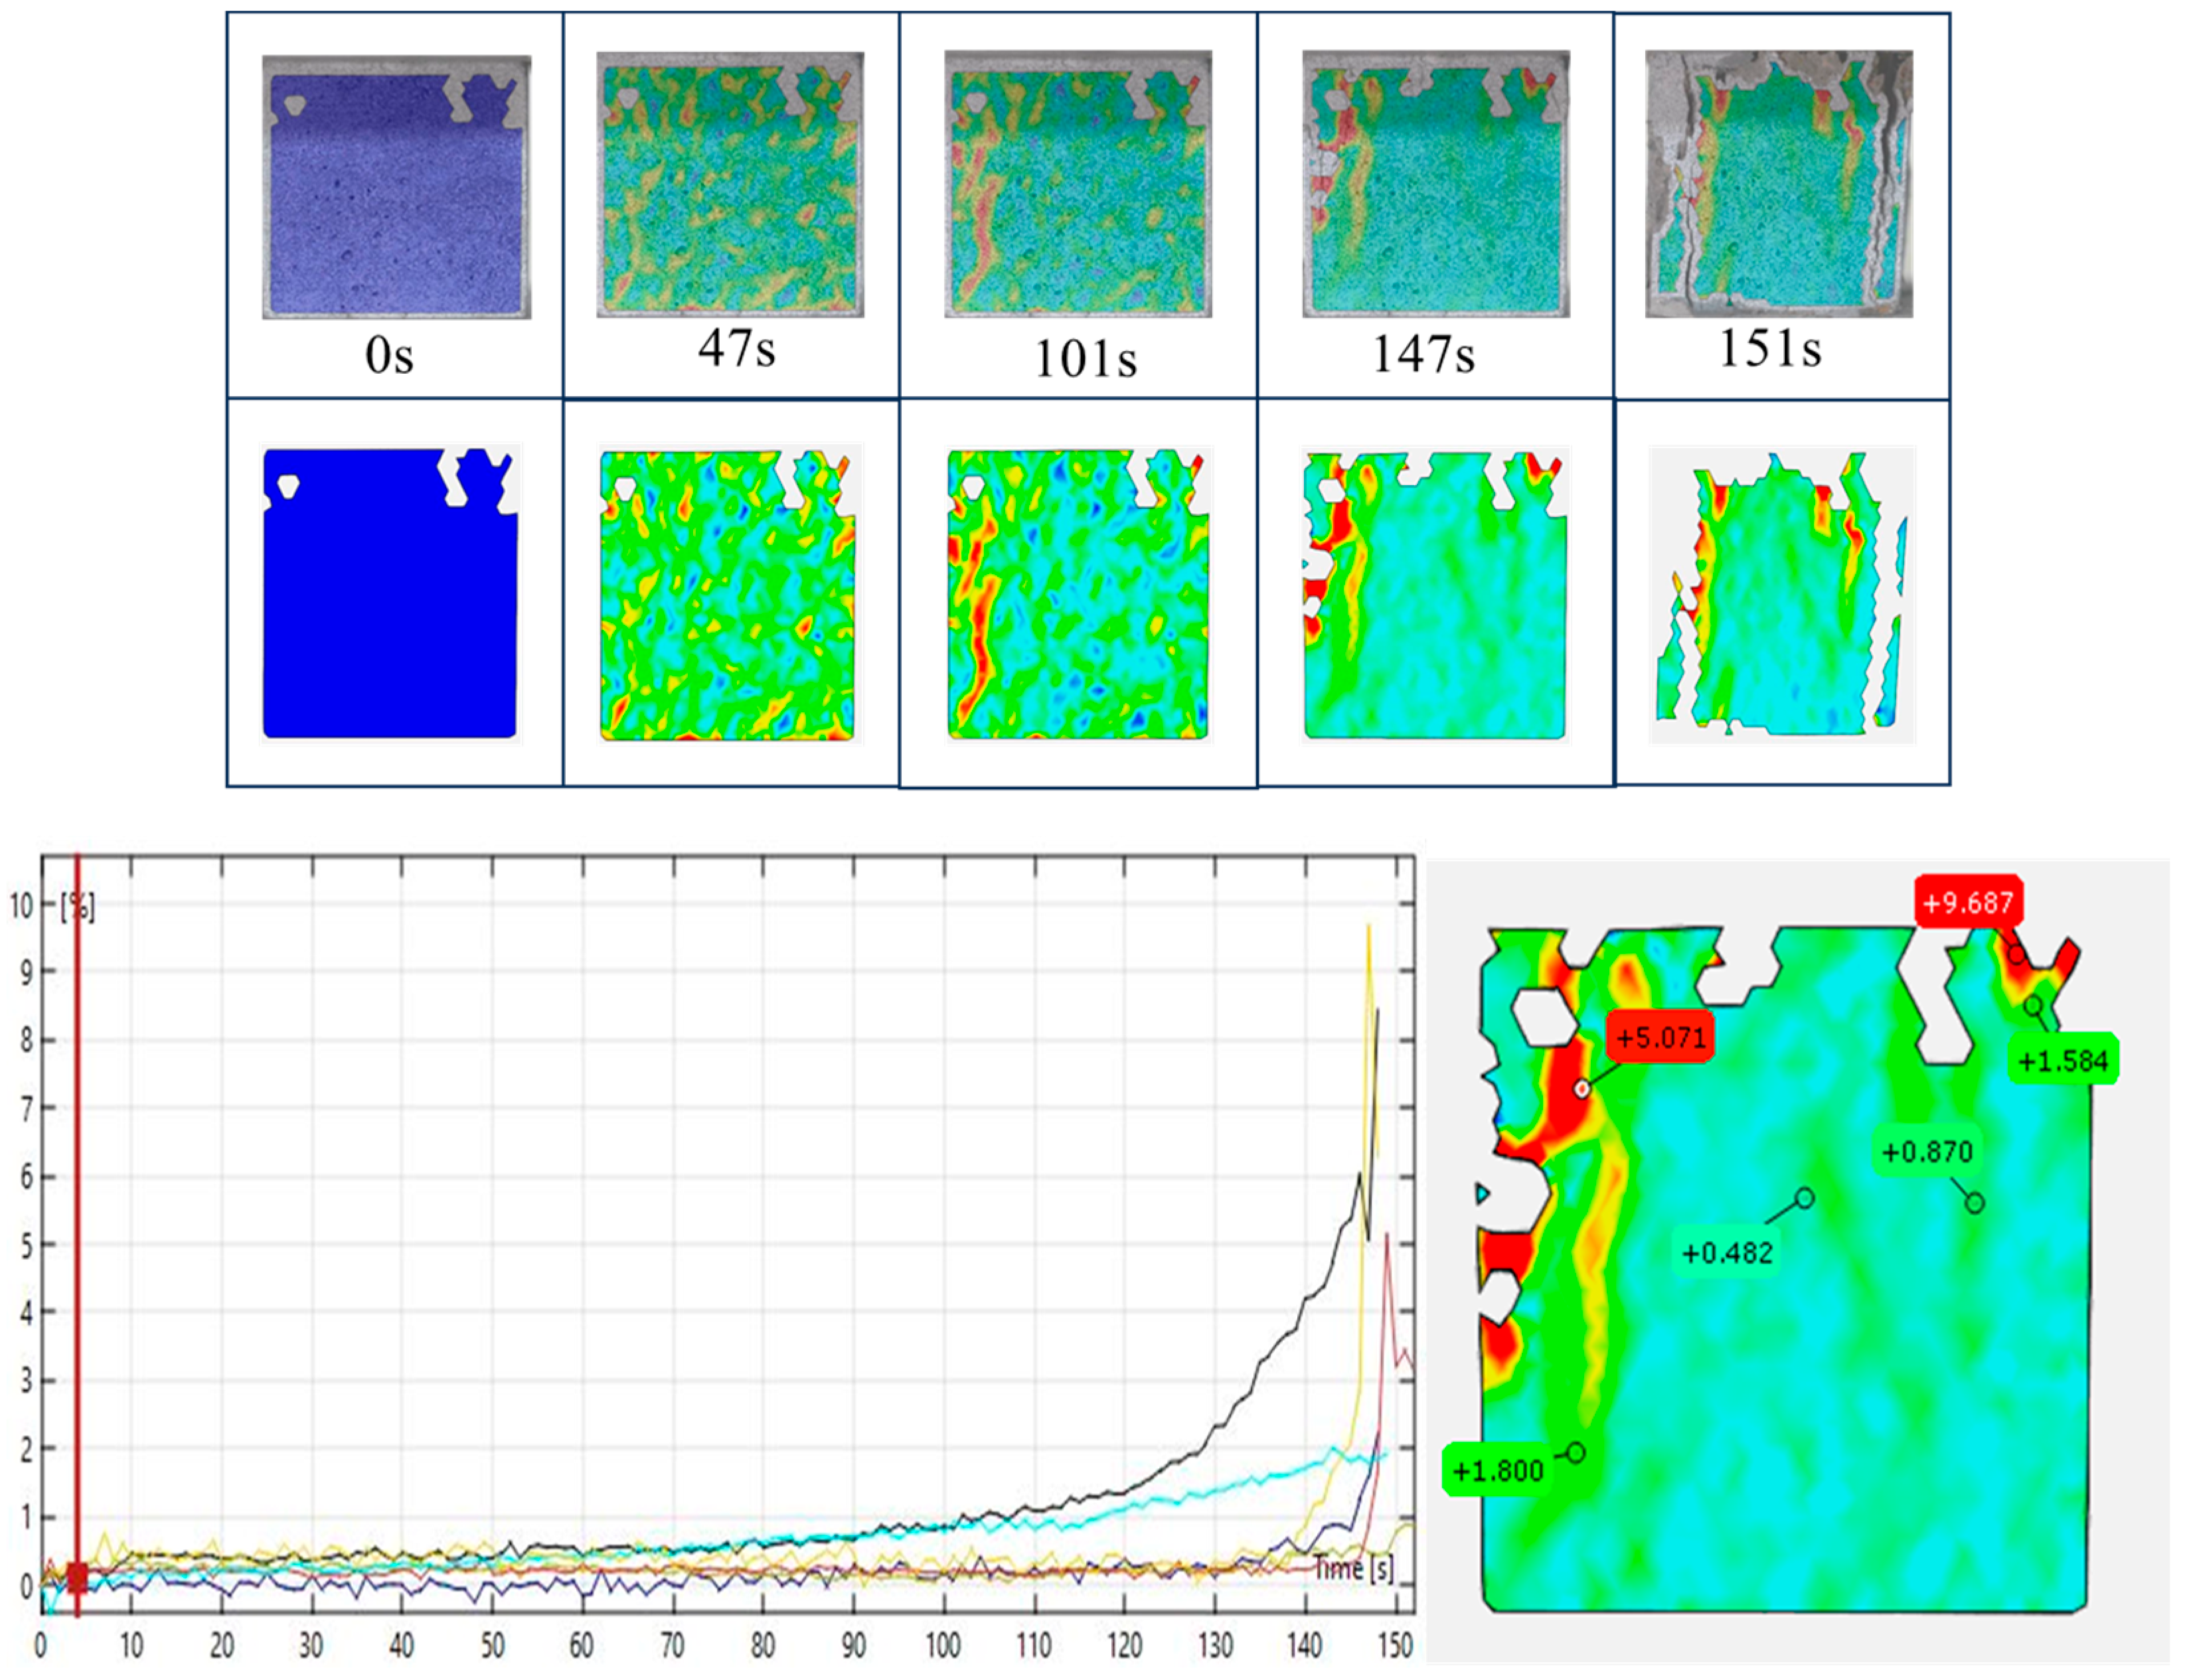
Table 8.
Crack width and propagation of NSBF-ICC specimen through DIC analysis.
Table 8.
Crack width and propagation of NSBF-ICC specimen through DIC analysis.
| Specimen Type | Max Strain (ε1) | Max Displacement (d) | Failure Mode | Crack Propagation | Time to Failure (s) |
|---|
| With Fiber (NS1.5BF1.2) | +0.478% | +0.137 mm | Gradual failure Controlled | Delayed crack propagation | ~170 s |
| Without Fiber (S0-A0.0) | −0.183% | +0.620 mm | Brittle failure | Rapid crack opening, no resistance | ~50 s |
Table 9.
Systematic distribution of coded variables for RSM-CCD analysis.
Table 9.
Systematic distribution of coded variables for RSM-CCD analysis.
| Run | Factors in Coded Units | Outputs |
|---|
| NS | BF | fc (MPa) | ff (MPa) | ft (MPa) |
|---|
| | | | 7d | 28d | 7d | 28d | 7d | 28d |
| 1 | −1 | 0 | 31.26 | 39.5 | 4.12 | 5.17 | 3.5 | 4.23 |
| 2 | 1 | 1 | 35.3 | 47.6 | 4.97 | 5.78 | 4.05 | 4.7 |
| 3 | −1 | −1 | 32.4 | 40.2 | 3.45 | 5.25 | 3.5 | 3.8 |
| 4 | −1 | 1 | 31.5 | 42.3 | 4.65 | 5.34 | 4 | 4.6 |
| 5 | 0 | −1 | 33.3 | 42.86 | 4.3 | 5.4 | 3.4 | 3.82 |
| 6 | 0 | 1 | 34.1 | 45 | 4.8 | 5.67 | 3.9 | 4.5 |
| 7 | 1 | 0 | 32.9 | 44.3 | 4.86 | 5.53 | 3.7 | 4.3 |
| 8 | 0 | 0 | 32.3 | 42.1 | 4.7 | 5.42 | 3.4 | 4 |
| 9 | 1 | −1 | 33.1 | 44 | 4.65 | 5.3 | 3.9 | 4.2 |
Table 10.
ANOVA data for the output variables.
Table 10.
ANOVA data for the output variables.
| Outputs | Variable | Sum of Squares | DF | Mean Square | F-Value | p-Value | Significant |
|---|
7-days
fc (MPa) | Model | 13.43 | 5 | 2.69 | 76.87 | <0.0001 | yes |
| NS | 6.28 | 1 | 6.28 | 179.78 | <0.0001 | |
| BF | 0.7350 | 1 | 0.7350 | 21.03 | 0.0025 | |
| NS × BF | 2.40 | 1 | 2.40 | 68.74 | <0.0001 | |
| NS2 | 0.4769 | 1 | 0.4769 | 13.64 | 0.0077 | |
| BF2 | 4.01 | 1 | 4.01 | 114.65 | <0.0001 | |
28-days
fc (MPa) | Model | 51.70 | 5 | 10.34 | 332.28 | <0.0001 | yes |
| NS | 32.20 | 1 | 32.20 | 1034.71 | <0.0001 | |
| BF | 10.24 | 1 | 10.24 | 329.17 | <0.0001 | |
| NS × BF | 0.5625 | 1 | 0.5625 | 18.07 | 0.0038 | |
| NS2 | 0.2469 | 1 | 0.2469 | 7.93 | 0.0259 | |
| BF2 | 8.28 | 1 | 8.28 | 265.93 | <0.0001 | |
7-days
ff (MPa) | Model | 1.89 | 5 | 0.3790 | 93.90 | <0.0001 | yes |
| NS | 0.8513 | 1 | 0.8513 | 210.91 | <0.0001 | |
| BF | 0.6801 | 1 | 0.6801 | 168.49 | <0.0001 | |
| NS × BF | 0.1936 | 1 | 0.1936 | 47.97 | 0.0002 | |
| NS2 | 0.0766 | 1 | 0.0766 | 18.98 | 0.0033 | |
| BF2 | 0.0314 | 1 | 0.0314 | 7.77 | 0.0270 | |
28-days
ff (MPa) | Model | 0.3103 | 5 | 0.0621 | 71.92 | <0.0001 | yes |
| NS | 0.1204 | 1 | 0.1204 | 139.57 | <0.0001 | |
| BF | 0.1176 | 1 | 0.1176 | 136.31 | <0.0001 | |
| NS × BF | 0.0380 | 1 | 0.0380 | 44.07 | 0.0003 | |
| NS2 | 0.0239 | 1 | 0.0239 | 27.65 | 0.0012 | |
| BF2 | 0.0234 | 1 | 0.0234 | 27.14 | 0.0012 | |
7-days
ft (MPa) | Model | 0.8002 | 5 | 0.1600 | 106.45 | <0.0001 | yes |
| NS | 0.0704 | 1 | 0.0704 | 46.84 | 0.0002 | |
| BF | 0.2204 | 1 | 0.2204 | 146.60 | <0.0001 | |
| NS × BF | 0.0306 | 1 | 0.0306 | 20.37 | 0.0028 | |
| NS2 | 0.1172 | 1 | 0.1172 | 77.98 | <0.0001 | |
| BF2 | 0.1811 | 1 | 0.1811 | 120.42 | <0.0001 | |
28-days
ft (MPa) | Model | 0.9817 | 5 | 0.1963 | 76.37 | <0.0001 | yes |
| NS | 0.0541 | 1 | 0.0541 | 21.06 | 0.0025 | |
| BF | 0.6534 | 1 | 0.6534 | 254.15 | <0.0001 | |
| NS × BF | 0.0225 | 1 | 0.0225 | 8.75 | 0.0212 | |
| NS2 | 0.1297 | 1 | 0.1297 | 50.46 | 0.0002 | |
| BF2 | 0.0345 | 1 | 0.0345 | 13.41 | 0.0081 | |
Table 11.
Model validation and statistical indicators.
Table 11.
Model validation and statistical indicators.
| Response | Age | R2 | Adj. R2 | Pred. R2 | Mean | SD | COV. (%) | AP |
|---|
| fc (MPa) | 7d | 0.9821 | 0.9693 | 0.8457 | 32.72 | 0.1870 | 0.5714 | 34.4557 |
| 28d | 0.9958 | 0.9928 | 0.9592 | 42.79 | 0.1764 | 0.4123 | 67.1350 |
| ff (MPa) | 7d | 0.9853 | 0.9748 | 0.8602 | 4.56 | 0.0635 | 1.39 | 33.2840 |
| 28d | 0.9809 | 0.9673 | 0.8222 | 5.43 | 0.0294 | 0.5413 | 30.7143 |
| ft (MPa) | 7d | 0.9870 | 0.9777 | 0.8683 | 3.61 | 0.0388 | 1.07 | 25.6078 |
| 28d | 0.9820 | 0.9691 | 0.8399 | 4.17 | 0.0507 | 1.22 | 26.0321 |
Table 12.
Evaluation criterion for the process of optimization.
Table 12.
Evaluation criterion for the process of optimization.
| Variable | Symbol | Goal | Lower Limit | Upper Limit |
|---|
| Nano-silica (%) | NS | In range | 0 | 1.5 |
| BF (%) | BF | In range | 0 | 1.2 |
| Compressive strength (MPa) | fc(7d) | Maximize | 31.26 | 35.3 |
| fc(28d) | Maximize | 39.5 | 47.6 |
| Flexural strength (MPa) | ff(7d) | Maximize | 3.45 | 4.97 |
| ff(28d) | Maximize | 5.17 | 5.78 |
| Split-Tensile strength (MPa) | ft(7d) | Maximize | 3.4 | 4.05 |
| ft(28d) | Maximize | 3.8 | 4.7 |
Table 13.
Optimum NSBF-ICC mix.
Table 13.
Optimum NSBF-ICC mix.
| NS (%) | BF (%) | fc(7d) | fc(28d) | ff(7d) | ff(28d) | ft(7d) | ft(28d) | Desirability (%) |
|---|
| 0.90 | 1.2 | 33.53 | 44.62 | 4.88 | 5.61 | 3.85 | 4.46 | 70.4 |


