
Using a Novel Process-Near Mechanical-Deflection-Based Spreading Test Rig for a Systematic Experimental Analysis of Carbon Fiber Rovings Spreading Process

 ,
,  ,
,
Abstract
1. Introduction
2. Materials and Methods
2.1. Materials
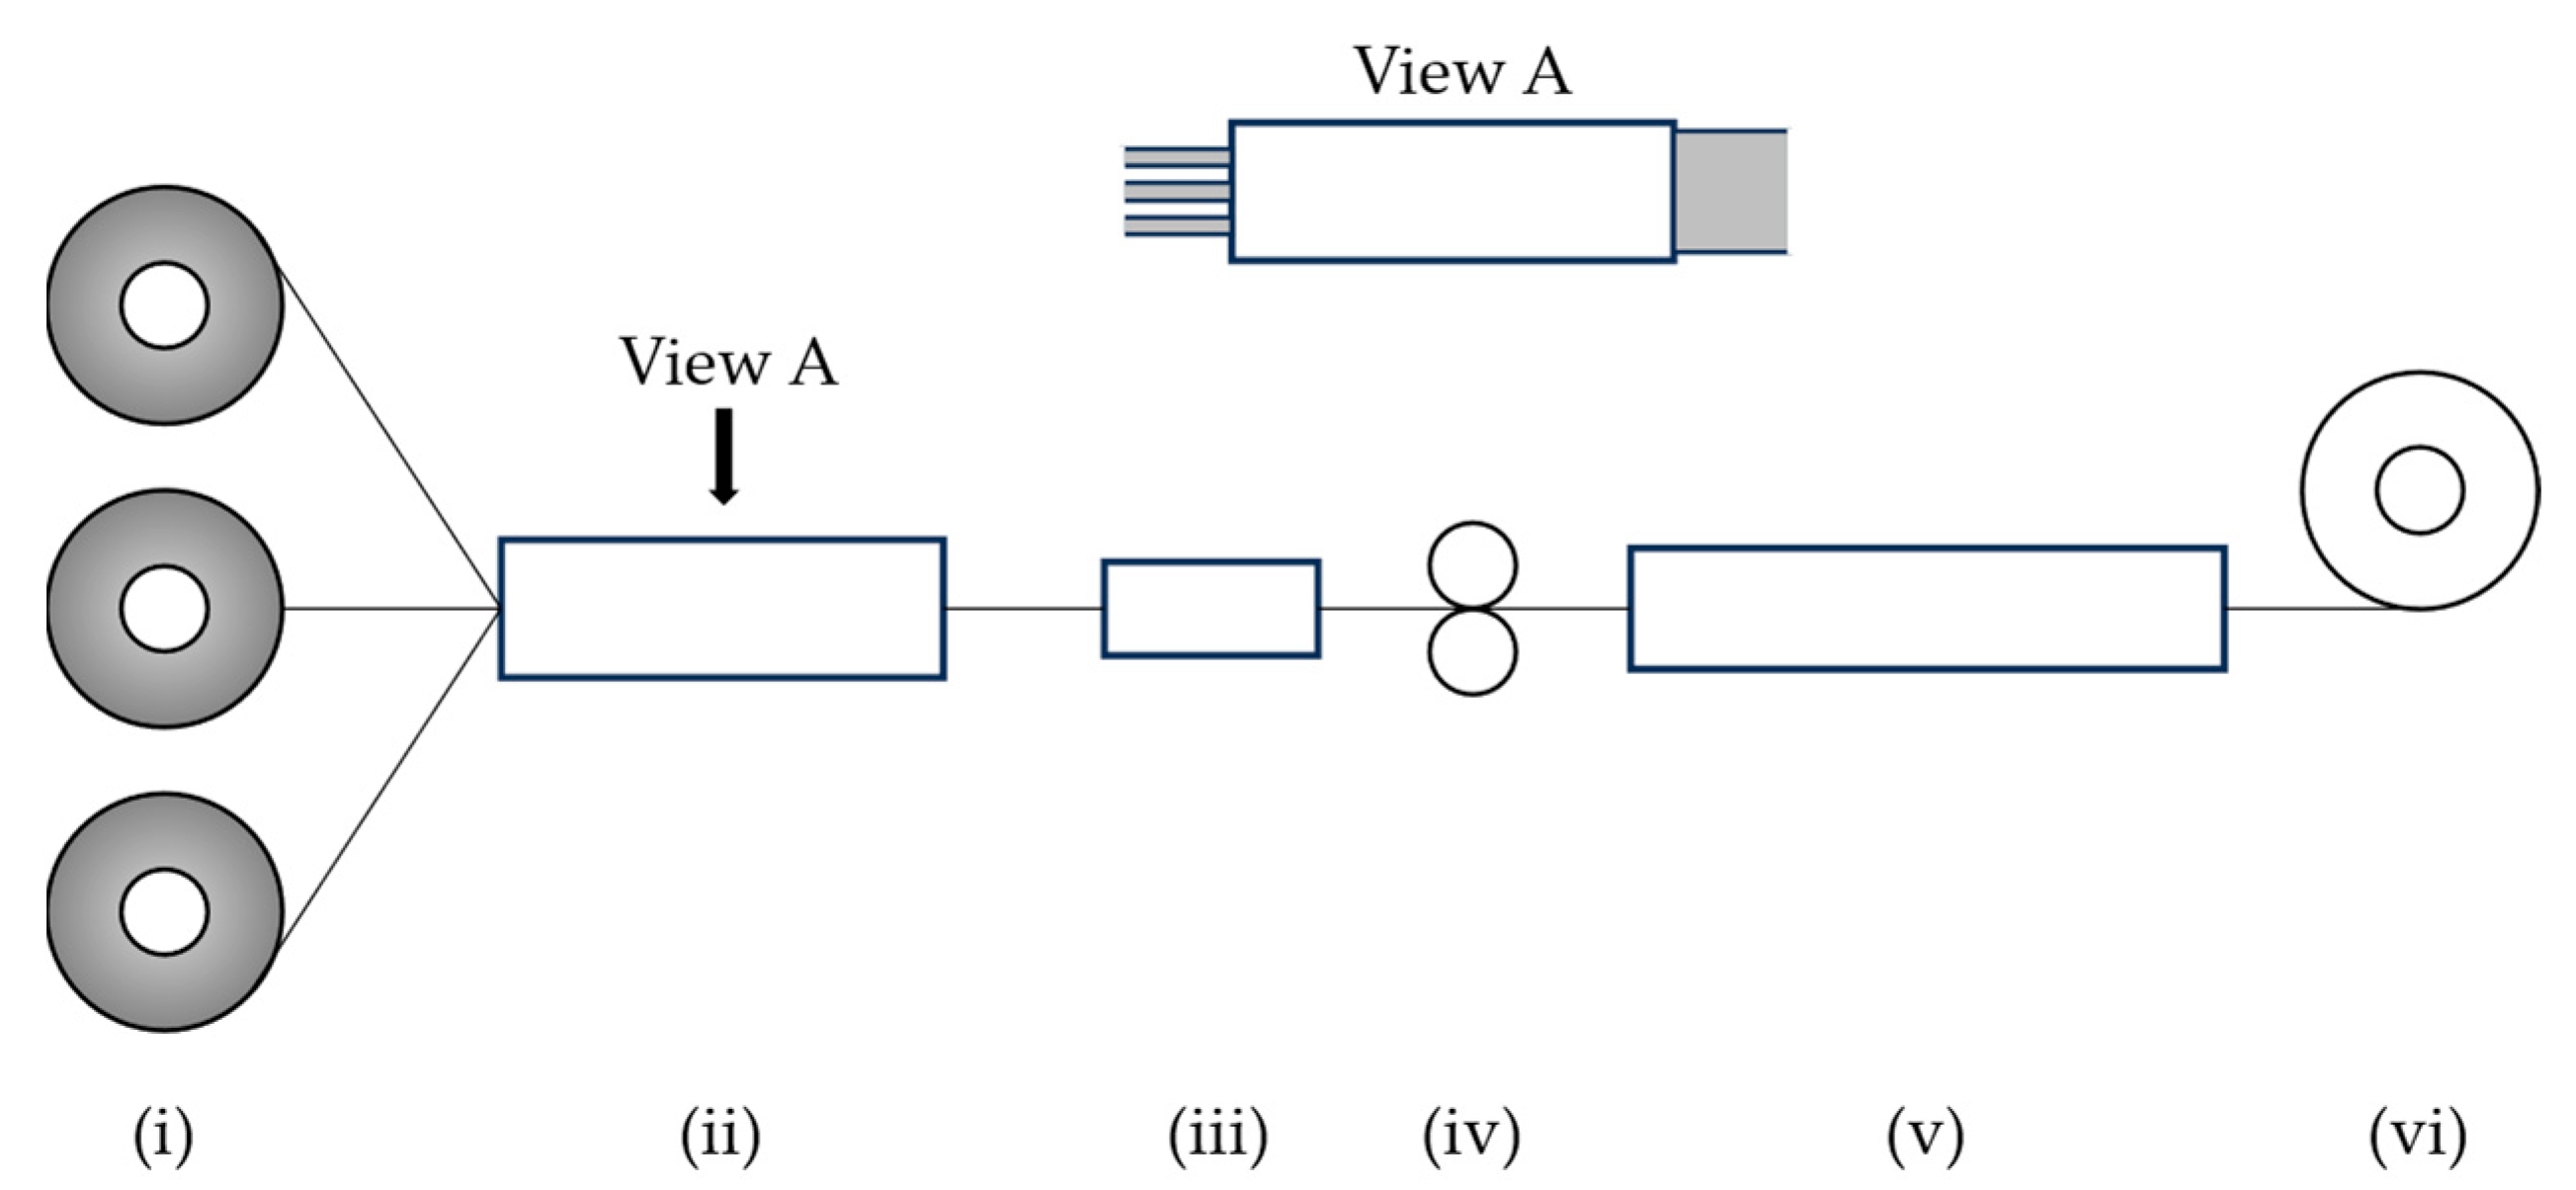
2.2. Equipment
2.3. Procedure
2.4. Experimental Design
3. Results and Discussion
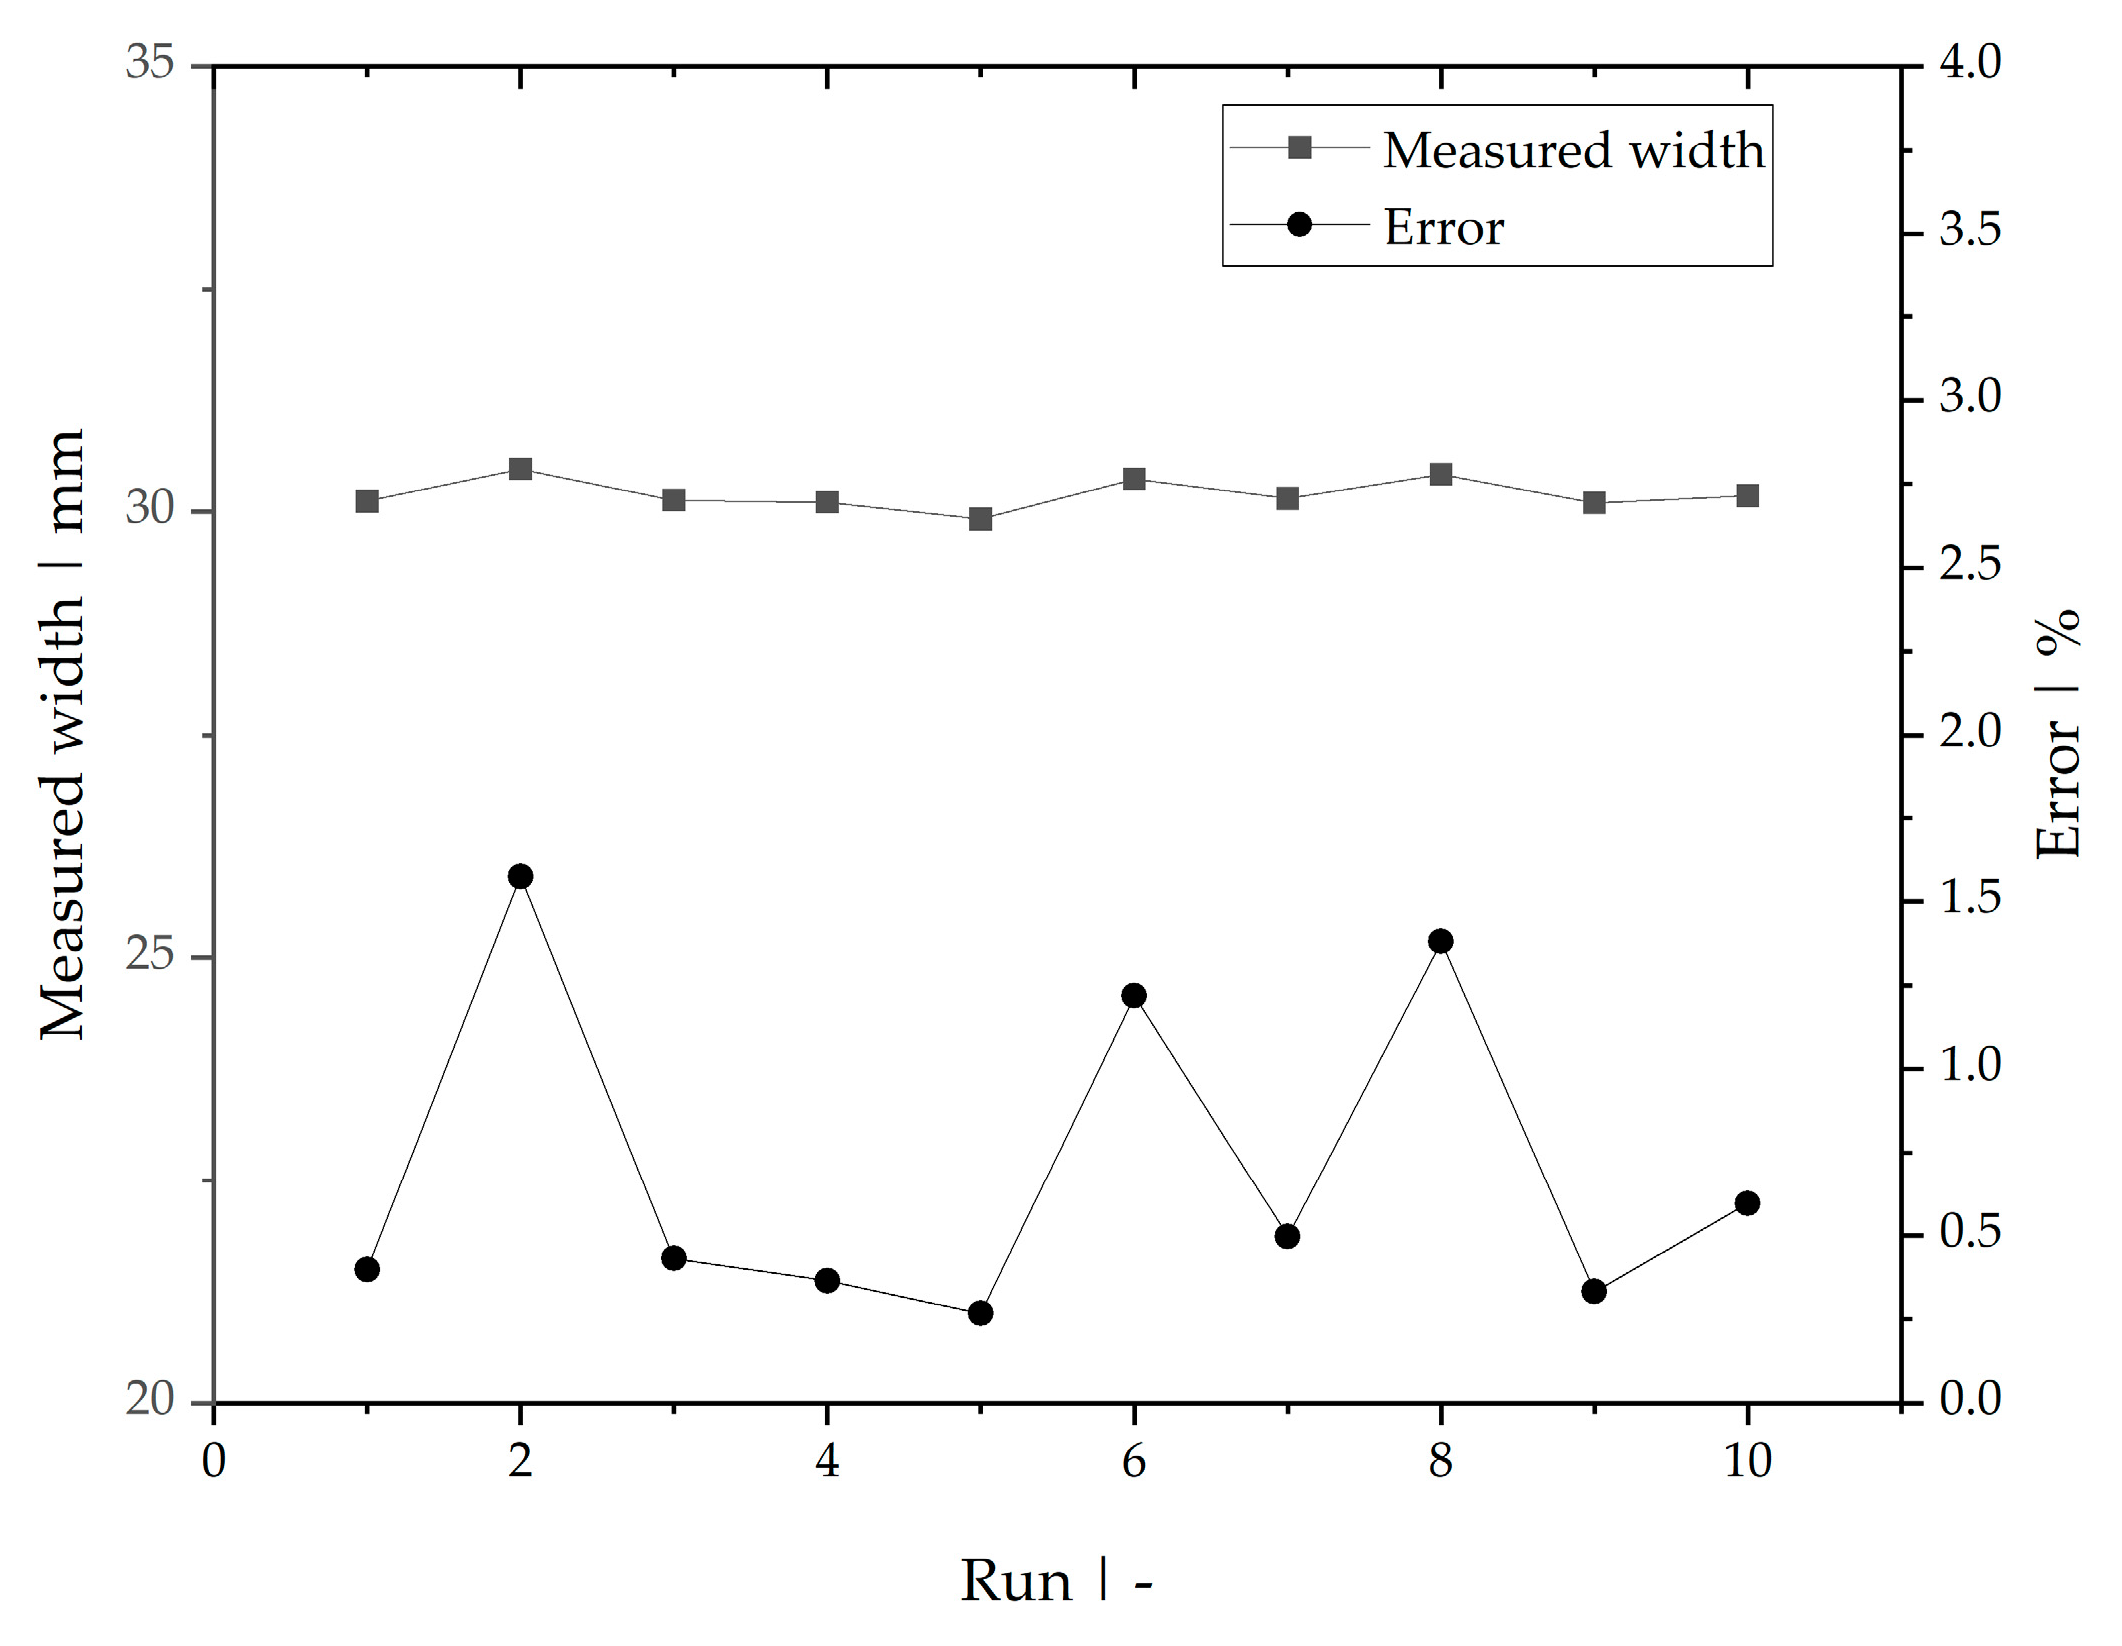
3.1. Repeatability of the Calibration Process
3.2. Variation in Input Width of Fiber Roving
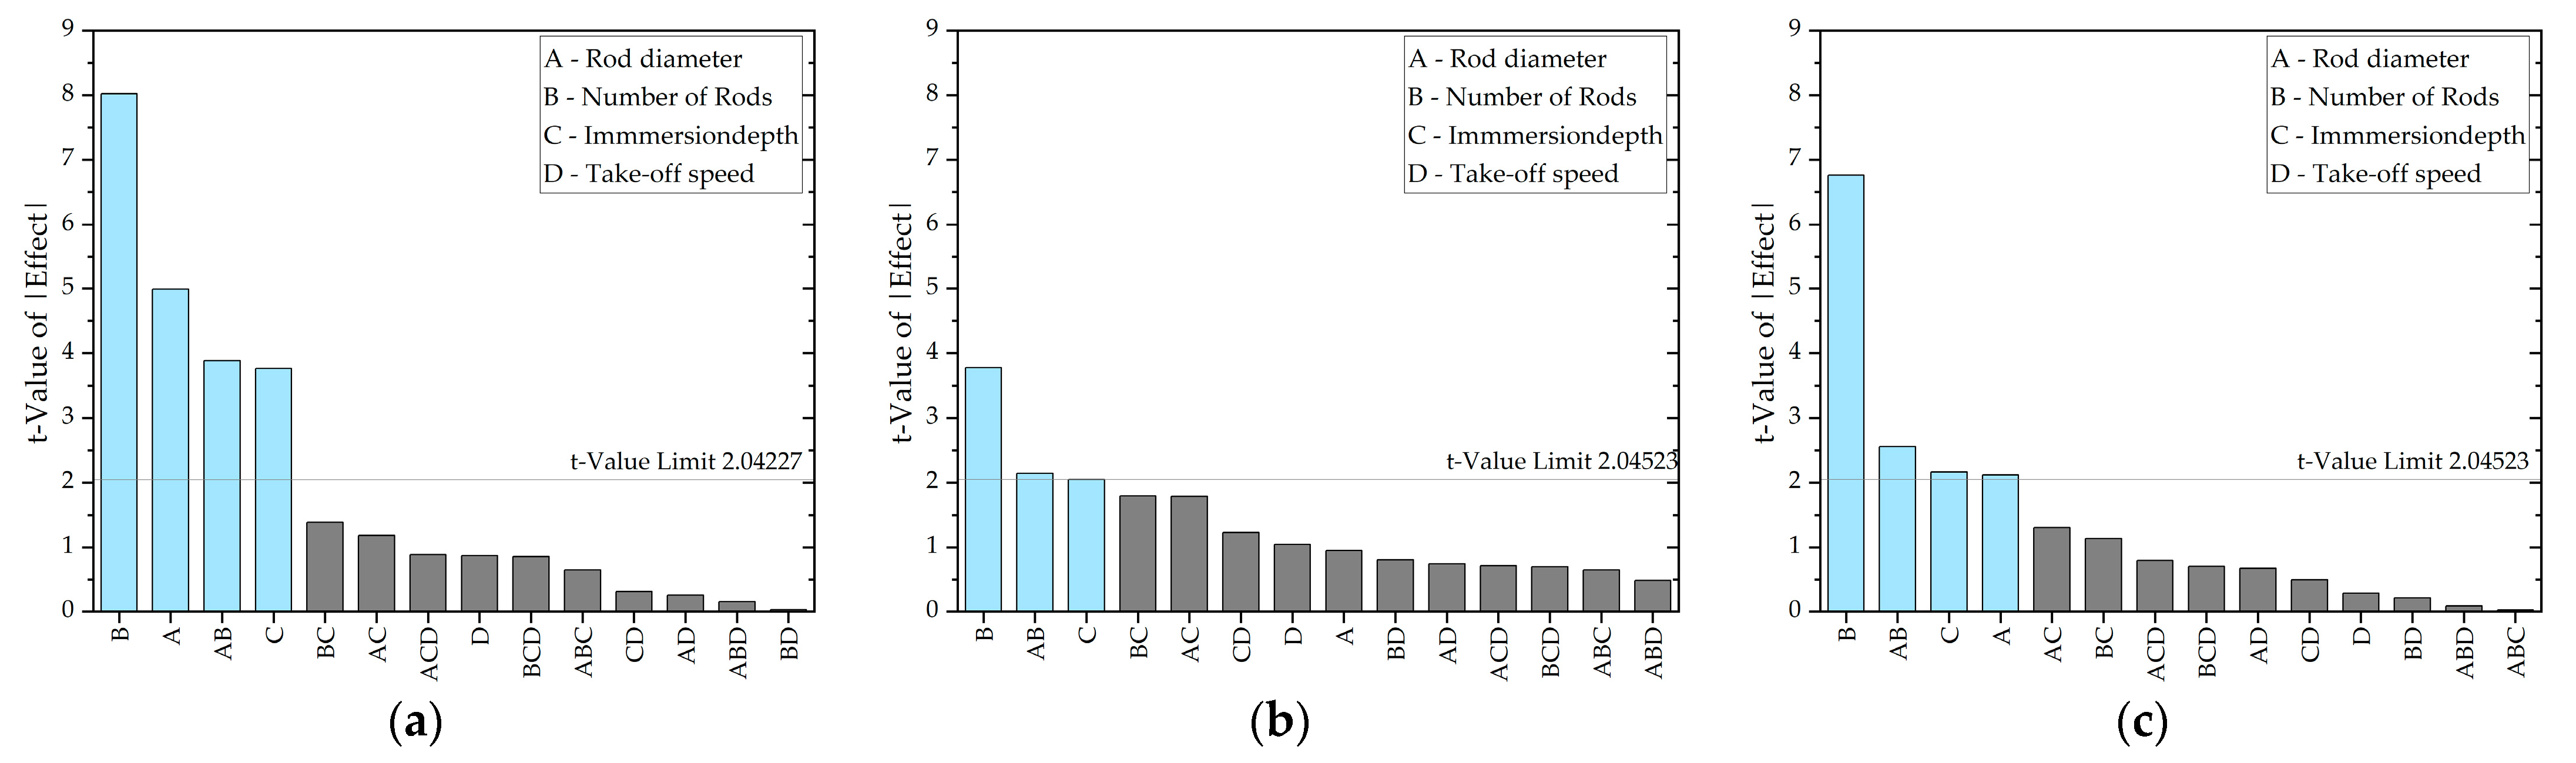
3.3. Main Factors That Influence Fiber Spreading
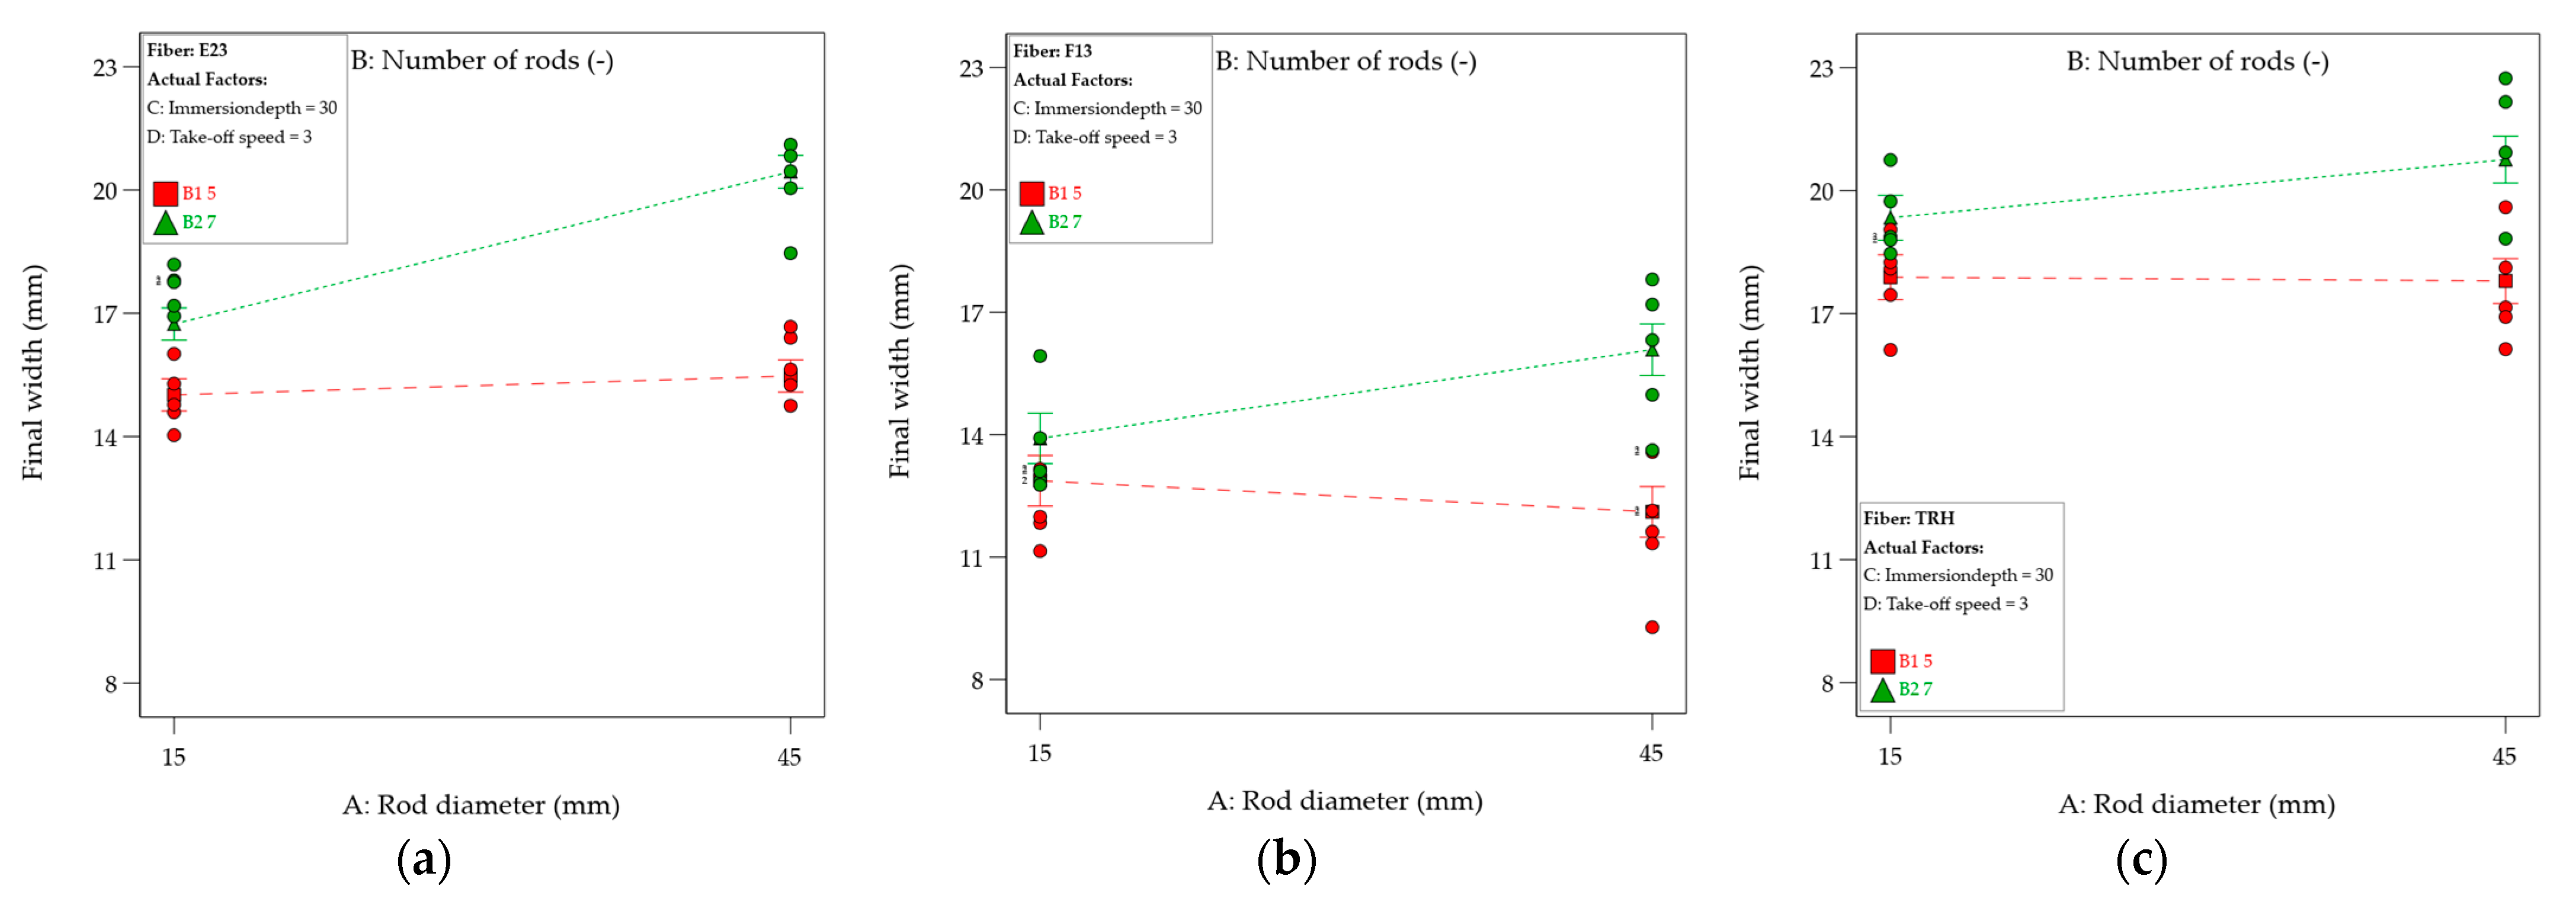
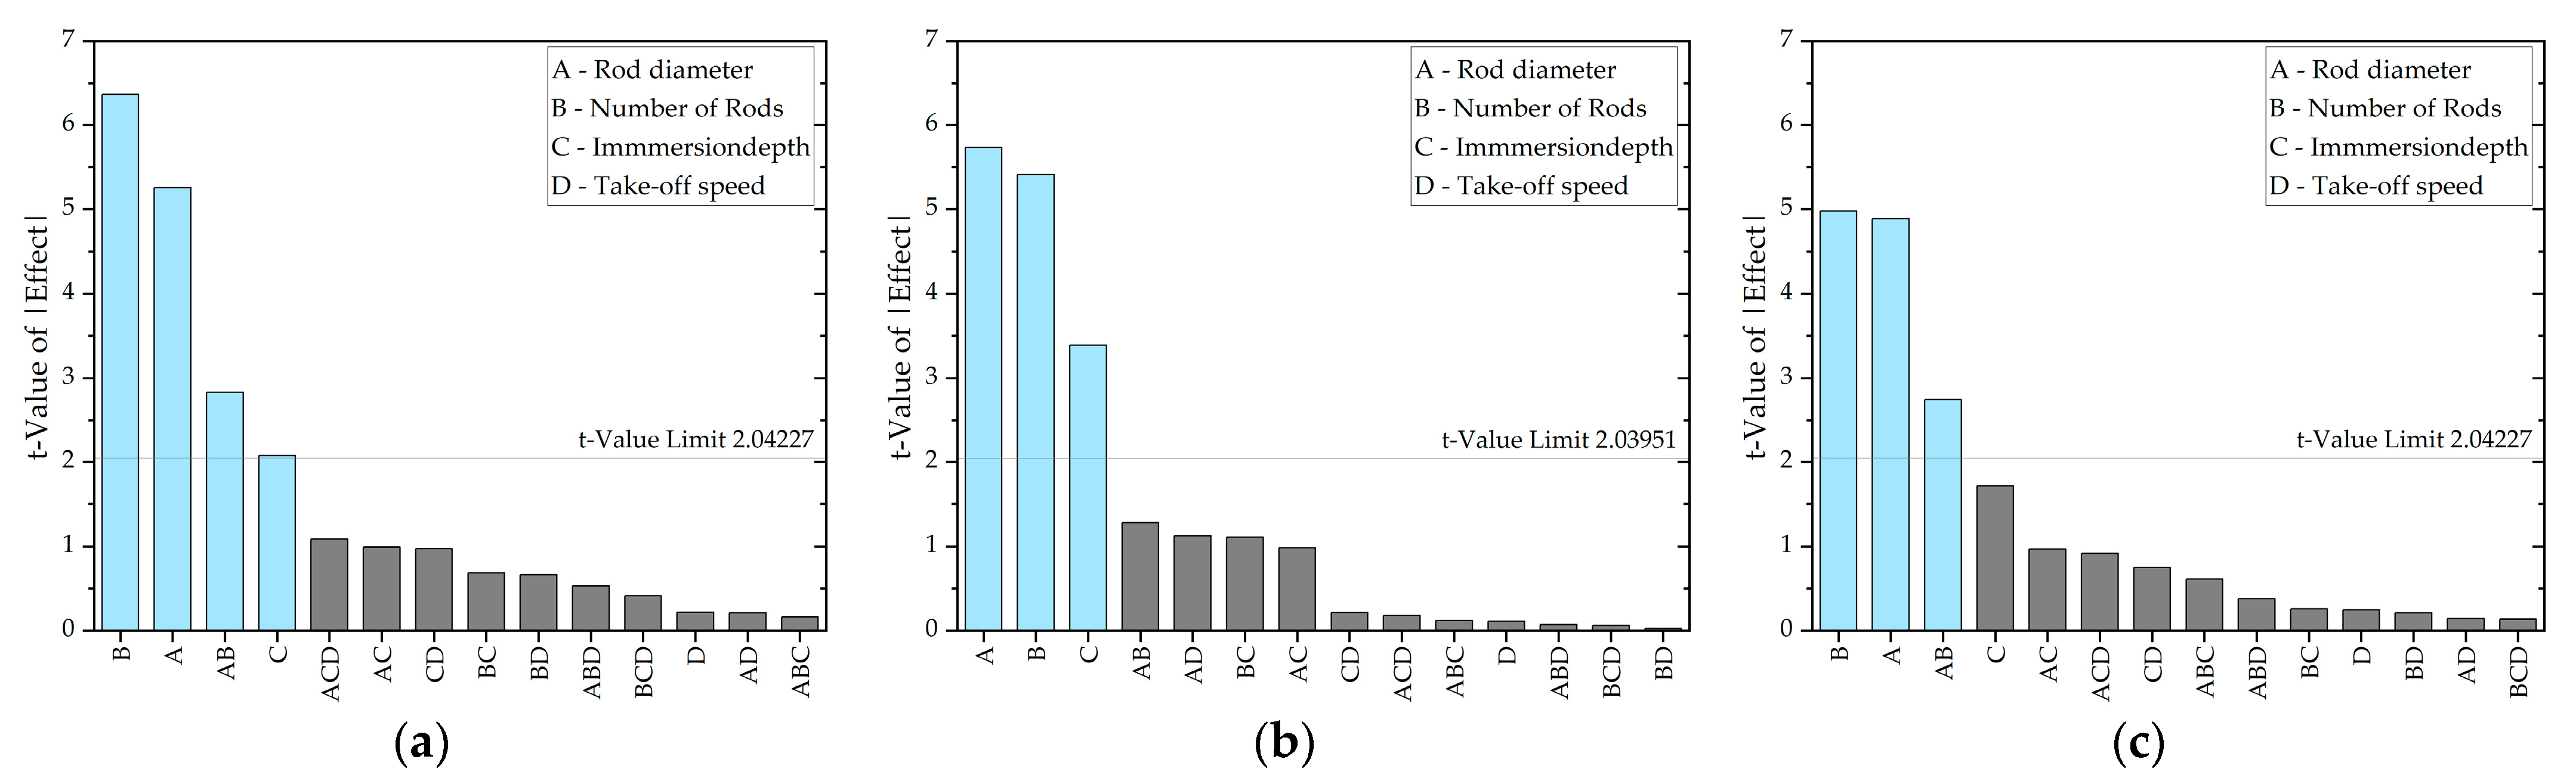
3.3.1. Final Width
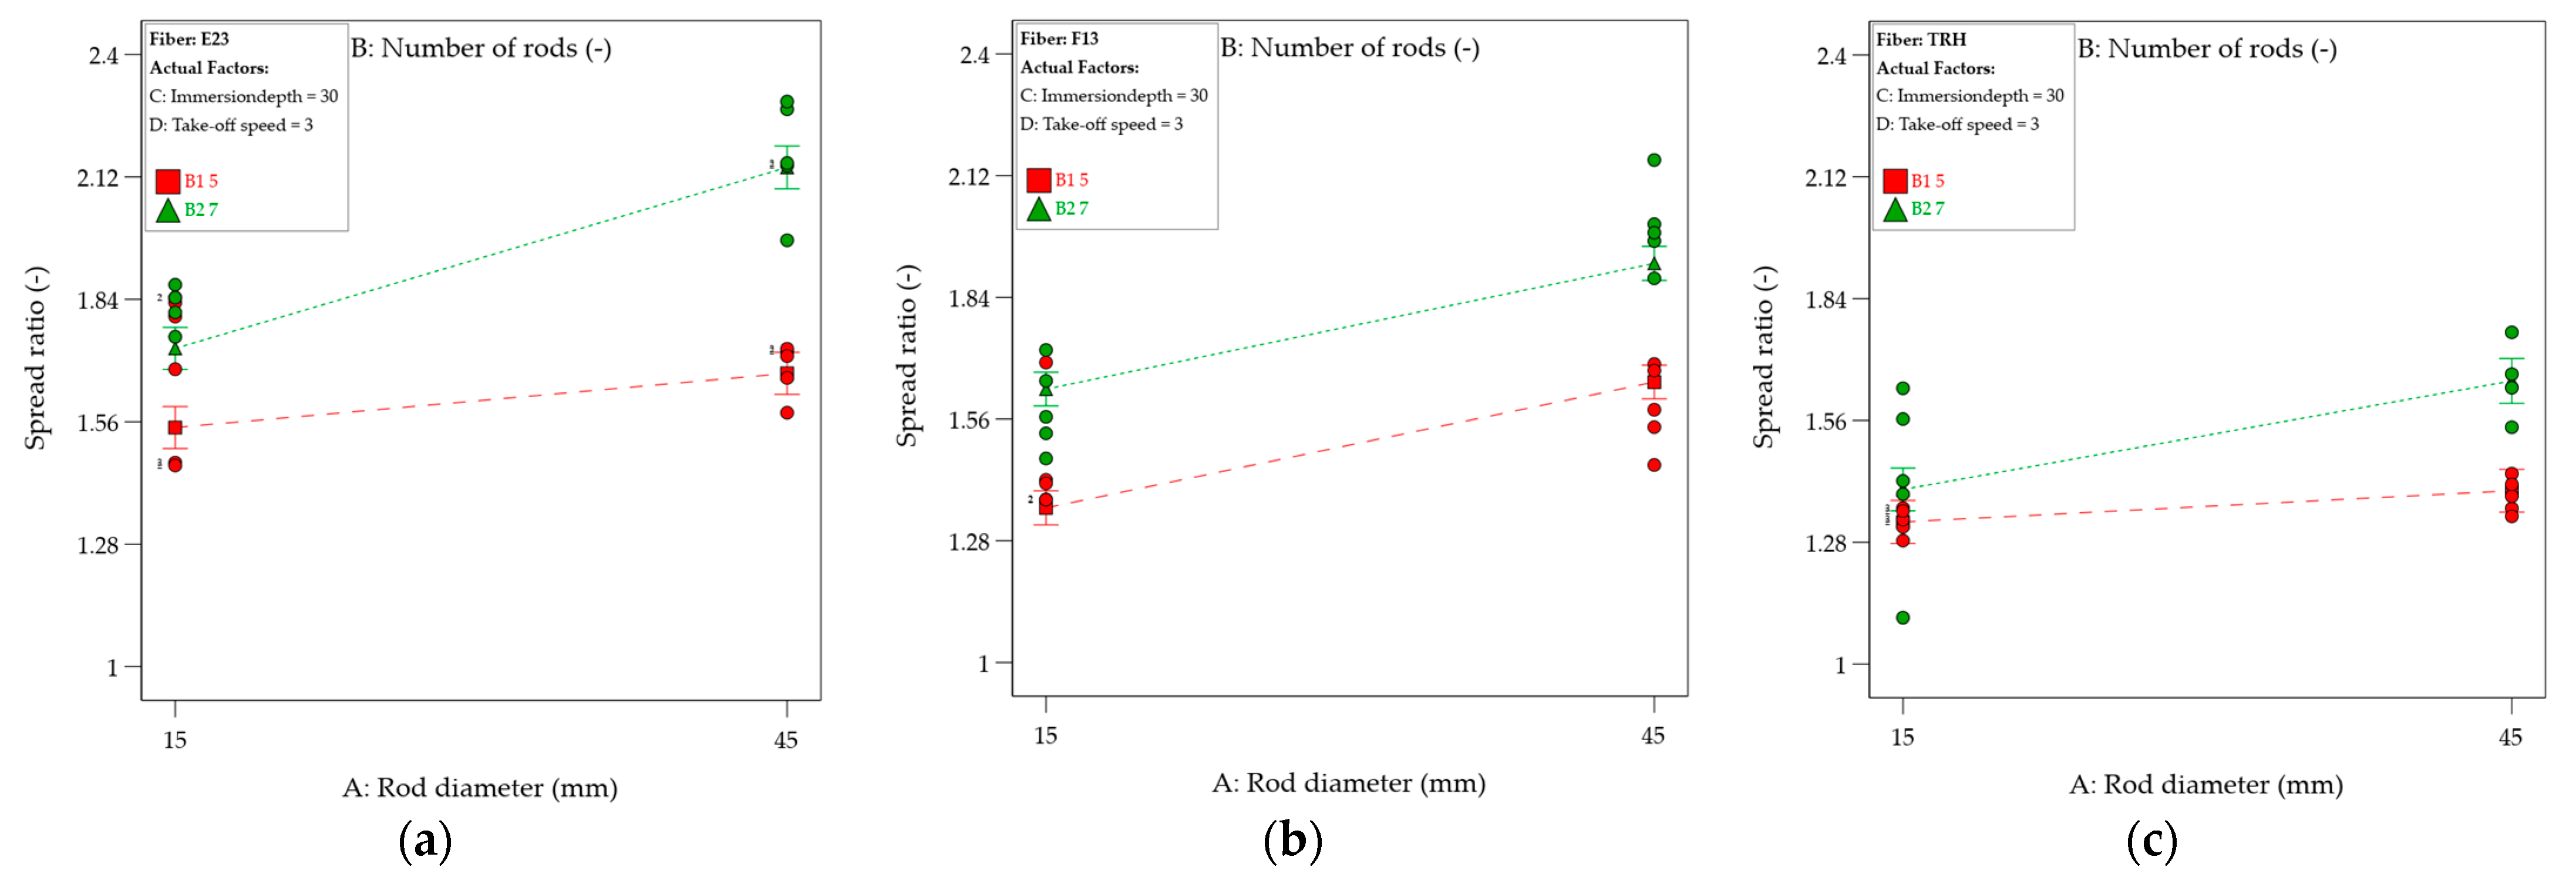
3.3.2. Spread Ratio
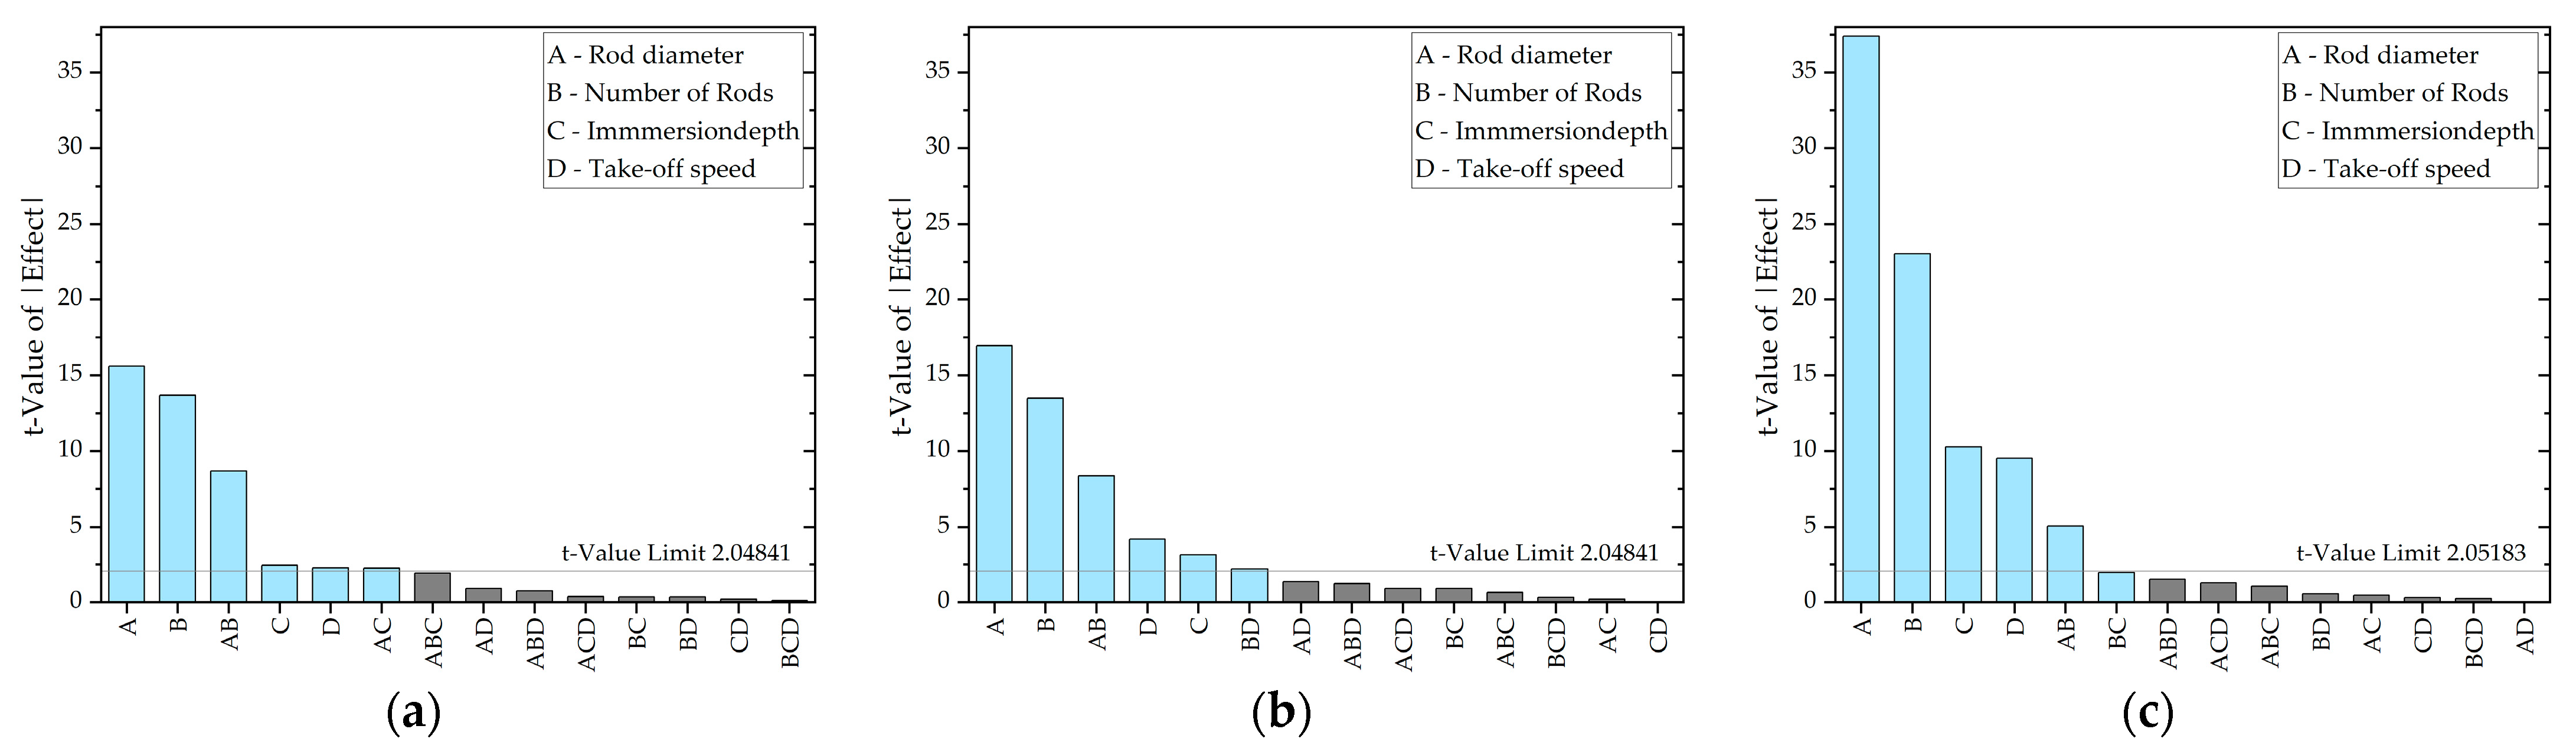
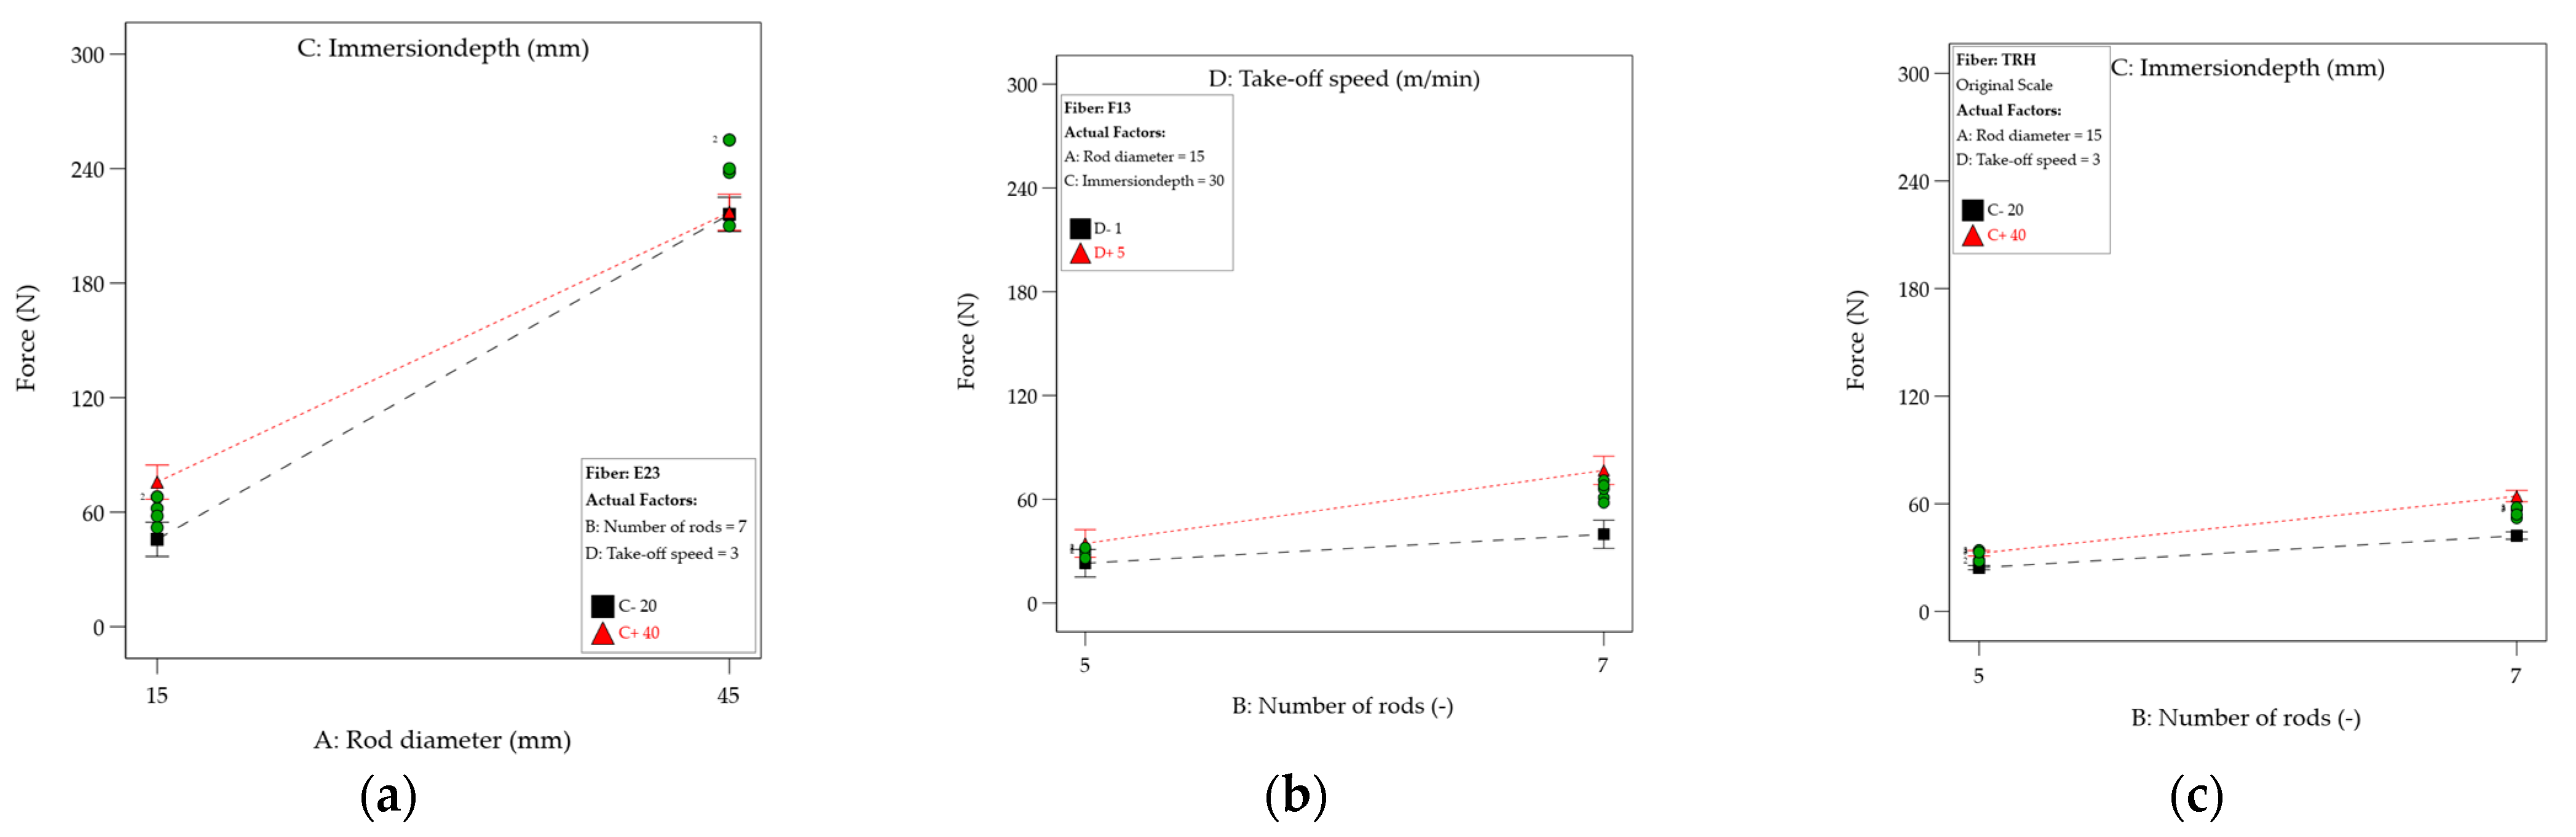
3.3.3. Force
4. Conclusions
Author Contributions
Funding
Data Availability Statement
Acknowledgments
Conflicts of Interest
Appendix A

| Std | Run | Factor 1 A: Rod Diameter | Factor 2 B: Number of Rods | Factor 3 C: Immersion Depth | Factor 4 D: Take-Off Speed |
|---|---|---|---|---|---|
| (mm) | - | (mm) | (m/min) | ||
| 8 | 1 | 45 | 7 | 40 | 1 |
| 16 | 2 | 45 | 7 | 40 | 5 |
| 5 | 3 | 15 | 5 | 40 | 1 |
| 14 | 4 | 45 | 5 | 40 | 5 |
| 7 | 5 | 15 | 7 | 40 | 1 |
| 25 | 6 | 15 | 5 | 30 | 3 |
| 32 | 7 | 45 | 7 | 30 | 3 |
| 29 | 8 | 15 | 5 | 30 | 3 |
| 17 | 9 | 15 | 5 | 30 | 3 |
| 12 | 10 | 45 | 7 | 20 | 5 |
| 26 | 11 | 45 | 5 | 30 | 3 |
| 31 | 12 | 15 | 7 | 30 | 3 |
| 18 | 13 | 45 | 5 | 30 | 3 |
| 30 | 14 | 45 | 5 | 30 | 3 |
| 21 | 15 | 15 | 5 | 30 | 3 |
| 36 | 16 | 45 | 7 | 30 | 3 |
| 24 | 17 | 45 | 7 | 30 | 3 |
| 10 | 18 | 45 | 5 | 20 | 5 |
| 2 | 19 | 45 | 5 | 20 | 1 |
| 11 | 20 | 15 | 7 | 20 | 5 |
| 9 | 21 | 15 | 5 | 20 | 5 |
| 35 | 22 | 15 | 7 | 30 | 3 |
| 1 | 23 | 15 | 5 | 20 | 1 |
| 33 | 24 | 15 | 5 | 30 | 3 |
| 27 | 25 | 15 | 7 | 30 | 3 |
| 3 | 26 | 15 | 7 | 20 | 1 |
| 22 | 27 | 45 | 5 | 30 | 3 |
| 13 | 28 | 15 | 5 | 40 | 5 |
| 4 | 29 | 45 | 7 | 20 | 1 |
| 15 | 30 | 15 | 7 | 40 | 5 |
| 6 | 31 | 45 | 5 | 40 | 1 |
| 34 | 32 | 45 | 5 | 30 | 3 |
| 19 | 33 | 15 | 7 | 30 | 3 |
| 20 | 34 | 45 | 7 | 30 | 3 |
| 28 | 35 | 45 | 7 | 30 | 3 |
| 23 | 36 | 15 | 7 | 30 | 3 |
References
- Wang, R.-M.; Zheng, S.-R.; Zheng, Y.-P. Polymer Matrix Composites and Technology; Woodhead Publishing: Oxford, UK; Science Press: Beijing, China, 2011. [Google Scholar]
- Clyne, T.W.; Hull, D. An Introduction to Composite Materials; Cambridge University Press: Cambridge, UK, 2019. [Google Scholar]
- Witten, E.; Volker, M. Der europäische Markt für Faserverstärkte Kunststoffe/Composites 2022: Marktentwicklungen, Trends, Herausforderungen und Ausblicke. AVK, Industrievereinigung Verstärkte Kunststoffe, April 2023. Available online: https://www.avk-tv.de/ (accessed on 21 November 2023).
- Chang, I.Y.; Lees, J.K. Recent Development in Thermoplastic Composites: A Review of Matrix Systems and Processing Methods. J. Thermoplast. Compos. Mater. 1988, 1, 277–296. [Google Scholar] [CrossRef]
- Mallick, P.K. Thermoplastics and thermoplastic–matrix composites for lightweight automotive structures. In Woodhead Publishing in Materials, Materials, Design and Manufacturing for Lightweight Vehicles, 1st ed.; Mallick, P.K., Ed.; CRC Press: Boca Raton, FL, USA; Woodhead Publishing: Oxford, UK, 2010; pp. 174–207. Available online: https://www.researchgate.net/publication/286428115_Thermoplastics_and_thermoplastic-matrix_composites_for_lightweight_automotive_structures (accessed on 5 September 2024).
- Yousefpour, A.; Hojjati, M.; Immarigeon, J.-P. Fusion Bonding/Welding of Thermoplastic Composites. J. Thermoplast. Compos. Mater. 2004, 17, 303–341. [Google Scholar] [CrossRef]
- Stokes, V.K. Joining methods for plastics and plastic composites: An overview. Polym. Eng. Sci 1989, 29, 1310–1324. [Google Scholar] [CrossRef]
- Vaidya, U.K.; Chawla, K.K. Processing of fiber reinforced thermoplastic composites. Int. Mater. Rev. 2008, 53, 185–218. [Google Scholar] [CrossRef]
- Behrens, B.A.; Dröder, K.; Brunotte, K.; Wester, H.; Hürkamp, A.; Ossowski, T.; Lorenz, R. Numerical Modelling of Bond Strength in Overmoulded Thermoplastic Composites. J. Compos. Sci. 2021, 5, 164. [Google Scholar] [CrossRef]
- Bourban, P.-E.; Bernet, N.; Zanetto, J.-E.; Månson, J.-A.E. Material phenomena controlling rapid processing of thermoplastic composites. Compos. Part A Appl. Sci. Manuf. 2001, 32, 1045–1057. [Google Scholar] [CrossRef]
- Kropka, M.; Muehlbacher, M.; Neumeyer, T.; Altstaedt, V. From UD-tape to Final Part—A Comprehensive Approach Towards Thermoplastic Composites. Procedia CIRP 2017, 66, 96–100. [Google Scholar] [CrossRef]
- European Commission. Communication from the Commission to the European Parliament, the European Council, the Council, the European Economic and Social Committee and the Committee of the Regions; The European Green Deal; European Commission: Brussels, Belgium, 2019. [Google Scholar]
- Ghosh, T.; Kim, H.C.; de Kleine, R.; Wallington, T.J.; Bakshi, B.R. Life cycle energy and greenhouse gas emissions implications of using carbon fiber reinforced polymers in automotive components: Front subframe case study. Sustain. Mater. Technol. 2021, 28, e00263. [Google Scholar] [CrossRef]
- Das, S.; Graziano, D.; Upadhyayula, V.K.; Masanet, E.; Riddle, M.; Cresko, J. Vehicle lightweighting energy use impacts in U.S. light-duty vehicle fleet. Sustain. Mater. Technol. 2016, 8, 5–13. [Google Scholar] [CrossRef]
- Amasawa, E.; Hasegawa, M.; Yokokawa, N.; Sugiyama, H.; Hirao, M. Environmental performance of an electric vehicle composed of 47% polymers and polymer composites. Sustain. Mater. Technol. 2020, 25, e00189. [Google Scholar] [CrossRef]
- van den Hoven, G. Widening-Narrowing Guide for Textile Filament Bundle. U.S. Patent 4301579, 24 November 1981. [Google Scholar]
- Nakagawa, N.; Ohsora, Y. Fiber Separator for Producing Fiber Reinforced Metallic or Resin Body. U.S. Patent 5101542, 7 April 1992. [Google Scholar]
- Guirman, J.-M.; Lecerf, B.; Memphis, A. Method and Device for Producing a Textile Web by Spreading Tows. U.S. Patent 6836939, 4 January 2005. [Google Scholar]
- Kiss, P.A.; Deaton, J.M.; Parsons, M.S.; Coffey, D. Apparatus and Method for Splitting a Tow of Fibers. U.S. Patent 6385828, 14 May 2002. [Google Scholar]
- Krueger, R.G. Apparatus and Method for Spreading Fibrous Tows into Linear Arrays of Generally Uniform Density and Products Made Thereby. U.S. Patent 6311377, 6 November 2001. [Google Scholar]
- Lifke, J.L.; Drake, B.L.; Finley, D.J.; Gordon, B.W. Method and apparatus for spreading fiber bundles. U.S. Patent 6049956, 18 April 2000. [Google Scholar]
- Niina, G.; Sasaki, Y.; Takahashi, M. Process for Spreading of Dividing Textile Materials. U.S. Patent 3358436, 19 December 1967. [Google Scholar]
- Anahara, M.; Kawasaki, Y.; Suzuki, Y. Method for Manufacturing a Textured Yarn. U.S. Patent 3969885, 20 August 1976. [Google Scholar]
- Sternberg, E.M. Method and Apparatus for Charging a Bundle of Filaments. U.S. Patent 3967118, 29 July 1976. [Google Scholar]
- Nestler, J.; Vettermann, F.; Reuchsel, D. Device and Method from Spreading a Carbon Fiber Hank. U.S. Patent 7536761 B2, 26 March 2009. [Google Scholar]
- Peritt, J.M.; Everett, R. Electrostatic Fibers Spreader Including a Corona Discharge Device. U.S. Patent 5200620, 6 April 1993. [Google Scholar]
- Chung, T.-S.; Furst, H.; Gurion, Z.; McMahon, P.E.; Orwoll, R.D.; Palangio, D. Process for Preparing Process for Preparing Tapes from Thermoplastic Polymers and Carbon Fibers. U.S. Patent 4588538, 13 May 1986. [Google Scholar]
- Newell, J.A.; Puzianowski, A.A. Development of a Pneumatic Spreading System for Kevlar-Based Sic-Precursor Carbon Fiber Tows. High Perform. Polym. 1999, 11, 197–203. [Google Scholar] [CrossRef]
- Chen, J.C.; Chao, C.G. Numerical and experimental study of internal flow field for a carbon fiber tow pneumatic spreader. Met. Mater. Trans. B 2001, 32, 329–339. [Google Scholar] [CrossRef]
- Daniels, C.G. Pneumatic Spreading Of Filaments. U.S. Patent 3795944, 12 March 1974. [Google Scholar]
- Pryor, J.W. Method and Apparatus for Conveying Filter Tow. U.S. Patent 4537583, 27 August 1985. [Google Scholar]
- McMahon, P.E.; Chung, T.-S.; Ying, L. Process for Preparing Composite Articles from Composite Fiber Blends. U.S. Patent 4871491, 3 October 1989. [Google Scholar]
- Baucom, R.M.; Snoha, J.J.; Marchello, M. Process for Application of Powder Particles to Filamentary Materials. U.S. Patent 5057338, 15 October 1991. [Google Scholar]
- Kawabe, K.; Tomoda, S. Method of Producing a Spread Multi-Filament Bundle and an Apparatus Used in the Same. U.S. Patent 7571524 B2, 11 August 2009. [Google Scholar]
- Ames, T.; Kenley, R.L.; Powers, E.J.; West, W.; Wygand, W.T.; Lomax, B.R. Method and Apparatus for Making an Absorbent Composite. U.S. Patent 7181817 B2, 27 February 2007. [Google Scholar]
- Akase, D.; Matsumae, H.; Hanao, T.; Sekido, T. Method and Aparatus for Opening Reinforcing Fiber Bundle and Method of Manufacturing Prepreg. U.S. Patent 6094791 PCT/JP97/04541, 1 August 2000. [Google Scholar]
- Sager, T.B. Method and Apparatus for Separating Monofilaments Forming a Strand. U.S. Patent 4959895, 2 October 1990. [Google Scholar]
- Tanaka, K.; Ohtani, H.; Matsumae, H. Production Device and Method for Opened Fiber Bundle and Prepreg Production Method. U.S. Patent 6743392, 1 June 2004. [Google Scholar]
- Hall, J.N. Apparatus for Spreading a Graphite Fiber Tow into a Ribbon of Graphite Filaments. U.S. Patent 3704485, 5 December 1972. [Google Scholar]
- Iyer, S.; Drzal, L.T. Method and system for spreading a tow of fibers. U.S. Patent 5042111, 27 August 1991. [Google Scholar]
- Wilson, S.D.R. Lateral spreading of fiber tows. J. Eng. Math. 1997, 32, 19–26. [Google Scholar] [CrossRef]
- Irfan, M.S.; Machavaram, V.R.; Mahendran, R.S.; Shotton-Gale, N.; Wait, C.F.; Paget, M.A.; Hudson, M.; Fernando, G.F. Lateral spreading of a fiber bundle via mechanical means. J. Compos. Mater. 2012, 46, 311–330. [Google Scholar] [CrossRef]
- Krützmann, J.; Schiendorfer, A.; Beratz, S.; Moosburger-Will, J.; Reif, W.; Horn, S. Learning Controllers for Adaptive Spreading of Carbon Fiber Tows. In Springer eBook Collection, Machine Learning, Optimization, and Data Science: 6th International Conference, LOD 2020, Siena, Italy, 19–23 July 2020, Revised Selected Papers, Part II, 1st ed.; Nicosia, G., Ojha, V., La Malfa, E., Jansen, G., Sciacca, V., Pardalos, P., Giuffrida, G., Umeton, R., Eds.; Springer International Publishing; Imprint Springer: Cham, Switzerland, 2020; Volume 12566, pp. 65–77. [Google Scholar]
- Mack, J. Entwicklung Eines Adaptiven Online-Bebinderungsprozesses für die Preformherstellung. Ph.D. Thesis, Fachbereich Maschinenbau und Verfahrenstechnik, Technischen Universität Kaiserslautern, Kaiserslautern, Germany, 2015. [Google Scholar]
- McGill, R.; Tukey, J.W.; Larsen, W.A. Variations of Box Plots. Am. Stat. 1978, 32, 12. [Google Scholar] [CrossRef]


| Fiber | Company | Fiber Type | Filaments | Sizing |
|---|---|---|---|---|
| E23 | Teijin (Wuppertal, Germany) | Tenax-E STS40 E23 | 24 K | Epoxy |
| F13 | Teijin (Wuppertal, Germany) | Tenax-E STS40 F11 | 24 K | Polyurethane |
| TRH | Mitsubishi Chemical (Irvine, CA, USA) | Pyrofil TRH50 60M | 60 K | Epoxy |
| Factor | Name | Units | Type | Minimum | Maximum |
|---|---|---|---|---|---|
| A | Rod diameter | mm | Categorical | 15 | 45 |
| B | Number of rods | - | Categorical | 3 | 7 |
| C | Immersion depth | mm | Numerical | 20 | 40 |
| D | Take-off speed | m/min | Numerical | 1 | 5 |
| Response | Name | Units |
|---|---|---|
| R1 | Final width | mm |
| R2 | Spread ratio | - |
| R3 | Force | N |
| Fiber | Median | Mean | Standard Deviation | 1. Quartile (25%) | 3. Quartile (75%) | IQR | Min | Max | Number of Outliers |
|---|---|---|---|---|---|---|---|---|---|
| (mm) | (mm) | (mm) | (mm) | (mm) | (mm) | (mm) | (mm) | - | |
| E23 | 9.36 | 9.36 | 0.65 | 9.04 | 9.80 | 0.76 | 6.42 | 10.92 | 3 |
| F13 | 8.11 | 8.11 | 0.99 | 7.35 | 8.83 | 1.48 | 4.43 | 10.59 | 1 |
| TRH | 13.22 | 12.92 | 2.08 | 11.88 | 14.52 | 2.63 | 7.07 | 16.64 | 3 |
Disclaimer/Publisher’s Note: The statements, opinions and data contained in all publications are solely those of the individual author(s) and contributor(s) and not of MDPI and/or the editor(s). MDPI and/or the editor(s) disclaim responsibility for any injury to people or property resulting from any ideas, methods, instructions or products referred to in the content. |
© 2025 by the authors. Licensee MDPI, Basel, Switzerland. This article is an open access article distributed under the terms and conditions of the Creative Commons Attribution (CC BY) license (https://creativecommons.org/licenses/by/4.0/).
Share and Cite
Kohl, S.; Marschik, C.; Kranzl, T.; Schnaitter, M.; Ünal, V.F.; Berger-Weber, G. Using a Novel Process-Near Mechanical-Deflection-Based Spreading Test Rig for a Systematic Experimental Analysis of Carbon Fiber Rovings Spreading Process. Fibers 2025, 13, 21. https://doi.org/10.3390/fib13020021
Kohl S, Marschik C, Kranzl T, Schnaitter M, Ünal VF, Berger-Weber G. Using a Novel Process-Near Mechanical-Deflection-Based Spreading Test Rig for a Systematic Experimental Analysis of Carbon Fiber Rovings Spreading Process. Fibers. 2025; 13(2):21. https://doi.org/10.3390/fib13020021
Chicago/Turabian StyleKohl, Stefan, Christian Marschik, Thomas Kranzl, Mathias Schnaitter, Veysel Furkan Ünal, and Gerald Berger-Weber. 2025. "Using a Novel Process-Near Mechanical-Deflection-Based Spreading Test Rig for a Systematic Experimental Analysis of Carbon Fiber Rovings Spreading Process" Fibers 13, no. 2: 21. https://doi.org/10.3390/fib13020021
APA StyleKohl, S., Marschik, C., Kranzl, T., Schnaitter, M., Ünal, V. F., & Berger-Weber, G. (2025). Using a Novel Process-Near Mechanical-Deflection-Based Spreading Test Rig for a Systematic Experimental Analysis of Carbon Fiber Rovings Spreading Process. Fibers, 13(2), 21. https://doi.org/10.3390/fib13020021