Article

Structural Performance of Columns with Glass Fiber-Reinforced Polymer Bars Under Axial Compression

by
Trupti Amit Kinjawadekar
1,
Shantharam Patil
1,* and
Gopinatha Nayak
2
1
Manipal School of Architecture and Planning, Manipal Academy of Higher Education, Manipal 576104, Karnataka, India
2
Department of Civil Engineering, Manipal Institute of Technology, Manipal Academy of Higher Education, Manipal 576104, Karnataka, India
*
Author to whom correspondence should be addressed.
Fibers 2025, 13(11), 156; https://doi.org/10.3390/fib13110156
Submission received: 27 September 2025 / Revised: 17 October 2025 / Accepted: 7 November 2025 / Published: 20 November 2025

Highlights

What are the main findings?
  • The study experimentally, numerically and analytically investigates GFRP-reinforced concrete columns under axial compression, comparing them with steel-RC columns.
  • Load capacity of GFRP-RC columns achieved 85–90% of the load carrying capacity of the steel-reinforced column, with the contribution of GFRP bars of 10–12% of total axial load capacity.
  • Reducing stirrup spacing from 75 mm to 50 mm increased load capacity by 15% and ductility by 12%, improving structural behavior.
  • Numerical models (ABAQUS) matched experimental results within 7–10% and analytical predictions within 10–15%, confirming the reliability of modified design equations.
What are the implications of these findings?
  • The proposed design factor (1.15) investigated based on tested specimens enhances predictive accuracy in the Indian context, supporting safer adoption of GFRP-RC columns.
  • GFRP reinforcement is a viable alternative to conventional steel in corrosive or marine environments, extending service life.

Abstract

Corrosion continues to be a major challenge affecting the service life, safety and durability of steel-reinforced concrete (RC) structures. The deterioration of steel not only reduces structural capacity but also increases long-term maintenance costs. To address this limitation, glass fiber-reinforced polymer (GFRP) is being investigated as an alternative to conventional steel reinforcement, particularly in aggressive environments. This work examines the behavior of composite columns reinforced with GFRP bars with steel stirrups. Sixteen square columns of 150 × 150 × 850 mm dimensions, cast with M30 grade concrete, were reinforced using either GFRP or steel, while varying stirrup spacing and bar diameters. Experimental observations showed that GFRP reinforcement contributed about 10–12% of the ultimate capacity of the columns. A marked enhancement in load carrying capacity of GFRP-RC columns was obtained with closer stirrup spacing. The axial strength of GFRP-reinforced columns was comparable to steel-reinforced ones with the same main reinforcement ratio. Ductility increased by 12% when stirrup spacing was reduced. The difference between analytical and experimental values ranged between 12% and 15%, whereas experimental and numerical results differed by 10–12%. Based on these results, a modification factor derived from IS 456:2000 is proposed for predicting the capacity of ‘GFRP-reinforced’ columns. The outcomes clearly highlight the potential of GFRP reinforcement as a durable, sustainable and practical substitute for conventional steel reinforcement.

1. Introduction

Traditional cement concrete exhibits higher strength in compression but limited tensile strength. Toward the end of the 18th century, designers attempted to develop the practice of inserting steel bars into concrete sections to achieve higher tensile strength. This innovative approach led to the development of a composite material known as reinforced concrete (RC) [1]. Steel reinforcement, with its thermal expansion coefficient similar to concrete, became the standard for RC structures [2]. Concrete resists compression and protects the steel bars from hazards such as corrosion. However, the presence of chlorides and carbon dioxide, particularly in moist environments, can lead to the corrosion of reinforcing steel [3]. The challenge of steel rebar corrosion has prompted research into alternative reinforcement solutions. Various methods have been explored, including resin coatings, anti-rust coatings, and polymer-modified epoxy concrete [4,5]. More recently, fiber-reinforced polymer (FRP) bars have been identified as a suitable replacement for steel bars [6,7]. FRP reinforcing bars primarily comprise resin matrices and fibers, with glass, aramid, basalt, and carbon fibers being commonly used [8,9]. Glass fibers offer an economical balance between specific strength properties and cost, making them more suitable for most RC applications than aramid and carbon fibers [10]. Numerous studies have explored the mechanical properties and performance of GFRP-RC elements. Recent studies highlight the performance of columns using various FRP reinforcements. Columns reinforced with GFRP tend to exhibit reduced ductility and a more brittle failure compared to the steel-reinforced counterparts, often characterized by sudden concrete failure and localized bar failure [11,12]. While reinforced concrete columns achieve comparable load carrying capacities, some findings indicate lower axial strength to the lower elastic modulus of GFRP [13]. Hybrid reinforced columns with steel and FRP reinforcements generally demonstrate enhanced load bearing capacity over the columns solely reinforced with FRP reinforcement [14,15]. Arczewska [16] demonstrated that bending tests provide a simple and efficient method to evaluate the tensile properties and performance of GFRP-RC elements. Hossain [17] used RILEM Beam Testing to investigate the bonding properties of GFRP bars inserted into engineered cementitious combinations. Tu et al. [18] experimentally investigated the axial compression behavior of GFRP-strengthened columns, concluding that longitudinal GFRP bars contribute 3–7% to the total load-bearing capacity. Ali and El-Salakawy [19] investigated the seismic performance of GFRP-reinforced [20] rectangular concrete columns. Their tests on eight full-scale column prototypes revealed drift capacities ranging from 3.5% to 12.5% at failure, exceeding North American building code limits. Scholars have also investigated the behavior of BFRP-RC columns under axial loading [21]. The study results show performance under pure axial stress and longitudinal reinforcement on full-scale GFRP-RC columns [22]. According to the study, the response of steel and GFRP-reinforced columns was comparable when the longitudinal reinforcement ratio was 1.0% [23]. They established new guidelines for designing GFRP-RC columns based on guidelines for steel RC columns by developing design equations based on the performance of GFRP-RC columns under simultaneous flexural and axial loads. Pantelides et al. [24] also studied the axial load performance of concrete columns confined with GFRP spirals, concluding that FRP confinement improved the axial and strain capacities of concrete. Analytical formulas were developed based on ACI 440 [25] to assess the axial load capacity of GFRP and hybrid-reinforced columns. Abdallah et al. [26] presented an experimental study on GFRP-RC circular columns under seismic loading conditions. The lateral load capacity of the circular GFRP-RC column was comparable to that of a corresponding steel RC member. The GFRP-RC column exhibited a higher drift capacity and stable hysteretic response. Luca et al. [27] assessed the performance of FRP-confined RC columns [28]. They found that FRP confinement improved the axial capacity of the concrete with higher strain capacity. Tobbi et al. [29] investigated the structural performance of glass FRP-RC columns [30] under axial load with different reinforcement ratios and reinforcement types. Despite the increasing awareness of GFRP as reinforcing material, prior studies have primarily focused on beams [31], slabs or circular columns, under flexure or seismic loading conditions. Limited investigations addressed the axial behavior of square columns reinforced with hybrid reinforcement configurations. Furthermore, the is lack of research aligning to existing Indian codes and construction practices. The present study addresses these gaps by evaluating the structural performance of short square GFRP-RC columns under axial compression, comparing them to steel-reinforced columns, and proposing a modified design equation aligned with IS 456:2000 [32].

2. Materials and Methods

2.1. Experimental Study

This section describes the experimental studies, including information on the column specimens, materials, and tests performed. The properties of the materials determined in the laboratory experiments are given. The properties of the reinforcing bars and concrete are discussed. Details of the casting of the column and the curing process are given. Figure 1 shows the composite section used in this study.

2.1.1. Material Properties

M30 grade concrete was used to prepare the RC column specimens. GFRP and steel bars were used as reinforcement. Table 1 shows the mix proportions calculated in accordance with IS 10262:2019 [33]. Table 2 shows the properties of the concrete.
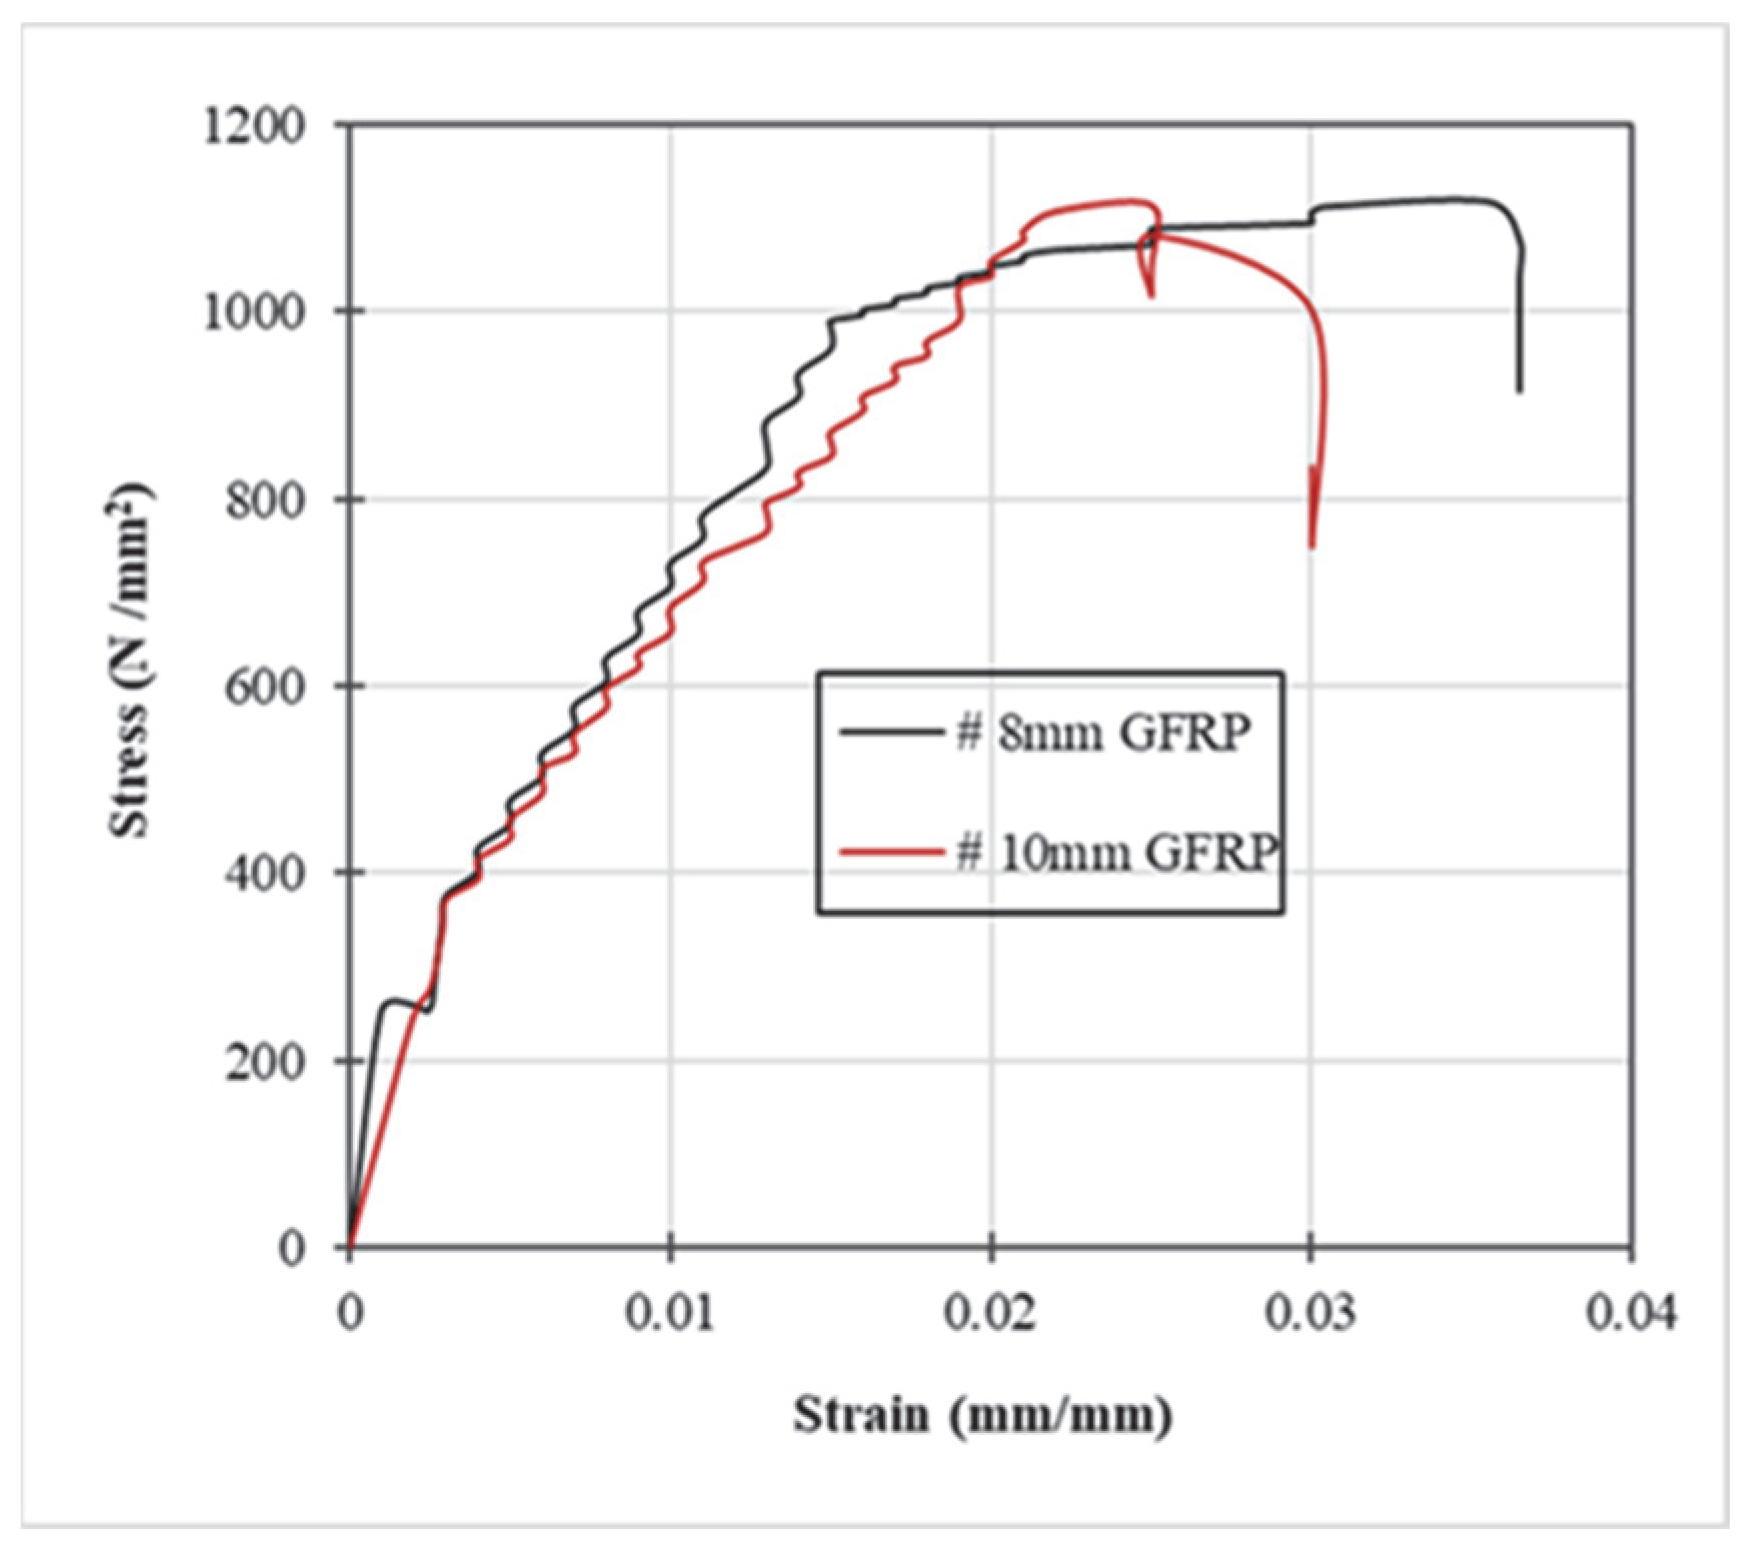
GFRP bars are manufactured by KOMAR Ltd., Russia, and tested in URAL Scientific and Research Institute of construction materials, Russia, provided by KC Contech, Chennai, India, were used in this study. Figure 2 shows the stress–strain curve of the GFRP bar, and Table 3 shows the properties of the reinforcing bars used in casting the column specimens.

2.1.2. Test Specimens

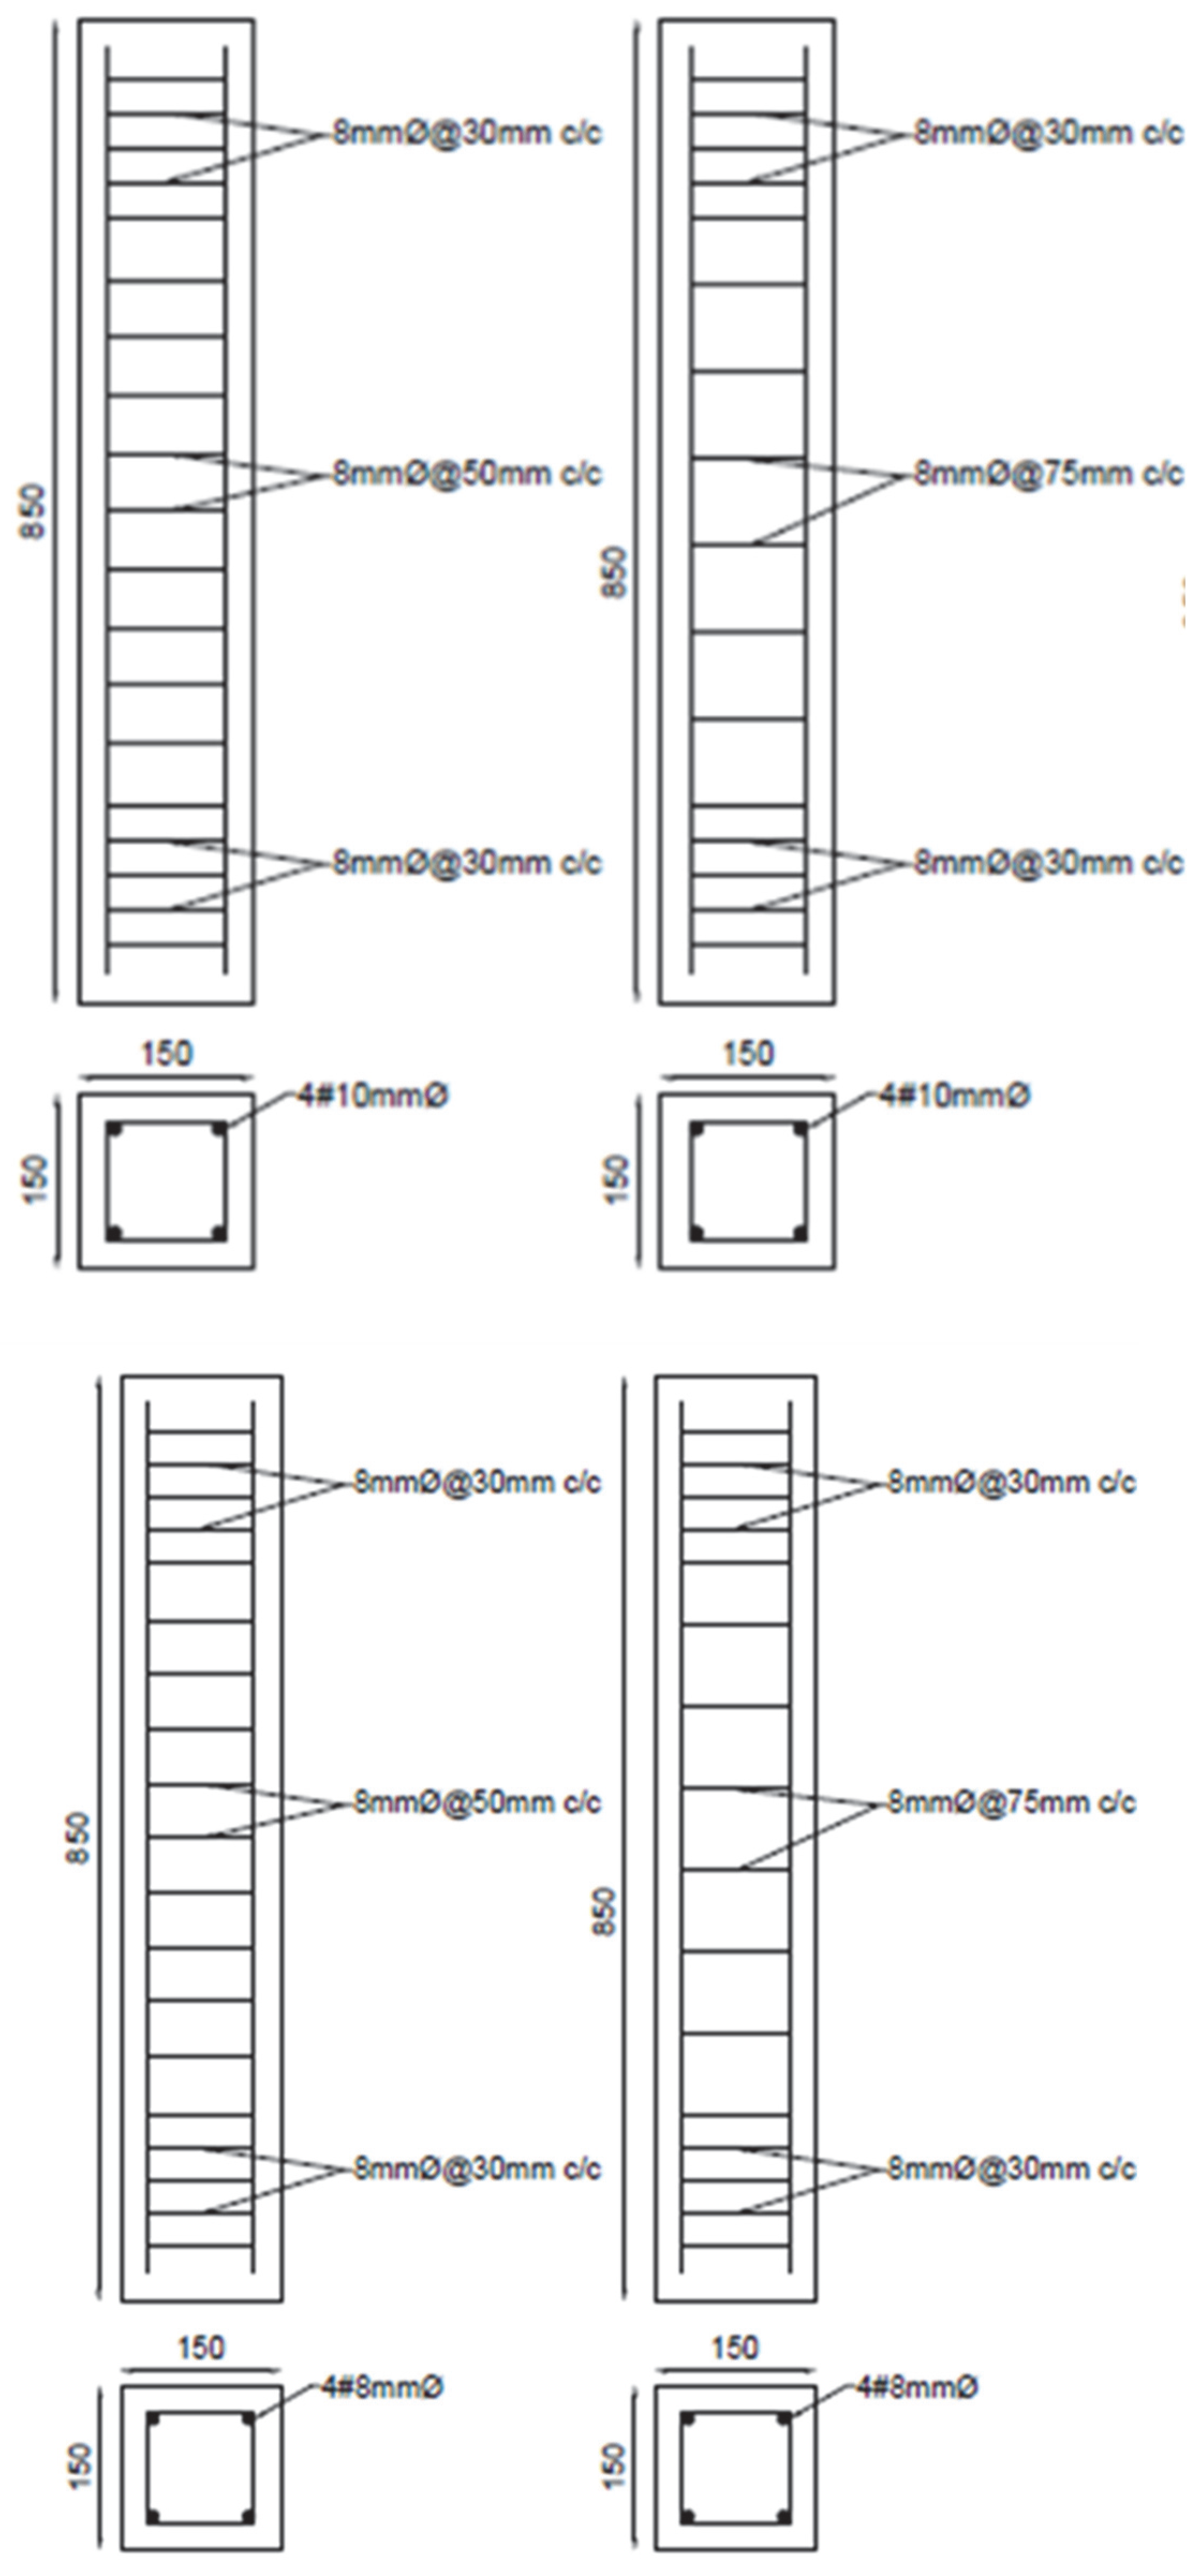
The columns measuring 150 mm × 150 mm × 850 mm were cast and cured for 28 days. Figure 3 shows the details of the test specimens. Reinforcements (GFRP and steel) with diameters of 8 mm and 10 mm were used as the main bars. In addition, a secondary reinforcement made of steel with a diameter of 8 mm was used.

2.1.3. Casting the Test Specimens

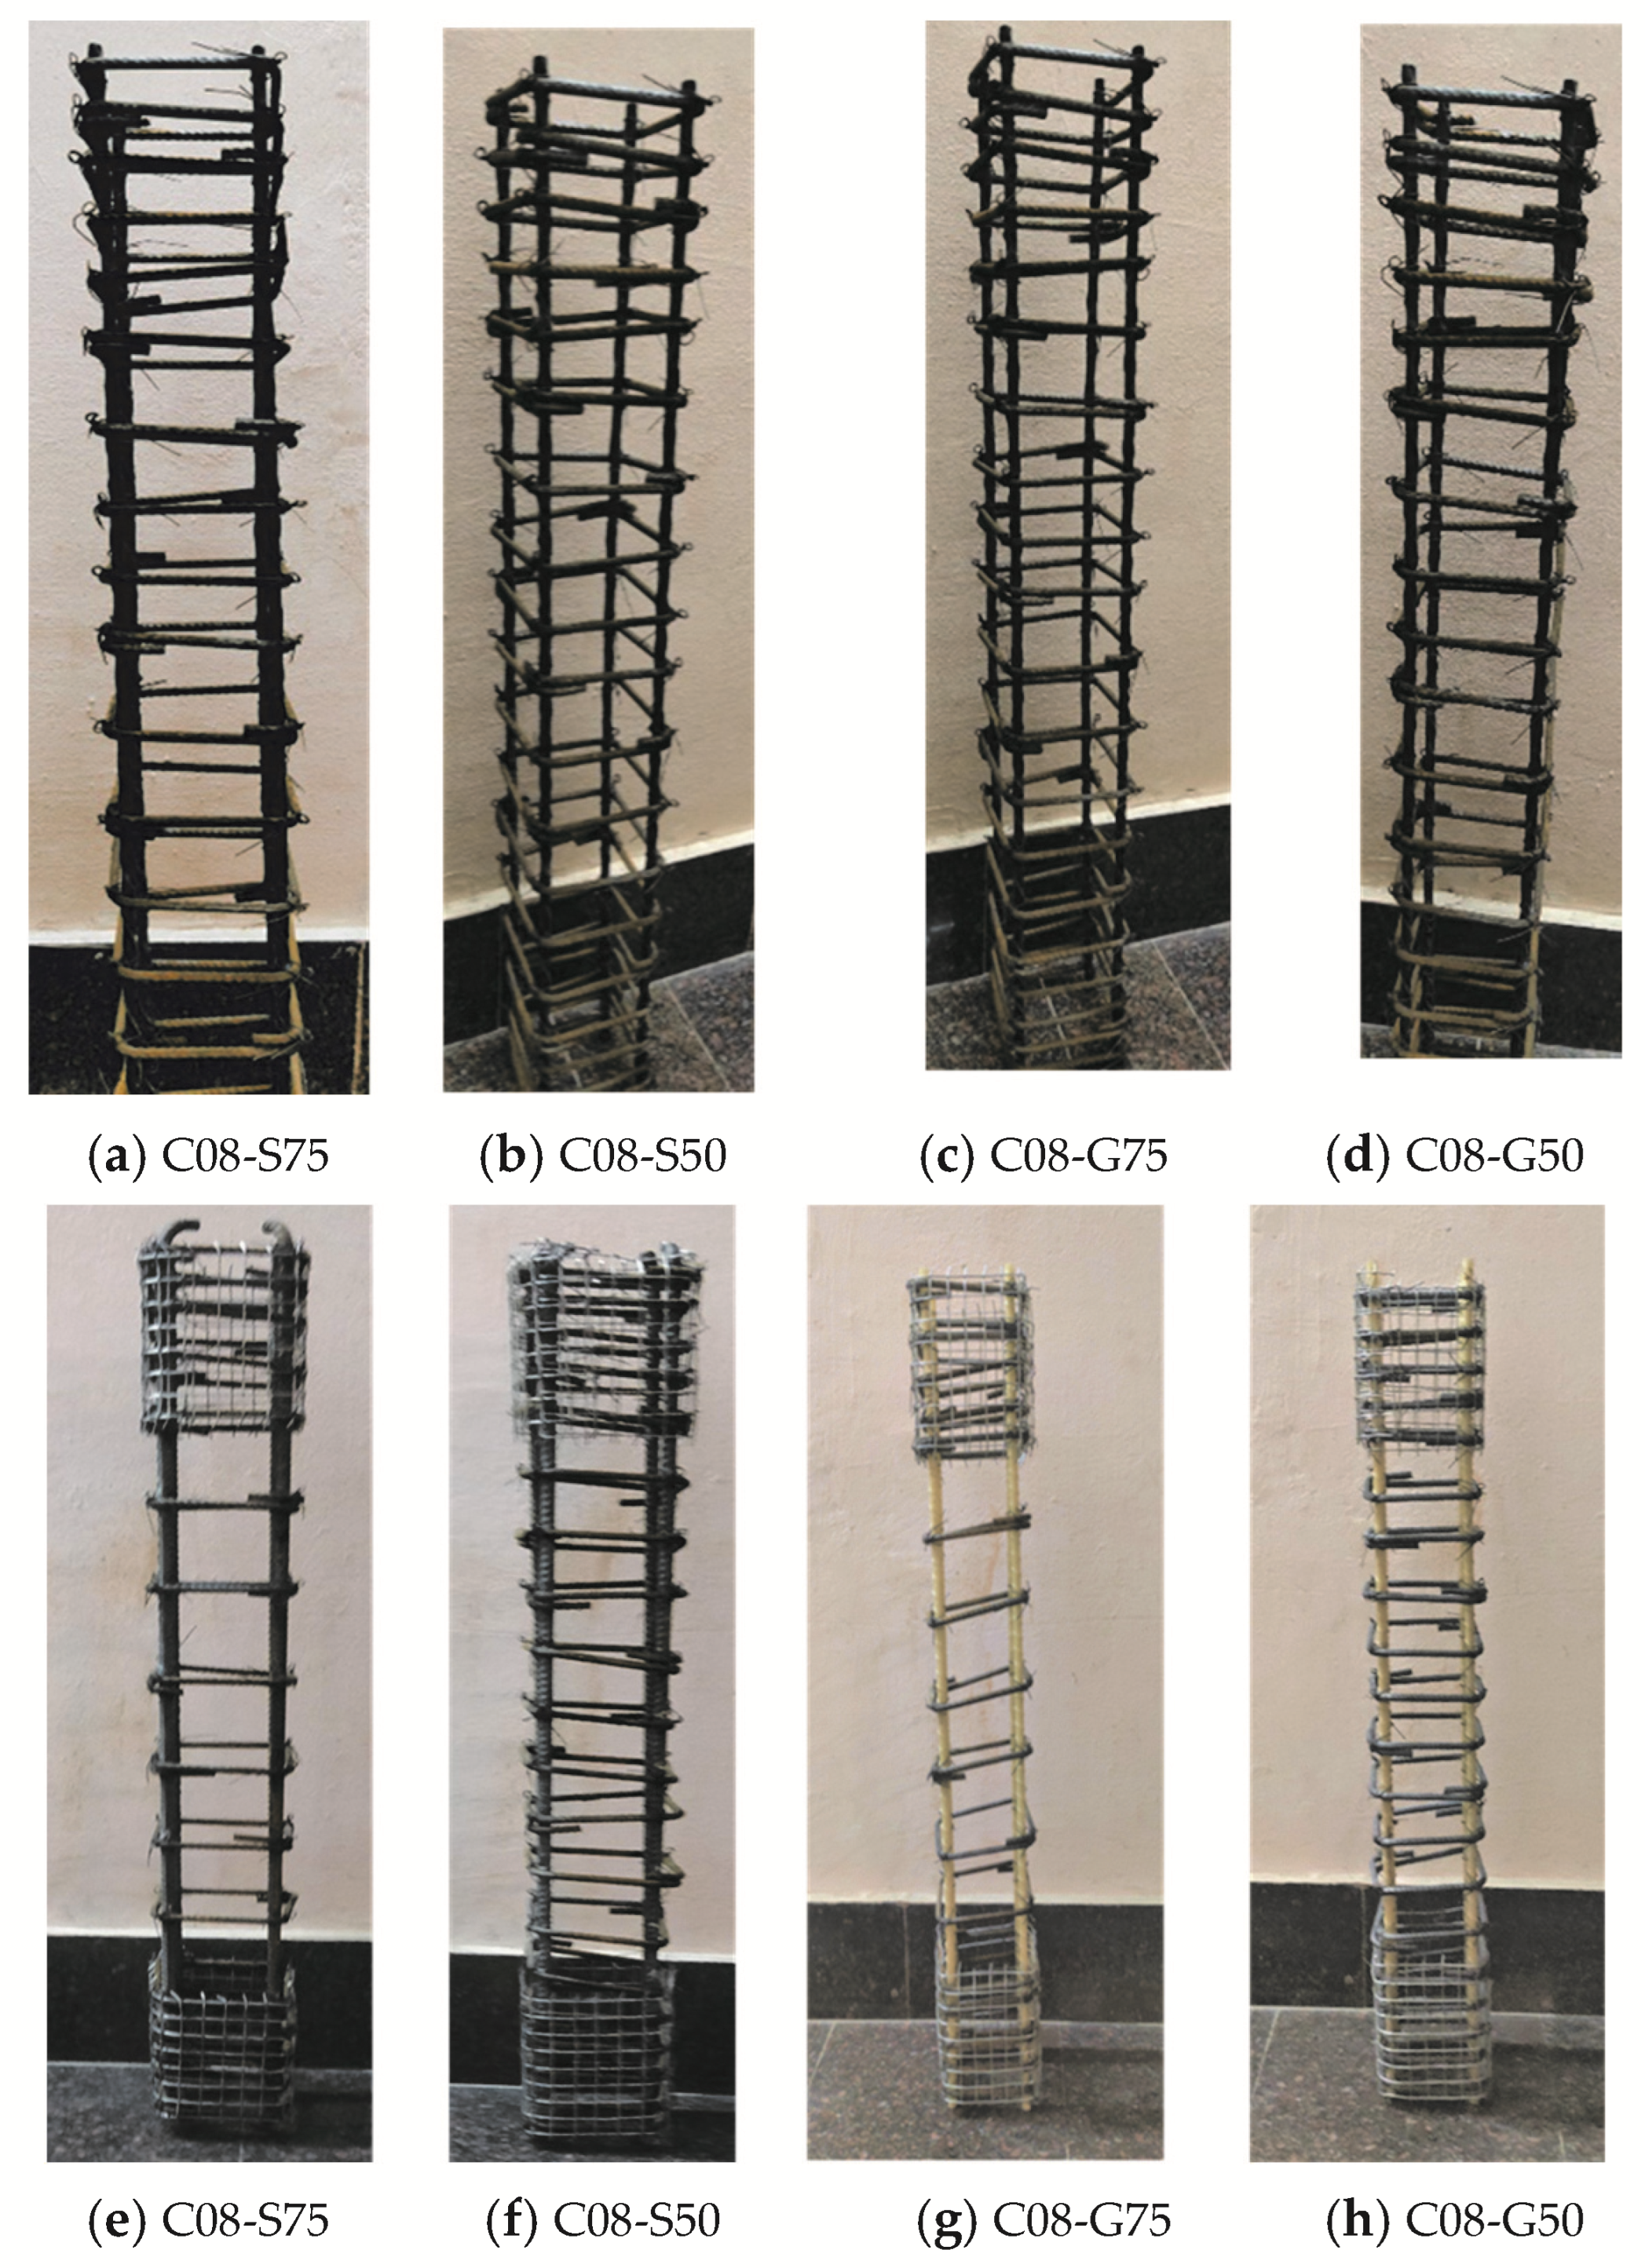
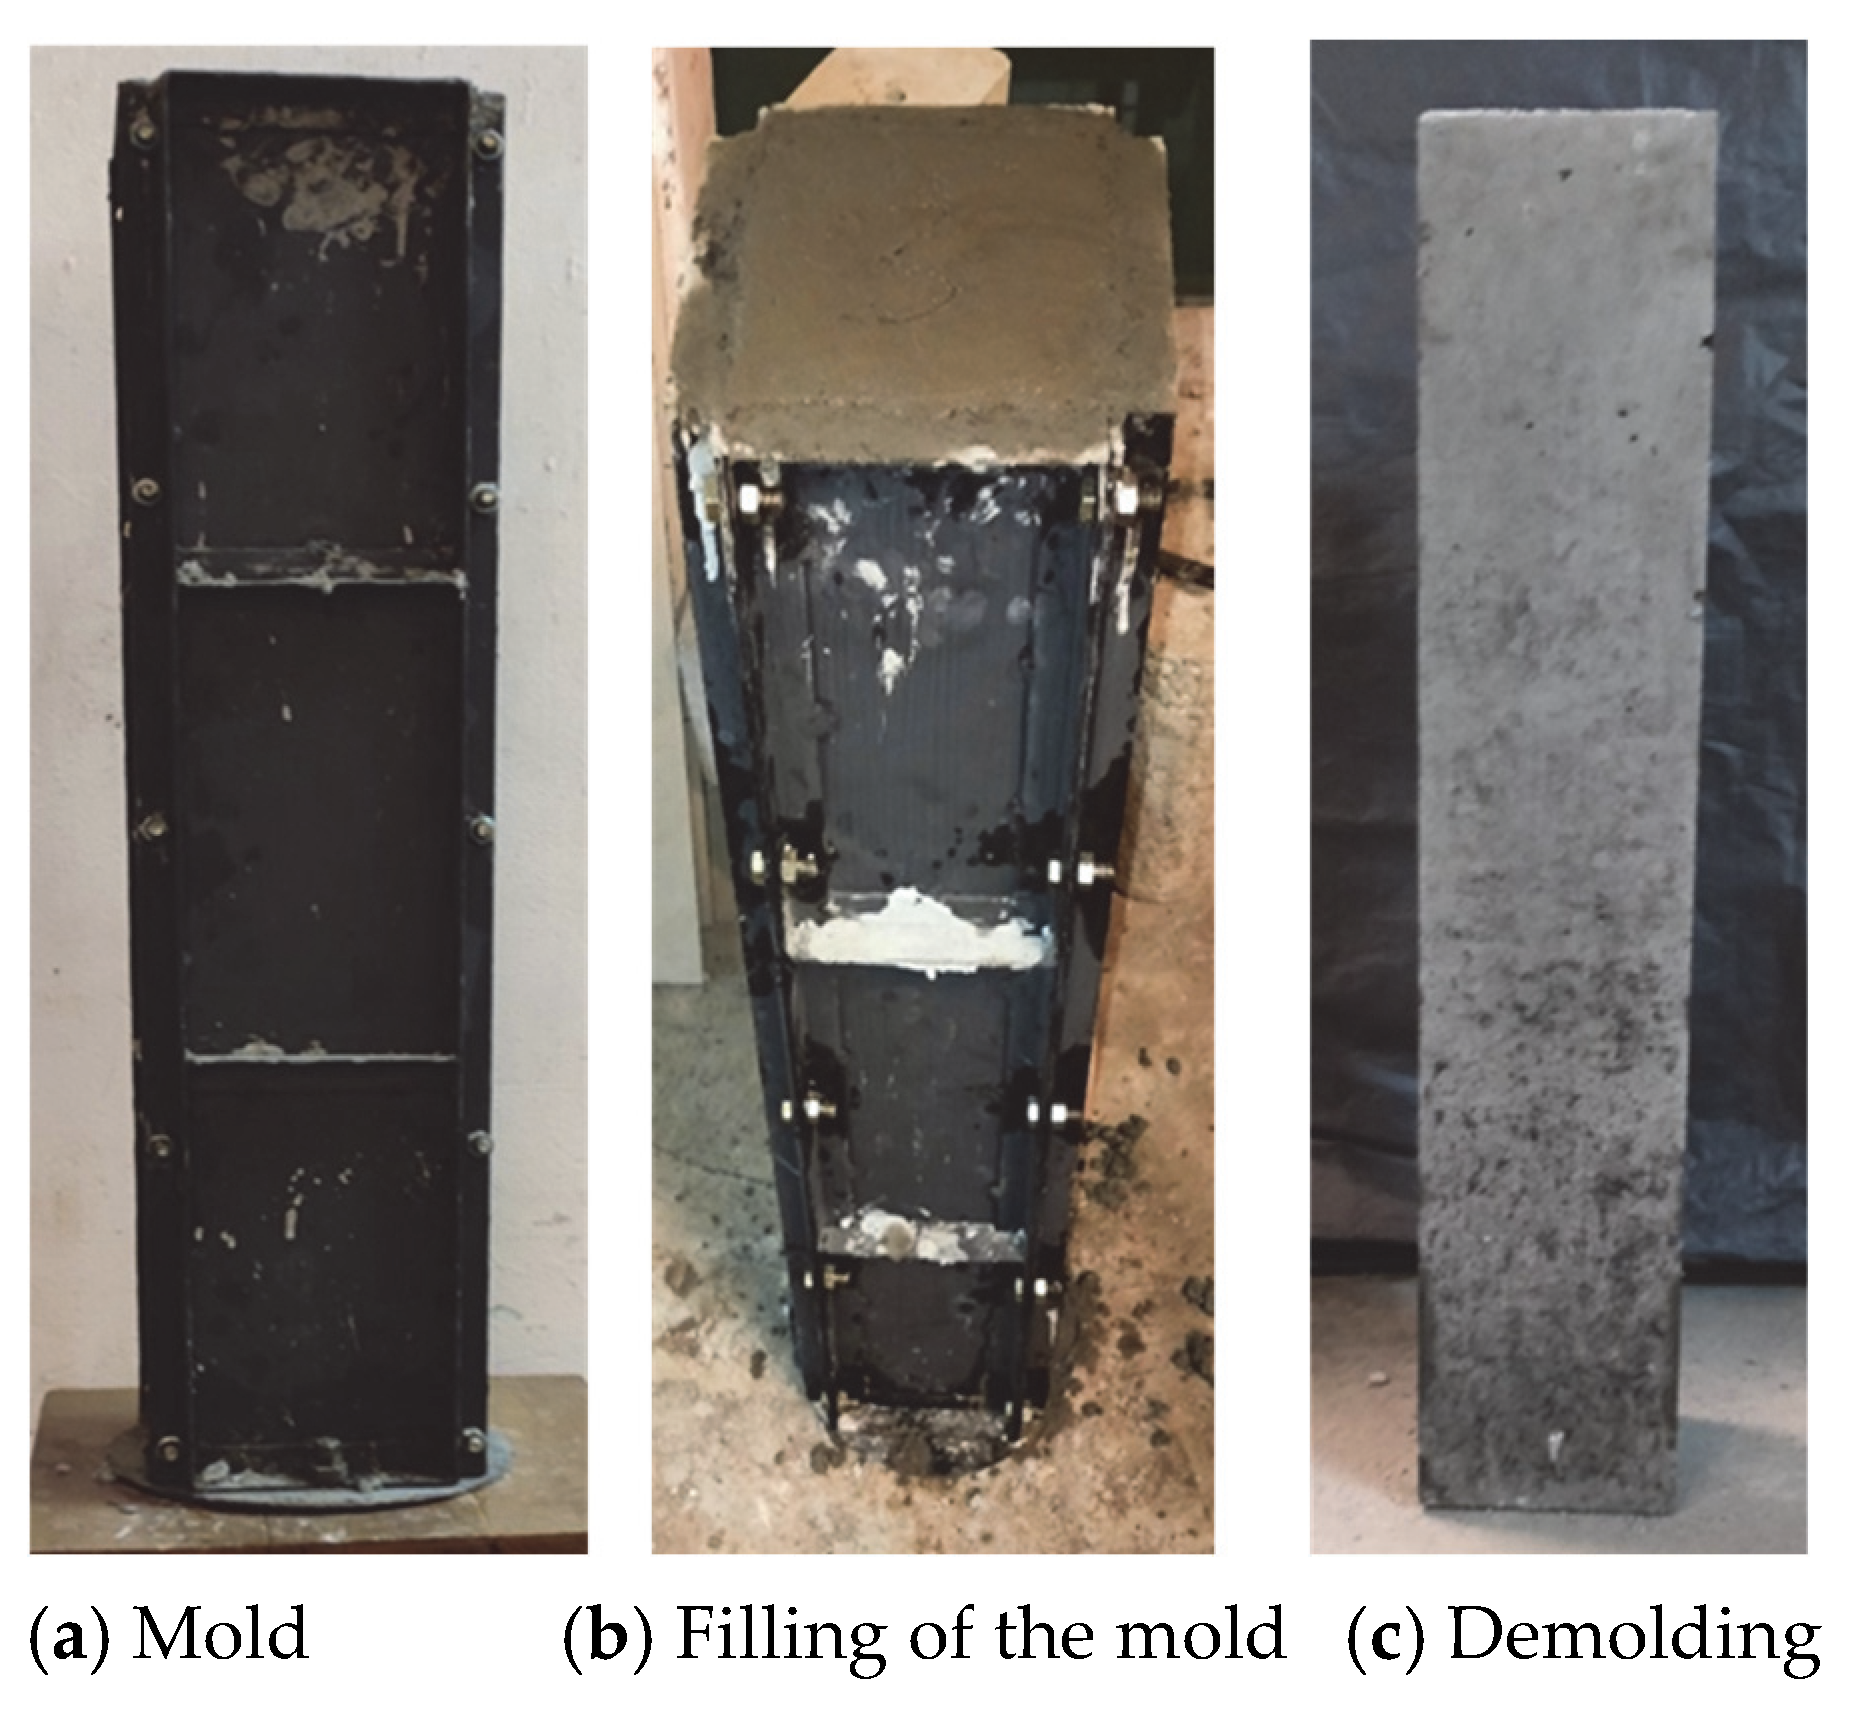
The mixing ratio is determined according to IS 10262:2019. Different concrete materials such as cement, coarse aggregate, sand, water, and superplasticizer are taken by weight and mixed using a concrete mixer. Figure 4a–h show a reinforcement cage for different specimens, and Figure 5 shows the casting details. A ‘10 mm × 10 mm’ steel wire mesh surrounds the specimen to avoid cracking due to stress concentration at the ends during compression testing. Table 4 presents the details of the column specimens.

2.1.4. Test Setup

A test was performed to assess compressive strength using a compression testing machine (CTM) as per ASTM C39/C39M standard by keeping the test-column on the base block. The test setup consists of a machine with two plates and the upper head, which are movable, while the lower head is stationary. One head was equipped with a hemispherical bearing to achieve a uniform load sharing over the test-piece ends. A loading gauge is attached to record the applied load. Two linear variable differential transducers (LVDT) are used to measure the longitudinal deformations in rectangular columns.

2.2. Software Modeling

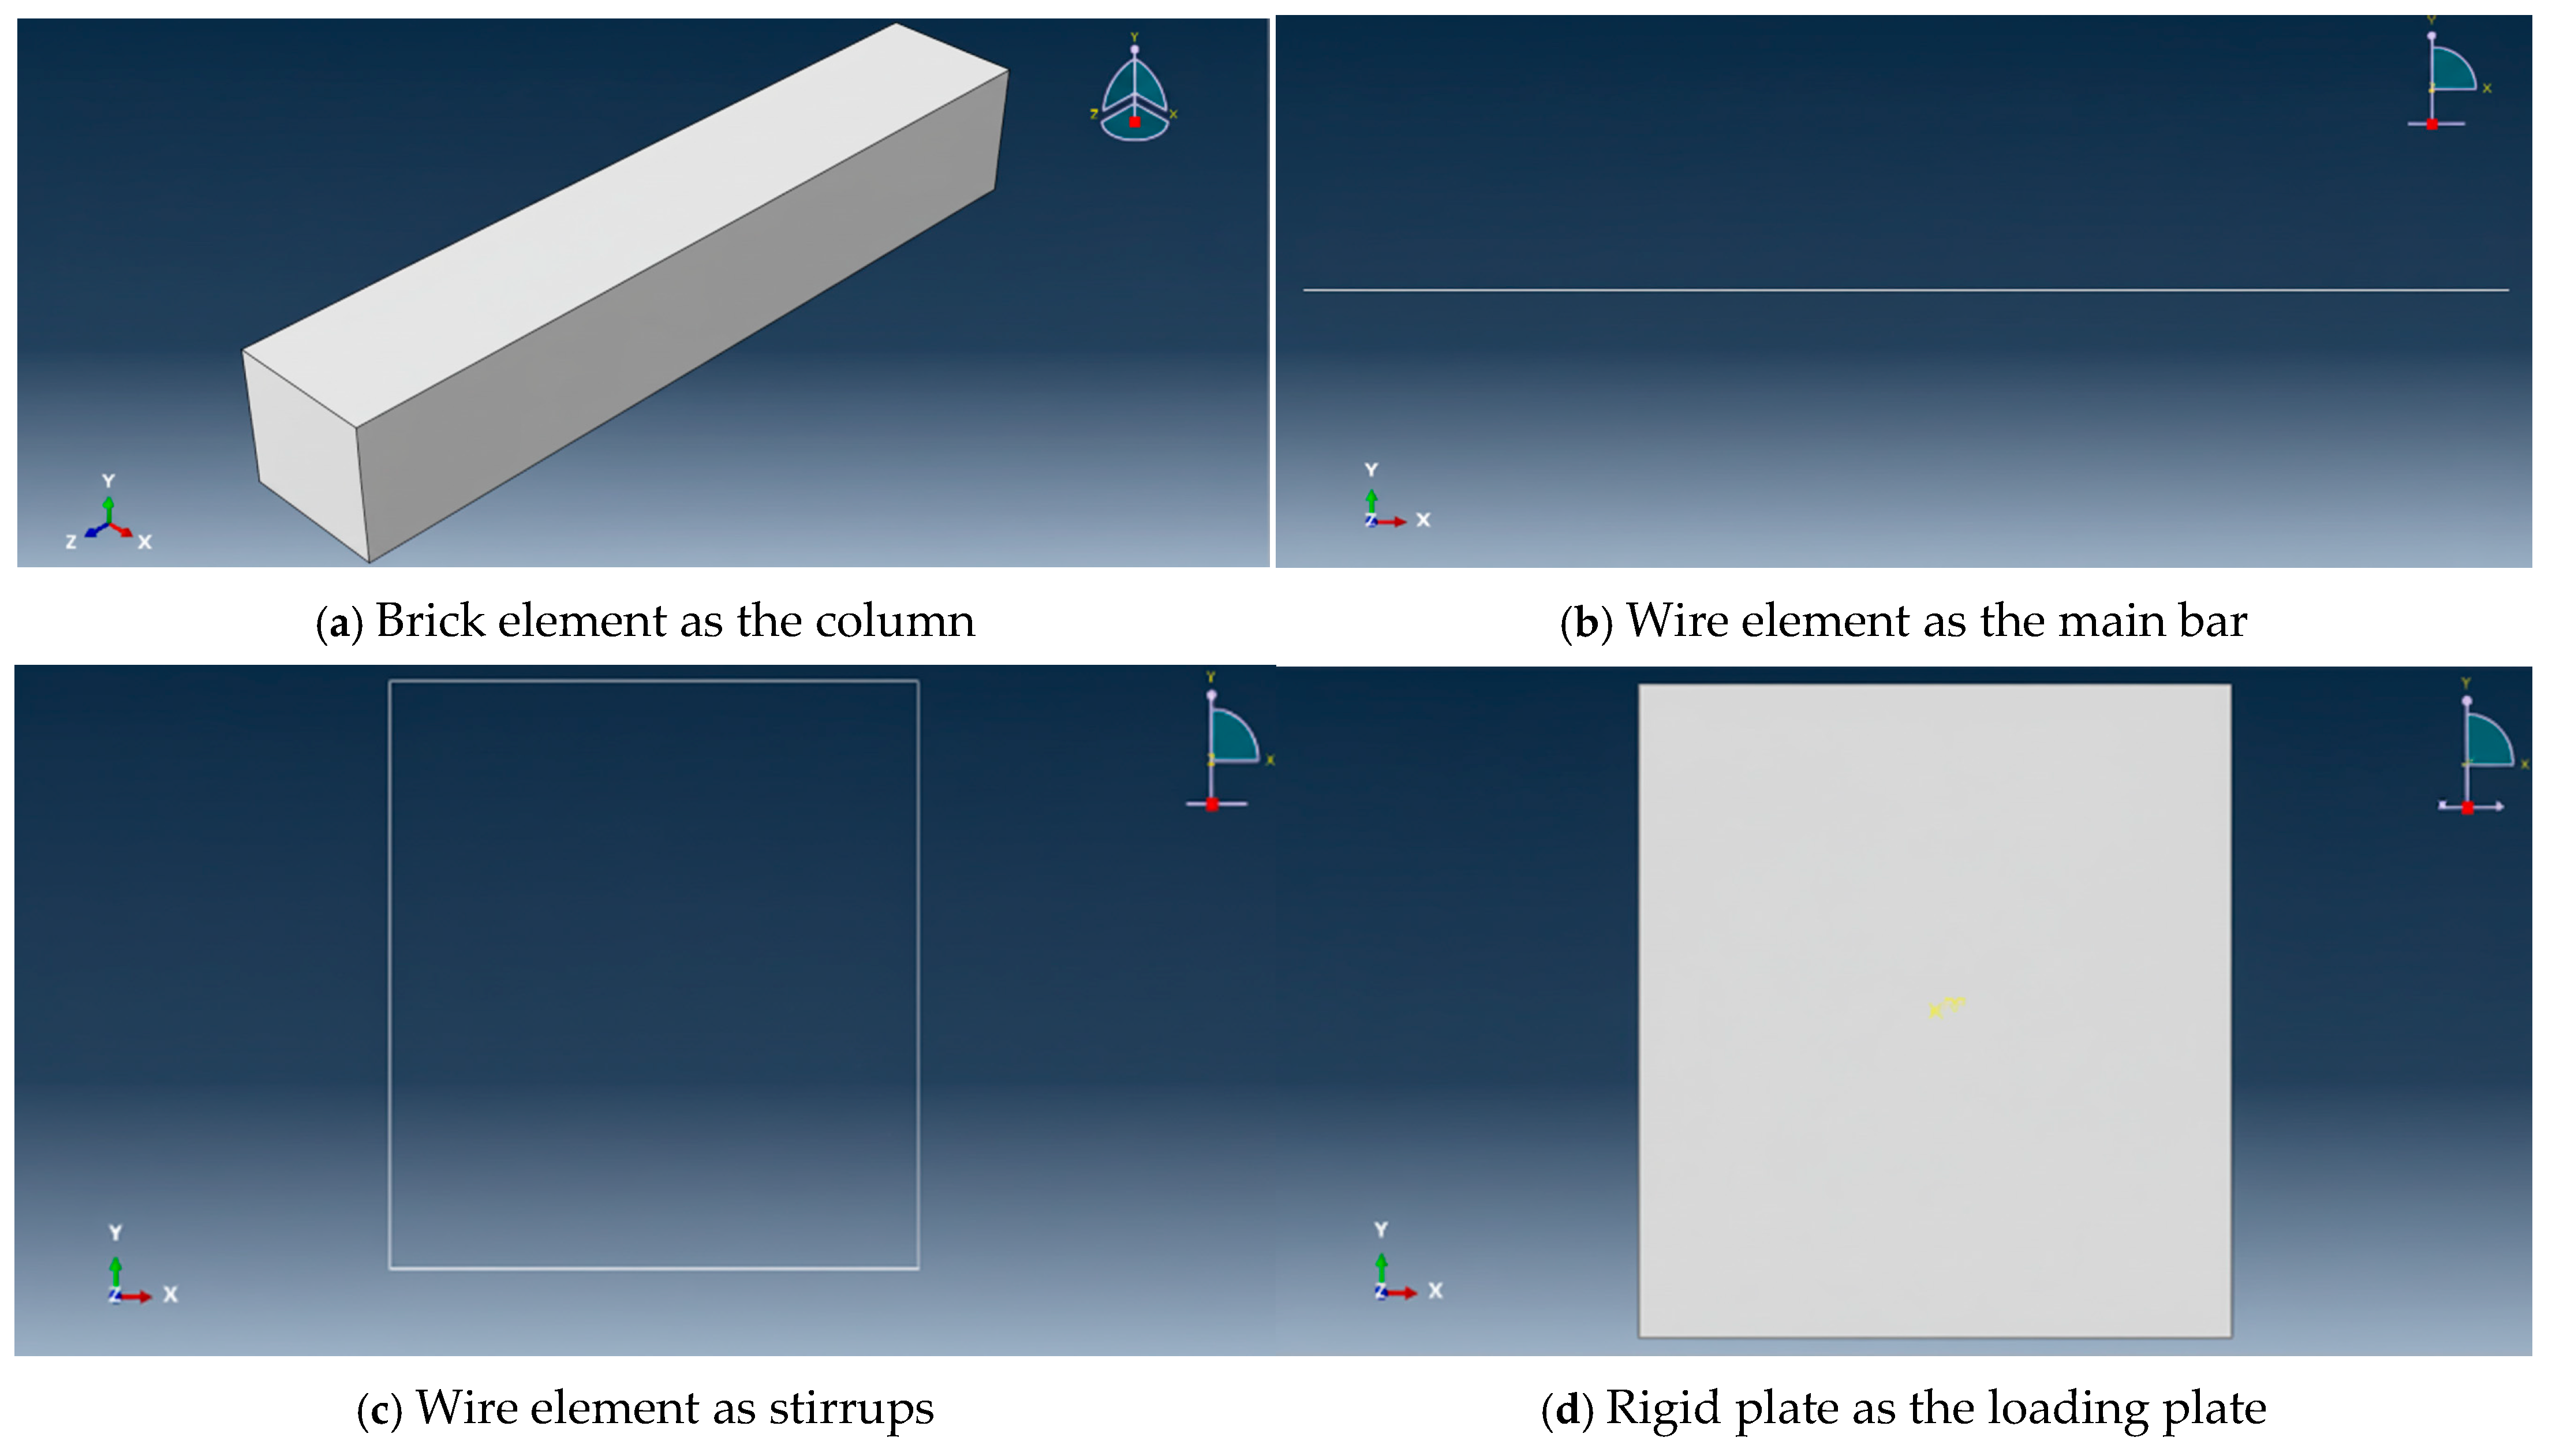
The specimens were modeled in ABAQUS 2017 finite element model (FEM) [34] software for RC columns using a concrete damage plasticity (CDP) model with varying stirrup spacing. This method develops the constitutive behavior of concrete by presenting scalar damage variables for the compressive and tensile response. In this section, column specimens are numerically analyzed, and a comparative analysis of the column specimens with steel and GFRP main rebars and varying steel stirrups is performed. The nonlinear finite element model of the control specimen was created using ABAQUS software. An axial load was applied to the top of the column specimen to determine the load-to-deflection history. The concrete was detailed as a brick element, and the reinforcement was designed using a beam element. To define the bond and the embedded constraint that binds the reinforcement to that of the host concrete, the embedded constraint defined in ABAQUS with a limited number of degrees of freedom is used for the interaction between concrete and steel or GFRP rebars.

2.2.1. Analysis Process Flow

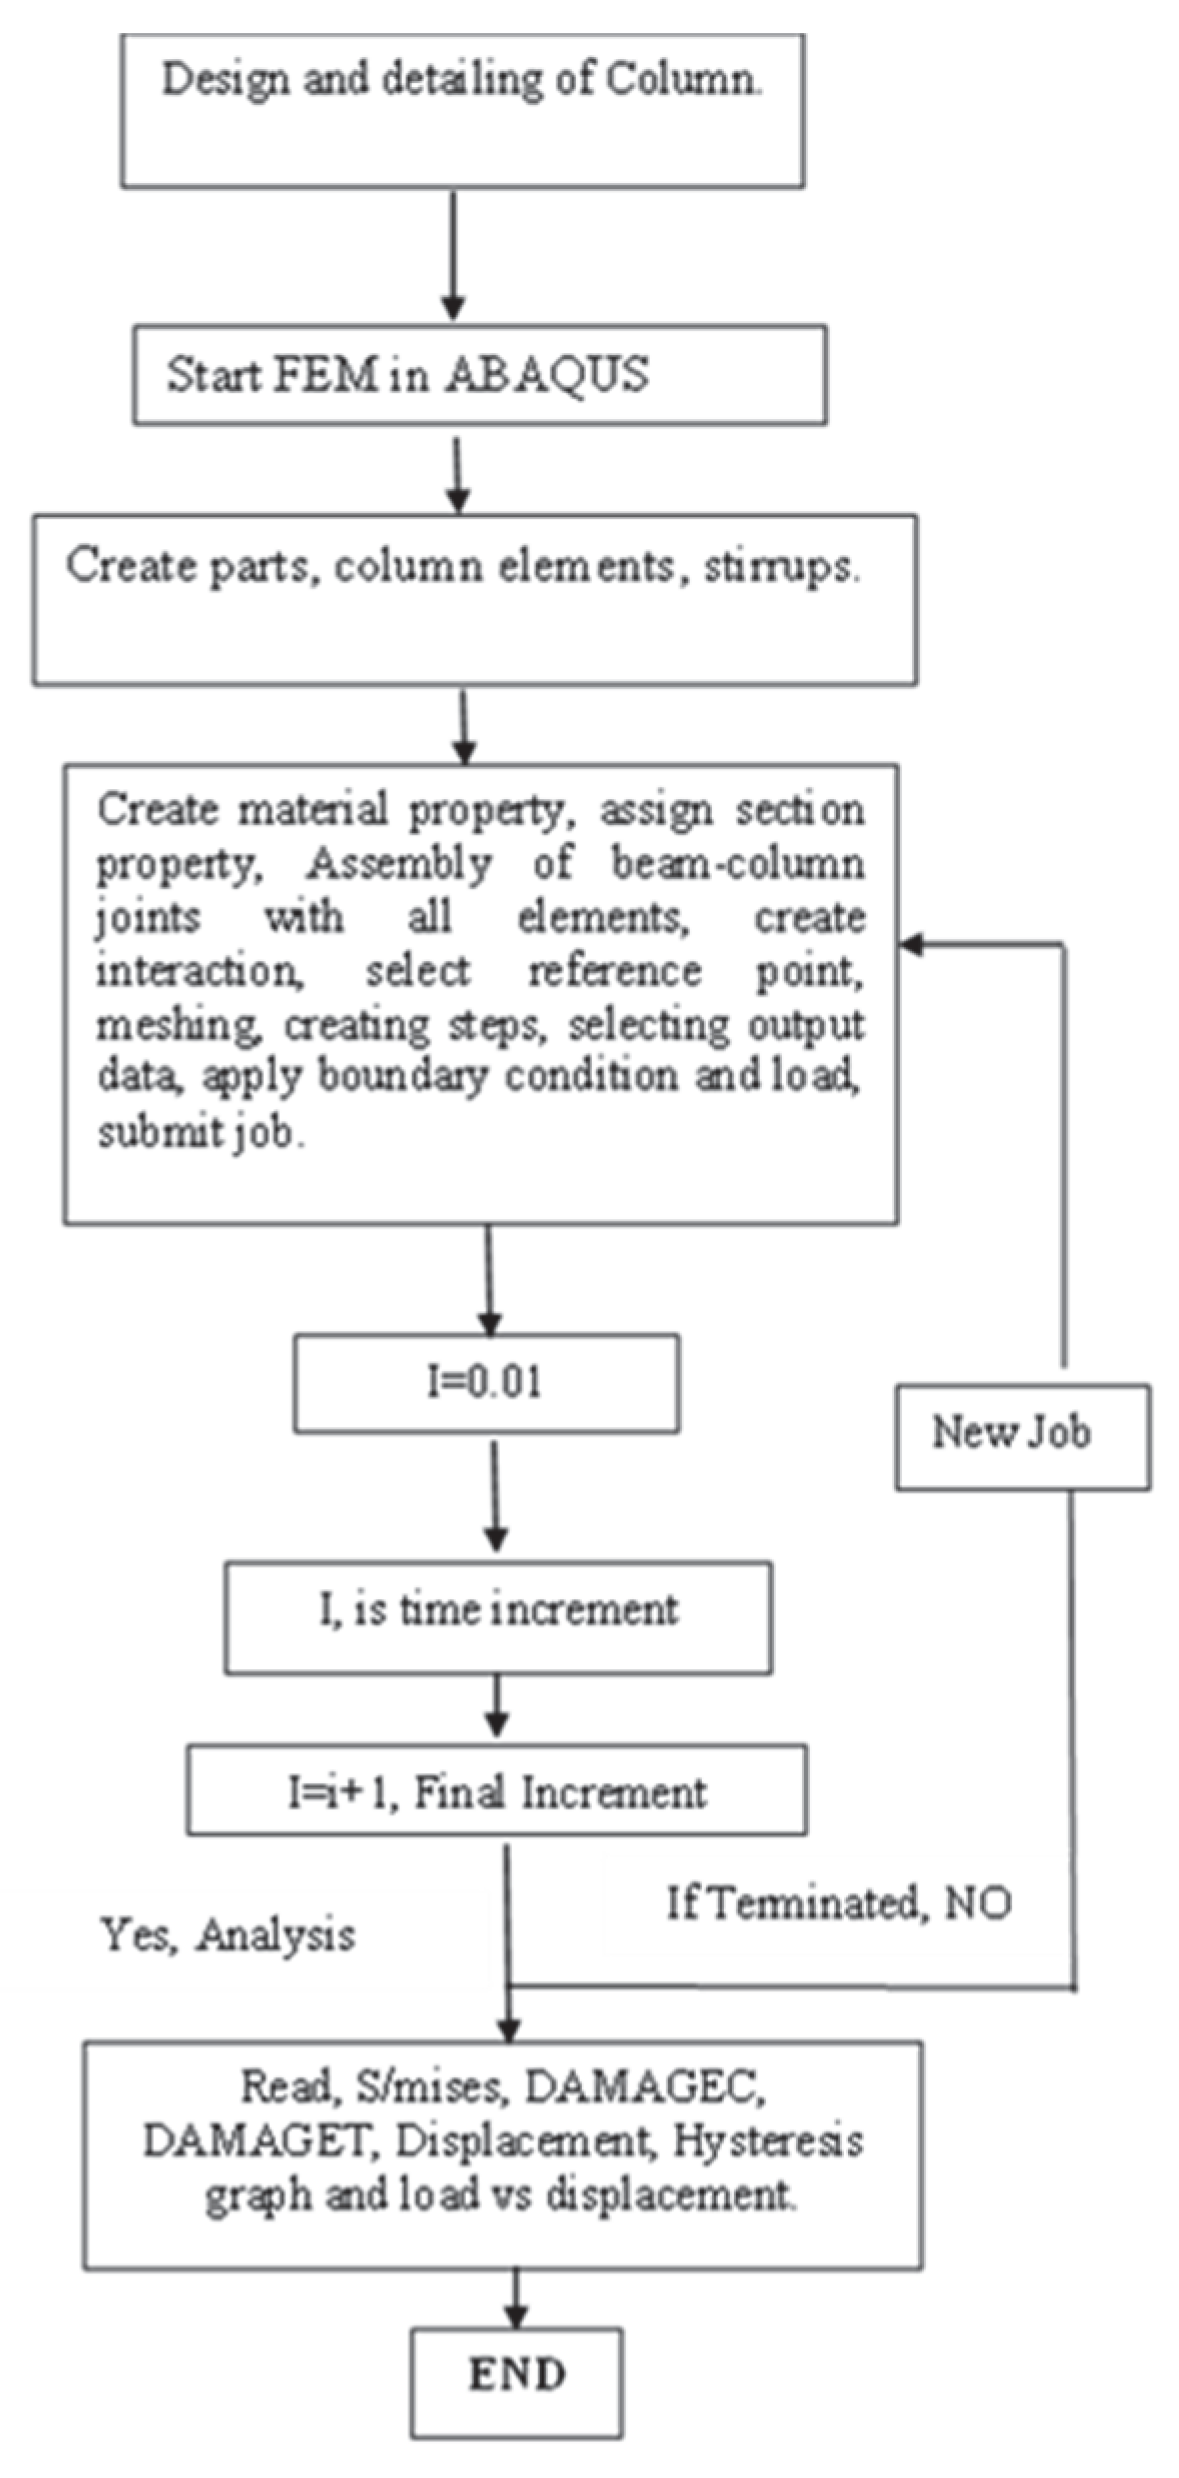
A nonlinear analysis was performed using the software program “ABAQUS” to assess the response of the reinforced columns with steel and GFRP reinforcement under axial compression. Figure 6 graphically illustrates the analysis procedure.

2.2.2. Assignment of Material Properties

In the numerical model, assigning material and section properties to each part is essential. Each region of the deformable body requires a specific section property, which includes the material definition for the region. Table 5 shows the material properties used in numerical analysis. In ABAQUS, three constitutive models are available to describe the inelastic behavior of concrete; one of them is the CDP model [5]. The CDP model is best known for its comprehensive representation of plastic behavior, which includes compressive and tensile responses, damage effects, and confinement mechanisms. This model can provide accurate results compared with the other two models. Unlike steel, concrete exhibits nonlinear performance in both compression and tension from the outset. Table 6 lists the CDP properties used in the analysis.

2.2.3. Modeling and Assembly of the Parts

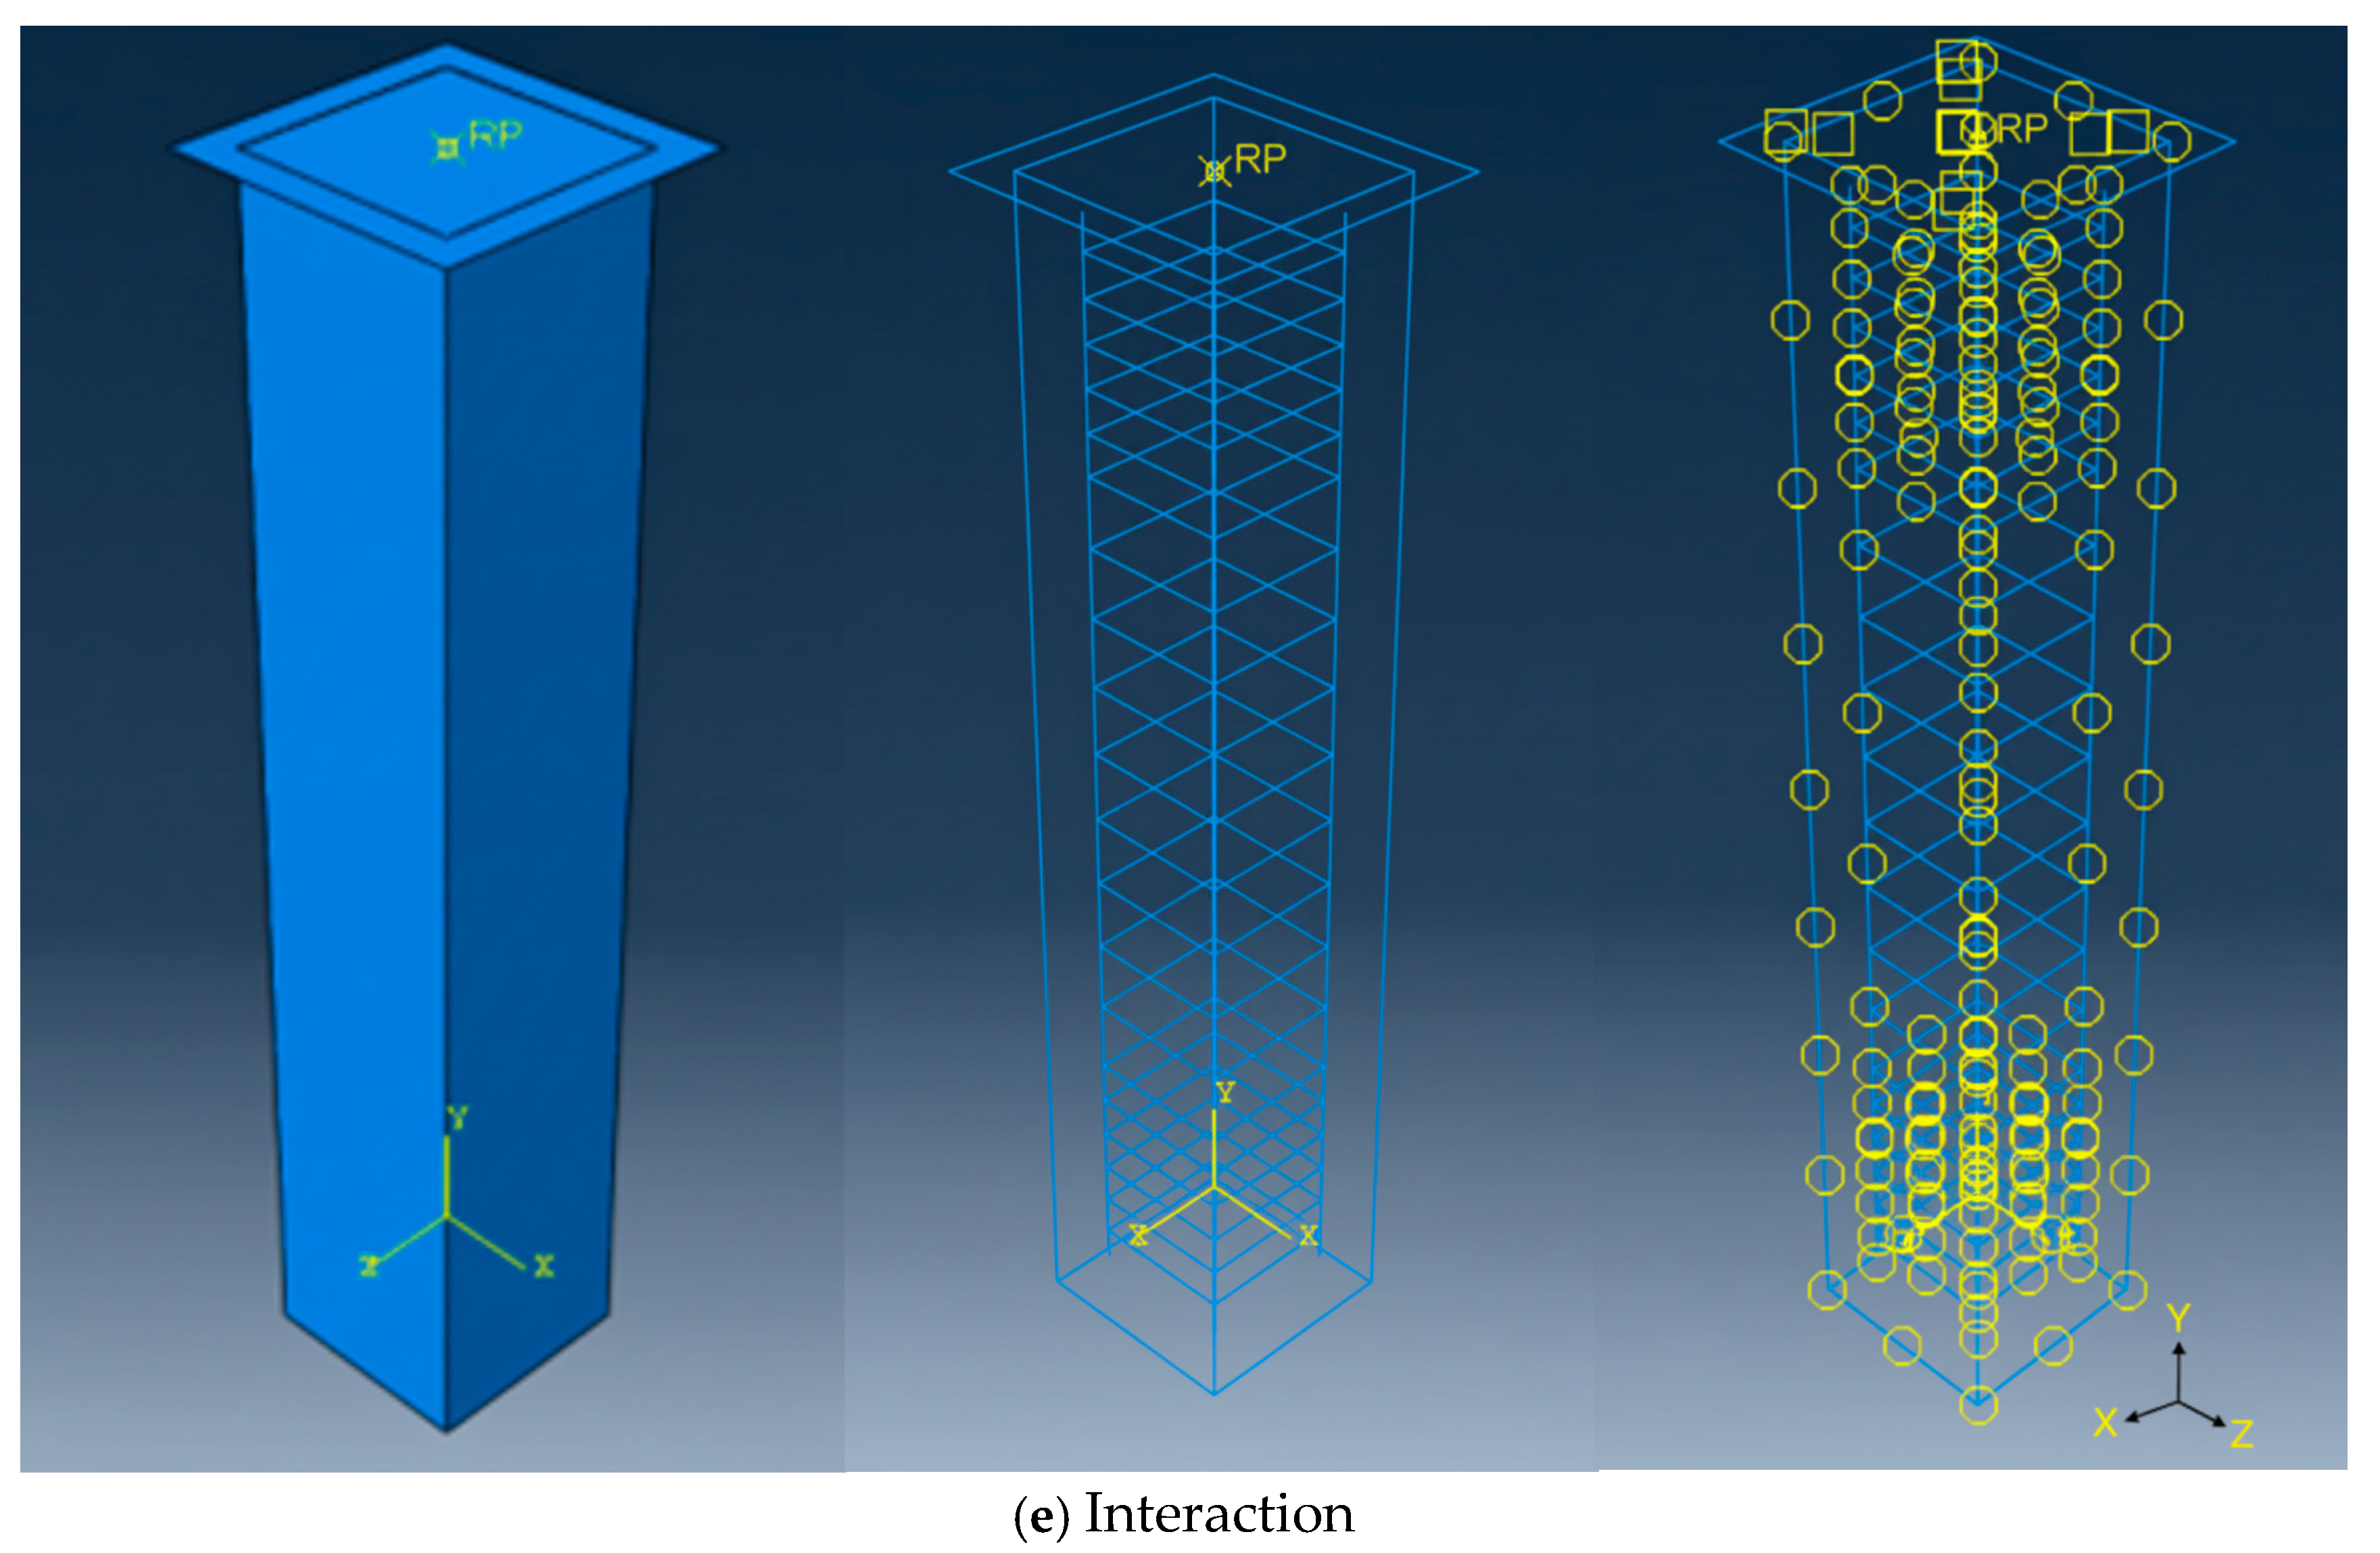
The numerical model of the column joint is created using the ABAQUS finite element software. This powerful software can also handle nonlinear and dynamic analysis methods. The column has a cross-sectional size of 150 mm × 150 mm and a height of 850 mm. The column is reinforced with 10 mm and 8 mm main steel and GFRP bars. The stirrup spacing varies between 50 mm and 75 mm. M30-grade concrete is used in different models. As an important region, the loading plate with dimensions of 200 mm × 200 mm, which is considered a rigid body, is placed at the top surface of the column. Figure 7a–e show the parts and assembly employed in this study. Using the embedded region constraint interaction parameter, a connection was made between the concrete and steel rebar. A surface-to-surface contact interaction was defined between the bottom of the loading plate and the top of the column.

2.2.4. Boundary Conditions, Loading and Meshing

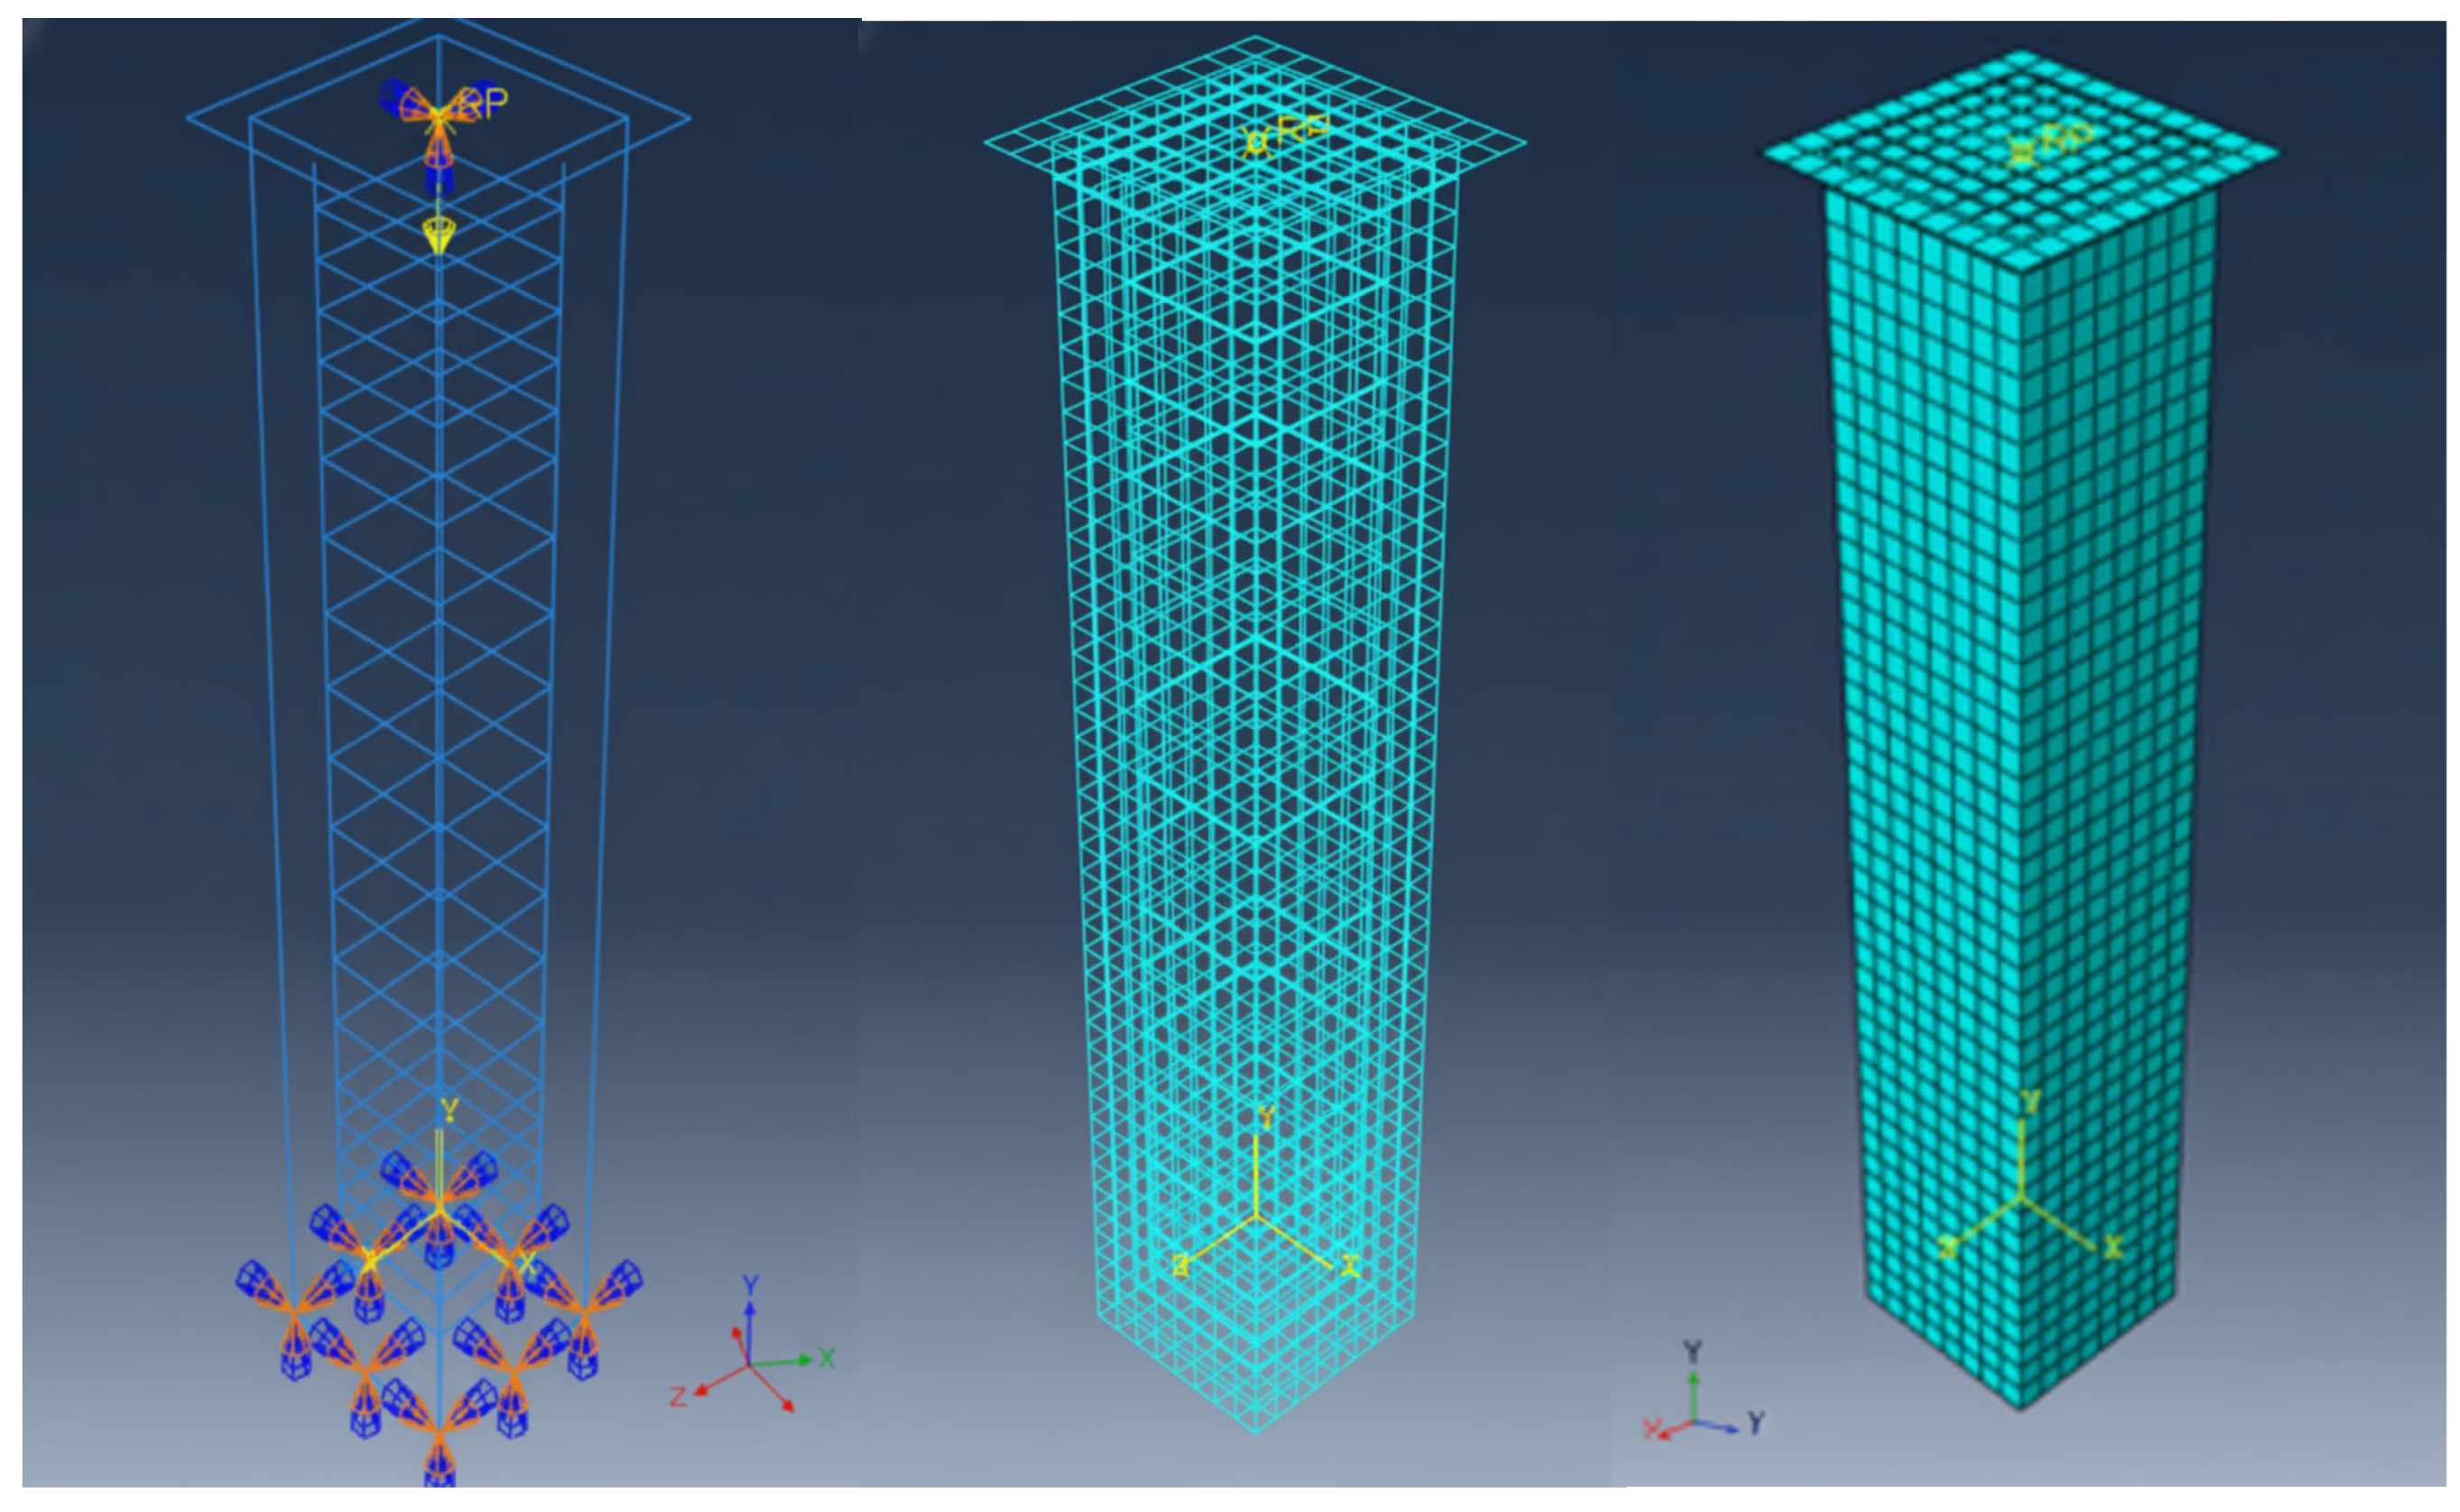
As per ACI 440 [25] the software analysis is based on assumption of the perfect bond between GFRP bar and concrete ignoring the slip. The mesh arrangement for the model was performed in such a way that the mesh size is similar for each element. A suitable mesh size was assigned to the column to protect the constituency in the element shape. An average mesh size of 20 mm is used. The column is concentrically loaded, and the loading plate distributes the load to the components of the composite column. The load is applied at the center of the rigid loading plate and boundary condition is considered as both ends rigid. Finally, a job is created, and a model is analyzed. Figure 8 shows the boundary conditions, loading, and meshing of the specimens used in this study.

2.2.5. Numerical Output

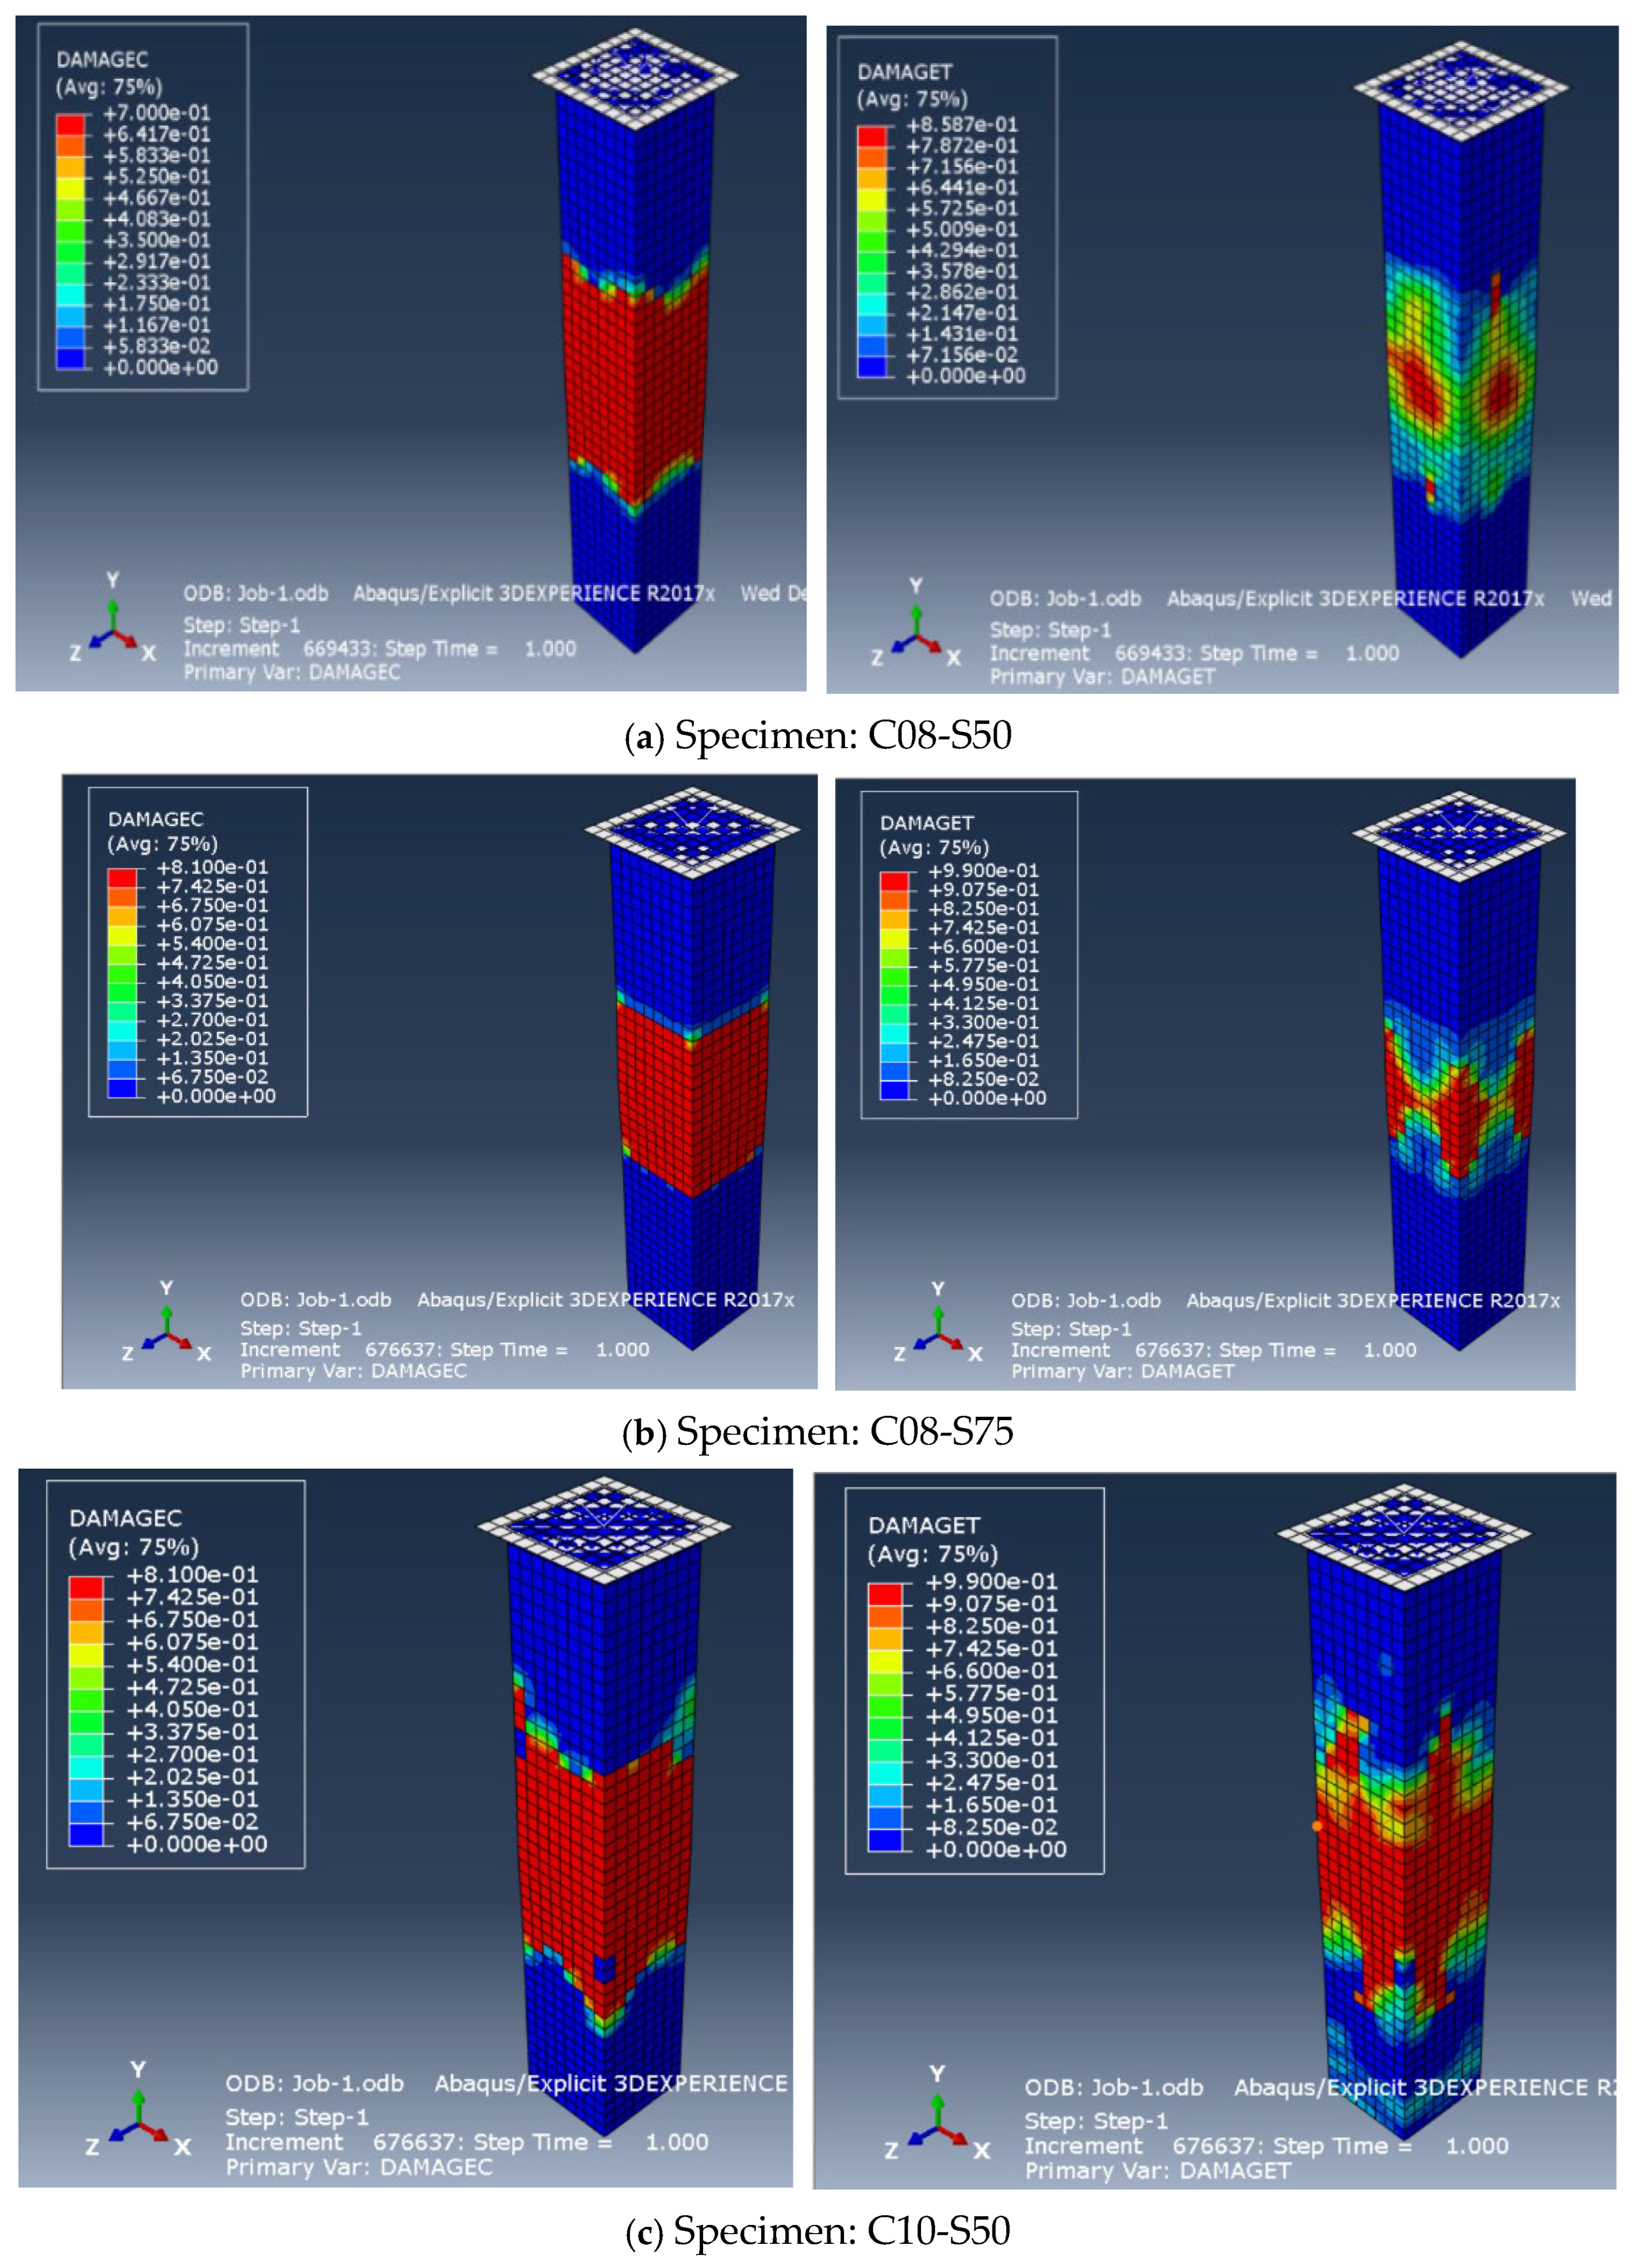
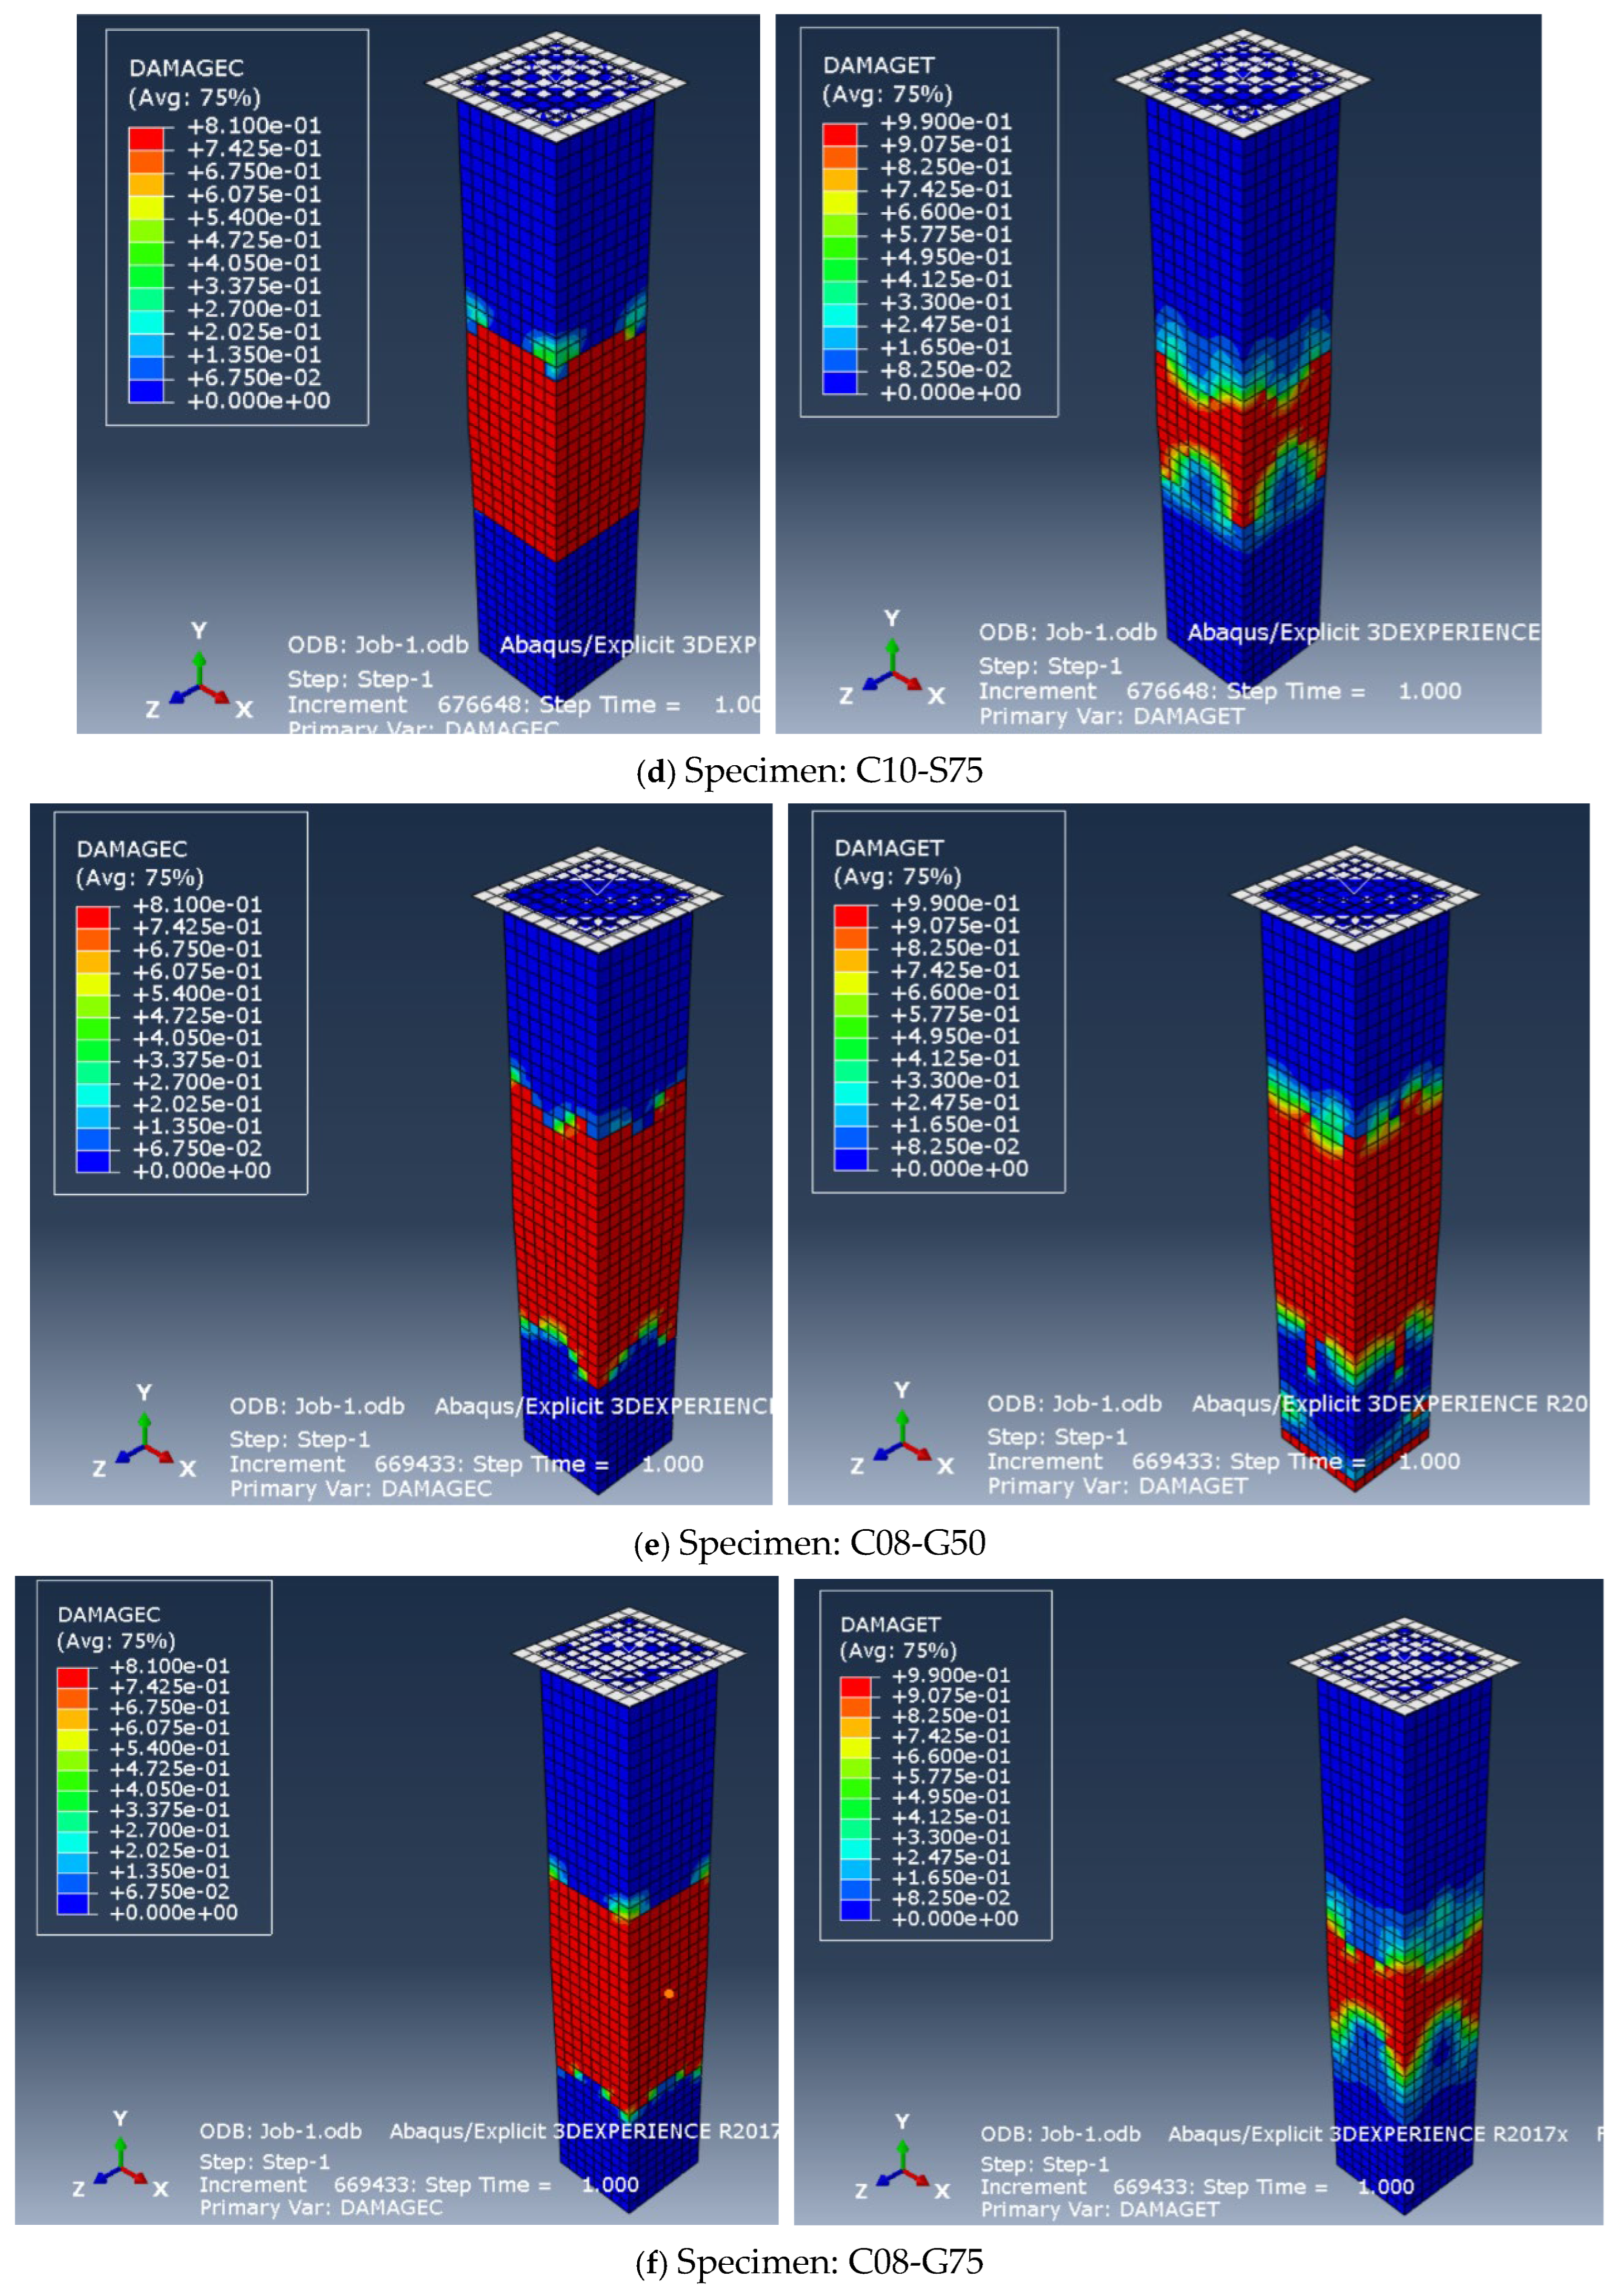
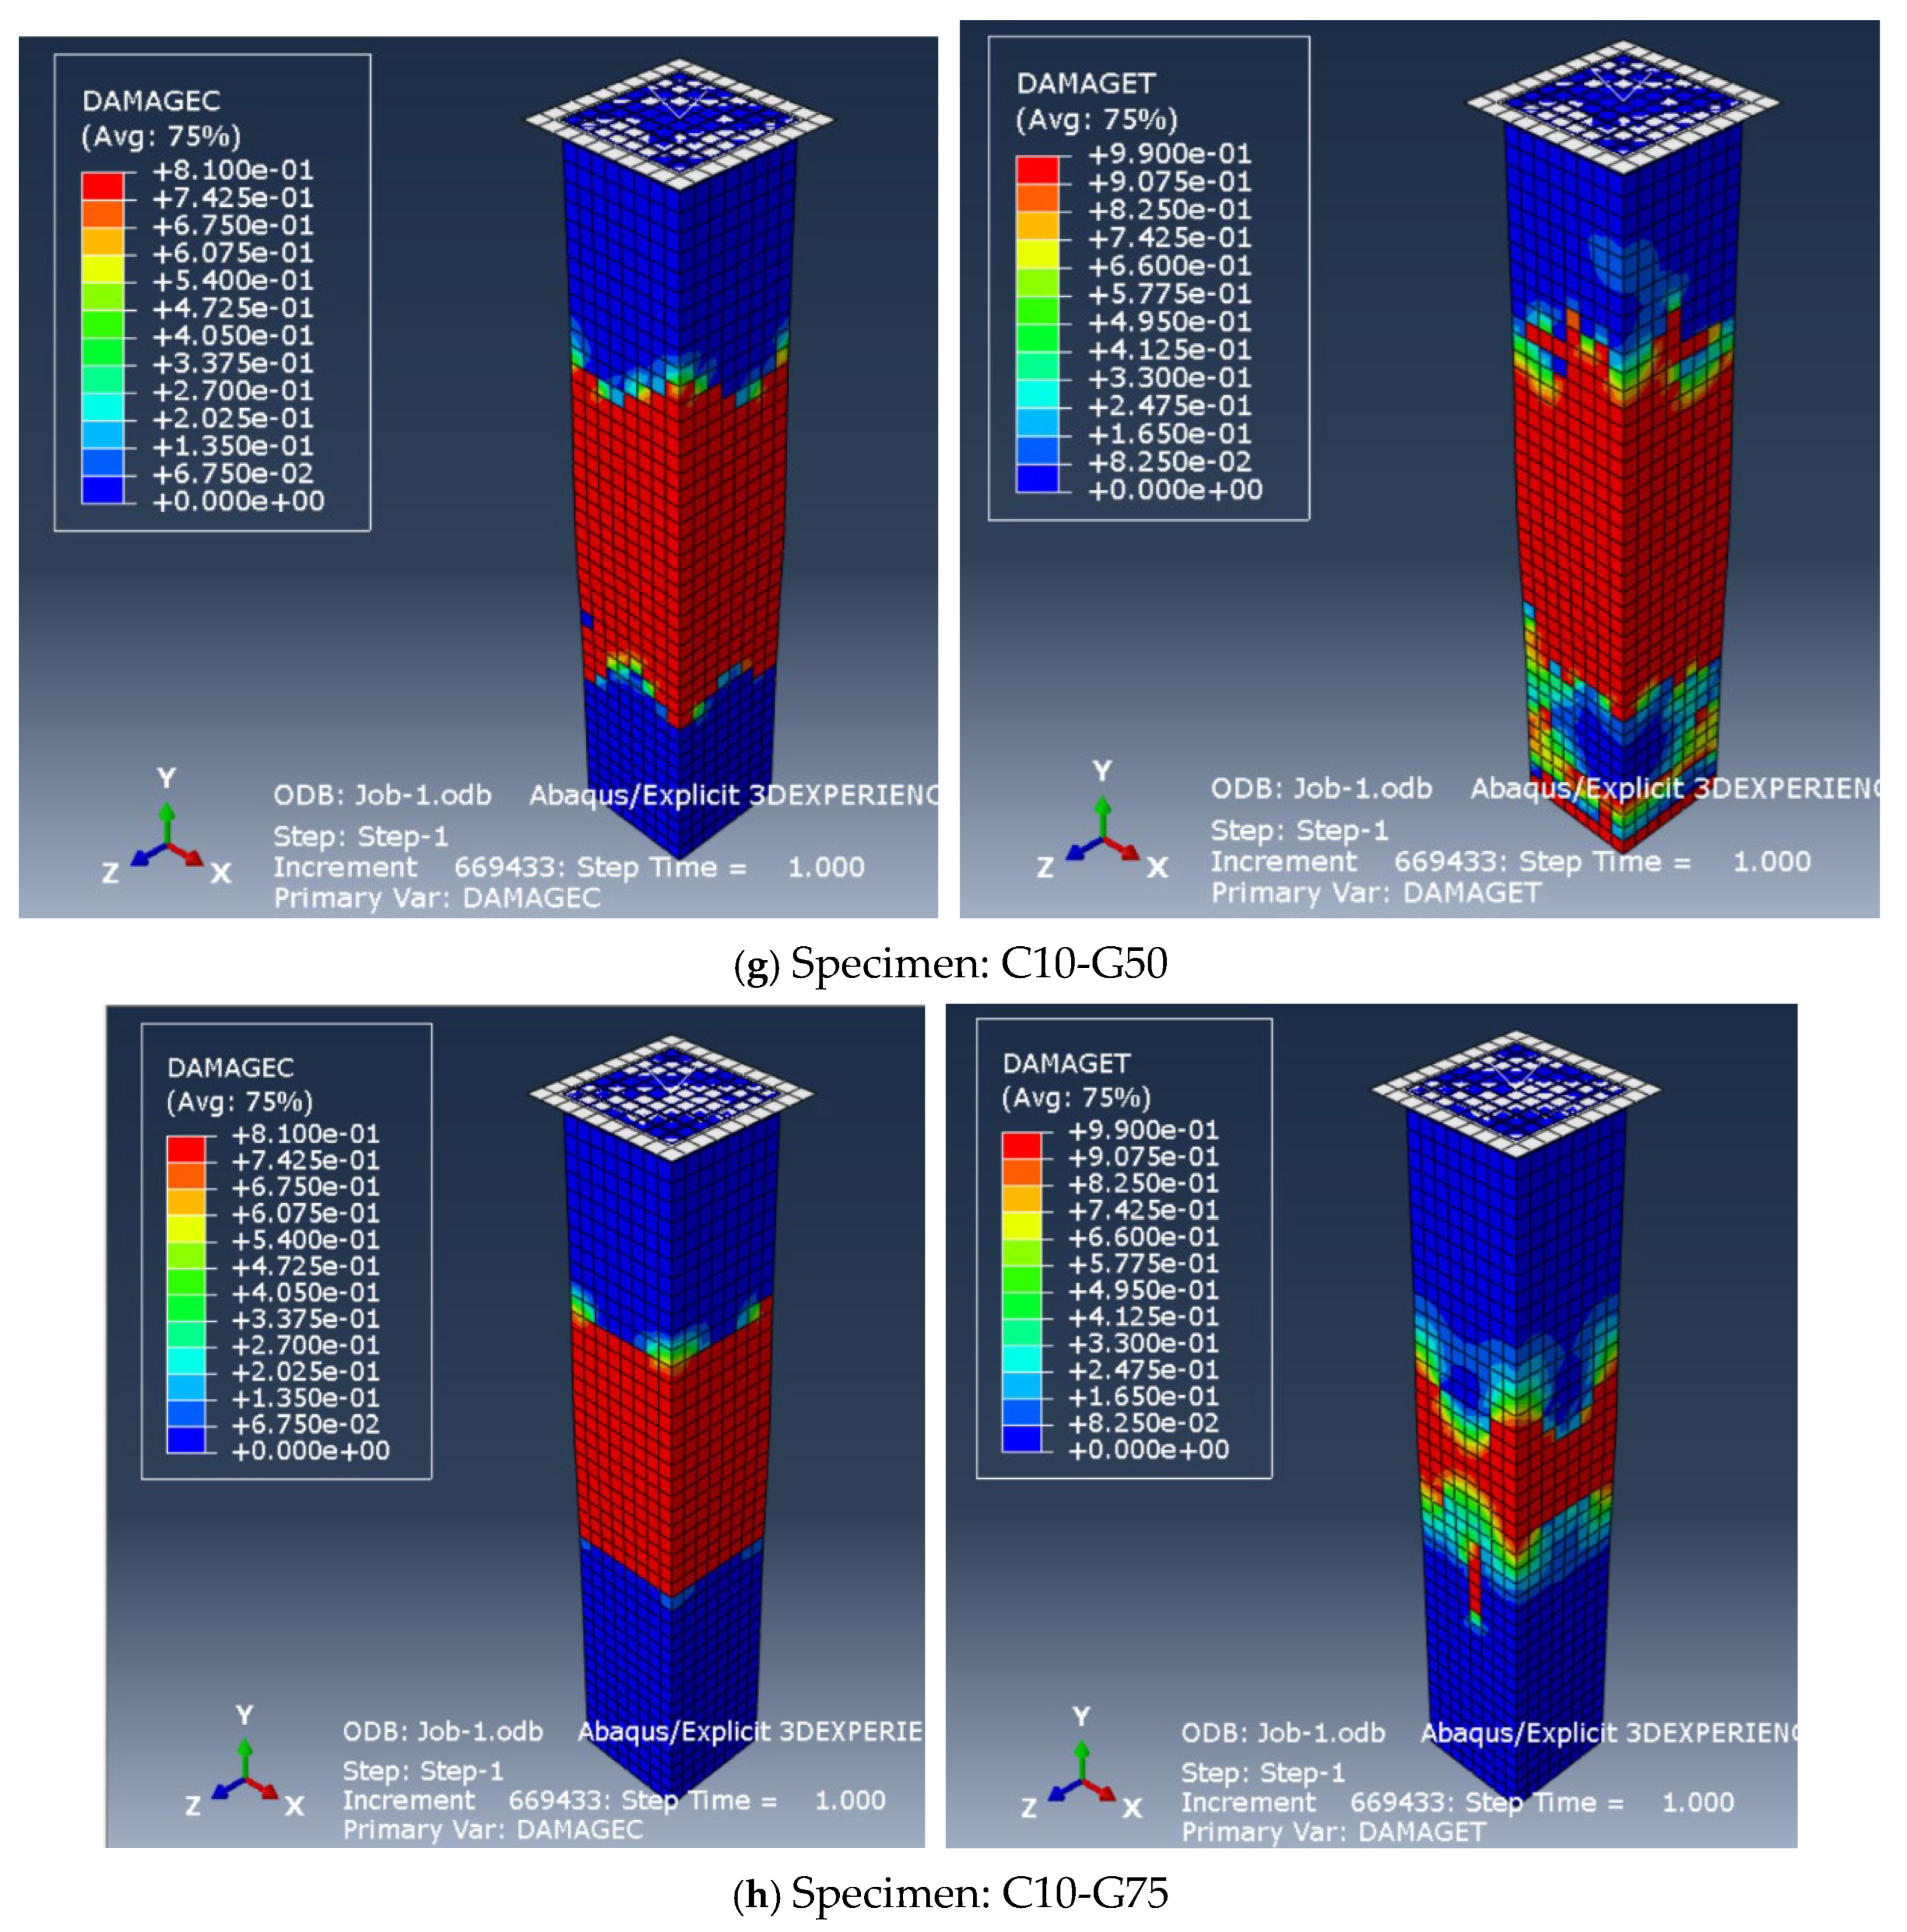
The DAMAGEC and DAMGET parameters are taken from the ABAQUS software and are used to indicate compression and tension damage in the concrete, steel, and GFRP rebars. The outputs defined in this step can be plotted in graphs. As such, load vs. displacement graphs are plotted and compared. Figure 9a–h show the DAMAGEC and DAMGET of specimens observed in this study for different specimens with varying spacing.
Figure 9a shows the compressive and tensile damage for a column reinforced with 8 mm steel bars with a stirrup spacing of 50 mm. The analysis shows significant compression damage in the center, decreasing toward the top and bottom. Clear zones of tensile damage are observed, particularly around the mid-section, indicating possible crack development or tensile failure in these areas. In Figure 9b, with 8 mm steel reinforcement and 75 mm stirrup spacing, compressive damage evidently increases in the middle of the span and decreases near the top and bottom. The tensile damage occurs in a certain area in the central part, while the damage in the upper and lower areas is minimal. Reduced stirrup spacing shows that more compressive cracks are distributed near the bottom, and tensile cracks are distributed over the mid-span and the lower part of the column. Figure 9c and Figure 9d show the behavior of columns reinforced with 10 mm steel bars and with a stirrup spacing of 50 mm and 75 mm, respectively. In both cases, critical compressive and tension damage occurs in the middle of the span. Figure 9e and Figure 9f show the behavior of the columns reinforced with 8 mm GFRP bars with a stirrup spacing of 50 mm and 75 mm, respectively. Compared with the steel reinforcement, the tensile damage is greater in the middle of the span. By contrast, the compressive damage is less in the upper and lower parts of the column. Figure 9g and Figure 9h show the behavior of columns reinforced with 10 mm GFRP bars and having a stirrup spacing of 50 mm and 75 mm, respectively. Decreased spacing is observed to increase the peak load and change the tensile and compressive damage patterns. The specimen with 75 mm spacing shows concentrated tensile damage in the mid-span, and the specimen with 50 mm stirrup spacing shows distributed tensile and compressive damage in the mid-section.

2.3. Analytical Method

2.3.1. Prediction of the Ultimate Load

The ACI 440 guidelines [25] for FRP-reinforced members do not consider the compressive loads absorbed by GFRP bars. The maximum load-carrying capacity for such a composite column can be calculated using the formula given in Equation (2). Equation (1) shows the formula that accounts for the contribution of the reinforcement in the composite section.
P u = 0.85   f c A g A s + f y A s   ( for   steel-reinforced   composite   columns )
P u = 0.85   f c A g A f   ( for   FRP-reinforced   columns )
where
A g = G r o s s   c r o s s   s e c t i o n a l   a r e a
A s = A r e a   o f   t h e   m a i n   s t e e l   r e i n f o r c e m e n t
A f = A r e a   o f   t h e   F R P   r e i n f o r c e m e n t
f c = S t r e n g t h   o f   t h e   c o n c r e t e   u n d e r   c o m p r e s s i o n
f y = Y i e l d i n g   s t r e s s   o f   t h e   s t e e l   r e i n f o r c e m e n t
Tests on FRP-reinforced columns have shown that Equation (1) underestimates the capacity of the column with FRP reinforcement and that the contribution of FRP can be considered when calculating the maximum load by setting compressive resistance at 0.35 times the maximum tensile stress of the FRP. Equation (1) can be modified as follows as shown in Equation (3):
P u = 0.85   f c A g A s + 0.35   f f A f
f f = m a x i m u m   t e n s i l e   s t r e s s   o f   t h e   F R P   r e i n f o r c e m e n t
According to the Indian Standard code IS 456:2000, the minimum reinforcement ratio for columns with steel reinforcement is not less than 0.8% of the gross cross-sectional area of the structural member. This amount of reinforcement is required to absorb the bending moment in the column owing to the possible eccentricity mentioned above and to prevent passive yielding of the steel. As GFRP does not yield, the literature specifies a minimum reinforcement ratio of more than 1% for GFRP-reinforced composite sections. The equation for calculating the maximum load on GFRP-RC columns is not available in the Indian standard. In this study, the design equation for GFRP-RC columns was developed considering the provisions of the Indian Standard code. As mentioned in the Indian standard (IS456:2000), the load-bearing capability of short columns under axial loading supported by steel rebars is given by Equation (4), considering partial safety factors.
P u = 0.4   f c A c + 0.67   f y A s
With reference to (Equations (3) and (4)), the new Equation (5) for GFRP-RC columns with reference to the Indian context is given as follows:
P u = 0.4   f c A c + 0.35   f f A f
Many scholars have considered the linear stress–strain behavior of GFRP to calculate the maximum compressive load for FRP-reinforced members as a function of the axial strain of the GFRP bars. Based on this approach, Equation (5) can be modified as follows:
P u = 0.4   f c A c + ε f E f f f A f
Here,
ε f = S t r a i n   a t   u l t i m a t e   l o a d
E f = E l a s t i c   m o d u l u s   o f   t h e   G F R P   b a r

2.3.2. Ductility Index

The ductility index is the ability of a structure to deform plastically before failure. A higher ductility index indicates a greater ability of the structure to absorb energy beyond the elastic limit. In the design of earthquake-resistant structures, ductility is an important property that allows the structure to deform significantly without sudden failure.
Table 7 shows that the ductility of GFRP-reinforced columns is lower compared with steel-reinforced columns owing to the lower modulus of elasticity of the GFRP bars. However, reducing the spacing from 75 mm to 50 mm increased the ductility by 12%. Different formulas and approaches can be used to calculate the ductility index, including the following:
  • Displacement ductility index (μ∆).
  • Curvature ductility index (μφ).
  • Energy-based ductility index.
The displacement ductility index approach is generally used for experimental studies.
μ∆ = ∆u/∆y
∆u = Maximum displacement.
∆y = Displacement at the yield point.
As the GFRP reinforcement does not have a clear yield point, the ductility index of a GFRP-RC column is specified as follows based on the axial deformation according to the studies by Tu et al. [18]:
μ∆ = ∆0.85P/∆P
∆0.85P = the axial deformation defined at an axial load corresponding to 85% of P m a x .
P = axial deformation at Pmax.

3. Results and Discussion

3.1. Experimental Study: Load-Deflection Performance and Failure Pattern

(a)
Specimens with a spacing of 50 mm (6db) and a reinforcement ratio of 1%
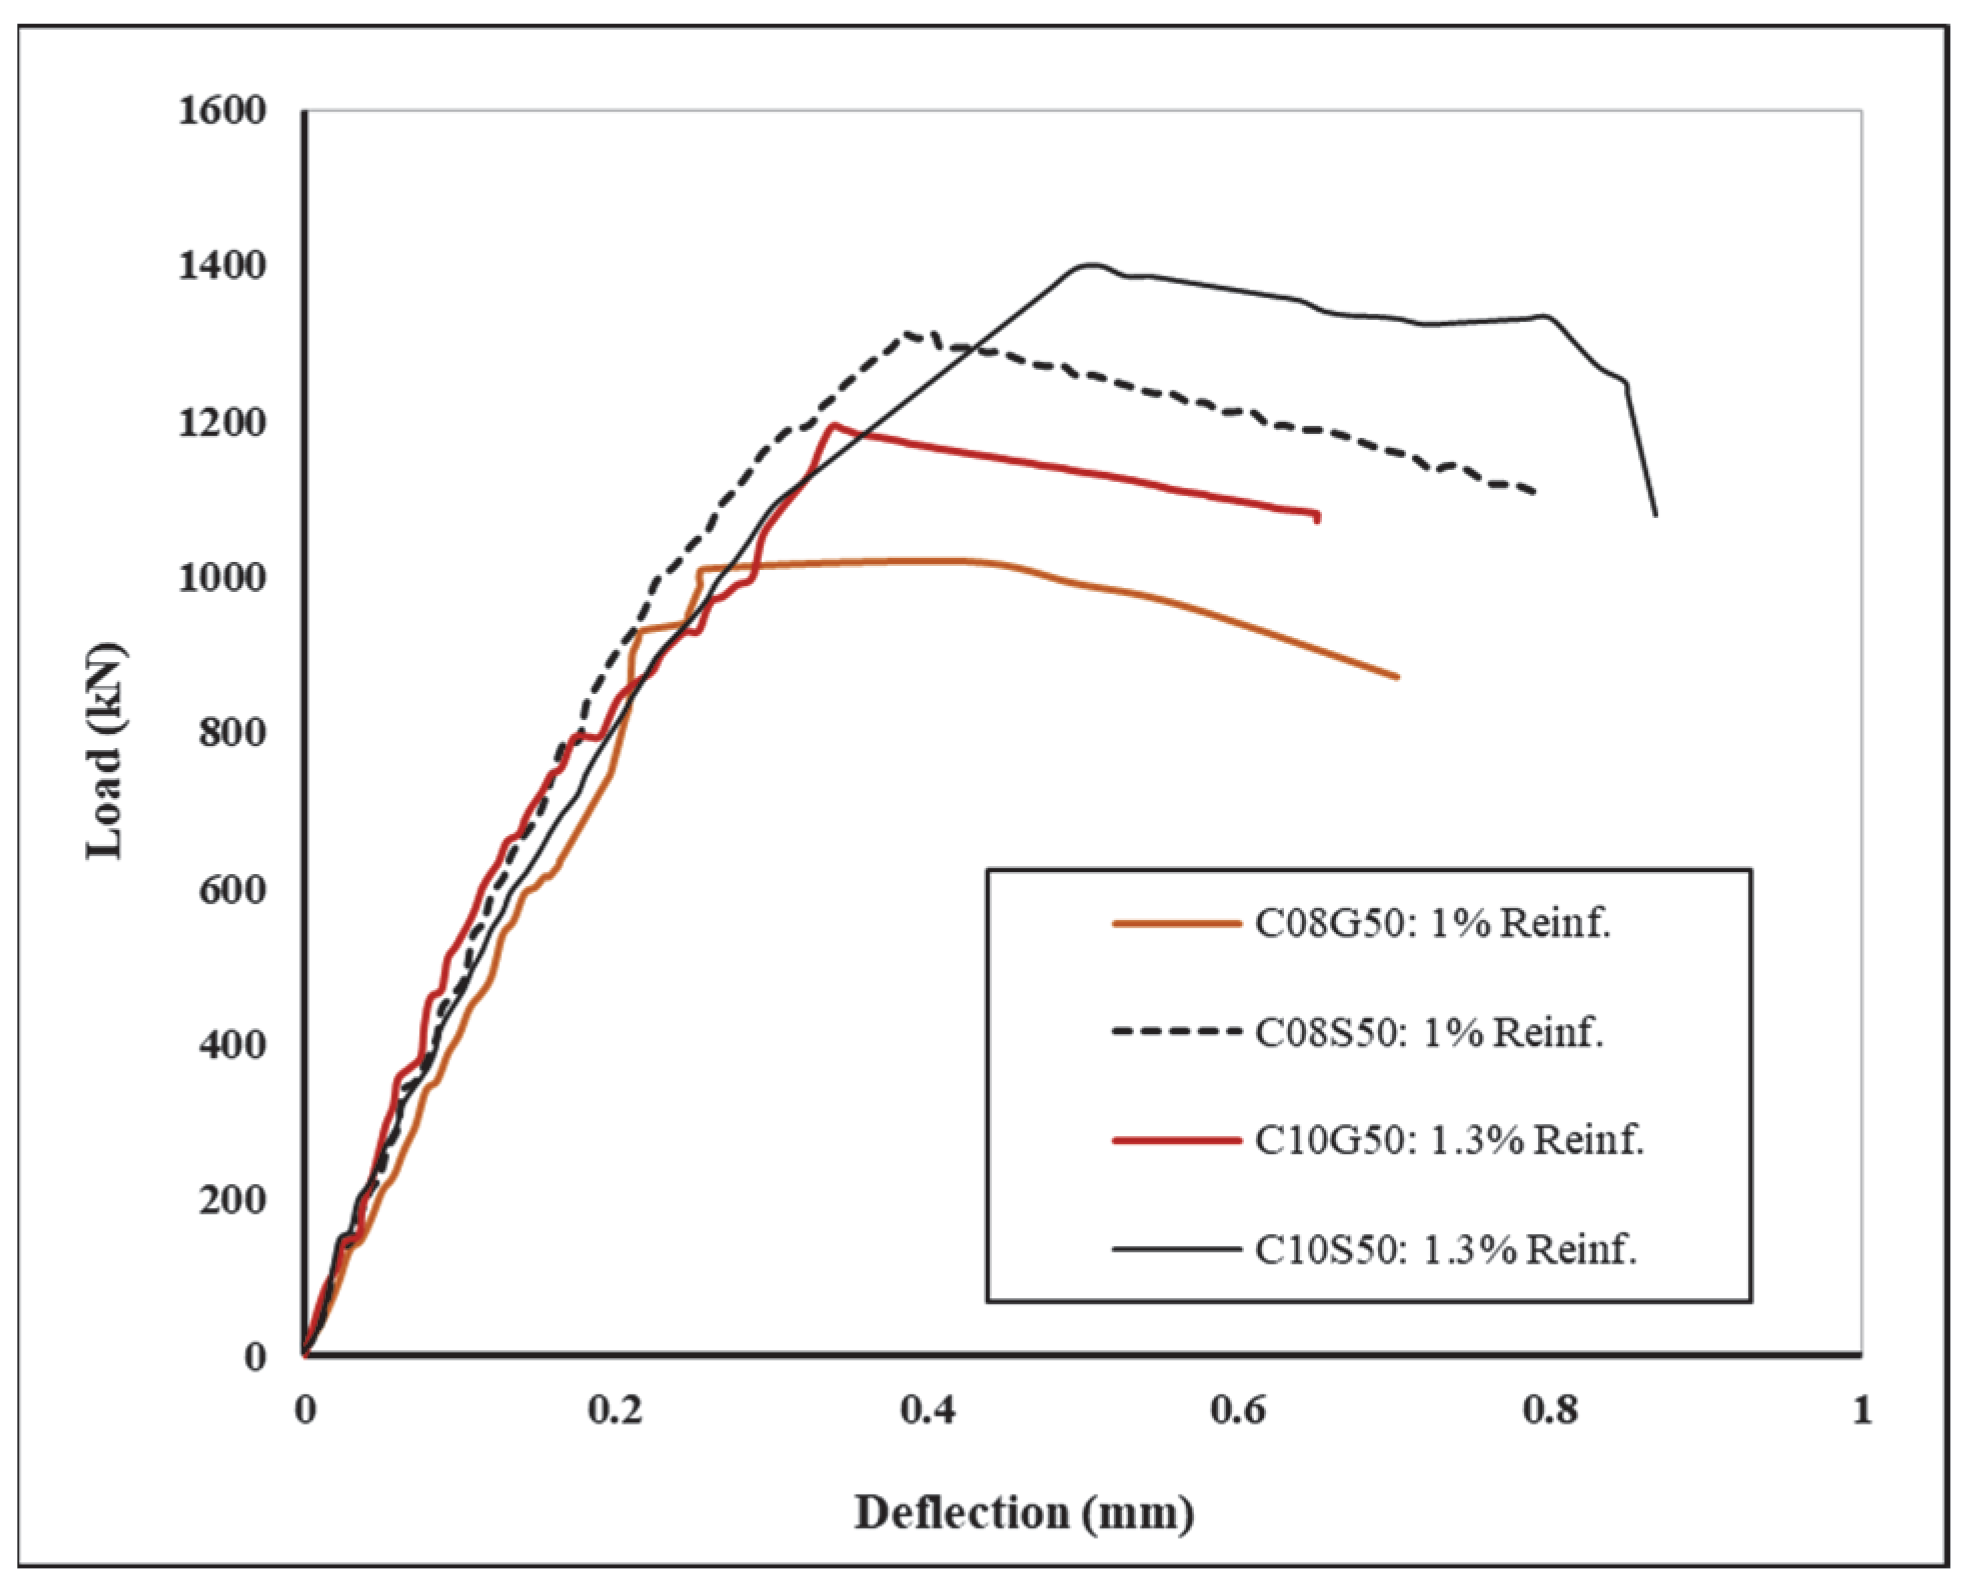
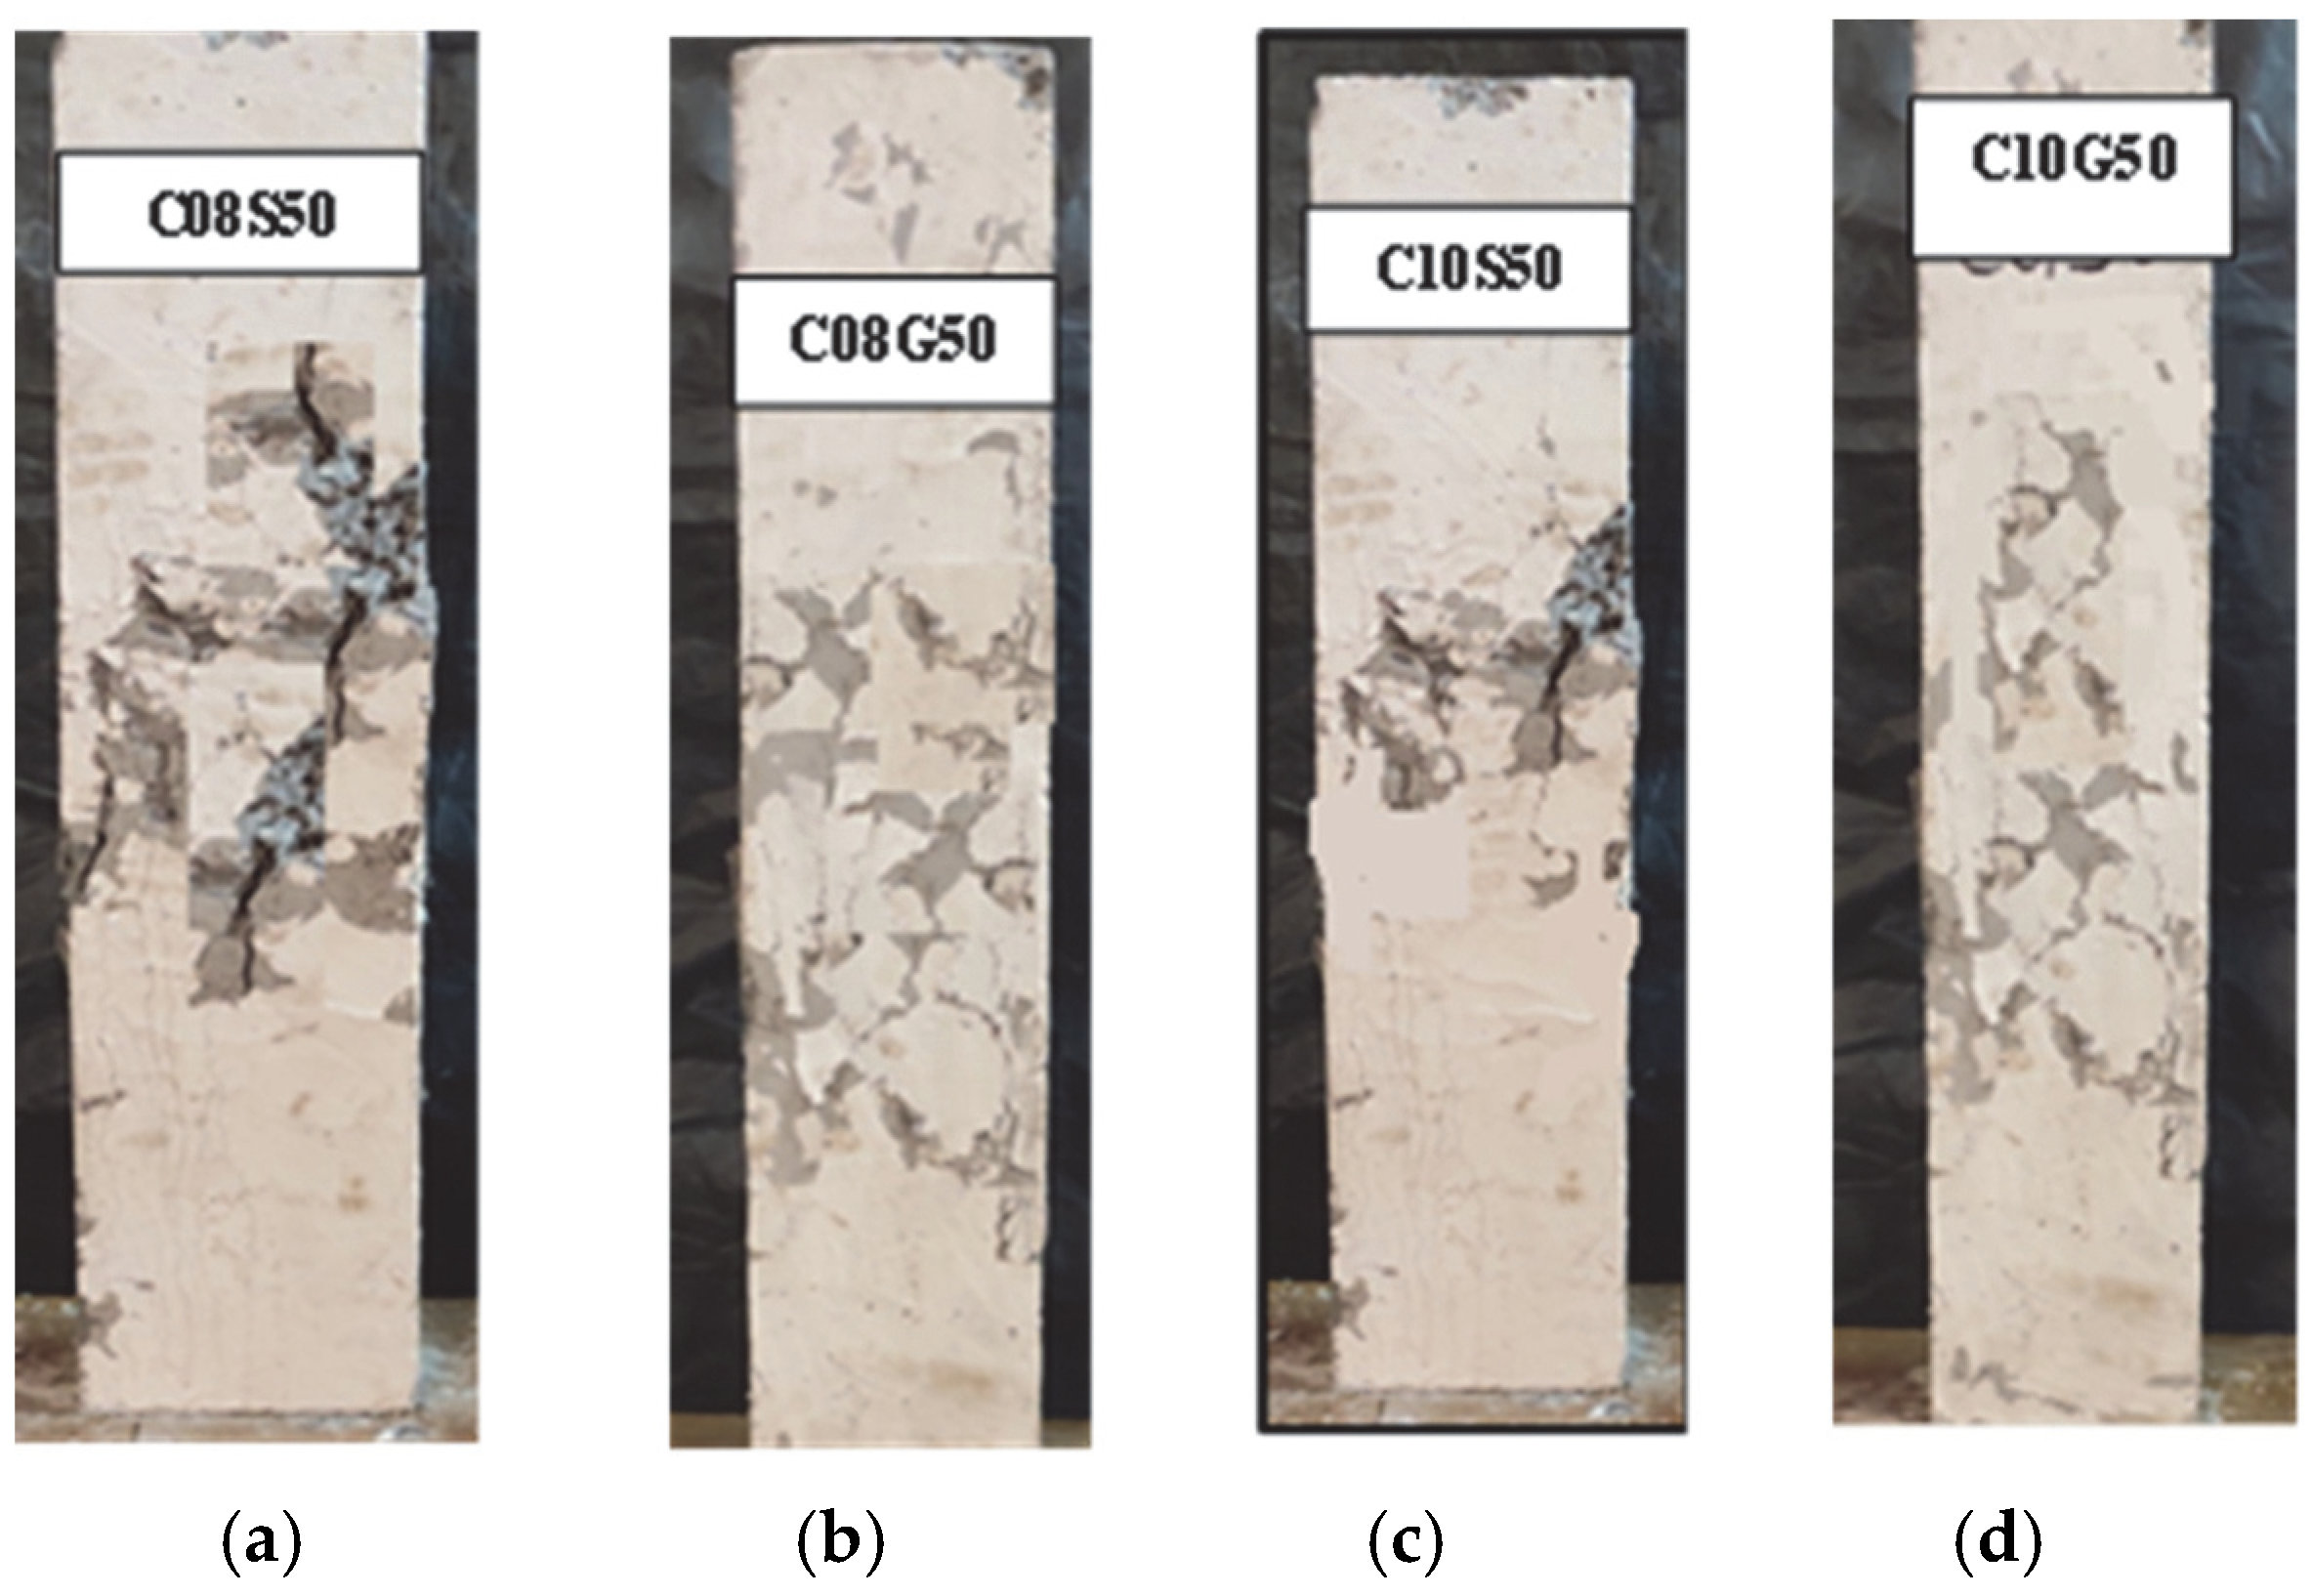
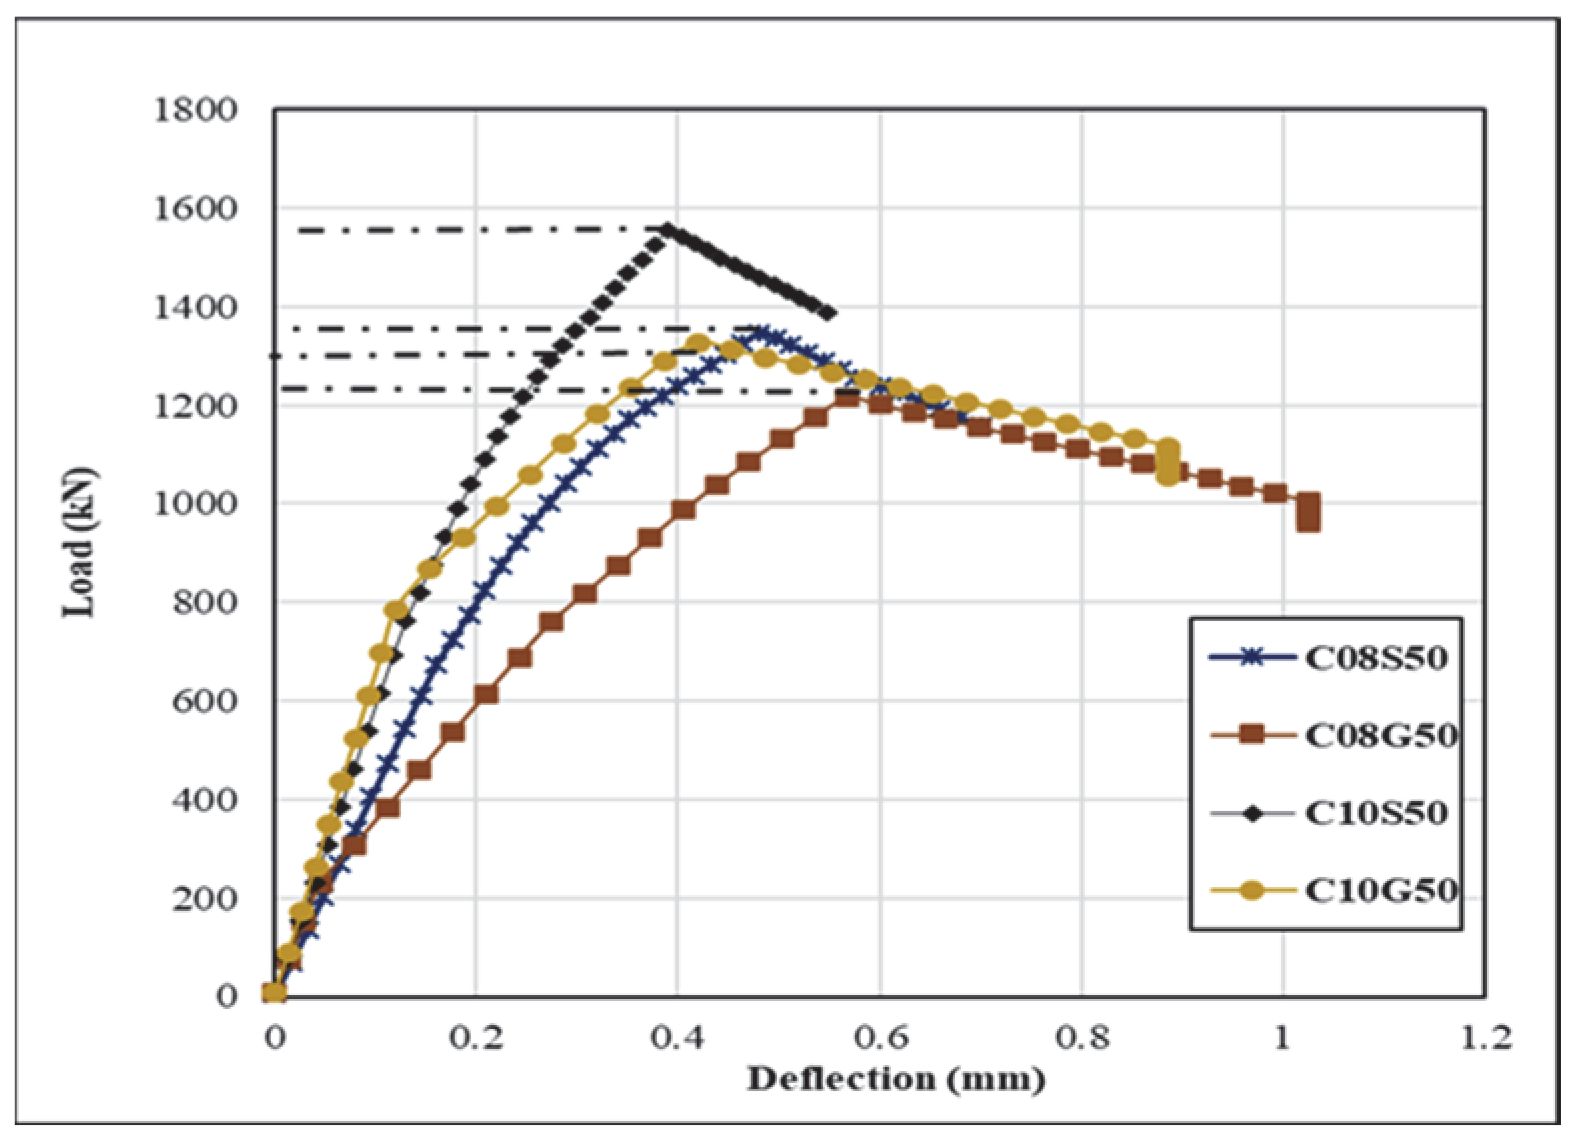
Column specimens C08S50 and C08G50, reinforced with 8 mm diameter (db), i.e., 1% reinforcement of steel and GFRP bars, respectively, were cast and tested after curing. The load-deflection performance is presented in Figure 10, and the failure patterns are described in Figure 11a,b. In the steel-reinforced columns, compression occurred on both sides. As the load increased, tensile cracks developed and propagated to the lower side of the column. The GFRP-reinforced column had a 20% lower load-carrying capacity compared with the steel-reinforced column, and initially, concrete crushing occurred near the mid-span, followed by scattered tensile cracks.
(b)
Specimens with a spacing of 50 mm (5db) and a reinforcement ratio of 1.3%
Column specimens C10S50 and C10G50, reinforced with 10 mm diameter (db), i.e., 1.3% reinforcement of steel and GFRP bars, respectively, were cast and tested after curing. The load-deflection performance is presented in Figure 10, and the failure patterns are described in Figure 11c,d. In the steel-reinforced columns, compression initially occurred on both sides, and tensile cracks began to develop as the load increased. The load-carrying capacity was 8% higher compared with that of a column with 1% reinforcement. The GFRP-reinforced column showed a 15% higher load-carrying capacity compared with a column with 1% reinforcement. Initially, concrete crushing occurred near the mid-span, followed by tensile cracking at the top and bottom of the column. The GFRP-reinforced columns had a 15% lower load-carrying capacity than their steel counterparts with 1.3% reinforcement.
(c)
Specimens with a spacing of 75 mm (9db) and a reinforcement ratio of 1%
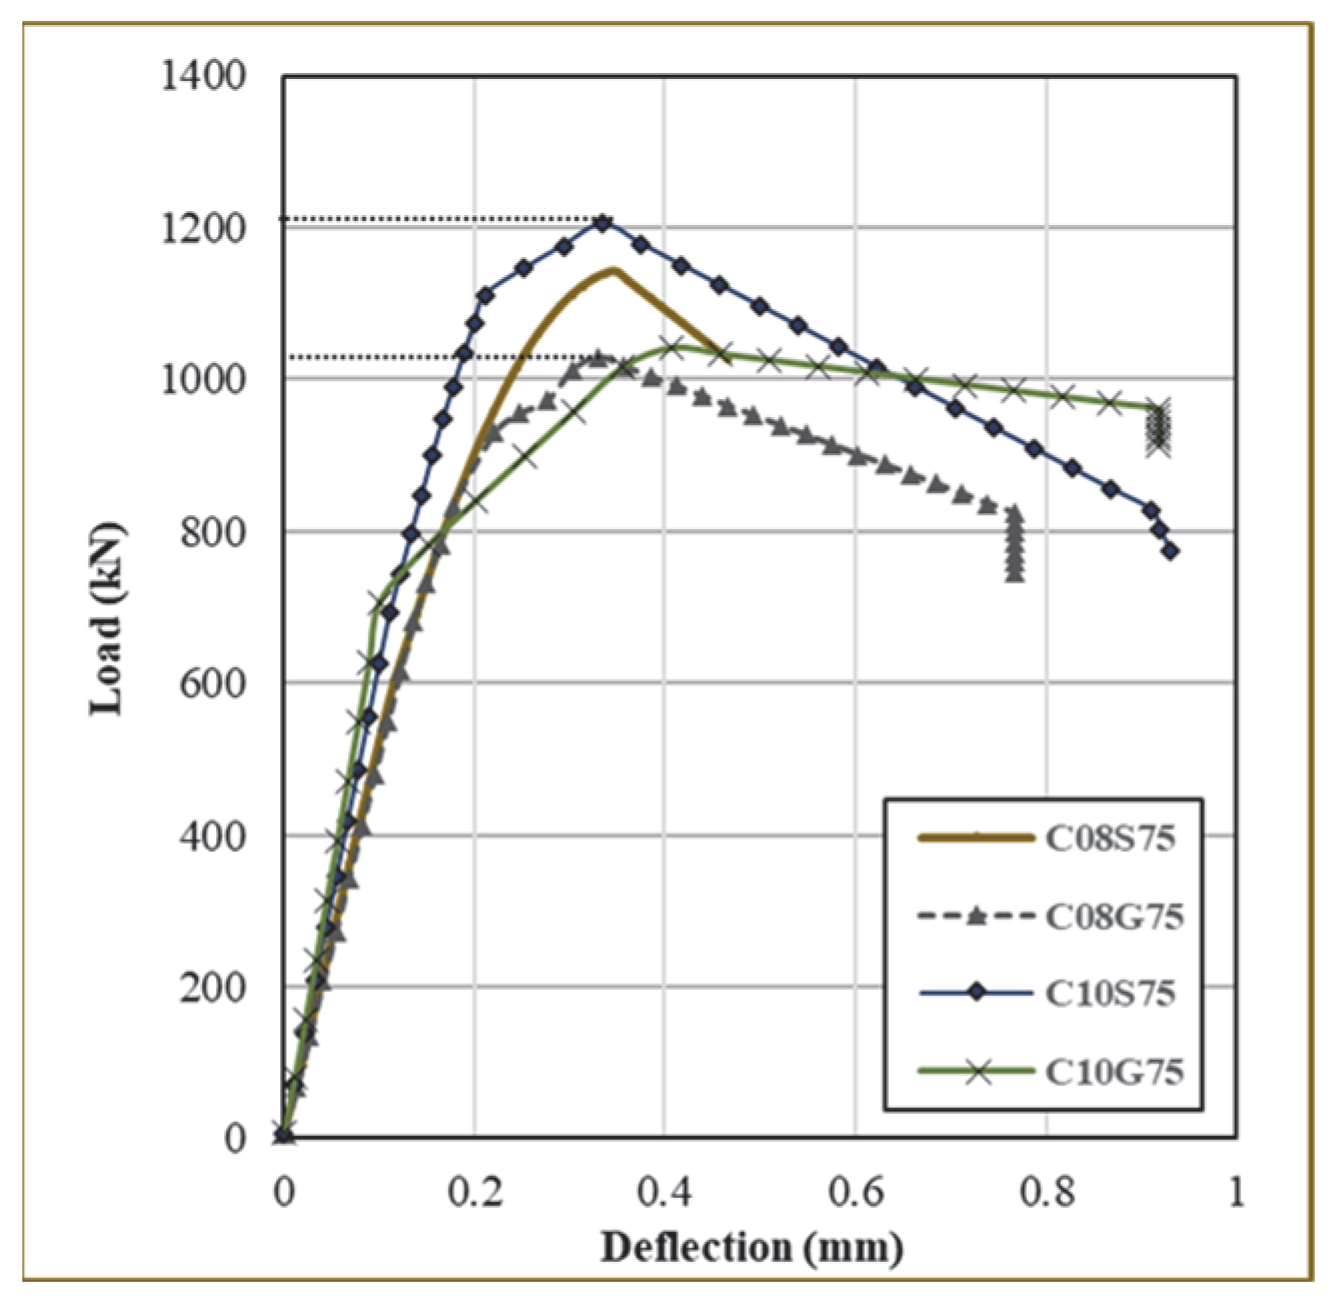
Column specimens C08S75 and C08G75, reinforced with 8 mm diameter, i.e., 1% reinforcement of steel and GFRP bars, respectively, were cast and tested after curing. The load-deflection performance is presented in Figure 12, and the failure patterns are presented in Figure 13a,b. In steel-reinforced columns, compression initially occurred on both sides. As the load increased, tensile cracking occurred and propagated to the upper side of the column. Diagonal shear cracks were also observed. The GFRP-reinforced column had a 12% lower load-carrying capacity compared with that of the steel-reinforced column and a 3% lower load-carrying capacity when the spacing between stirrups was 50 mm. Initially, concrete crushing occurred near the mid-span, followed by scattered shear cracking.
(d)
Specimens with a spacing of 75 mm (7db) and a reinforcement ratio of 1.3%
Column specimens C10S75 and C10G75 reinforced with 10 mm diameter, i.e., 1.3% reinforcement of steel and GFRP bars, respectively, were cast and tested after curing. The load-deflection performance is presented in Figure 12, and the failure patterns are described in Figure 13c,d. As the load increased, tensile and shear cracks began to develop in the steel-reinforced columns. The load-carrying capacity of the GFRP-reinforced columns was 4% higher than that of the columns with 1% reinforcement. The GFRP-reinforced column was 16% lower than that of the steel-reinforced column. Initially, concrete crushing occurred near the mid-span, followed by shear cracking at the top and bottom of the column. Compared to earlier research studies, the results of this study align with the trends observed by Afifi et al. [35] and Mohamed et al. [36], who concluded that FRP bars having limited axial capacity can improve the overall performance of compression members if it is confined properly. The load taken by GFRP observed in this study is 85–90%, which is slightly better than the 70–80% range reported by Tu et al. [18], is due to hybrid reinforcement and enhanced stirrup detailing. Additionally, the 12% increase in ductility observed by reducing stirrup spacing is similar to results presented by Alzoubi et al. [37] and Cao et al. [38], indicating critical role of confinement.

3.2. Numerical Results

Figure 14 shows that the load-bearing capacity of the 8 mm steel-reinforced column with 50 mm stirrup spacing is 1346 kN with a deflection of 0.48 mm. The load-bearing capacity of the 10 mm steel-reinforced column with 50 mm stirrup spacing is 1555 kN with a deflection of 0.39 mm. An increase of 13% was determined between the load-bearing capacities of these columns. The load-bearing capacity of an 8 mm GFRP-reinforced column with 50 mm stirrup spacing is 1216 kN with a deflection of 0.56 mm. The load-bearing capacity of a 10 mm GFRP-reinforced column with 50 mm stirrup spacing is 1327 kN with a deflection of 0.42 mm. An increase of 10% was determined between the load-bearing capacities of these columns.
Figure 15 shows that an 8 mm steel-reinforced column with a stirrup spacing of 75 mm has a load-bearing capacity of 1142 kN and a deflection of 0.35 mm. In comparison, a 10 mm steel-reinforced column with the same stirrup spacing has a slightly higher load-bearing capacity of 1205 kN with a deflection of 0.33 mm, which corresponds to an increase of 6%. The 8 mm GFRP-reinforced column with a 75 mm stirrup spacing shows a load-bearing capacity of 1030 kN with a deflection of 0.33 mm. Under the same conditions, the 10 mm GFRP-reinforced column achieves a higher load-bearing capacity of 1040 kN with a deflection of 0.40 mm, which represents a slight increase. Table 8 lists the results of numerical and experimental analysis.
To verify that the observed difference between the steel-reinforced and GFRP-reinforced columns are not statically significant, a one-way analysis of variance (ANOVA) was conducted for load bearing capacity, deflection and ductility index for both numerical as well as experimental results. Table 9 shows p-values for different datasets.
ANOVA shows p > 0.05 for all tested parameters, indicating no statically significant difference between steel and GFRP-reinforced columns in terms of load-carrying capacity, deflection and ductility index.

3.3. Analytical Results

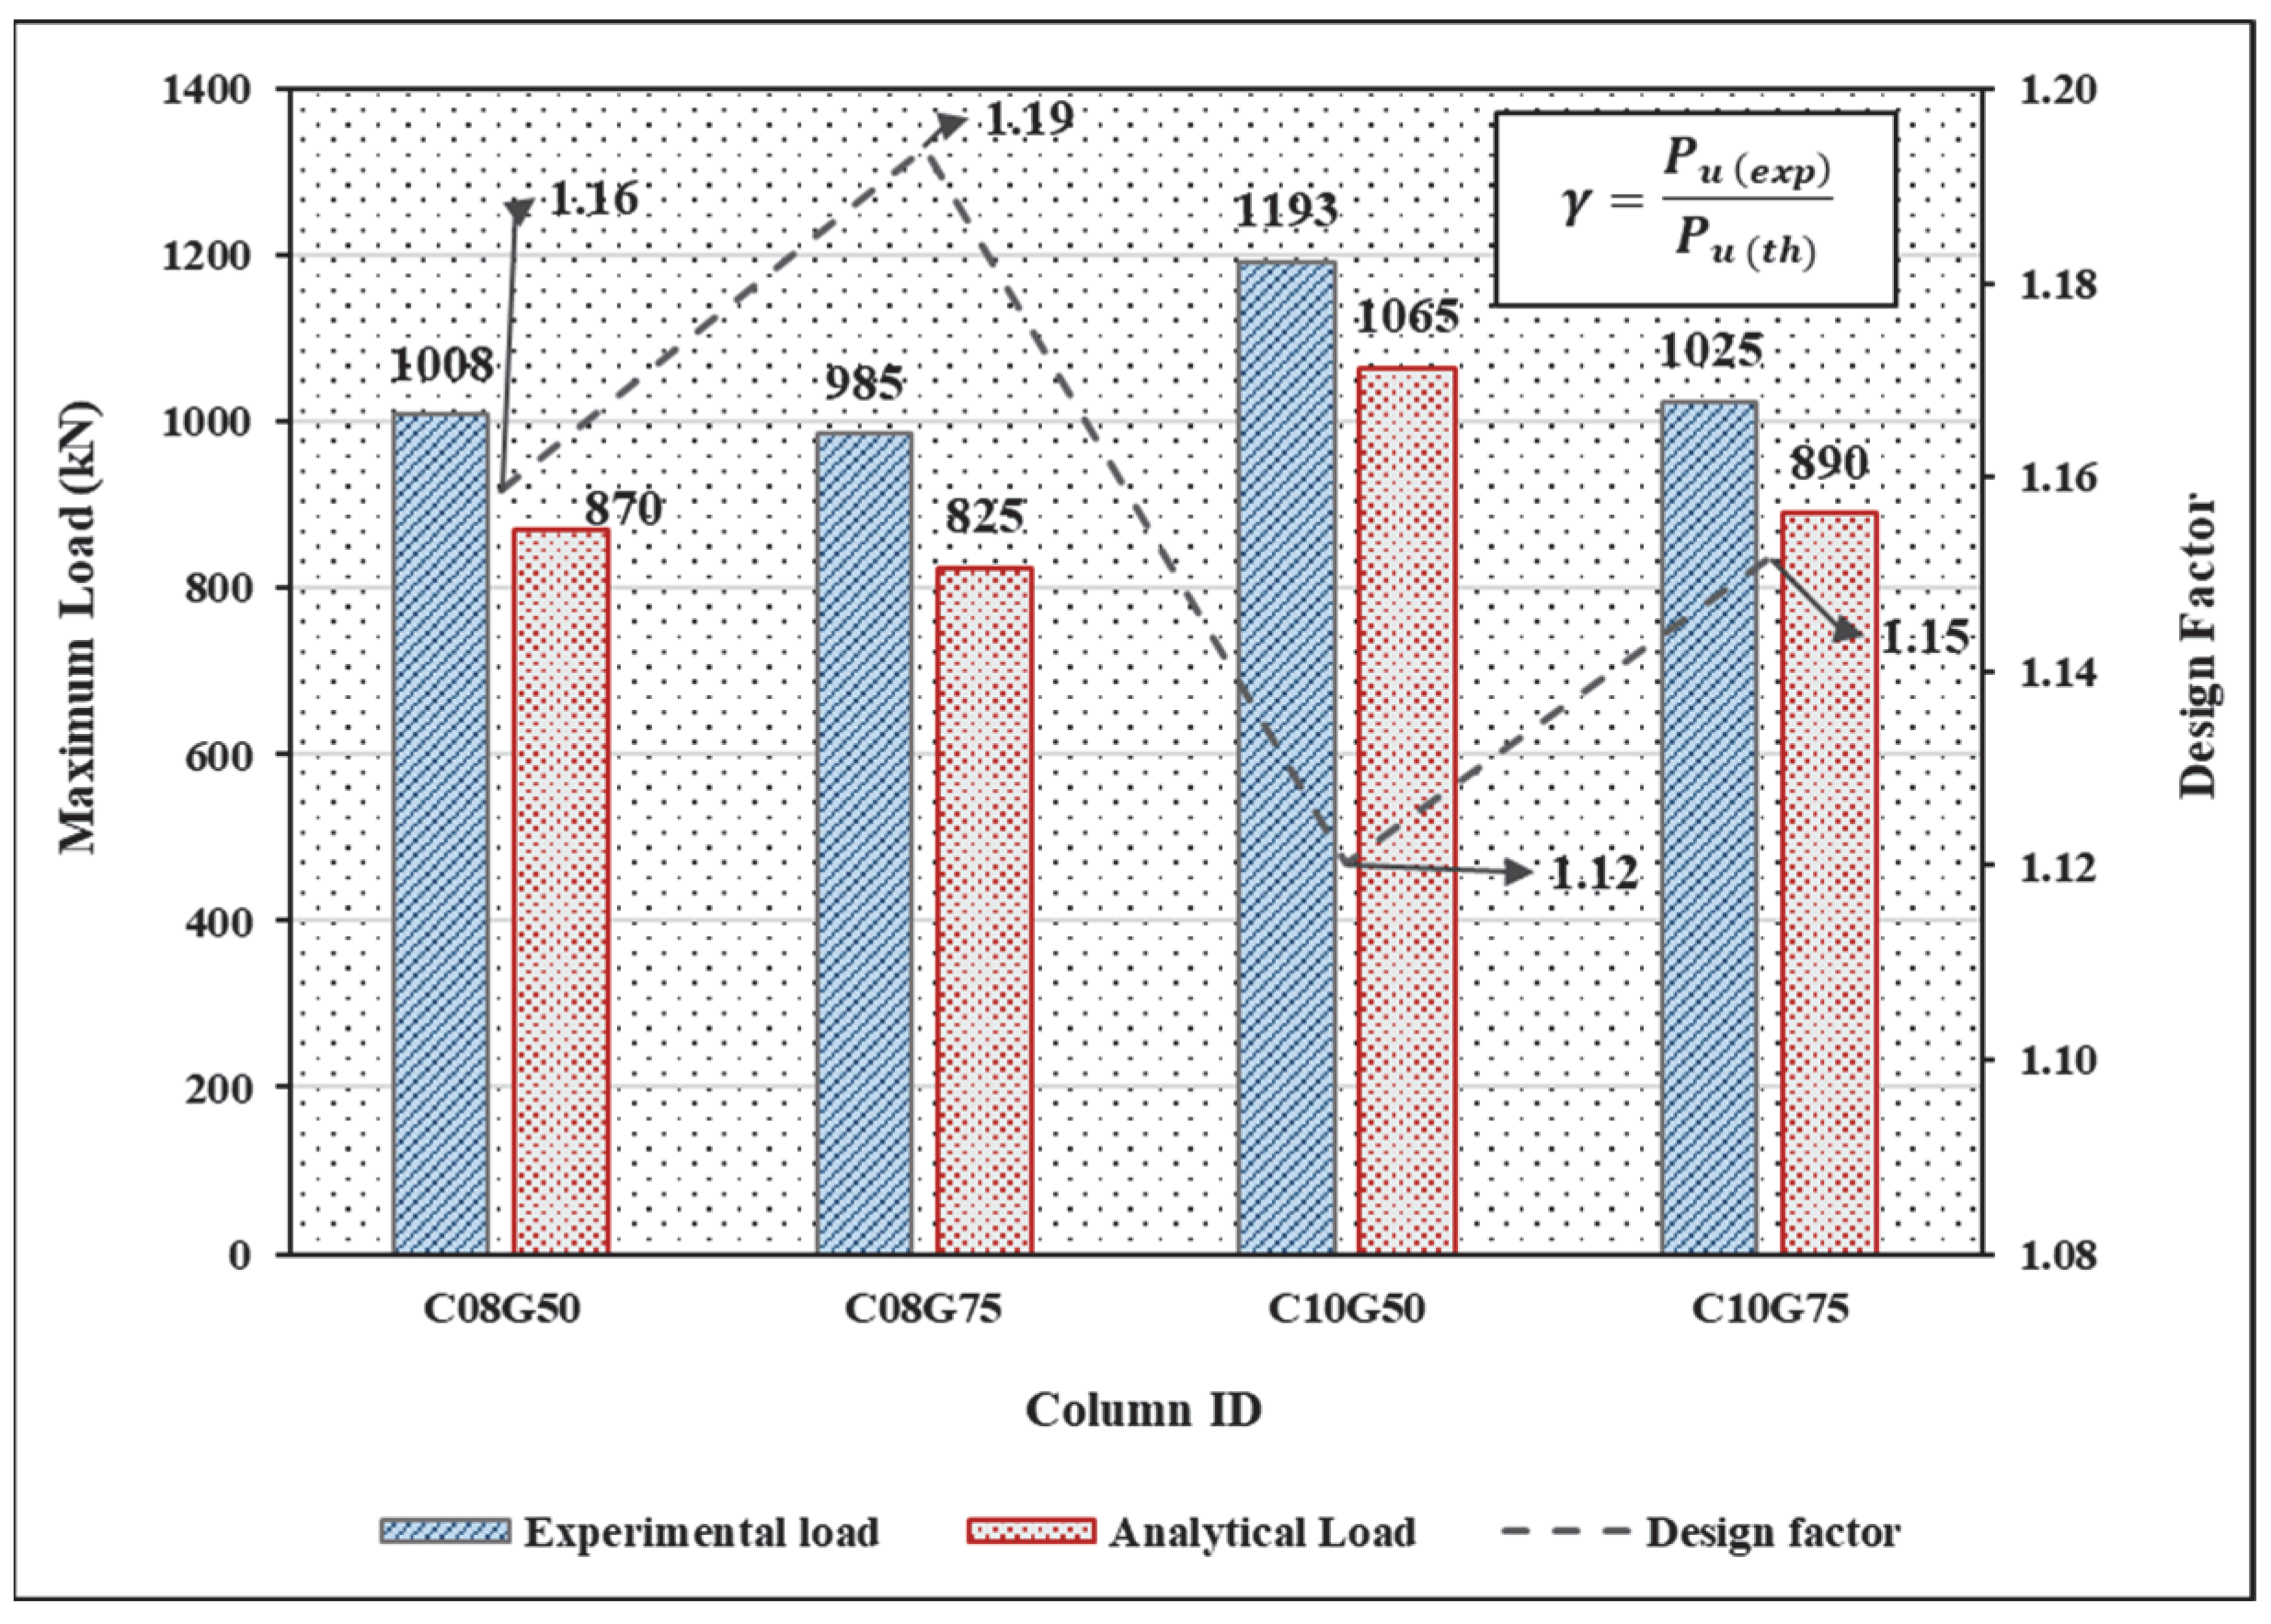
Table 9 shows that strain in the GFRP rebars at the ultimate load is between 0.0035 and 0.0039. The average strain can be considered as 0.0035, which agrees well with the value given in the literature. Figure 16 shows the comparison between the experimental load-carrying capacity and the analytical load-carrying capacity referring to (Equations (5) and (6)).
From the experimental and analytical load calculations, the design factors for the GFRP-reinforced columns can be calculated according to Equation (7).
γ = P u ( e x p ) P u ( t h )
With reference to Equation (7) and Figure 16, the average design factor γ in this study is calculated as 1.15. The modified value for the theoretical load calculation can thus be calculated using Equation (8). This value can be used to predict the experimental load-carrying capacity.
P u ( e x p ) = 1.15   P u ( t h )

Validation of the Design Factor with Data from the Literature

Table 10 lists the validation of the design factor determined in the present study. The modified theoretical load is calculated using the derived design factor of 1.15. The selected data are comparable with the composite section and loading conditions used in this study. The calculated values agree well with the experimental load capacity, and an average difference of 8% between the predicted load and the actual experimental results can be observed.

4. Conclusions

This study investigated the performance of GFRP-RC composite columns under concentric loading using experimental, analytical, and numerical studies. The following conclusions were drawn:
  • Experimental results
GFRP-reinforced columns exhibited 85–90% of the load-carrying capacity of their steel counterparts having the same reinforcement ratio [41]. A reduction in the stirrup spacing from 75 mm to 50 mm increased the load-carrying capacity by 15% and the ductility by 12%. The low elastic modulus of GFRP led to brittle failure of the composite section. However, this can be mitigated by confining reinforcement. The GFRP reinforcement sustained 10–12% of the total load of the column, showing its structural contribution.
  • Software analysis
The results of the FEM accurately forecasted the results of the steel-reinforced and GFRP-reinforced columns The difference between numerical and experimental results is observed in the range of 7–10%, which emphasizes the reliability of the numerical approach. The numerical analysis of the composite section shows higher values than the experimental results. This is because of various assumptions, such as boundary conditions and perfect bonding in the different materials of the composite section. The damage analysis in the numerical studies shows more distrusted tensile and compressive damage with reduced stirrup spacing, which improves the structural performance of the column.
  • Analytical studies
The analytical equations for column load-carrying capacity based on IS 450:2000 were modified to estimate the load-carrying capacity of GFRP-reinforced columns. The design factor γ = 1.15 was developed to improve the theoretical load and predict the experimental results. This signifies the practical importance of this equation. The difference between the analytical and experimental results was in the range of 10–15%, which shows the conservative approach of the analytical formula. The difference in the results is due to the boundary conditions and safety factors assumed in the analytical approach. The validation of the new design factor shows good agreement with the experimental and theoretical results related to the literature. These results underline the feasibility of using GFRP-steel hybrid reinforcement in corrosive environments and represent a viable alternative to steel-reinforced columns.
The findings of this research exhibit that GFRP-RC columns can provide comparable structural capacity to steel RC columns in axial load condition. The marginal difference (10–15%) noted between load capacities by analytical and experimental studies underscore the viability of GFRP in structural applications. The proposed design factor 1.15 based on analytical results enhances predictive accuracy of results based on IS 456:2000 supporting the results in Indian context.

5. Summary

GFRP-RC composite columns can be a better alternative to steel-reinforced columns, especially in harsh environments. The stirrups play an important role in improving column ductility and load-carrying capacity. The numerical model effectively simulates the performance of the column. Analytical studies provide a conservative yet useful design approach. In the case of a concentrically loaded short composite column, it can be assumed that approximately 12% of the load is sustained by the FRP reinforcement. A higher reinforcement ratio with lateral confinement can play an important role in increasing the load-carrying capacity. This study has some limitations, as it only considers GFRP and steel-RC sections with M30 grade concrete under axial loading. Therefore, this composite section can be considered for practical application when further research focuses on different load cases and the influence of the slenderness ratio.

Author Contributions

Investigation, methodology, analysis, drafting the manuscript, T.A.K.; Conceptualization, review and editing, formal analysis, supervision, S.P.; Project administration, resource management, supervision, G.N. All authors have read and agreed to the published version of the manuscript.

Funding

The authors declare that no funding was used for this research study.

Data Availability Statement

The data presented in this study can be made available on request from the corresponding author.

Acknowledgments

The authors would like to thank Manipal Academy of Higher Education, Manipal, Karnataka, India, for supporting the study.

Conflicts of Interest

The authors declare that they have no competing interests.

References

  1. Li, V.C.; Wang, S. Flexural Behaviors of Glass Fiber-Reinforced Polymer (GFRP) Reinforced Engineered Cementitious Composite Beams. ACI Mater. J. 2002, 99, 11–21. [Google Scholar] [CrossRef]
  2. Gu, X.; Dai, Y.; Jiang, J. Flexural Behavior Investigation of Steel-GFRP Hybrid-Reinforced Concrete Beams Based on Experimental and Numerical Methods. Eng. Struct. 2020, 206, 110117. [Google Scholar] [CrossRef]
  3. Elansary, A.; Farag, A.; Abdeen, M.; Zawam, M.; El-Shabrawy, M. Estimation of Corrosion-Free Reinforcement as Replacement to Steel Rebars for Concrete Walls. J. Inst. Eng. Ser. A 2022, 103, 1073–1087. [Google Scholar] [CrossRef]
  4. Castela, A.S.; Silva, M.A.G.; Duarte, R.G. Influence of GFRP Confinement of Reinforced Concrete Columns on the Corrosion of Reinforcing Steel in a Salt Water Environment. J. Mater. Civ. Eng. 2014, 27, 04014107. [Google Scholar] [CrossRef]
  5. Kinjawadekar, T.A.; Patil, S.; Nayak, G.; Kumar, S. Investigation on Glass Fiber-Reinforced Polymer Bars in Concrete Beams. Adv. Polym. Technol. 2025, 2025, 6680051. [Google Scholar] [CrossRef]
  6. Duan, D.; Ouyang, L.; Gao, W.; Xu, Q.; Liu, W.; Yang, J. Fire Performance of FRP-RC Flexural Members. Polymers 2022, 14, 346. [Google Scholar] [CrossRef]
  7. Gouda, O.; Asadian, A.; Galal, K. Flexural and Serviceability Behavior of Concrete Beams Reinforced with Ribbed GFRP Bars. J. Compos. Constr. 2022, 26, 04022064. [Google Scholar] [CrossRef]
  8. Hasan, H.A.; Sheikh, M.N.; Hadi, M.N.S. Performance Evaluation of High Strength Concrete and Steel Fibre High Strength Concrete Columns Reinforced with GFRP Bars and Helices. Constr. Build. Mater. 2017, 134, 297–310. [Google Scholar] [CrossRef]
  9. Kinjawadekar, T.A.; Patil, S.; Nayak, G.; Kinjawadekar, A.; Kulal, S.A. Experimental Study on Mechanical Properties of Hybrid Fiber-Reinforced Concrete. J. Archit. Eng. 2024, 30, 06024001. [Google Scholar] [CrossRef]
  10. Hadhood, A.; Mohamed, H.M.; Ghrib, F.; Benmokrane, B. Efficiency of Glass-Fiber Reinforced-Polymer (GFRP) Discrete Hoops and Bars in Concrete Columns under Combined Axial and Flexural Loads. Compos. B Eng. 2017, 114, 223–236. [Google Scholar] [CrossRef]
  11. Pandey, A.K.P.K.; Dada, M.; Patton, M.L.; Adak, D. A Comparative Review on the Structural Behaviour of GFRP Rebars with Conventional Steel Rebars in Reinforced Concrete Columns. Innov. Infrastruct. Solut. 2024, 9, 373. [Google Scholar] [CrossRef]
  12. Elkafrawy, M.; Gowrishankar, P.; Aswad, N.G.; Alashkar, A.; Khalil, A.; AlHamaydeh, M.; Hawileh, R. GFRP-Reinforced Concrete Columns: State-of-the-Art, Behavior, and Research Needs. Buildings 2024, 14, 3131. [Google Scholar] [CrossRef]
  13. Syed, A.U.; Goldack, A. Slenderness Limit for GFRP Reinforced Concrete Columns Based on Axial Force Ratio. Eng. Struct. 2024, 298, 117026. [Google Scholar] [CrossRef]
  14. Abadel, A.; Alenzi, S.; Almusallam, T.; Abbas, H.; Al-Salloum, Y. Shear Behavior of Self-Consolidating Concrete Deep Beams Reinforced with Hybrid of Steel and GFRP Bars. Ain Shams Eng. J. 2023, 18, e01872. [Google Scholar] [CrossRef]
  15. Yoo, S.W.; Choo, J.F. Behavior of CFRP-Reinforced Concrete Columns at Elevated Temperatures. Constr. Build. Mater. 2022, 358, 129425. [Google Scholar] [CrossRef]
  16. Arczewska, P.; Polak, M.A.; Penlidis, A. Relation between Tensile Strength and Modulus of Rupture for GFRP Reinforcing Bars. J. Mater. Civ. Eng. 2019, 31, 04018362. [Google Scholar] [CrossRef]
  17. Hossain, K.M.A.; Ametrano, D.; Lachemi, M. Bond Strength of GFRP Bars in Ultra-High Strength Concrete Using RILEM Beam Tests. J. Build. Eng. 2017, 10, 69–79. [Google Scholar] [CrossRef]
  18. Tu, J.; Gao, K.; He, L.; Li, X. Experimental Study on the Axial Compression Performance of GFRP-Reinforced Concrete Square Columns. Adv. Struct. Eng. 2019, 22, 1554–1565. [Google Scholar] [CrossRef]
  19. Ali, M.A.; El-Salakawy, E. Seismic Performance of GFRP-Reinforced Concrete Rectangular Columns. J. Compos. Constr. 2016, 20, 04015074. [Google Scholar] [CrossRef]
  20. Youssef, J.; Hadi, M.N.S. Axial Load-Bending Moment Diagrams of GFRP Reinforced Columns and GFRP Encased Square Columns. Constr. Build. Mater. 2017, 135, 550–564. [Google Scholar] [CrossRef]
  21. Zadeh, H.J.; Nanni, A. Design of RC Columns Using Glass FRP Reinforcement. J. Compos. Constr. 2013, 17, 294–304. [Google Scholar] [CrossRef]
  22. El-Gamal, S.; AlShareedah, O. Behavior of Axially Loaded Low Strength Concrete Columns Reinforced with GFRP Bars and Spirals. Eng. Struct. 2020, 216, 110732. [Google Scholar] [CrossRef]
  23. Raza, A.; El Ouni, M.H.; uz Zaman Khan, Q.; Berradia, M. Structural Assessment of Eccentrically Loaded GFRP Reinforced Circular Concrete Columns: Experiments and Finite Element Analysis. Compos. Struct. 2021, 275, 114528. [Google Scholar] [CrossRef]
  24. Pantelides, C.P.; Asce, M.; Gibbons, M.E.; Reaveley, L.D. Axial Load Behavior of Concrete Columns Confined with GFRP Spirals. J. Compos. Constr. 2013, 6, 305–313. [Google Scholar] [CrossRef]
  25. Bank, L.C.; Campbell, T.I.; Dolan, C.W. Guide for the Design and Construction of Concrete Reinforced with FRP Bars Reported by ACI Committee 440. Concrete 2003, 322, 1–42. [Google Scholar] [CrossRef]
  26. Abdallah, A.E.M.; El-Salakawy, E. Confinement Properties of GFRP-Reinforced Concrete Circular Columns under Simulated Seismic Loading. J. Compos. Constr. 2021, 25, 04020088. [Google Scholar] [CrossRef]
  27. Luca, A.D.; Asce, M.; Nardone, F.; Matta, F.; Asce, A.M.; Nanni, A.; Asce, F.; Lignola, G.P.; Prota, A. Structural Evaluation of Full-Scale FRP-Confined Reinforced Concrete Columns. J. Compos. Constr. 2011, 15, 112–123. [Google Scholar] [CrossRef]
  28. Raza, A.; Ali, B.; Asad Nawaz, M.; Ahmed, I. Structural Performance of FRP-RC Compression Members Wrapped with FRP Composites. Structures 2020, 27, 1693–1709. [Google Scholar] [CrossRef]
  29. Tobbi, H.; Farghaly, A.S.; Benmokrane, B. Behavior of Concentrically Loaded Fiber-Reinforced Polymer Reinforced Concrete Columns with Varying Reinforcement Types and Ratios. ACI Struct. J. 2014, 111, 375–385. [Google Scholar] [CrossRef]
  30. Karimipour, A.; Mohebbi Najm Abad, J.; Fasihihour, N. Predicting the Load-Carrying Capacity of GFRP-Reinforced Concrete Columns Using ANN and Evolutionary Strategy. Compos. Struct. 2021, 275. [Google Scholar] [CrossRef]
  31. Sümer, Y.; Öztemel, M. Investigation of the Effect of GFRP Reinforcement Bars on the Flexural Strength of Reinforced Concrete Beams Using the Finite Element Method. Fibers 2025, 13, 125. [Google Scholar] [CrossRef]
  32. IS 456:2000; Plain and Reinforced Concrete. Bureau of Indian Standard: New Delhi, India, 2000.
  33. IS 10262:2019; Concrete Mix Proportioning—Guidelines. Bureau of Indian Standard: New Delhi, India, 2019.
  34. Ahmad, H.; Elnemr, A.; Ali, N.; Hussain, Q.; Chaiyasarn, K.; Joyklad, P. Finite Element Analysis of Glass Fiber-Reinforced Polymer-(Gfrp) Reinforced Continuous Concrete Beams. Polymers 2021, 13, 4468. [Google Scholar] [CrossRef]
  35. Afifi, M.Z.; Mohamed, M.H.; Benmokrane, B. Axial Capacity of Circular Concrete Columns Reinforced with GFRP Bars and Spirals. J. Compos. Constr. 2013, 18, 04013017. [Google Scholar] [CrossRef]
  36. Mohamed, H.M.; Afifi, M.Z.; Benmokrane, B. Performance Evaluation of Concrete Columns Reinforced Longitudinally with FRP Bars and Confined with FRP Hoops and Spirals under Axial Load. J. Bridge Eng. 2014, 19, 04014020. [Google Scholar] [CrossRef]
  37. Al-Salloum, H.A.; Elsanadedy, H.; Abbas, H.; Almusallam, T.; Abadel, A.; Al-Salloum, Y. Investigating the Performance of Basalt FRP-reinforced Concrete Columns: Experimental and Analytical Insights. Arch. Civ. Mech. Eng. Publ. Model 2024, 24, 216. [Google Scholar]
  38. Cao, Q.; Ju, H.; Wu, Z.; Ma, Z.J. Experimental Study on Seismic Performance of GFRP and Highly Ductile Stainless Steel Hybrid Reinforced Concrete Columns. Eng. Struct. 2025, 322, 119130. [Google Scholar] [CrossRef]
  39. Mohammed, S.A.; Said, A.M.I. Analysis of Concrete Beams Reinforced by GFRP Bars with Varying Parameters. J. Mech. Behav. Mater. 2022, 31, 767–774. [Google Scholar] [CrossRef]
  40. Karim, H.; Sheikh, M.N.; Hadi, M.N.S. Axial Load-Axial Deformation Behaviour of Circular Concrete Columns Reinforced with GFRP Bars and Helices. Constr. Build. Mater. 2016, 112, 1147–1157. [Google Scholar] [CrossRef]
  41. Khan, Q.S.; Sheikh, M.N.; Hadi, M.N.S. Axial-Flexural Interactions of GFRP-CFFT Columns with and without Reinforcing GFRP Bars. J. Compos. Constr. 2017, 21, 04016109. [Google Scholar] [CrossRef]
Figure 1. GFRP-reinforced composite section.
Fibers 13 00156 g001
Figure 2. Stress vs. strain curve for the GFRP bar.
Fibers 13 00156 g002
Figure 3. Specimen details.
Fibers 13 00156 g003
Figure 4. Reinforcement cage.
Fibers 13 00156 g004
Figure 5. Casting of the specimen.
Fibers 13 00156 g005
Figure 6. FEM analysis: process flow.
Fibers 13 00156 g006
Figure 7. Assembled column specimen and interaction.
Fibers 13 00156 g007aFibers 13 00156 g007b
Figure 8. Boundary conditions, loading, and meshing.
Fibers 13 00156 g008
Figure 9. Damage compression and damage tension of column specimens.
Fibers 13 00156 g009aFibers 13 00156 g009bFibers 13 00156 g009c
Figure 10. Load-deflection curve: stirrup spacing of 50 mm.
Fibers 13 00156 g010
Figure 11. Failure patterns: (a) Steel reinforcement: 8 mm bars, 50 mm spacing; (b) GFRP reinforcement: 8 mm bars, 50 mm spacing. (c) Steel reinforcement: 10 mm bars, 50 mm spacing; (d) GFRP reinforcement: 10 mm bars, 50 mm spacing.
Fibers 13 00156 g011
Figure 12. Load-deflection curve: stirrup spacing 75 mm.
Fibers 13 00156 g012
Figure 13. Failure patterns: (a) Steel reinforcement: 8 mm bars, 75 mm spacing; (b) GFRP reinforcement: 8 mm bars, 75 mm spacing; (c) Steel reinforcement: 10 mm bars, 75 mm spacing; (d) GFRP reinforcement: 10 mm bars, 75 mm spacing.
Fibers 13 00156 g013
Figure 14. Load vs. deflection curve: Numerical analysis with a stirrup spacing of 50 mm.
Fibers 13 00156 g014
Figure 15. Load vs. deflection curve: Numerical analysis with a stirrup spacing of 75 mm.
Fibers 13 00156 g015
Figure 16. Experimental vs. analytical load for the GFRP-reinforced composite columns.
Fibers 13 00156 g016
Table 1. Mix proportions.
GradeCement
(kg)
Coarse Aggregate
(kg)
Fine Aggregate
(kg)
W/C RatioWater
(Liter)
Mix Proportion
M30450.00500.00892.000.42189.001:1.25:2.23
Table 2. Properties of the concrete.
GradeW/C
Ratio
Compression Strength (MPa)Split Tension Strength (MPa)Flexural Strength
(MPa)
M300.4241.153.856.58
Table 3. Properties of the reinforcement.
Type of ReinforcementStrength in Tension
MPa
Elastic Modulus
GPa
Relative Extension
%
GFRP110051.52.04
Steel54021012
Table 4. Details of the column specimens.
SpecimenNumber of SpecimensType of Main
Reinforcement
Main
Reinforcement:
Diameter of Bar (mm)
Transverse Steel
Reinforcement (mm)
Spacing (mm)
C10-S502Steel108 mm50 mm
C10-S7528 mm75 mm
C08-S502088 mm50 mm
C08-S7528 mm75 mm
C10-G502GFRP108 mm50 mm
C10-G7528 mm70 mm
C08-G502088 mm50 mm
C08-G7528 mm75 mm
Note: C: Column; S: Steel; G: GFRP; 08, 10: Diameter of bar; 75, 50: Spacing of ties.
Table 5. Properties of materials.
PropertiesValue
Concrete
Density2.5 × 10−5 N/mm3
Poisson’s ration0.2
Young’s modulus27,386.13 N/mm2
Cover25 mm
Steel
Density7.85 × 10−5 N/mm3
Poisson’s ratio0.3
Elastic modulus210,000 N/mm2
GFRP
Density2.0 × 10−5 N/mm3
Poisson’s ratio0.3
Elastic modulus50 N/mm2
Table 6. Properties: concrete damage plasticity model.
ParametersΨΕFb0/fc0KΜ
Values3100.11.160.6670.0001
Note: Ψ = Dilation angle; E = Eccentricity; Fb0 = Maximum biaxial compressive stress; fc0 = Maximum uniaxial compressive stress; K = Shape factor; Μ = Viscosity parameter.
Table 7. Comparison of the numerical and experimental results.
Grade
of Concrete
Spacing of StirrupsColumn IDExperimental AnalysisNumerical Analysis
Load-
Bearing
Capacity
(kN)
Deflection at Maximum Load (mm)Ductility Index µLoad-Bearing Capacity (kN)Deflection at Maximum Load (mm)Ductility Index µ
M3050C08S5012950.400.7013460.450.73
C08G5010080.350.7112160.560.75
C10S5013980.500.7415550.420.70
C10G5011930.350.8013270.420.70
75C08S7511300.320.6011420.350.65
C08G759850.650.6910300.330.60
C10S7512300.300.6412050.320.62
C10G7510250.300.7010400.410.64
Table 8. Summary of statistical significance.
DatasetSteel-Reinforced Member vs. GFRP-Reinforced Member p Value (Significance α = 0.05)
Load-Bearing Capacity
(kN)
Deflection at Maximum Load (mm)Ductility Index µ
Experimental0.120.320.31
Numerical0.160.510.68
Table 9. The strains of the GFRP-reinforced specimens considered in this study at maximum load.
Specimen IDStrain at Maximum Load
C08G500.0030
C10G500.0037
C08G750.0035
C10G750.0039
Average   strain   ( ε f ) 0.0035
Table 10. Validation of the design factor.
ReferenceType of ColumnType of Load P u t h (kN)Longitudinal Reinforcement Ratio P u ( t h ) Modified (kN)
(Equation (6))
P u ( e x p ) (kN) %   Difference   Between   the   Modified   P u ( t h )   and   P u ( e x p )
[29]ShortConcentric10501–2%1207.5011504.72
[39]13001–2%1495.0014006.35
[34]12501–2.5%1437.513506.08
[40]17501.5–3.5%2012.5180010.53
[36]9280.8–1.1%1067.2943.2011
Disclaimer/Publisher’s Note: The statements, opinions and data contained in all publications are solely those of the individual author(s) and contributor(s) and not of MDPI and/or the editor(s). MDPI and/or the editor(s) disclaim responsibility for any injury to people or property resulting from any ideas, methods, instructions or products referred to in the content.