Article

Experimental Evaluation of RC Structures with Brick Infills for Vertical Forest Adaptation in Seismic Regions

by
Theodoros Rousakis
1,*,
Vachan Vanian
1,*,
Martha Lappa
1,
Adamantis G. Zapris
1,
Ioannis P. Xynopoulos
1,
Maristella Voutetaki
2,
Stefanos Kellis
1,
George Sapidis
1,
Maria Naoum
1,
Nikos Papadopoulos
1,
Violetta K. Kytinou
1,
Martha Karabini
1,
Constantin E. Chalioris
1,
Athanasia K. Thomoglou
1 and
Emmanouil Golias
1
1
Department of Civil Engineering, Democritus University of Thrace, 67100 Xanthi, Greece
2
Architectural Engineering Department, School of Engineering, Democritus University of Thrace, 67100 Xanthi, Greece
*
Authors to whom correspondence should be addressed.
Fibers 2025, 13(11), 154; https://doi.org/10.3390/fib13110154
Submission received: 11 September 2025 / Revised: 31 October 2025 / Accepted: 10 November 2025 / Published: 17 November 2025

Abstract

Existing Mediterranean reinforced concrete buildings with masonry infills exhibit critical seismic vulnerabilities, yet real-time damage detection capabilities remain limited. This study validates a novel dense piezoelectric transducer (PZT) network concept for early damage detection in deficient RC structures under progressive seismic loading. A three-dimensional single-story RC frame with brick infills, representative of pre-Eurocode Mediterranean construction (non-ductile detailing, inadequate transverse reinforcement), was tested at serviceability limit states (SLSs) (Phase A) using a dynamic pushover approach with the 1978 Thessaloniki earthquake record, progressively scaled from EQ0.1g to EQ1.1g within the GREENERGY vertical forest renovation project. The specimen featured 48 PZTs using electromechanical impedance (EMI) methodology, 12 accelerometers, 8 displacement sensors, and 20 strain gauges. Progressive infill deterioration initiated at EQ0.5g while steel reinforcement remained elastic (max 2350 μstrain < 2890 μstrain yield). Maximum inter-story drift reached 11.37‰ with negligible residual drift (0.204‰). The PZT network, analyzed through Root Mean Square Deviation (RMSD), successfully detected internal cracking and infill-frame debonding before visible manifestation, validating its early warning capability. Floor acceleration amplification increased from 1.26 to 1.57, quantifying structural stiffness degradation. These SLS results provide critical baseline data enabling the Phase B implementation of sustainable vertical forest retrofitting strategies for aging Mediterranean building stock.

1. Introduction

Aging building infrastructure worldwide would benefit significantly from urgent assessment and retrofitting to meet modern safety and sustainability standards [1]. In seismically active regions, this challenge intensifies as existing buildings designed according to outdated codes often exhibit inadequate seismic performance [2]. Reinforced concrete (RC) buildings with masonry infill walls constitute a substantial portion of existing building stock in Mediterranean seismic-prone regions [3,4]. These structures, constructed between the 1960s and 1980s, typically involve non-ductile detailing, sparse transverse reinforcement, and deficient seismic design provisions, among others [5,6]. Recent earthquakes have repeatedly demonstrated the vulnerability of masonry-infilled RC buildings. Post-earthquake reconnaissance studies reveal that masonry infill failures contribute significantly to structural damage, economic losses, and human casualties [7,8,9]. Recent experimental investigations on infilled RC frames have demonstrated that combined in-plane and out-of-plane loading leads to significantly lower resistances compared to separate loading [10]. This finding has been validated through post-earthquake reconnaissance following the February 2023 Kahramanmaras earthquakes (Mw 7.8 and 7.5), where failure of masonry infill walls represented the most dominant damage type in RC frame structures across Mediterranean regions [11]. Shake table studies on scaled infilled RC buildings have further confirmed the critical importance of in-plane/out-of-plane interaction under bi-directional seismic loading [12]. The in-plane damage and out-of-plane collapse of infills often represent the most significant contributors to building damage [13]. Under real earthquake conditions, the vulnerability of infill walls increases due to interaction between in-plane deformations and transverse inertial forces [14,15].
Traditional structural assessment methodologies rely on visual inspections, destructive testing, and post-earthquake damage surveys [16,17]. These approaches provide limited insight into progressive structural deterioration and may fail to detect incipient damage. Real-time condition assessment during seismic events is currently limited, when critical structural decisions must be made rapidly [18]. Intelligent structural health monitoring (SHM) systems capable of continuous, real-time damage detection have emerged as essential for enhancing building stock resilience [19]. Piezoelectric transducers (PZTs) offer promising capabilities for advanced structural monitoring, providing high sensitivity, broad frequency response, and dual sensor–actuator functionality [20,21]. The electromechanical impedance (EMI) method utilizing PZT sensors has the potential to detect localized damage through voltage signal measurements. When embedded as smart aggregates within concrete structures or bonded to critical interfaces, PZT sensors provide valuable insight into structural behavior and damage evolution. Despite significant advances in PZT-based monitoring technologies, comprehensive experimental validation of novel monitoring concepts on RC-brick-infilled structures under realistic seismic loading needs further investigation. These knowledge gaps must be addressed to enable the practical deployment of intelligent monitoring systems for existing building stock assessment.
Simultaneously, the building sector faces mounting pressure to address climate change through dramatic reductions in operational energy consumption and embodied carbon emissions [22]. Existing buildings represent the largest opportunity for energy efficiency improvements, yet conventional retrofit approaches often address seismic safety or energy performance in isolation, missing opportunities for synergistic solutions [23]. Emerging concepts in building-integrated greenery systems—including green roofs, living walls, and vertical forest installations—offer potential for integrated retrofitting strategies that simultaneously enhance seismic resilience, improve energy efficiency, sequester carbon, reduce urban heat island effects, improve air quality, and provide a biodiverse habitat [24,25]. The vertical forest concept, pioneered architecturally by Stefano Boeri, envisions the structural integration of substantial vegetation and trees with building facades, balconies, and roofs, requiring robust structural systems to support distributed greenery loads while maintaining seismic safety [26,27]. However, the feasibility of implementing such systems on seismically deficient existing buildings requires rigorous experimental validation establishing baseline structural performance before retrofit implementation. No existing studies have systematically investigated the seismic performance of deficient Mediterranean RC-brick-infilled construction at serviceability limit states with dynamic pushover approaches specifically to enable vertical forest retrofit strategies—a critical knowledge gap this study addresses (with combination of Phase A and B).
The present investigation addresses these converging challenges by validating an innovative dense 48-sensor piezoelectric transducer (PZT) network concept—representing a 3–6× increase in sensor density compared to conventional sparse deployments—for real-time damage detection in seismically deficient reinforced concrete frames with brick masonry infills, representative of pre-Eurocode Mediterranean construction. This research presents Phase A results documenting as-built performance at serviceability limit states through progressive seismic testing (EQ0.1g to EQ1.1g), establishing critical baseline data for subsequent Phase B implementation of innovative vertical forest retrofitting technologies. The PZT network is integrated with comprehensive conventional instrumentation to enable multi-scale structural health monitoring from global frame response to localized interface behavior. This combined approach bridges traditional seismic assessment with cutting-edge intelligent monitoring and sustainable retrofitting strategies, providing validated methodologies for resilient infrastructure renewal in Mediterranean seismic-prone regions.

2. Methodology

This section presents the experimental program design, including specimen geometry and construction details (Section 2.1), material properties (Section 2.2), comprehensive instrumentation layout (Section 2.3), and the progressive seismic loading protocol (Section 2.4).

2.1. Construction and Geometric Characteristics

Carefully designed to replicate old Greek (pre-Eurocode) construction practices prevalent in seismic-prone regions, this experimental study employs a single-story, single-bay, three-dimensional reinforced concrete frame structure with infill masonry walls. The specimen intentionally incorporates the structural flaws typical of older building stock, particularly inadequate transverse reinforcement in columns, the absence of capacity-based design principles, and the use of low-strength masonry infills—these traits being essential for true assessment of retrofit techniques for vertical forest implementation in the next phase. The specimen has plan dimensions of 2.70 m × 2.70 m with a total height of 1.95 m. The specimen was scaled at a ratio of 1:3 in accordance with the capacity of the laboratory’s shake table, which possessed a maximum tested structure mass of 8 tons and a maximum overturning moment of 8 ton·m. Therefore, the mass of the specimens was adjusted to 4.3 tonnes, which is less than the maximum bearing capacity of the shake table. (see Figure 1). The Democritus University of Thrace (DUTh) in Xanthi, Greece operates a shake table featuring a 3.4 × 3.4 m surface. It provides dynamic testing with ±0.13 m displacement and acceleration ranges reaching 15.7 m/s2 (1.6 g) at full payload or 28.4 m/s2 (2.9 g) with a 4-tonne mass load, across a frequency range of 0–50 Hz. Utilizing ANCO R-643A actuators, the shake table is primarily a 1 DOF system (expandable to 6 DOF) capable of velocities up to 1.2 m/s.
The foundation system consists of four reinforced concrete beams with cross-sectional dimensions of 0.25 m × 0.20 m (height × width). It is reinforced with 8∅14 mm longitudinal bars spread over three levels (three bottom, two middle, and three top) and Φ10/100 mm stirrups providing transverse support. Four square columns measuring section dimensions of 0.13 m × 0.13 m rise from the foundation to a clear height of 1.0 m (below the slab level) and continue for an additional height of 0.5 m above the slab. Deliberately inadequate by modern standards to simulate weak existing buildings, the column reinforcement is made up of 4∅8 mm longitudinal bars set at the corners and ∅5.5/60 mm stirrups (see Figure 2).
Beam–column joints come in two basic varieties: (1) conventional joint type where the rebars are continuous to the beam–column joint through a cantilever (see Figure 3a) and (2) modified joint where the beam anchors directly into the column (see Figure 3b). This design eliminates the cantilever portion at the joint level, creating an intentional asymmetry at the joint level to investigate differential seismic behavior. This modification may affect the load transfer mechanism and potential stress concentration at the joint region. Set at 1.57 m above the base, the main horizontal diaphragm is a 0.20 m thick concrete slab reinforced with orthogonal ∅8/100 mm steel meshes at both the top and bottom sides. This notable slab thickness serves three functions: (1) It contains hidden beams along the grid lines and, more critically, (2) it provides sufficient mass to generate the inertial forces needed to mimic real seismic loads on the structural components under testing. (3) Most importantly, this heavily reinforced slab was utilized to drive the potential damage in the RC columns and the brick infill panels as well as to allow for additional mass due to renovations involving greenery (with special reference to the Thessaloniki metropolitan area). Hidden beams contain 8∅10 mm longitudinal reinforcement (arranged as three bottom, two middle, and three top) with ∅10/100 mm stirrups. A distinctive feature of the specimen design is the extension of the slab beyond the frame beams, providing adequate surface area for the subsequent anchoring of vertical forest components on both the internal and cantilever regions in the next phase. The above-mentioned outline information is depicted in Figure 3.
The brick infill walls exhibit different layouts based on their orientation relative to the anticipated seismic excitation direction. While the frames parallel to the loading direction have partial infills (0.3 m length and full height of 1 m), infills perpendicular to the loading direction exhibit full-length construction (1.24 m and full height of 1 m), permitting the investigation of both in-plane and out-of-plane seismic response mechanisms. All masonry components are made of clay bricks measuring 60/90/190 mm (width/height/length) joined with horizontal and vertical 10 mm mortar joints. Notably, the uppermost course of bricks is inclined to enhance mortar bonding with the overhead slab—a traditional construction technique observed in older structures (see Figure 1 and Figure 3).
This deliberate configuration facilitates future research phases focused on green renovation techniques (Phase B). Other provisions are the strategic foundation holes for safe attachment to the seismic table and steel hooks inserted in the slab for specimen manipulation (see Figure 3). Strategically located inside and outside the structural components, the specimen contains extensive and thorough instrumentation including strain gauges, accelerometers, displacement sensors, and advanced piezoelectric transducers (to be discussed in the following sections). Although the processing of optical measurement data is outside the scope of this work, the system is also fitted with markers for further optical analysis. This all-encompassing monitoring system allows for close structural response tracking during dynamic excitation depending on the 1978 Thessaloniki (Volvi) earthquake characteristics.

2.2. Construction Materials

2.2.1. Concrete

Two separate concrete strength categories were used in the building of the specimen to properly represent the characteristics of older structures. Based on Eurocode 2 [28] classification, a strength of C30/37 was used for the foundation beam to provide enhanced bearing capacity with minimum mass, while a concrete strength equal to C20/25 was utilized in the columns and column extensions and the top slab. The concrete structure was cast in the DUTh laboratory using conventional materials, with a maximum aggregate size of 16 mm. Quality control procedures involved casting twelve cylindrical specimens (150 mm diameter × 300 mm height), following EN 12390-3 & 6 [29,30] standards. Compressive strength testing revealed varying performance across different structural elements, with the foundation tie beams achieving the highest average compressive strength of 36.76 MPa (CV = 2.5%, ready mix concrete, Alexandros ATEBE), followed by the slab elements at 31.63 MPa (CV = 2.9%, ready-mixed concrete, Alexandros ATEBE) and the columns at 23.52 MPa (CV = 9.7%, mixed in situ in DUTh lab) (see Table 1). The intentional lower concrete compressive strength achieved in the columns’ concrete aligns with the design intention to simulate deficient older structures. The concrete strength in the columns meets the targeted quality to align with the design intention of stimulating an older structure, while ready-mixed concrete reveals higher concrete strength.

2.2.2. Reinforcement

The reinforcement aimed to replicate conventional reinforced concrete building methods prevalent in seismic regions of the Mediterranean. B500C ribbed bars were employed for all longitudinal reinforcement in columns, foundation beams, and hidden beams within the slab, while S220 smooth bars were used for column stirrups to simulate the sparse and inadequate transverse reinforcement characteristic of pre-Eurocode construction practices. The reinforcement layout included 4Ø8 mm longitudinal bars with Ø5.5/60 mm stirrups in columns, and 8Ø14 mm longitudinal bars with Ø8/100 mm stirrups in foundation beams. More detailed information about the reinforcement configuration and quantities can be found in Figure 2 and Table 2, respectively.
Mechanical properties identification of the B500C steel through tensile testing provides a yield strength of 564 MPa and ultimate tensile strength of 663 MPa, with a corresponding yield strain of 0.289% and an ultimate strain of 14.3% (see Table 3). The elastic modulus was determined as 195,156 MPa, confirming compliance with European standards for B500C grade steel.

2.2.3. Bricks

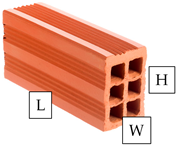
Following Mediterranean architectural custom, hollow clay bricks were used to construct masonry infills. Table 4 lists the brick specifications. The mortar used for the masonry walls was purposefully created with low strength to simulate traditional building methods using a lime–cement mortar of 10 mm thickness.

2.3. Instrumentation

Sensors are placed strategically all around the test specimen to capture the whole dynamic response profile during seismic excitation. Every sensor has been placed in specially designed locations to track important locations and behavioral systems. The extensive monitoring scheme allows for thorough monitoring of the specimen’s response, from global displacement and acceleration to localized strain development and internal damage progression. The instrumentation specifications are provided in Table 5.

2.3.1. Accelerometer Configurations

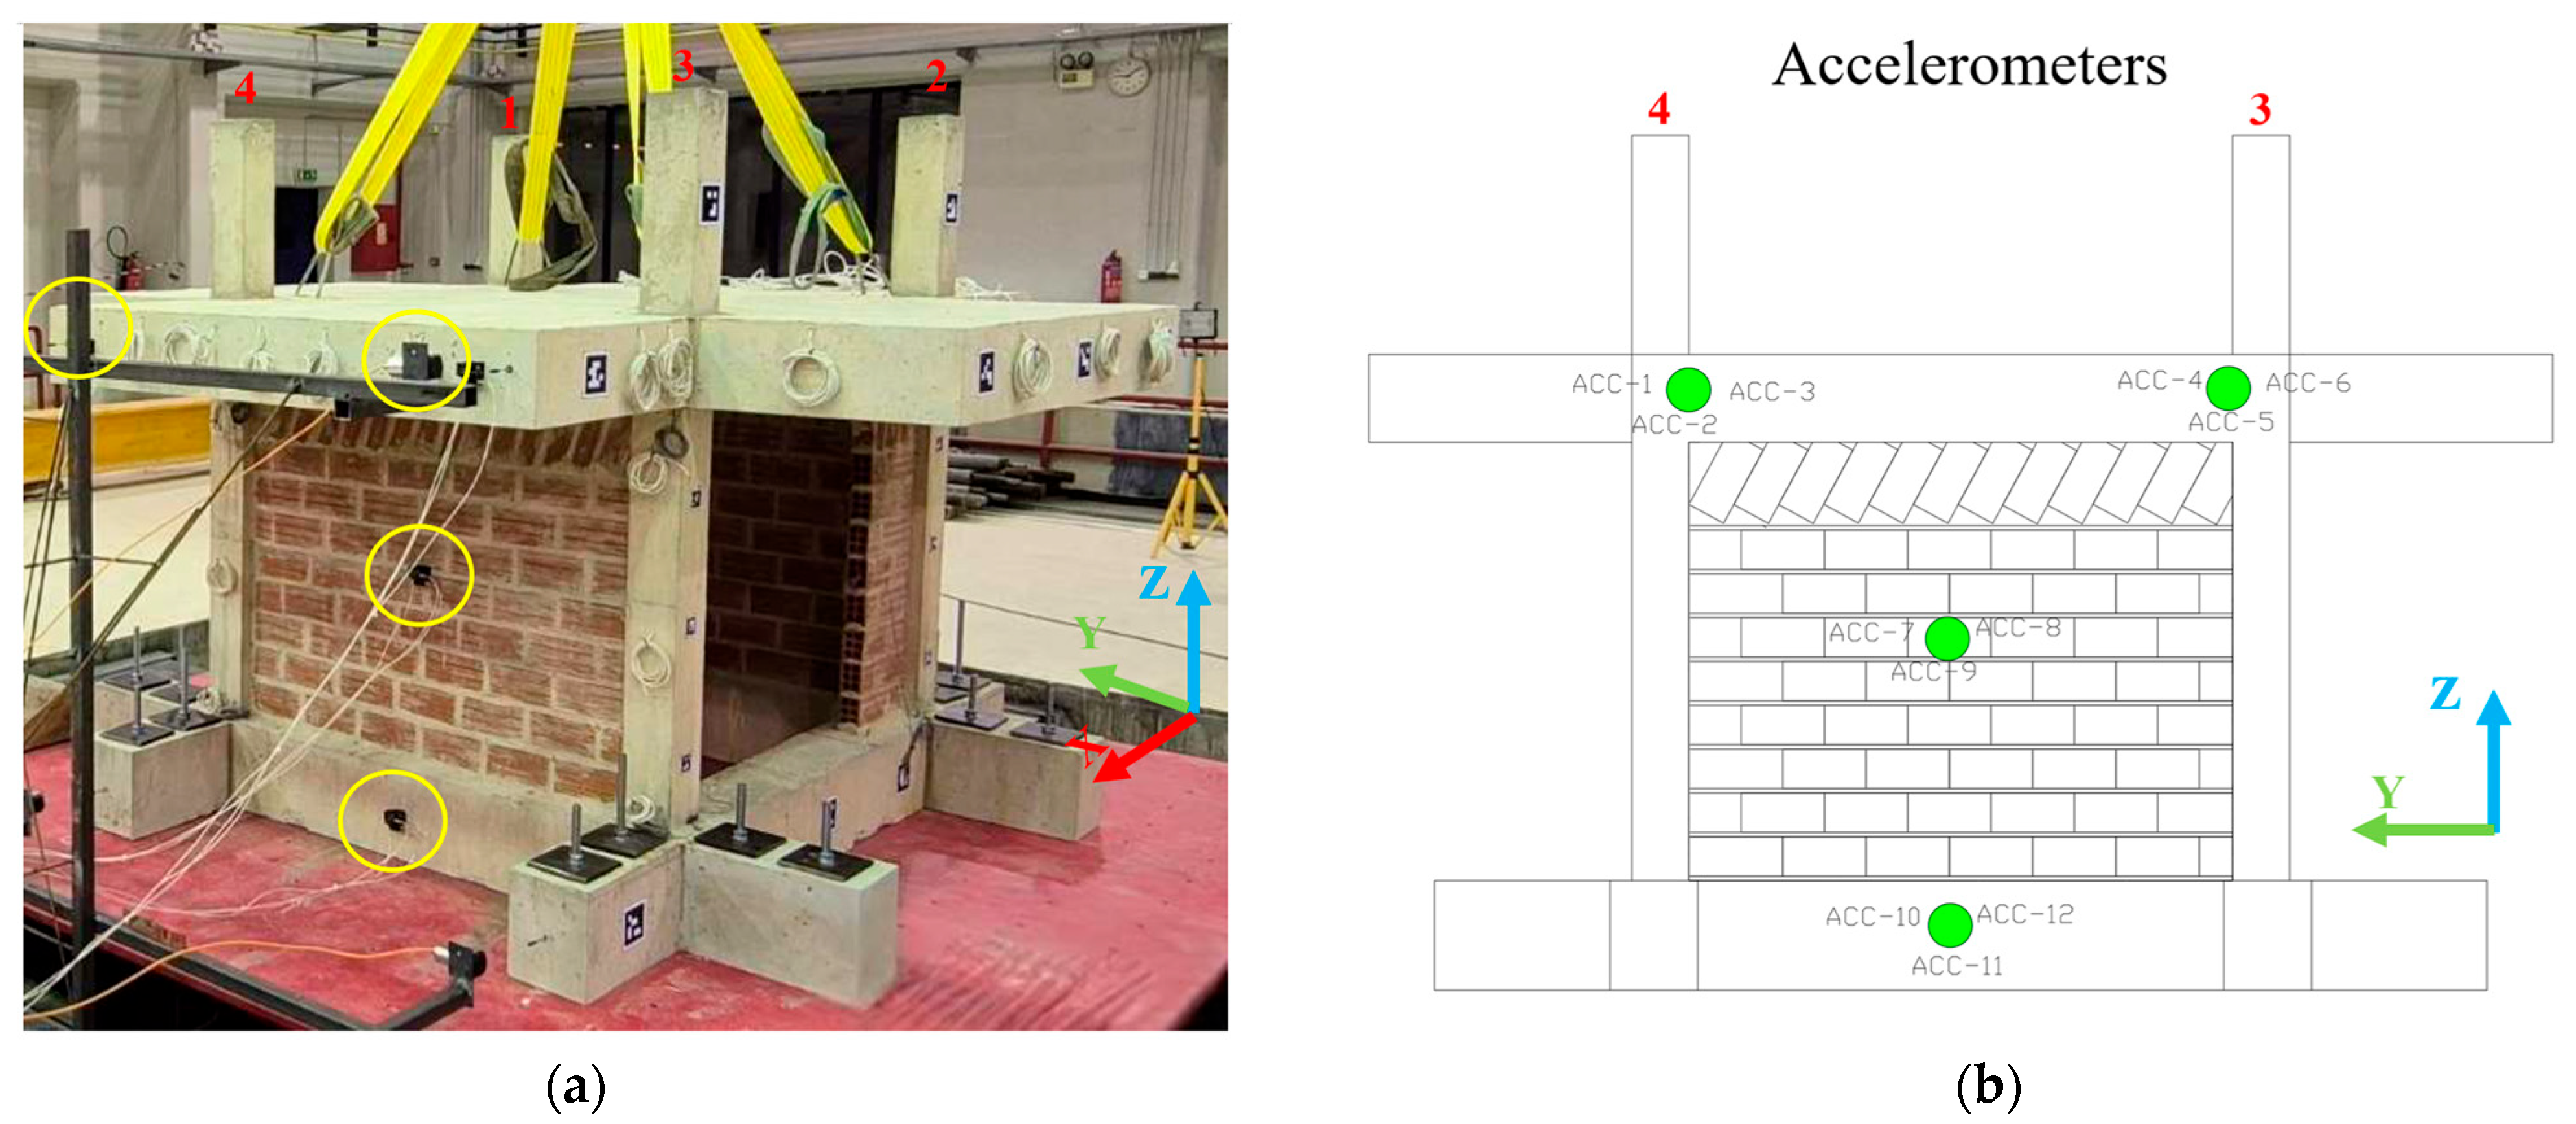
In total, twelve uniaxial accelerometers (KISTLER 8330A3) are attached to the specimen on one side of the fully infilled frame (see Figure 4). They are organized into four triaxial clusters. Accelerometers ACC-1 through ACC-6 record the three-dimensional movement at the slab level. Specifically, ACC-1, ACC-2, and ACC-3 are mounted at the left corner to record movement parallel to the shake table excitation (X-direction), perpendicular to the excitation (Y-direction), and vertical to the excitation (Z-direction), respectively. Accelerometers ACC-4, ACC-5, and ACC-6 form a similar arrangement on the right corner of the slab. To properly monitor the dynamic response and potential instabilities of the infill, one cluster comprising ACC-7, ACC-8, and ACC-9 is attached at the middle of the infill to monitor in-plane and out-of-plane behavior. Finally, to provide reference measurements for the specimen at its own beam foundation level, accelerometers ACC-10, ACC-11, and ACC-12 measure the base excitation of the structure in all three primary directions (X, Y, Z).

2.3.2. Draw-Wire Meter Sensor Setup

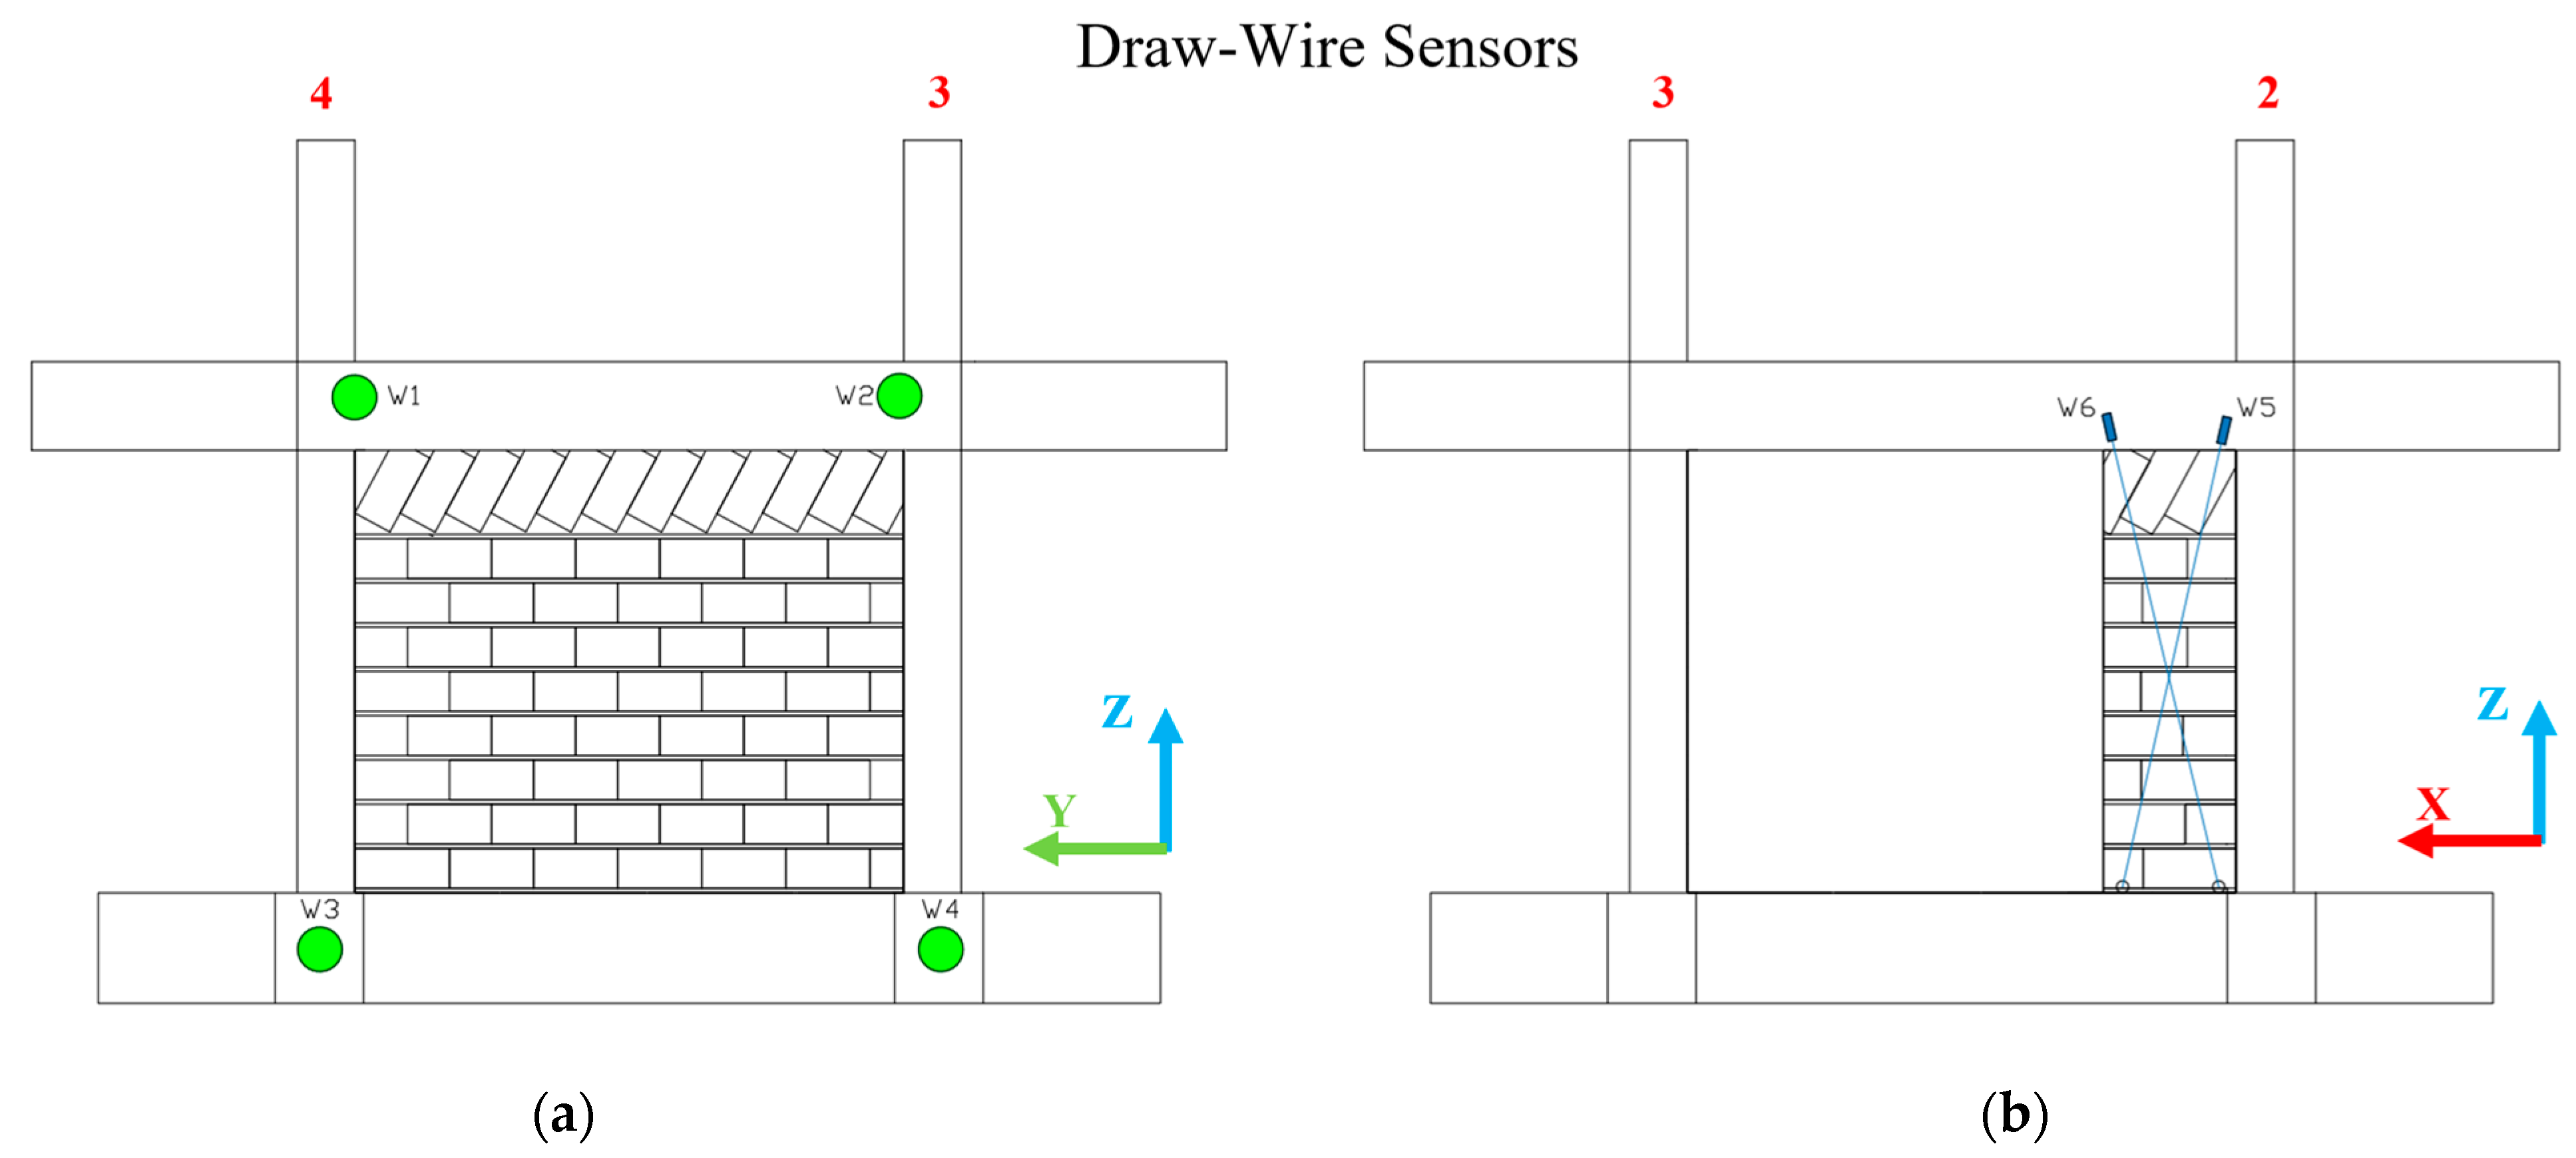
Arranged in parallel, four draw-wire sensors (WayCon SX50-300-10V-KA05) produce horizontal displacement data. W-1 and W-2, which are, respectively, attached to the left and right sides of the upper slab, monitor the lateral drift in the direction of seismic loading. W-4 and W-3 track the horizontal motion of the left and right foundation beams in the same way. Further, two diagonal draw-wire sensors are attached over each partial infill wall, in an X-configuration (W-5 through W-8). The two diagonally placed sensors on each partial infill track the extension and compression happening during in-plane deformation. This setup aims to replicate the diagonal cracking patterns and shear deformation typical of masonry infills under lateral load. The configuration of draw-wire meters is depicted in Figure 5.

2.3.3. Strain Gauge Distribution

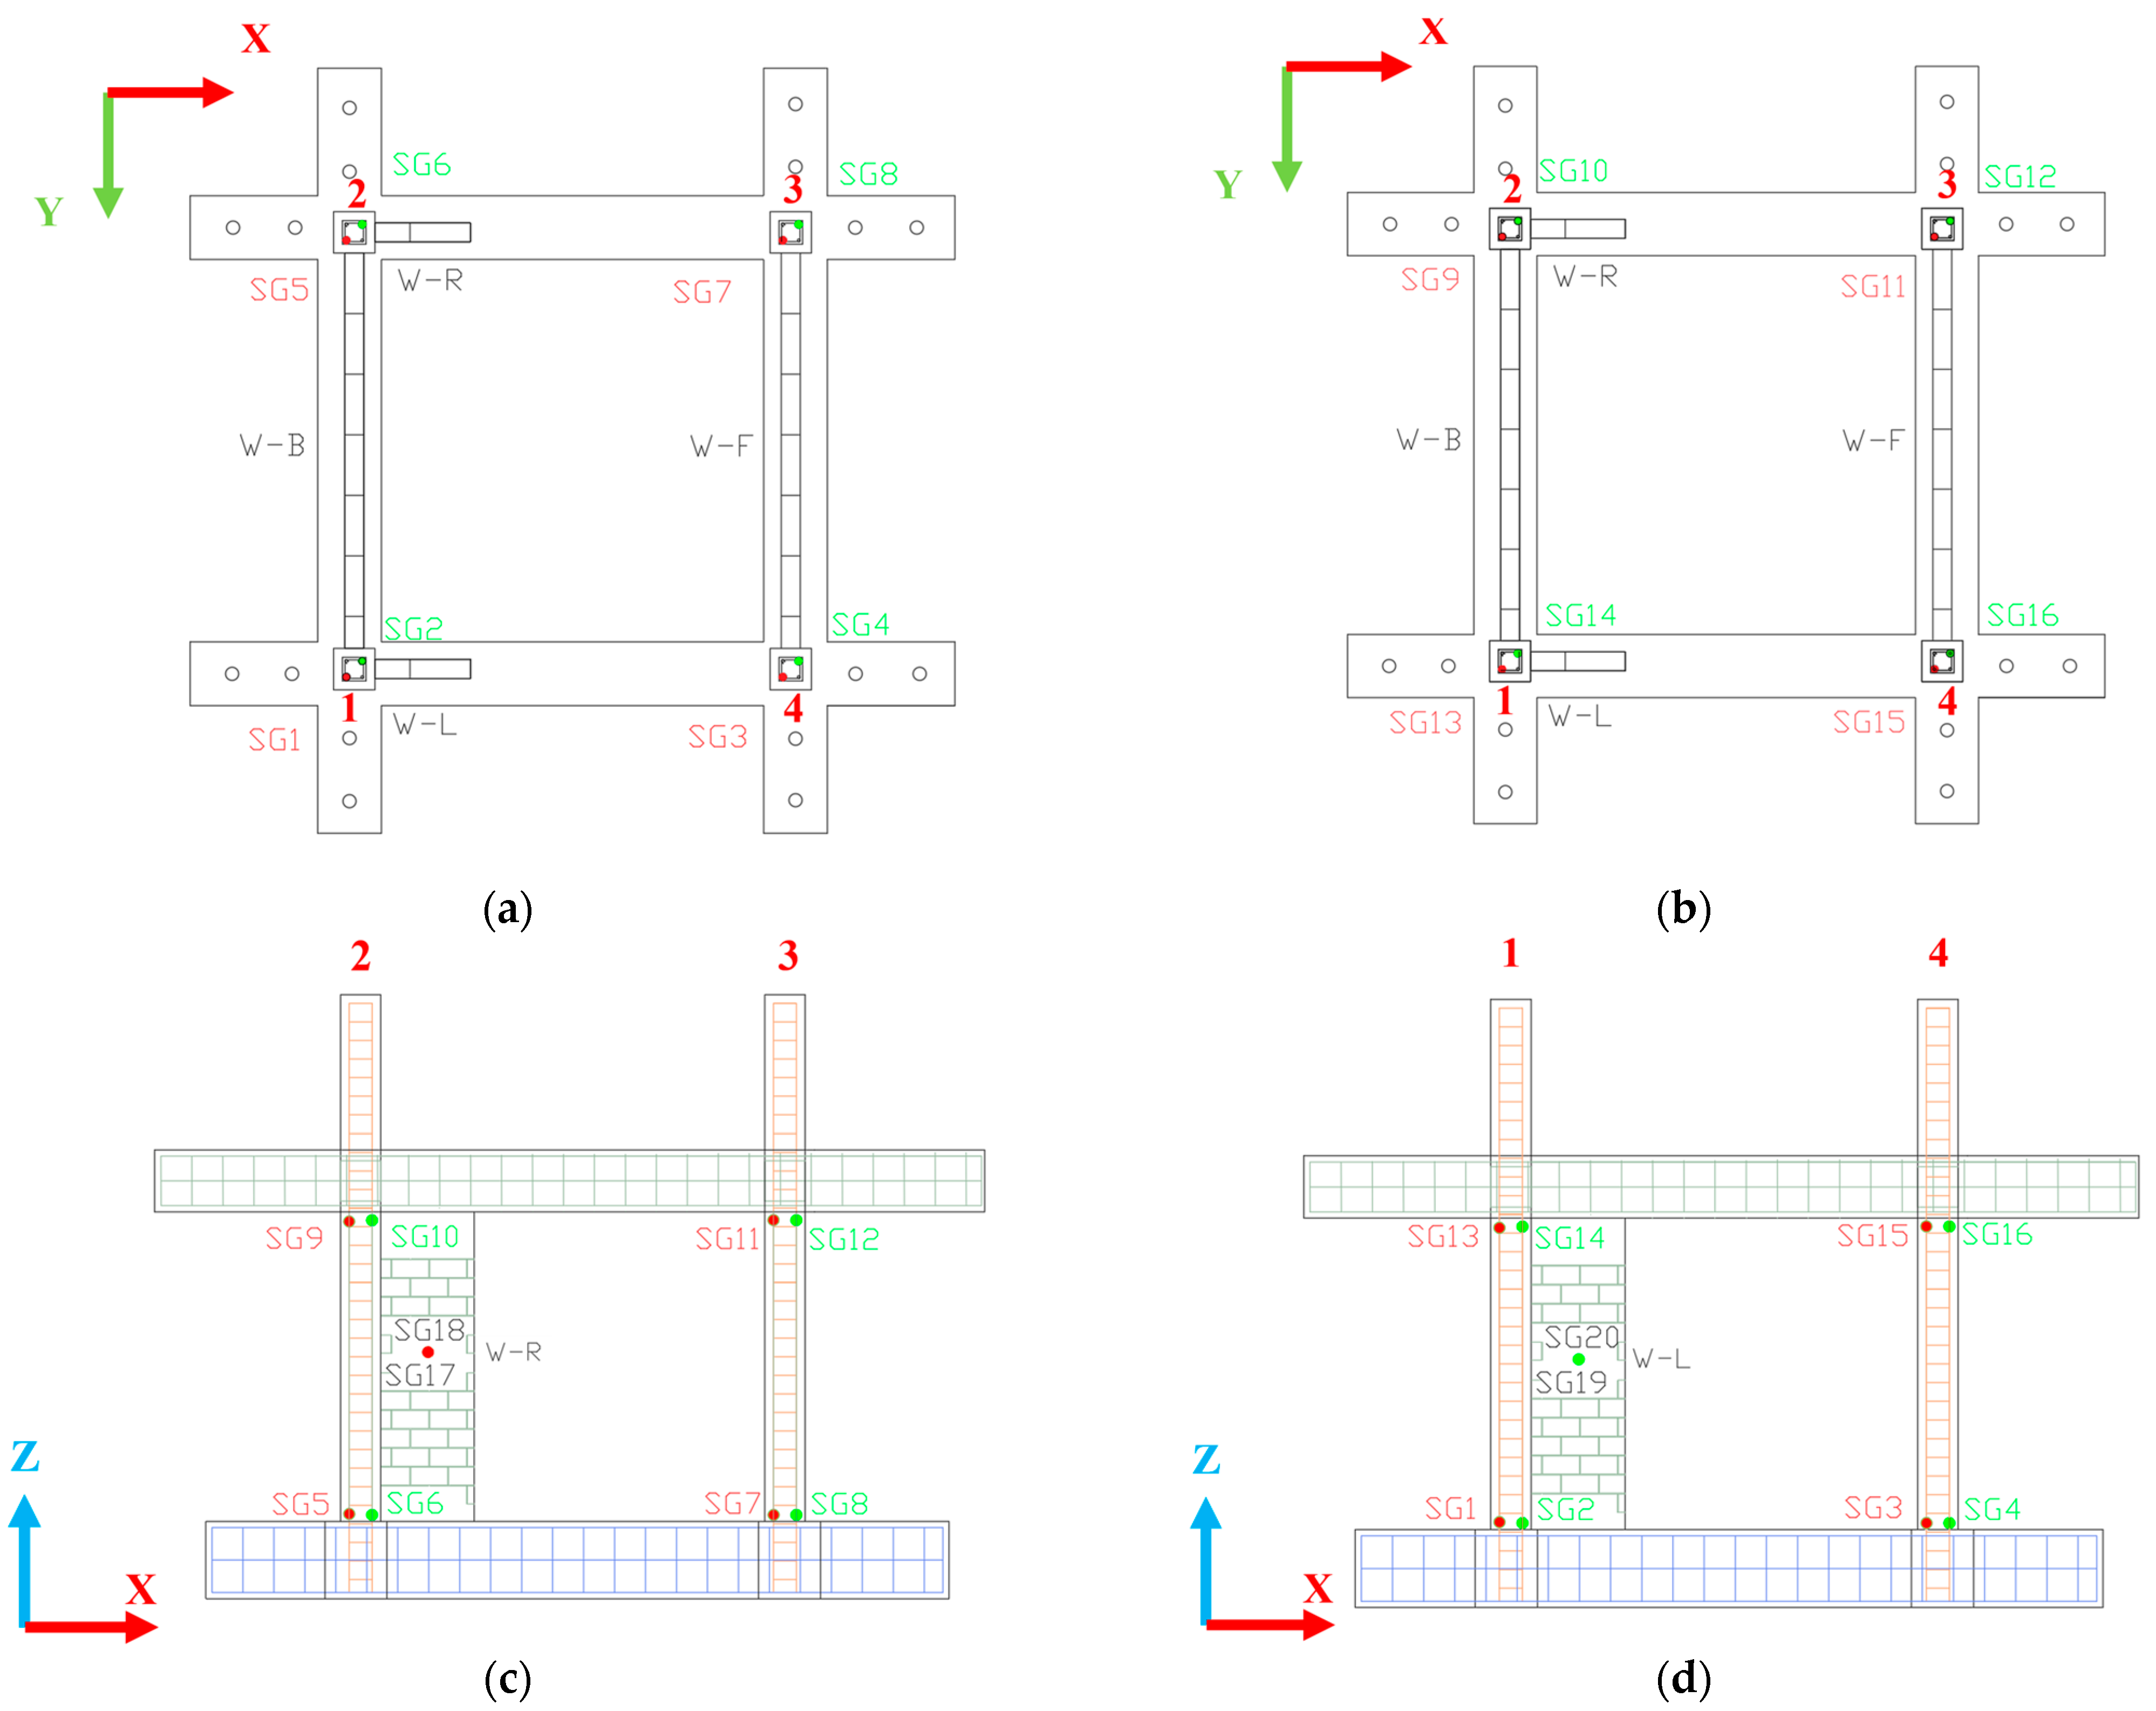
Sixteen strain gauges (FLAB-5-11-3LJC-F) painstakingly attached to the longitudinal reinforcement bars of the columns during the internal steel cage construction phase provide a reinforcement strain measuring system. One can see the expected peak moment and possible plastic hinge creation at the bottom region of each column, on the longitudinal reinforcement where two opposite strain gauges (S-1 through S-8) reside. Complementing this, strain gauges S-9 to S-16 are attached to the highest portion of the column reinforcement in near proximity to the beam–column joint region. The brick infill panels are instrumented using four additional surface-mounted strain gauges (total of 20 strain gauges). From its center, strain gauges S-17 and S-18 track the horizontal (x-direction) and vertical (z-direction) strains of the initial partial infill. Similarly, S-19 and S-20 track vertical and horizontal strain at the core of the second partial infill panel. The fully schematic representation is depicted in Figure 6.

2.3.4. Network of Advanced PZT Sensors

There was an extensive grid of 48 piezoelectric (PZT) transducers on the test specimen. These transducers were introduced following a concept of addressing key locations of the structural system, so that they could provide proper insights into progressive damage accumulation (see Figure 7). This sensor array used the electromechanical impedance (EMI) method to record high-frequency structural responses that showed where localized damage had started and spread. The system capture resolution was 1 kHz, and the frequency range was from 10 to 250 kHz. The PZT sensor deployment consisted of two distinct installation methodologies. After steel cage construction and before the casting process, 37 sensors were attached as “smart aggregates” in specially designed locations inside the core of the columns or the slab. The concept was to attach the smart aggregates along the axis line of the column at different heights (bottom, middle, and top), with the help of thin steel wires in order to avoid movement or disposition of the smart aggregates with PZT sensors during concrete casting. Casting of the columns followed a special procedure to ensure suitable concrete compaction without disposition of the smart aggregates or injury of the strain gauges or of their wires. The concept of PZT positioning intends to capture any early internal cracking due to shear or normal stresses or deformations, even if these cracks are not visible with in situ inspection of the external concrete surface (due to internal nature of the cracks or due to cracks closing after ending structure excitation and returning to zero position). Another PZT sensor was attached inside each upper beam–column joint (total of four), and twelve sensors were attached inside the four hidden top beams. The remaining nine PZT sensors were positioned inside the internal slab and in the cantilevers in positions close to the future anchoring positions of the greenery planters. This concept of dense PZT instrumentation (Figure 7) may provide advanced internal monitoring capabilities for the key structural elements. They may monitor critical stress concentration zones and potential failure locations. The other eleven sensors (to add up to a total of 48 sensors) were externally bonded to the outside of the masonry infill surfaces with the use of appropriate adhesive compounds. This sub-grid enables proper monitoring of the interfaces between infills and the surrounding reinforced concrete frame and the bond behavior of the infills themselves.
The internal PZT network was labeled as follows: There are twelve sensors on the hidden beams (3A, 4A, 5A, 3B, 4B, 5B, 3C, 4C, 5C, 3D, 4D, 5D), twelve sensors on the lower, middle, and upper levels of each of the four columns (indicated with the column integer number followed by UP, MID, DOWN), three sensors on the floor slab (SL1, SL2, and SL3), six sensors on the cantilever components (1BP, 1AP, 1CP, 1DP, 2CP, 2DP), four sensors on joints (2AC, 2BC, 6AD, 6BD) and eleven sensors on the infill surfaces (five on the full infill with the optical markers, four in the top (MOUL, MOUR) and bottom (MOBL, MOBR) edges, and one in the middle (MOMM); and three on each partial infill, vertically aligned from Up to Middle and Bottom (part with optical markers (MI2U, MI2M, MI2B) and part without optical markers (MI1U, MI1M, MI1B))). This multi-scale monitoring concept may enable simultaneous assessment of global structural behavior through frame-embedded sensors and local interface phenomena through surface-mounted transducers, providing comprehensive damage detection capabilities throughout the progressive seismic loading protocol.

2.4. Input Seismic Signal

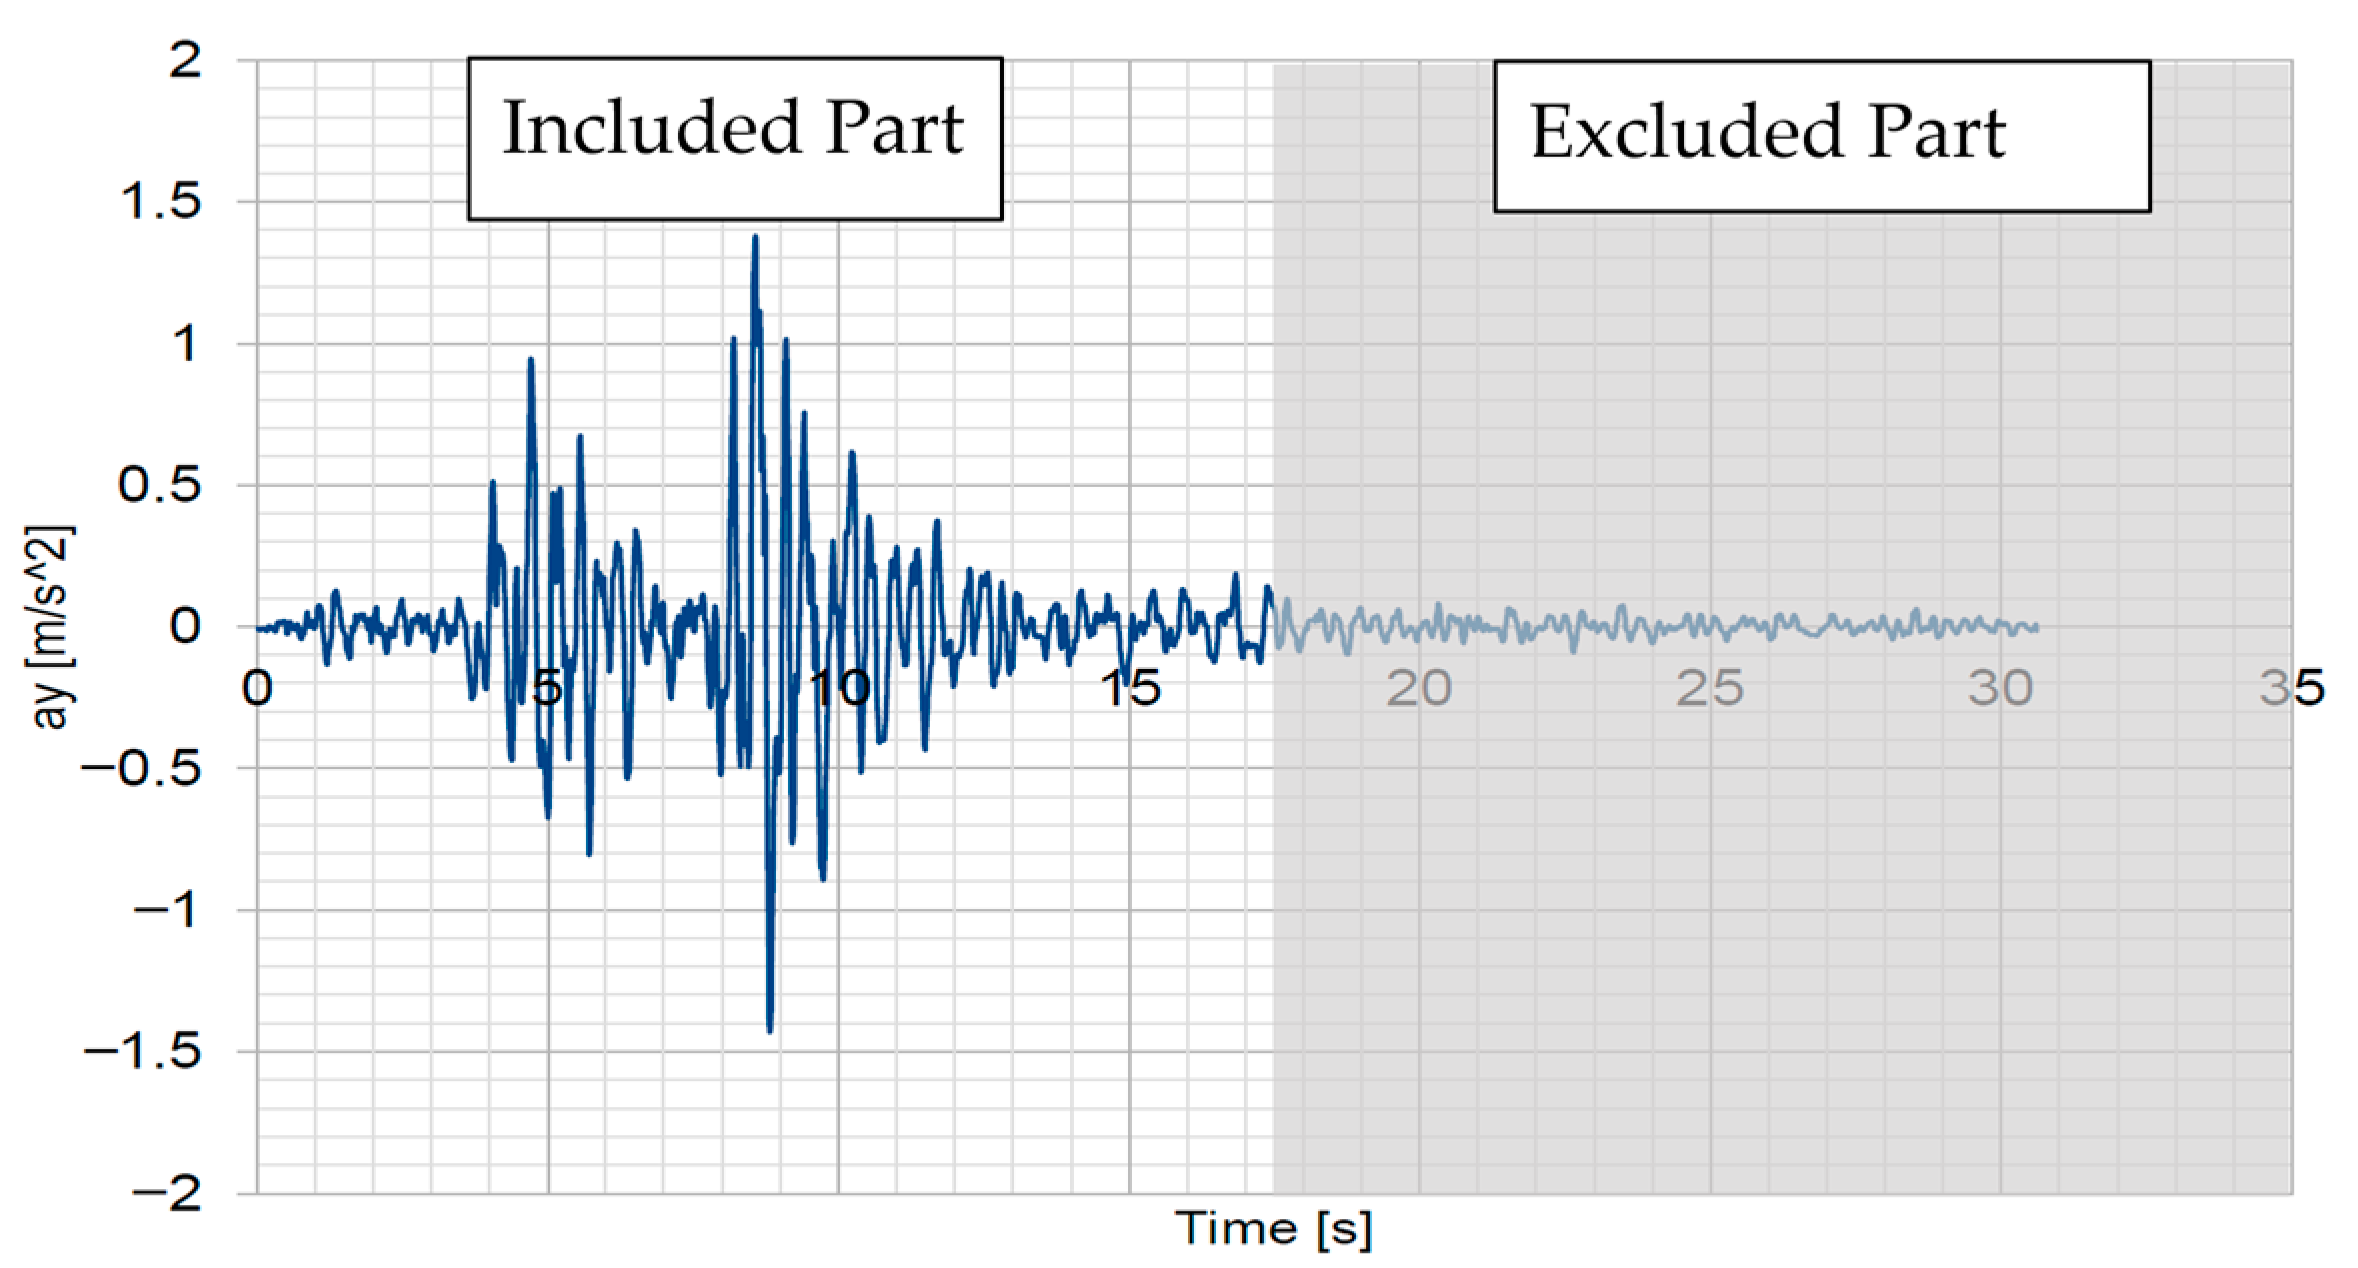
The seismic excitation protocol was based on the record of the Thessaloniki (Volvi) earthquake (see Figure 8), which was one of the most important in modern Greek history and occurred at 23:03 local time on 20 June 1978.
The experimental program used a methodological approach of gradually increased intensity [31] to monitor the response and potential deterioration progress of the RC frame with brick infills, similar to the dynamic pushover approach. Two types of seismic protocols were employed: (a) low-intensity white noise excitations (0.08g) to determine the structure’s fundamental dynamic properties and (b) scaled Thessaloniki record from 0.1g to 1.1g at its peak amplitude. For full protocol implementation see Table 6. This was implemented such that the testing procedure could remain manageable while the specimen was incrementally deteriorating. The objective was to induce failure in the brick infill walls to the threshold of damage initiation–serious damage while maintaining the steel reinforcement below yield strain.

3. Results and Discussion

3.1. Acceleration Results

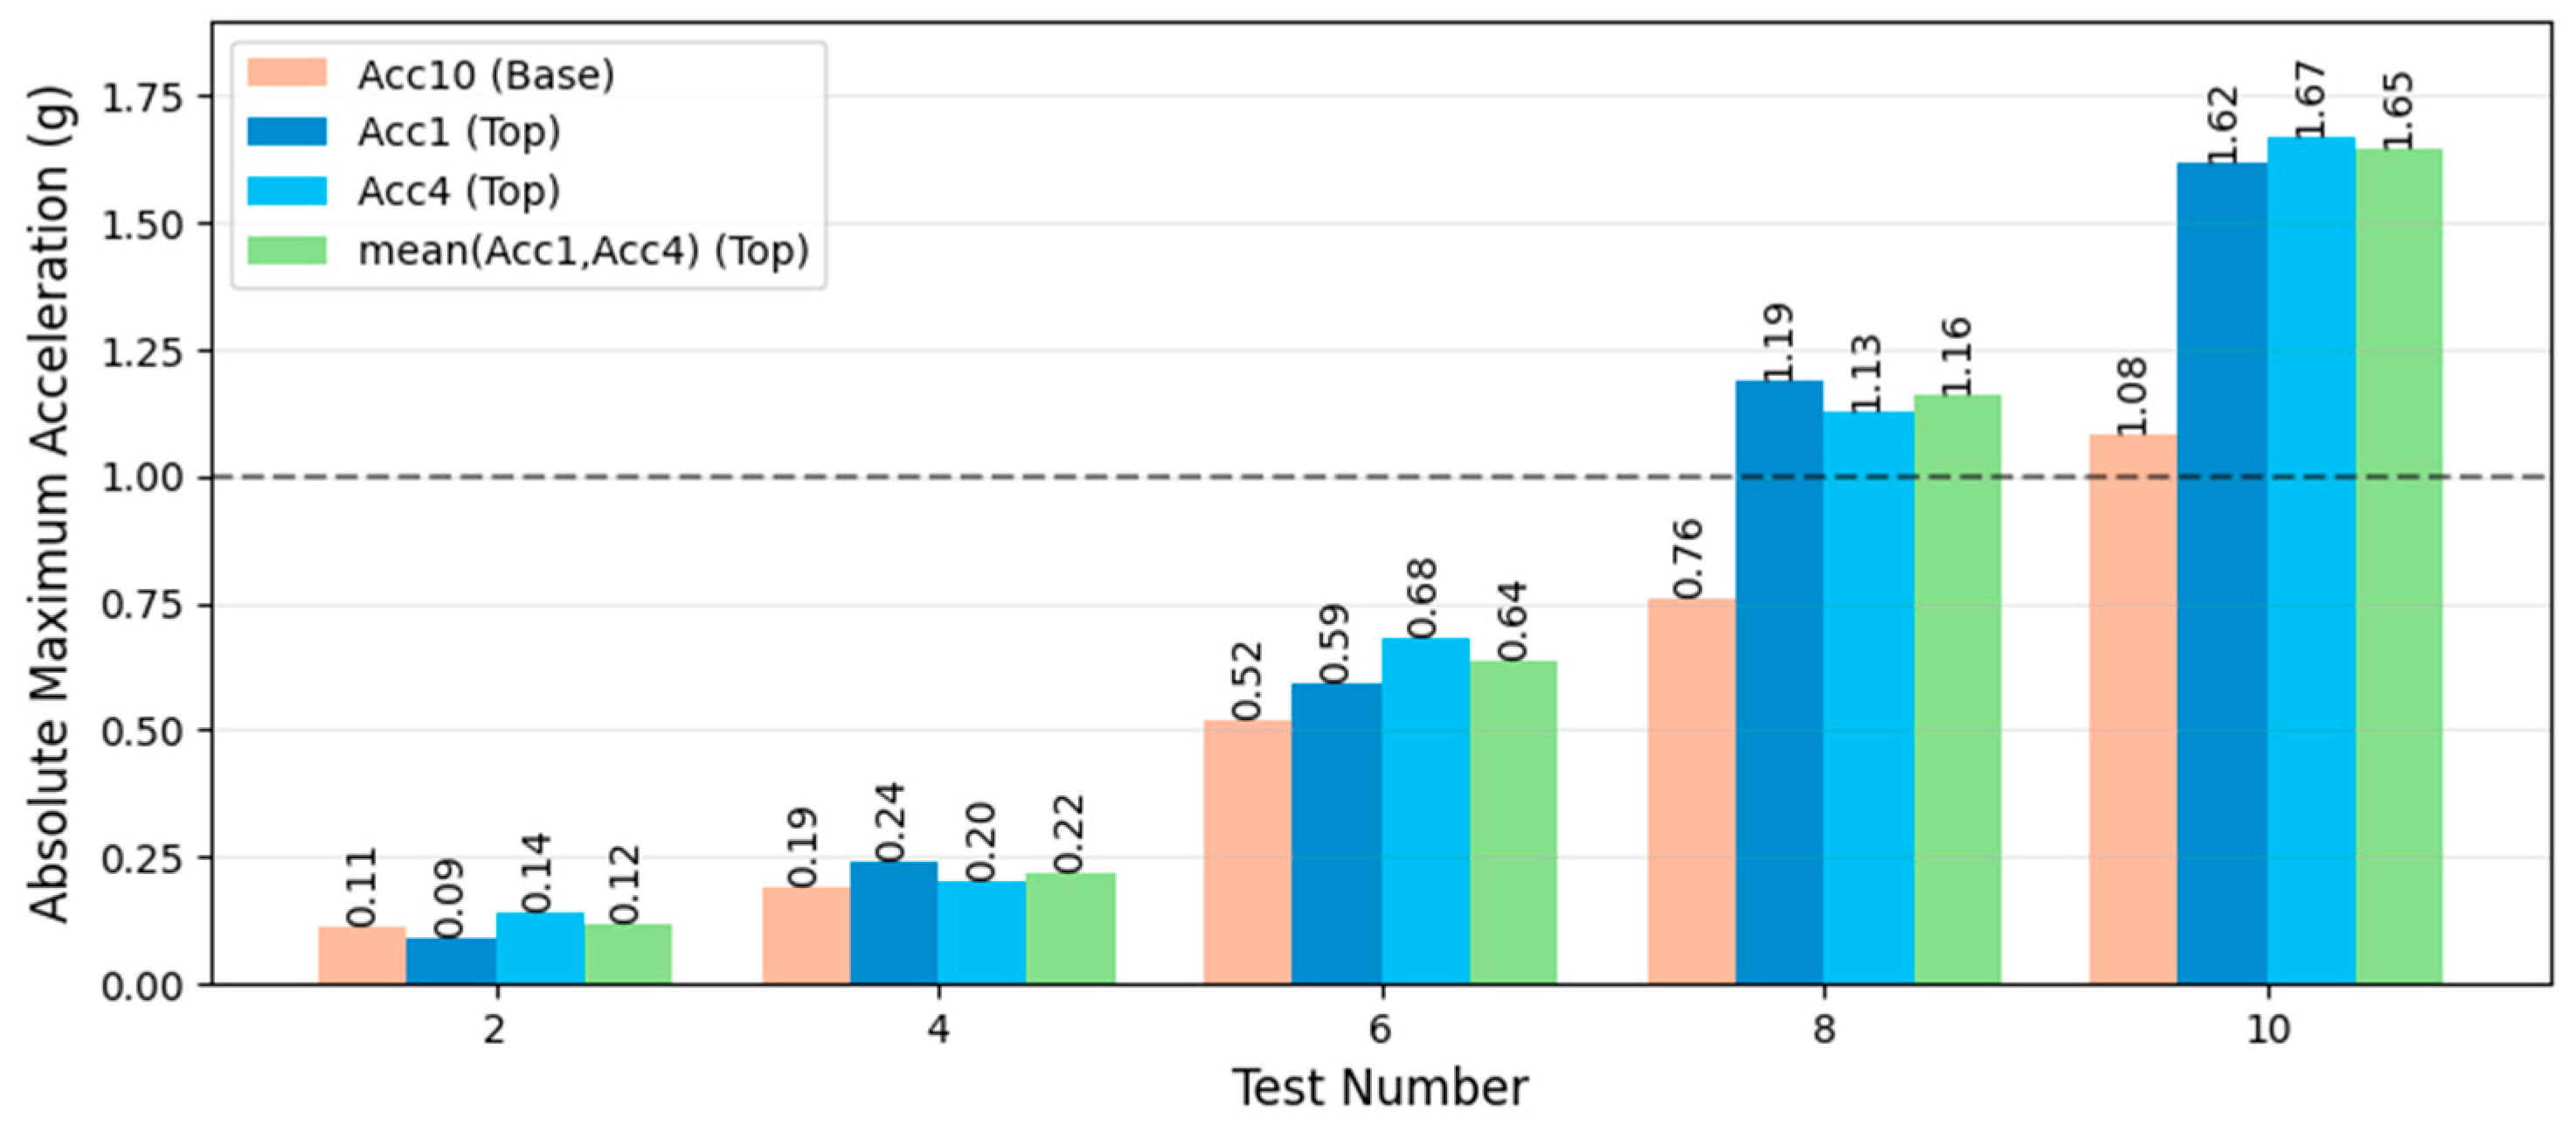
The dynamic acceleration response characteristics of the single-story reinforced concrete structural frame with masonry brick infill wall assemblies were comprehensively monitored through a network of twelve precision accelerometers positioned at strategically selected measurement locations throughout the test specimen. The structural system was subjected to five progressively increasing earthquake excitation intensity levels based on the recorded seismic ground motion from the Thessaloniki 1978 earthquake event, in other words with peak ground acceleration amplitudes ranging from 0.10 g to 1.10 g loading intensity applied through the shake table testing apparatus. The measured peak ground acceleration (PGA) values recorded at the foundation center location by accelerometer ACC10 were 0.11 g, 0.19 g, 0.52 g, 0.76 g, and 1.08 g for the respective earthquake loading intensities of seismic test numbers 2, 4, 6, 8, and 10 (ST2, ST4, ST6, ST8, and ST10), while the corresponding peak floor acceleration (PFA) responses measured at the upper slab level through accelerometers ACC1 and ACC4 reached maximum values of 0.14 g, 0.24 g, 0.68 g, 1.19 g, and 1.67 g, respectively. The calculated floor-to-foundation acceleration amplification factors (FAFs) demonstrated a distinct behavioral trend; they increased from 1.26 during the lowest intensity seismic excitation to 1.57 during the 0.80 g loading intensity (seismic test number 8), followed by a marginal reduction to 1.55 during the maximum 1.10 g excitation level (seismic test number 10), indicating progressive structural stiffness degradation and the onset of nonlinear dynamic response behavior in the infilled reinforced concrete frame system. Detailed information is depicted in Figure 9.
During the white noise excitations conducted before and after each earthquake test, additional insights into the dynamic characteristics of the structural system were provided. The white noise testing procedures, performed at a consistent 0.08g input loading intensity, showed floor acceleration amplification factors ranging from 1.0 to 3.13, with the maximum amplification occurring before seismic test number 8 at 0.80 g earthquake loading intensity. This pronounced dynamic amplification during the pre-0.80 g white noise excitation (3.13×) indicated significant changes in the structural stiffness and damping characteristics of the system, which were correlated with the severe debonding observed in the infill wall between columns 3 and 4. The post-1.10 g white noise testing (seismic test number 11) maintained an elevated amplification factor of 2.11, confirming permanent changes to the dynamic properties of the structural system following the completion of the entire testing sequence. Detailed information of the result is depicted in Table 7.
The acceleration response behavior of the masonry infill wall assemblies exhibited particularly significant dynamic characteristics, with accelerometer ACC7 positioned at the central location of the full infill wall assembly recording dramatic increases in out-of-plane acceleration amplitudes. During seismic test number 6 (ST6) at 0.50 g earthquake loading intensity, this accelerometer registered 1.72 g peak acceleration, which represents a substantial increase from the 0.37 g recorded during seismic test number 4 (ST4) at 0.20 g loading intensity, indicating the onset of significant masonry infill wall dynamic amplification behavior. The maximum infill acceleration response of 2.19 g occurred during seismic test number 10 (ST10) at 1.10 g earthquake loading intensity, demonstrating severe out-of-plane dynamic response behavior that corresponded directly with the observed structural damage patterns in the brick–mortar assembly. Time lag analysis between peak foundation acceleration and peak slab acceleration responses revealed temporal delay values ranging from 0.16 s during moderate intensity seismic excitations to 4.35 s during the maximum intensity loading test. This delay suggesting increased structural flexibility characteristics and potential progressive damage accumulation within the infilled reinforced concrete frame system.

3.2. Draw-Wire Results

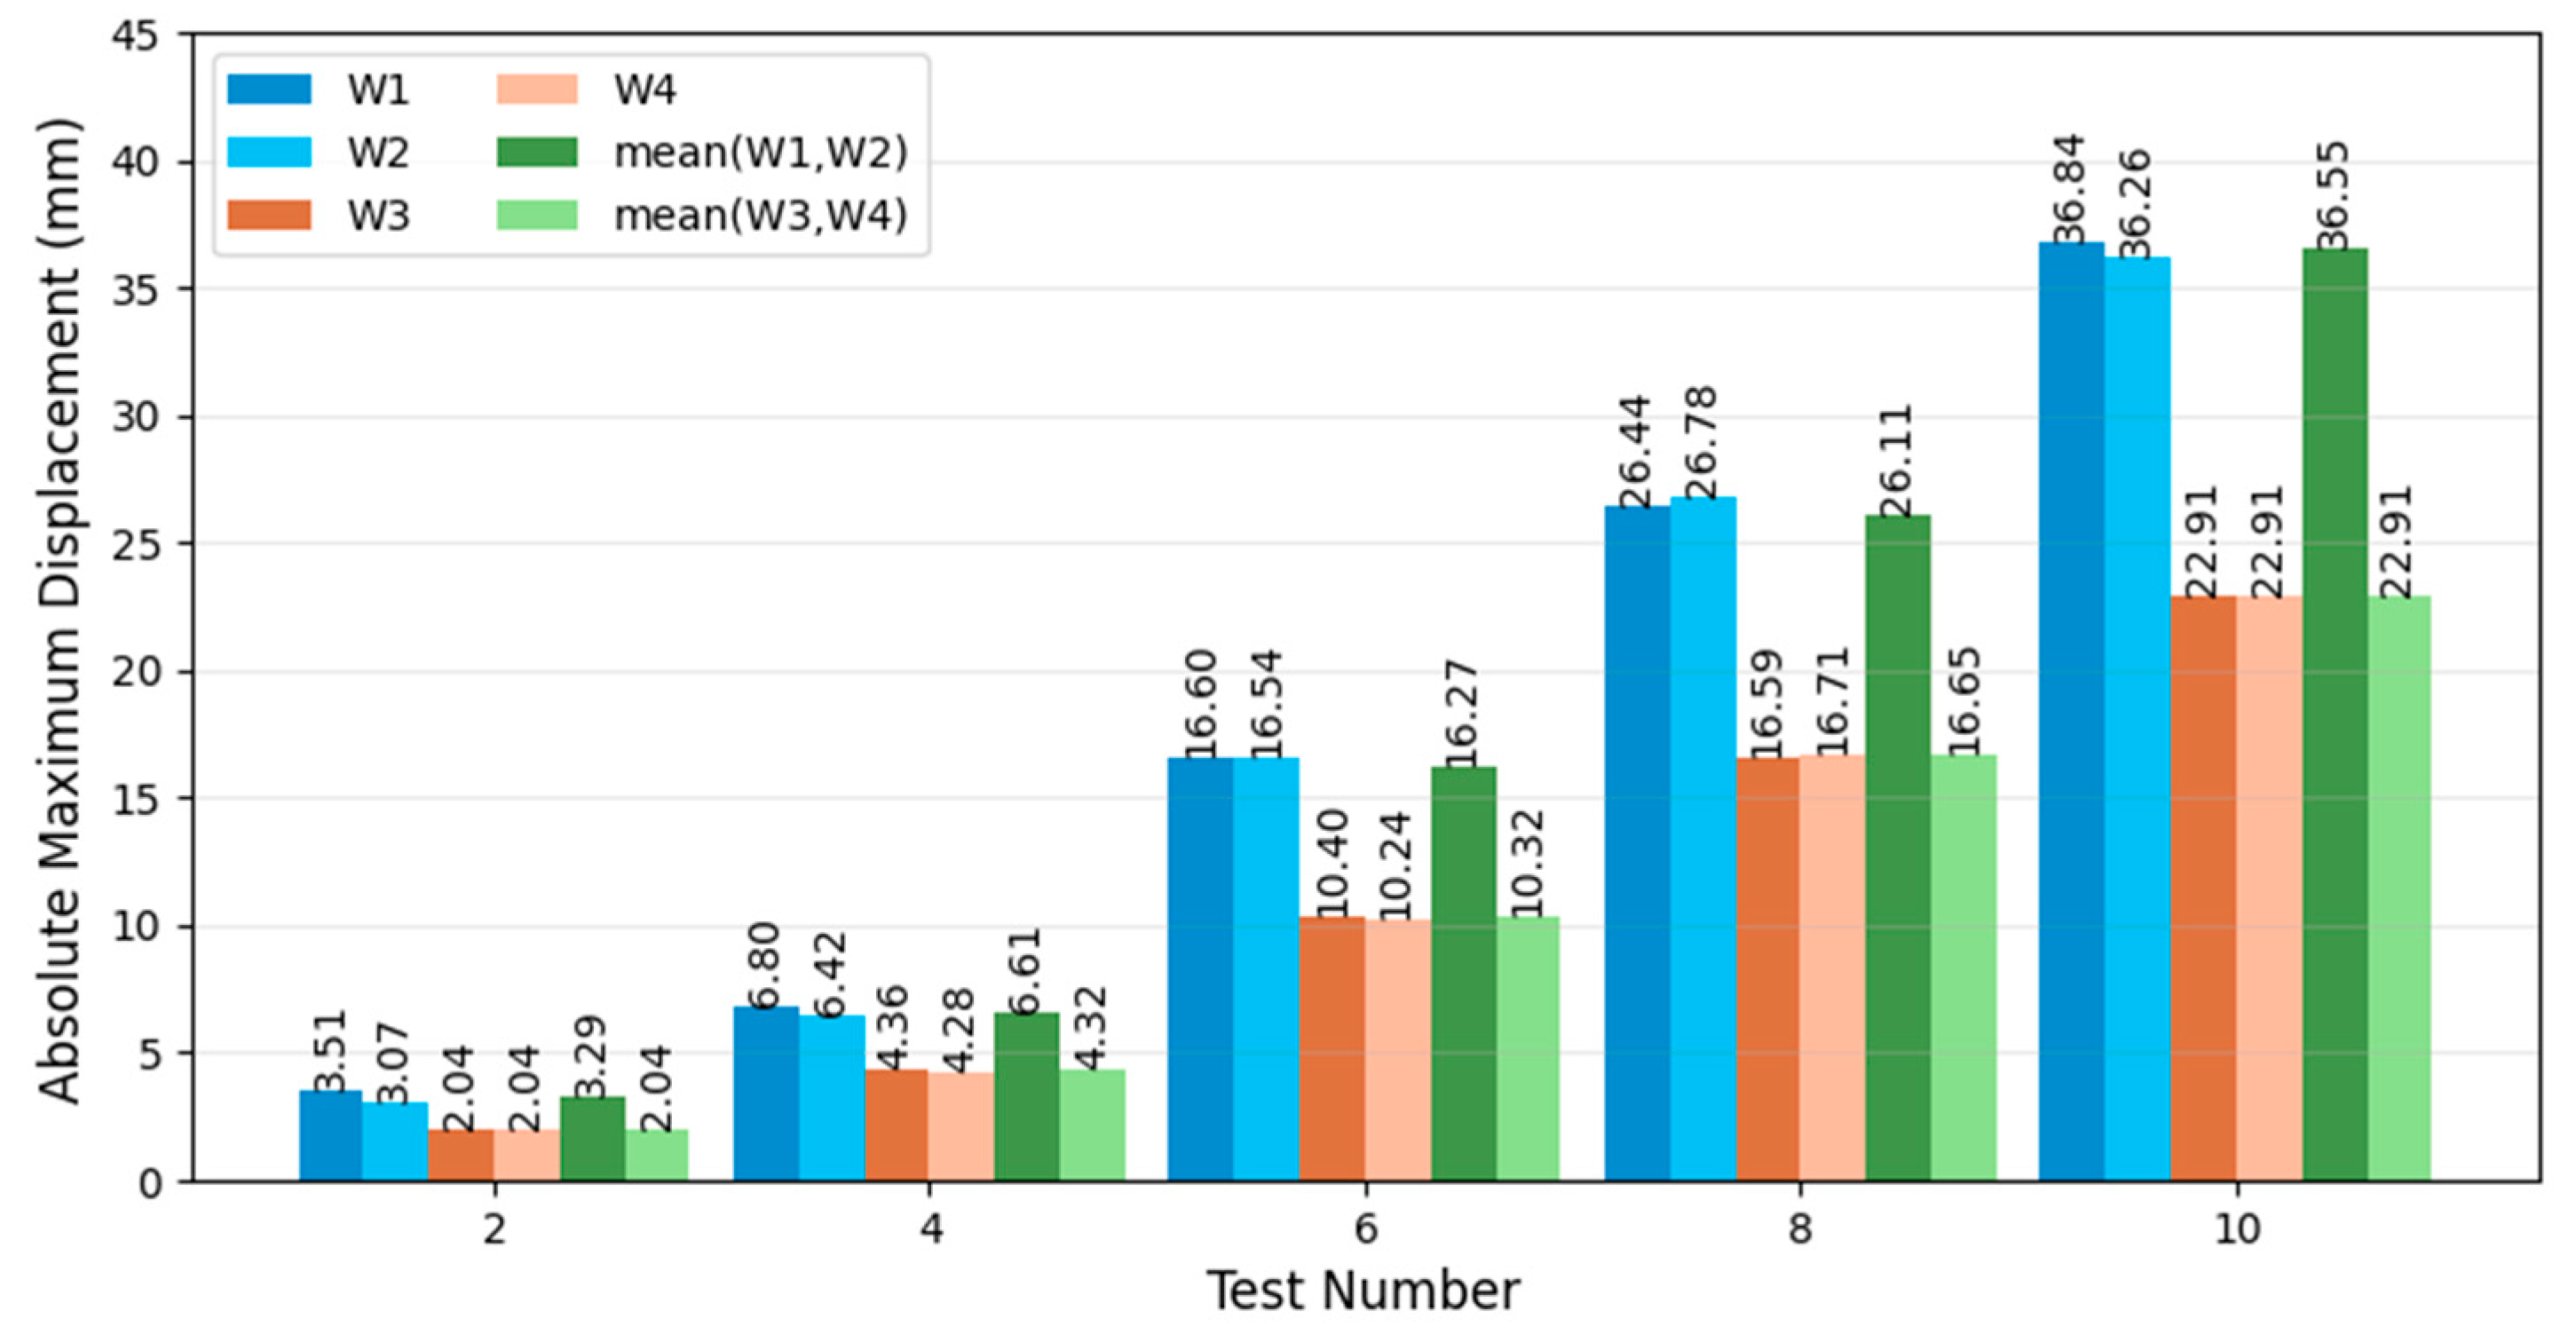
Eight draw-wire displacement sensors (W1 through W8) were used to monitor how the structure moved during testing. These sensors had two main jobs—four sensors (W1–W4) tracked the overall building movement, while the other four (W5–W8) focused on what was happening locally with the infill walls. The main displacement measurements came from sensors W1–W4. W1 and W2 sat on the slab, positioned at the left and right sides, respectively. W3 and W4 were down at the foundation beam level in similar positions. When the strongest shaking at 1.1g was executed, the slab sensors showed some significant movement—W1 hit +36.84 mm/−34.76 mm while W2 reached +36.26 mm/−34.37 mm. The foundation sensors did not move quite as much, with W3 measuring +22.91 mm/−21.69 mm and W4 obtaining +22.91 mm/−21.69 mm. Looking at the drift patterns, a steady increase pattern is obvious as the tests progressed. The drift started small at 1.20‰ for EQ0.1g excitation, but by excitation EQ1.1g it had grown to 11.37‰ (that is 13.93 mm). After all excitations, there was a negligible 0.25 mm of residual drift (0.204‰) measured, which suggests that the structure bounced back reasonably well. A summary of results is depicted in Figure 10 and Table 8.
The other four sensors—W5, W6, W7, and W8—were placed along the diagonal lines of the partial masonry infills to measure differential displacement along the diagonal of the infill walls themselves. During the final EQ1.1g test, the diagonal movements reached their peak values. W5 showed the highest range at +5.17 mm/−3.69 mm, while W6 hit +4.44 mm/−2.83 mm. W7 was not far behind with +4.55 mm/−3.32 mm, and W8 reached +4.43 mm/−2.39 mm. It was noticed that these diagonal sensors were negligibly activated during the early, gentler tests—the EQ0.1g and EQ0.2g runs showed almost nothing. But from EQ0.5g and beyond, the readings increased significantly, which lined up reasonably well with when we first started seeing the infill walls being damaged. The sensors on opposite diagonals did not always move the same way either, which tells us that the infill panels were deforming in some fairly complex patterns. The abovementioned quantified results may help explain the damage inspections that follow.

3.3. Strain Gauge Results

During the strain gauge instrumentation monitoring of the reinforced concrete structural elements, 20 sensors were distributed throughout the structure. Specifically, S1–S8 monitored longitudinal reinforcement at the column bases of the structure, S9–S16 at the column tops of the structure, and S17–S20 measured strains at infill wall centers of the structure. During the progressive seismic testing sequence, distinct behavioral patterns were observed, with damage initiation occurring during seismic test number 6 (ST6), at EQ0.50g loading intensity, where strain gauges SG1, SG4, SG8, SG11, and SG14 exhibited 2–4 times higher strain responses compared to previous loading stages of the structure. During seismic test number 8 (ST8), at EQ0.80g loading intensity, several strain gauges demonstrated more than double the strain magnitudes recorded during seismic test number 6 (ST6), coinciding with the development of additional cracks in bed joints and concrete-to-concrete interfaces of the structure. The maximum recorded strain responses occurred during seismic test number 10 (ST10), at 1.10 g loading intensity, with strain gauge SG5 at the external face of the bottom of column 2 recording the highest tensile strain of 2334.67 μstrain and compressive strain of 1136.19 μstrain.
During the structural response analysis of the reinforced concrete elements, it was demonstrated that all B500C steel reinforcement remained within the elastic range throughout the testing sequence, specifically with maximum measured strains of 2000–2350 μstrain remaining well below the yield strain threshold of 2890 μstrain of the steel material. Column 2 of the structure experienced the most severe straining responses, with critical strain readings from SG6 (1763.86 μstrain tensile), SG9 (1979.40 μstrain tensile), and SG10 (1961.66 μstrain tensile), indicating concentrated stress demand at both top and bottom reinforcement levels of the structure. During the partial infill wall strain gauge monitoring, significantly lower strain magnitudes were recorded, in other words, with maximum values of 76.30 μstrain for SG17-SG18 and 16.25 μstrain for SG19-SG20, reflecting the different load transfer mechanisms and material properties of the masonry elements of the structure. During the residual strain analysis, a maximum permanent compressive strain of −717.39 μstrain in SG9 was revealed, indicating cumulative damage effects (higher compressive load transfer through the longitudinal steel bars due to several reasons) while maintaining the structural integrity of the structure. The strain gauge measurements provided comprehensive validation of the rather elastic performance of the structure at SLS performance level and confirmed that the observed visual damage to infill walls of the structure occurred without compromising the primary load-bearing reinforcement system. The summary of the results is presented in Table 9.

3.4. Infill Optical Damage Assessment

During the visual damage assessment of masonry infills, a progressive deterioration pattern of brick–mortar interfaces were observed as the intensity of the load was increased. At very low seismic excitation ST1-ST4 (up to 0.20 g), no visible damage was observed to any of the infills of the structure. The first indication of structural stress appeared during seismic test number 6 (ST6), at 0.50 g loading intensity, where the infill wall between columns 3 and 4 began to accumulate damage.
The deterioration progression of the masonry infill intensified during the white noise excitation ST7 (before the 0.80 g seismic loading), when the infill wall between columns 3 and 4 exhibited the maximum out-of-plane dynamic acceleration response at its central location, which was accompanied by severe debonding of the brick–mortar assembly from both lateral column surfaces and the upper slab connection interface. During the following seismic test number 8 (ST8) at 0.80 g earthquake excitation intensity, further structural deterioration was observed, with the formation of horizontal cracks within the mortar bed joints between individual brick units and additional cracking at the concrete-to-concrete connection interfaces between the reinforced concrete columns and the upper reinforced concrete slab.
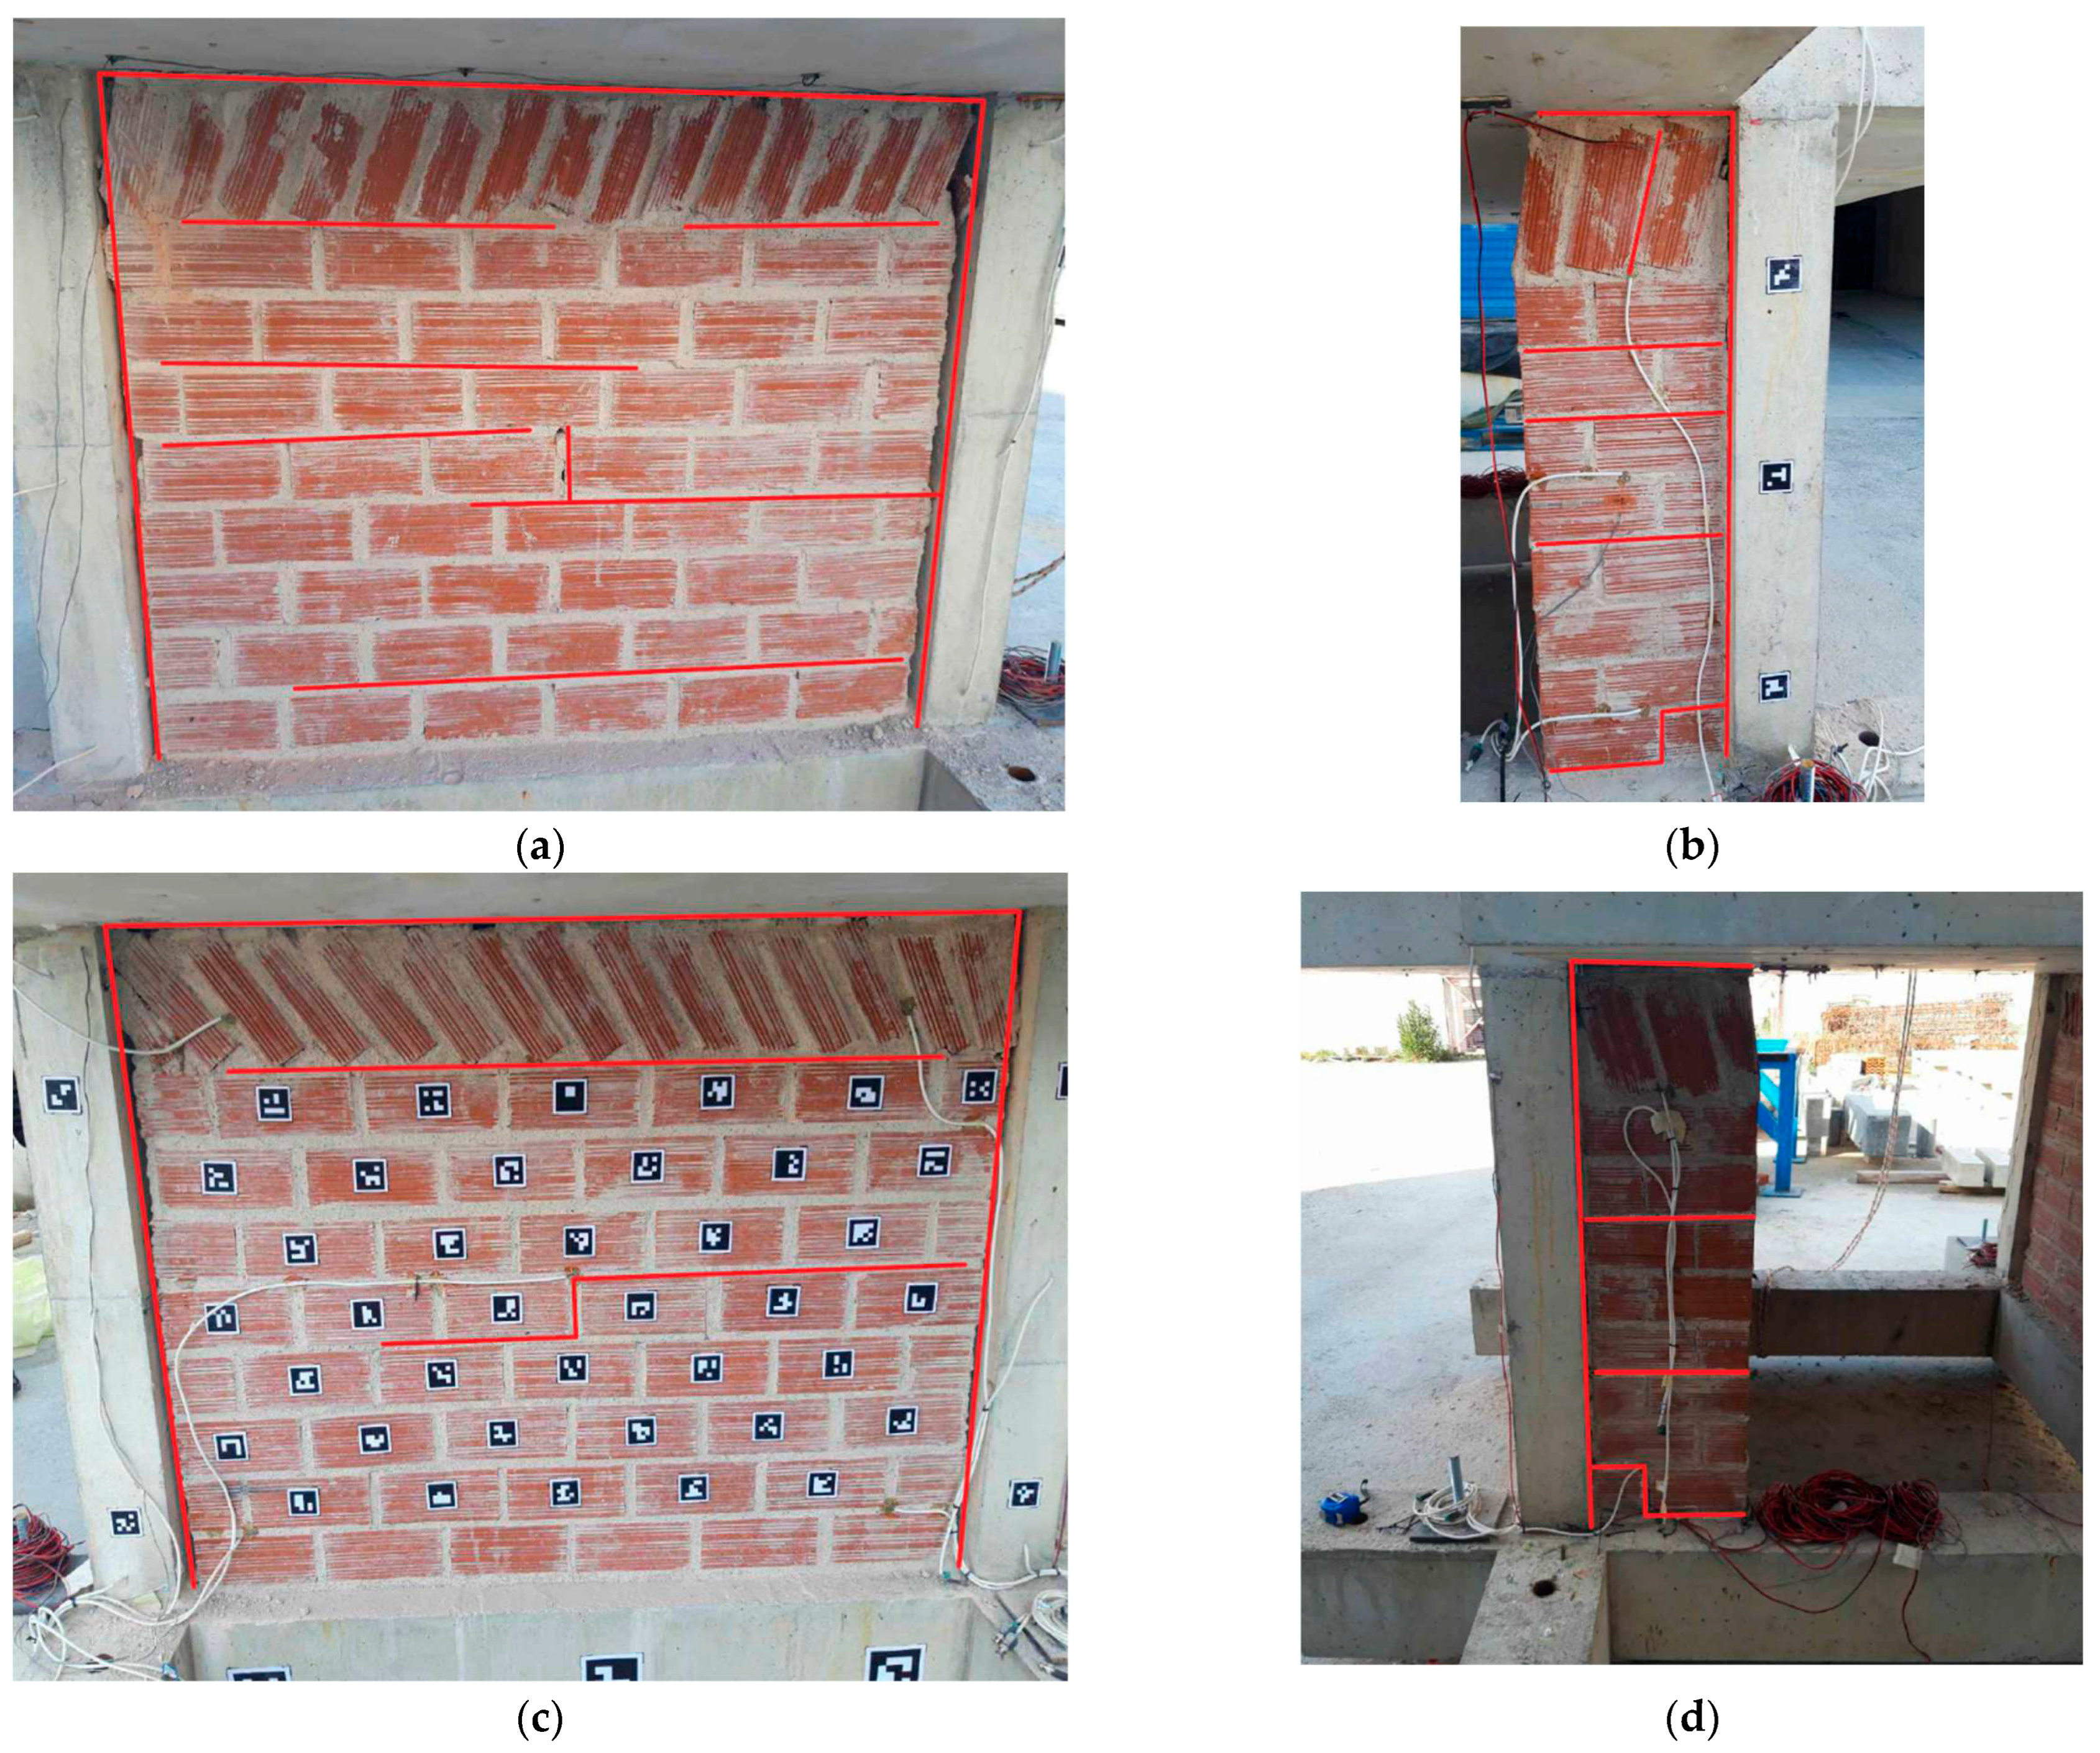
Following the completion of the final seismic test number 10 (ST10) at EQ1.10g earthquake excitation intensity, comprehensive post-test damage assessment of the masonry infill system revealed distinct cracking mechanisms and debonding failure characteristics for each individual infill wall panel, as documented in Figure 11. The spatial distribution of structural damage exhibited pronounced directional dependencies that were directly correlated to the orientation of the applied seismic loading direction relative to the plane of each infill wall assembly. A detailed discussion of damages for the final stage is provided.
Masonry Infill Wall 3–4 (Oriented Perpendicular to Applied Seismic Loading Direction): The brick–mortar assembly positioned between reinforced concrete columns 3 and 4 experienced the most extensive structural deterioration, exhibiting thin horizontal flexural cracks propagating along the mortar bed joints between the first and second horizontal brick courses, with additional horizontal cracking mechanisms developing between the fourth and fifth brick courses, and further crack formation between the sixth and seventh horizontal brick rows. Two pronounced horizontal separation cracks formed beneath the uppermost brick course at the top of the wall assembly. Complete interface debonding failure occurred at the brick–concrete connections from both lateral reinforced concrete columns 3 and 4, as well as complete separation from the upper reinforced concrete slab connection, constituting the most severe structural failure mechanism observed throughout the experimental testing program.
Infill wall between columns 1 and 2 (opposite masonry panel, Oriented Perpendicular to Applied Seismic Loading Direction): This masonry infill panel developed minor stair-stepped diagonal crack formations concentrated at the central region of the wall assembly, with one prominent horizontal crack formation occurring at the mortar bed joint interface between the eighth and ninth brick courses. Similarly to the structural response observed in the infill wall between columns 3 and 4, complete debonding of the brick–mortar assembly was observed in the adjacent reinforced concrete columns 1 and 2 and the upper reinforced concrete slab connection interface.
Partial Masonry Infill between columns 2 and 3 (Oriented Parallel to the Seismic Loading Direction): The observed damage pattern of this brick–mortar assembly included two distinct horizontal cracks located between the fourth and fifth and sixth and seventh brick courses, with an additional horizontal crack formation between the seventh and eighth brick rows, and diagonal crack propagation at the uppermost brick course. A slight stair-stepped diagonal crack pattern appeared within the first row of masonry units. Severe debonding of the brick–mortar interface occurred in the adjacent reinforced concrete column 2 surface and the upper reinforced concrete slab connection interface.
Partial masonry infill wall between columns 1 and 4 (Oriented Parallel to the Seismic Loading Direction): The brick–mortar assembly of this partially infilled wall exhibited two distinct horizontal crack formations within the mortar bed joints between the third and fourth and sixth and seventh brick courses, accompanied by a small stair-stepped diagonal crack pattern at the bottom right corner of the masonry panel. Severe debonding of the brick–mortar assembly was observed in the reinforced concrete column 1 interface and the upper reinforced concrete slab connection.
An important structural observation was that the lower infill–tie beam connection interface remained intact for all infill walls subjected to out-of-plane excitation (specifically infill walls between columns 1 and 2 and between columns 3 and 4), indicating that the predominant failure mechanism was upper and lateral debonding rather than complete separation from the concrete frame structure. The observed crack formation patterns consistently followed the horizontal mortar bed joints, indicating that the mortar–brick bonding interface was the primary structural weakness under seismic loading conditions.

3.5. Assessment of the Structure Using Advanced PZTs Results

In this study, a piezoelectric (PZT) sensor network employing the electromechanical impedance (EMI) method was used to enable real-time structural health monitoring throughout the seismic testing sequence. The use of PZT transducers with the EMI-based SHM method in cementitious materials has been extensively investigated across various applications [32], and successfully implemented in real-scale structural components, including shear-critical RC beams [33], RC frames [34], and RC joints [35], under both monotonic and cyclic loading conditions. However, the application of PZT-based SHM techniques for monitoring damage in RC buildings subjected to seismic or quasi-static loading remains relatively limited. Addressing this gap is crucial, as earthquake-induced damage to critical structural members can significantly compromise their load-bearing capacity and increase the risk of catastrophic failure if not identified and mitigated promptly. The fundamental principle of the EMI technique is based on the inverse piezoelectric effect, where PZT patches function simultaneously as actuators and sensors. When an alternating voltage is applied to a PZT patch bonded to or embedded within a structural element, it generates high-frequency mechanical vibrations that interact with the local structural properties, including stiffness, mass, and damping. The electrical impedance response measured by the sensor is directly linked to the mechanical impedance of the monitored region. Any variations in structural integrity—such as crack initiation, propagation, debonding, or material degradation—lead to changes in the local mechanical properties, thereby modifying the electrical impedance signature. This strong coupling between the electrical and mechanical domains enables the early detection of structural damage, often before it becomes visually apparent, throughout the seismic testing sequence.
The comprehensive monitoring system consisted of 48 strategically positioned PZT sensors distributed throughout the reinforced concrete structure, including critical locations within columns, joints, beams, slabs, cantilevers, and on brick infill wall surfaces. Each sensor captured electromechanical impedance responses across a predefined frequency range of 10–250 kHz with a resolution of 1 kHz, generating voltage output signals that characterize the local structural condition. The baseline measurements were established during the healthy, pristine state of the structure before any seismic loading commenced, serving as reference signatures for subsequent damage assessment. The data analysis employed the Root Mean Square Deviation (RMSD) statistical index to quantify variations between baseline and damaged state measurements, calculated using the following formula:
R M S D = i = 1 M V p f i D V p f i 0 2 i = 1 M V p f i 0 2
where V p f i 0 is the absolute value of the voltage output signal extracted from the PZT sensor at the healthy pristine state of the specimen, V p f i D is the absolute value of the corresponding voltage output signal measured from the same PZT sensor at any damage level, M is the number of measurements in the frequency band, and i represents the discrete frequency points within the measurement range. Higher RMSD values indicate greater structural changes and potential damage, providing a quantitative metric for structural health assessment that can be correlated with physical damage observations.
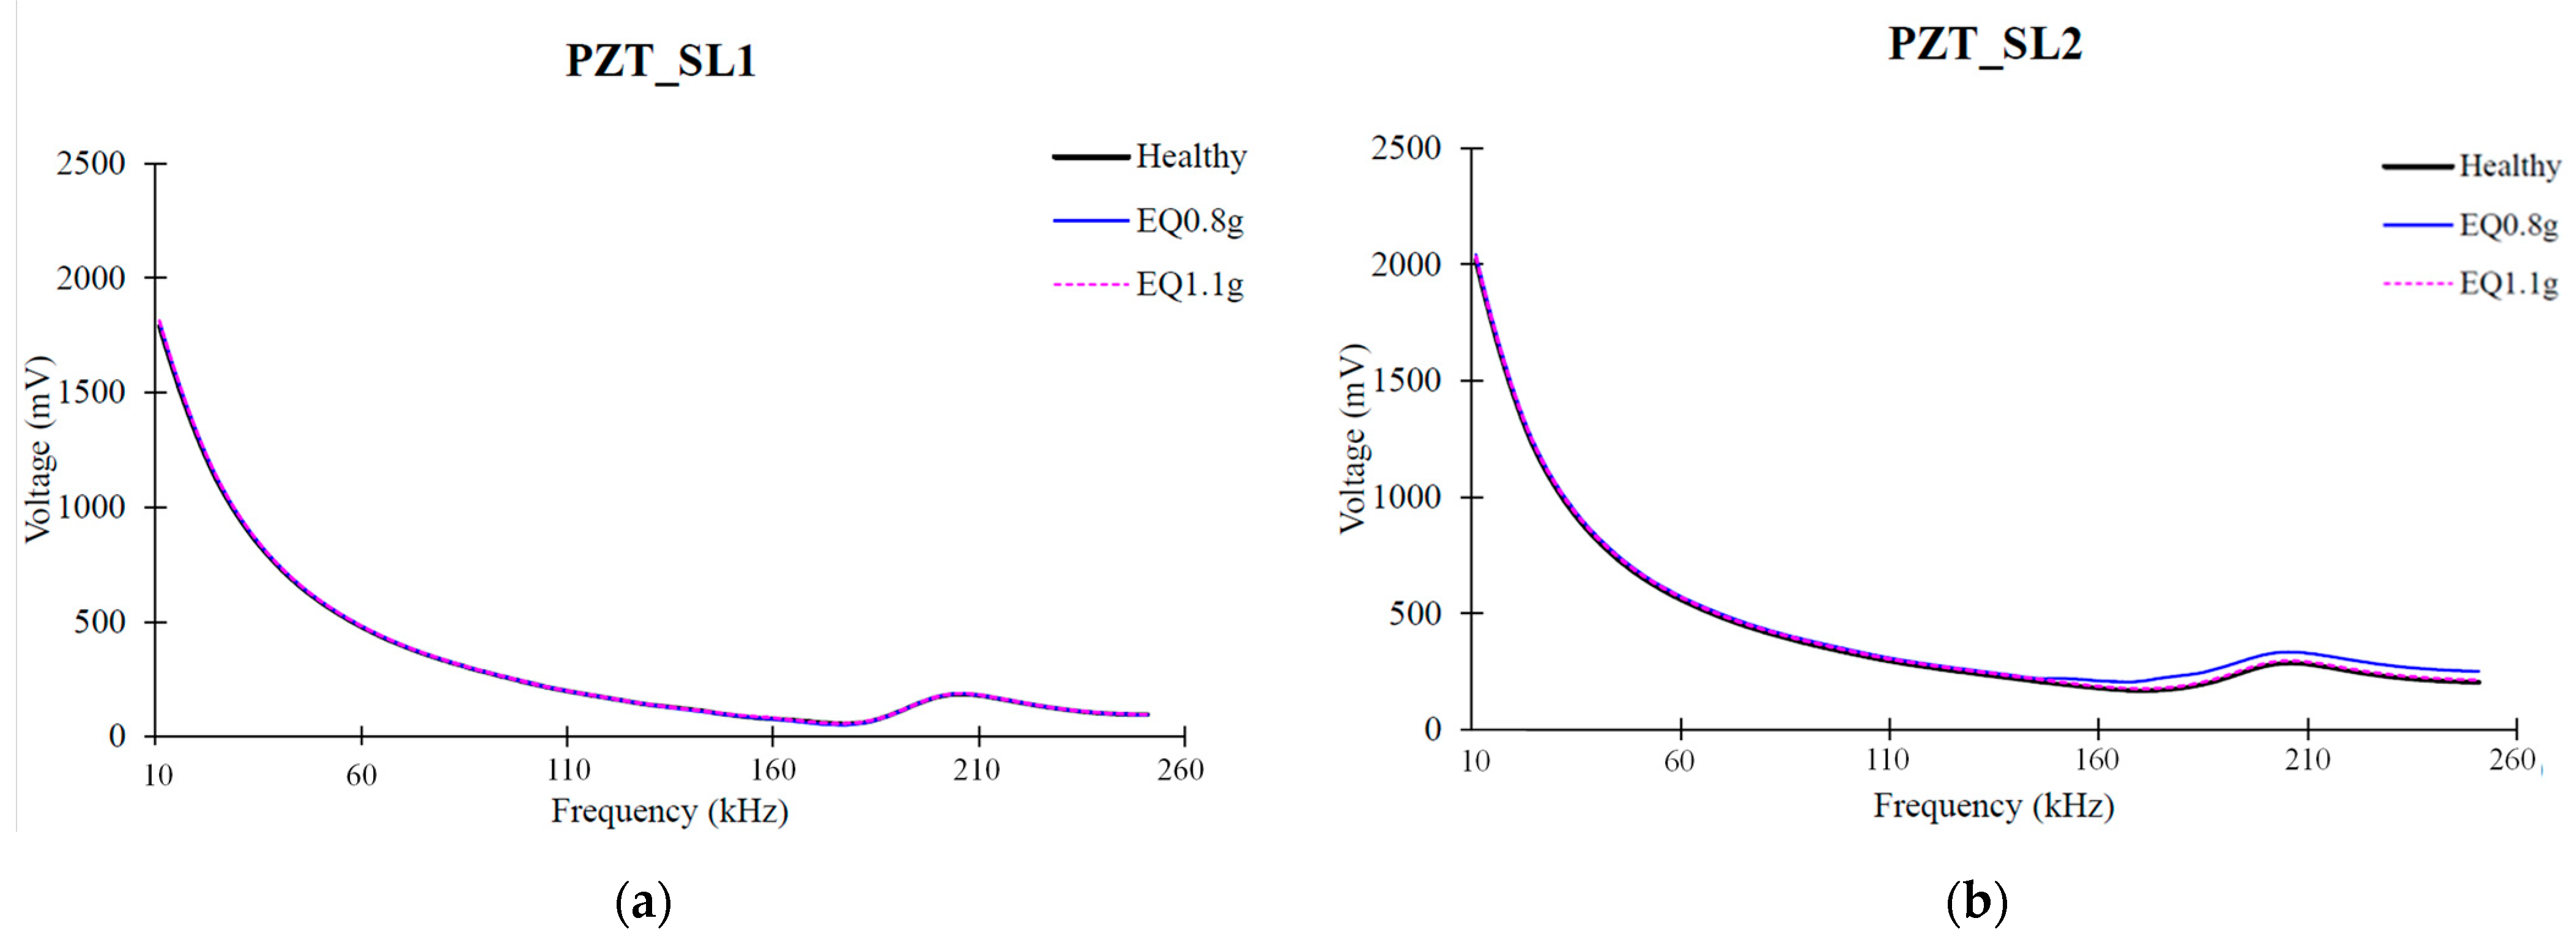
Figure 12a–c illustrate the voltage frequency responses of the PZT sensors.
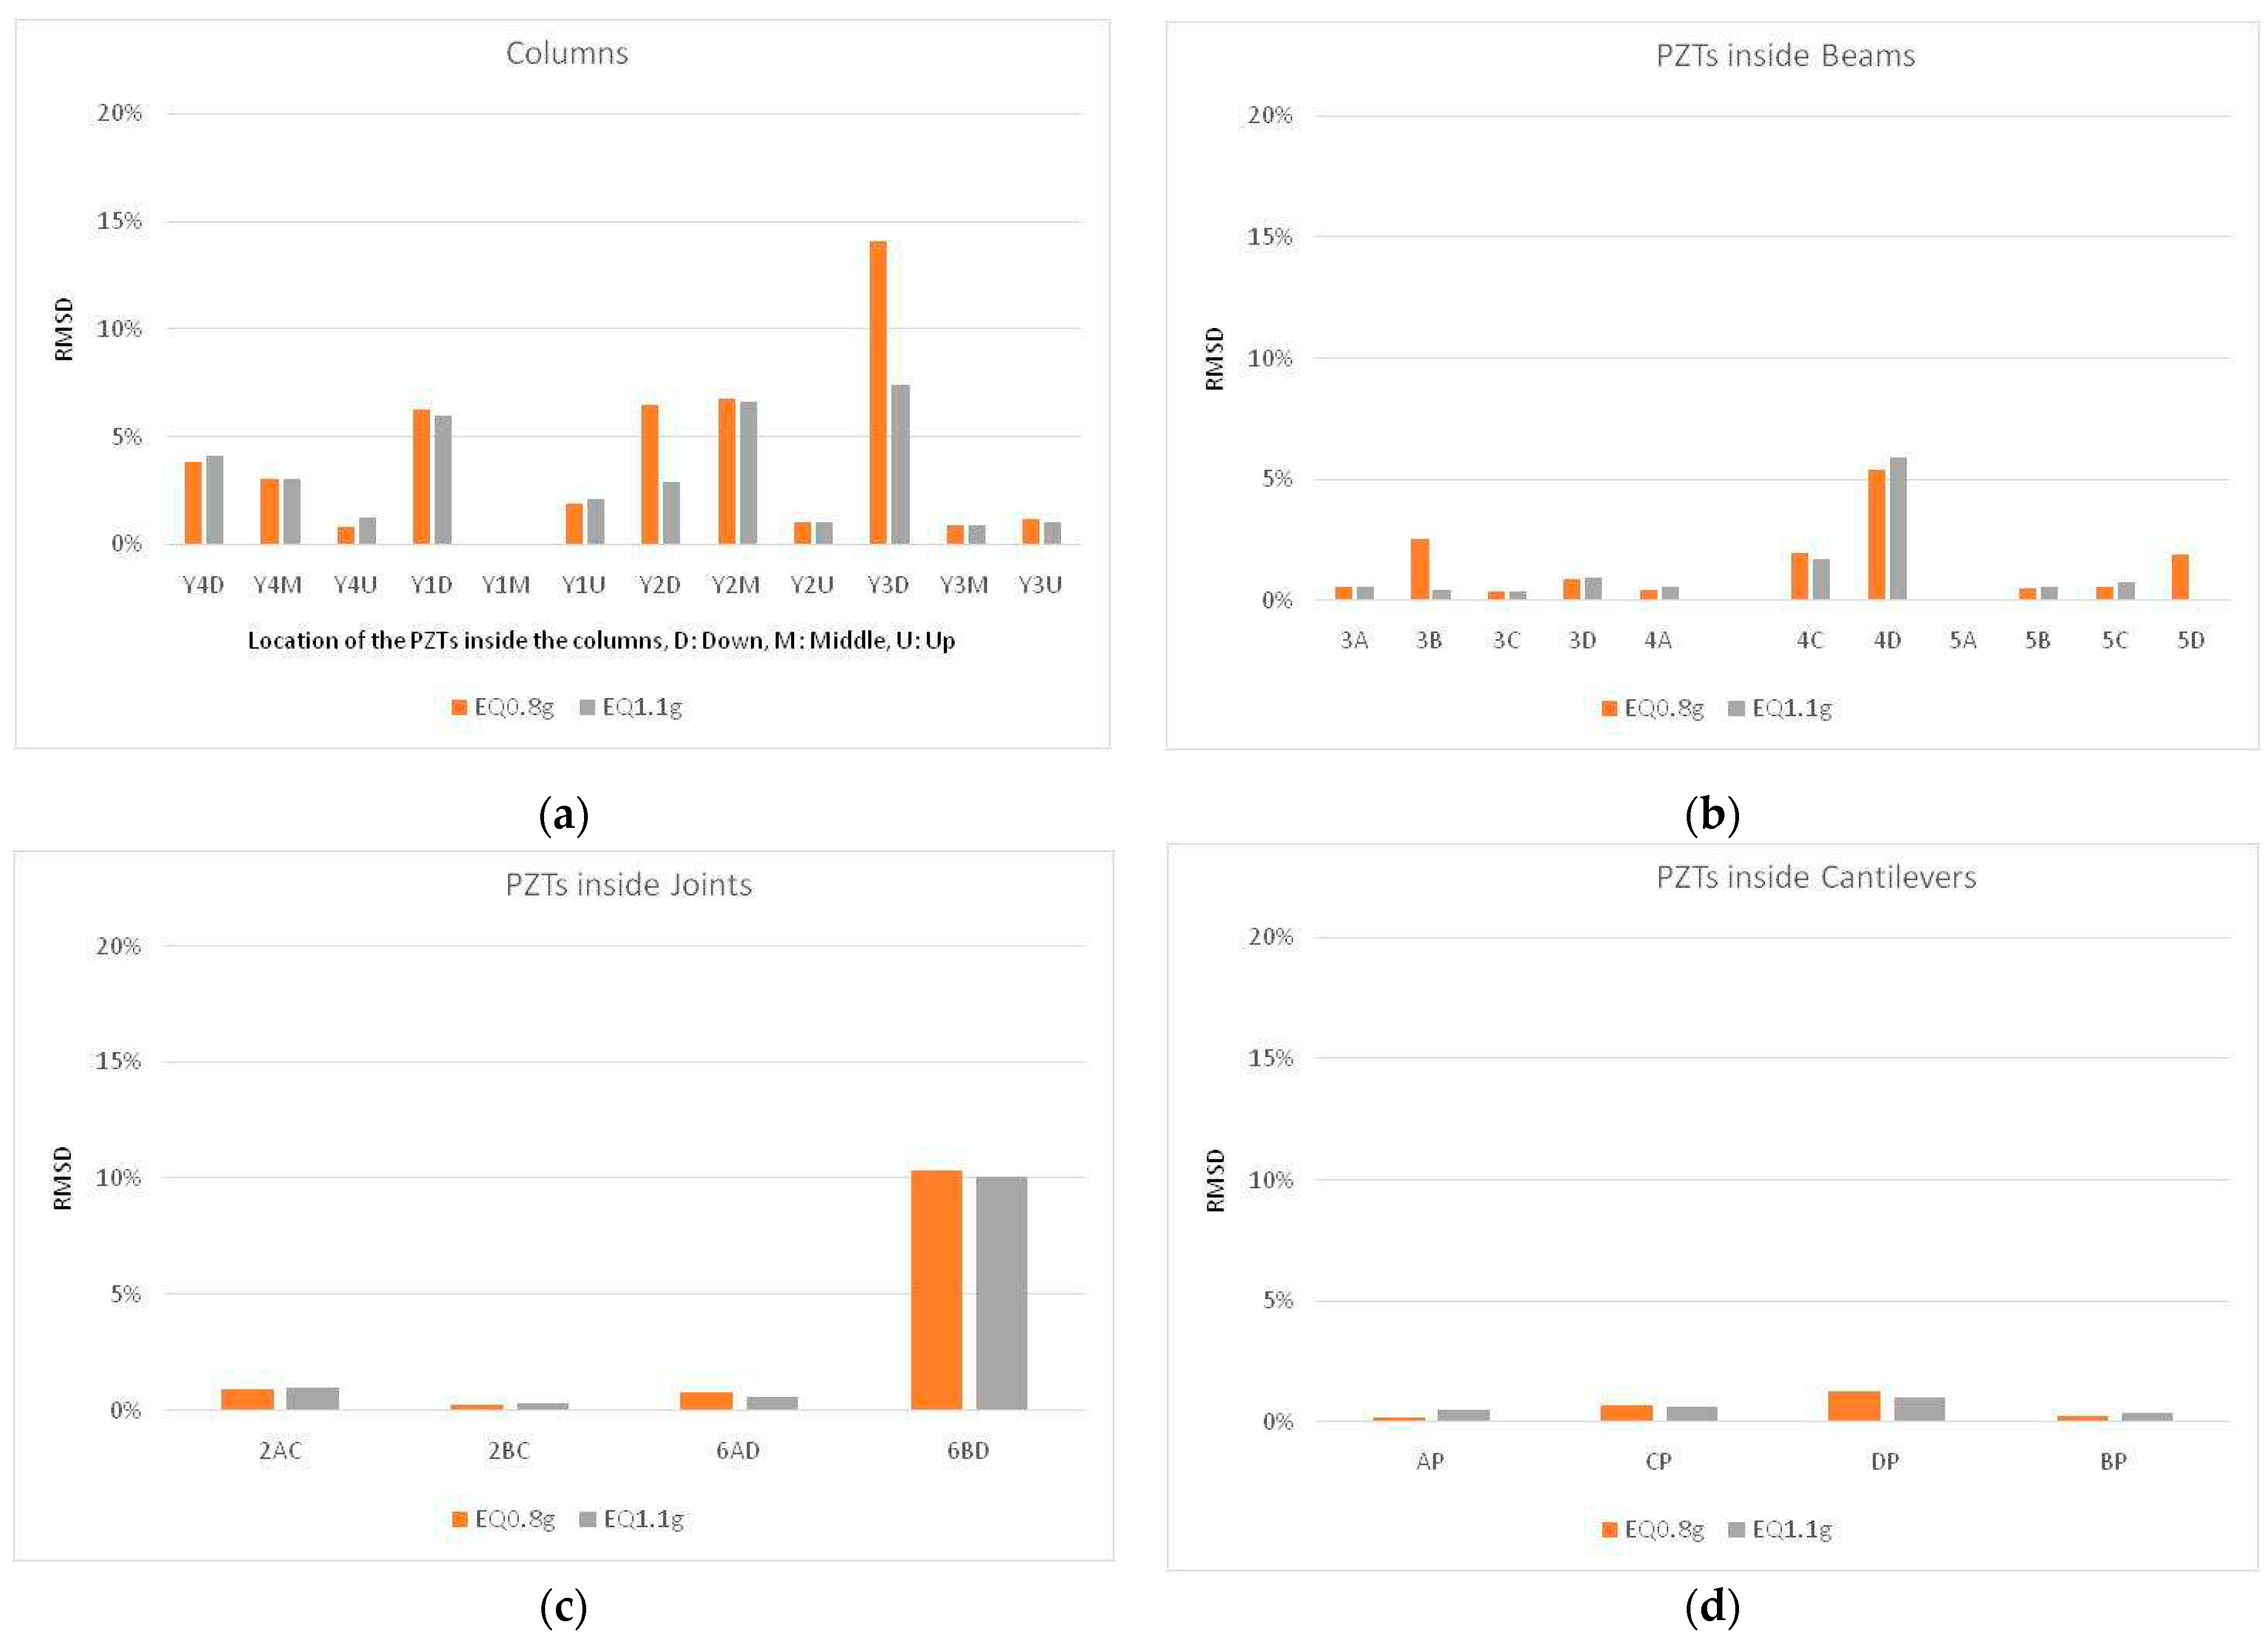
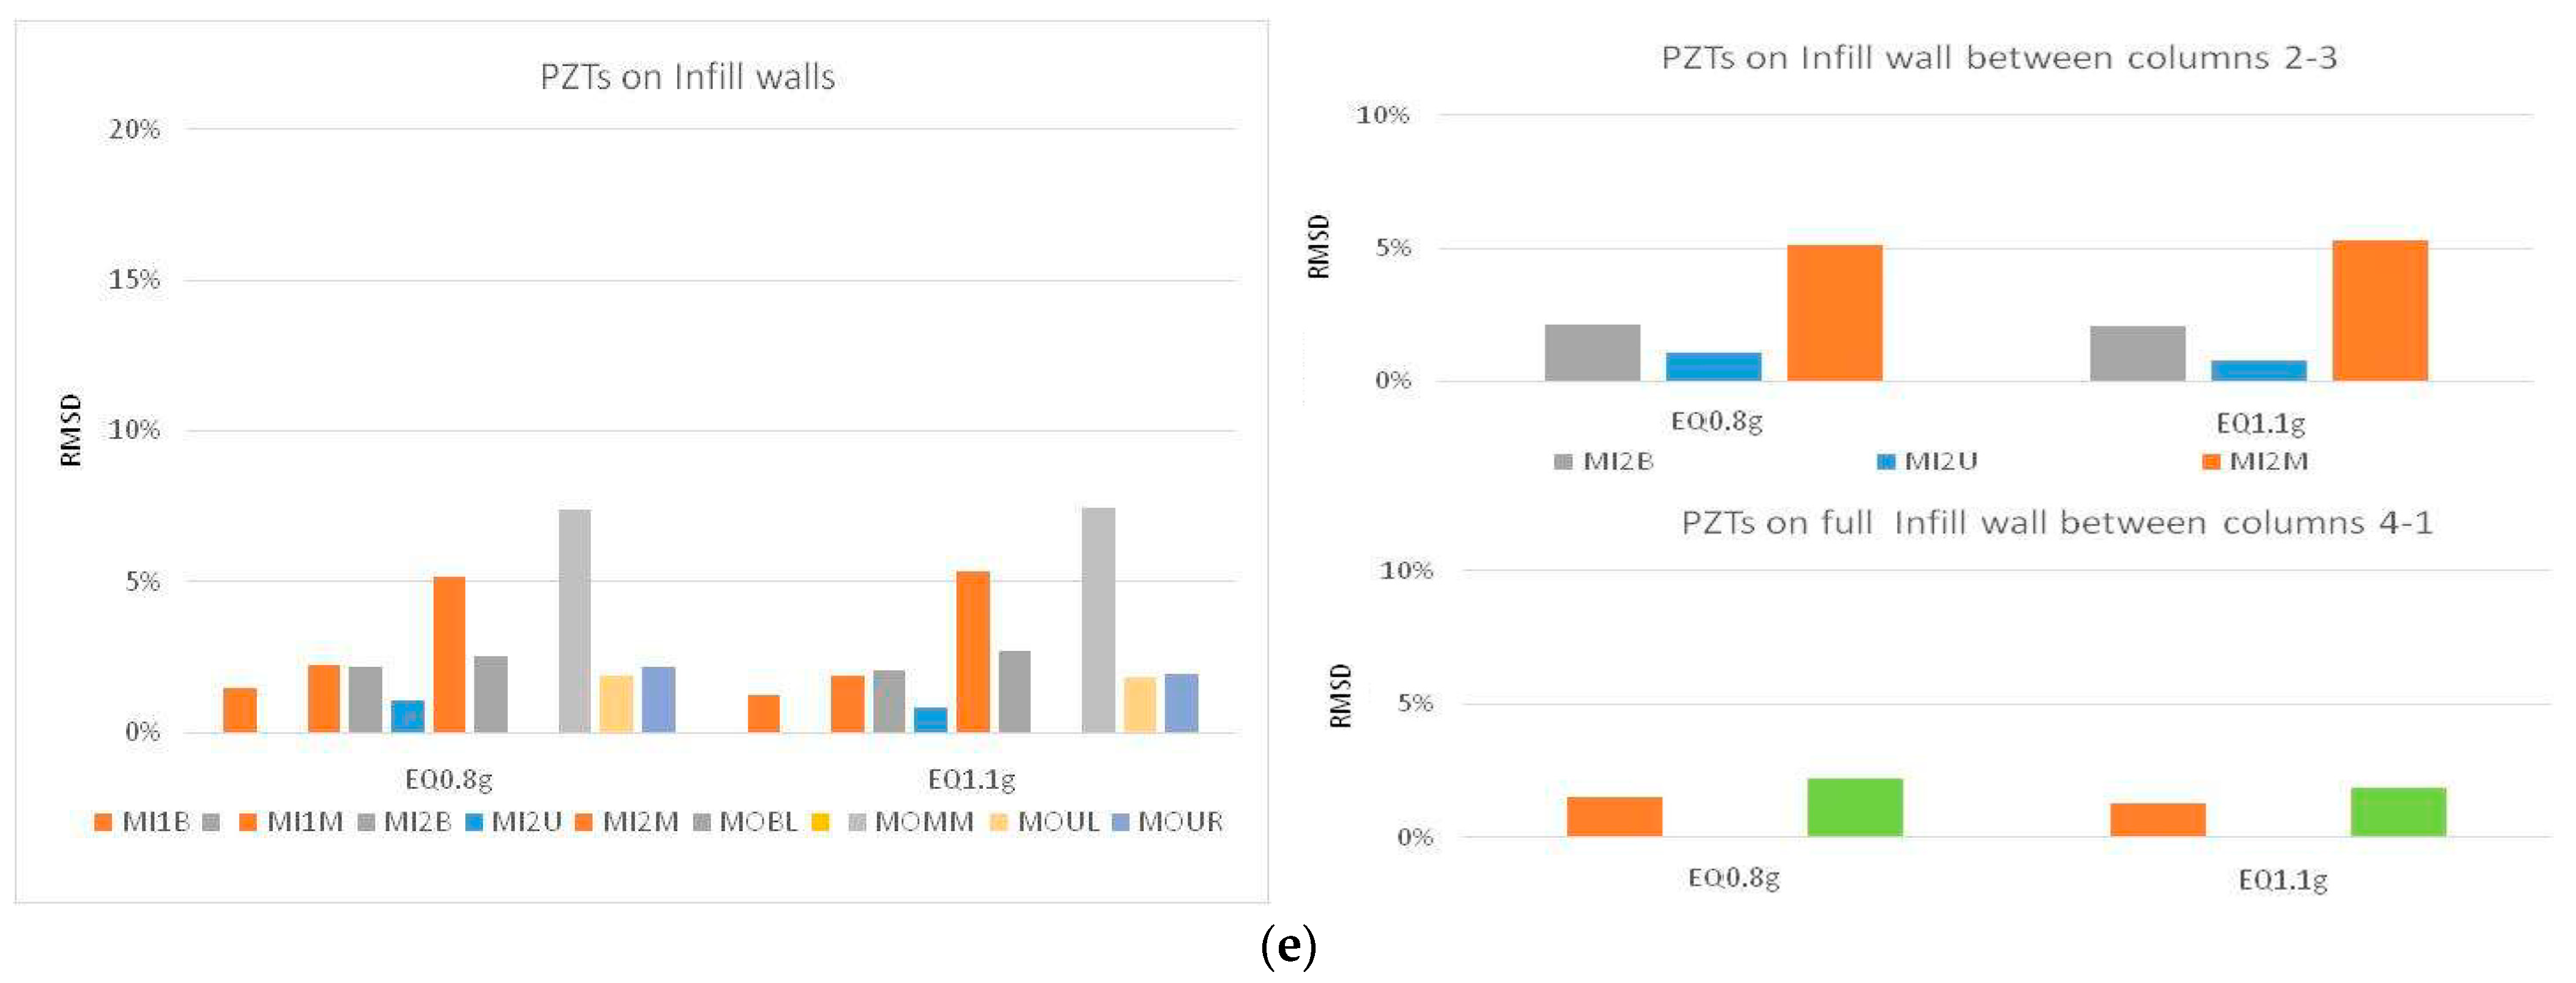
SL1, SL2, and SL3 at the healthy pristine state and after executing the two critical excitation stages EQ0.8g and EQ1.1g inside the slab. The values of RMSD (see Figure 12d) are computed from the absolute values of the voltage output responses and used to evaluate the effectiveness of the SHM method for damage diagnosis and assessment. Figure 13 contains the remaining RMSD values from other structural elements including columns, beams, joints, cantilevers, and infills.
The structural condition assessment was comprehensively evaluated through RMSD values derived from the piezoelectric sensor responses, where elevated indices serve as quantitative indicators of structural deterioration. The correlation between RMSD magnitudes and physical damage was consistently validated, with notable absence of elevated values in regions where visual inspection revealed no structural compromise.
Undamaged Structural Elements: The cantilevers and slab exhibited minimal RMSD variations, corresponding precisely with the absence of observable structural damage in these components. This correlation reinforces the discriminatory capability of the PZT monitoring system in distinguishing between damaged and intact structural regions.
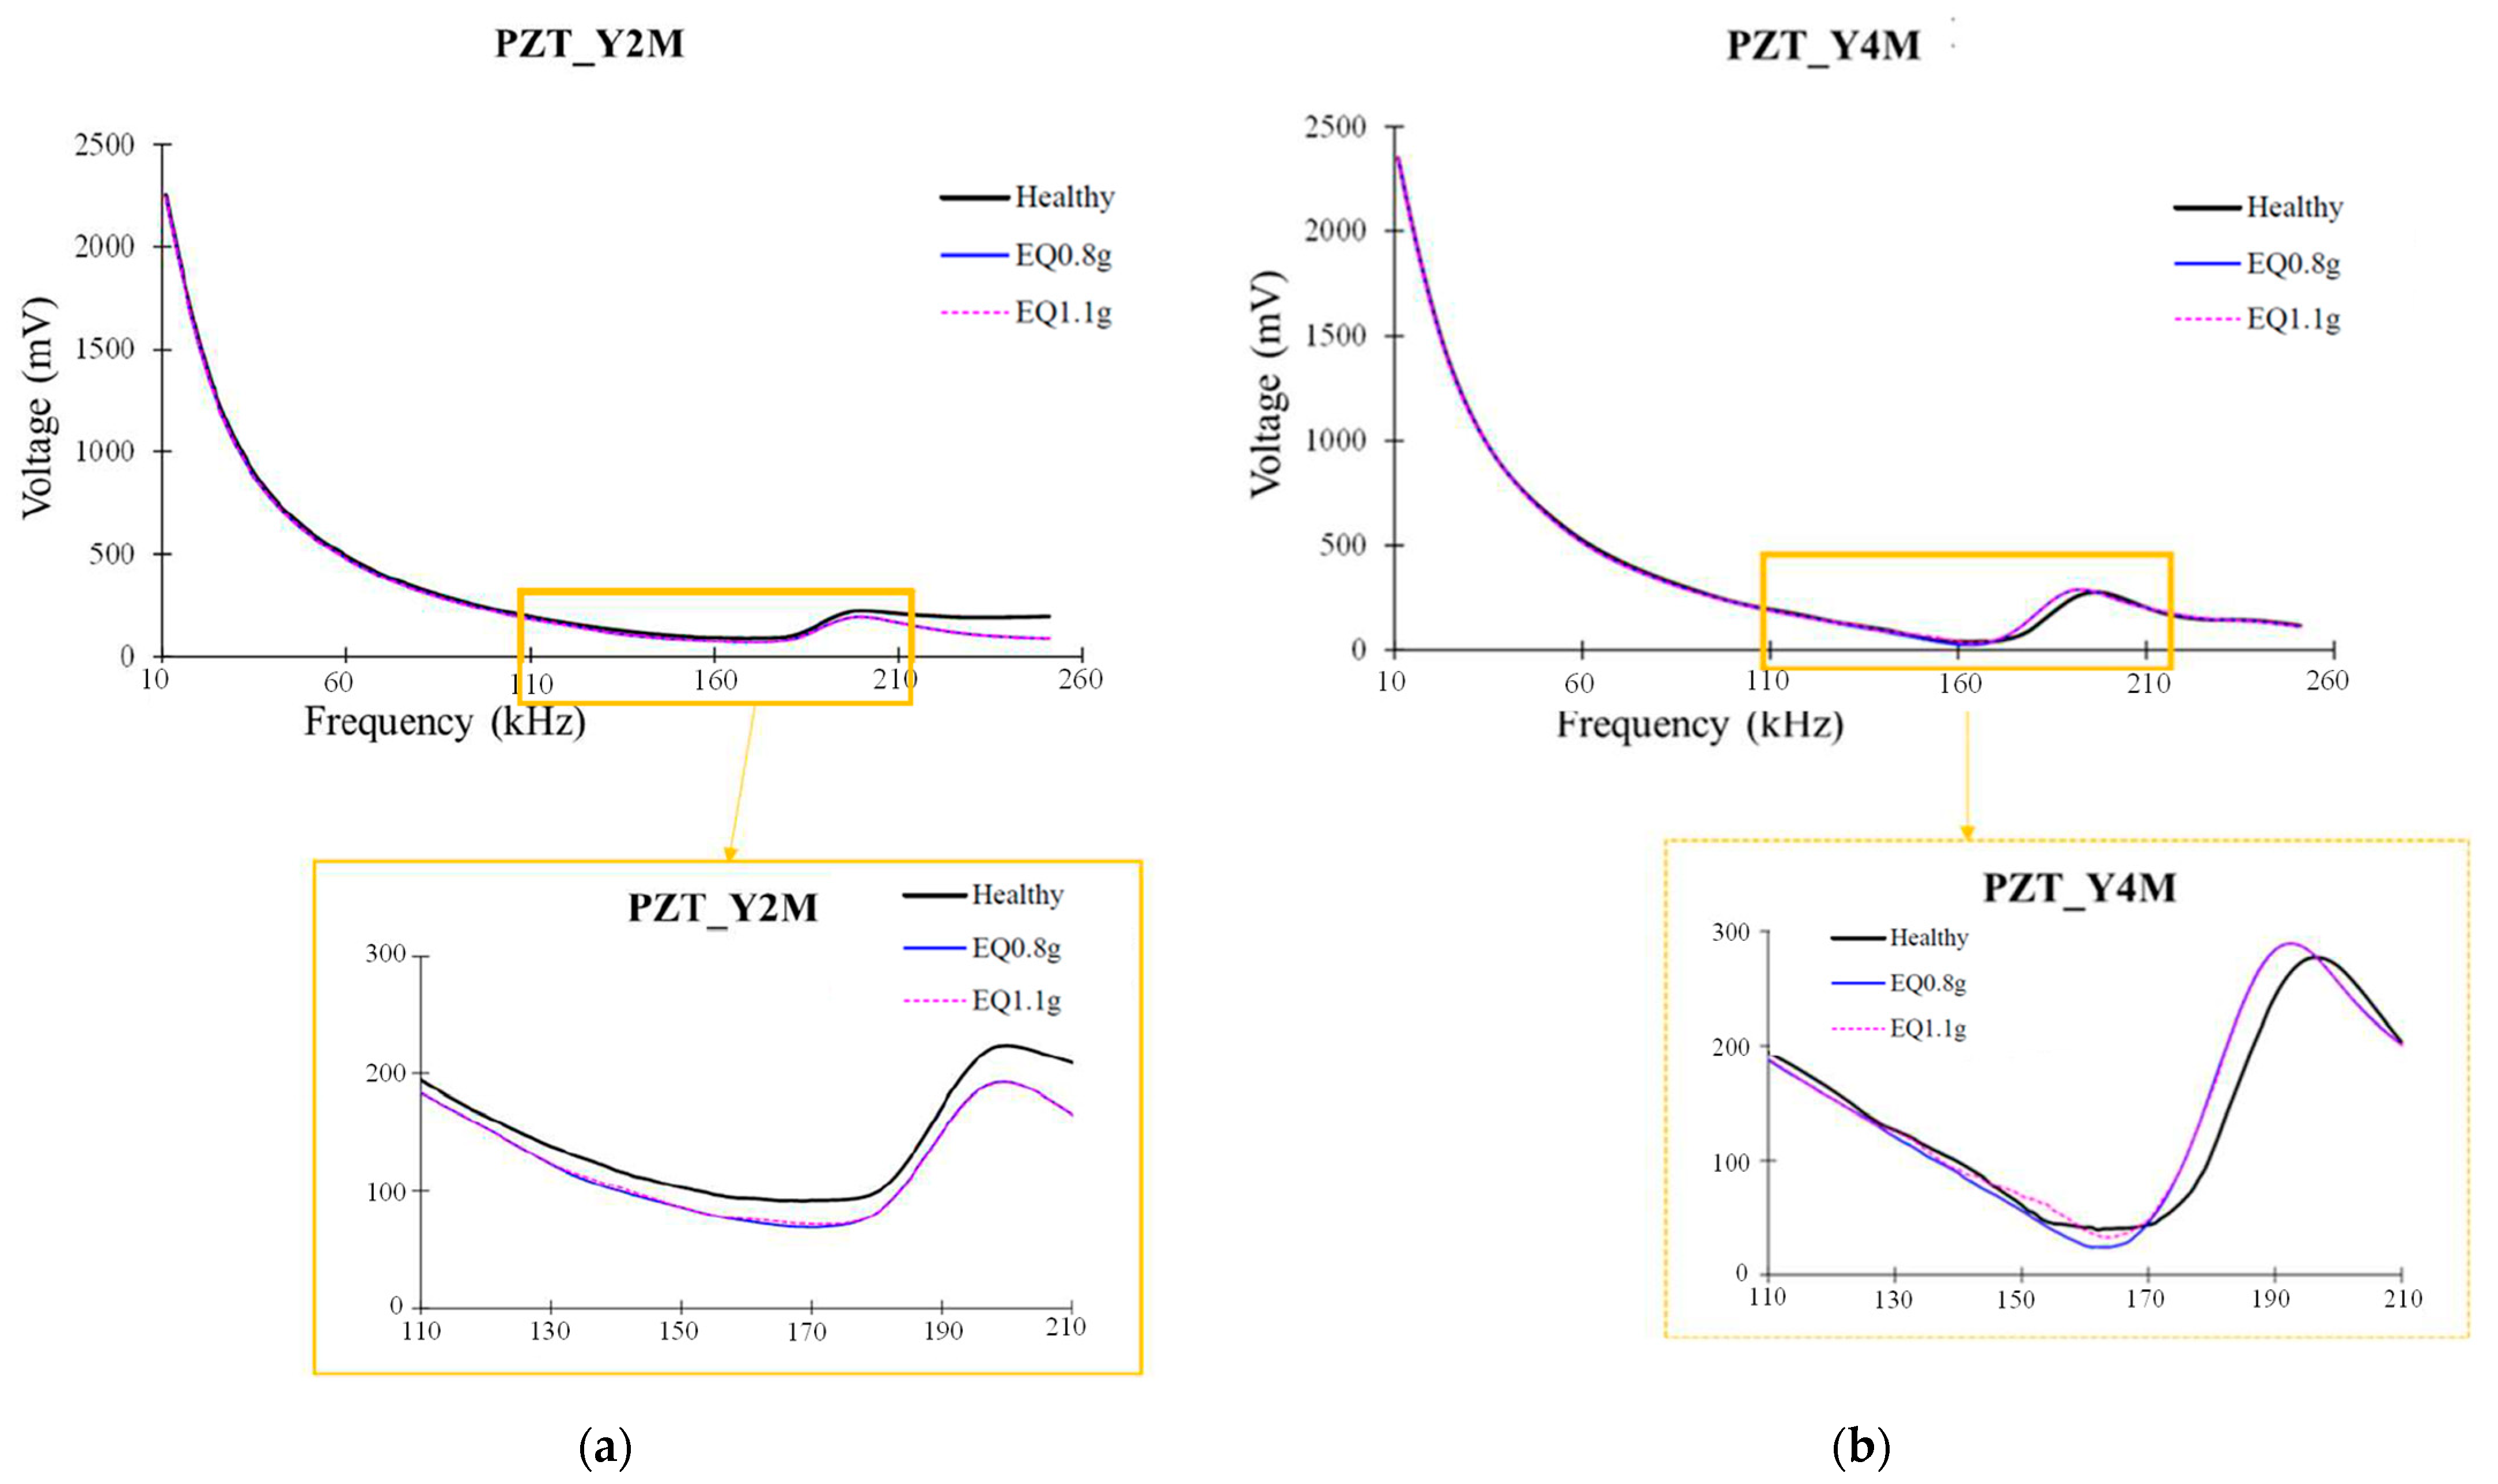
Column Response Characteristics: All monitored columns demonstrated increased RMSD values across their entire height (lower, middle, and upper sections), providing quantitative confirmation of distributed damage development. A distinct damage gradient was observed, with lower column regions consistently exhibiting higher RMSD magnitudes compared to upper sections, indicating concentrated structural stress and deterioration at the base connections. The characteristic voltage frequency response changes for the middle sensors are illustrated in Figure 14, showing the clear differences in sensor signals between healthy and damaged states, for example, columns Y2M and Y4M.
Joint and Beam Performance: Joint 6BD, located on Column Y3, registered particularly elevated RMSD values, directly attributable to accumulated damage within the associated column. Similarly, beams connected to Column Y3 exhibited increased RMSD readings, demonstrating the sensor network’s ability to detect damage propagation through interconnected structural elements.
Infill Wall Monitoring: The masonry infill walls generated substantial RMSD increases, providing quantitative evidence of debonding from the surrounding concrete frame. Spatial analysis revealed that sensors positioned in the middle and upper regions of infill walls consistently recorded higher damage indices compared to lower elevations. Full infill walls exhibited universally high RMSD values, with the central monitoring location registering the most significant elevation, precisely coinciding with the major horizontal crack identified through visual inspection.
System Validation: These comprehensive results validate the concept of a dense PZT network for early (a) concrete core cracking and (b) concrete column-to-brick infill interface debonding (damages) detection, alongside other damage mechanisms. For example, it is notable that high RMSD values correspond to Y3D from excitation EQ0.8g upwards. Then, after EQ1.1g excitation, the bottom corner of the section of the concrete column reveals negligible cracking. No other column revealed similar negligible concrete cracking. The PZT-related results demonstrate the effectiveness and reliability of the implemented PZT instrumentation coupled with the EMI-based monitoring methodology for structural health assessment. The strong correlation between quantitative RMSD indices and observed physical damage validates the system’s capability for real-time damage detection and progressive deterioration tracking across diverse structural components.

4. Conclusions

This experimental study focuses on purposefully deficient reinforced concrete frames with brick masonry infills, a prevalent characteristic of Mediterranean construction methods prior to Eurocodes.
This study presents the first comprehensive investigation of an extensive and strategically designed PZT sensor network deployed in a three-dimensional reinforced concrete (RC) frame structure with masonry infill walls, subjected to successive seismic excitations up to the serviceability limit state (maximum 2350 μstrain < 2890 μstrain yield). The experimental results demonstrate that PZT sensors can reliably detect progressive damage accumulation in both the concrete matrix of the columns and at critical interfaces, provided adequate sensor density and optimal orientation are maintained (smart aggregates implementation).
Notably, PZT sensors positioned near the infill wall–column interface successfully detected partial bond degradation at early loading stages (EQ 0.5g). Furthermore, PZT sensors embedded within the infill walls effectively identified the onset of cracking in the mortar joints within the masonry at an early stage. The increasing RMSD (Root Mean Square Deviation) values correlate well with the observed progressive damage accumulation at the structural interfaces and across different structural components during successive seismic excitations, up to the final loading stage (EQ: 1.1g, drift 11.37‰), with a residual drift of 0.024‰.
These findings confirm that masonry infills constitute the primary vulnerability in moderate earthquakes, threatening occupant safety and building functionality despite resilient structural frames. Moreover, the observed infill damages result in the significant deterioration of protective building envelopes (thermal insulation, environmental protection, etc.).
The successful completion of Phase A testing establishes the critical foundation for implementing innovative vertical forest retrofitting technologies in Phase B, representing a comprehensive approach to sustainable infrastructure renewal. This investigation contributes to the scientific understanding of infilled RC frame behavior under seismic excitations at SLS performance level while introducing validated monitoring methodologies for intelligent structural assessment. While the study was conducted on a single-story specimen with suitably designed characteristics that may complicate direct extrapolation to multi-story structures, the comprehensive experimental dataset may enrich available performance data for deficient building stock and may support improved seismic vulnerability assessment procedures. This research contributes meaningfully to validating resilient, sustainable monitoring concepts for existing Mediterranean building stock, thereby bridging traditional construction practices with cutting-edge environmental technologies to address contemporary challenges of seismic safety, energy efficiency, and environmental sustainability in the built environment.

Author Contributions

Conceptualization, T.R., V.V., M.L., A.G.Z., I.P.X., M.V., S.K., G.S., M.N., N.P., V.K.K., M.K., C.E.C., A.K.T., and E.G.; methodology, T.R., V.V., M.L., A.G.Z., I.P.X., M.V., S.K., G.S., M.N., N.P., V.K.K., M.K., C.E.C., A.K.T., and E.G.; software, T.R., V.V., M.L., A.G.Z., I.P.X., M.V., S.K., G.S., M.N., N.P., V.K.K., M.K., C.E.C., A.K.T., and E.G.; validation, T.R., V.V., M.L., A.G.Z., I.P.X., M.V., S.K., G.S., M.N., N.P., V.K.K., M.K., C.E.C., A.K.T., and E.G.; formal analysis, T.R., V.V., M.L., A.G.Z., I.P.X., M.V., S.K., G.S., M.N., N.P., V.K.K., M.K., C.E.C., A.K.T., and E.G.; investigation, T.R., V.V., M.L., A.G.Z., I.P.X., M.V., S.K., G.S., M.N., N.P., V.K.K., M.K., C.E.C., A.K.T., and E.G.; resources, T.R., V.V., M.L., A.G.Z., I.P.X., M.V., S.K., G.S., M.N., N.P., V.K.K., M.K., C.E.C., A.K.T., and E.G.; data curation, T.R., V.V., M.L., A.G.Z., I.P.X., M.V., S.K., G.S., M.N., N.P., V.K.K., M.K., C.E.C., A.K.T., and E.G.; writing—original draft preparation, T.R., V.V., M.L., A.G.Z., I.P.X., M.V., S.K., G.S., M.N., N.P., V.K.K., M.K., C.E.C., A.K.T., and E.G.; writing—review and editing, T.R., V.V., M.L., A.G.Z., I.P.X., M.V., S.K., G.S., M.N., N.P., V.K.K., M.K., C.E.C., A.K.T., and E.G.; visualization, T.R., V.V., M.L., A.G.Z., I.P.X., M.V., S.K., G.S., M.N., N.P., V.K.K., M.K., C.E.C., A.K.T., and E.G.; supervision, T.R. and M.V.; project administration, T.R.; funding acquisition, T.R. and M.V. All authors have read and agreed to the published version of the manuscript.

Funding

The research project is implemented in the framework of H.F.R.I call “Basic research Financing (Horizontal support of all Sciences)” under the National Recovery and Resilience Plan “Greece 2.0” funded by the European Union—NextGenerationEU (H.F.R.I. Project Number: 015376).

Data Availability Statement

The data that support the findings of this study are available from the corresponding author upon reasonable request.

Conflicts of Interest

The authors declare no conflicts of interest.

References

  1. Frangopol, D.M.; Tsompanakis, Y. (Eds.) Maintenance and Safety of Aging Infrastructure; Structures and Infrastructures Series; CRC Press: Boca Raton, FL, USA; Leiden, The Netherlands, 2014; ISBN 978-0-415-65942-0. [Google Scholar]
  2. Kim, J.-H.; Hessek, C.J.; Kim, Y.J.; Park, H.-G. Seismic Analysis, Design, and Retrofit of Built-Environments: A Procedural Review of Current Practices and Case Studies. J. Infrastruct. Preserv. Resil. 2022, 3, 11. [Google Scholar] [CrossRef]
  3. Ricci, P.; De Risi, M.T.; Verderame, G.M.; Manfredi, G. Influence of Infill Distribution and Design Typology on Seismic Performance of Low- and Mid-Rise RC Buildings. Bull. Earthq. Eng. 2013, 11, 1585–1616. [Google Scholar] [CrossRef]
  4. De Angelis, A.; Pecce, M.R. The Role of Infill Walls in the Dynamic Behavior and Seismic Upgrade of a Reinforced Concrete Framed Building. Front. Built Environ. 2020, 6, 590114. [Google Scholar] [CrossRef]
  5. Sattar, S.; Liel, A.B. Collapse Indicators for Existing Nonductile Concrete Frame Buildings with Varying Column and Frame Characteristics. Eng. Struct. 2017, 152, 188–201. [Google Scholar] [CrossRef]
  6. Jeon, J.-S.; Lowes, L.N.; DesRoches, R.; Brilakis, I. Fragility Curves for Non-Ductile Reinforced Concrete Frames That Exhibit Different Component Response Mechanisms. Eng. Struct. 2015, 85, 127–143. [Google Scholar] [CrossRef]
  7. Vintzileou, E.; Palieraki, V. Damage to Stone Masonry Buildings in Historical Centers Due to the 2023 Earthquake Sequence in Turkey. Earthq. Spectra 2024, 40, 2306–2338. [Google Scholar] [CrossRef]
  8. Puncello, I.; Caprili, S. Seismic Assessment of Historical Masonry Buildings at Different Scale Levels: A Review. Appl. Sci. 2023, 13, 1941. [Google Scholar] [CrossRef]
  9. Vuran, E.; Serhatoğlu, C.; Timurağaoğlu, M.Ö.; Smyrou, E.; Bal, İ.E.; Livaoğlu, R. Damage Observations of RC Buildings from 2023 Kahramanmaraş Earthquake Sequence and Discussion on the Seismic Code Regulations. Bull. Earthq. Eng. 2025, 23, 1153–1182. [Google Scholar] [CrossRef]
  10. Milijaš, A.; Marinković, M.; Butenweg, C.; Klinkel, S. Experimental Results of Reinforced Concrete Frames with Masonry Infills with and without Openings under Combined Quasi-Static in-Plane and out-of-Plane Seismic Loading. Bull. Earthq. Eng. 2023, 21, 3537–3579. [Google Scholar] [CrossRef]
  11. Milijaš, A.; Marinković, M.; Butenweg, C.; Klinkel, S. Experimental Investigation on the Seismic Performance of Reinforced Concrete Frames with Decoupled Masonry Infills: Considering in-Plane and out-of-Plane Load Interaction Effects. Bull. Earthq. Eng. 2024, 22, 7489–7546. [Google Scholar] [CrossRef]
  12. Baek, E.R.; Pohoryles, D.A.; Bournas, D. Seismic Assessment of the In-plane/Out-of-plane Interaction of Masonry Infills in a Two-storey RC Building Subjected to Bi-directional Shaking Table Tests. Earthq. Engng Struct. Dyn. 2024, 53, 2230–2251. [Google Scholar] [CrossRef]
  13. Palieraki, V.; Zeris, C.; Vintzileou, E.; Adami, C.-E. In-Plane and out-of Plane Response of Currently Constructed Masonry Infills. Eng. Struct. 2018, 177, 103–116. [Google Scholar] [CrossRef]
  14. Xie, X.; Qu, Z.; Fu, H.; Zhang, L. Effect of Prior In-Plane Damage on the out-of-Plane Behavior of Masonry Infill Walls. Eng. Struct. 2021, 226, 111380. [Google Scholar] [CrossRef]
  15. Liu, W.; Jin, W.; Zhai, C. Fragility Functions for Masonry Infill Walls in RC Frames with the In-Plane and Out-of-Plane Loading. J. Build. Eng. 2024, 95, 110177. [Google Scholar] [CrossRef]
  16. Mouloud, H.; Chaker, A.; Nassim, H.; Lebdioui, S.; Rodrigues, H.; Agius, M.R. Post-Earthquake Damage Classification and Assessment: Case Study of the Residential Buildings after the Mw = 5 Earthquake in Mila City, Northeast Algeria on August 7, 2020. Bull. Earthq. Eng. 2023, 21, 849–891. [Google Scholar] [CrossRef] [PubMed]
  17. Harirchian, E.; Lahmer, T.; Buddhiraju, S.; Mohammad, K.; Mosavi, A. Earthquake Safety Assessment of Buildings through Rapid Visual Screening. Buildings 2020, 10, 51. [Google Scholar] [CrossRef]
  18. López-Castro, B.; Haro-Baez, A.G.; Arcos-Aviles, D.; Barreno-Riera, M.; Landázuri-Avilés, B. A Systematic Review of Structural Health Monitoring Systems to Strengthen Post-Earthquake Assessment Procedures. Sensors 2022, 22, 9206. [Google Scholar] [CrossRef]
  19. Fuentes, R.; Cross, E.J.; Gardner, P.A.; Bull, L.A.; Rogers, T.J.; Barthorpe, R.J.; Shi, H.; Dervilis, N.; Farrar, C.R.; Worden, K. Structural Health Monitoring and Damage Identification. In Handbook of Experimental Structural Dynamics; Springer: New York, NY, USA, 2020; pp. 1–72. ISBN 978-1-4939-6503-8. [Google Scholar]
  20. Voutetaki, M.E.; Providakis, C.P.; Chalioris, C.E. FRP Debonding Prevention of Strengthened Concrete Members under Dynamic Load Using Smart Piezoelectric Materials (PZT). In Proceedings of the 15th European Conference on Composite Materials (ECCM15), Venice, Italy, 24–28 June 2012; p. 2170. [Google Scholar]
  21. Naoum, M.C.; Papadopoulos, N.A.; Sapidis, G.M.; Voutetaki, M.E. Efficacy of PZT Sensors Network Different Configurations in Damage Detection of Fiber-Reinforced Concrete Prisms under Repeated Loading. Sensors 2024, 24, 5660. [Google Scholar] [CrossRef]
  22. Liang, Y.; Li, C.; Liu, Z.; Wang, X.; Zeng, F.; Yuan, X.; Pan, Y. Decarbonization Potentials of the Embodied Energy Use and Operational Process in Buildings: A Review from the Life-Cycle Perspective. Heliyon 2023, 9, e20190. [Google Scholar] [CrossRef]
  23. Pohoryles, D.A.; Bournas, D.A.; Da Porto, F.; Caprino, A.; Santarsiero, G.; Triantafillou, T. Integrated Seismic and Energy Retrofitting of Existing Buildings: A State-of-the-Art Review. J. Build. Eng. 2022, 61, 105274. [Google Scholar] [CrossRef]
  24. Shafique, M.; Xue, X.; Luo, X. An Overview of Carbon Sequestration of Green Roofs in Urban Areas. Urban For. Urban Green. 2020, 47, 126515. [Google Scholar] [CrossRef]
  25. Theodoridou, I.; Vatitsi, K.; Stefanidou, M.; Vanian, V.; Fanaradelli, T.; Macha, M.; Zapris, A.; Kytinou, V.; Voutetaki, M.; Rousakis, T.; et al. Nature-Based Solutions for Urban Buildings—The Potential of Vertical Greenery: A Brief Review of Benefits and Challenges of Implementation. Urban. Sci. 2025, 9, 398. [Google Scholar] [CrossRef]
  26. Vanian, V.; Rousakis, T.; Fanaradelli, T.; Voutetaki, M.; Macha, M.; Zapris, A.; Theodoridou, I.; Stefanidou, M.; Vatitsi, K.; Mallinis, G.; et al. Performance-Based Damage Quantification and Hazard Intensity Measures for Vertical Forest Systems on RC Buildings. Buildings 2025, 15, 769. [Google Scholar] [CrossRef]
  27. Vanian, V.; Fanaradelli, T.; Rousakis, T. A Comprehensive Review of Vertical Forest Buildings: Integrating Structural, Energy, Forestry, and Occupant Comfort Aspects in Renovation Modeling. Fibers 2025, 13, 101. [Google Scholar] [CrossRef]
  28. EN 1992-1-1:2004; Eurocode 2: Design of Concrete Structures—Part 1-1: General Rules and Rules for Buildings. European Committee for Standardization: Brussels, Belgium, 2004.
  29. EN 12390-3:2019; Testing Hardened Concrete—Part 3: Compressive Strength of Test Specimens. European Committee for Standardization: Brussels, Belgium, 2019.
  30. EN 12390-6:2023; Testing Hardened Concrete—Part 6: Tensile Splitting Strength of Test Specimens. European Committee for Standardization: Brussels, Belgium, 2023.
  31. Rousakis, T.; Ilki, A.; Kwiecien, A.; Viskovic, A.; Gams, M.; Triller, P.; Ghiassi, B.; Benedetti, A.; Rakicevic, Z.; Colla, C.; et al. Deformable Polyurethane Joints and Fibre Grids for Resilient Seismic Performance of Reinforced Concrete Frames with Orthoblock Brick Infills. Polymers 2020, 12, 2869. [Google Scholar] [CrossRef]
  32. Voutetaki, M.E.; Naoum, M.C.; Papadopoulos, N.A.; Chalioris, C.E. Cracking Diagnosis in Fiber-Reinforced Concrete with Synthetic Fibers Using Piezoelectric Transducers. Fibers 2022, 10, 5. [Google Scholar] [CrossRef]
  33. Voutetaki, M.E.; Papadopoulos, N.A.; Angeli, G.M.; Providakis, C.P. Investigation of a New Experimental Method for Damage Assessment of RC Beams Failing in Shear Using Piezoelectric Transducers. Eng. Struct. 2016, 114, 226–240. [Google Scholar] [CrossRef]
  34. Chalioris, C.E.; Voutetaki, M.E.; Liolios, A.A. Structural Health Monitoring of Seismically Vulnerable RC Frames under Lateral Cyclic Loading. Earthq. Struct. 2020, 19, 29–44. [Google Scholar] [CrossRef]
  35. Karayannis, C.G.; Golias, E.; Naoum, M.C.; Chalioris, C.E. Efficacy and Damage Diagnosis of Reinforced Concrete Columns and Joints Strengthened with FRP Ropes Using Piezoelectric Transducers. Sensors 2022, 22, 8294. [Google Scholar] [CrossRef]
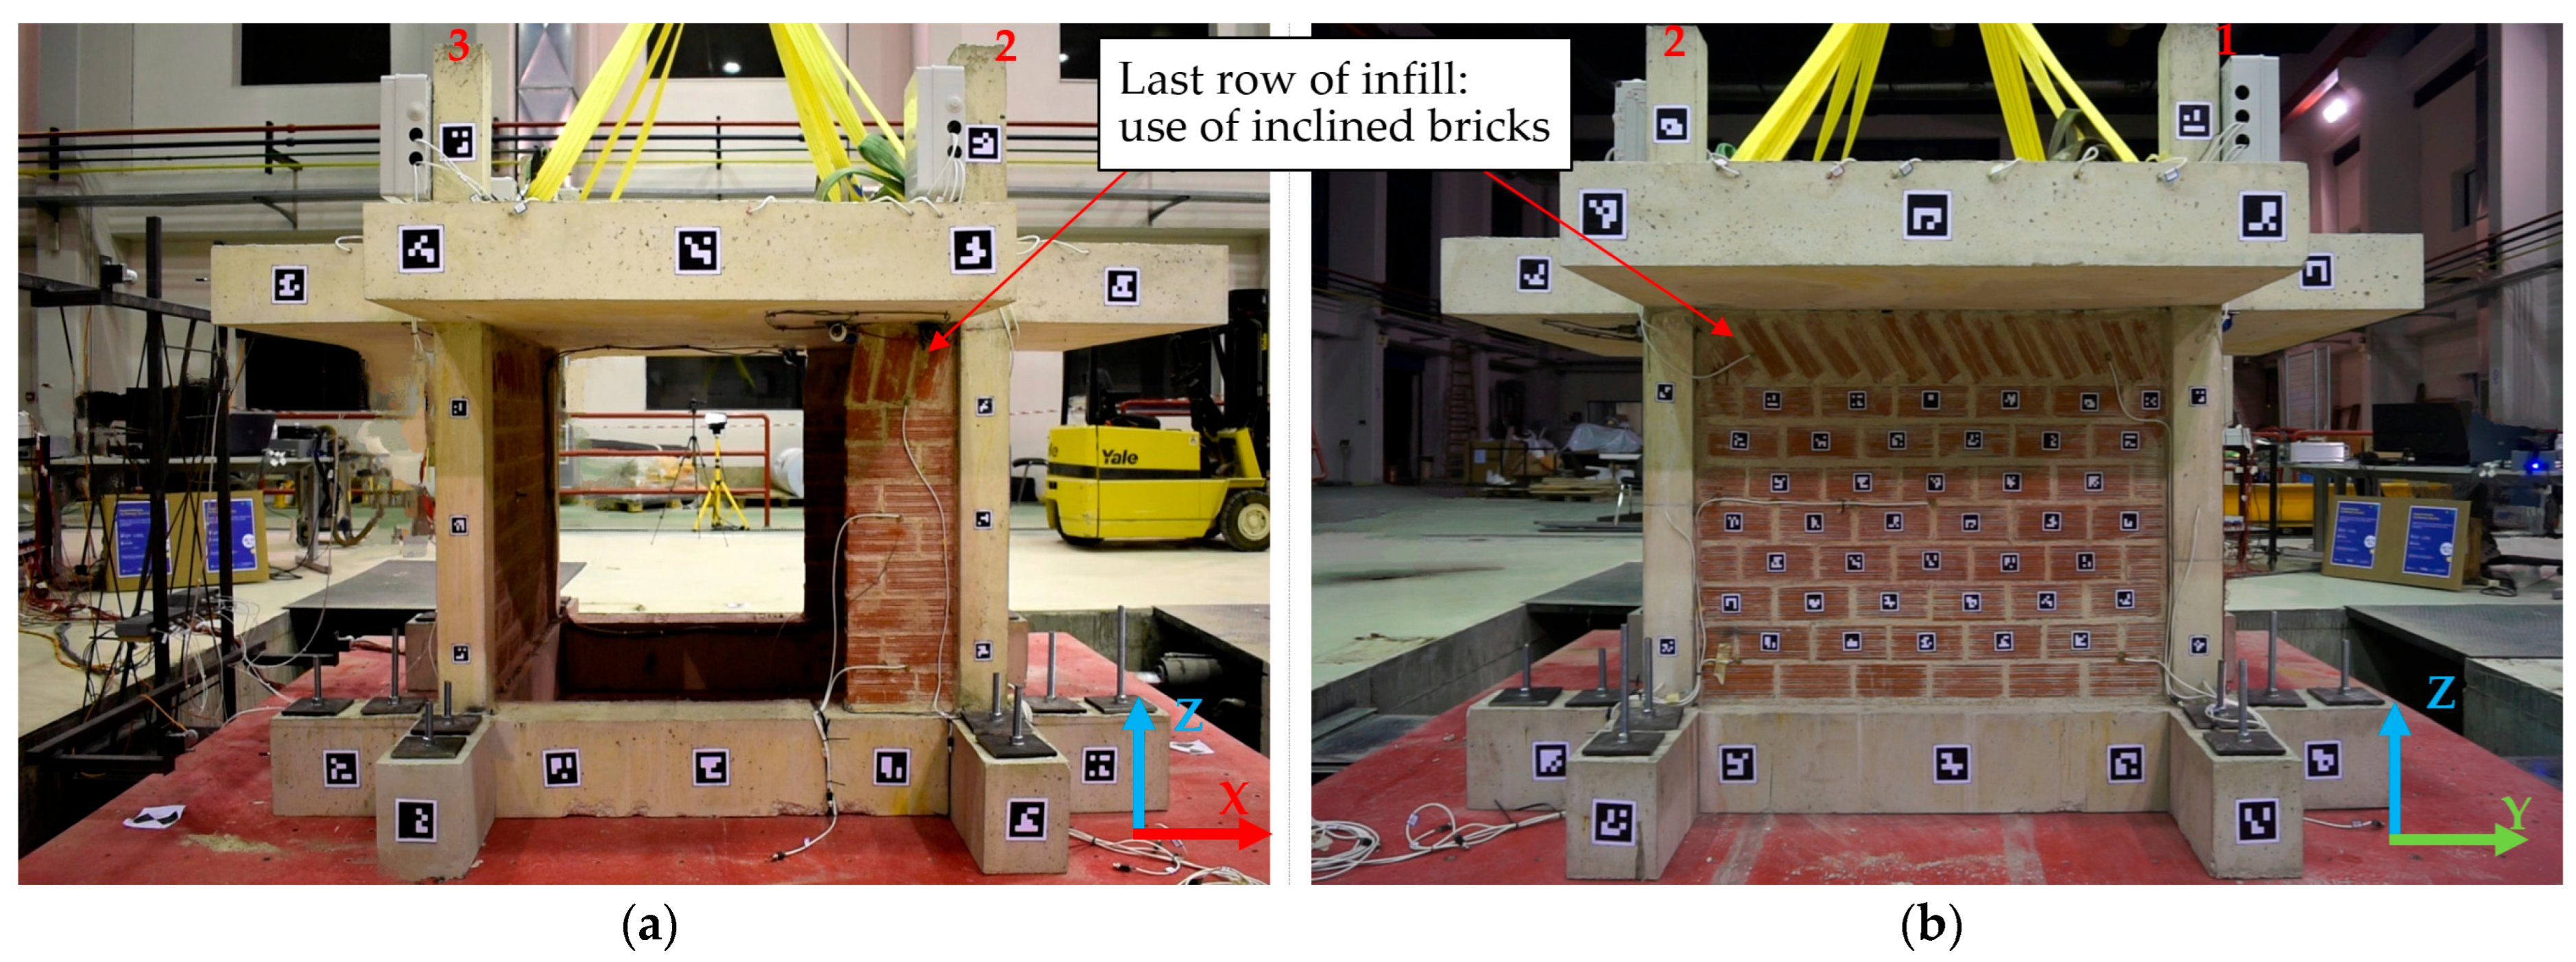
Figure 1. Experimental specimen overview on the DUTh seismic table: (a) view of the frame with partial infills (b) view of the frame with full infills.
Fibers 13 00154 g001
Figure 2. Geometry and reinforcement detailing of the specimen: (a) typical frame section view (b) cross-sections.
Fibers 13 00154 g002
Figure 3. Details of slab extensions and two beam–column joint variations, (a) conventional, (b) modified, and seismic load direction.
Fibers 13 00154 g003
Figure 4. Position of the accelerometers (a) in the specimen and (b) schematic details.
Fibers 13 00154 g004
Figure 5. Schematic position of the draw-wire meters (a) in the full infill frame and (b) in the partial infill frame.
Fibers 13 00154 g005
Figure 6. Schematic position of the strain gauges: (a) floor plan at the bottom of the columns, (b) floor plan at the top of the columns, (c) frame of columns 2–3, and (d) frame of columns 1–4.
Fibers 13 00154 g006
Figure 7. Schematic representation of the PZT sensors: (a) names, (b) positions, (c) full infill, and (d) partial infills.
Fibers 13 00154 g007
Figure 8. Seismic excitation of original Thessaloniki 1978 earthquake (ay component).
Fibers 13 00154 g008
Figure 9. Progressive increase in acceleration (seismic load cases).
Fibers 13 00154 g009
Figure 10. Progressive increase in displacement (seismic load cases).
Fibers 13 00154 g010
Figure 11. Damage assessment following EQ1.10g seismic testing (ST10): (a) masonry infill wall 3–4 perpendicular to loading direction, (b) infill wall 2–3 parallel to loading direction, (c) infill wall 1–2 perpendicular to loading direction, and (d) infill wall 1–4 parallel to loading direction.
Fibers 13 00154 g011
Figure 12. Slab-embedded PZT sensor responses and RMSD damage indices: (a) SL1, (b) SL2, and (c) SL3 voltage outputs at healthy state and loading stages EQ0.8g and EQ1.1g, (d) RMSD values for slab sensors.
Fibers 13 00154 g012aFibers 13 00154 g012b
Figure 13. RMSD Damage index values of PZT sensors for all structural components: (a) PZT sensors inside the columns, (b) PZT sensors inside all beams, (c) PZT sensors inside joints, (d) PZT sensors inside cantilevers, and (e) PZT sensors on all infill walls. Data shown for EQ0.8g and EQ1.1g loading stages compared to healthy baseline condition.
Fibers 13 00154 g013aFibers 13 00154 g013b
Figure 14. Column-embedded PZT sensor responses of voltage outputs at healthy state and loading stages EQ0.8g and EQ1.1g for MIDDLE sensors: (a) Column Y2M and (b) Column Y4M.
Fibers 13 00154 g014
Table 1. Compressive strength test results of concrete elements.
Structural
Element
Mix Proportions (kg/m3)Compressive Strength (MPa)Average (MPa)* CV (%)
CementWaterSandAggregate
Tie Beam*** 320171100385536.06, 36.44, 37.7936.762.5
** Column300199102479824.52, 20.92, 25.1323.529.7
Slab300199102479832.13, 30.68, 32.87, 30.82, 31.6731.632.9
* CV = Coefficient of Variation; ** mixed in situ in DUTh lab (small quantity); *** high-strength cement only.
Table 2. Reinforcement quantities and specifications of specimen.
Structural ElementLongitudinal
Reinforcement
Transverse
Reinforcement
Bar GradeTotal Steel Weight (kg)
Foundation beams8Ø14 mmØ10/100 mmB500C132.1
Columns
(below slab)
4Ø8 mmØ5.5/60 mmB500C/S22019.6
Columns
(above slab)
4Ø8 mmØ5.5/60 mmB500C/S2207.7
Hidden beams8Ø10 mmØ10/100 mmB500C109.9
SlabØ8/100 mm
(top and bottom)
-B500C121
Total steel weight 390.3
Table 3. Mechanical properties of B500C reinforcement steel.
PropertySymbolValueUnit
Yield strengthfsy564MPa
Ultimate strengthfsu663MPa
Elastic modulusEs195,156MPa
Yield strainεsy0.289%
Ultimate strainεsu14.3%
Table 4. Brick details of the specimen.
PropertySpecificationFibers 13 00154 i001
ManufacturerKEBE S.A.
TypeHollow clay brick
Dimensions60 × 90 × 190 mm (W × H × L)
Weight per brick1.2 kg
Void percentage45.00%
Joints thickness10 mm horizontal, 10 mm vertical
Table 5. Instrumentation specifications.
Sensor TypeManufacturerModelRangeSensitivity
AccelerometerKISTLER
(Winterthur, Switzerland)
8330A3±3 g1200 mV/g
(±10% tolerance)
Draw-wireWayCon
(Munich,
Germany)
SX50-300-10V-KA05±300 mm±0.02% of full scale
Strain gaugeTokyo Measuring Instruments Lab.
(Tokyo, Japan)
FLAB-5-11-3LJC-F5 mm2.10 ± 1%
(gauge factor)
PZT sensor (PZT transducer)PI Ceramics
(Thuringia,
Germany)
PIC 15110–250 Hz1 Hz
Table 6. Total test sequence protocol (11 tests).
Test No.NameTypeIntensityTest No.NameTypeIntensity
ST1WNb0.1gWhite noise0.08 gST7WNb0.8gWhite noise0.08 g
ST2EQ0.1gEarthquake0.10 gST8EQ0.8gEarthquake0.80 g
ST3WNb0.2gWhite noise0.08 gST9WNb1.1gWhite noise0.08 g
ST4EQ0.2gEarthquake0.20 gST10EQ1.1gEarthquake1.10 g
ST5WNb0.5gWhite noise0.08 gST11WNa1.1gWhite noise0.08 g
ST6EQ0.5gEarthquake0.50 g
Table 7. Summary of results for accelerations (11 total tests).
Test No.PGA (g)PFA (g)FAFTest No.PGA (g)PFA (g)FAF
ST1+0.13/−0.13+0.11/−0.131.00ST7+0.06/−0.08+0.25/−0.243.13
ST2+0.07/−0.11+0.14/−0.091.27ST8+0.69/−0.76+1.19/−1.131.57
ST3+0.1/−0.11+0.12/−0.121.09ST9+0.06/−0.07+0.12/−0.131.86
ST4+0.15/−0.19+0.24/−0.21.26ST10+1.08/−1.00+1.67/−1.621.55
ST5+0.06/−0.07+0.11/−0.111.57ST11+0.06/−0.09+0.19/−0.192.11
ST6+0.47/−0.52+0.68/−0.591.31
Table 8. Summary of results for displacement drift (mm) and (‰) (11 total tests).
Test No.Disp. (mm)Drift (‰)Test No.Disp. (mm)Drift (‰)
ST1+1.35/−1.35+1.10/−1.10ST7+2.81/−2.84+2.29/−2.32
ST2+1.47/−1.03+1.20/−0.84ST8+9.85/−10.07+8.04/−8.22
ST3+1.32/−1.18+1.08/−0.96ST9+1.62/−1.58+1.32/−1.29
ST4+2.44/−2.14+1.99/−1.75ST10+13.93/−13.35+11.37/−10.9
ST5+1.24/−1.08+1.01/−0.88ST11+2.82/−2.83+2.30/−2.31
ST6+6.20/−6.30+5.06/−5.14
Table 9. Summary of strain gauge results.
LocationGauge IDMax Tensile (μstrain)Max Comp. (μstrain)Residual (μstrain)Test Stage (First > 1000 μstrain)
Column 1
BottomSG11190−336−15ST10
SG2809−92−15
TopSG91979−56717ST8
SG101962−269−54ST8
Column 2
BottomSG52335−1136−412ST8
SG61764−74−50ST8
TopSG111068−198−31ST10
SG12855−76−1
Column 3
BottomSG3702−9231
SG41205−427−76ST10
TopSG131007−920ST10
SG141083−1980ST10
Column 4
BottomSG7702−46−83
SG81129−446−92ST10
TopSG151175−2590ST10
SG16839−1370
Infills
Partial 1SG1776−107−61
SG1892−9246
Partial 2SG1930−522
SG2051−9412
Notes: B500C yield strain = 2890 μstrain; all reinforcement remained elastic. “—” indicates strain never exceeded 1000 μstrain.
Disclaimer/Publisher’s Note: The statements, opinions and data contained in all publications are solely those of the individual author(s) and contributor(s) and not of MDPI and/or the editor(s). MDPI and/or the editor(s) disclaim responsibility for any injury to people or property resulting from any ideas, methods, instructions or products referred to in the content.