1. Introduction
The potential of paper and paperboard as fiber-based materials capable of replacing conventional polymer-based materials has been widely applied and investigated. However, the inhomogeneous distribution of properties such as density, thickness, and fiber orientation, caused by the degree of refining, fiber properties, fiber distribution, suspension composition, and process conditions, leads to stochastic material characteristics. Due to their inherent heterogeneity, local structural variations lead to unpredictable mechanical behavior of materials and instability during processing [
1]. Therefore, accurate determination of the local structure is essential for understanding the paper material and for optimizing manufacturing and processing.
The methods for measuring the local structural properties, including formation-related and fiber network characteristics of paper and paperboard, have been recently reviewed by the authors in [
2]. The advantages and disadvantages of the different methods of measurement and a comparison of their characteristics and areas of application are listed in the form of tables. Nevertheless, the most representative and relevant measurements of the techniques presented in this paper are briefly reviewed again. In the field of paper technology, grammage or basis weight, expressed as grams per square meter, is the most commonly used quality property to describe the weight of paper. An optical imaging system based on visible light transmission considers the dependence of local optical density on the local scattering properties. This system is popular due to its low cost, simplicity, no radiation risk, and instantaneous acquisition of data [
3]. However, it has limitations in terms of sensitivity to the sheet composition of the material being tested, limitations imposed by sheet opacity, and the inability to reliably determine actual values [
4]. An analysis of the coefficients of variation of local transmittance and local grammage showed a linear correlation between the two coefficients when the detection scale is significantly larger than the sheet thickness [
5]. The
-radiography technique overcomes local scattering effects while providing a more accurate characterization of the mass distribution [
6]. This method detects the emission of
particles (high-energy, high-speed electrons), as the absorption degree is dependent on the formation of paper. However, the measurement of high-grammage sheets is time-consuming and requires specialized equipment and strict safety precautions due to radiation exposure. The grammage measurement range is limited to 350 g/m
2 for beta radiation, while soft X-rays have sufficient energy to penetrate paperboard up to 1000 g/m
2 and enable higher spatial resolution [
7]. At the same time, with the development of camera and image processing technology, the relationship between basis weight and light transmittance of paper and how the relationship changes over the diverse spatial scales has been studied [
8]. The results show that the correlation is best at relatively small scales, but even large-scale variations do not change the relationship because white noise is filtered out of the measurements. However, the study only tested one type of paper, and the authors suggested that the method would not be effective on coated paper. These studies suggest that light transmittance measurements can be used to estimate the basis weight of paper, but the accuracy is affected by factors such as time alignment and illumination variations, which can be improved with reference images and optimized measurement systems.
From the density formula, it is known that there is a strong correlation between the three parameters, local grammage, local thickness, and local density. It has been shown that the distributions of local basis weight and local thickness are strongly correlated in [
9]. A contact method was developed to measure the local thickness of paper by Schultz-Eklund et al. [
10]. A sheet of paper was placed on a moving coordinate table and the thickness was recorded as the distance between two spherical probes, each 1 mm in diameter, pressed against the paper with a force of 35 mN. Due to the compressibility of the paper in the thickness direction and the surface roughness, the non-contact measurement method has obvious advantages over the contact measurement method for the accurate determination of local thickness. Izumi and Yoshida [
11] developed a new three-dimensional thickness gauge that measures thickness unevenness based on surface roughness data from the front and back of the paper. Measurements were taken at 0.5 mm intervals and the average of
adjacent measurements were taken to obtain a local average thickness of a 1 mm
2 square. Sung et al. [
12,
13] developed a method for mapping the apparent density of paper based on the grammage measurement from
-radiography and thickness measurement using non-contact laser profilometry through simultaneous scanning of the topography of both sides of the specimen by opposing range sensors. Thickness maps were measured with a resolution of 25 μm spacing and then scaled to 100 μm elements by local averaging. Using non-contact twin-laser profilometry (TLP), the surface topography of both sides of the paper strip was determined simultaneously using two lasers in [
14]. Although optical systems based on laser triangulation have proven to be feasible, their application to multilayer paperboard has limitations, especially when information up to the level of each layer is required. Terahertz (THz) time-domain spectroscopy, in combination with a stratified dispersive model approach, enables the non-detective highly accurate determination of material parameters for paper sheets, including multilayer structures [
15]. The proposed approach enables contactless, hazard-free, and quasi-real-time multi-parameter sensing in ambient conditions to determine thickness, fiber orientation, and moisture [
16].
Concerning local fiber orientation, image analysis using the fast Fourier transform (FFT) was demonstrated as an applicable and nondestructive method for determining the orientation angle and anisotropy. A method was developed to binarize photomicrographs of paper surfaces, and the mean Fourier coefficients were accurately calculated as angular distributions by linear interpolation [
17]. A sheet splitting method combined with scanning and image processing was used to determine the local fiber orientation by accumulating the local fiber orientation in different layers [
18,
19]. While this method can measure the fiber orientation of thicker or multilayer paperboards, it is destructive, and the material cannot be further tested for mechanical properties. A novel methodology combining a reflective imaging method based on a digital camera to obtain images of paper surfaces with a new and robust image processing algorithm, the gradient-segmentation method (GSM), to determine the polar fiber orientation distribution, was developed in [
20]. This methodology, designated as the camera-GSM methodology, was employed to estimate the in-plane fiber orientation. However, it should be noted that fiber orientation on the surface might not always correlate with the distribution of the entire sample. Therefore, this method will be less reliable for multi-layered or thicker paperboard.
The inhomogeneous local structure of paper also affects the mechanical properties and material response and, thus, the processing of paper products. There have been several experimental or numerical studies on the relationship between local structure and mechanical properties. Hagman et al. [
21] evaluated the paper formation using a scanner based on transmitted light methods. Although not calibrated for grammage variations, the gray value images could be used to identify flocculation and other density variations in the paper. This allowed visual comparison of the paper structure with digital image correlation (DIC) and thermographic measurements, which can be used to investigate the local mechanical response. The influences of local grammage from
-radiography, local thickness from TLP, local density calculated from grammage and thickness, and local fiber orientation using the sheet splitting method were studied by Lahti et al. [
18]. The results revealed a strong correlation between local fiber orientation, local density changes, and structural mechanisms of paper failure. Alzweighi et al. [
1] utilized the same local structural measurements to numerically investigate the effect of structural variations on the constitutive response and strain changes of thin fiber materials. The results indicated that the variation in density has the largest effect on the local strain pattern, followed by thickness and fiber orientation. The authors’ paper [
22] used mathematically generated random distributions to investigate the extent to which density, thickness, and fiber orientation affect the mechanical correspondence of materials in tensile tests, particularly the stress–strain curve. Heterogeneity in commercial paperboard was described by Considine et al. [
23] to determine the source of the non-uniform mechanical response and whether the observed heterogeneity was physical or mechanical. Physical heterogeneity studies included grammage measurements using the soft X-ray method and thickness measurements using the TLP method. Tensile tests were then performed using the DIC technique to investigate the heterogeneity of the mechanical properties.
As previously discussed in relation to the methods employed for determining local structural characteristics, it is evident that the local structural characterization of paperboard presents significant challenges. The measurement of grammage, for example, often relies on the use of radiant energy, such as -rays or soft X-rays, which necessitates the use of highly specialized equipment and skilled personnel to ensure accurate and reliable results. These techniques are inherently complex and require careful calibration to avoid measurement errors. Similarly, conventional methods for assessing thickness typically involve the use of two profilometers along with high-precision positioning stages. The setup of such experimental systems is intricate, requiring careful alignment and calibration, and the construction of such setups can be both time-consuming and resource-intensive.
Advances in fiber orientation measurement, particularly those using image processing techniques, have provided a promising solution to some of these challenges. By using non-destructive methods, these innovations overcome the limitations of traditional techniques, such as sheet splitting, which requires physical separation of the material and thus alters its properties during measurement. The integration of image processing for fiber orientation measurement allows for a more accurate and efficient assessment, avoiding the drawbacks of destructive methods. In addition, the method showed a clear correlation between the gray values obtained from light transmission measurements and both thickness and grammage, suggesting that these structural characteristics can be effectively inferred from the gray value intensity distribution. This finding highlights the potential of the method to provide a comprehensive understanding of material structure from a single measurement.
Based on the methods in the literature and considering their limitations, a method that simultaneously measures grammage, thickness, and fiber orientation would have significant advantages. This study presents a transmittance technique for determining the local structural properties of paperboard. By leveraging gray values derived from light transmission measurements, this method estimates local grammage and thickness through correlation with data obtained from -radiography and profilometry, respectively. Furthermore, image analysis is employed to identify the local in-plane orientation of fibers using the gray values as well. This approach provides a simple and efficient way to obtain critical structural information without the need for multiple individual tests or complex experimental setups, thus contributing to more efficient characterization and modeling of fiber-based materials.
2. Materials and Methods
2.1. Materials
In fact, paperboard is an anisotropic material, i.e., the properties of the material vary with the direction, i.e., with the orientation of the fibers in the machine direction (MD) and in the cross direction (CD). In the paperboard manufacturing process, the fibers are mostly oriented parallel to the transport direction of the belt, i.e., most of the fibers are oriented in the MD, a few in the CD, and very few in the thickness direction (ZD).
Three different paperboards are investigated in this work. Paperboard A (Enviro form Inapa, Hamburg, Germany) is a premium uncoated recycled paper made from 100% recycled fibers and is commonly used for printing purposes. Paperboard B (Trayforma from Stora Enso, Helsinki, Finland) is a three-layer fiber construction board with chemithermomechanical pulp (CTMP) in the middle layer, which is suitable for packaging food and other products. Paperboard C (Fibreform from Kapag, Muhen, Switzerland) is manufactured from bleached kraft pulp and exhibits good extensibility and nearly isotropic mechanical properties, rendering it suitable for printing and processing with exceptionally deep embossing. The three materials used are composed of virgin or recycled fibers and also have different chemical additives that can help determine the widespread applicability of the proposed methodology.
2.2. Reference Measurement: -Radiography for Grammage and Profilometry for Thickness
The Ambertec Beta Formation Tester is a unique, reliable, and factual standard used commercially to analyze formation changes (small-scale basis weight distributions) in paper, paperboard, etc. It is used in this paper as a reference to measure basis weight with a planar resolution of 1 mm2 and a measurement range of about 70 × 110 mm2.
Traditional thickness measurement methods often involve contact techniques that may result in sample damage or offer restricted spatial resolution. Profilometry offers a non-destructive and highly precise alternative, enabling the detailed analysis of height contours on both sides of the sample. Profilometry is a precise method used to assess the surface profile of an object by capturing the height profile of both sides of the sample. Subsequently, the thickness at various points across the sample can be calculated with exact precision using the developed algorithms.
In this study, a 3D-Profilometer Keyence VR-5200 (refer to
Figure 1) with vertical resolution of 0.1 μm and in-plane resolution of 23.5 μm is used to measure the height profile of both sides of the specimen. The specimen, with four pre-marked points on both sides, is carefully placed on the profilometry stage, to ensure stability and the precise location of the region of interest (ROI). Subsequently, the sample is flipped, and the opposite surface is scanned like that employed for the frontside surface, thereby obtaining a height map of the backside surface. Following a slight rotation, cropping, and surface shape correction, a surface profile of the specimen can be obtained, and the local height data can be exported. It should be noted that the thickness of the specimen is not directly measured using profilometry; rather, the average of the measured heights is considered to be 0. Like the concept of roughness, the local data will be given as positive or negative. Nevertheless, the global thickness of the paperboard remains a requisite variable for determining the actual thickness.
The height data from both surfaces are aligned to ensure corresponding spatial coordinates. For each point (x, y), the thickness (T) of the sample is calculated by subtracting the height of the bottom surface from the height of the top surface:
where
is the global measurement of thickness using a paper thickness tester according to ISO 534 [
24].
Figure 2 depicts the overlapped entire thickness mapping of material C, utilizing the local height profile of both surfaces.
This process results in a detailed thickness map with high spatial resolution (1 μm), providing comprehensive information about the sample’s thickness distribution. Profilometry is an effective tool for measuring the height contours of both sides of a paperboard sample and calculating its thickness.
2.3. Transmitted Light Measurement and Gray Value Analysis
The study focuses on the application of transmitted light measurements to analyze the local structure of paperboard. Light transmission measurement captures the amount of light passing through the paperboard sample. A highly specialized scanner (Epson Perfection V850 Pro), specifically to capture high-resolution transmitted light images, is used to obtain precise and reliable data on the internal structure of the test specimen. To ensure consistent and accurate light penetration during the imaging process, a meticulously manufactured stencil is precisely aligned with the geometries of the test specimen, thus providing uniform examination conditions. By maintaining consistent light transmission across all samples, the stencil plays a crucial role in minimizing variability and ensuring the reliability of the gray data obtained from the transmitted light images. The dimensions of the samples are the same as those used for grammage measurements with -radiography, and a resolution of 300 dpi (about 84.6 μm) is used for scanning.
In order to facilitate the subsequent analysis of the local structure, it is necessary to convert the resulting image to gray values. These images undergo thorough analysis to examine the distribution of gray values, which are indicative of various material properties within the paperboard. The gray value, ranging from 0 (black) to 255 (white), corresponds to the intensity of transmitted light and provides a quantitative measure of the material density and composition. Areas with higher gray values indicate regions of higher light transmission, which could correspond to less dense or more translucent areas within the paperboard. Conversely, lower gray values suggest denser or more opaque regions. In addition, regions with inconsistent fiber distribution appeared as mottled patterns in the gray images. Analyzing the gray value distribution in the transmitted light images offers profound insights into the composition and internal structure of the paperboard. To check whether the intensity parameter of visible light is properly adjusted, the front and back sides of the sample are also scanned and analyzed.
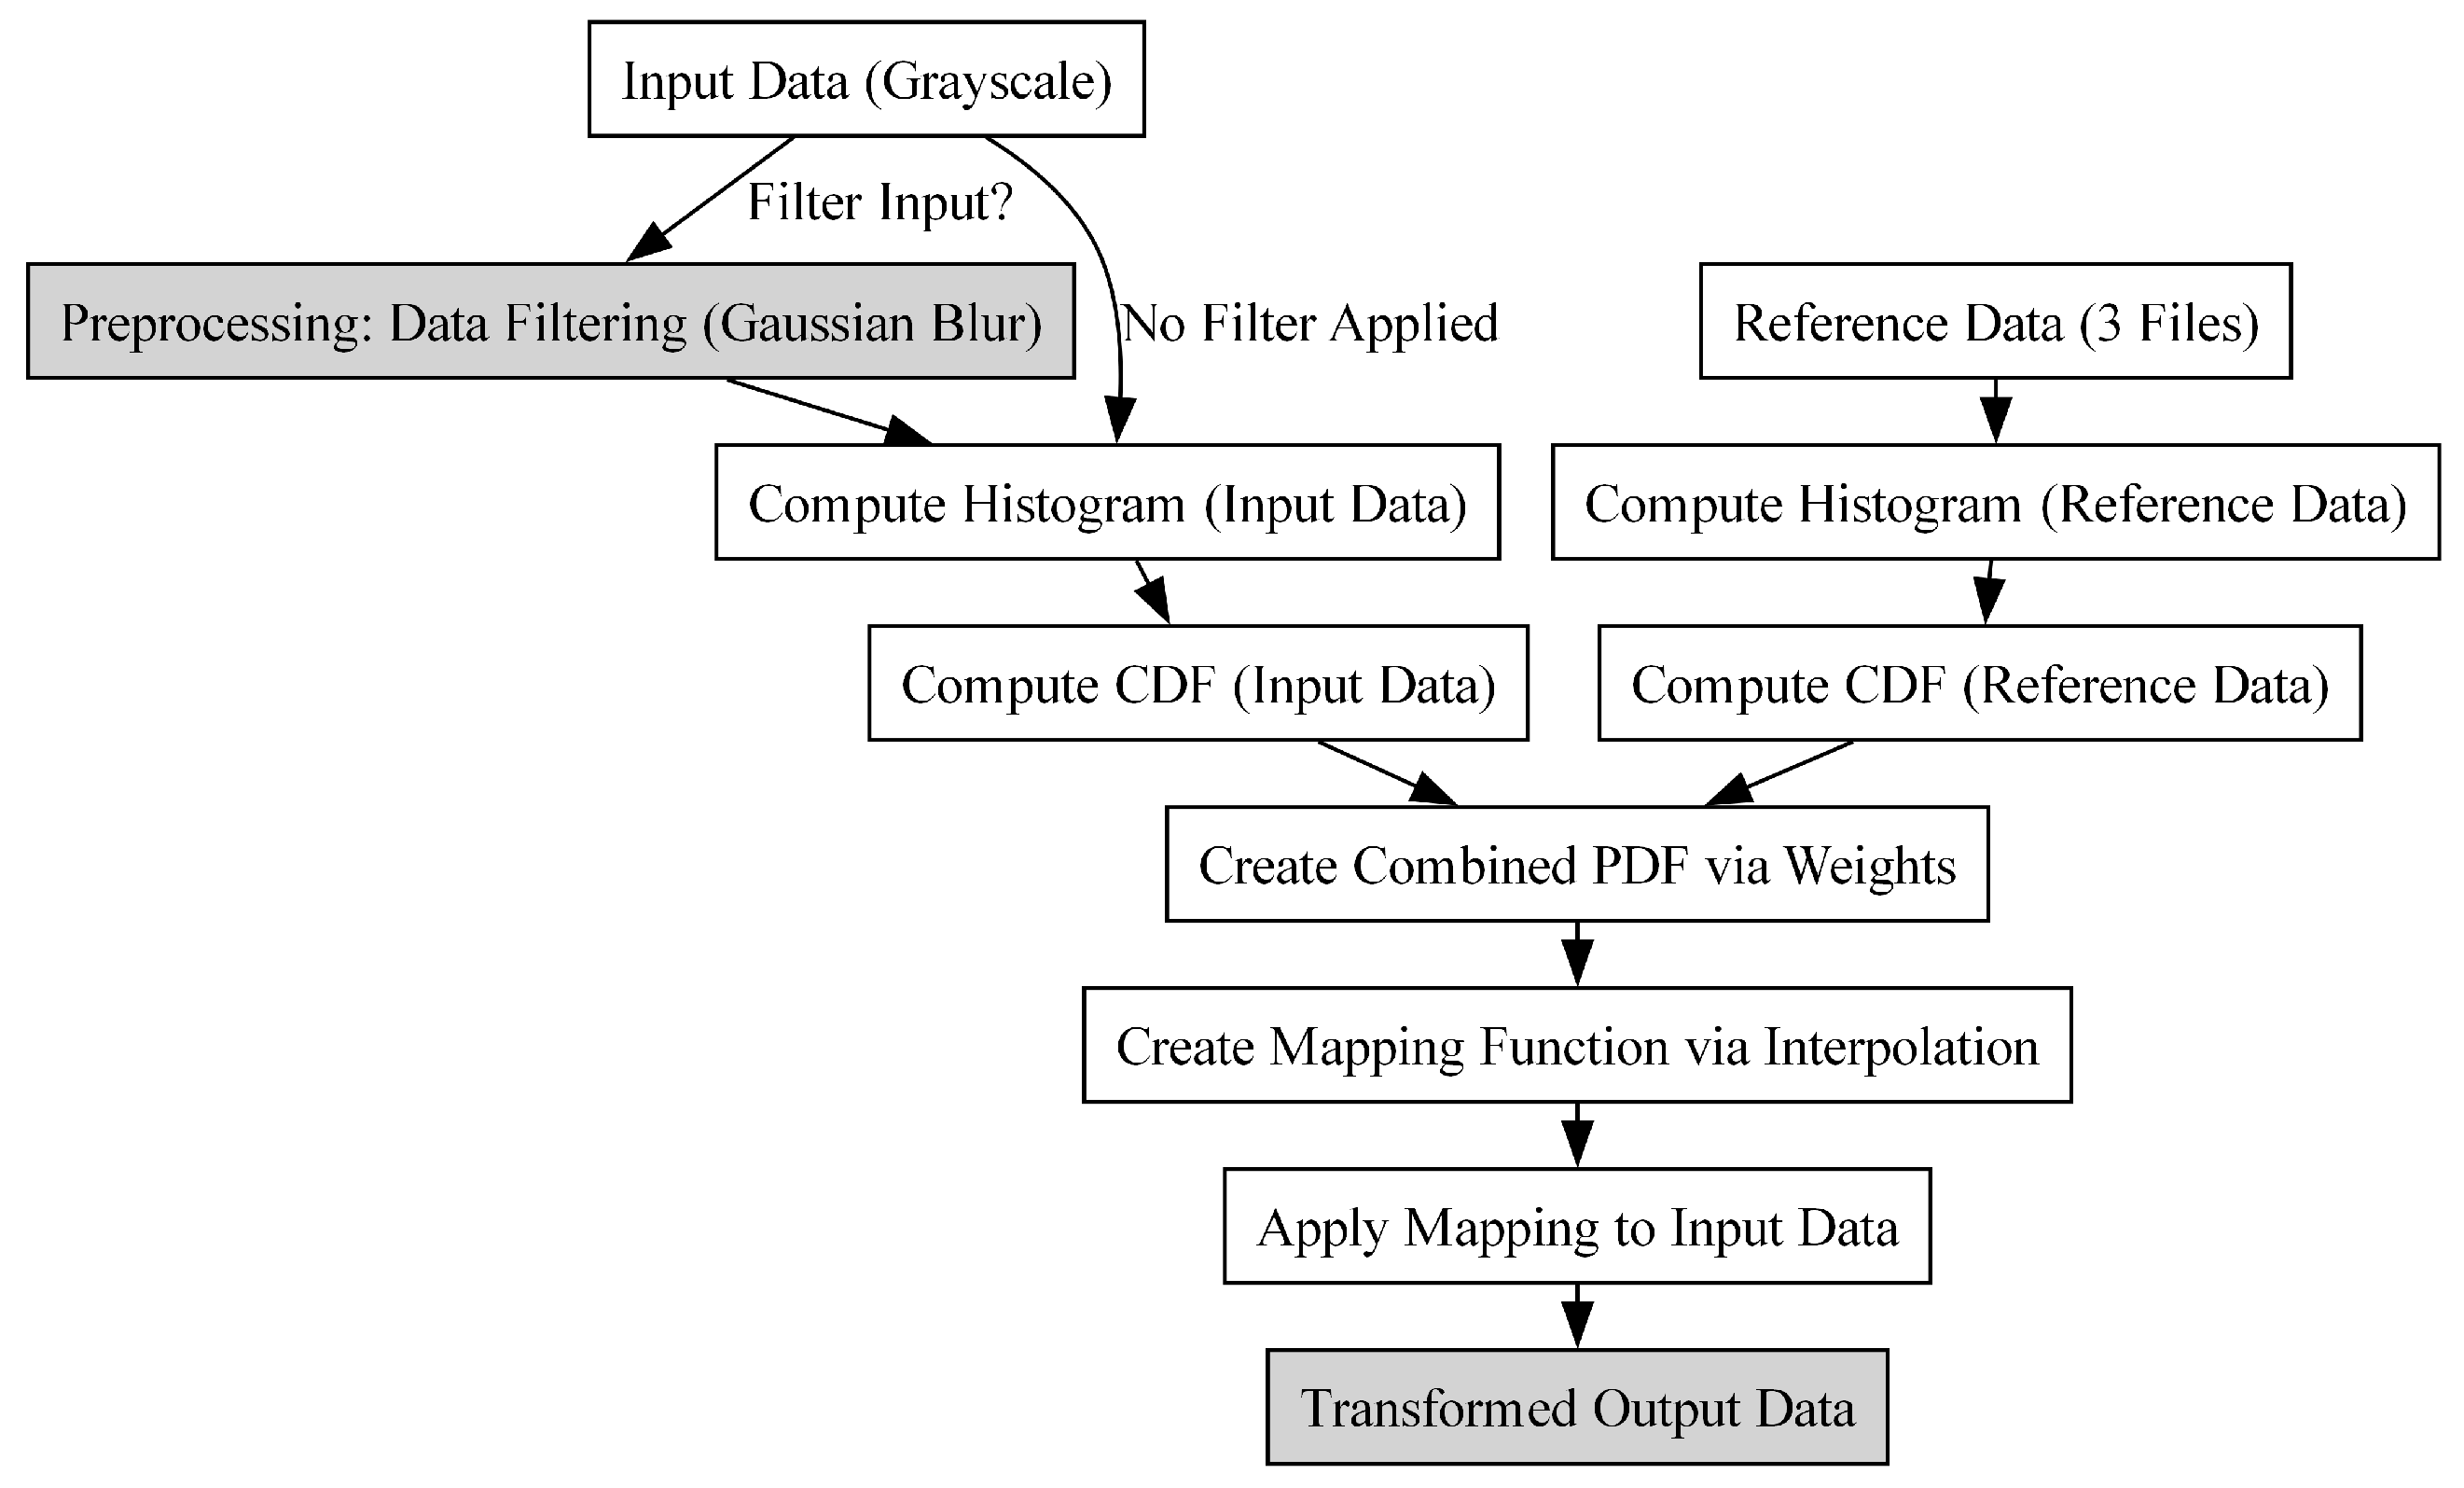
2.4. Histogram Matching Using Reference Data
Histogram matching is an essential technique in image processing that modifies the intensity distribution of an input dataset to match that of a reference dataset. In this analysis, the reference dataset consists of three different files. Gaussian kernel density estimation (KDE) is used to compute histograms, apply appropriate weights to create a combined distribution, and filter the input dataset with Gaussian blur before performing the matching process [
25]. The result of this procedure will be the final estimated dataset.
The reference datasets consist of three separate 2D arrays, , , and , each characterized by specific thickness or grammage values. The integration of these three datasets provides a comprehensive representation of the entire material spectrum, ensuring that the combined dataset faithfully encapsulates its inherent variability. Consequently, the weights assigned to each of the three datasets are uniform, resulting in an equitable contribution from each dataset to the overall reference distribution. The objective is to synthesize these datasets into a comprehensive reference distribution through appropriate weighting, thus creating a unified statistical model for comparison with the input dataset.
2.4.1. Constructing Histograms
For each reference dataset
(where
), the histogram
is computed, which captures the frequency of occurrence of distinct thickness or grammage values across the 2D dataset. Here,
i represents a specific thickness or grammage value of interest within the range of the dataset. Mathematically, this can be expressed as:
where:
denotes the histogram of the k-th reference dataset;
indicates the thickness or grammage value at the position in the dataset;
W and H are the width and height of the 2D dataset, respectively;
is the Kronecker delta function, which equals 1 if the condition holds true (i.e., if the thickness or grammage at position equals i) and 0 otherwise.
This histogram is a frequency count of the values in the dataset that match i, enabling an analysis of the distribution of thickness or grammage in the reference dataset.
In practice, datasets may contain values that fall outside the expected range of i due to noise, measurement inaccuracies, or natural variability. To ensure the robustness of the histogram calculation, specific strategies are applied to handle these edge cases:
- 1.
Clipping values:
Any values in
that are less than the minimum
or greater than the maximum
are clipped to fall within the valid range:
- 2.
Binning continuous values:
For datasets with continuous thickness or grammage values, exact matches with
i are unlikely. In this case,
i represents the center of a bin, and the histogram is computed using intervals (bins) around
i. The Kronecker delta function is replaced by an indicator function that checks if the value falls within the bin:
- 3.
Overflow and underflow bins:
To account for values that are significantly outside the expected range, “overflow” and “underflow” bins can be introduced. These bins capture all values above and below , ensuring no data are discarded and providing insight into outliers.
2.4.2. Gaussian Kernel Density Estimation (KDE)
KDE is a non-parametric statistical method for estimating the PDF of a random variable based on a finite sample of data. Unlike parametric methods that assume a specific distribution form (e.g., normal or exponential), KDE estimates the density function directly from the data by summing contributions from individual data points using a kernel function. In practice, Gaussian kernel density estimation is the most widely used variant due to the properties of the Gaussian function, which provides smooth and differentiable estimates of the density. After calculating the histograms, Gaussian kernel density estimation (KDE) is used to smooth the histograms and obtain continuous probability density functions (PDFs) for each reference dataset. The KDE for the
k-th dataset can be represented as:
where:
is the probability density function associated with the k-th dataset;
represents the total number of data points in ;
is the m-th thickness or grammage value in ;
is the Gaussian kernel defined as , with h being the bandwidth parameter that controls the degree of smoothness;
h is the bandwidth of the Gaussian kernel, controlling the smoothness of the estimated density.
The choice of bandwidth h is critical; it determines the balance between smoothness and the preservation of data features. An inappropriate selection can lead to either over-smoothing, obscuring important details, or under-smoothing, which fails to effectively mitigate noise.
In this equation, x is a continuous variable representing the thickness or grammage values over which the density is being estimated.
2.4.3. Weighting the Datasets
Once the KDEs are computed for each of the three reference data sets, weights are applied to create a combined probability density function. The weights assigned to each dataset are denoted as
,
, and
. The assumption of equal weights is justified because all three measurements are derived from the same batch produced during the material’s manufacturing process. This combination of datasets ensures comprehensive coverage of the full range of material properties:
The combined PDF can be calculated as follows:
Thus,
In this equation,
represents the synthesized probability density function for the combined reference datasets, where
x continues to denote the thickness or grammage values.
2.4.4. Normalizing the Combined PDF
To ensure that the combined PDF integrates to one, normalization is required by calculating the integral of the combined PDF over the intensity range:
The normalized PDF is then given by:
2.4.5. Filtering the Input Dataset with Gaussian Blur
Gaussian blur is a widely adopted and effective technique in image processing and data smoothing, primarily due to its robust mathematical foundation. The method leverages a Gaussian function to weight adjacent data points, achieving noise suppression while retaining crucial features of the signal. The rationale behind selecting Gaussian blur for noise reduction applications is underscored by the following factors [
26]:
Efficient noise reduction: Gaussian blur attenuates high-frequency noise through a weighted averaging process. By emphasizing data points in close proximity and diminishing abrupt variations that typically characterize noise, the filter yields a smoother and more coherent data representation.
Preserving structural integrity: Unlike alternative techniques such as the median filter or the bilateral filter, which can unintentionally distort or alter fundamental data patterns, Gaussian blur preserves the overall structural features. The filter’s smoothly decaying weights allow it to minimize noise without introducing artifacts, preserving the fidelity of the underlying data.
Computational efficiency: The Gaussian kernel is derived from the normal distribution, which is both mathematically straightforward and computationally efficient. This simplicity is particularly advantageous for applications involving large datasets or scenarios requiring real-time processing capabilities.
Before proceeding with histogram matching, a Gaussian blur is applied to the input data. This step is crucial for noise reduction and enhancement of the underlying data structure. The blurred dataset can be mathematically represented as:
In this equation,
represents the thickness or grammage value at the position
in the blurred dataset.
G denotes the Gaussian kernel defined by:
where
controls the amount of smoothing.
2.4.6. Computing the Histogram for the Blurred Input Dataset
Once the input dataset has been filtered, its histogram
is computed as:
In this case, captures the frequency of occurrences of the specific thickness or grammage value i in the blurred input dataset.
2.4.7. Computing Cumulative Distribution Functions (CDFs)
The cumulative distribution functions (CDFs) are then computed for both the blurred input dataset and the normalized combined reference dataset. The CDF for the blurred input dataset is defined as:
Here, accumulates the histogram values up to the thickness or grammage value i, providing the cumulative probability of obtaining values less than or equal to i in the blurred dataset.
In a similar manner, the CDF for the combined reference dataset is given by:
In this equation, accumulates the probabilities from the normalized reference dataset, where j represents the thickness or grammage value of interest.
2.4.8. Creating the Mapping Function
To facilitate the matching process, a mapping function
T is constructed that aligns the CDF of the blurred input dataset with that of the reference distribution. This mapping function is defined as:
In this equation, identifies the appropriate reference value j corresponding to the cumulative probability , effectively mapping the values from the blurred dataset to the reference dataset.
2.4.9. Generating the Estimated Output Dataset
Finally, the mapping function is utilized to generate the estimated output dataset
:
Here, represents the thickness or grammage value at the position in the estimated output dataset, ensuring that the distribution of the output closely aligns with that of the reference datasets.
2.4.10. Summary of the Methodology
This detailed methodology of histogram matching using a reference dataset consisting of three separate files highlights the crucial steps of Gaussian kernel density estimation (KDE), weighting, and filtering of the input data. The process results in a final estimated dataset that aligns closely with the reference dataset. The flow chart is shown in
Figure 3.
The rigorous mathematical formulation provided here underscores the robustness of the histogram matching process and serves as a guide for practitioners in various fields, such as medical imaging, remote sensing, and industrial quality control. In summary, this approach not only enhances the visual quality of the output dataset but also facilitates more accurate analyses and comparisons across diverse datasets.
2.5. Structure Tensor Method for Fiber Orientation Analysis
The fiber orientation is investigated by means of a transmitted light measurement, whereby the light transmission and scattering provide information about the orientation and distribution of the fibers. The structure tensor is a powerful mathematical tool used in image processing and computer vision to analyze local structures in images. It is particularly valuable in applications involving fiber-reinforced materials, where understanding the orientation and distribution of fibers is crucial for predicting material behavior.
2.5.1. Structure Tensor Calculation
The structure tensor can be described as an operator that represents the predominant directions of the gradient in a specified neighborhood of a point and the degree to which those directions are coherent. It is represented by a matrix that captures partial derivatives, making it an effective tool for representing edge information and describing local patterns [
27]. The structure tensor
J is defined based on the gradient of an image. It captures local information about the image structure by encoding both the gradient magnitude and direction. For a gray value image
I, the structure tensor is computed as:
where
and
are the partial derivatives of the image with respect to the
x and
y coordinates, respectively.
Gradient Computation
To compute
and
, various methods can be used, including Sobel filtering. The Sobel operator applies convolution with specific kernels to approximate the gradients:
The gradients are calculated as:
where * denotes the convolution operation.
Gaussian Filtering
Before calculating the gradients, it is common to apply Gaussian smoothing to reduce noise, which can adversely affect the accuracy of the gradient computation. The Gaussian filter is defined as Equation (
9). The filtered image is then used to compute gradients, yielding
and
.
Structure Tensor Method
Once the gradients are computed, the structure tensor is constructed by taking the outer product of the gradient vector. For a pixel at coordinates
, the structure tensor is formulated as:
Eigenvalue and Eigenvector Extraction
The next step involves computing the eigenvalues and eigenvectors of the structure tensor. The eigenvalues
and
provide insights into the local structure of the image, while the eigenvectors indicate the orientation. The eigenvalues can be determined by solving the characteristic polynomial:
The eigenvalues are the solutions to this equation, providing critical information about the image structure.
2.5.2. Fiber Orientation Analysis
Fiber Orientation Calculation
The fiber orientation can be derived from the eigenvectors of the structure tensor. Specifically, the principal eigenvector
corresponding to the largest eigenvalue
indicates the dominant direction of the fibers in the image. The orientation angle
can be calculated as:
where
and
are the components of the principal eigenvector.
Anisotropy Calculation
Anisotropy is a key parameter in characterizing the directional dependence of the fiber distribution. It quantifies the difference between the primary and secondary eigenvalues, reflecting the degree of directionality in the fiber orientation distribution. The anisotropy
A can be computed using the following formula:
where
is the larger eigenvalue (dominant eigenvalue) and
is the smaller eigenvalue. A higher value of anisotropy indicates a more pronounced fiber directionality, while lower values suggest a more isotropic distribution.
Relationship Between Eigenvalues and Anisotropy
The eigenvalues represent the variance of the fiber orientation distribution along their respective axes. When fibers are well-aligned, will be significantly larger than , resulting in higher anisotropy. Conversely, if the fibers are randomly oriented, the eigenvalues will be closer in value, leading to lower anisotropy.
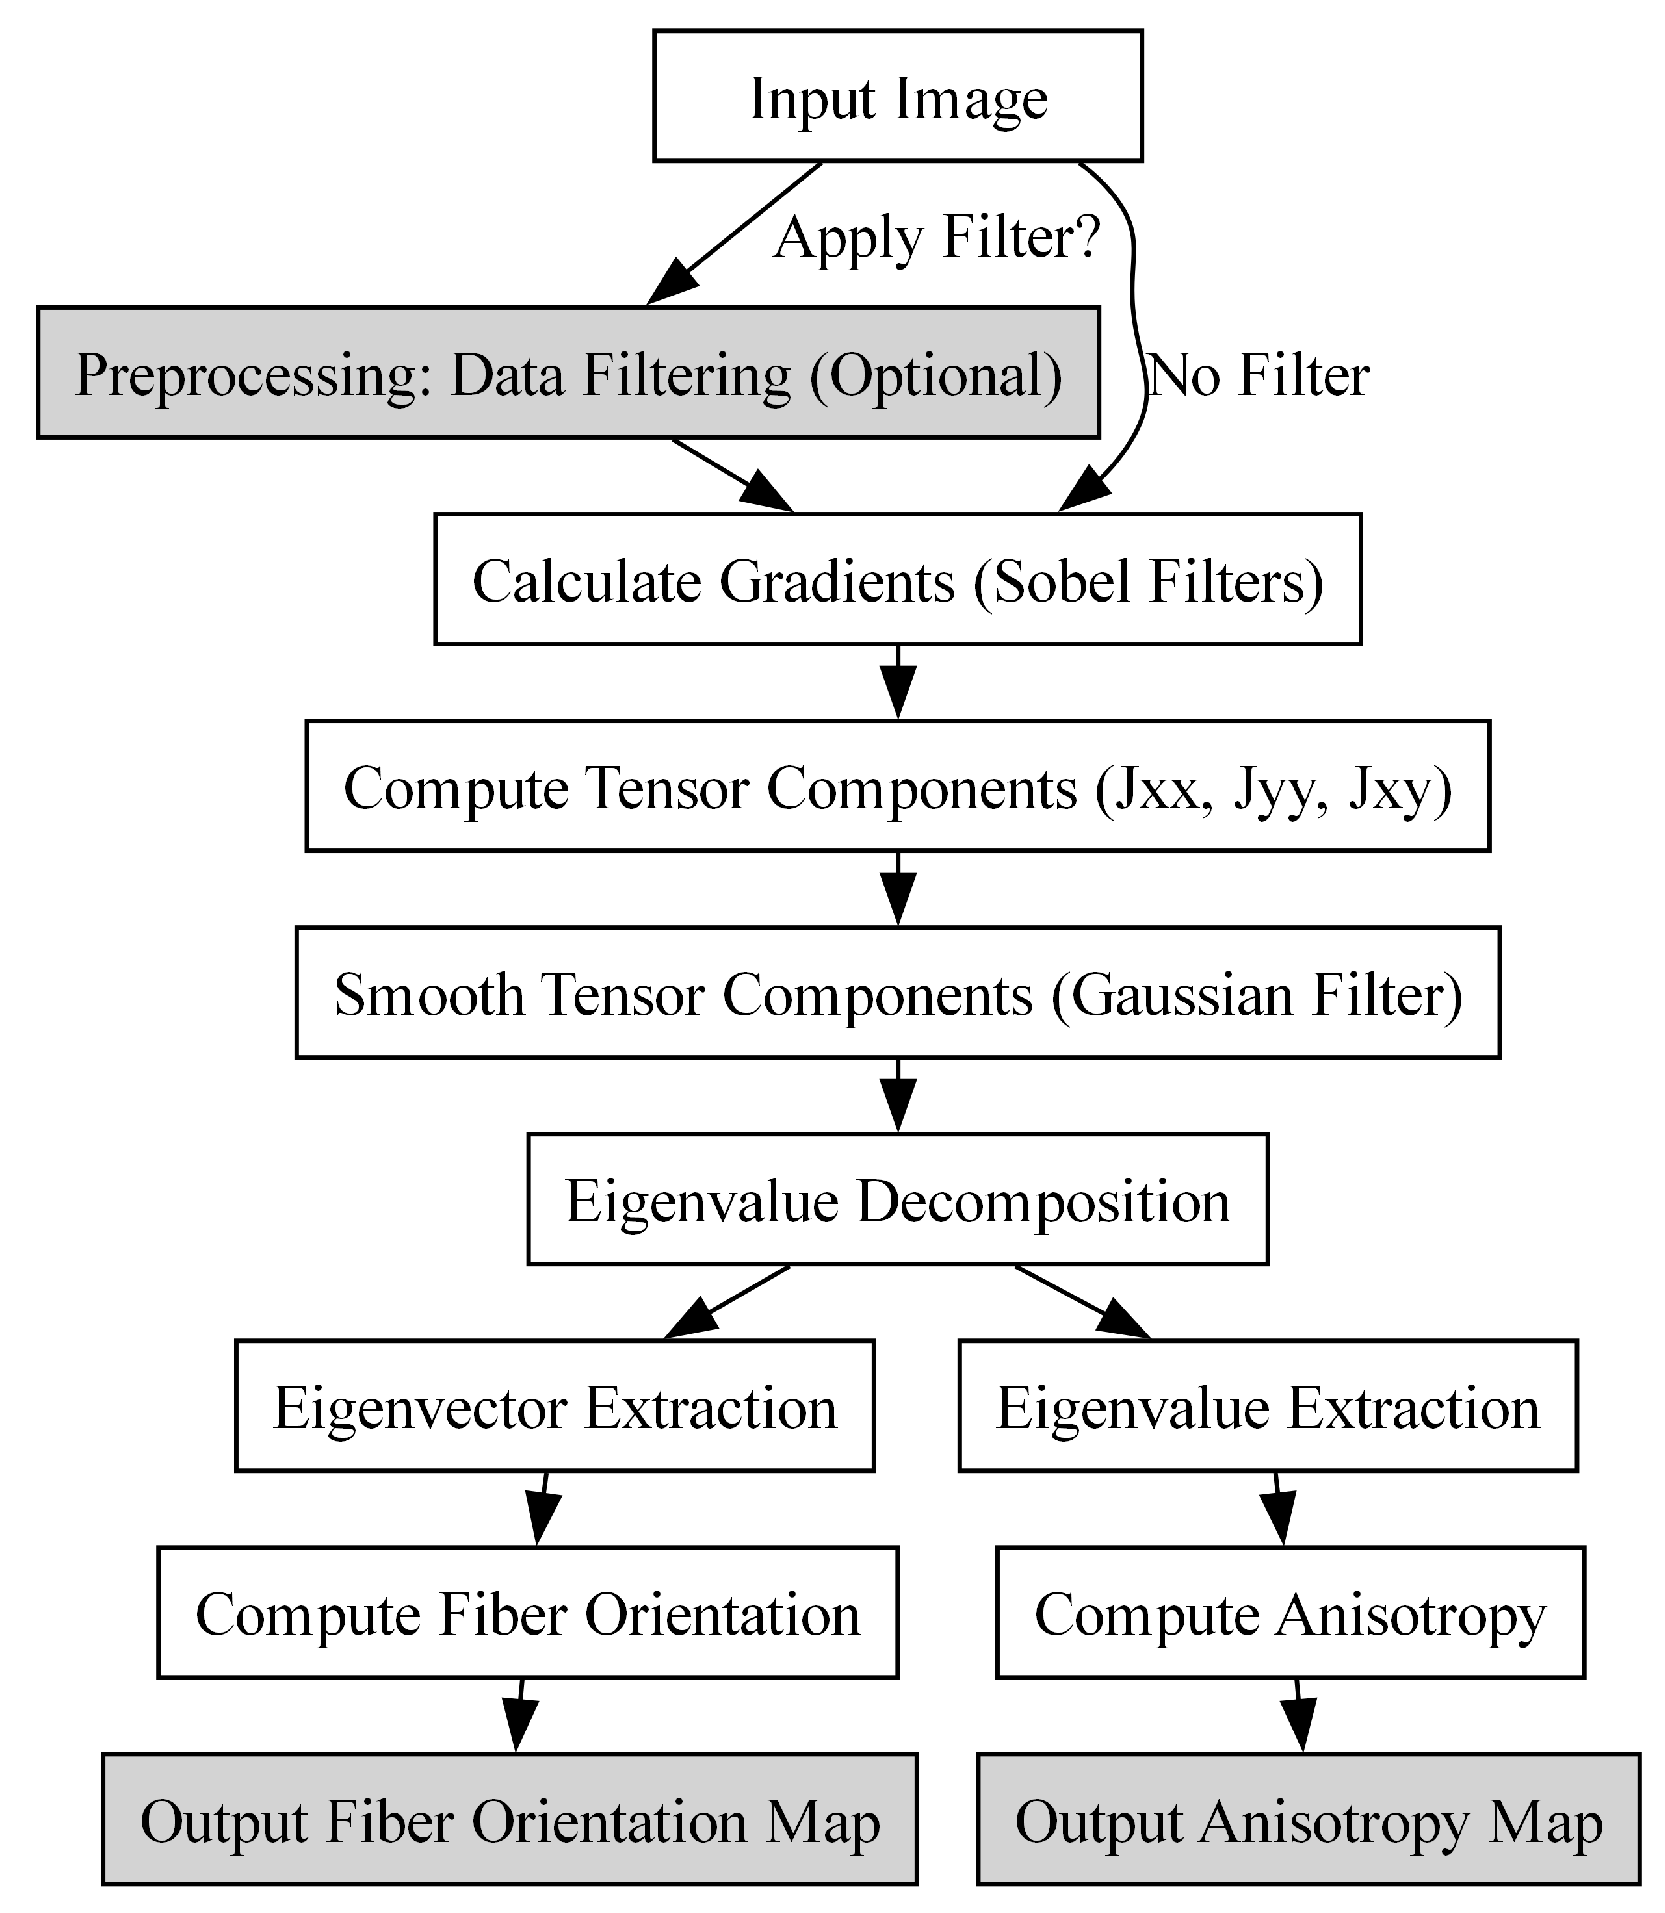
2.5.3. Summary of the Methodology
The process of applying the structure tensor method to fiber orientation analysis is summarized below, and the flow chart is shown in
Figure 4.
- 1.
Input Image: A gray value or color image of the material structure.
- 2.
Preprocessing: Optionally apply Gaussian filtering to the image to reduce noise.
- 3.
Gradient Calculation: Compute the gradients using the Sobel operator or other methods.
- 4.
Structure Tensor Formation: Construct the structure tensor from the gradients.
- 5.
Eigenvalue and Eigenvector Extraction: Calculate eigenvalues and eigenvectors of the structure tensor.
- 6.
Fiber Orientation Calculation: Determine the fiber orientation from the principal eigenvector.
- 7.
Anisotropy calculation: Compute anisotropy using the eigenvalues.
Structure tensor and fiber orientation analysis have important applications in materials science, particularly in characterizing the mechanical properties of fiber-reinforced composites, where the orientation and distribution of fibers influence strength and stiffness. In addition, this analysis can aid in the design of materials with tailored properties for specific applications.
In summary, the structure tensor provides a robust framework for the analysis of fiber orientation in composite materials. The use of mathematical formulations and computational techniques provides valuable insights into material behavior, ultimately leading to the development of improved materials with desirable mechanical properties.
2.6. Distribution Functions
In this study, several well-established statistical distribution functions are used to evaluate which distribution provides the best fit to the local grammage, thickness, and fiber orientation data. The goal is to determine which of these distributions most accurately captures the variability and structural characteristics of the material under study. By fitting the data to these distributions, an informed decision can be made as to which model provides the most accurate description of the underlying stochastic processes. This analysis is critical to improving numerical simulations and understanding the behavior of the material under mechanical stress, particularly in industrial applications involving forming processes. Here, the individual statistical distributions, their properties, common applications, and the potential advantages and limitations of fitting data related to grammage, thickness, and fiber orientation are discussed.
2.6.1. Weibull Distribution
The Weibull distribution is essential for analyzing the strength and failure characteristics of paperboard materials, particularly in running web applications where it adeptly models strength distributions [
28]. It also provides robust predictive capabilities for assessing creep life in containerboard and corrugated boxes [
29]. The shape and scale parameters of the distribution allow nuanced capture of failure mode variability under different loading conditions, providing insight into material properties beyond mean strength measurements alone [
30]. Variables such as reinforcing pulp type, basis weight, and cross-machine orientation significantly affect the parameters of the distribution, providing a rigorous statistical basis for evaluating the durability and reliability of paperboard materials. The Weibull distribution is, therefore, invaluable for lifetime prediction and material optimization in paperboard product design [
29,
30].
2.6.2. Log-Normal Distribution
The log-normal distribution plays a critical role in the characterization of paperboard, particularly for modeling fiber characteristic distributions and porosity. This distribution is often used to represent pore sizes in both interfiber and intrafiber spaces, capturing the effects of pulping forces and alignment during the papermaking process [
31]. The distribution of fiber lengths in medium-density fiberboard, often log-normal, occasionally fits Weibull characteristics [
32]. Understanding fiber length and spacing distributions is fundamental to assessing flocculation and formation dynamics in paper products, as these parameters directly affect material uniformity and mechanical integrity [
33].
2.6.3. Exponential Distribution
The exponential distribution, valued for its simplicity, finds application in reliability studies, although its accuracy depends on proper application [
34]. Research in paperboard packaging highlights the critical role of crush resistance, which is significantly influenced by load orientation and material anisotropy [
35]. Advanced predictive frameworks, such as those of Mattsson and Uesaka [
30], include static strength, load sensitivity, and creep life variability parameters, providing a more comprehensive understanding of paperboard failure under environmental and load-induced conditions. Such frameworks underscore the need for accurate statistical modeling in predicting material performance [
36].
2.6.4. Normal Distribution
Widely used in statistics, the normal distribution is advantageous for analyzing microstructural aspects of paperboard, where, for example, X-ray
-CT can approximate fiber distributions using parametric probability density functions, providing quantifiable assessments of structural uniformity [
37]. However, failure analysis under compressive loading typically reveals a skewed distribution that is better represented by the Weibull model. This underscores the importance of selecting distribution models that account for specific material structures and loading characteristics for reliable predictions of packaging durability [
30,
35].
2.6.5. Gamma Distribution
The Gamma distribution is essential for modeling fiber spacing, particularly in nonwoven configurations, by capturing interfiber spacing in both random and nonrandom arrangements [
38]. In paper and staple fiber materials, the gamma model adeptly represents material inhomogeneity, a critical factor for quality control and performance prediction. Its application to creep life modeling in paperboard, given the skewed nature of the failure distribution, allows accurate prediction of time-dependent failure behavior, particularly in corrugated and containerboard materials [
30].
2.6.6. Pearson Type 3 Distribution
The Pearson Type 3 (Pearson3) distribution, effectively modeled by the gamma distribution, is particularly suitable for fitting data characterized by skewness and a wide range of variability. In this study, it is identified as the optimal model for grammage, thickness, and fiber orientation distributions in paper and paperboard materials, indicating that the variability in these properties is non-symmetric. This distribution is particularly relevant for assessing fiber orientation, which is critical for optimizing the structural and mechanical performance of paperboard products. Using advanced techniques such as X-ray
-CT, the Pearson3 distribution accurately captures the skewness in fiber orientation and provides valuable insights into the principal fiber direction [
37]. Such insights are critical to understanding how fiber orientation affects the overall performance and durability of paperboard materials, helping to design stronger, more reliable products. In addition, the adaptability of the Pearson3 distribution to model processes that deviate from normality allows for a nuanced understanding of material properties, improving quality control and performance prediction in paperboard applications.
4. Discussion
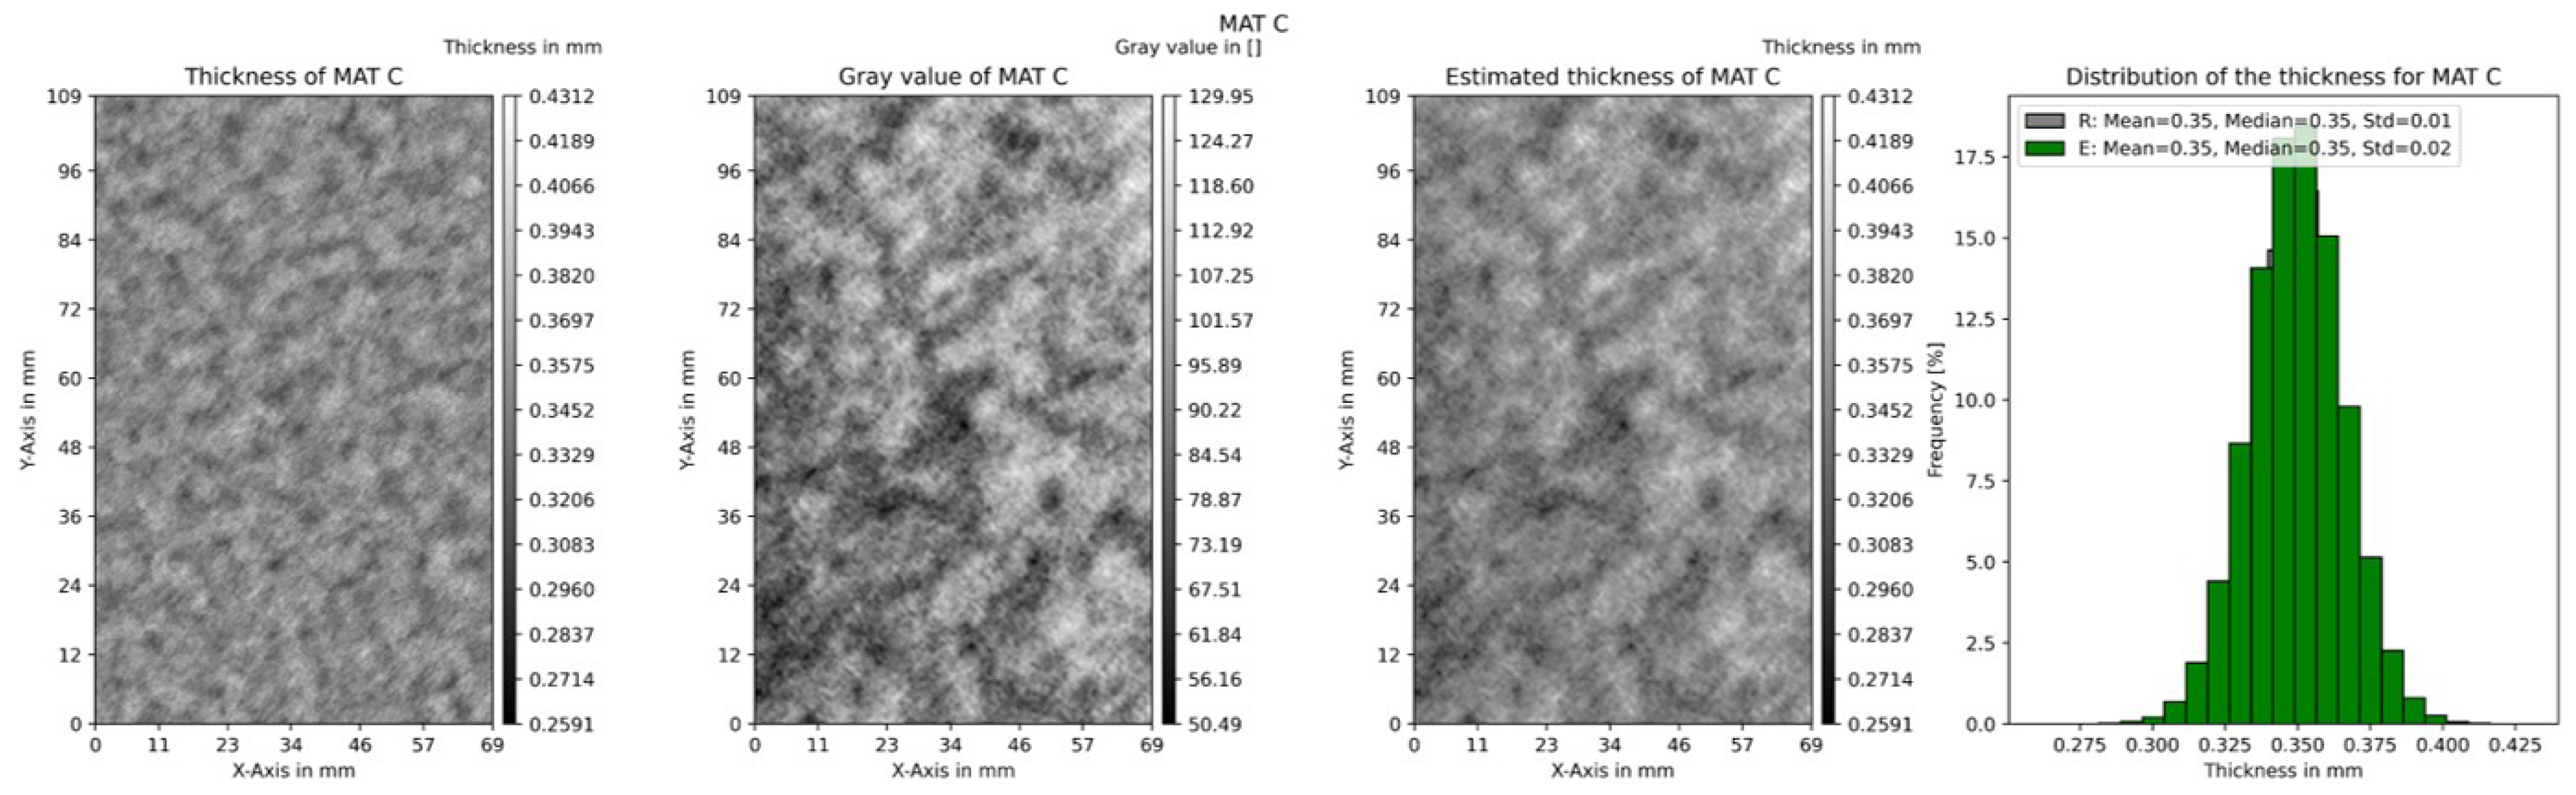
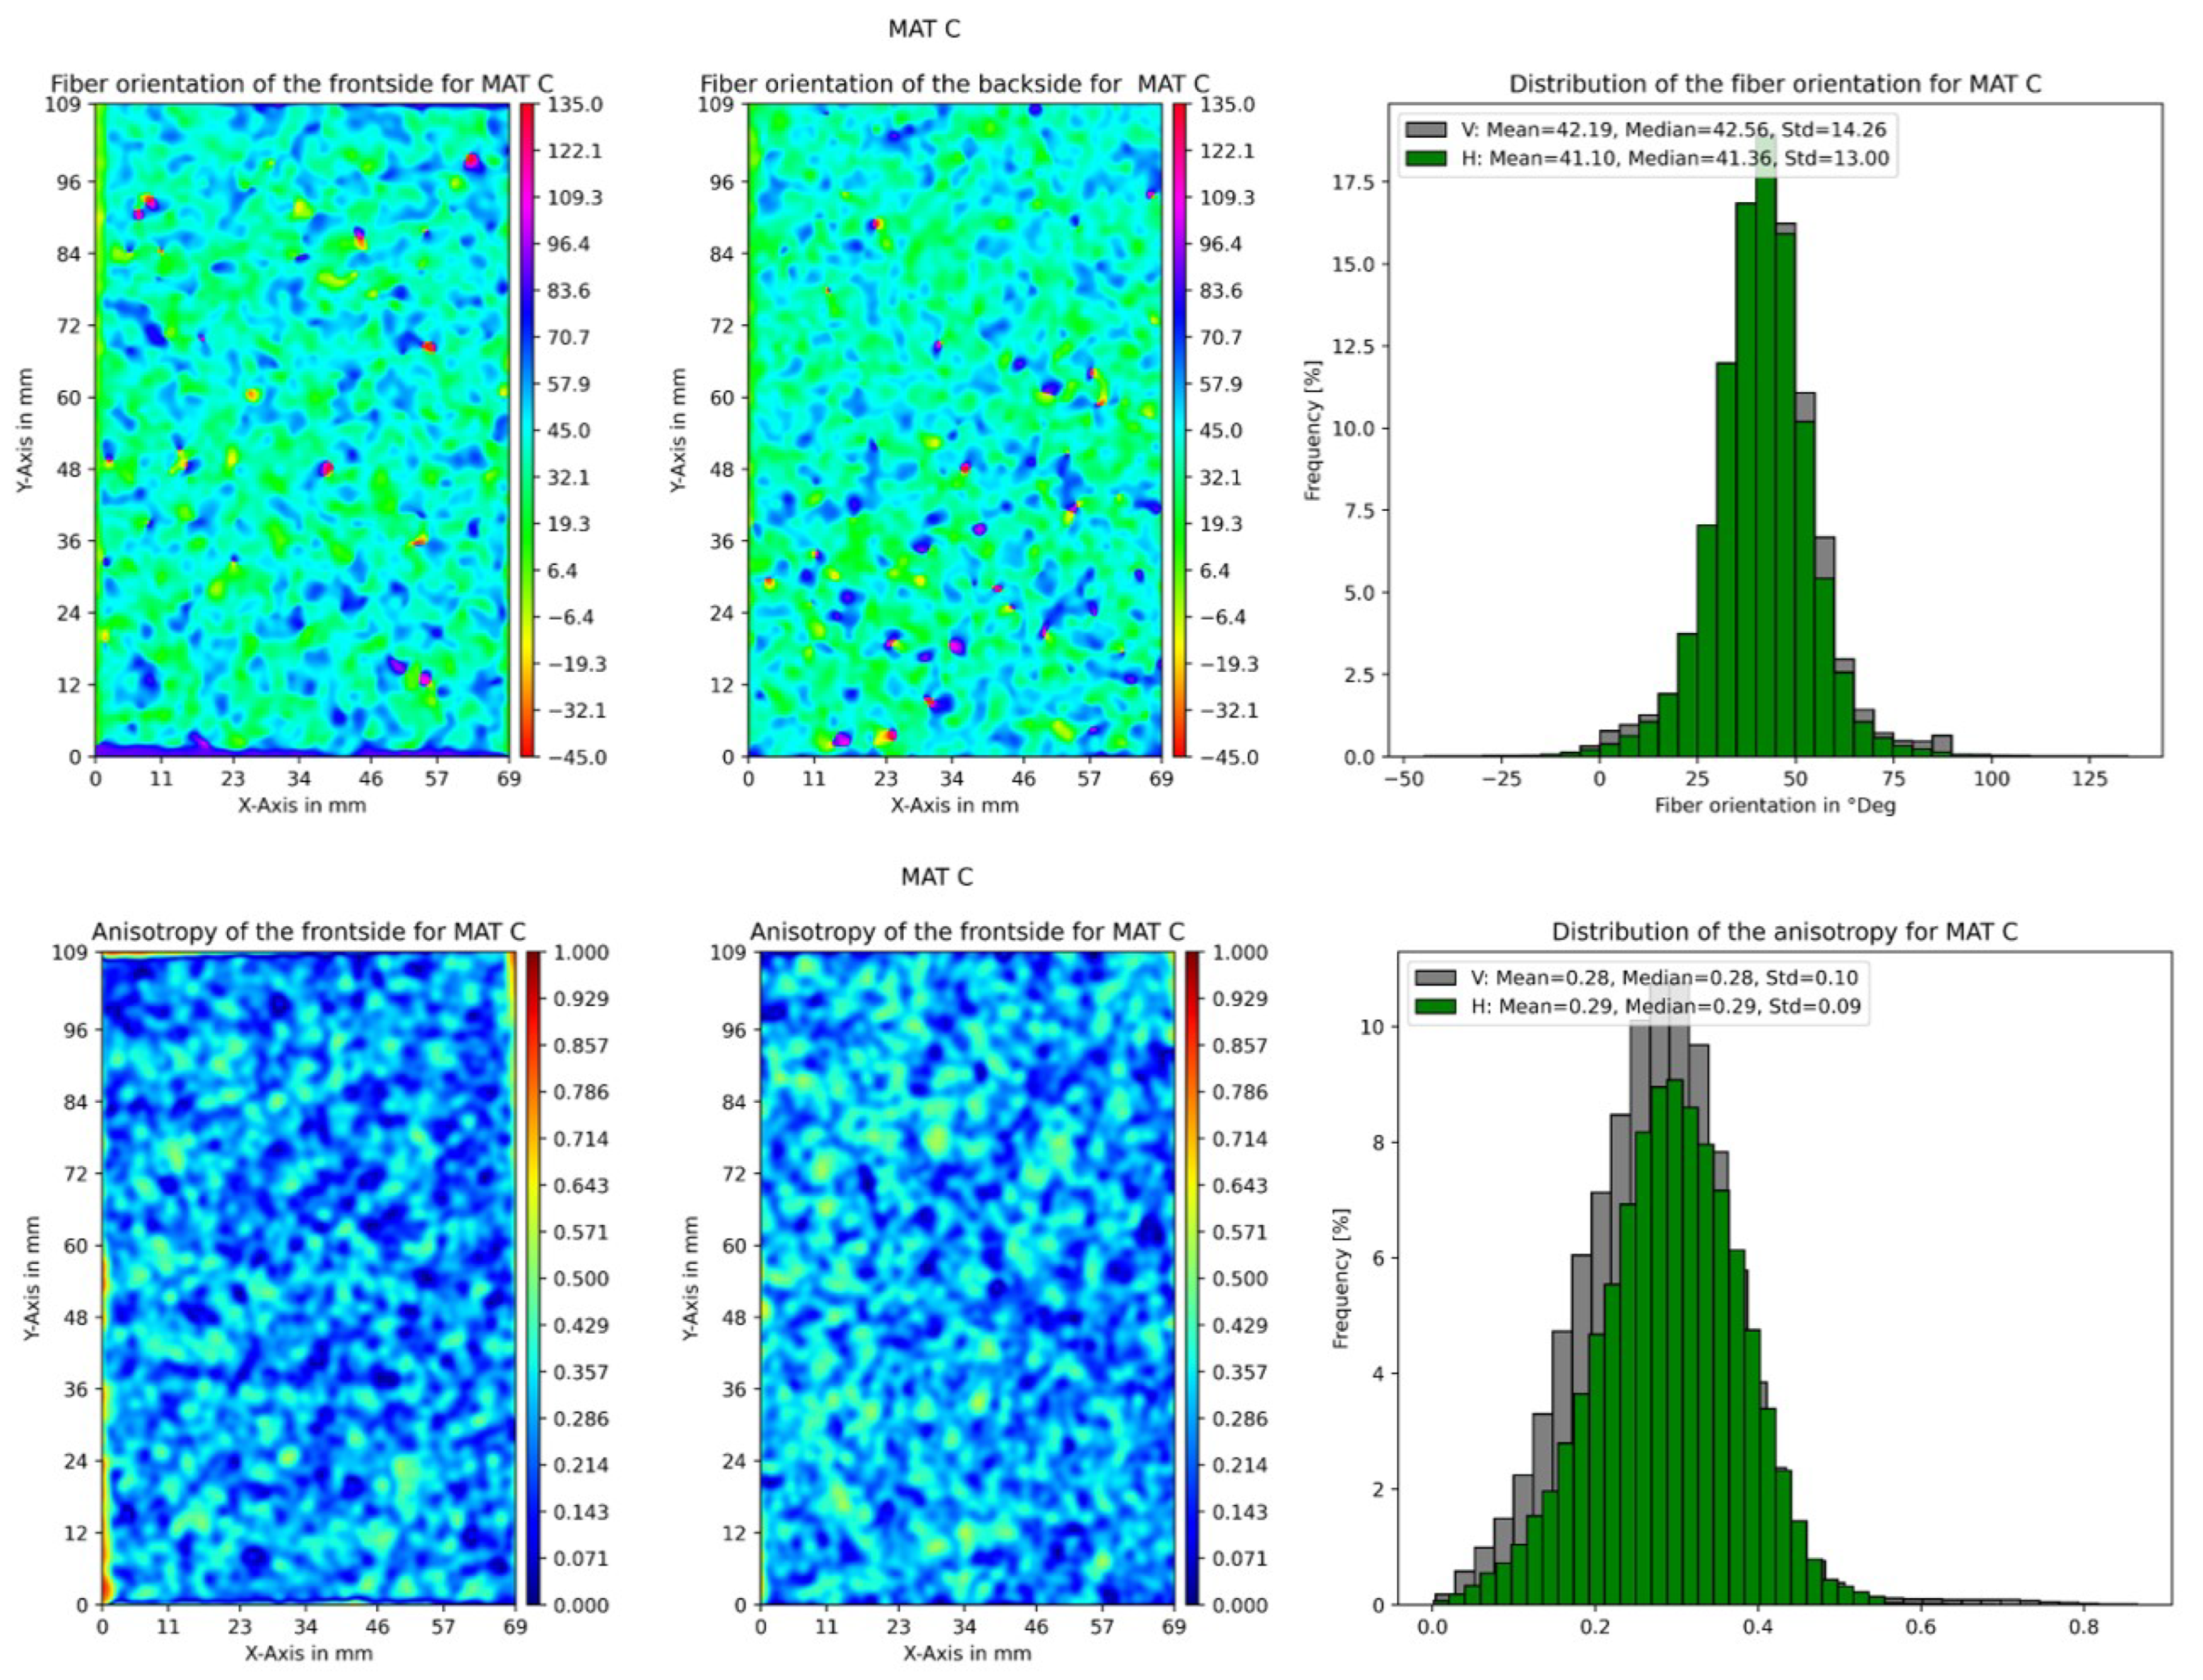
This study introduces transmission-based measurement methods for determining local structural characteristics of paper materials, including grammage, thickness, and fiber orientation. The results show significant potential in offering a rapid, cost-effective, and comprehensive alternative to traditional methods that currently require the simultaneous use of multiple techniques. The proposed approach successfully correlates gray values from light transmission measurements with data obtained from -radiography and profilometry, allowing for accurate estimation of local grammage and thickness. The study also highlights the effectiveness of image analysis techniques in determining local in-plane fiber orientation. In particular, the structure tensor method has been demonstrated to be a robust tool for the extraction of fiber orientation information from gray images. This method leverages the gradients of light transmission images to construct a local orientation map, offering detailed insights into the fiber distribution within the paper material. The results demonstrate that the Pearson3, log-normal, and gamma distributions provide the best fits to the data for grammage, thickness, and fiber orientation.
The primary advantage of this method lies in its ability to simultaneously provide multiple local structural characteristics through a single, straightforward measurement process. This capability addresses the limitations of existing methods, which are often time-consuming, expensive, and limited in scope. The proposed method significantly reduces the time and cost associated with the structural characterization of paper materials by utilizing light transmission measurements, thereby making it a practical option for industrial applications. The time required for scanning and evaluation depends on the resolution and size of the sample; for an A4-sized sample, scanning at 300 dpi takes about 5 s.
Addressing the challenges and limitations identified in the transmitted light method requires further investigation. The accuracy of this technique is highly dependent on the quality of the gray value images and the consistency of the light transmission setup. Even slight noise can significantly affect the reliability of the results. To enhance the robustness of this method, careful calibration of the light source, along with improved preprocessing techniques such as noise reduction and contrast enhancement, is crucial. In this study, these improvements were applied to increase the overall reliability of the method.
Mitigating the method’s sensitivity to foreign particles and structural inconsistencies requires the implementation of advanced filtering techniques, which are successfully utilized in the proposed approach. Although machine learning-based classification is not explored in this work, it represents a promising avenue for future research, offering the potential to further distinguish relevant structural features from artifacts. Additionally, optimizing calibration protocols to account for variations in pulp composition would improve measurement reliability. This is addressed in this study by using three distinct reference datasets derived from the reference measurements of -radiography and profilometry, which together cover the full spectrum of grammage for the -radiography data and thickness for the profilometer data. Further studies are required to confirm its applicability across a broader range of material compositions.
The transferability of these corrections to other paper and paperboard materials remains untested, necessitating additional research to evaluate the generalizability of the method across diverse material types, including coated materials. While the validation of fiber orientation remains a significant challenge, alternative methods, such as sheet splitting combined with single-layer measurements or X-ray -CT on smaller samples, offer promising avenues for cross-validation.
This study demonstrates the feasibility of the transmitted light method for material characterization. However, more comprehensive testing across a wider variety of paper materials and under different environmental and experimental conditions is essential to fully establish the accuracy, reproducibility, and general applicability of the method in diverse practical applications. A better understanding of the inhomogeneity of fiber-based materials can help in studying the correlation between the local structure and the mechanical behavior. The application of stochastic finite element analysis allows the incorporation of local random variables into finite element simulations, leading to an accurate determination of the mechanical behavior of the paperboard as well as damage prediction. A better understanding of material properties during the forming process can also help to improve formability, product quality, and production stability.
5. Conclusions
This study introduces a novel, efficient method for the non-destructive evaluation of local structural properties of paper materials by utilizing transmission-based measurements. The method leverages histogram matching to align the intensity distributions of gray value images (from transmission measurements) with those of reference datasets, such as -radiography data that accurately reflect grammage or profilometry for the thickness distributions. By transforming the histograms of the gray value images to match those of the reference datasets, this approach ensures that local variations in grammage and thickness are reliably estimated across the sample.
In addition to thickness and grammage, the method incorporates the structure tensor technique to determine the local in-plane fiber orientation, a key factor influencing paper mechanical properties. The structure tensor, an image analysis method, is applied to the gray value images to extract orientation information by analyzing local gradients in the image. This enables a detailed characterization of fiber orientation within the paper, which has a direct impact on its mechanical strength and formability.
Furthermore, the study demonstrates that the local distributions of thickness, grammage, and fiber orientation closely follow the Pearson3, log-normal, and gamma distributions, offering significant insight into the material’s variability. This statistical analysis is crucial for subsequent stochastic numerical studies, allowing for more accurate simulations of the material’s behavior under different conditions.
In conclusion, this integrated approach based on transmitted light measurements combining histogram matching and structure tensor analysis offers a fast, economical, and accurate alternative to traditional destructive testing methods. Although necessary for the calibration of paper and board materials with different fiber compositions, the proposed method has great advantages for a wide range of measurement needs. It has significant implications for improving numerical modeling in papermaking, optimizing mechanical forming processes, and ensuring the development of high-quality paper products.


 ,
, 