Article

Raman Scattering for Tensile Testing of Polyacrylonitrile-Based and Pitch-Based Single Carbon Fibers

1
Polymer Matrix Composites Group, Research Center for Structural Materials, National Institute for Materials Science (NIMS), Tsukuba 305-0047, Japan
2
Department of Aerospace Engineering, Tohoku University, Sendai 980-8579, Japan
*
Author to whom correspondence should be addressed.
Fibers 2024, 12(10), 88; https://doi.org/10.3390/fib12100088
Submission received: 26 August 2024 / Revised: 26 September 2024 / Accepted: 8 October 2024 / Published: 10 October 2024

Abstract

:
The tensile properties of polyacrylonitrile (PAN)-based and pitch-based single carbon fibers were assessed using Raman scattering. Parameters and ratios related to Raman scattering and stress measurement for the G- and D-bands were analyzed. These include the peak values of Raman shifts (RG, RD), full width at half maximum (FWHMG, FWHMD), peak value slopes (|AG|, |AD|), peak value intercepts (BG, BD), the intensity ratio (ID/IG), the peak value ratio (RD/RG), the full width at half maximum ratio (FWHMD/FWHMG), the slope ratio (AD/AG), and the intercept ratio (BD/BG). These parameters and ratios were determined by analyzing the PAN-based and pitch-based carbon fibers and were correlated to the tensile modulus (E), interlayer spacing (d002), lattice spacing (d10), and crystalline size (Lc and La). In addition, a linear relationship was identified between the Raman scattering, stress measurement parameters, ratios and E, d002, d10, as well as between the Raman scattering, stress measurement parameters, ratios and La and LC on the log–log scale.

1. Introduction

Polyacrylonitrile (PAN)-based and pitch-based carbon fibers are commonly utilized as reinforcements in composite materials due to their high specific strengths and moduli [1,2]. Presently, numerous PAN-based and pitch-based carbon fibers are available on the commercial market. Naito et al. characterized the tensile strength [3,4], fracture toughness [5], and transverse compressive properties [6] of PAN-based and pitch-based single carbon fibers. Several studies have investigated the nanostructure of carbon fibers using various techniques, such as X-ray diffraction [7,8,9,10,11], transmission electron microscopy [12,13,14], and Raman spectroscopy [15,16,17,18,19].
In contrast to crystallites, our understanding of the disordered part within carbon fibers remains limited, which is likely due to the absence of suitable analytical techniques [20]. Recently, Raman spectroscopy has been extensively applied to a wide range of carbon materials, and has proven to be an effective tool for characterizing their nanostructures. Raman spectra, which pertain to vibration modes at the molecular level, provide insights into the microstructure and crystalline ordering of carbon fibers [21,22]. Early studies on carbon materials demonstrated that a Raman band at approximately 1600 cm−1, corresponding to the graphite mode (G-band), can be correlated to the doubly degenerate in-plane Raman-active vibrational mode in graphite. Another band was observed in polycrystalline graphite at approximately 1300 cm−1, corresponding to the defect-induced Raman band known as the defect mode (D-band), which can be attributed to the breathing mode within the boundaries of the graphite crystals [23,24]. It was hypothesized that the appearance of breathing mode symmetry was the result of a breakdown in translational symmetry caused by the presence of microcrystalline structure on the surface of the fibers [17]. Therefore, the appearance of the D-band signifies a disordered structure, with the ratio of the intensities of the two bands, ID/IG, being extensively utilized to quantify the degree of structural disorder. Melanitis et al. [15] utilized Raman spectroscopy to determine the relationship between the structural and morphological characteristics of carbon fibers and their tensile moduli. Their findings indicated that an increase in the tensile modulus resulted in a more pronounced Raman signal and a reduction in the ID/IG ratio. Hao et al. [16] demonstrated that the tensile moduli of carbon fibers exhibited an upward trend with an increase in the heat treatment temperature. The ID/IG value decreased with increasing heat treatment temperature. However, the ID/IG value remained nearly constant, indicating that the bond defects and degree of covalent cross-linking between the graphene planes remained nearly constant at constant temperatures and stress levels. Qian et al. [17] discussed the correlation between the tensile strength and moduli of PAN-based carbon fibers and Raman measurements. An increase in the ID/IG ratio could lead to an increase in the tensile strength and moduli of the carbon fibers, although the trends depended on the type of impurities and precursors. Raman scattering is one of the effective methods for assessing the differences in the moduli and strength of various commercially available PAN-based and pitch-based carbon fibers.
The experimental results indicated that these bands are extremely sensitive to strain effects and can be used to investigate structural modifications in carbon materials [25,26,27,28]. Huang and Young [25] demonstrated that the rates of Raman band shift per unit strain for both PAN-based and pitch-based carbon fibers exhibited a linear increase with the tensile modulus of the fibers. Galiotis and Batchelder [26] demonstrated the strain dependencies of the Raman spectra of high-modulus carbon fibers. The shifts in the Raman band are significantly influenced by the deformation modes, which shift upward under compression and downward under tension. Moreover, Raman scattering during tensile testing effectively evaluates the differences in tensile properties between several commercially available PAN-based and pitch-based carbon fibers.
The aforementioned observations demonstrate that Raman spectroscopy possesses the capacity to quantify strain in commercially available carbon fibers. These measurements have the potential to serve as a non-destructive evaluation tool in the inspection and reliability assessment of carbon fiber composites [29]. Although numerous papers have been published on the Raman spectra of carbon fibers, studies focusing on the relationship between the Raman measurements and the structure of carbon fibers and the relationship between the Raman measurements and the mechanical properties of carbon fibers, separately, are limited. Comprehensive studies focusing on the relationship between the mechanical properties, Raman measurements, and structure of carbon fibers remain limited.
In this study, Raman scattering was used for tensile testing of commercially available high-strength PAN-based, high-modulus PAN-based, high-modulus pitch-based, and high-ductility pitch-based single carbon fibers. Raman scattering during tensile testing is believed to be correlated with the structure of carbon fibers. In addition, the structures of the carbon fibers were examined using X-ray diffraction. The relationships between the tensile properties, Raman measurements, and structural parameters, including the interlayer spacing (d002), lattice spacing (d10), crystalline size (Lc) (crystallite size perpendicular to the graphitic sheet or crystalline height), and crystalline size (La) (crystallite size along the graphitic sheet perpendicular and parallel to the fiber axis or the crystalline width) of the carbon fibers were discussed. The novelty and advantage of this study lie in our ability to elucidate the intricate relationships between the various Raman scattering parameters with and without tensile loads and the structural parameters in a comprehensive manner.

2. Materials and Methods

2.1. Materials

The carbon fibers used in this study were high-strength PAN-based (T1000GB and T700SC), high-modulus PAN-based (M60JB), high-modulus pitch-based (K13D), and high-ductility pitch-based (XN-05) carbon fibers. Moreover, high-strength PAN-based (T300, T800SC, T800HB, IMS60, and TR50S), high-modulus PAN-based (M40B and UM55), and high-modulus pitch-based (K135, K13C, XN-60, and XN-90) carbon fibers were tested for comparison. The T1000GB, T700SC, M60JB, T300, T800SC, T800HB, and M40B PAN-based carbon fibers were obtained from Toray Industries, Inc., Tokyo, Japan. The IMS60 and UMS55 PAN-based carbon fibers were supplied by Teijin Limited, Tokyo, Japan. The TR50S PAN-based, K13D, K135, and K13C pitch-based carbon fibers were obtained from Mitsubishi Chemical Corp., Tokyo, Japan. The XN-05, XN-60, and XN-90 pitch-based carbon fibers were obtained from Nippon Graphite Fiber Corp., Hyogo, Japan. All fibers underwent commercial surface treatments and sizing, with the specific aim of ensuring compatibility with epoxy. The physical and tensile properties of PAN-based and pitch-based carbon fibers are listed in Table 1 and Table S1 in the Supporting Information [4,5,6].

2.2. In Situ Raman Stress Measurement for Tensile Testing

Single carbon fiber specimens were prepared on a stage utilizing a stereoscope. A single carbon fiber was selected from the bundles of carbon fibers and cut perpendicular to the fiber axis using a razor blade. Subsequently, the diameter (df) of each individual carbon fiber was measured using a digital microscope with a maximum magnification of 6000 (VH-ZST swing-head zoom lens, VHX-8000 digital microscope, Keyence Corp., Osaka, Japan). The measured diameters of the single fibers are listed in Table 1 and Table S1 in the Supporting Information.
In situ Raman stress measurements were conducted during the tensile test in the chamber of a laser Raman spectrometer (NRS-7100. JASCO Corp., Tokyo, Japan) with a laser excitation wavelength of 532 nm, a diffraction grating of 1800 L/mm, a CCD detector, a long working distance object lens (100×) (spot size of 1 μm), a redactor with an OD of 1, a laser power of less than 3 mW, an exposure time of 60 s, and a neon lamp calibration. Raman spectra over the 1200–1700 cm−1 were measured. The loading system (fiber tensile module, Kammrath & Weiss GmbH, Schwerte, Germany) was controlled using testing controllers (DDS3, Kammrath & Weiss GmbH, Schwerte, Germany), with the maximum loading capacity of the in situ tensile machine being 1000 mN. The tensile test specimen is shown in Figure 1.
As reported in the literature, the tensile test specimen was prepared by affixing a single carbon fiber to a paper holder with an instant cyanoacrylate adhesive [3,4,5]. The specimen was then placed on the testing machine and the holder was cut into two pieces before testing. The gage length (L) was 5 mm, and the crosshead speed was 1.0 μm/s. Five replicate specimens were tested for all the carbon fibers. All tests were conducted in a laboratory environment at room temperature (23 °C ± 3 °C) with a relative humidity of 50% ± 5%.

2.3. X-ray Diffraction

Structural differences between the carbon fibers were analyzed using an X-ray diffractometer (Rigaku RINT TTR III, Rigaku Corp., Tokyo, Japan; Cu Kα, 50 kV, 300 mA). The experiments were conducted with fiber bundles mounted on holders. To obtain radial scans at three distinct angles (ϕ = 0°, 70°, and 90°), scans were taken at 0° and 90° scans to correspond to equatorial and meridional views, respectively. A 70° scan was selected to detect the presence of three-dimensional reflections (112) and (101). Detailed information on the measurement technique can be found in previous studies [6,31,32].

3. Results and Discussion

3.1. Raman Spectrum

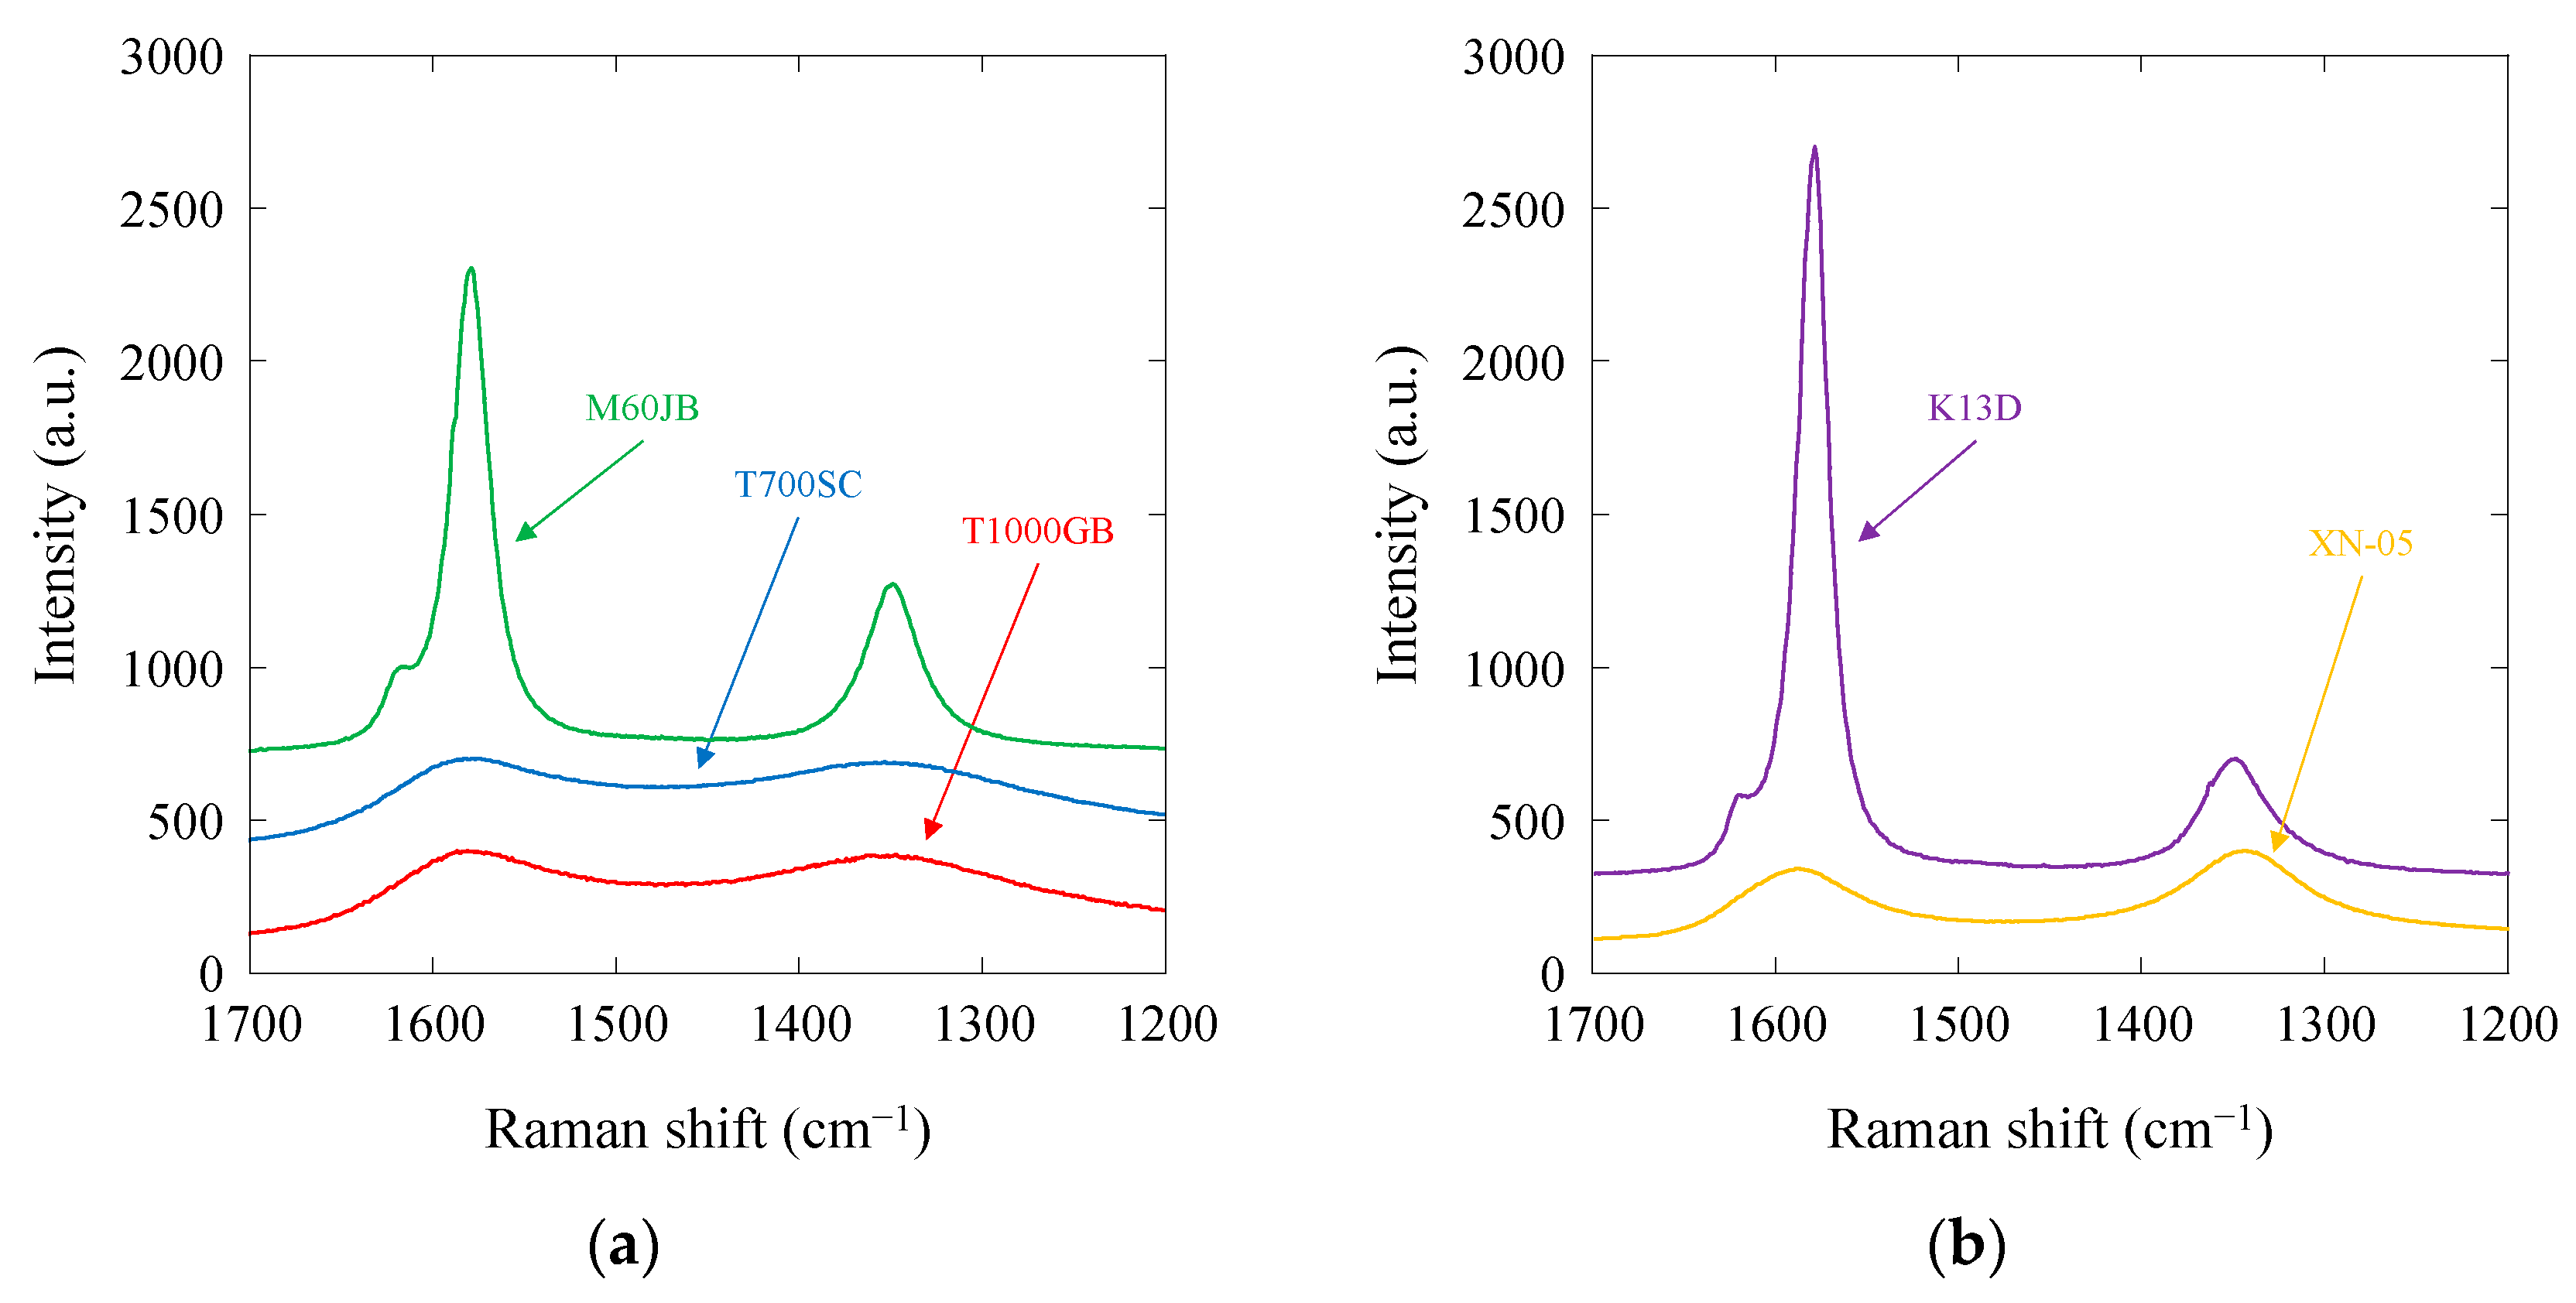
Figure 2a,b shows the Raman spectra of PAN-based and pitch-based single carbon fibers obtained from the tensile test specimens under zero-stress conditions. These Raman spectra were obtained from a neon lamp calibration (1712.71 cm−1) and baseline correction. In order to correctly describe the parameters of the Raman spectra, they were analyzed using a combination of multi peak fitting functions. Specifically, three Lorentzian functions were selected with the intention to fit the G- and D-bands [15]. This package of fitting functions is designed to be applicable to the Raman spectra of carbon fibers.
The G-band peak at 1600 cm−1 and D-band peak at 1300 cm−1 are clearly visible in the PAN-based and pitch-based carbon fibers (usually, various Raman band peaks (D, G, D’, G’) at 1300, 1600, 1650, 2750, and 2950 cm-1 can be observed when Raman spectra over the 0–3000 cm−1 range are measured. In this study, the D’-band peaks at 1650 cm−1 are clearly visible in the high-modulus PAN-based (M60JB) and high-modulus pitch-based (K13D) carbon fibers; however, the D’-band peaks are not clearly visible in the high-strength PAN-based (T1000GB and T700SC) and high-ductility pitch-based (XN05) carbon fibers. The visibility of D’-band peak depends on the impurities, precursors, and excitation wavelengths; here, the D’-band peak is hidden in the original spectrum. A similar result is observed in [20]). A noticeable difference was observed in the peak values of the Raman shifts for the G- (RG) and D-bands (RD). The high-modulus M60JB PAN-based and K13D pitch-based carbon fibers exhibited sharp G- and D-band behaviors, characterized by the full widths at half maximum of the G (FWHMG) and D-bands (FWHMD), whereas the high-strength T1000GB and T700SC PAN-based and high-ductility XN-05 pitch-based fibers exhibited broader behaviors, characterized by larger FWHMG and FWHMD values. The RG, RD, FWHMG, and FWHMD values are summarized in Table 1. The results for the high-strength PAN-based (HS-PAN; T300, T800SC, T800HB, IMS60, and TR50), high-modulus PAN-based (HM-PAN; M40B, UM55), and high-modulus pitch-based (HM-pitch; K135, K13C, XN-60, and XN-90) carbon fibers are summarized in Table S1 in the Supporting Information.

3.2. Relationship between Raman, Tensile, and Structure Parameter

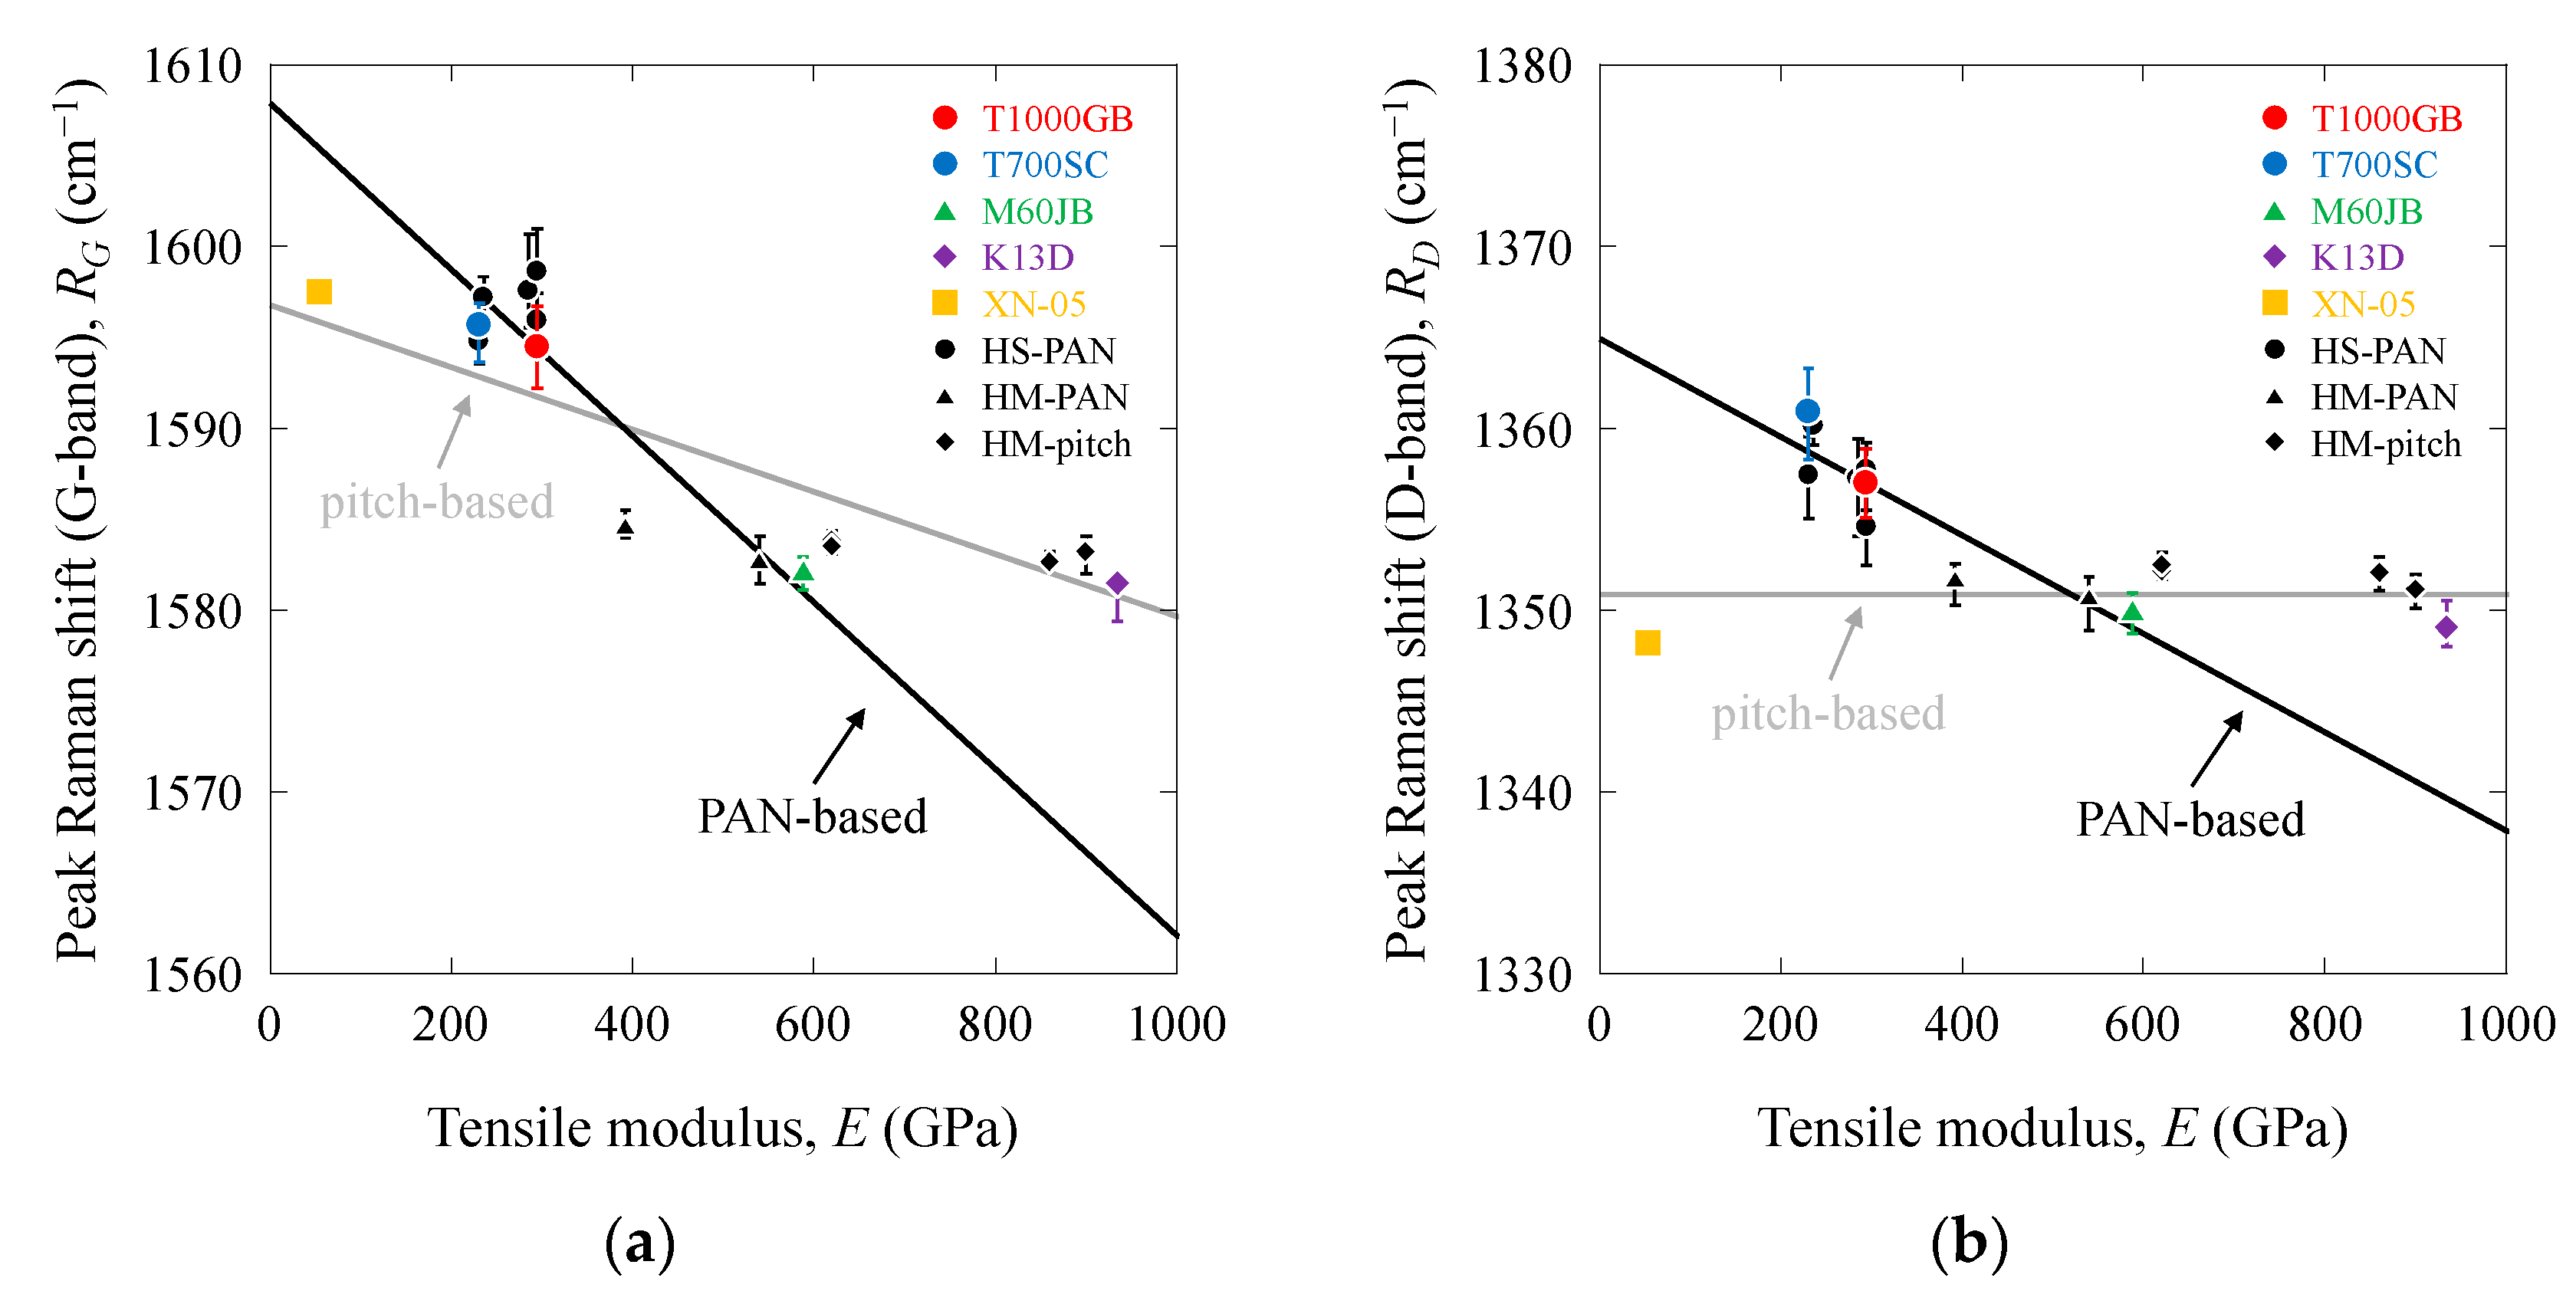
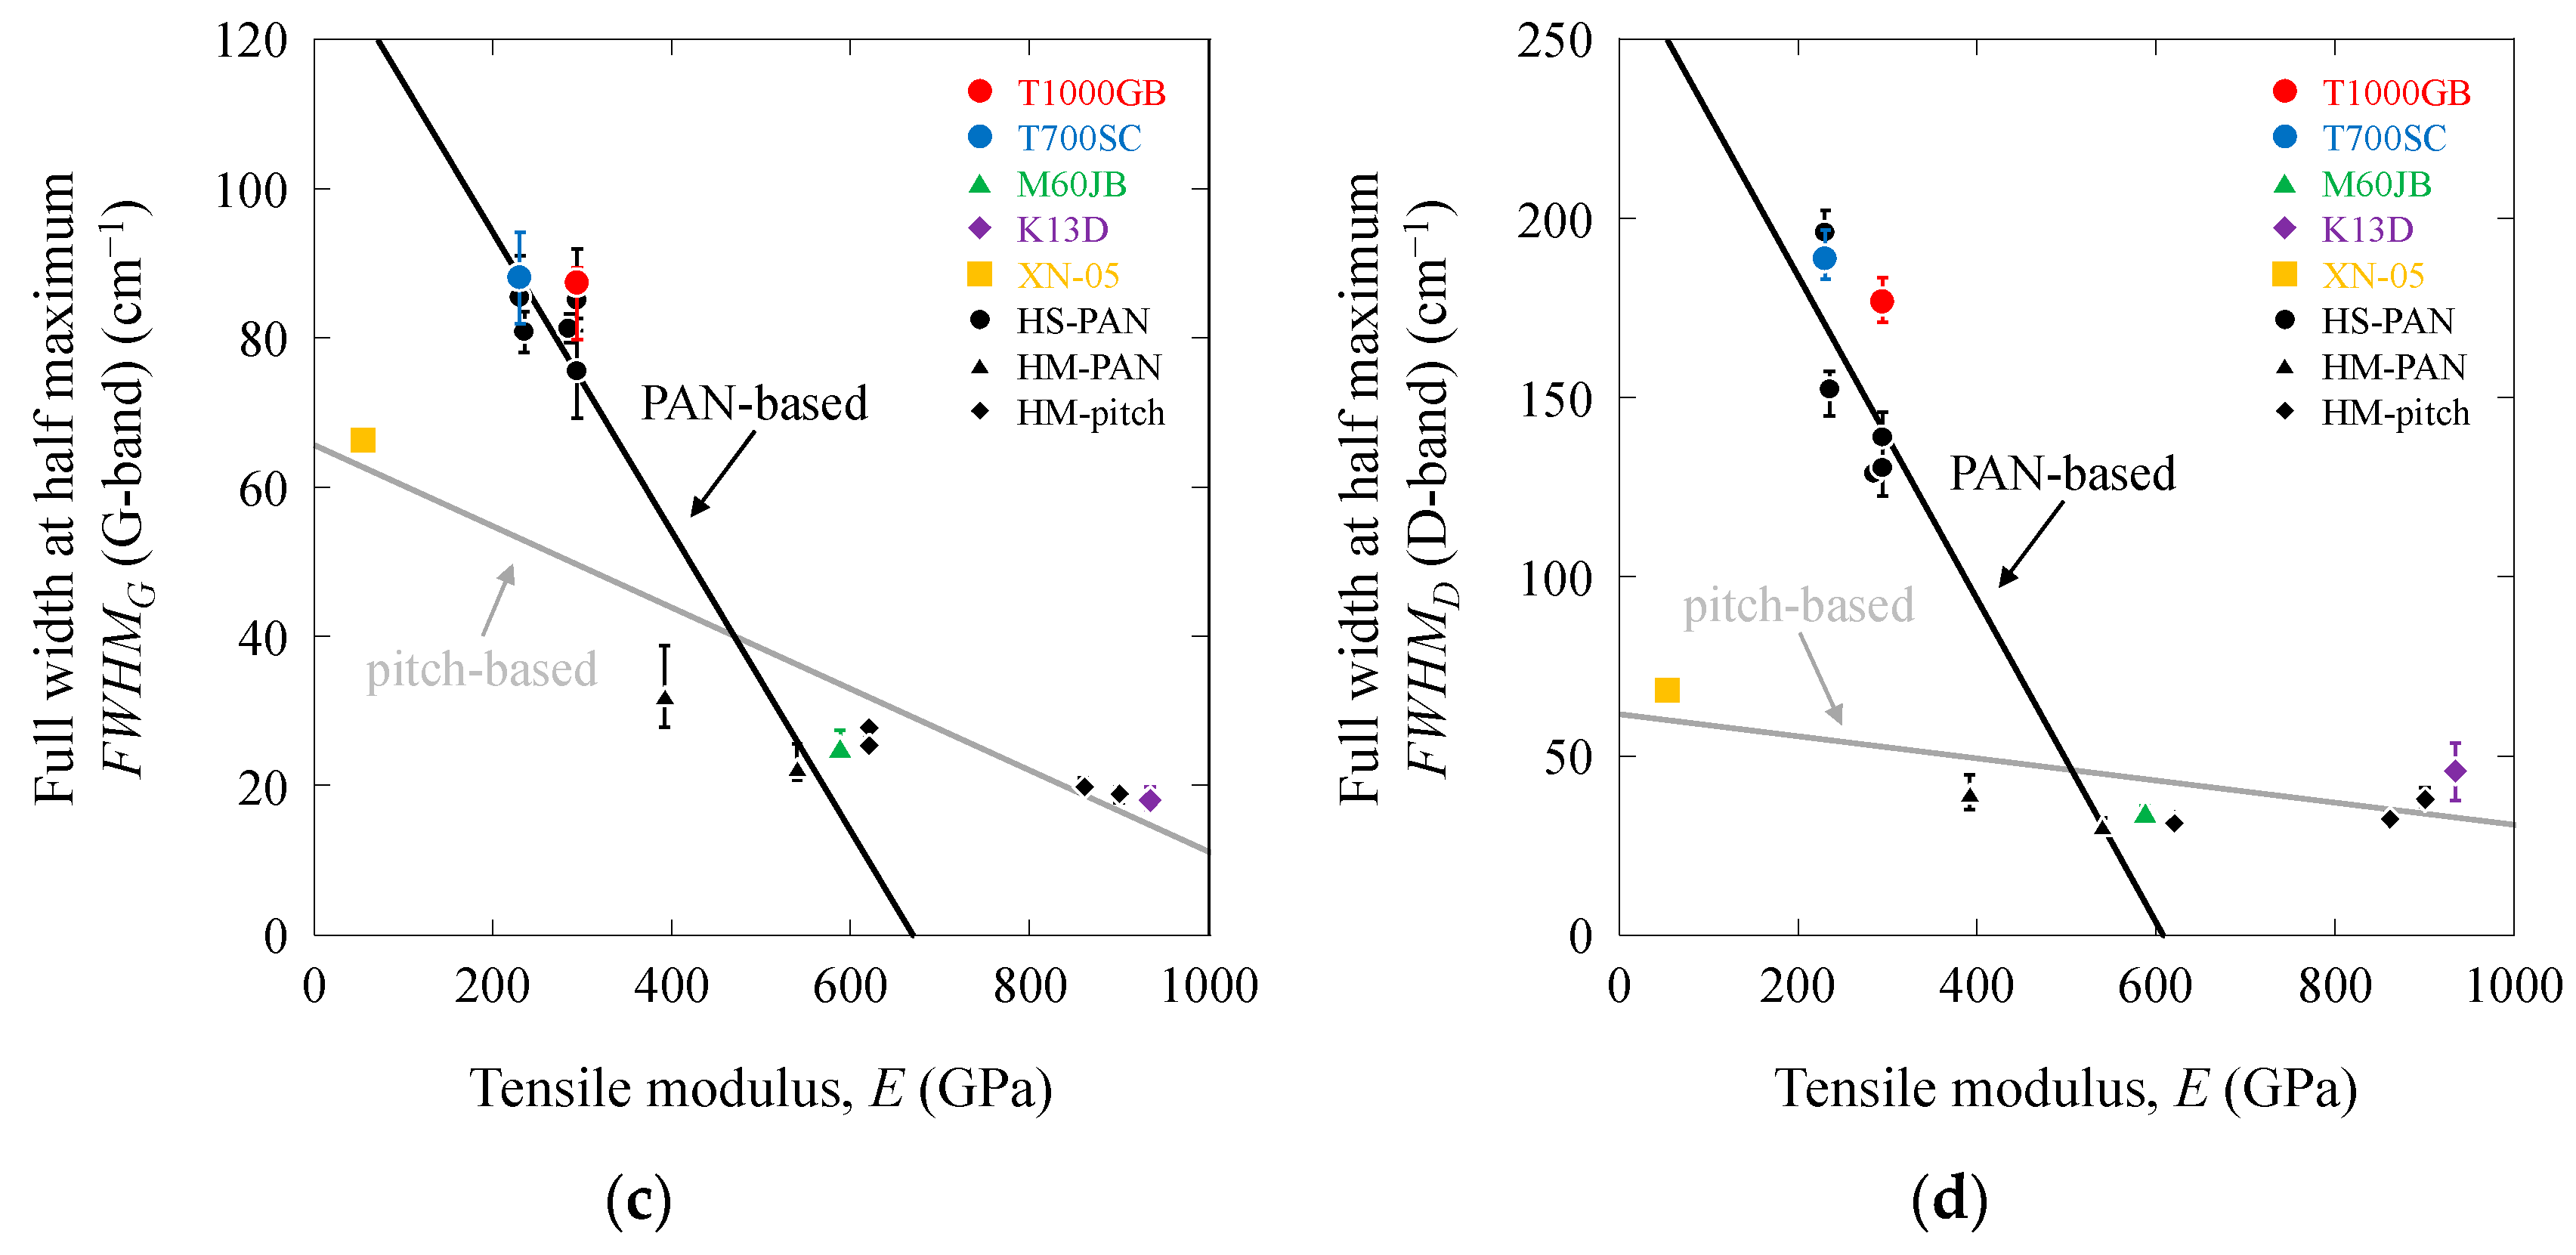
Figure 3a–d show the Raman scattering parameters (RG, RD, FWHMG, and FWHMD values) as a function of the tensile moduli (E) of the high-strength PAN-based, high-modulus PAN-based, high-modulus pitch-based, and high-ductility pitch-based carbon fibers (the tensile strength, σf, of PAN-based and pitch-based carbon fibers affected the gage length L. According to Table 1 and Table S1 in the Supporting Information, no significant relationship was observed between the Raman parameters and tensile strength). The RG, RD, FWHMG, and FWHMD values were notably high for the high-strength PAN-based carbon fibers. Conversely, these values were low for the high-modulus PAN-based and pitch-based carbon fibers. The RG and FWHMG values were high for the high-ductility XN-05 pitch-based carbon fibers, whereas the RD and FWHMD values were low. In addition, a clear distinction was observed between PAN-based and pitch-based carbon fibers. Considering the differences in the tensile modulus, the Raman scattering parameters (RG, RD, FWHMG, and FWHMD values) exhibited high sensitivities for PAN-based carbon fibers, whereas they exhibited low sensitivities for pitch-based carbon fibers. The least-square fitting lines for PAN-based and pitch-based carbon fibers are also depicted in Figure 3. The RG, RD, FWHMG, and FWHMD values of the PAN-based and pitch-based carbon fibers increased with an increase in E, whereas the RD value of the pitch-based carbon fibers remained nearly constant at 1350.9 cm−1. Linear relationships were observed between the RG, RD, FWHMG, and FWHMD values and E. The slopes of the PAN-based carbon fibers were higher than those of the pitch-based carbon fibers. These correlations were verified by evaluating the PAN-based and pitch-based carbon fibers separately. The lines for the PAN-based and pitch-based carbon fibers intersected at 400–600 GPa, suggesting a structural similarity between the PAN-based and pitch-based carbon fibers at approximately 400–600 GPa.
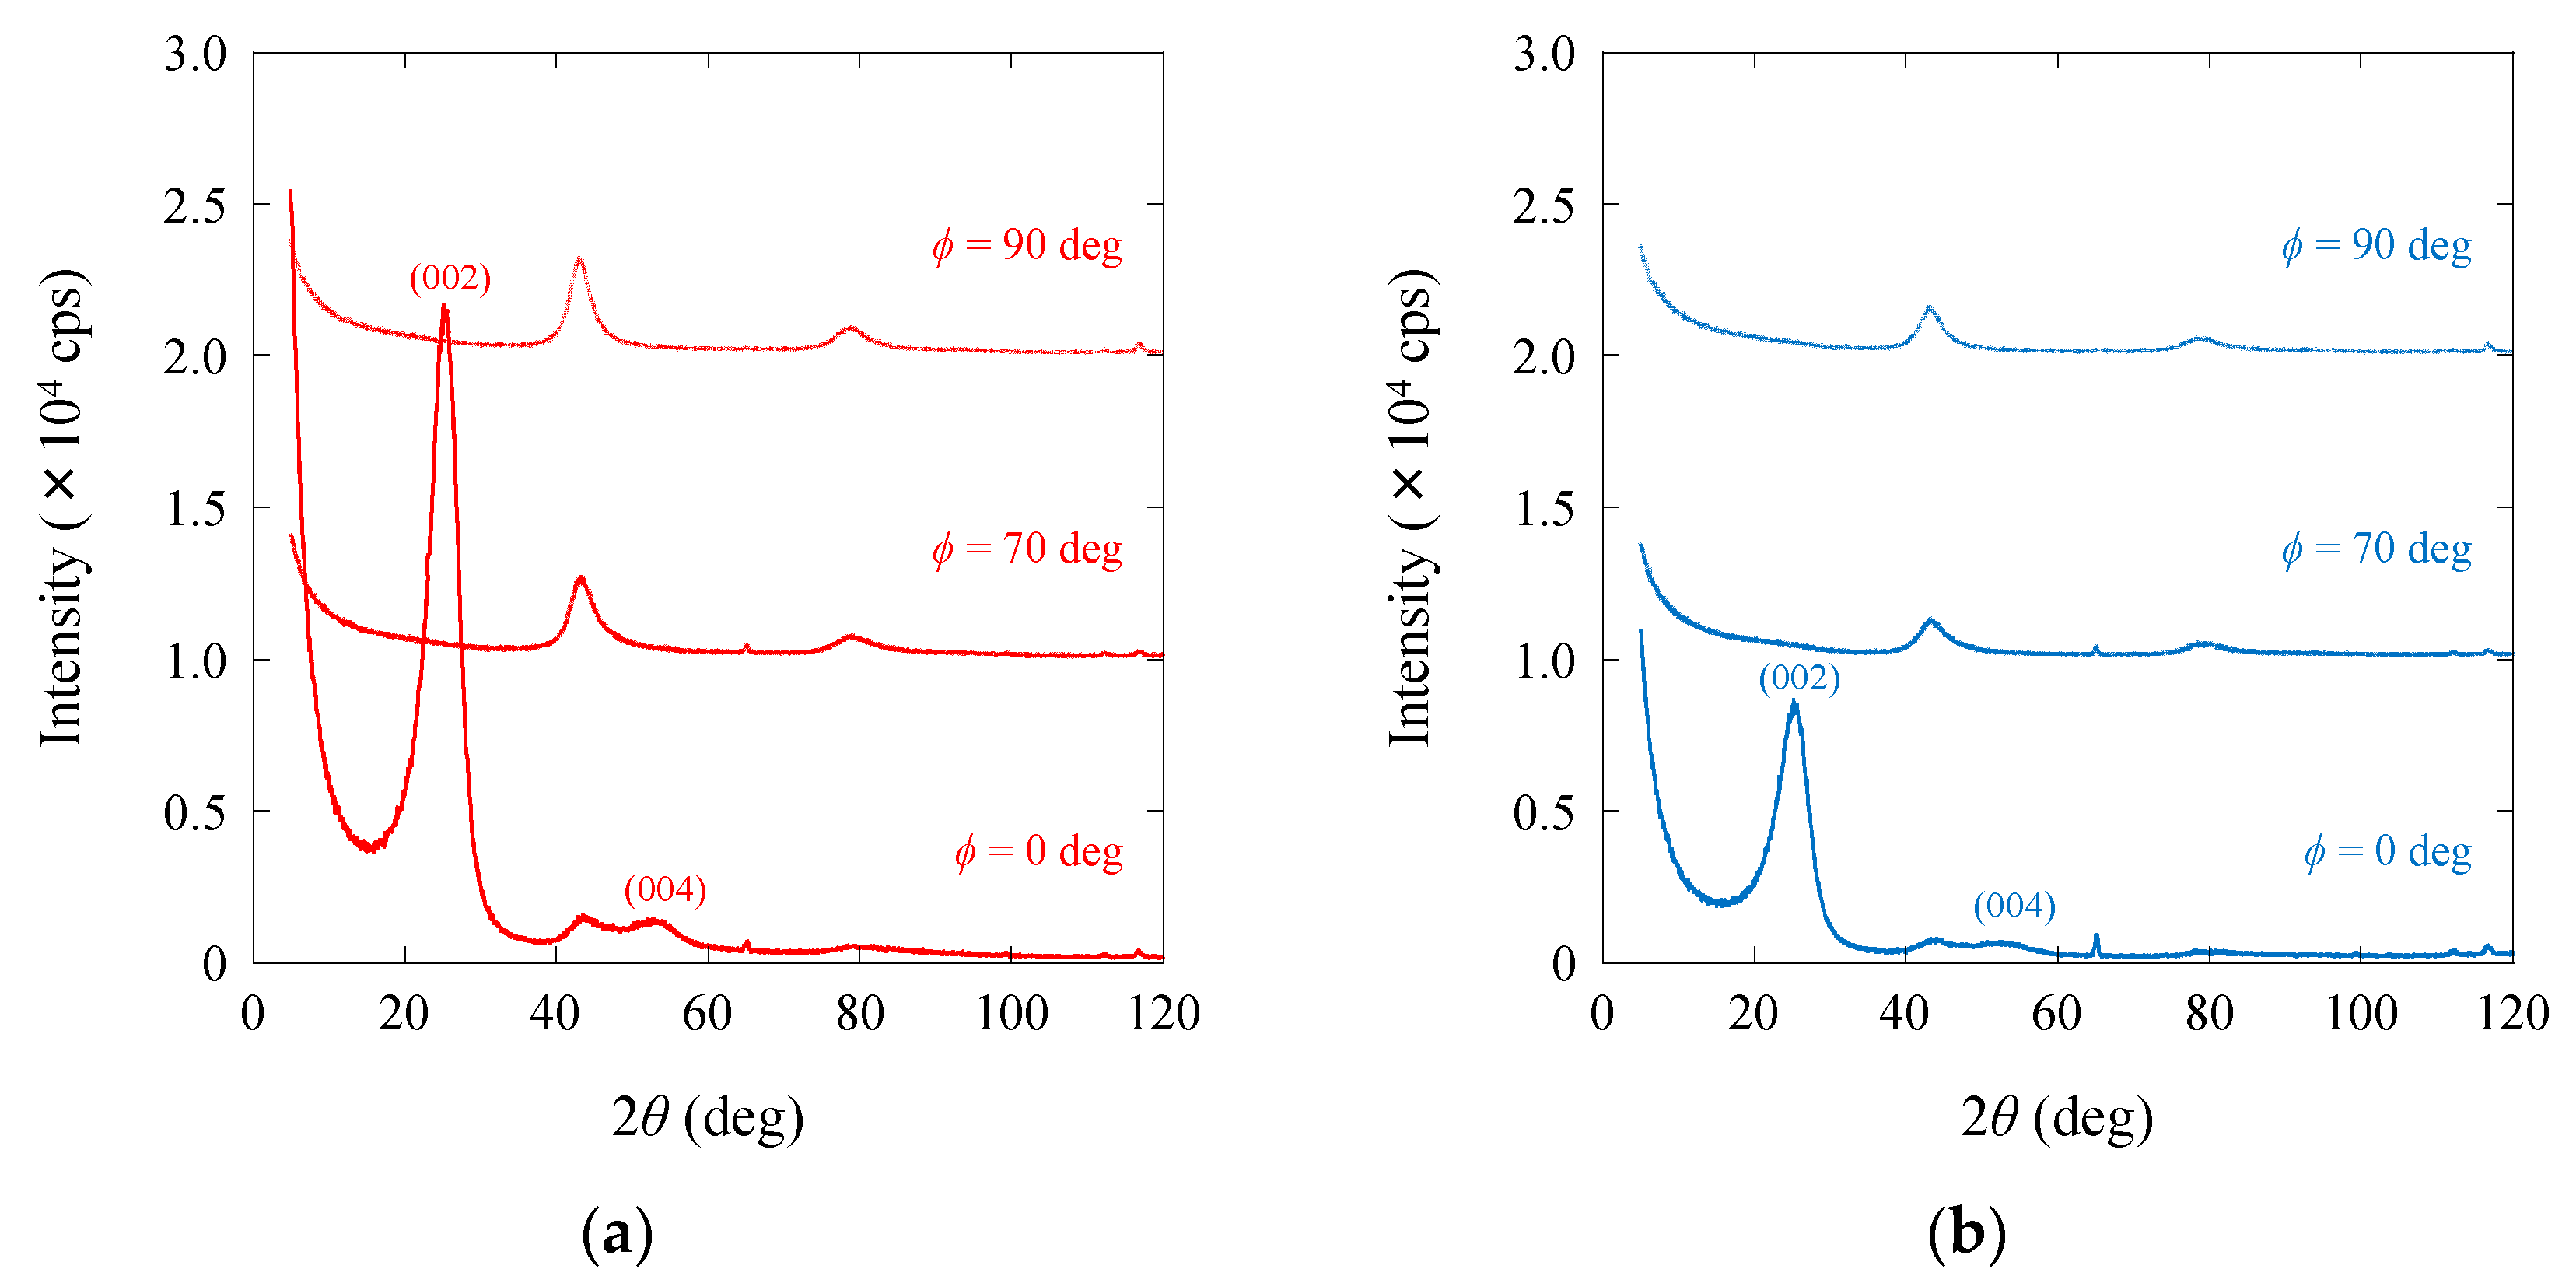
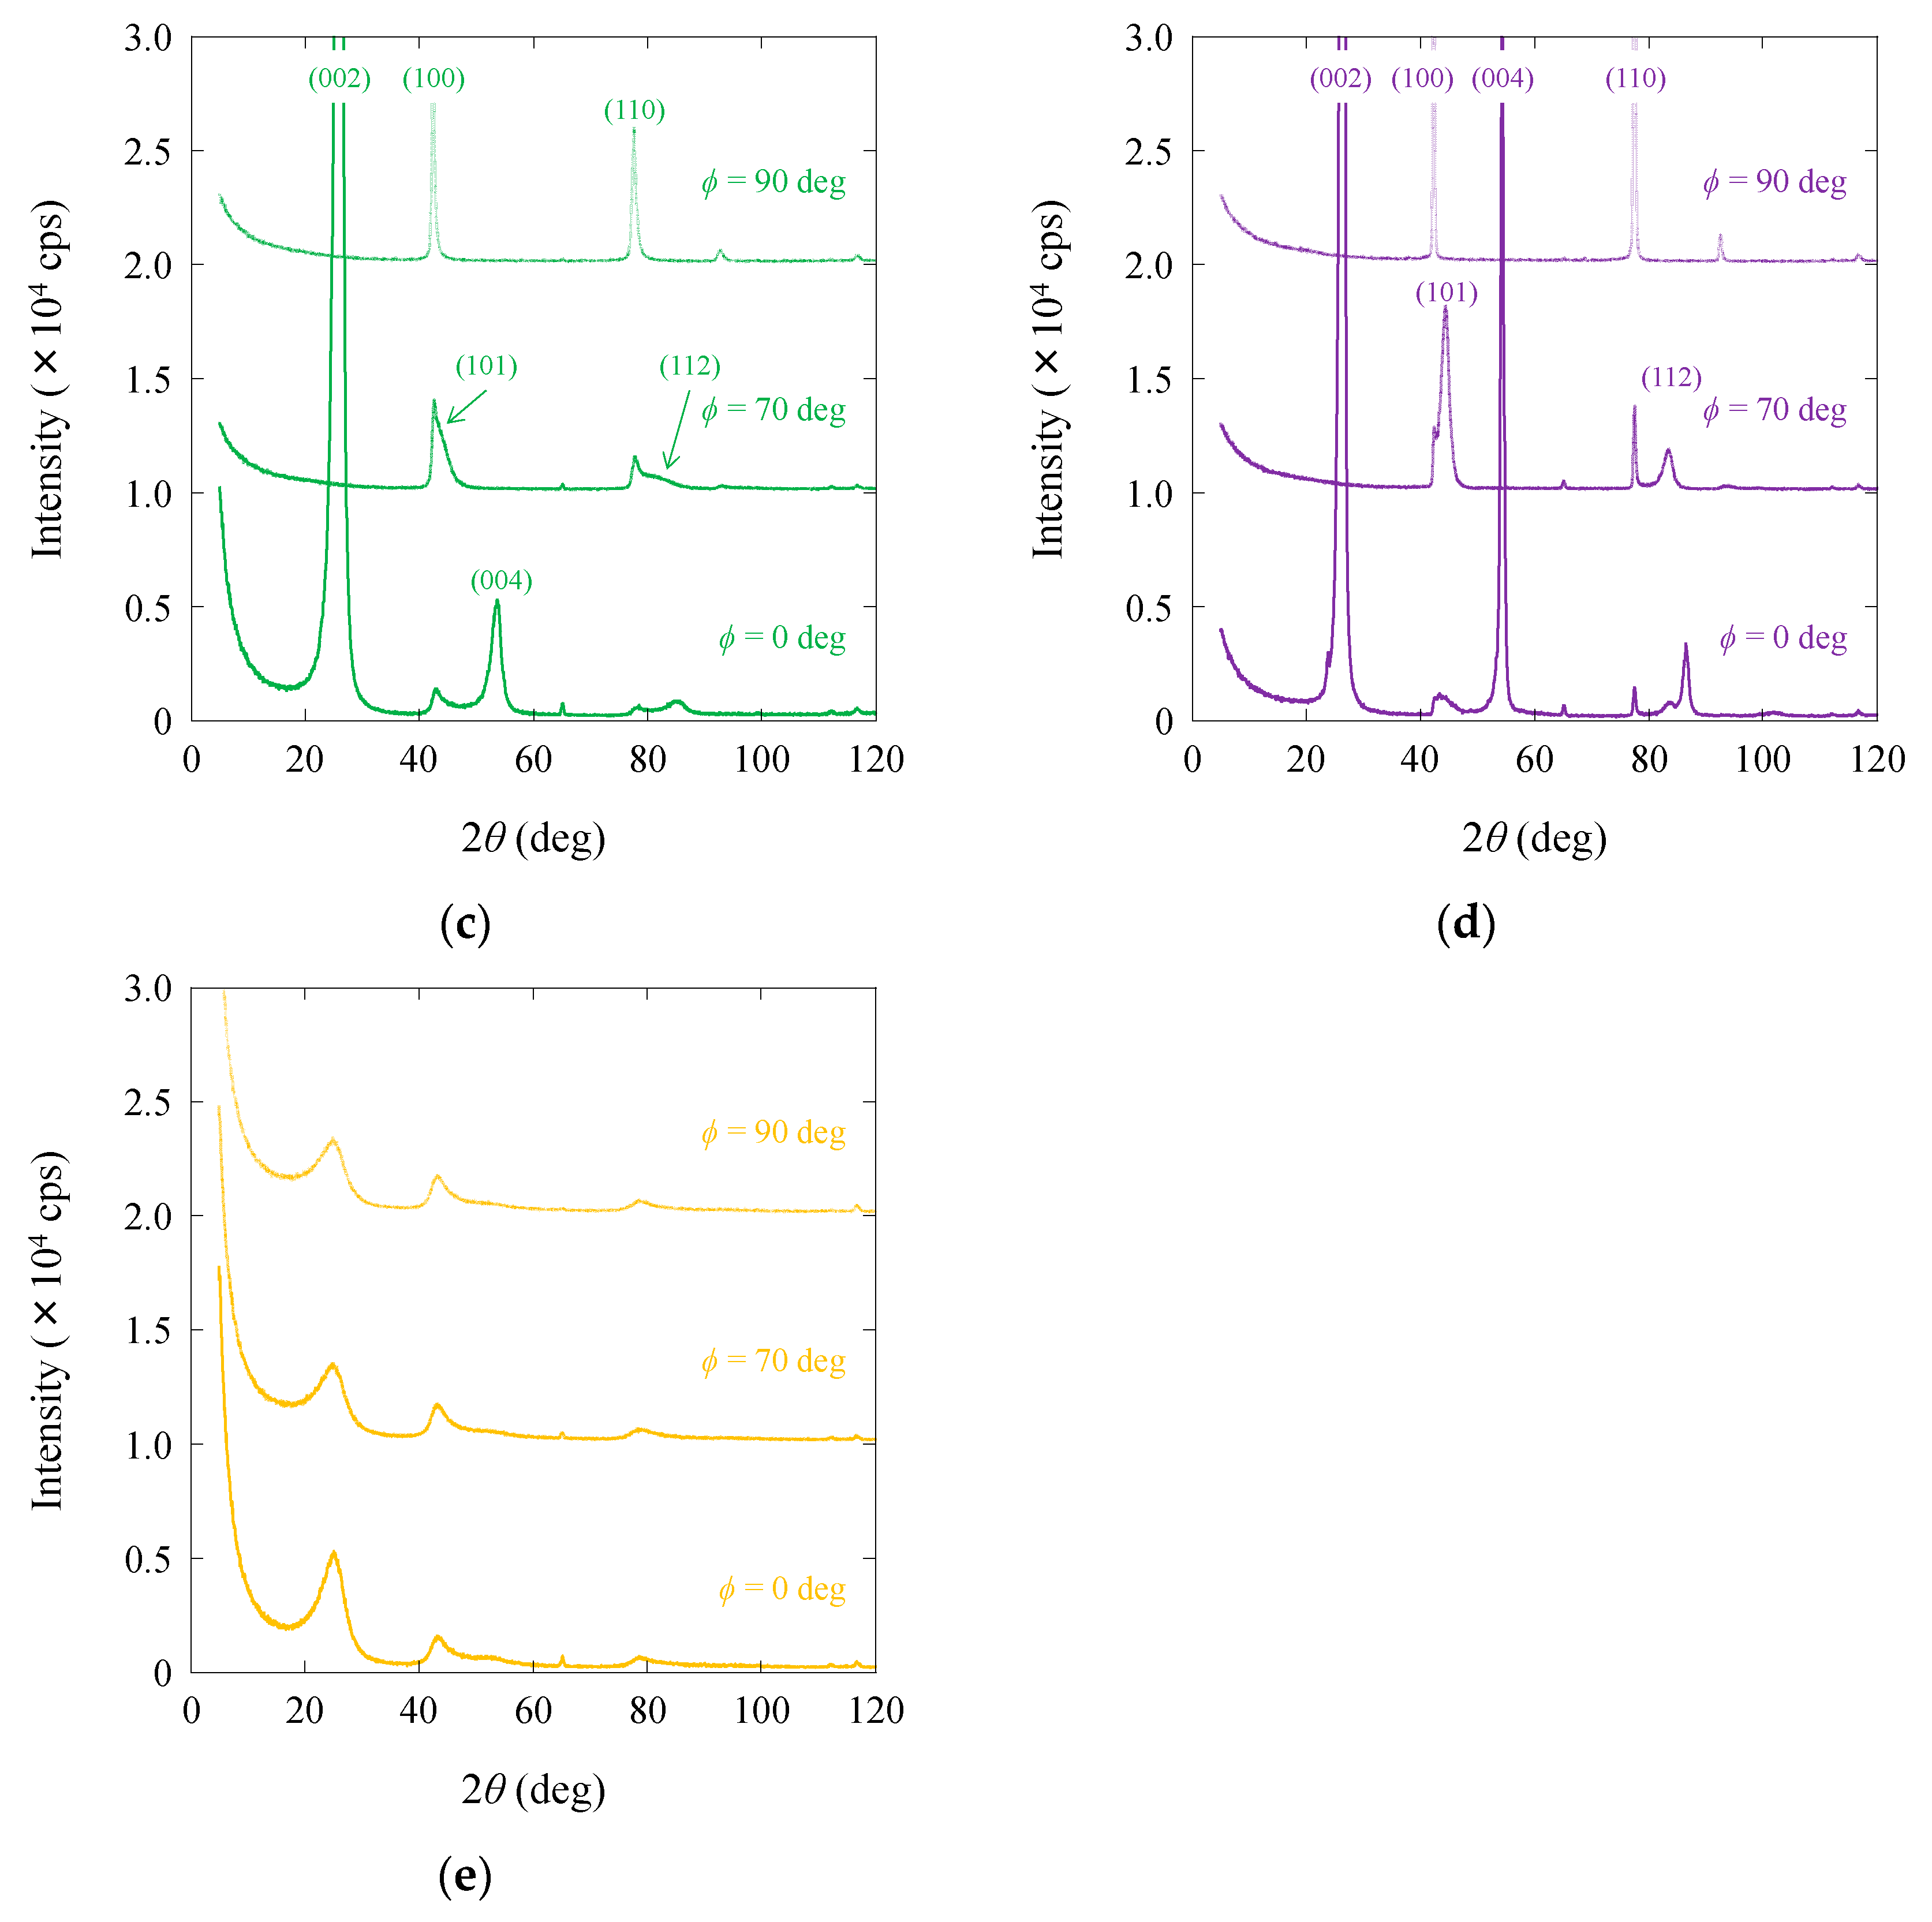
Figure 4a–e shows the X-ray diffraction (XRD) results for the high-strength PAN-based (T1000GB and T700SC), high-modulus PAN-based (M60JB), high-modulus pitch-based (K13D), and high-ductility pitch-based (XN-05) carbon fiber bundles. X-ray diffraction measurement results can also be found in [6].
The (002), (004), (100), and (110) reflections exhibited substantial intensities at a ϕ of 0° and 90°, while the peaks for the (101) and (112) reflections were also observed at a ϕ of 70° for the high-modulus pitch-based carbon fibers. Additionally, the peaks of the (002), (004), (100), and (110) reflections at a ϕ of 0° and 90°, as well as those for the (101) reflection at ϕ of 70°, were also observed in the high-modulus PAN-based carbon fibers. However, it was not possible to observe the peak for the (112) reflection at a ϕ of 70° for the high-modulus PAN-based carbon fibers. The (002) and (004) reflections exhibited broad peaks at a ϕ of 0°, while no peak was observed for the (101) reflection at a ϕ of 70° in the high-strength PAN-based carbon fibers. The peaks observed in the high-ductility pitch-based carbon fiber were broader than those observed for other carbon fibers. The high-ductility pitch-based carbon fiber demonstrated a low-oriented turbostratic structure, as evidenced by a broad (002) peak and the absence of (10) and (11) bands (i.e., no hkl reflections). The fiber bundles exhibited peaks corresponding to the (101) and/or (112) reflections in the 70° scan, possessing a three-dimensional order of carbon fibers. The high-modulus pitch-based (K13D) carbon fiber possesses a high-oriented graphitic structure. The high-modulus PAN-based (M60JB) carbon fibers possess a high-oriented turbostratic structure, whereas the high-strength PAN-based (T1000GB and T700SC) carbon fibers possess a turbostratic structure. The high-ductility pitch-based (XN-05) carbon fiber had a low-oriented turbostratic structure. Therefore, the high-modulus pitch-based carbon fiber exhibited a well-developed three-dimensional order, whereas the high-modulus PAN-based, high-strength PAN-based and high-ductility pitch-based carbon fibers did not display this structural organization. Similar structural differences have been reported for other PAN-based and pitch-based carbon fibers [6,7,8,9,10,11,31].
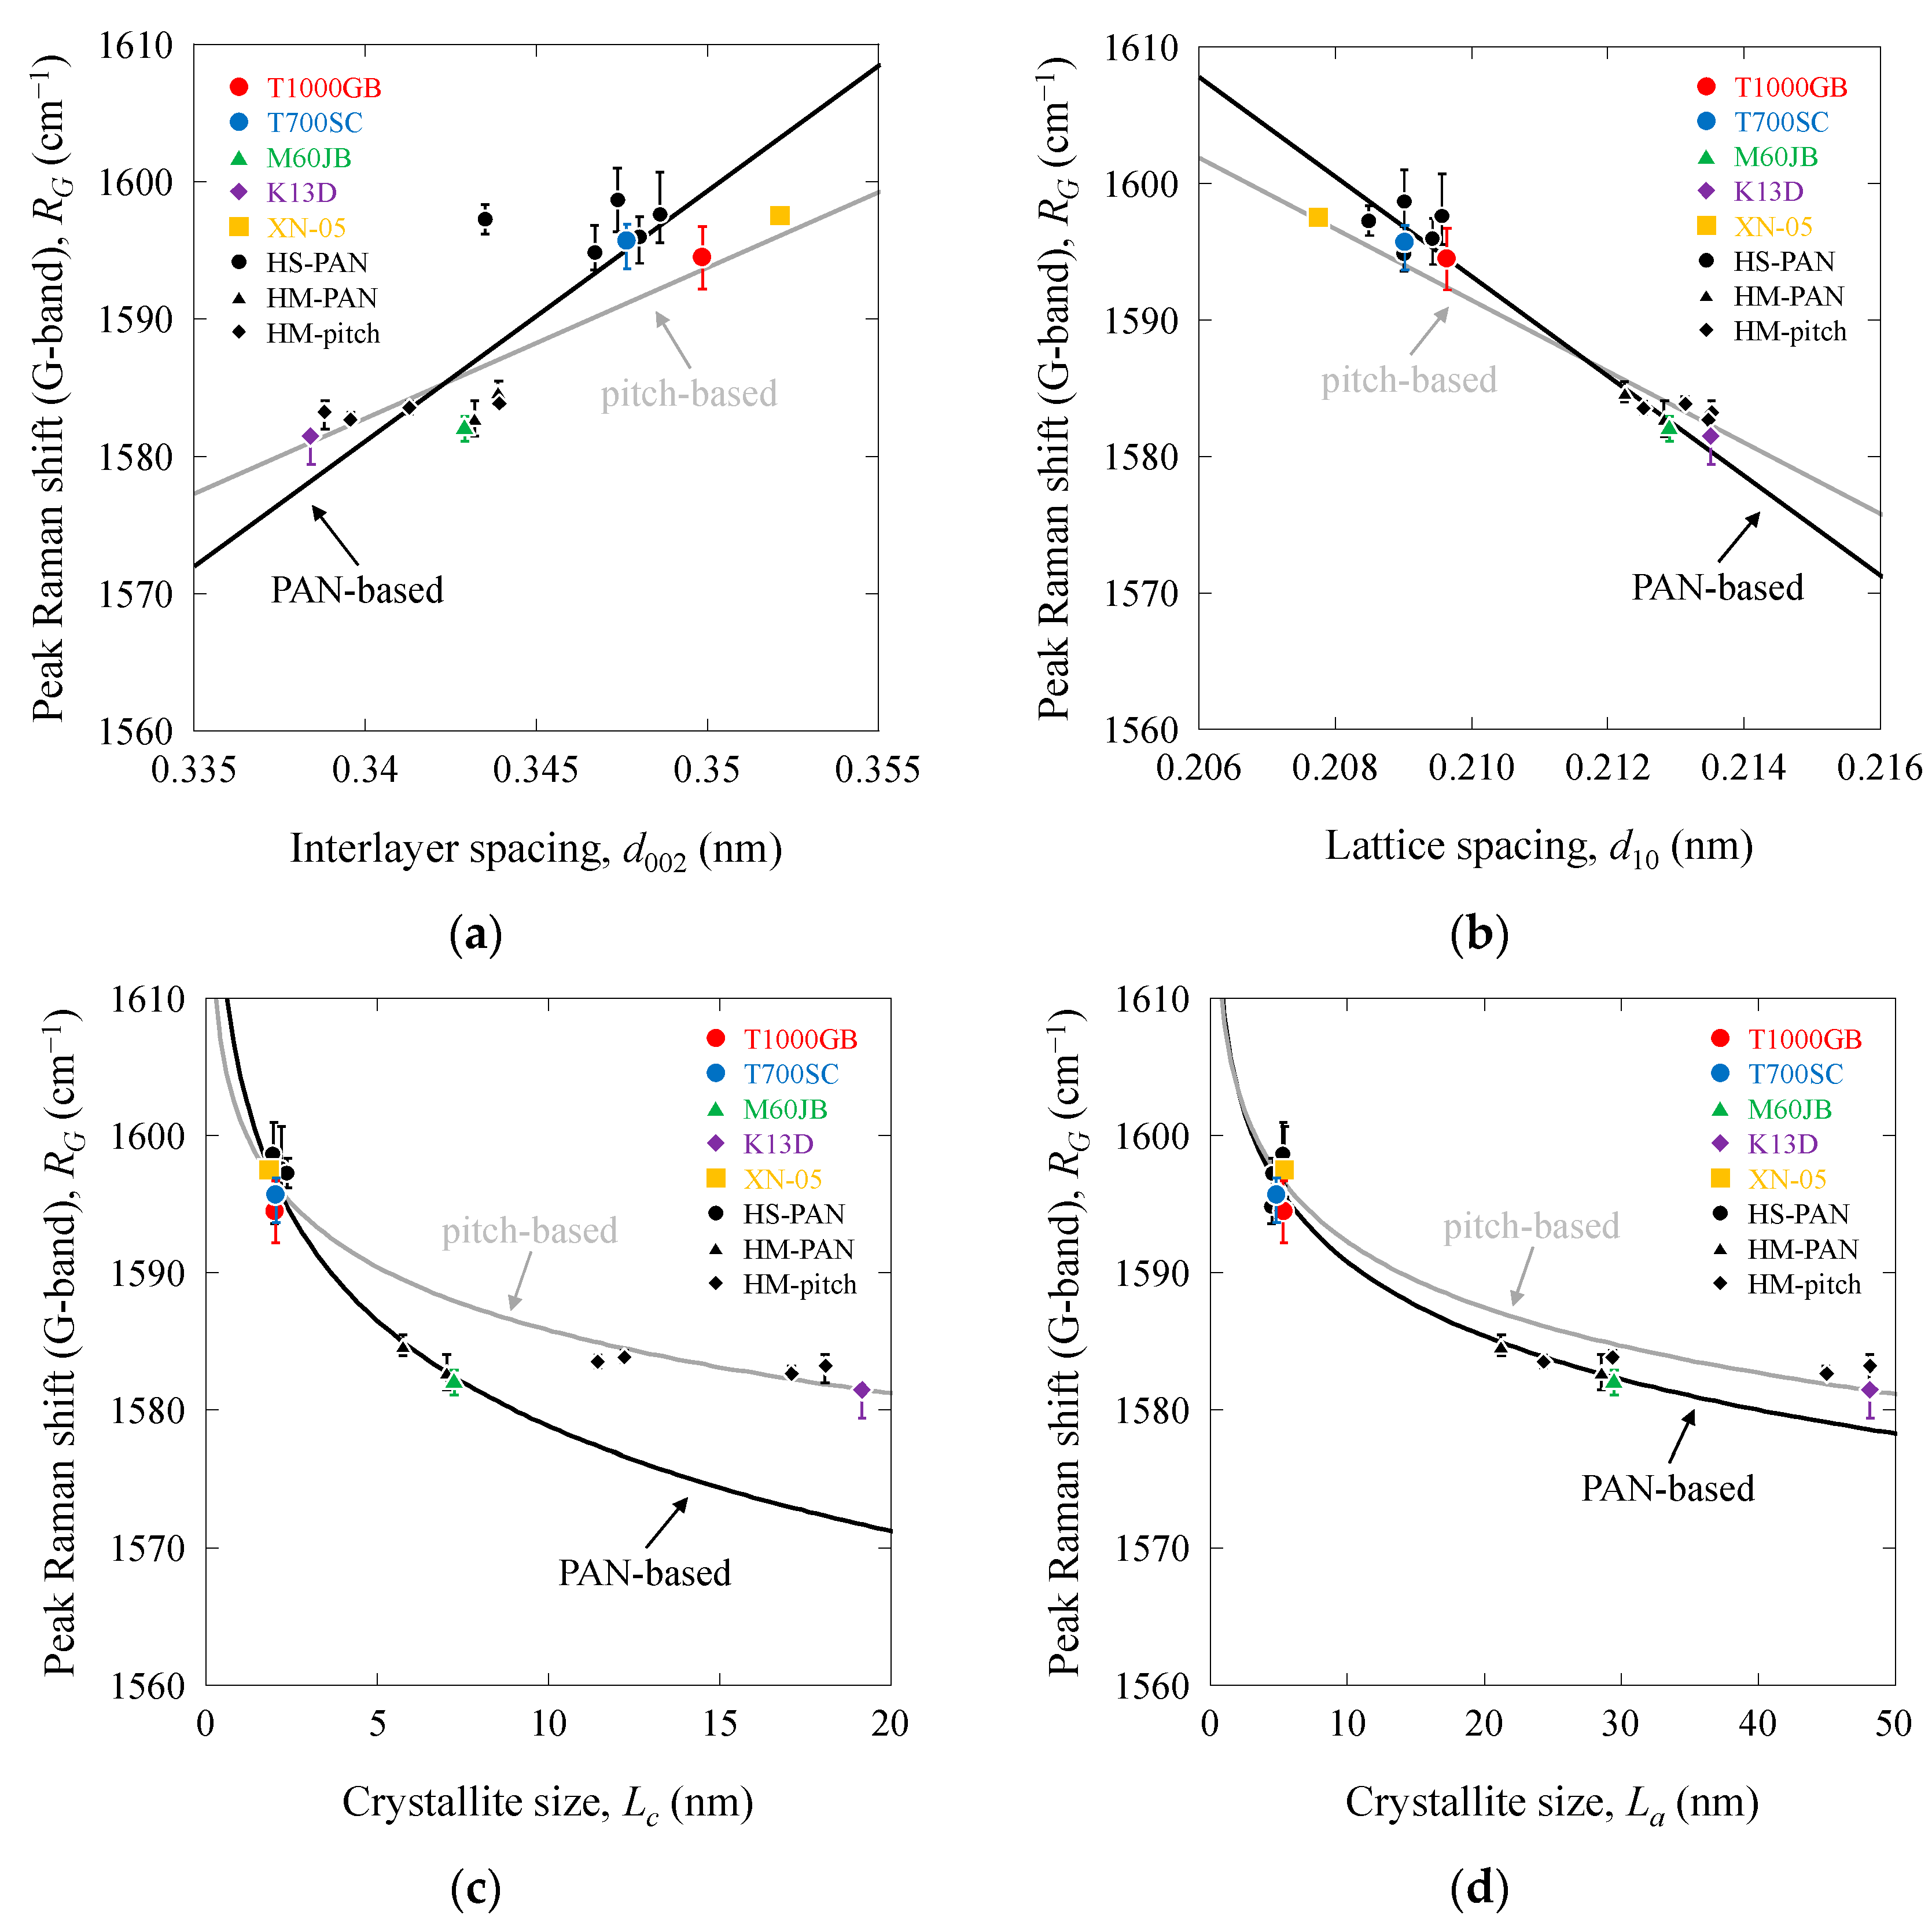
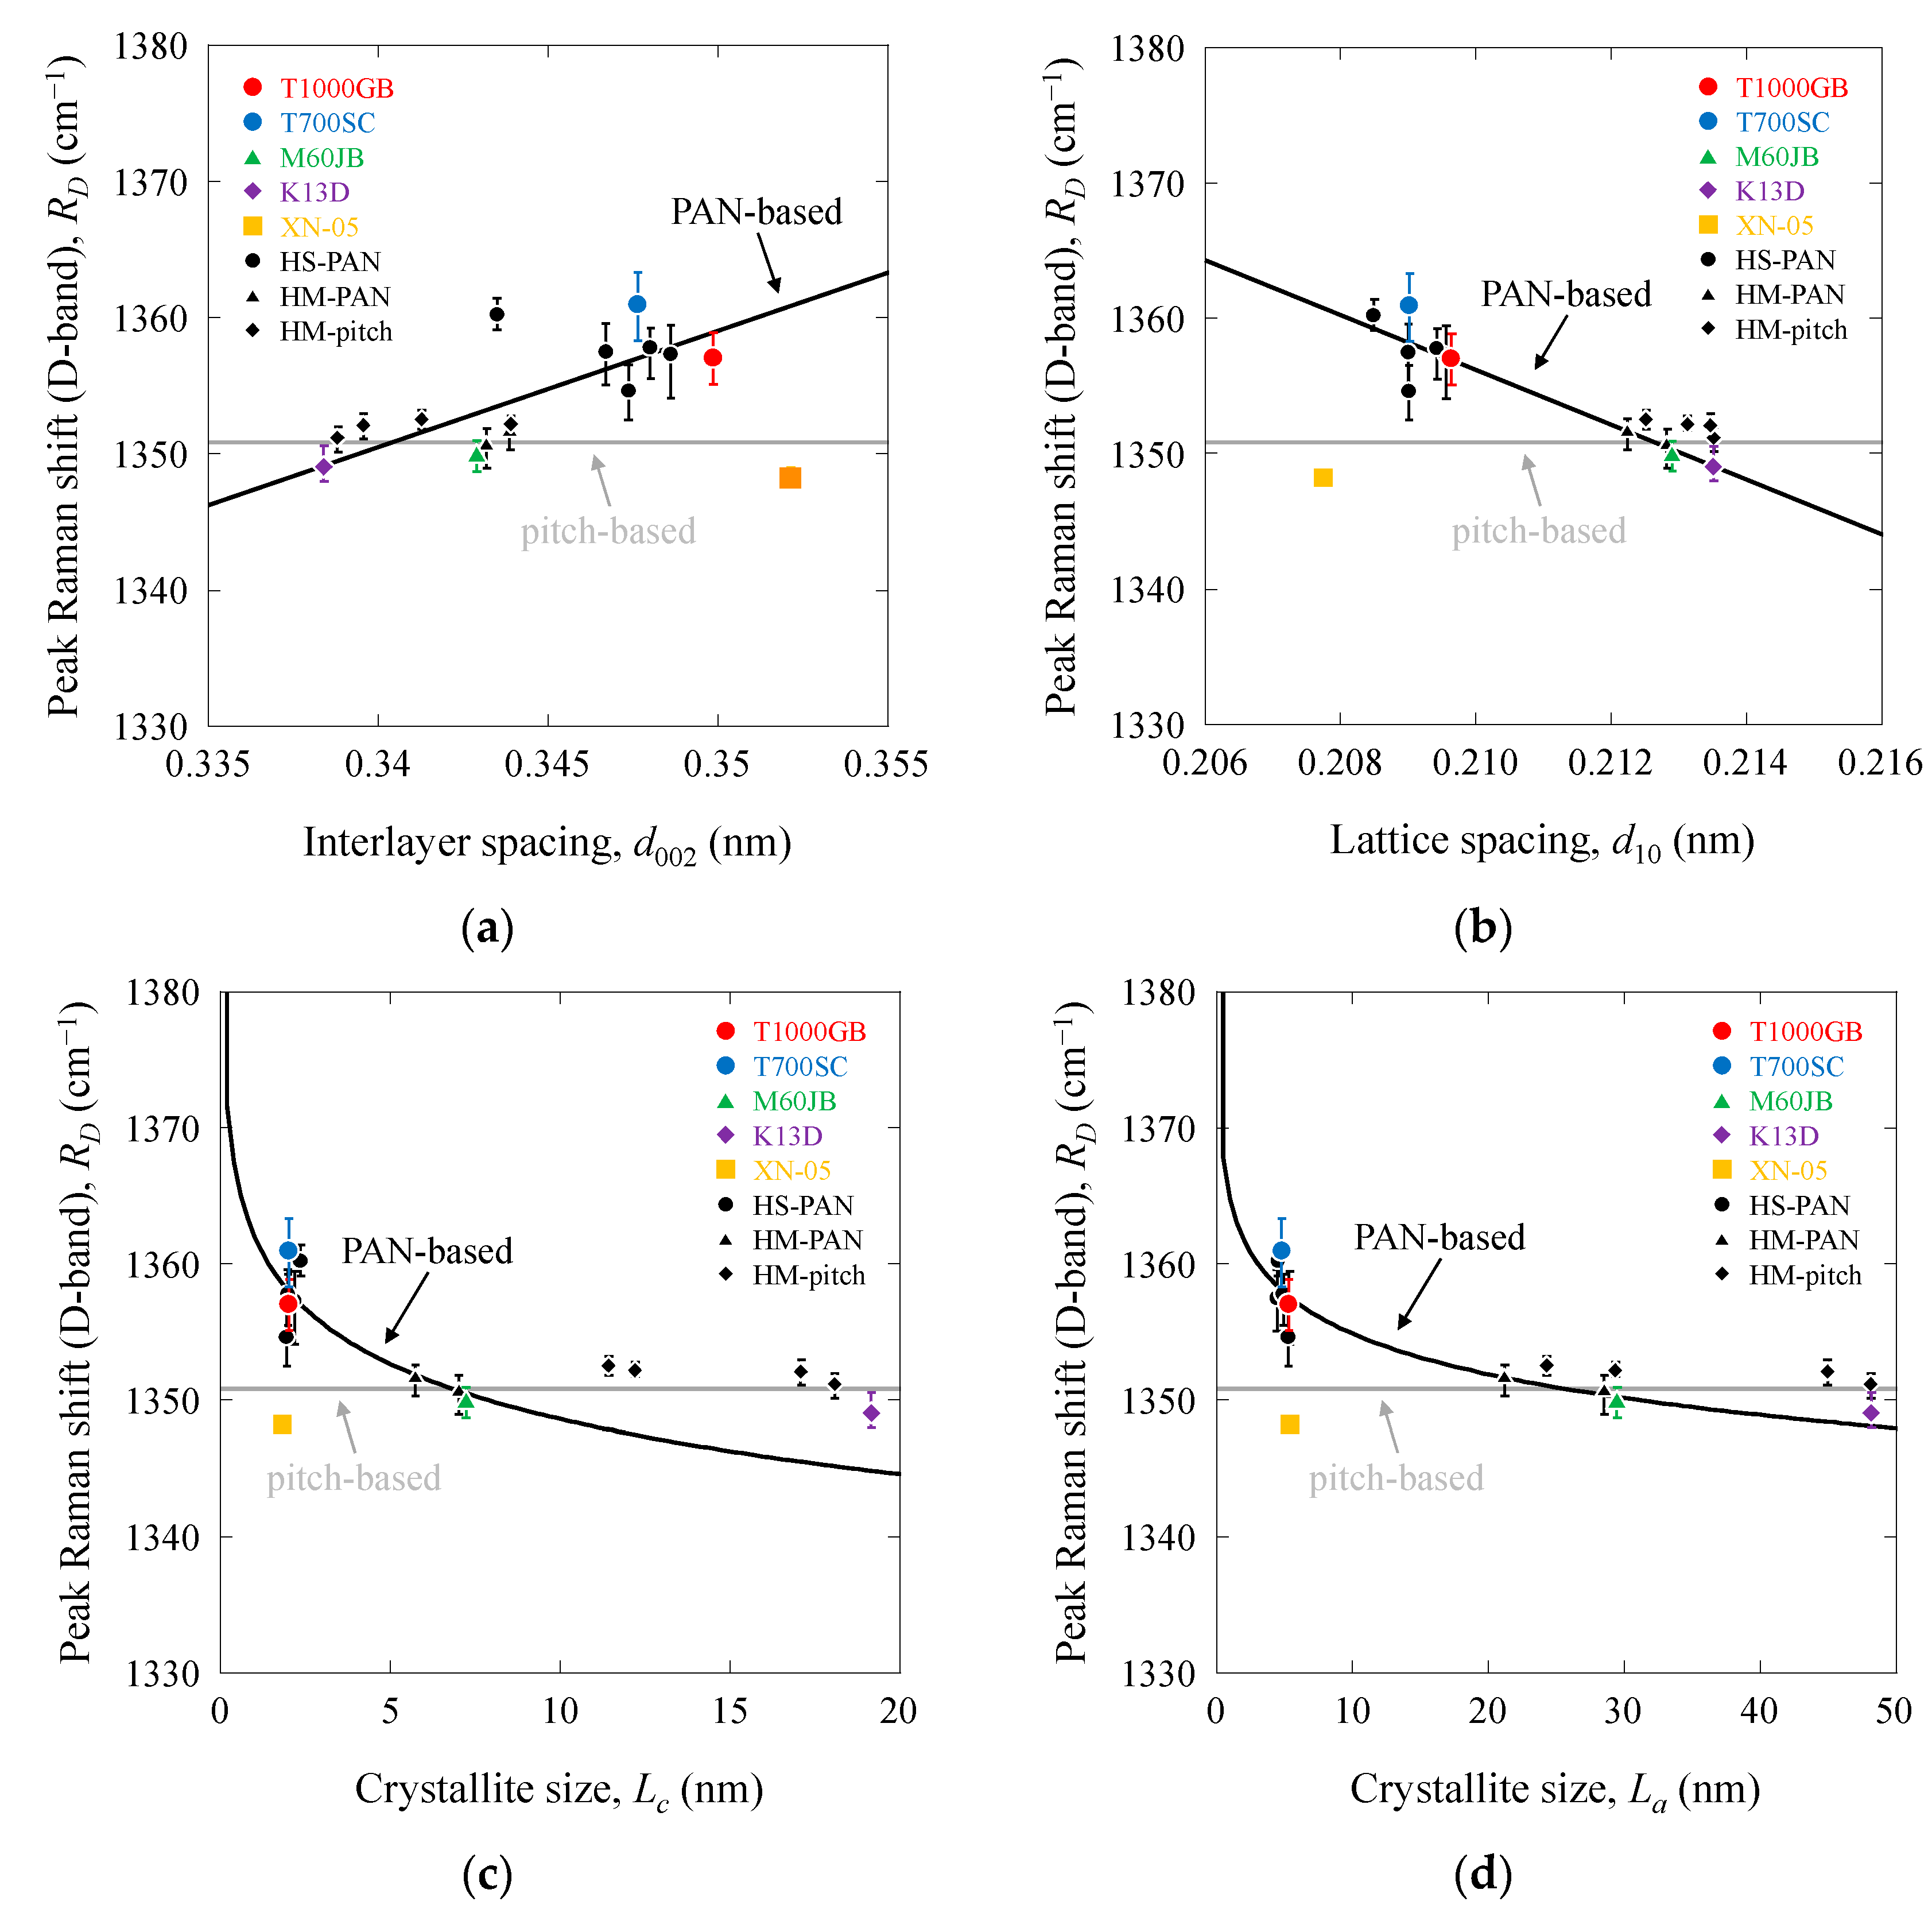
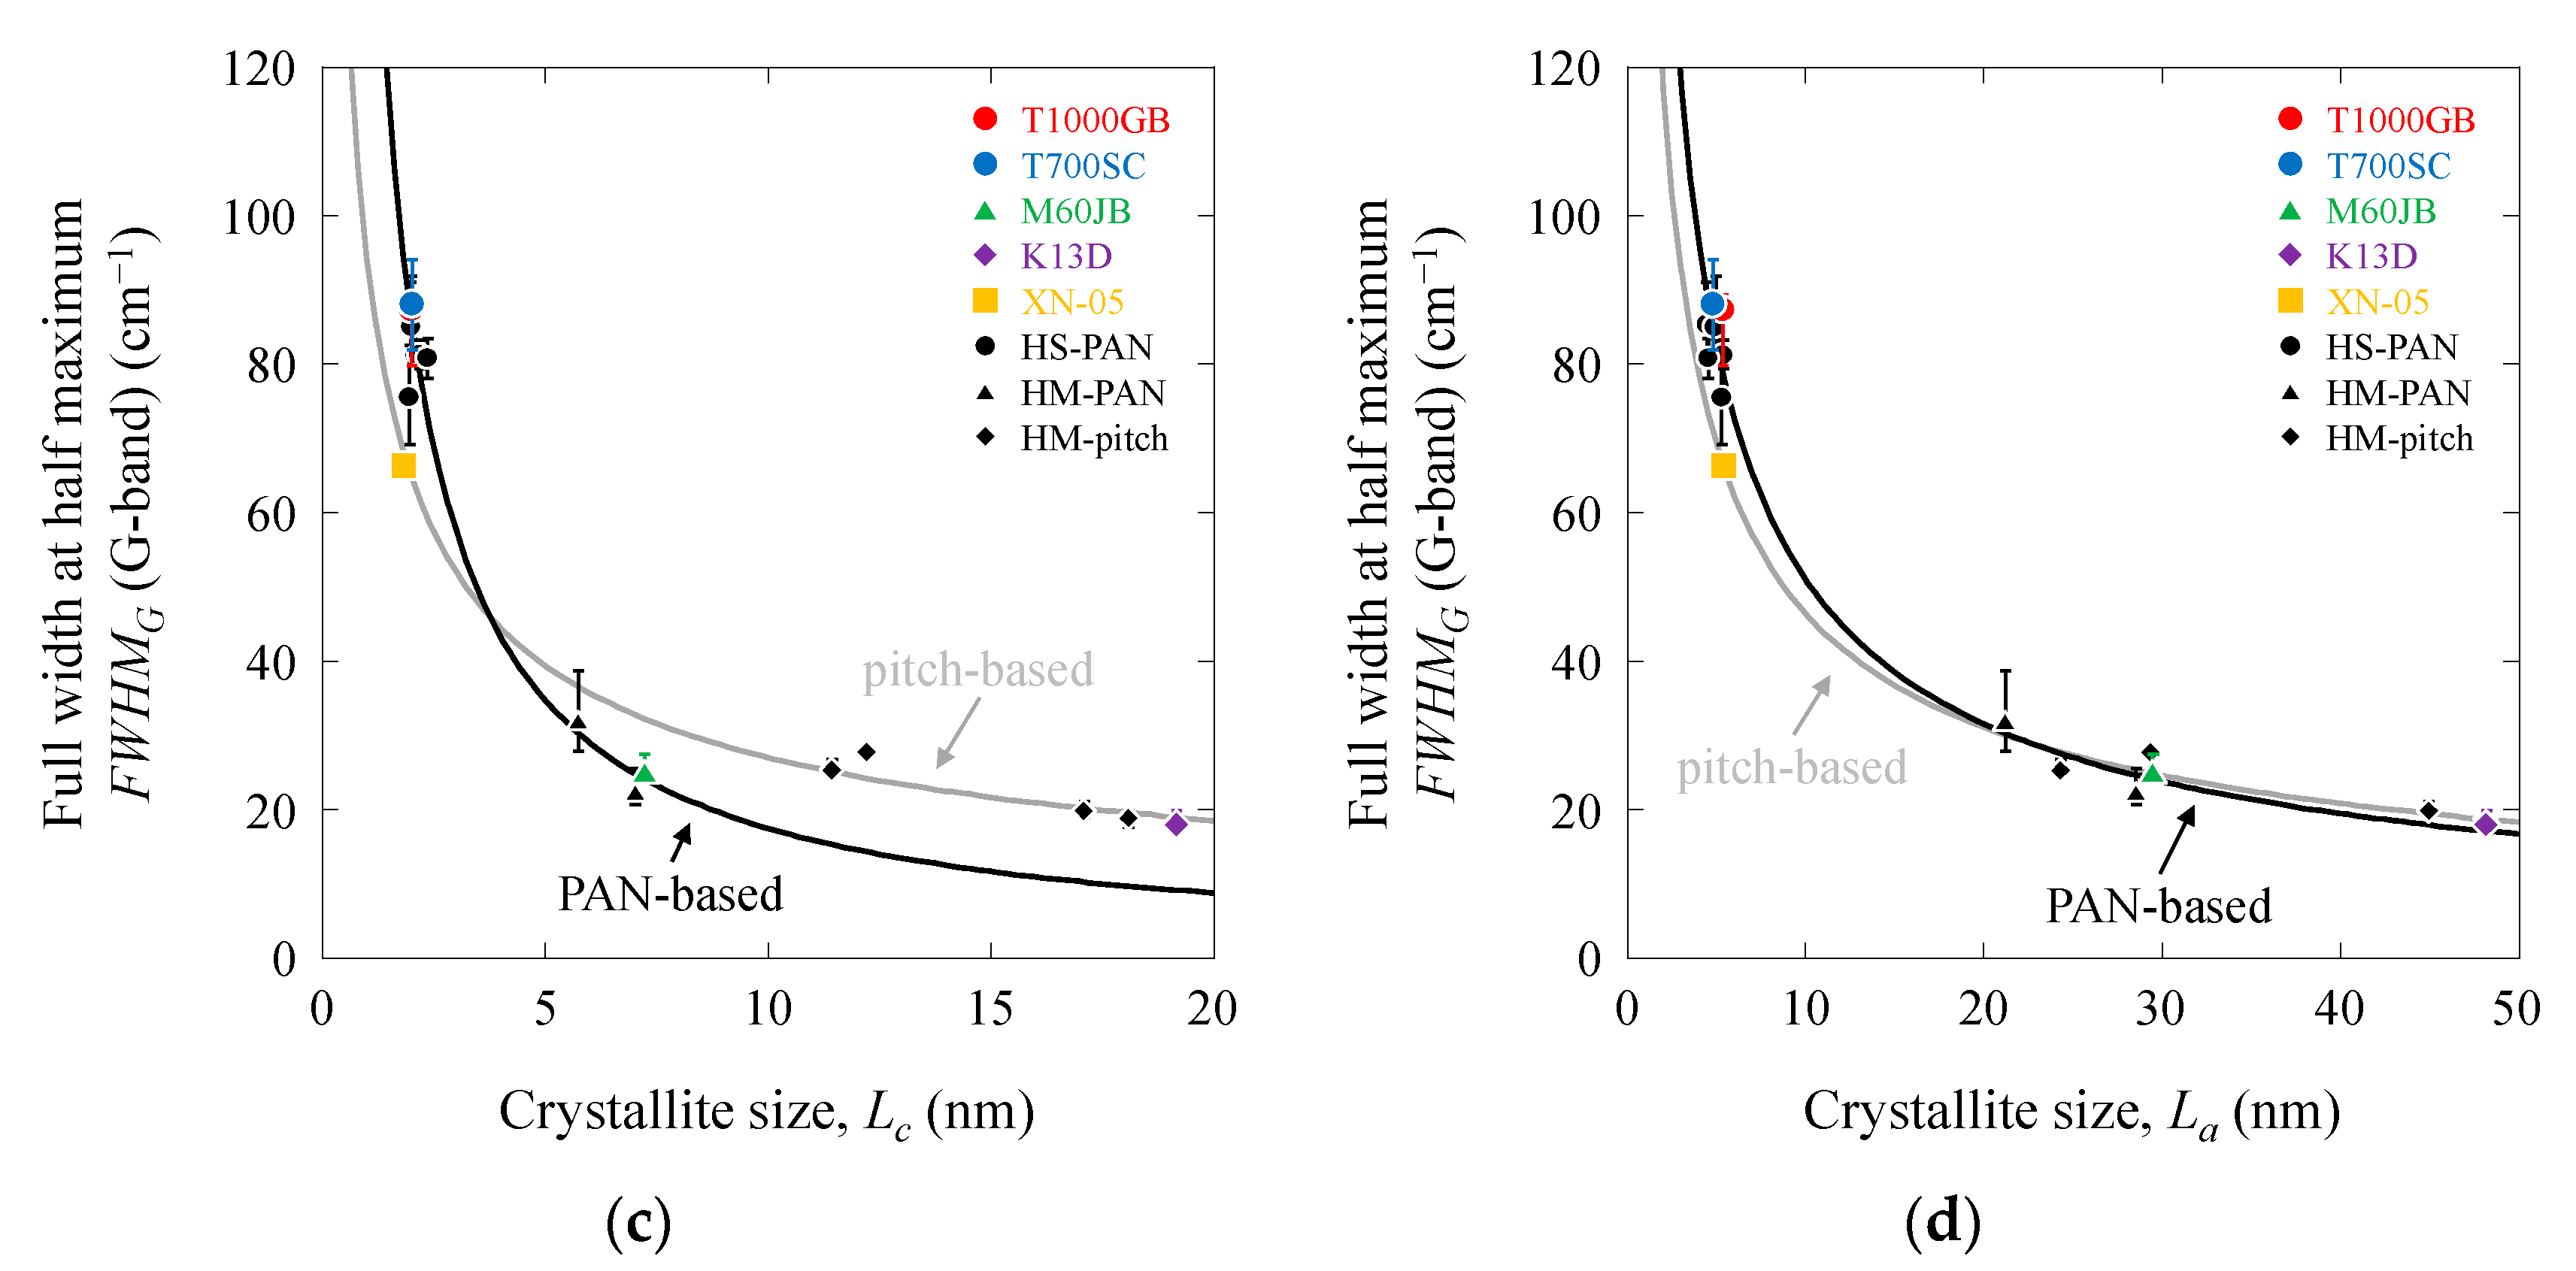
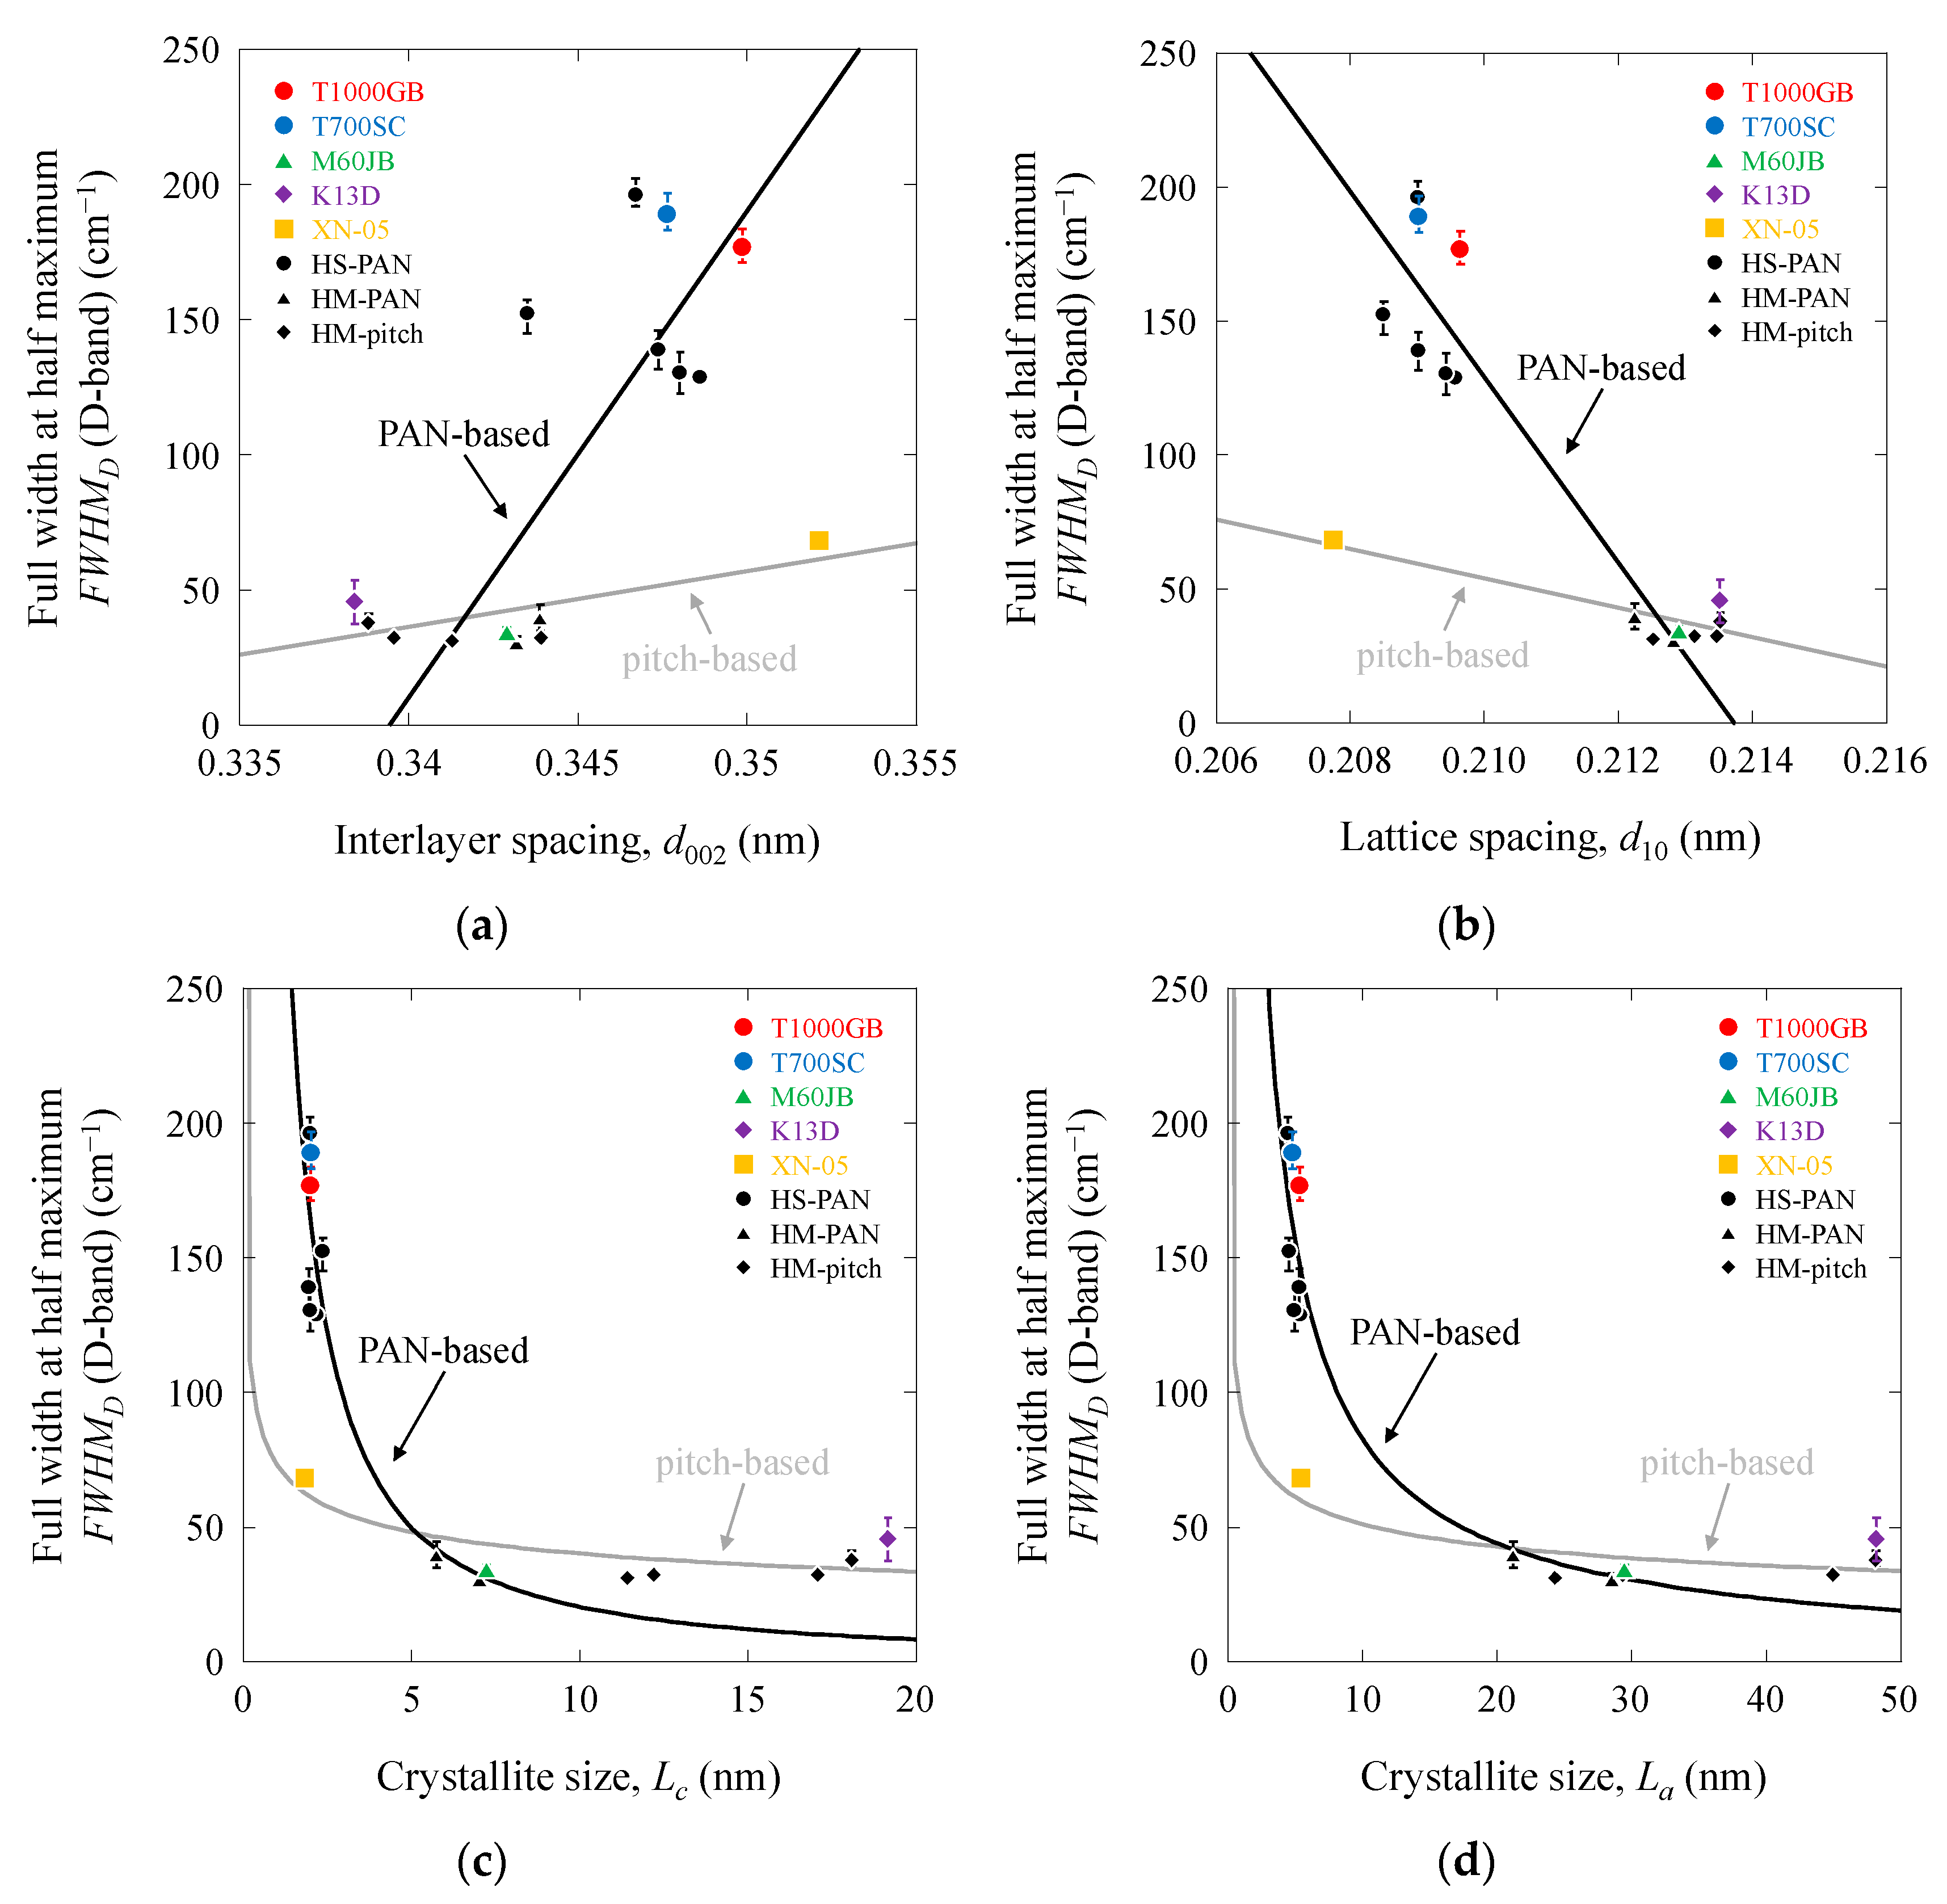
Structural differences between the PAN-based and pitch-based carbon fibers were thoroughly assessed using X-ray diffraction structural parameters [7,8,9,10,11], such as the interlayer spacing (d002), lattice spacing (d10), crystalline size (Lc) (crystallite size perpendicular to the graphitic sheet or the crystalline height), and crystalline size (La) (crystallite size along the graphitic sheet perpendicular and parallel to the fiber axis or the crystalline width), as summarized in Table 1 and Table S1 in the Supporting Information [4,5,6]. Figure 5, Figure 6, Figure 7 and Figure 8 show the RG, RD, FWHMG, and FWHMD values as functions of d002, d10, Lc, and La, respectively. The RG, RD, FWHMG, and FWHMD values of PAN-based and pitch-based carbon fibers exhibited an increasing trend with increasing d002. Conversely, the RG, FWHMG, and FWHMD values of the PAN-based and pitch-based carbon fibers exhibited a decreasing trend with increasing d10, Lc, and La. The RD value of the pitch-based carbon fibers remained nearly constant at 1350.9 cm−1, while the RD value of the PAN-based carbon fibers exhibited a decreasing trend with increasing d10, Lc, and La. From a structural perspective, the Raman scattering parameters (RG, RD, FWHMG, and FWHMD values) exhibited high sensitivities for the PAN-based carbon fibers and low sensitivities for the pitch-based carbon fibers. Linear relationships were observed between the RG, RD, FWHMG, and FWHMD values, and between d002 and d10. In addition, linear relationships were observed between the RG, RD, FWHMG, and FWHMD values and Lc and La on a log–log scale. Therefore, the values of RG, RD, FWHMG, and FWHMD were related to the structural parameters. The intersections between the PAN-based and pitch-based carbon fibers occurred at approximately 0.342 (d002), 0.213 (d10), 5 (Lc), and 20 (La). These values were equivalent to those of the 400–600 GPa-class PAN-based and pitch-based carbon fibers.
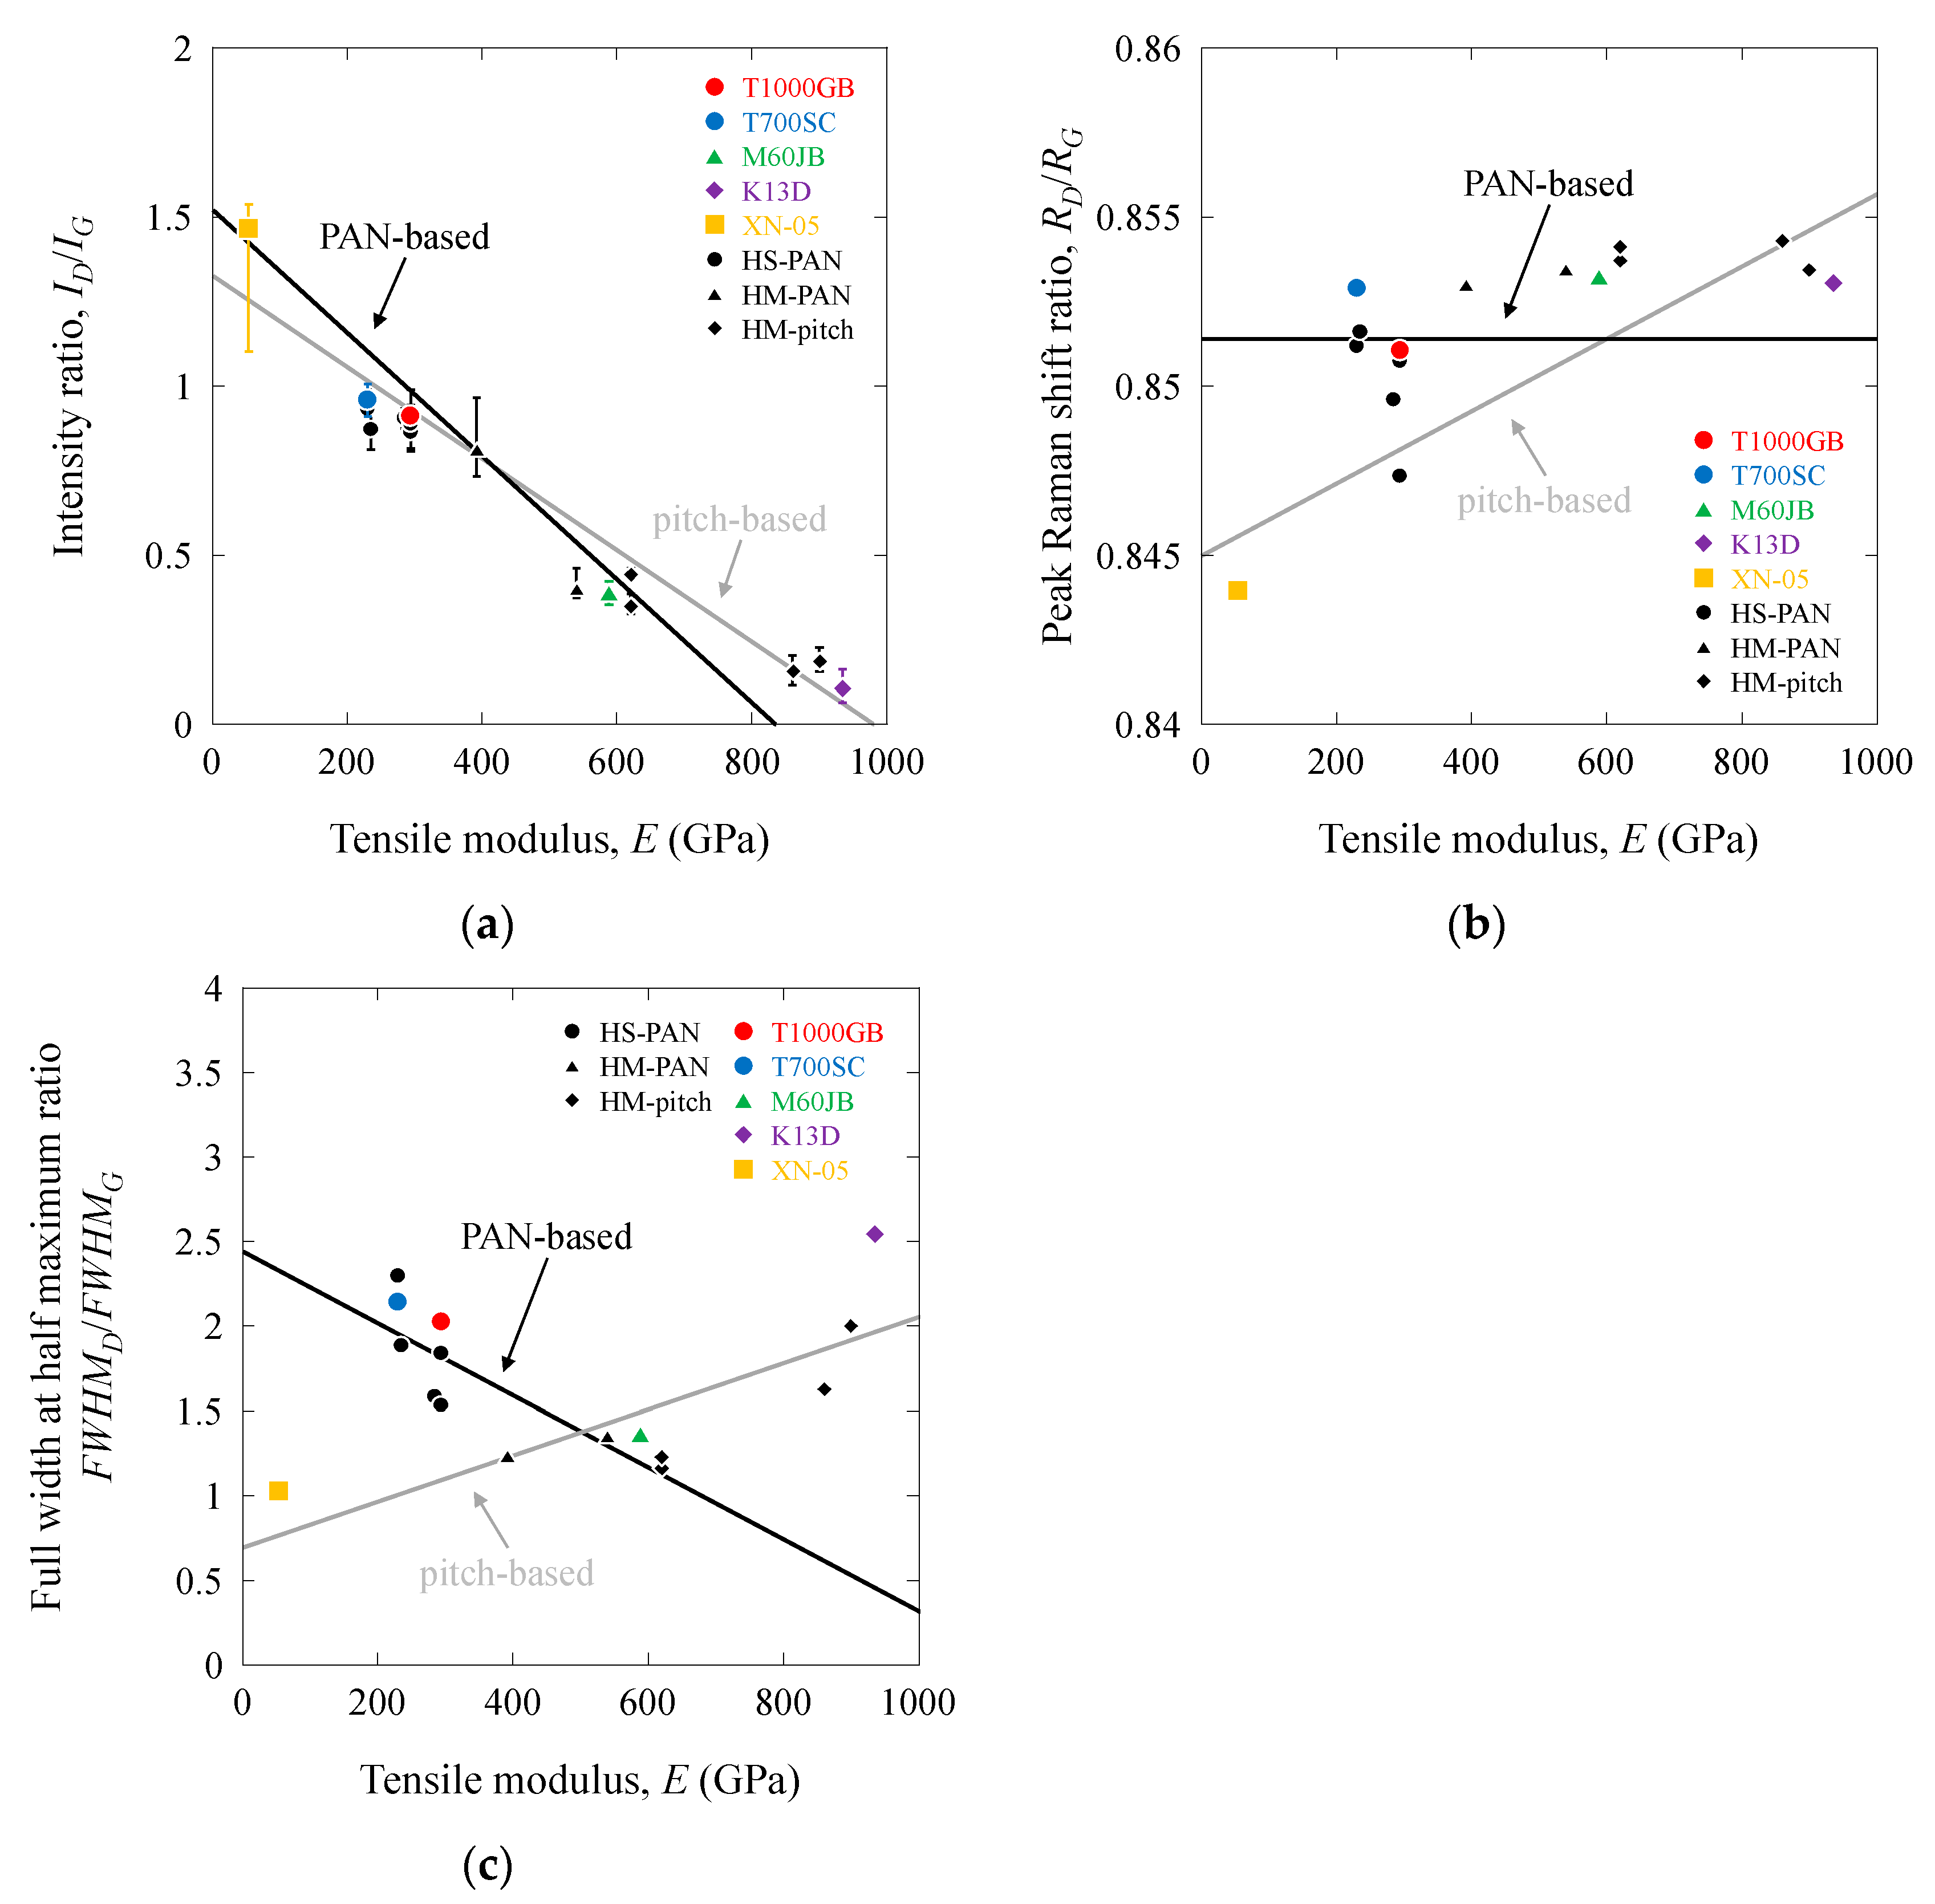
The Raman intensity ratio of the G- and D-bands, ID/IG, is a useful parameter for characterizing carbon fibers [15,16,17,18,19]. Similarly, the peak Raman shift ratios of the G- and D-bands, RD/RG and the full width at half maximum ratios for the G- and D-bands, FWHMD/FWHMG are effective parameters. The values of ID/IG, RD/RG, and FWHMD/FWHMG are summarized in Table 1 and Table S1 in the Supporting Information. Figure 9a–c show the Raman scattering ratios (ID/IG, RD/RG, and FWHMD/FWHMG values) as functions of the tensile modulus, E. The ID/IG values for PAN-based and pitch-based carbon fibers decreased with increasing E. The tendencies of RD/RG, FWHMD/FWHMG, and E were unclear; however, these relationships were elucidated by evaluating the PAN-based and pitch-based carbon fibers separately. The RD/RG and FWHMD/FWHMG values for pitch-based carbon fibers increased with increasing E, whereas those for the PAN-based carbon fibers either remained nearly constant (0.851) or decreased with increasing E. Linear relationships were observed between the ID/IG, RD/RG, and FWHMD/FWHMG values and E. In addition, these linear trends for the PAN-based and pitch-based carbon fibers intersected in the range of 400–600 GPa.
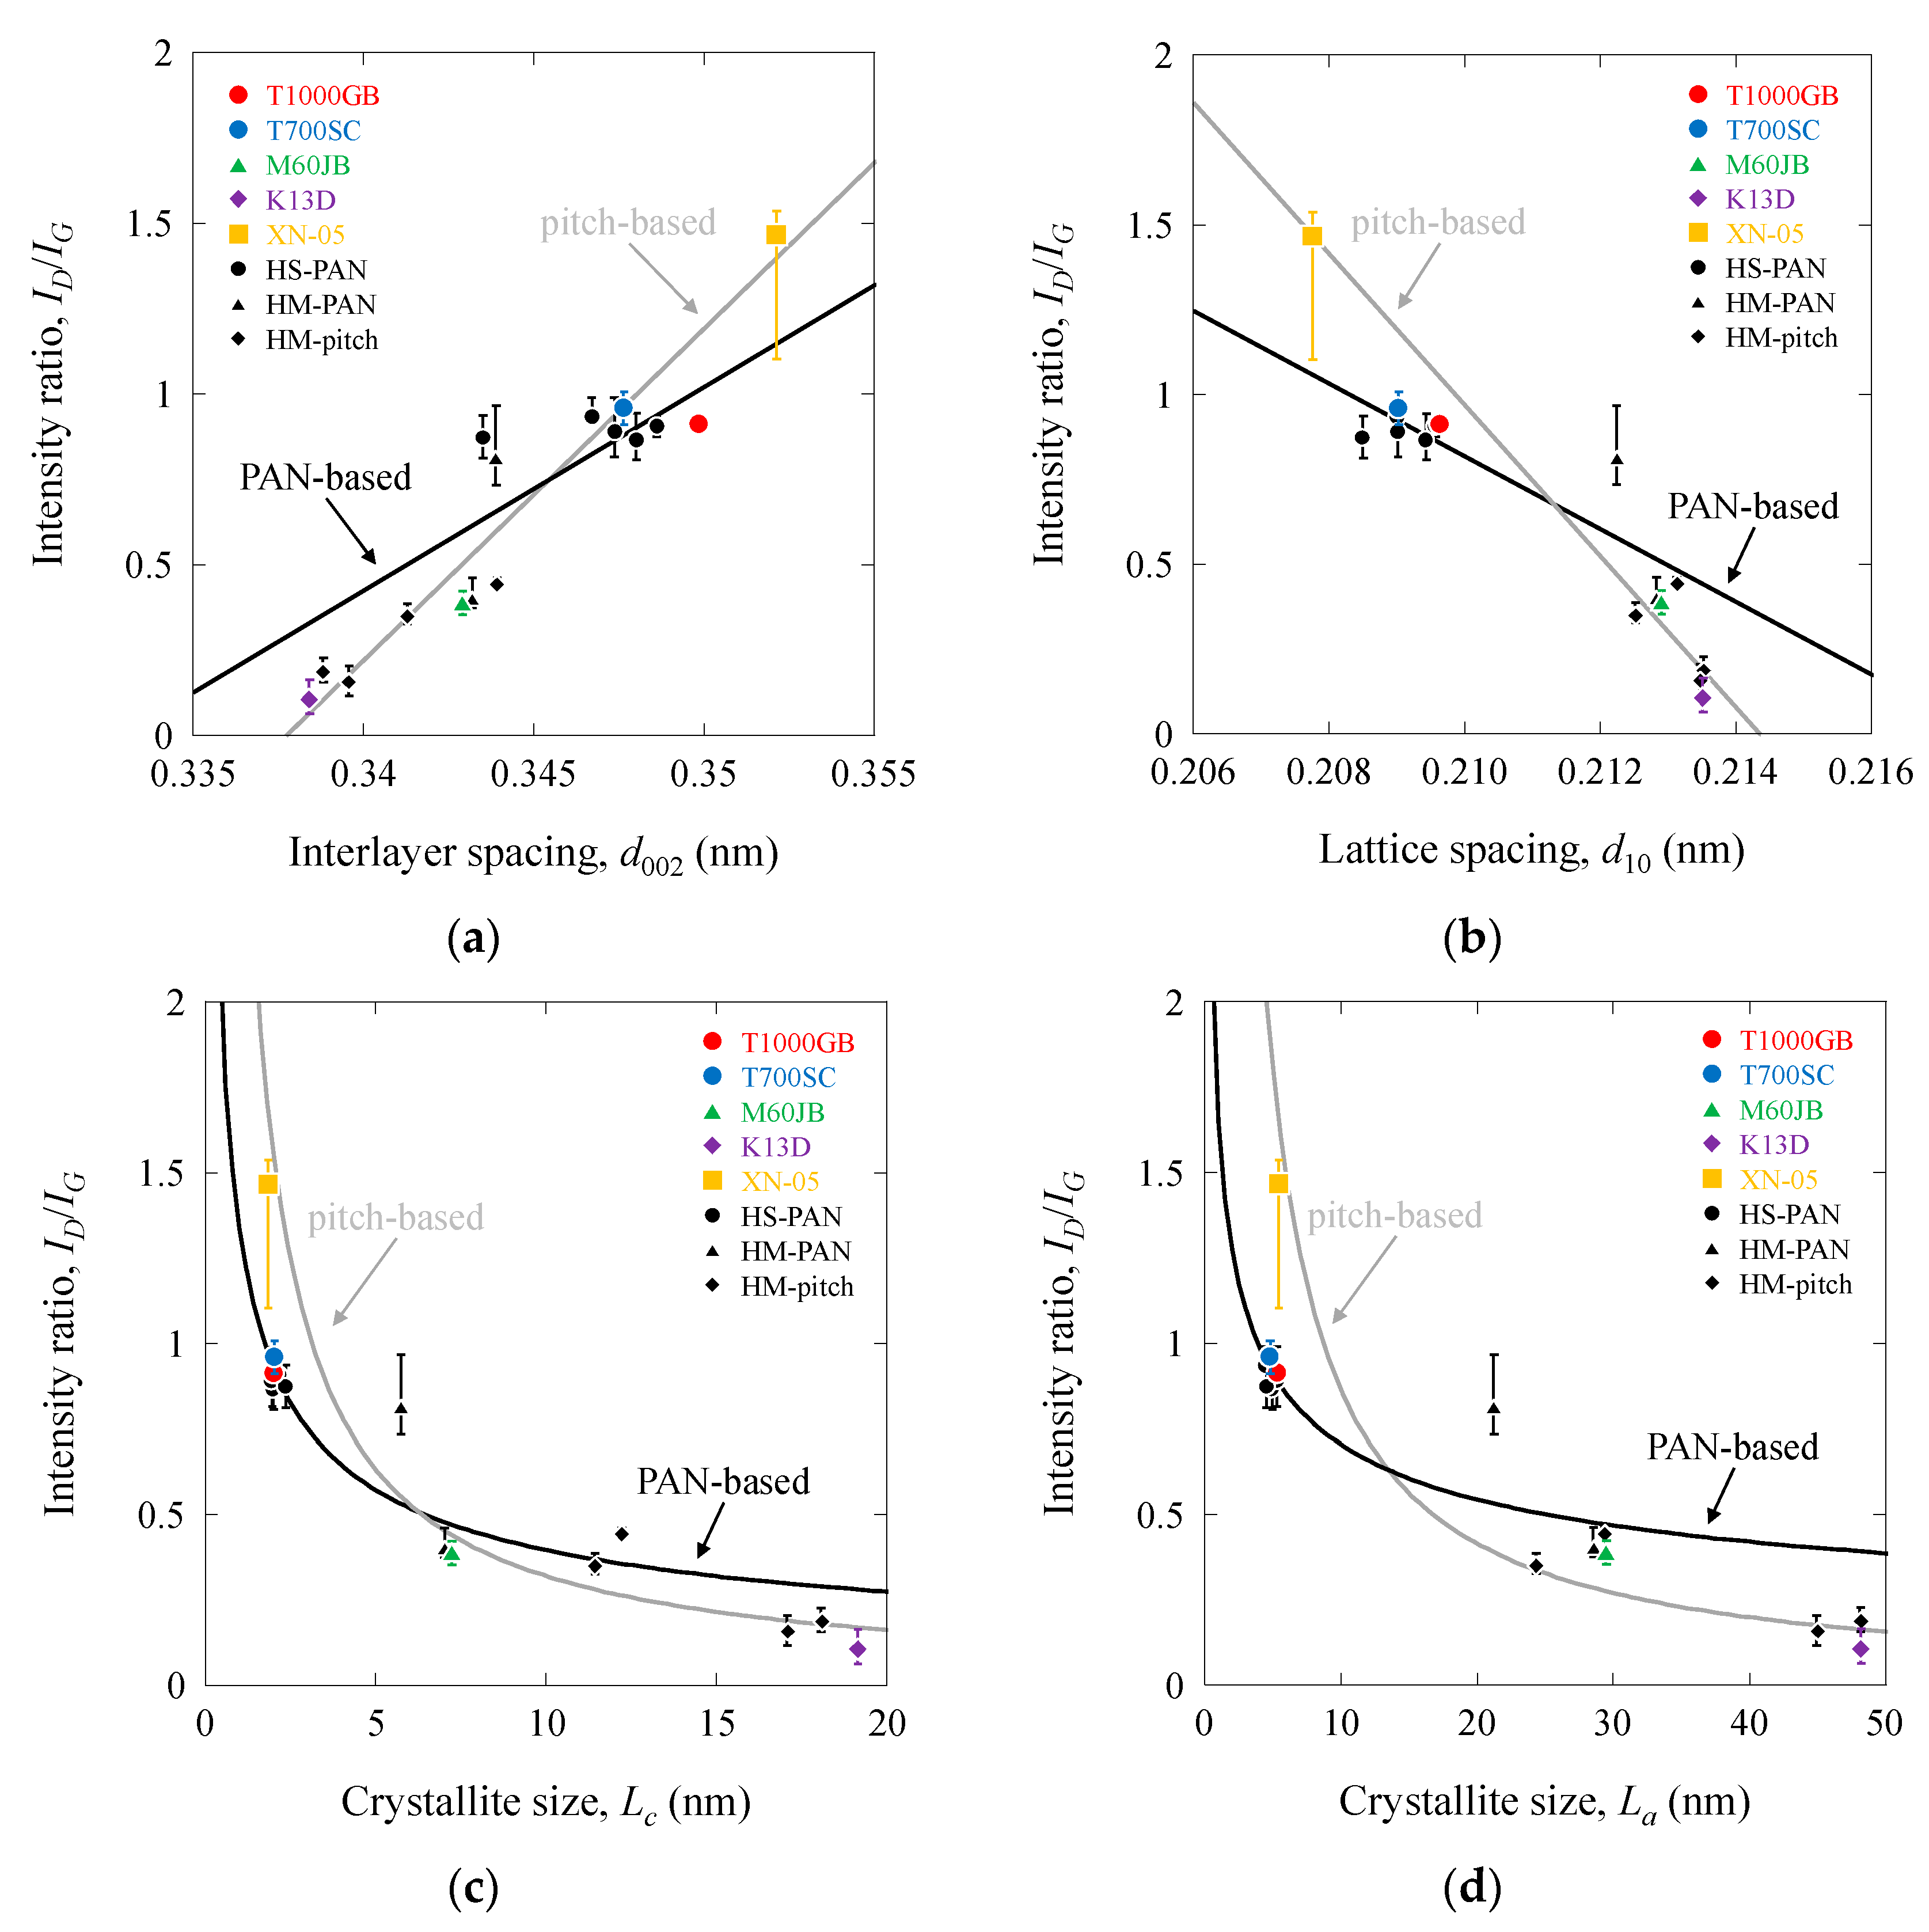
Figure 10, Figure 11 and Figure 12 show the ID/IG, RD/RG, and FWHMD/FWHMG values as functions of d002, d10, Lc, and La, respectively. For the PAN-based and pitch-based carbon fibers, the ID/IG value increased with increasing d002 and decreasing d10, Lc, and La. Linear relationships were observed between ID/IG and d002, d10, as well as between ID/IG and Lc, La on a log–log scale. The RD/RG value of the PAN-based carbon fibers remained nearly constant at 0.851. In contrast, for the pitch-based carbon fibers, the RD/RG value increased as d002 increased, and decreased as d10, Lc, and La decreased. The FWHMD/FWHMG value of the PAN-based carbon fibers increased with increasing d002 and decreasing d10, Lc, and La. Conversely, for pitch-based carbon fibers, the FWHMD/FWHMG value decreased with increasing d002 and decreasing d10, Lc, and La. Moreover, linear relationships were observed between the RD/RG and FWHMD/FWHMG values and d002, d10, as well as between the RD/RG, and FWHMD/FWHMG values and Lc, La on a log–log scale. Therefore, the ID/IG, RD/RG, and FWHMD/FWHMG values were related to the structural parameters. The points at which each line for the PAN-based and pitch-based carbon fibers intersected were obtained at approximately 0.344 (d002), 0.212 (d10), 7.5 (Lc), and 20 (La). These values were also equivalent to the values for 400–600 GPa-class PAN-based and pitch-based carbon fibers.

3.3. In Situ Raman Stress Measurement for Tensile Testing of Carbon Fibers

The full widths at half maximum (FWHMG and FWHMD) and the Raman intensity ratio (ID/IG) values remained nearly constant during the tensile test. The Raman bands (RG and RD) shifted downwards under tension [25,26,27,28]. The relationships between RG vs. σ and RD vs. σ are useful for characterizing carbon fibers and carbon fiber-reinforced composites (CFCs). For example, the residual stress of CFCs could be estimated using the relationships between RG vs. σ and RD vs. σ [33]. Figure 13a,b show the relationships between RG and RD and the tensile stress (σ) for the T1000GB, T700SC high-strength PAN-based, M60JB high-modulus PAN-based, K13D high-modulus pitch-based, and XN-05 high-ductility pitch-based carbon fibers (the Scanning electron microscope (SEM) micrographs, displaying transverse cross-sections of fractured tensile surfaces, are presented for the following types of carbon fibers: the high-strength PAN-based (T1000GB and T700SC), high-modulus PAN-based (M60JB), high-modulus pitch-based (K13D), and high-ductility pitch-based (XN-05) carbon fibers. Figure S1 in the Supporting Information provides an illustration of these micrographs). RG and RD and σ exhibit a linear relationship as expressed in the following equations.
R G = A G σ + B G ,
R D = A D σ + B D
where AG and AD (slopes of RG and RD) and BG and BD (intercepts of RG and RD) are experimental constants. The AG, AD, BG, and BD values are summarized in Table 1 and Table S1 in the Supporting Information.
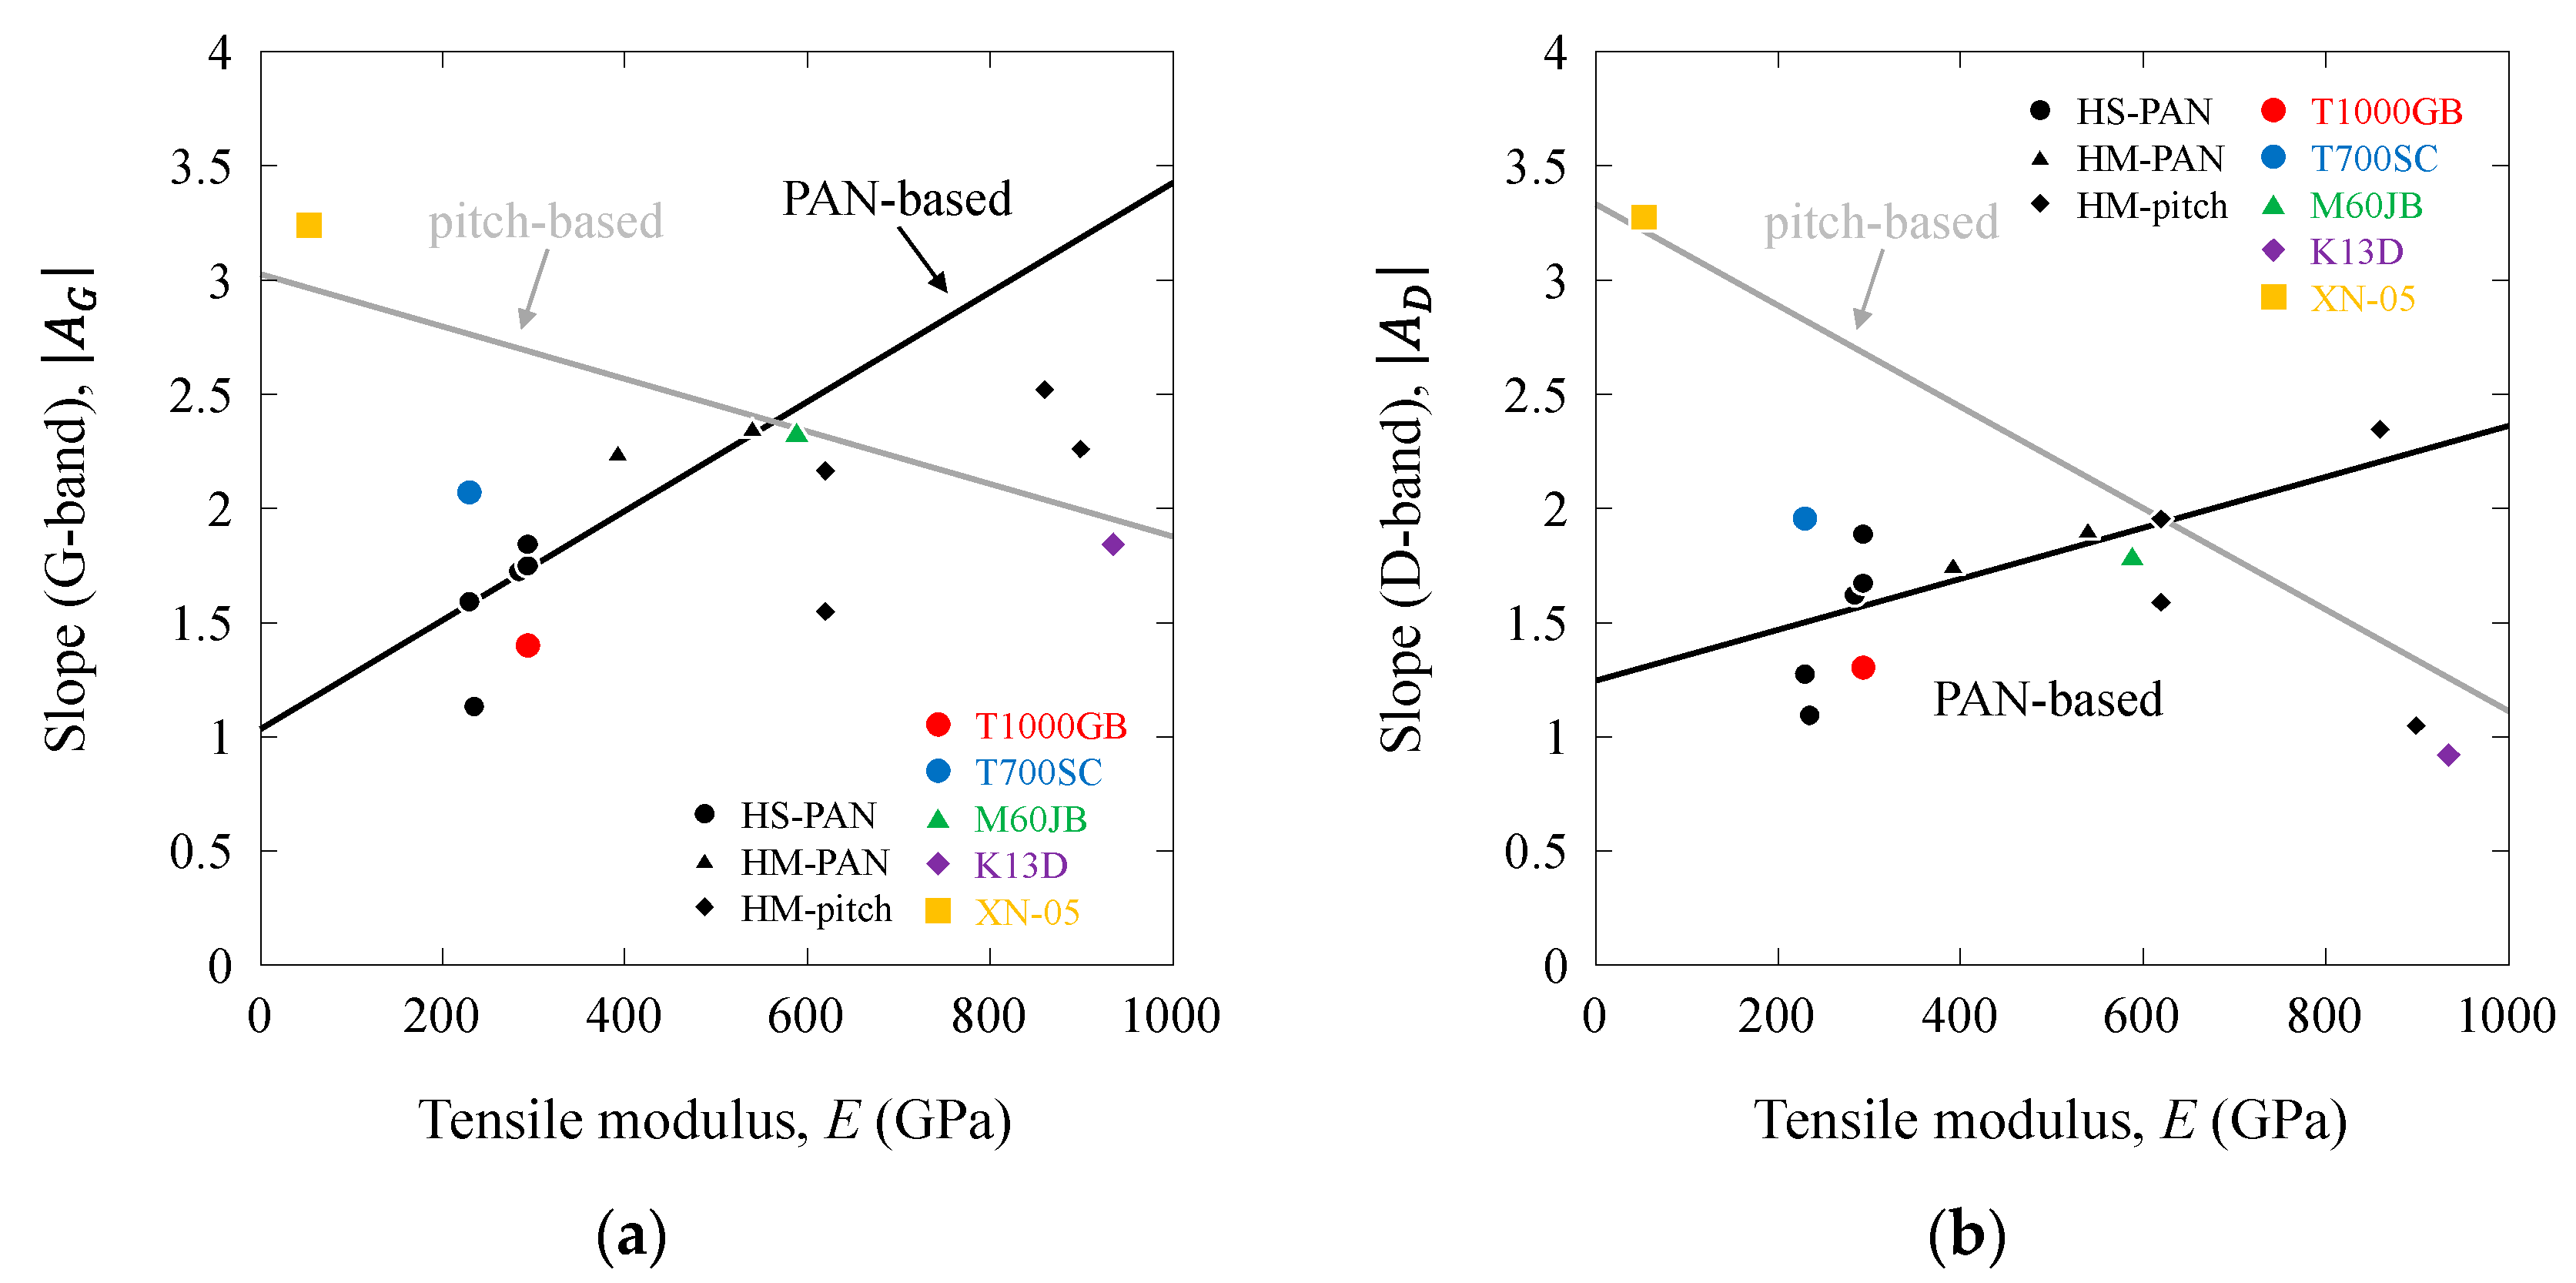
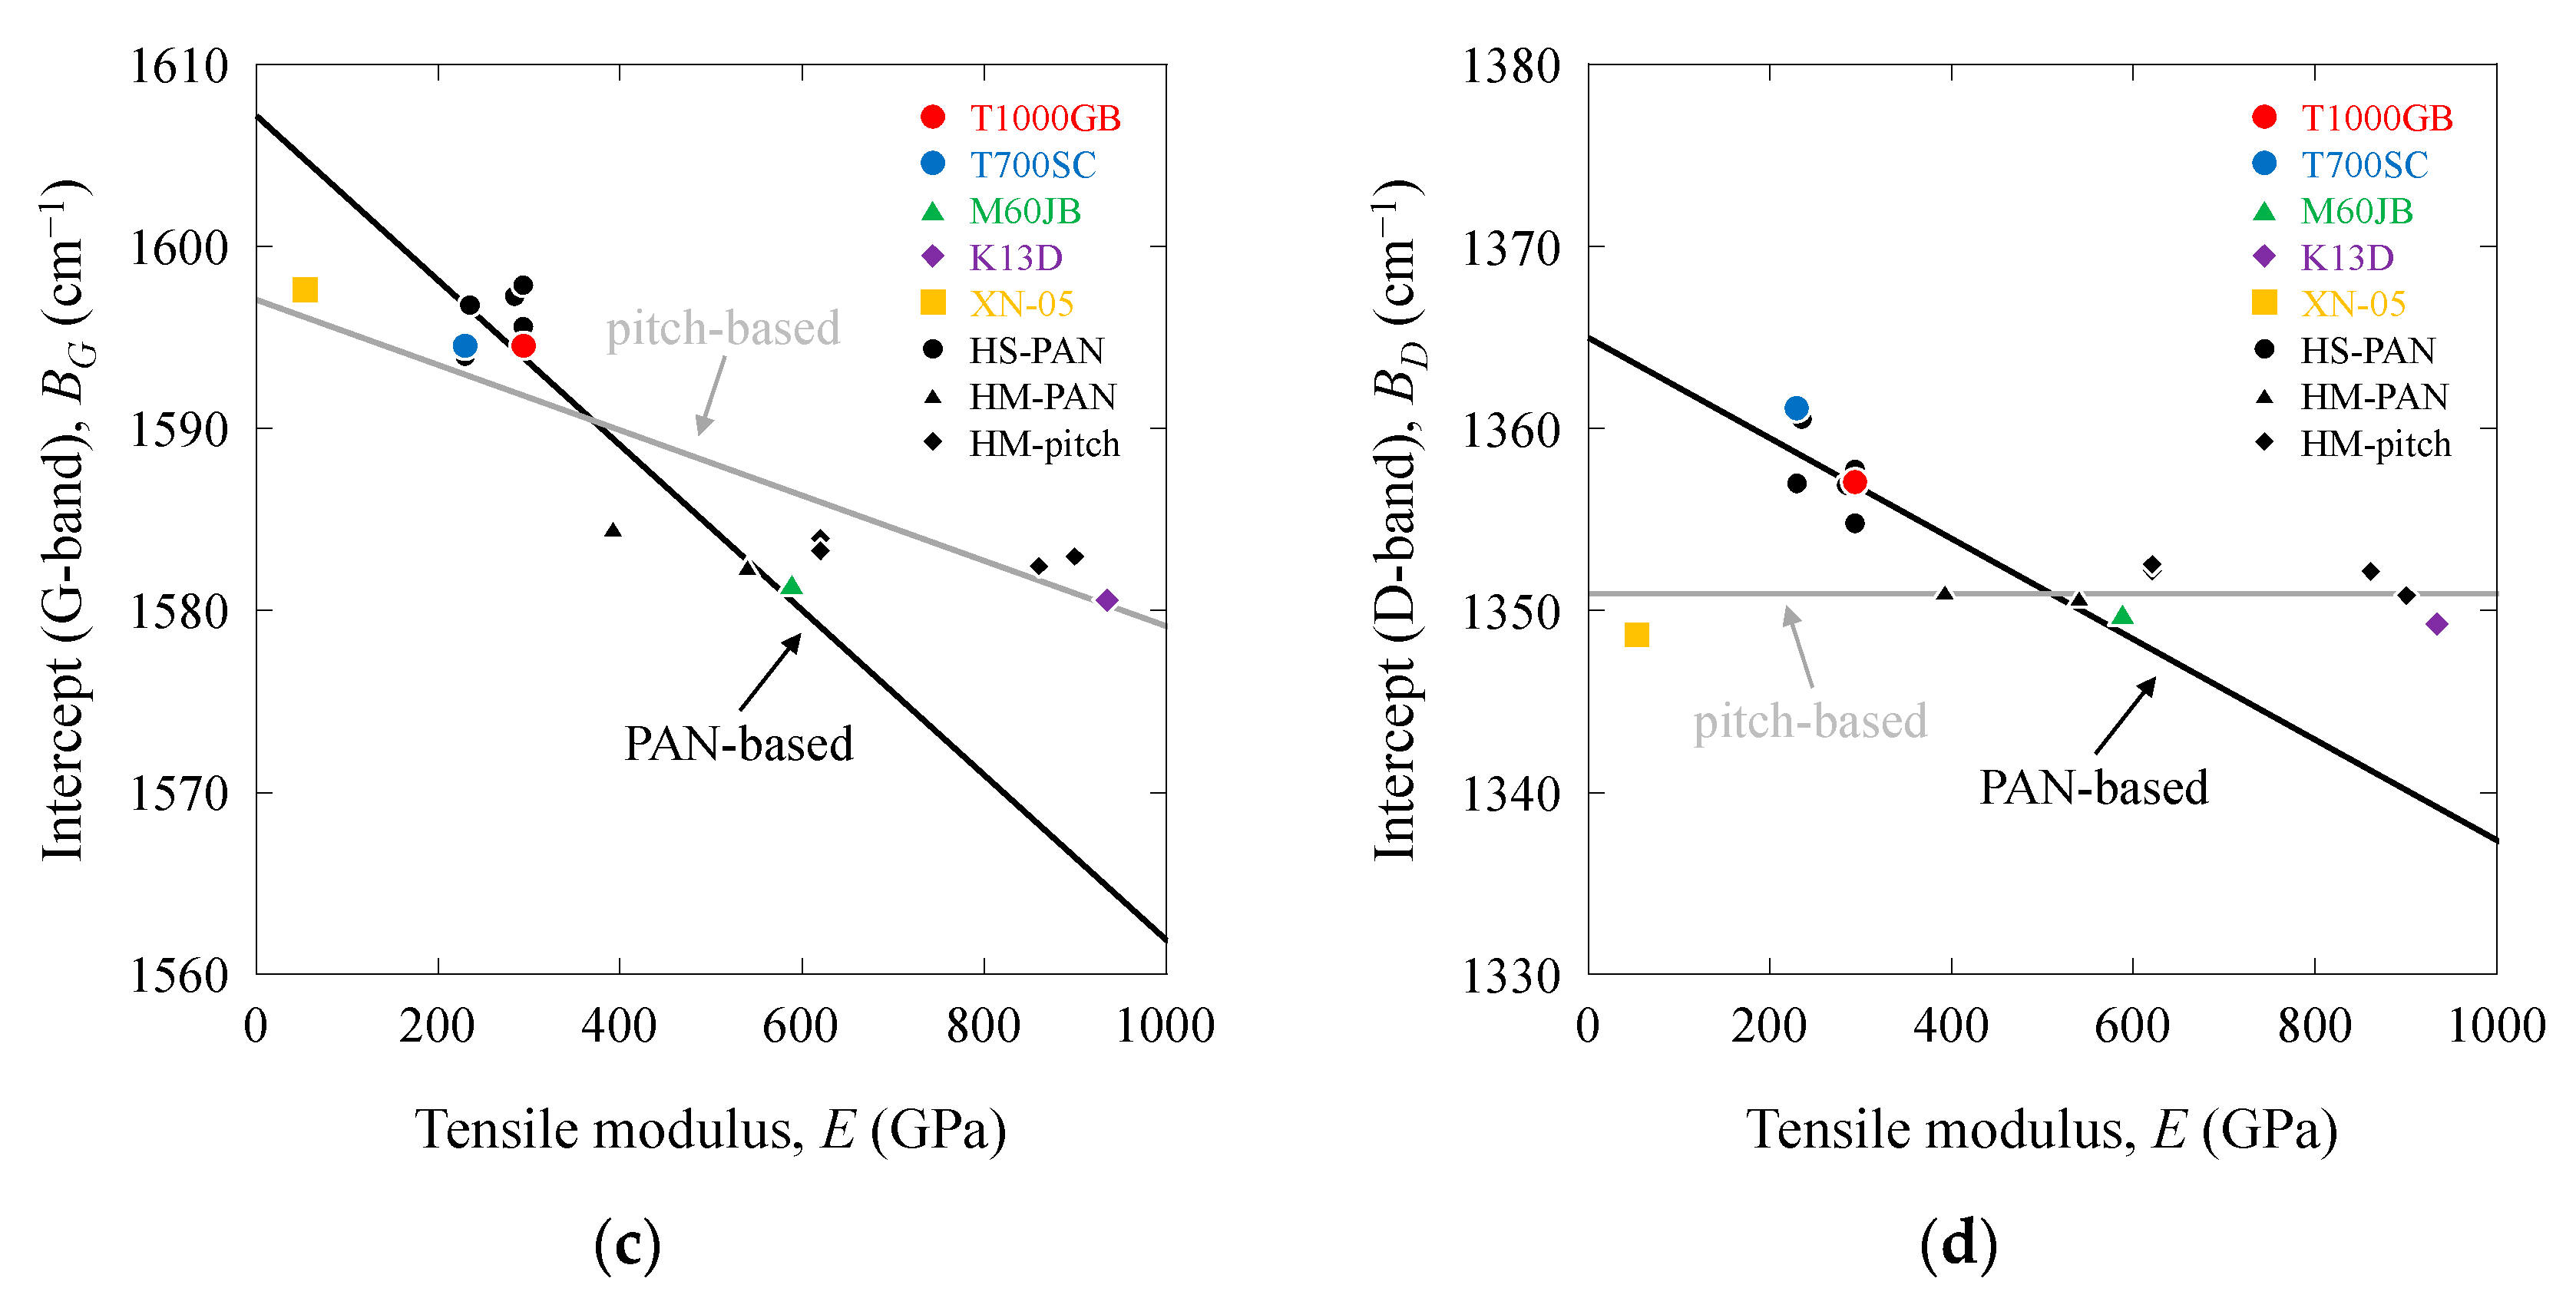
Figure 14a–d show the |AG|, |AD|, BG, and BD values and their relationship with the tensile modulus (E). These values were distinguished for the high-strength PAN-based, high-modulus PAN-based, high-modulus pitch-based, and high-ductility pitch-based carbon fibers. The |AG| and |AD| values were high for the high-ductility XN-05 pitch-based carbon fibers and low for the high-strength PAN-based, high-modulus PAN-based, and pitch-based carbon fibers. For the PAN-based carbon fibers, the |AG| and |AD| values increased with increasing E, whereas for the pitch-based carbon fibers, these values decreased with increasing E. The BG and BD values are approximately the same as the RG and RD values in zero-stress conditions, as shown in Table 1, Table S1 in the Supporting Information, and Figure 3a,b. The BG and BD values of the PAN-based and pitch-based carbon fibers increased with increasing E, whereas the BD value of the pitch-based carbon fibers remained nearly constant (1350.9 cm−1). Linear relationships were identified between |AG|, |AD|, BG, and BD and E. These linear trends for the PAN-based and pitch-based carbon fibers intersected in the range of 400–600 GPa.
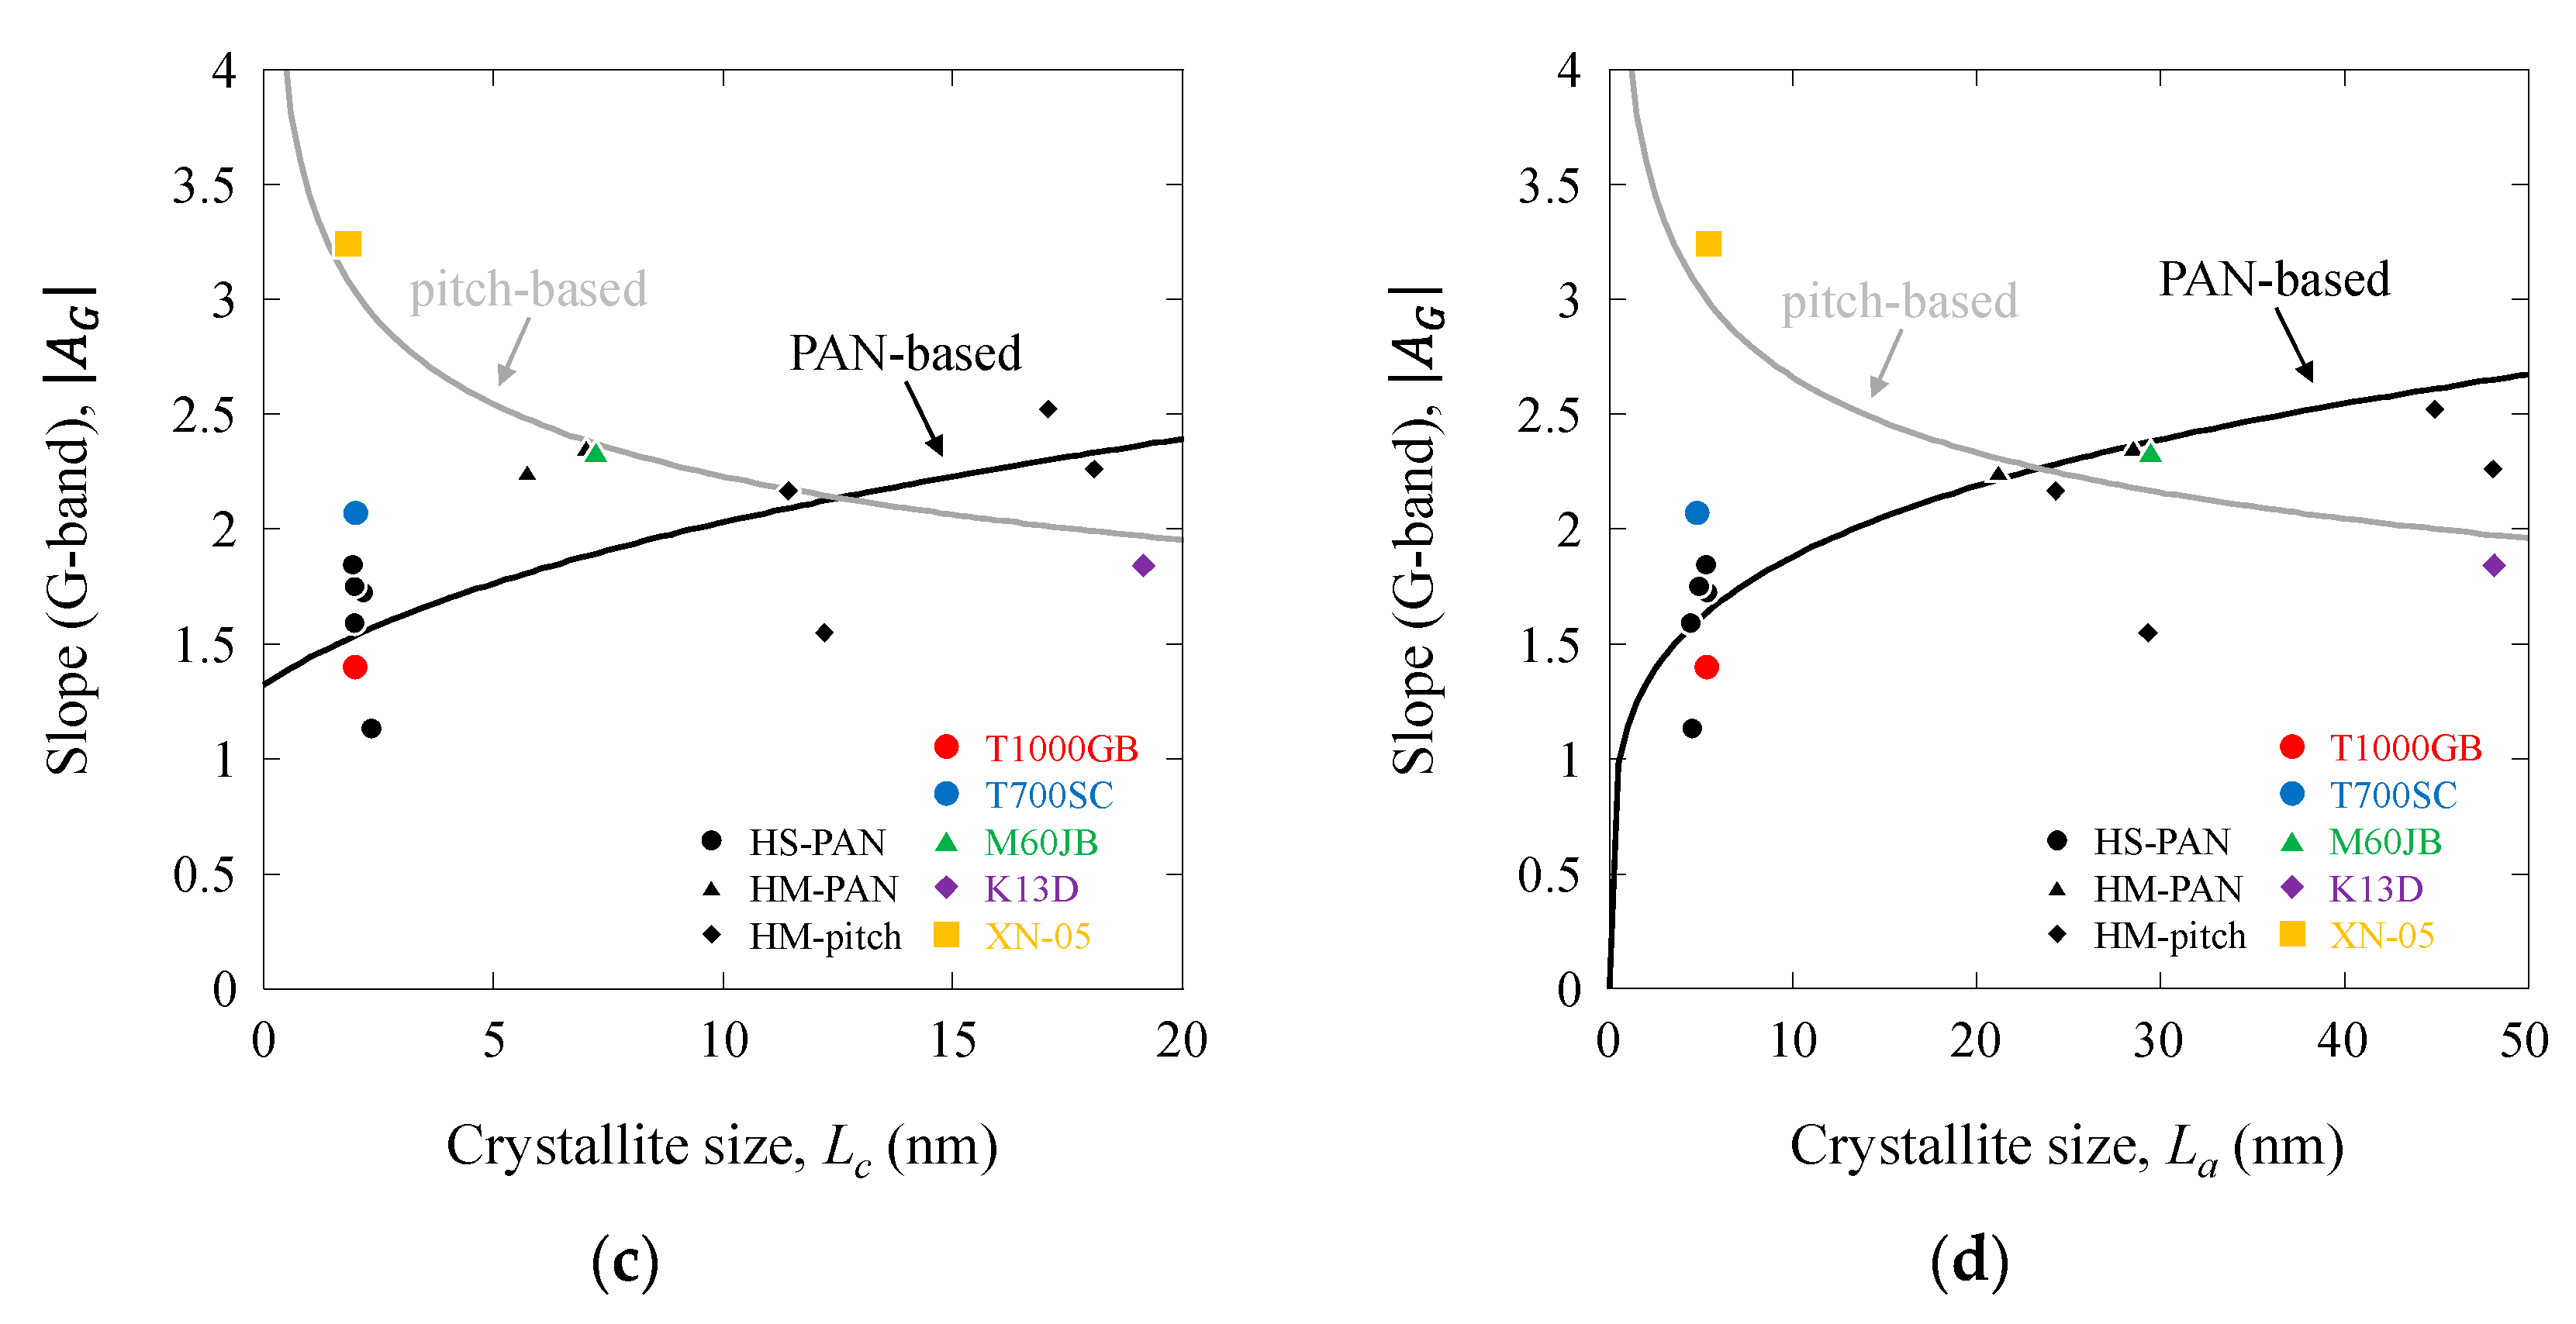
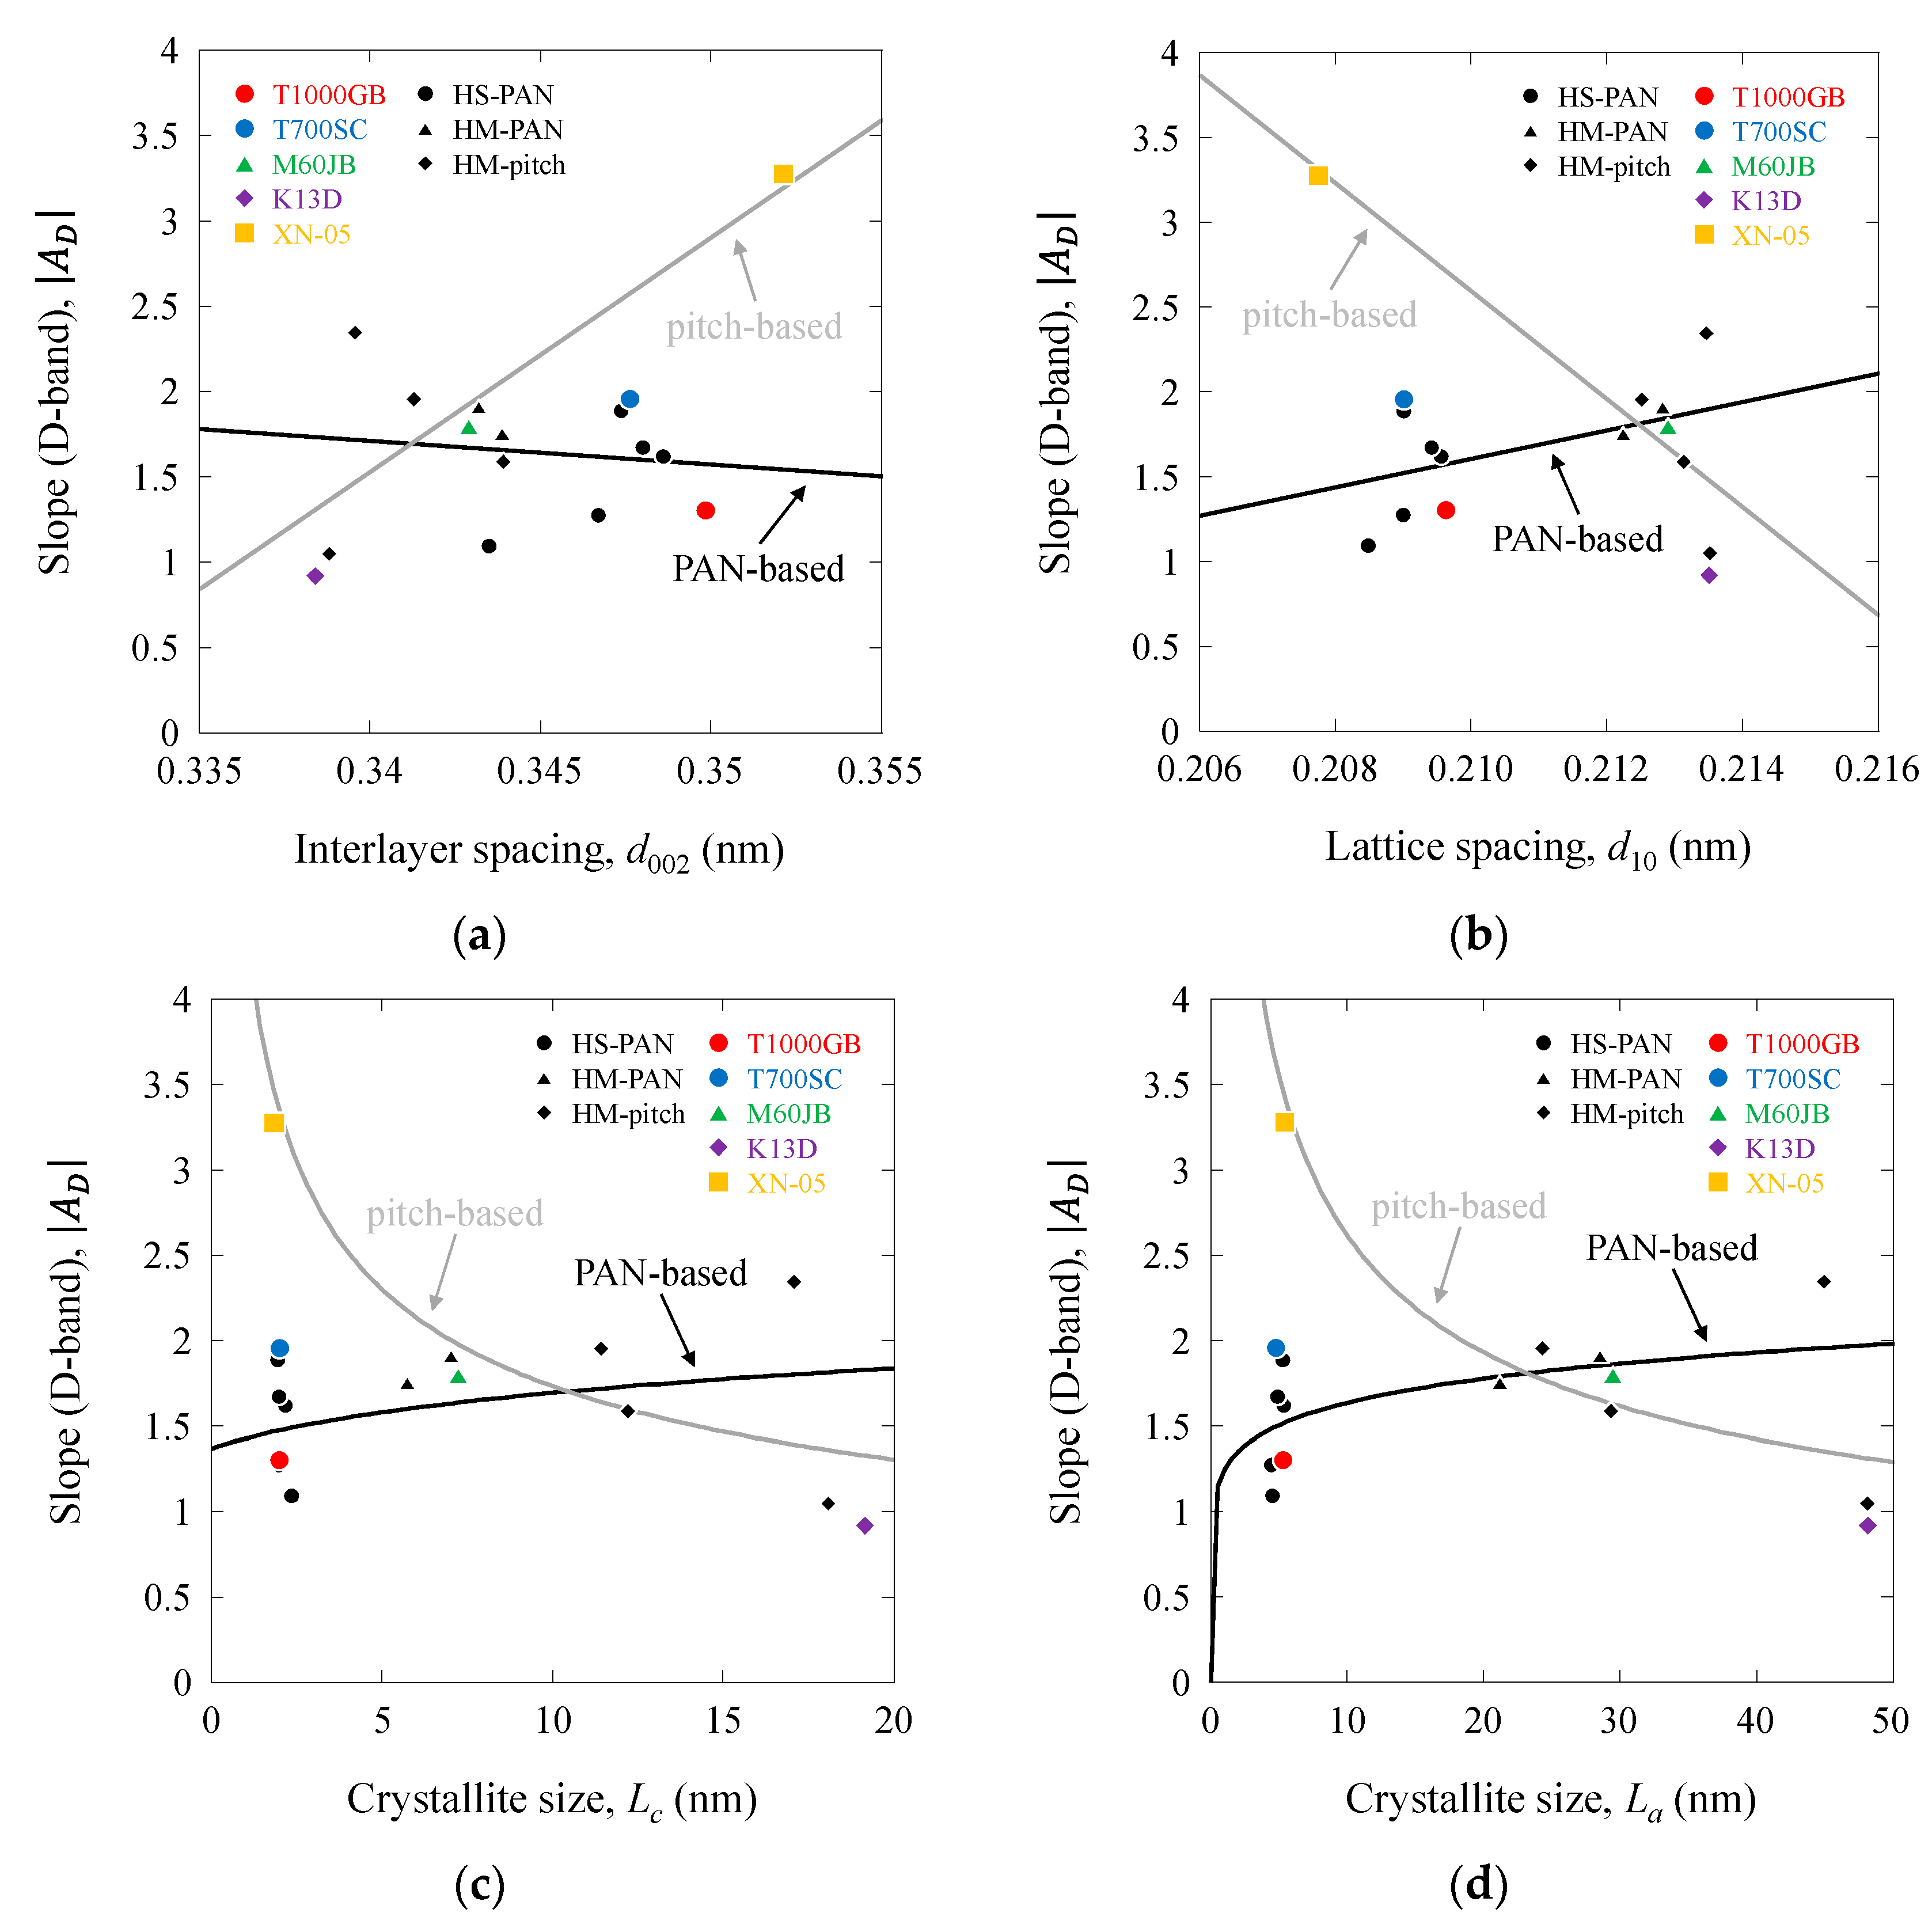
Figure 15 and Figure 16 show the |AG| and |AD| values as functions of d002, d10, Lc, and La. The |AG| and |AD| values of the PAN-based carbon fibers decreased with increasing d002, d10, Lc, and La, whereas those of the pitch-based carbon fibers increased with these structural parameters. Linear relationships were observed between |AG| and |AD| and d002 and d10. Moreover, linear relationships were observed between |AG| and |AD| and Lc, La on the log–log scale. Consequently, the |AG| and |AD| values (also BG and BD values) were associated with the structural parameters. The lines representing PAN-based and pitch-based carbon fibers intersected at approximately 0.342 (d002), 0.212 (d10), 7.9 (Lc), and 18 (La). These values correspond to those of the 400–600 GPa-class PAN-based and pitch-based carbon fibers.
The ID/IG ratio is a useful parameter for characterizing carbon fibers [15,16,17,18,19]. Similarly, for the Raman stress measurement parameters for the G- and D-bands, the ratios of AD/AG and BD/BG appeared to be effective. The AD/AG and BD/BG values are summarized in Table 1 and Table S1 in the Supporting Information. The BG/BD values were nearly the same as the RG/RD values, as shown in Table 1, Table S1 in the Supporting Information, and Figure 3a,b. Figure 17 shows the AD/AG values as functions of the tensile modulus, E. The AD/AG value of the pitch-based carbon fibers decreased with increasing E, whereas the AD/AG value of the PAN-based carbon fibers remained nearly constant at 0.892). A linear relationship was identified between the AD/AG and E (also BD/BG and E). These lines for PAN-based and pitch-based carbon fibers also intersected at 400–600 GPa.
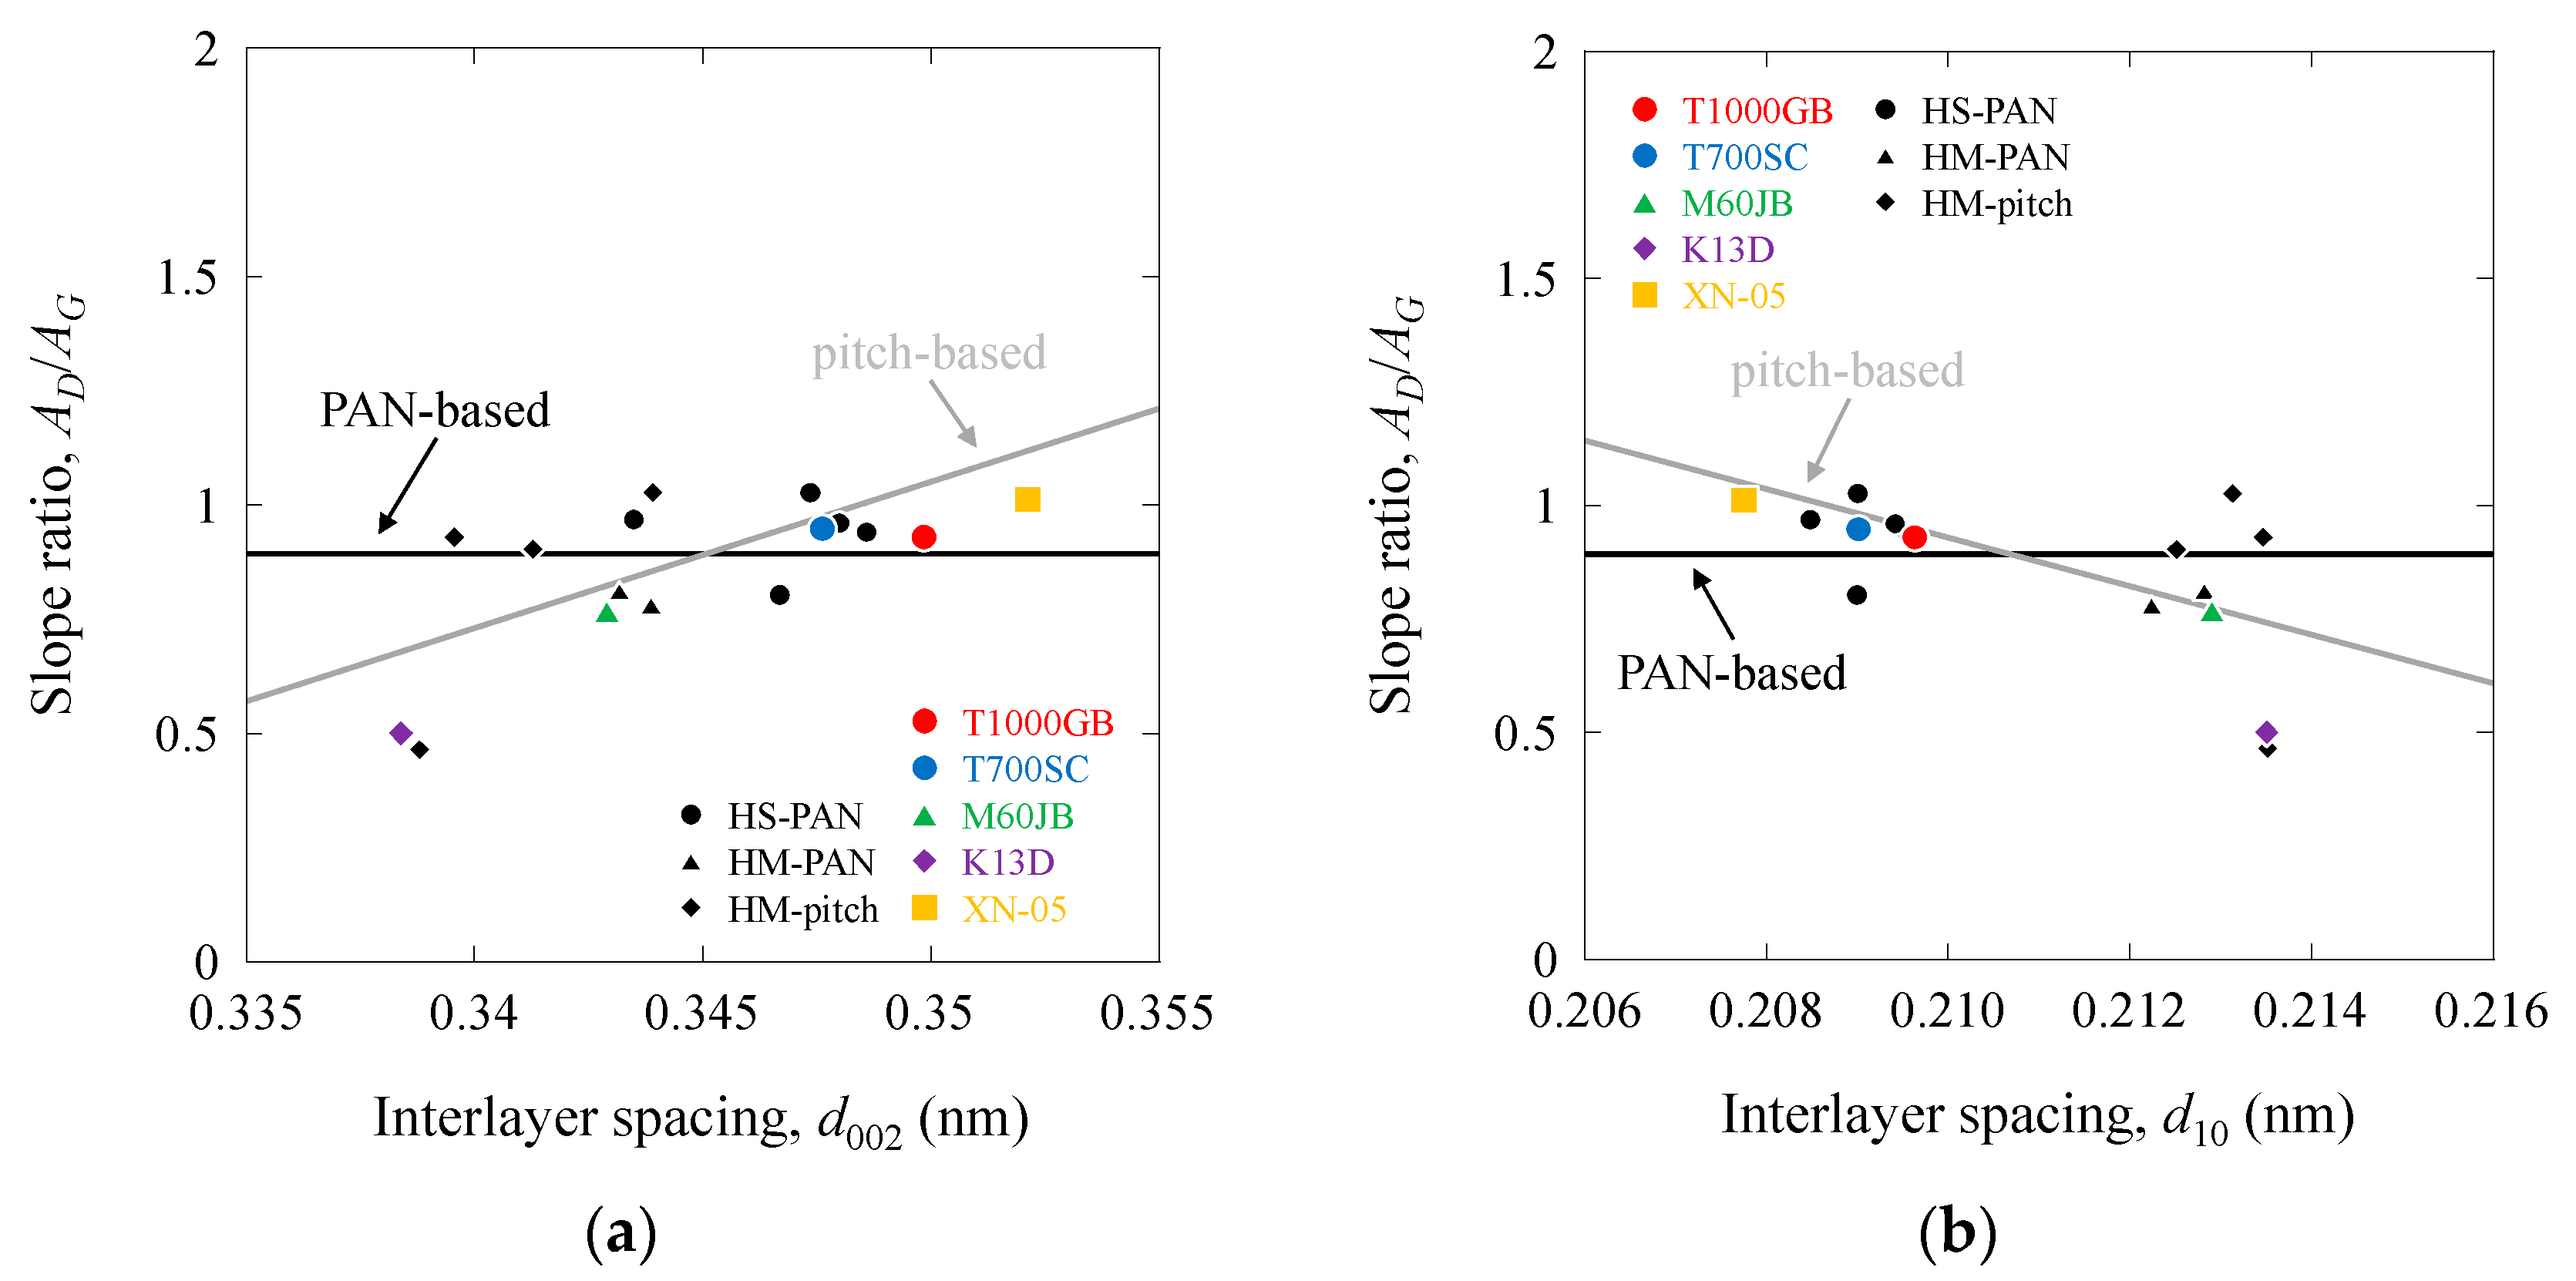
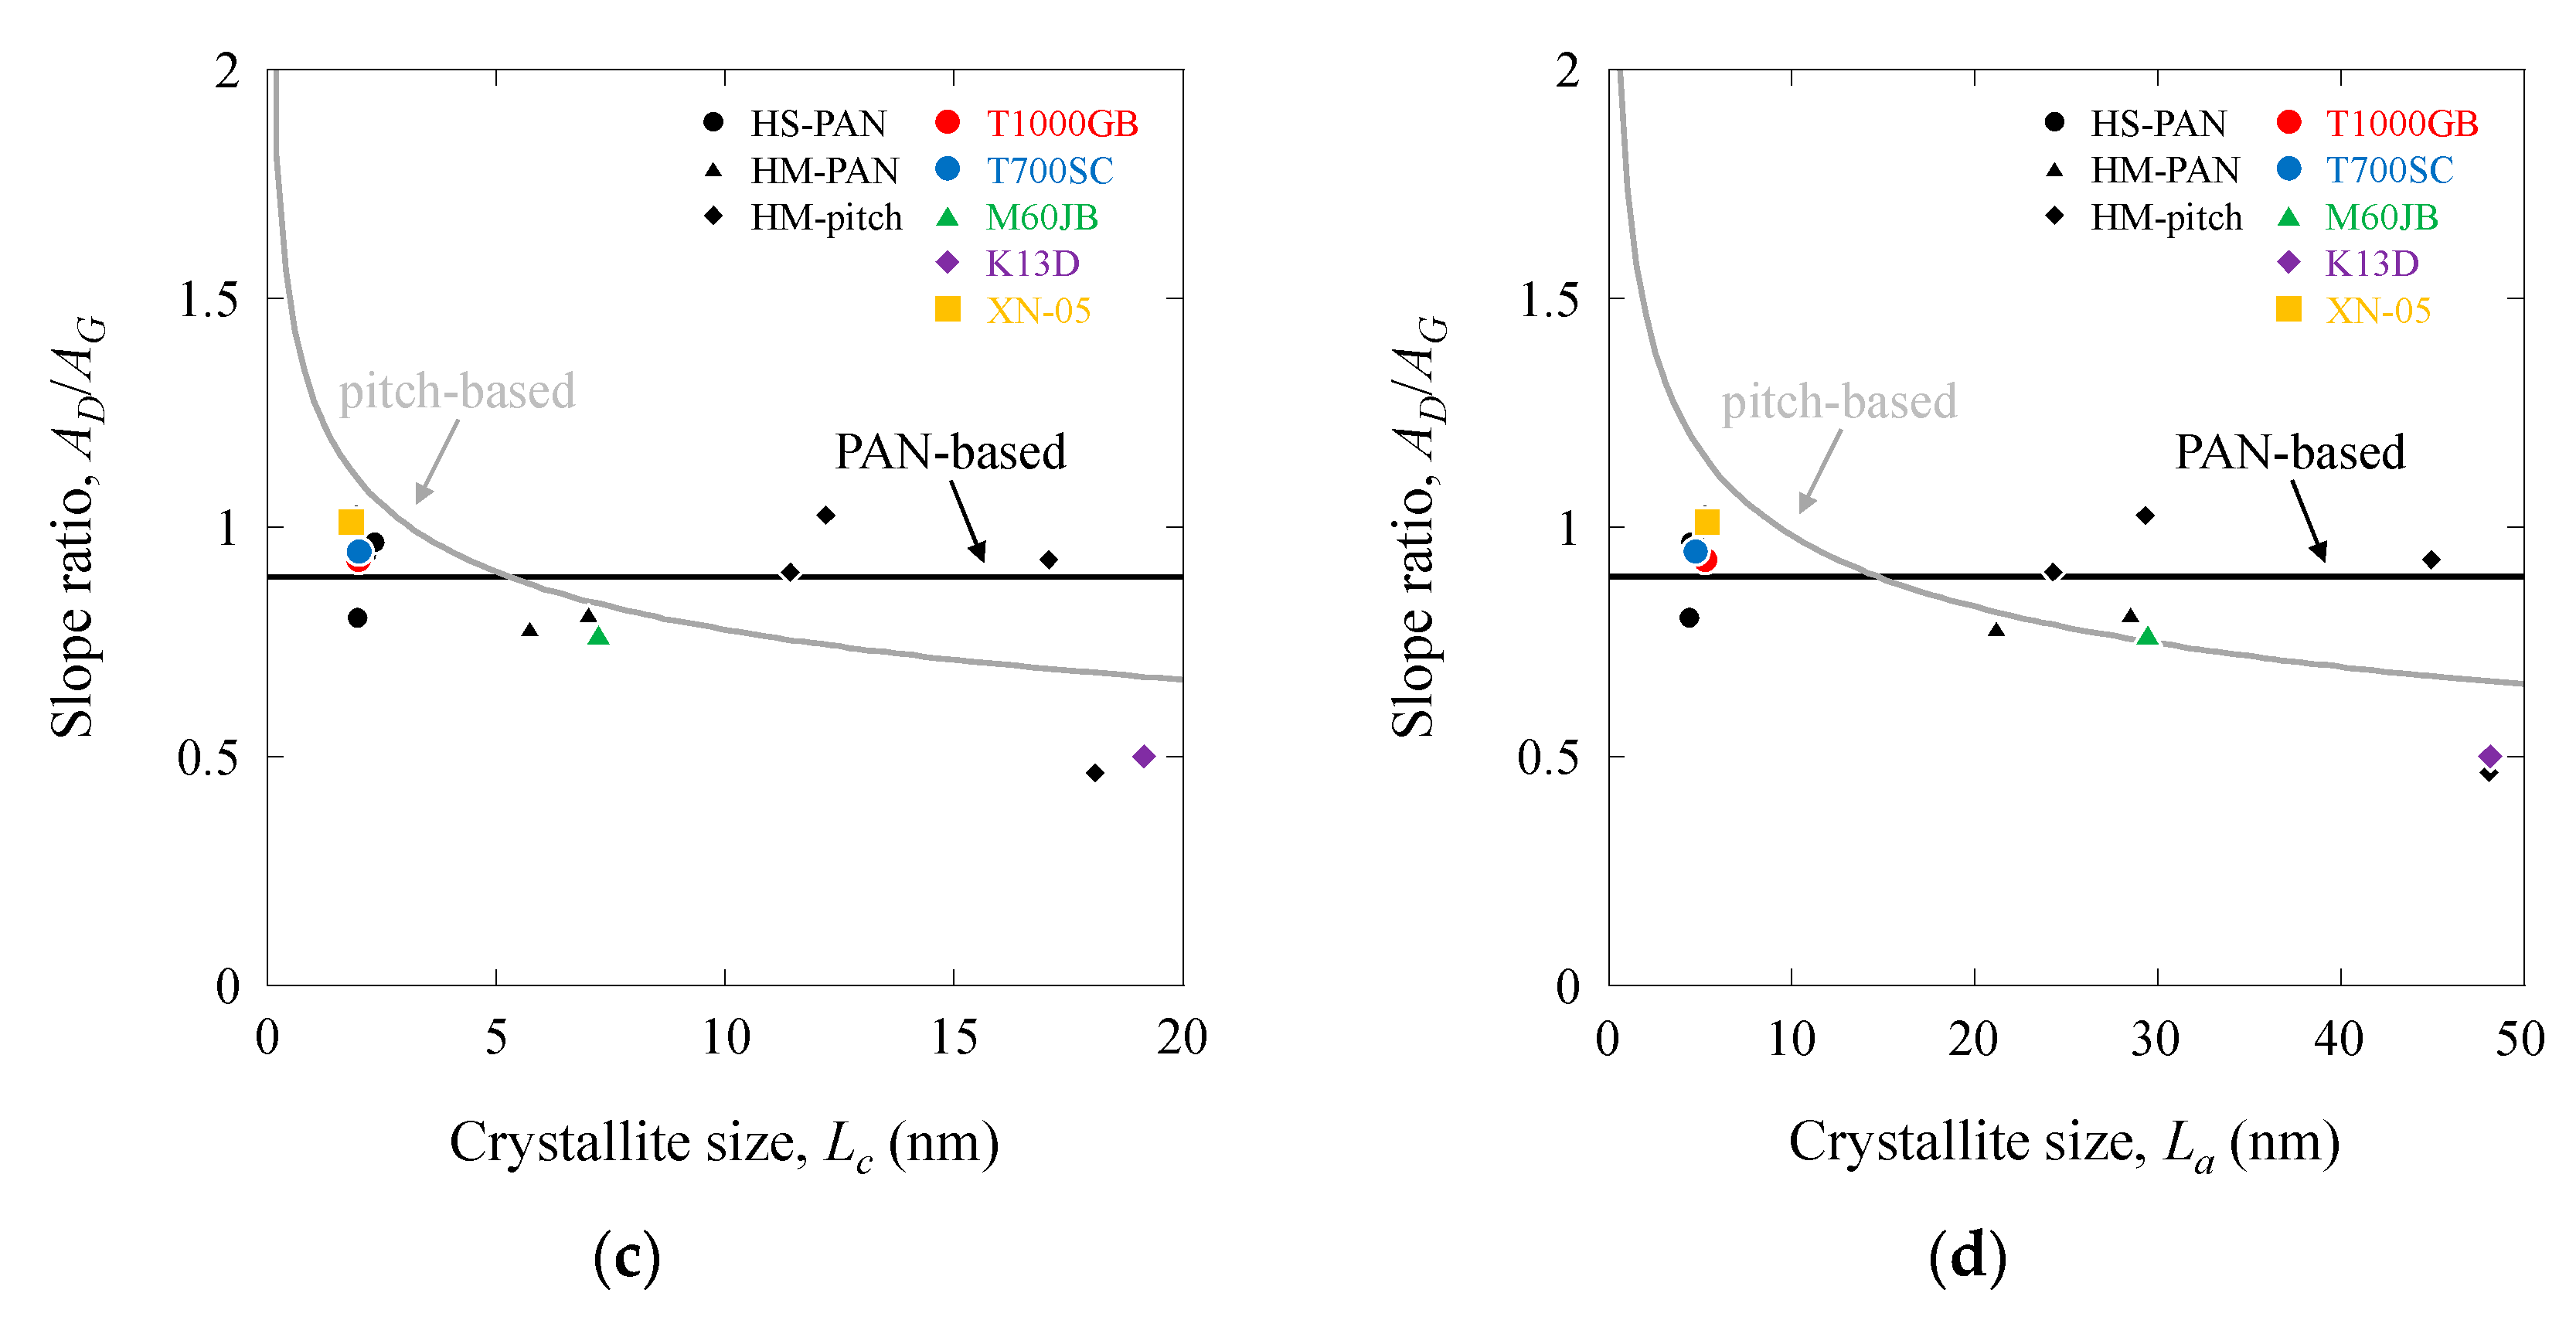
Figure 18a–d shows the AD/AG values as functions of d002, d10, Lc, and La. The AD/AG value of the pitch-based carbon fibers decreased with an increase in d002, d10, Lc, and La, whereas the AD/AG value of the PAN-based carbon fibers remained nearly constant at 0.892. Linear relationships were observed between AD/AG and d002, d10, as well as between AD/AG and Lc, La, on a log–log scale. Consequently, the AD/AG value (also the BG/BD value) was found to be related to structural parameters. The lines for the PAN-based and pitch-based carbon fibers intersected at approximately 0.344 (d002), 0.211 (d10), 7.3 (Lc), and 19 (La). These values were also consistent with the values of the 400–600 GPa-class PAN-based and pitch-based carbon fibers.
All the Raman scattering and stress measurement parameters were found to be strongly correlated with the tensile moduli and structural parameters (as determined by X-ray diffraction). In this study, the relationships between the tensile properties, Raman scattering, and structural parameters of carbon fibers were elucidated. As a result, the tensile modulus and structural parameters can be roughly predicted using the Raman scattering parameters. We believe that these correlations can be generalized to several types of PAN- and pitch-based carbon fibers, and that these findings can be employed as a tool for non-destructive evaluation in the inspection and reliability assessment of carbon fiber composites (high-strength PAN-based carbon fibers are the dominant material used as reinforcements in composites in high-load-bearing components, such as the bodies of airplanes and automobiles. The high-modulus PAN-based and high-modulus pitch-based carbon fibers are the dominant materials in high-stiffness components, such as the bodies of spacecrafts and industrial robotics. The high-ductility pitch-based carbon fibers are the dominant materials as hybrid media in high-elongation components).

4. Conclusions

A Raman scattering analysis was performed for tensile testing on commercially available high-strength PAN-based, high-modulus PAN-based, high-modulus pitch-based, and high-ductility pitch-based single carbon fibers. The results are summarized as follows.
(1)
The Raman scattering parameters and ratios for the G- and D-bands (peak values of Raman shifts RG, RD, full widths at half maximum FWHMG, FWHMD, intensity ratio ID/IG, peak value ratio RD/RG, and full widths at half maximum ratio FWHMD/FWHMG) were categorized according to the PAN-based and pitch-based carbon fibers and correlated with the tensile modulus E, interlayer spacing d002, lattice spacing d10, crystalline size, Lc and La. In addition, a linear relationship was observed between the Raman scattering parameters and ratios and E, d002, and d10. A linear relationship was also observed between ratios La and LC on a log–log scale. The lines for PAN-based and pitch-based carbon fibers intersected at 400–600 GPa.
(2)
The Raman stress measurement parameters and ratios for the G- and D-bands (peak values’ slopes |AG|, |AD|, peak value intercepts BG, BD, slope ratio AD/AG, and intercept ratio BD/BG) were categorized for PAN-based and pitch-based carbon fibers and correlated with the tensile modulus E, interlayer spacing d002, lattice spacing d10, crystalline size, Lc and La. In addition, a linear relationship was observed between the Raman stress measurement parameters and ratios and E, d002, and d10, as well as between these parameters and ratios and La and LC on the log–log scale. The lines for PAN-based and pitch-based carbon fibers intersected at 400–600 GPa.
(3)
All the Raman scattering and stress measurement parameters were found to be strongly correlated with the tensile modulus and structural parameters (as determined by X-ray diffraction). The tensile modulus and structural parameters could be roughly predicted from Raman scattering parameters. These correlations could be generalized to several types of PAN- and pitch-based carbon fibers, and these findings could be employed as a tool for non-destructive evaluation in the inspection and reliability assessment of carbon fiber composites.

Supplementary Materials

The following supporting information can be downloaded at: https://www.mdpi.com/article/10.3390/fib12100088/s1, Figure S1: SEM micrographs of transverse cross-sectional views for the tensile fractured surfaces of the high strength PAN-based ((a) T1000GB and (b) T700SC), high modulus PAN-based ((c) M60JB), high modulus pitch-based ((d) K13D), and high ductility pitch-based ((e) XN-05) carbon fibers; Table S1: Physical, structure, tensile, and Raman properties of high-strength PAN-based (T300, T800SC, T800HB, IMS60, and TR50S), high-modulus PAN-based (M40B and UM55), and high-modulus pitch-based (K135, K13C, XN-60, and XN-90) carbon fibers.

Author Contributions

K.N.: Conceptualization, Methodology, Software, Validation, Formal analysis, Investigation, Resources, Data curation, Writing—original draft, Writing—review and editing, Visualization, Supervision. C.N.: Software, Validation, Formal analysis, Investigation, Data curation, Writing—review and editing, Visualization. All authors have read and agreed to the published version of the manuscript.

Funding

This paper is based on results obtained from a future pioneering project commissioned by the New Energy and Industrial Technology Development Organization (NEDO) and innovative science and technology initiative for security projects (JPJ004596) commissioned by the Acquisition, Technology & Logistics Agency (ATLA).

Data Availability Statement

The datasets supporting the conclusions of this article are included within the article.

Conflicts of Interest

The authors declare no potential conflicts of interest with respect to the research, authorship, and/or publication of this article.

References

  1. Fitzer, E. PAN-based carbon fibers-Present state and trend of the technology from the viewpoint of possibilities and limits to influence and to control the fiber properties by the process parameters. Carbon 1989, 27, 621–645. [Google Scholar] [CrossRef]
  2. Chand, S. Review-Carbon fibers for composites. J. Mater. Sci. 2000, 35, 1303–1313. [Google Scholar] [CrossRef]
  3. Naito, K.; Tanaka, Y.; Yang, J.M.; Kagawa, Y. Tensile properties of ultrahigh strength PAN-based, ultrahigh modulus pitch-based and high ductility pitch-based carbon fibers. Carbon 2008, 46, 189–195. [Google Scholar] [CrossRef]
  4. Naito, K.; Tanaka, Y.; Yang, J.M.; Kagawa, Y. The effect of gauge length on tensile strength and Weibull modulus of polyacrylonitrile (PAN)- and pitch-based carbon fibers. J. Mater. Sci. 2012, 47, 632–642. [Google Scholar] [CrossRef]
  5. Naito, K.; Tanaka, Y.; Yang, J.M. Transverse compressive properties of polyacrylonitrile (PAN)-based and pitch-based single carbon fibers. Carbon 2017, 118, 168–183. [Google Scholar] [CrossRef]
  6. Naito, K. Stress analysis and fracture toughness of notched polyacrylonitrile (PAN)-based and pitch-based single carbon fibers. Carbon 2018, 126, 346–359. [Google Scholar] [CrossRef]
  7. Shioya, M.; Takaku, A. Characterization of crystallites in carbon fibres by wide-angle X-ray diffraction. J. Appl. Cryst. 1989, 22, 222–230. [Google Scholar] [CrossRef]
  8. Takaku, A.; Shioya, M. X-ray measurements and the structure of polyacrylonitrile- and pitch-based carbon fibres. J. Mater. Sci. 1990, 25, 4873–4879. [Google Scholar] [CrossRef]
  9. Perret, R.; Ruland, W. Single and multiple X-ray small-angle scattering of carbon fibres. J. Appl. Crystallogr. 1969, 2, 209–218. [Google Scholar] [CrossRef]
  10. Shioya, M.; Takaku, A. Disorder in the layer stacking in carbon fibers. Carbon 1990, 28, 165–168. [Google Scholar] [CrossRef]
  11. Paris, O.; Loidl, D.; Peterlik, H.; Muller, M.; Lichtenegger, H.; Fratzl, P. The internal structure of single carbon fibers determined by simultaneous small-and wide-angle scattering. J. Appl. Crystallogr. 2000, 33, 695–699. [Google Scholar] [CrossRef]
  12. Johnson, D.J.; Crawford, D.; Jones, B.F. Observations of a three-phase structure in high-modulus PAN-based carbon fibres. J. Mater. Sci. 1973, 8, 286–290. [Google Scholar] [CrossRef]
  13. Guigon, M.; Oberlin, A.; Desarmot, G. Microtexture and structure of some high tensile strength, PAN-base carbon fibres. Fibre Sci. Technol. 1984, 20, 55–72. [Google Scholar] [CrossRef]
  14. Guigon, M.; Oberlin, A.; Desarmot, G. Microtexture and structure of some high-modulus, PAN-base carbon fibres. Fibre Sci. Technol. 1984, 20, 177–198. [Google Scholar] [CrossRef]
  15. Melanitis, N.; Tetlow, P.L.; Galiotis, C. Characterization of PAN-based carbon fibres with laser Raman spectroscopy. J. Mater. Sci. 1996, 31, 851–860. [Google Scholar] [CrossRef]
  16. Hao, X.; Lu, Y.; Zhao, W.; Qin, X. The effect of heat treatment temperature and time on the microstructure and mechanical properties of PAN-based carbon fibers. J. Mater. Sci. 2014, 49, 794–804. [Google Scholar] [CrossRef]
  17. Qian, X.; Wang, X.; Zhong, J.; Zhi, J.; Heng, F.; Zhang, Y.; Son, S. Effect of fiber microstructure studied by Raman spectroscopy upon the mechanical properties of carbon fibers. J. Raman Spectrosc. 2019, 50, 665–673. [Google Scholar] [CrossRef]
  18. Frank, O.; Tsoukleri, G.; Riaz, I.; Papagelis, K.; Parthenios, J.; Ferrari, A.C.; Geim, A.K.; Novoselov, K.S.; Galiotis, C. Development of a universal stress sensor for graphene and carbon fibres. Nat. Commun. 2011, 2, 255. [Google Scholar] [CrossRef]
  19. Tuinstra, F.; Koenig, J.L. Characterization of graphite fiber surfaces with Raman spectroscopy. J. Compos. Mater. 1970, 4, 492–499. [Google Scholar] [CrossRef]
  20. Okuda, H.; Young, R.J.; Wolverson, D.; Tanaka, F.; Yamamoto, G.; Okabe, T. Investigating nanostructures in carbon fibres using Raman spectroscopy. Carbon 2018, 130, 178–184. [Google Scholar] [CrossRef]
  21. Tuinstra, F.; Koenig, J.L. Raman spectrum of graphite. J. Chem. Phys. 1970, 53, 1126–1130. [Google Scholar] [CrossRef]
  22. Mitra, V.K.; Risen, W.M., Jr.; Baughman, R.H. A laser Raman study of the stress dependence of vibrational frequencies of a monocrystalline polydiacetylene. J. Chem. Phys. 1977, 66, 2731–2736. [Google Scholar] [CrossRef]
  23. Wang, Y.; Alsmeyer, D.C.; McCreery, R.I. Raman spectroscopy of carbon materials: Structural basis of observed spectra. Chem. Mater. 1990, 2, 557–563. [Google Scholar] [CrossRef]
  24. Ferrari, A.C.; Robertson, J. Interpretation of Raman spectra of disordered and amorphous carbon. Phys. Rev. B 2000, 61, 14095. [Google Scholar] [CrossRef]
  25. Huang, Y.; Young, R.J. Effect of fibre microstructure upon the modulus of PAN and pitch-based carbon fibres. Carbon 1995, 33, 97–107. [Google Scholar] [CrossRef]
  26. Galiotis, C.; Batchelder, D.N. Strain dependences of the first- and second-order Raman spectra of carbon fibres. J. Mater. Sci. Lett. 1988, 7, 545–547. [Google Scholar] [CrossRef]
  27. Robinson, I.M.; Zakikhani, M.; Day, R.J.; Young, R.J.; Galiotis, C. Strain dependence of the Raman frequencies for different types of carbon fibres. J. Mater. Sci. Lett. 1987, 6, 1212–1214. [Google Scholar] [CrossRef]
  28. Sakata, H.; Dresselhaus, G.; Dresselhaus, M.S.; Enda, M. Effect of uniaxial stress on the Raman spectra of graphite fibers. J. Appl. Phys. 1988, 63, 2769–2772. [Google Scholar] [CrossRef]
  29. Washer, G.G.; Blum, F., Jr. Raman spectroscopy for the nondestructive testing of carbon fiber. Adv. Mater. Sci. Eng. 2009, 2008, 693207. [Google Scholar] [CrossRef]
  30. ASTM C1557-20; Standard Test Method for Tensile Strength and Young’s Modulus of Fibers. American Society for Testing and Materials: West Conshohocken, PA, USA, 2020. [CrossRef]
  31. Kumar, S.; Anderson, D.P.; Crasto, A.S. Carbon fibre compressive strength and its dependence on structure and morphology. J. Mater. Sci. 1993, 28, 423–439. [Google Scholar] [CrossRef]
  32. Johnson, W. The structure of PAN based carbon fibres and relationship to physical properties. In Strong Fibers; Watt, W., Perov, B.V., Eds.; Elsevier: Amsterdam, The Netherlands, 1985; Volume 1, pp. 389–443. [Google Scholar]
  33. Wagner, H.H.; Amer, M.S.; Schadler, L.S. Residual compression stress profile in high-modulus carbon fiber embedded in isotactic polypropylene by micro-Raman spectroscopy. Appl. Compos. Mater. 2000, 7, 209–217. [Google Scholar] [CrossRef]
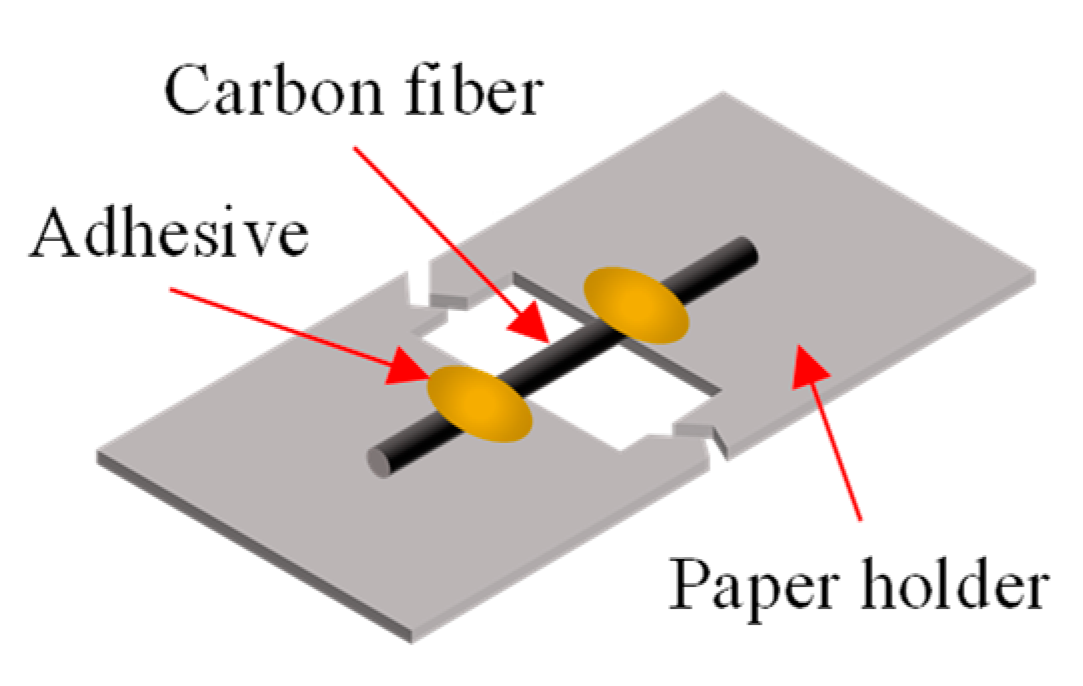
Figure 1. Tensile test specimen of the carbon fiber.
Fibers 12 00088 g001
Figure 2. Raman spectra of PAN-based and pitch-based single carbon fibers: (a) T1000GB, T700SC, and M60JB PAN-based carbon fibers; (b) K13D and XN-05 pitch-based carbon fibers.
Fibers 12 00088 g002
Figure 3. Raman scattering parameters as a function of tensile moduli of PAN-based and pitch-based carbon fibers: (a) RG vs. E; (b) RD vs. E; (c) FWHMG vs. E; (d) FWHMD vs. E.
Fibers 12 00088 g003aFibers 12 00088 g003b
Figure 4. X-ray diffraction curves for high-strength PAN-based ((a) T1000GB and (b) T700SC), high-modulus PAN-based ((c) M60JB), high-modulus pitch-based ((d) K13D), and high-ductility pitch-based ((e) XN-05) carbon fiber bundles in the 0° (equatorial), 70°, and 90° (meridional) scans.
Fibers 12 00088 g004aFibers 12 00088 g004b
Figure 5. Peak Raman shift (G-band) as a function of structural parameters of PAN-based and pitch-based carbon fibers: (a) RG vs. d002; (b) RG vs. d10; (c) RG vs. Lc; (d) RG vs. La.
Fibers 12 00088 g005
Figure 6. Peak Raman shift (D-band) as a function of structural parameters of PAN-based and pitch-based carbon fibers: (a) RD vs. d002; (b) RD vs. d10; (c) RD vs. Lc; (d) RD vs. La.
Fibers 12 00088 g006
Figure 7. Full width at half maximum of G as a function of structural parameters of PAN-based and pitch-based carbon fibers: (a) FWHMG vs. d002; (b) FWHMG vs. d10; (c) FWHMG vs. Lc; (d) FWHMG vs. La.
Fibers 12 00088 g007aFibers 12 00088 g007b
Figure 8. Full width at half maximum of D as a function of structural parameters of PAN-based and pitch-based carbon fibers: (a) FWHMD vs. d002; (b) FWHMD vs. d10; (c) FWHMD vs. Lc; (d) FWHMD vs. La.
Fibers 12 00088 g008
Figure 9. Raman scattering ratio as a function of tensile modulus of PAN-based and pitch-based carbon fibers: (a) ID/IG vs. E; (b) RD/RG vs. E; (c) FWHMD/FWHMG vs. E.
Fibers 12 00088 g009
Figure 10. Raman intensity ratio as a function of structural parameters of PAN-based and pitch-based carbon fibers: (a) ID/IG vs. d002; (b) ID/IG vs. d10; (c) ID/IG vs. Lc; (d) ID/IG vs. La.
Fibers 12 00088 g010
Figure 11. Peak Raman shift ratio as a function of structural parameters of PAN-based and pitch-based carbon fibers: (a) RD/RG vs. d002; (b) RD/RG vs. d10; (c) RD/RG vs. Lc; (d) RD/RG vs. La.
Fibers 12 00088 g011
Figure 12. Full width at half maximum ratio as a function of structural parameters of PAN-based and pitch-based carbon fibers: (a) FWHMD/FWHMG vs. d002; (b) FWHMD/FWHMG vs. d10; (c) FWHMD/FWHMG vs. Lc; (d) FWHMD/FWHMG vs. La.
Fibers 12 00088 g012aFibers 12 00088 g012b
Figure 13. In situ Raman stress measurement of PAN-based and pitch-based carbon fibers: (a) RG vs. σ; (b) RD vs. σ.
Fibers 12 00088 g013
Figure 14. Raman stress measurement parameters as a function of tensile moduli of PAN-based and pitch-based carbon fibers: (a) |AG| vs. E; (b) |AD| vs. E; (c) BG vs. E; (d) BD vs. E.
Fibers 12 00088 g014aFibers 12 00088 g014b
Figure 15. Raman stress measurement parameter |AG| as a function of structural parameters of PAN-based and pitch-based carbon fibers: (a) |AG| vs. d002; (b) |AG| vs. d10; (c) |AG| vs. Lc; (d) |AG| vs. La.
Fibers 12 00088 g015aFibers 12 00088 g015b
Figure 16. Raman stress measurement parameter |AD| as a function of structural parameters of PAN-based and pitch-based carbon fibers: (a) |AD| vs. d002; (b) |AD| vs. d10; (c) |AD| vs. Lc; (d) |AD| vs. La.
Fibers 12 00088 g016
Figure 17. Raman stress measurement parameter AD/AG as a function of tensile modulus of PAN-based and pitch-based carbon fibers.
Fibers 12 00088 g017
Figure 18. Raman stress measurement parameter AD/AG as a function of structural parameters of PAN-based and pitch-based carbon fibers: (a) AD/AG vs. d002; (b) AD/AG vs. d10; (c) AD/AG vs. Lc; (d) AD/AG vs. La.
Fibers 12 00088 g018aFibers 12 00088 g018b
Table 1. Physical, structural, tensile, and Raman properties of high-strength PAN-based (T1000GB and T700SC), high-modulus PAN-based (M60JB), high-modulus pitch-based (K13D), and high-ductility pitch-based (XN-05) carbon fibers.
High-Strength
PAN-Based
High-Modulus PAN-BasedHigh-Modulus Pitch-BasedHigh-Ductility Pitch-Based
T1000GBT700SCM60JBK13DXN-05
Density *1
ρf (g/cm3)
1.801.801.932.201.65
Tensile modulus *1
E (GPa)
29423058893554
Tensile strength
σf (GPa)
7.71 *2
(0.88)
5.60
(0.67)
4.60 *2
(0.56)
4.00 *2
(0.82)
1.34 *2
(0.17)
Diameter
df (μm)
5.03
(0.23)
6.97
(0.52)
5.13
(0.37)
11.72
(0.36)
9.64
(0.45)
Interlayer spacing
d002 (nm)
0.350 *30.348 *30.343 *30.338 *30.352 *3
Lattice spacing
d10 (nm)
0.2100.2090.2130.2140.208
Crystallite size
Lc (nm)
2.014 *32.033 *37.236 *319.159 *31.838 *3
Crystalline size
La (nm)
5.3314.79729.47448.1815.440
Peak Raman shift (G-band)
RG (cm−1)
1594.5
(1.1)
1595.7
(0.9)
1582.2
(0.6)
1581.5
(0.5)
1597.5
(0.2)
Peak Raman shift (D-band)
RD (cm−1)
1357.0
(1.2)
1360.9
(1.3)
1350.0
(0.8)
1349.1
(0.8)
1348.2
(0.3)
G-band full width at half maximum FWHMG (cm−1)87.4
(2.4)
88.1
(3.4)
25.2
(0.5)
18.0
(0.6)
66.4
(0.5)
D-band full width at half maximum FWHMD (cm−1)176.7
(3.6)
188.7
(3.8)
34.4
(0.6)
45.9
(4.2)
68.1
(0.5)
Peak Raman shift ratio
RD/RG
0.8510.8530.8530.8530.844
Full width at
half maximum ratio
FWHMD/FWHMG
2.0232.1421.3672.5451.027
Intensity ratio
ID/IG
0.911
(0.014)
0.959
(0.032)
0.390
(0.018)
0.106
(0.029)
1.467
(0.109)
Slope, AG
Slope, AD
−1.399
−1.299
−2.067
−1.954
−2.337
−1.795
−1.840
−0.919
−3.234
−3.273
Intercept BG (cm−1)
Intercept BD (cm−1)
1594.5
1357.0
1594.5
1361.1
1581.5
1349.8
1580.6
1349.3
1597.6
1348.7
Slope ratio
AD/AG
0.9290.9460.7680.4991.011
Intercept ratio
BD/BG
0.8510.8540.8540.8540.844
*1 Producer’s data sheet T1000GB, T700SC, and M60JB: Catalog for TORAYCA, Toray Industries, Inc. (Toray), High performance carbon fiber Torayca in Japanese. 2004. K13D: Catalog for Carbon Fiber Tow (Continuous Fiber), Mitsubishi Chemical Corp., DIALEAD. 2022. XN-05: Catalog for GRANOC Yarn, Nippon Graphite Fiber Corp. (NGF), Technical data XN and XNL. *2 Single fiber tensile data (5 mm gage length, corrected for machine compliance) from previous investigation [4,5]. The values that do not include footnotes have been obtained through the same method in accordance with ASTM C1557 [30]. *3 X-ray diffraction (XRD) data from previous investigation [6]. The values that do not include footnotes have been obtained through the same method. ( ) indicates standard deviations.
Disclaimer/Publisher’s Note: The statements, opinions and data contained in all publications are solely those of the individual author(s) and contributor(s) and not of MDPI and/or the editor(s). MDPI and/or the editor(s) disclaim responsibility for any injury to people or property resulting from any ideas, methods, instructions or products referred to in the content.