Article

The Production of Ultra-Thin Polyethylene-Based Carbon Fibers out of an “Islands-in-the-Sea” (INS) Precursor

1
Institut für Textiltechnik, RWTH Aachen University, 52074 Aachen, Germany
2
Non-Metallic Research Center (NRC), Aramco Overseas Company, Rueil-Malmaison, 92852 Paris, France
*
Author to whom correspondence should be addressed.
Fibers 2023, 11(9), 75; https://doi.org/10.3390/fib11090075
Submission received: 5 July 2023 / Revised: 23 August 2023 / Accepted: 1 September 2023 / Published: 8 September 2023
(This article belongs to the Special Issue Fibers 10th Anniversary: Past, Present, and Future)

Abstract

:
Carbon fibers (CF) and their composites (CC) are one of the world’s most promising and avant-garde high-performance materials, as they combine excellent mechanical characteristics with high weight reduction potential. Polyethylene (PE) is the perfect alternative precursor for CF as it combines widespread availability, low cost, high carbon content, and, most importantly, precursor fibers that can be produced via melt-spinning. PE-based CF production involves a challenging and time-consuming diffusion-limited chemical stabilization step. The work presented in this article tackles the challenge of reducing the chemical stabilization process time by converting a bicomponent island-in-the-sea fiber, consisting of PA6 as sea matrix and HDPE as island material, into an ultra-thin PE-precursor fiber. The produced precursor fiber is then successfully converted into an ultra-thin PE-based CF through sulfonation and subsequent carbonization in a continuous set-up. The resulting CF has a smooth surface with no observable surface defects and a filament diameter of around 3 µm. The successful conversion to ultra-thin CF is shown in both batch and continuous processes. Additionally, a reduction in sulfonation reaction time from 4 h to 3 h is achieved.

1. Introduction

Carbon fibers (CF) are among the most promising high-performance materials due to their excellent mechanical properties and low density. When compared to steel, carbon fiber reinforced composites can achieve a weight reduction of 45–80% [1]. The aerospace industry heavily relies on these characteristics and is willing to pay the current high cost of commercial carbon fibers, making it the largest consumer of carbon fibers worldwide, based on the monetary market size [2,3,4,5]. Meanwhile the wind energy sector has taken over as the biggest end-use market overall for carbon fibers [5]. Carbon composites (CC) are also extremely interesting for the automotive industry due to their excellent mechanical properties and potential for weight reduction, which can make survival cells for cars up to eight times lighter and safer than conventional cells [6].
However, the widespread implementation of carbon fibers in the automotive industry and other applications is hindered by their high cost. Currently, commercially available carbon fibers used in the automotive industry have an average price range of 15–25 € per kilogram [7,8]. Many experts consider a fiber price below 10 €/kg as the turning point for mass production of carbon fibers and their composites [9,10]. Currently, over 96% of global carbon fiber production is based on polyacrylonitrile (PAN) precursors [11]. The main cost driver in the production of PAN-based carbon fibers is the production of the precursor by the wet-spinning process, which accounts for about 50% of the total production costs [12]. To overcome this hurdle, alternative precursor fibers can be explored to reduce production costs and expand the application areas of carbon fibers across industries. Polyethylene (PE), a polyolefin, is a promising candidate as an alternative precursor material.
PE is the most industrially used thermoplastic polymer, with an annual production exceeding 80 million tons [13]. It has a molecular structure with no heteroatoms apart from hydrogen, and a carbon content of approximately 86%. These characteristics suggest that PE could achieve better carbon fiber yields than PAN, with carbon yields of up to 70% reported in the literature [14]. PE can be melt spun at a low cost and at speeds of up to 6000 m/min [15,16]. Analogues to PAN, PE must be also stabilized before carbonization. The stabilization involves sulfonation with hot sulfuric acid, which cross-links the PE polymer and prevents the melting of the fibers during the carbonization process. In parallel, desulfonation reactions further stabilize the polymer through the creation of intramolecular carbon double-bonds, which are formed by the degradation of the unstable sulfuric acid groups incorporated in the sulfonation process [16,17,18,19]. Optimizing the sulfonation step is crucial for the successful implementation of PE as a viable and efficient replacement for PAN as a carbon fiber precursor [20]. A recent extensive review on the production of PE-based carbon fibers was published recently by Röding et al. [21].
Using high-density PE (HDPE), carbon fibers have already been produced with a tensile modulus of 178 GPa and 2.53 GPa tensile strength [22,23,24,25]. These results exceed the values determined for tensile modulus and tensile strength by the Department of Energy Vehicles Technology of 172 GPa and 1.72 GPa, respectively, leading to the assumption that such values can be achieved with optimization of the intrinsic reaction and processes. This optimization is crucial for advancing and implementing applications in the automotive industry, in conjunction with reducing the long and intensive sulfonation process and costs [26,27]. In a recent study conducted at the Institut für Textiltechnik of RWTH Aachen University (ITA) in collaboration with industrial partners, a cost model was developed showing that the use of PE as a precursor material could reduce carbon fiber production costs by 51% [28]. In conclusion, there are two main challenges still to be addressed for the industrial production of PE-based carbon fibers and their broader application, as follows:
  • long sulfonation process
  • improvement of the mechanical properties of PE-based carbon fibers
Griffith’s theory delineates that the tensile strength of a fiber is delimited by its biggest defect, and most defects in carbon fibers are created by gas molecules exiting the fiber during carbonization [29]. These defects appear randomly, and their mathematical probability increases with the volume of the fiber [30]. As a result, reducing the diameter of the fiber can decrease its volume and subsequently reduce defects. Consequently, the diameter of the PE precursor must be reduced significantly. The reduction of the filament diameter can also shorten the required time for the successful stabilization of the PE precursor, as the challenging sulfonation step is a diffusion-limited process. Currently, commercially available PAN-based carbon fibers have a diameter of 5–8 μm [31]. PE-based CF conventionally has a filament diameter of 6.9–19.0 μm [21].
To achieve ultra-thin PE precursor fibers with diameters below 5 μm, a bicomponent melt-spinning approach using islands-in-the-sea (INS) fibers is employed. These fibers consist of a sea component, which in this study is polyamide 6 (PA6) due to its solubility in sulfuric acid, and ultra-thin PE islands within it [32,33]. The production process of ultra-thin PE-based carbon fibers differs from that of conventional PE-based carbon fibers, as it requires a dissolution step to isolate the desired ultra-thin PE precursor filaments by removing the PA6 component. A comparison of the individual steps in the production of conventional PE-based and ultra-thin PE-based CF is depicted in Figure 1.
The objective of this study is to assess the feasibility of producing ultra-thin PE-based carbon fibers with a diameter < 4 µm from INS fibers with PA6 as the sea component, to reduce the sulfonation process time. Therefore, the evolution of the fiber morphology and properties will be thoroughly monitored during the dissolution process of the PA6 component as well as during the sulfonation and carbonization steps in both batch and continuous setups. These investigations will provide a comprehensive understanding of the characteristics of the stabilized and carbonized fibers, offering a novel approach to the production of ultra-thin PE-based carbon fibers. Finally, the findings of this study will contribute to advancing the commercial applications of PE-based carbon fibers.

2. Materials and Methods

2.1. Precursor Material

The PA6 used is the Ultramid® B24 N 02, produced by the German company BASF SE, Ludwigshafen. It is suited for fiber production as it allows for high-speed spinning. The polymer is readily available and is primarily used in the textile industry for fiber production.
The polyethylene used is a high-density polyethylene named HDPE MM810, manufactured by SK Global Chemical Co. Ltd., based in Seoul, Republic of Korea. The HDPE is particularly suited for the application of a fiber bond due to its exceptional processability and adhesive characteristics.
The INS precursor is melt-spun and produced by Hills, Inc., Melbourne, FL, USA. Each INS filament consists of a PA6 matrix (40 wt%) and 61 individual PE filaments (60 wt%). These fibers are combined into precursor fibers with 3000 INS filaments, resulting in a total of 183,000 PE-filaments at the ITA. They are then treated with a spin finish, specifically LIMANOL C 167 AS from the company Schill + Seilacher GmbH, Böblingen, Germany. The precursor is referred to as HDPE-INS.

2.2. Stabilization

2.2.1. Batch PA6 Dissolution

First, the produced INS-precursor fibers undergo a pre-treatment step in which the PA6 component (“Sea” component) is dissolved. Dissolution trials are conducted using a batch reactor, as depicted in Figure 2.
The reactor is a double-walled glass structure. The reaction temperature is adjusted by circulating heated silicone oil through the gap between the walls, which is supplied by a heating module. The reactor is filled with one liter of 96% concentrated sulfuric acid. To keep the fibers in place during the reaction, they are held in the acid using a polytetrafluoroethylene (PTFE) piece that guides and secures them. Kynol fiber, manufactured by Kynol Europa GmbH in Hamburg, Germany, is attached to both ends of the INS-precursor fiber due to its superior chemical resistance. This ensures that the INS fiber remains immersed in the acid without rupturing at the PTFE piece’s edges. Additionally, weights are attached to one end of the Kynol fiber to maintain constant tension on the INS fiber. On one side, the Kynol fiber is fixed, while the weights can be attached on the other side. The dissolution of PA6 is investigated under the conditions outlined in Table 1.
The reaction time is varied from 0.5 h to 3.5 h, the temperature ranges from 40 °C to 120 °C, and the fiber tension is adjusted between 0.4 MPa and 1.3 MPa. At each sampling time, the fibers are extracted from the reactor by cutting down the Kynol fibers and pulling out the fiber. These extracted fibers are then wound onto a glass rod and allowed to cool for 10 min. Subsequently, they are immersed in a water bath for 10 min before being air-dried overnight at room temperature.

2.2.2. Batch Sulfonation

The INS-precursor fibers undergo sulfonation after the dissolution of their PA6 component, utilizing the same batch reactor employed for the dissolution process. The experimental setup is depicted in Figure 2. Similar to the dissolution process, Kynol fiber is attached to both ends of the measured PE-precursor fiber to prevent rupturing at the borders of the PTFE piece. Additionally, weights are attached to maintain a defined tension on the PE fiber. The Kynol fibers are fixed on one side, while the weights are attached on the other side. The batch sulfonation trials were conducted under the conditions specified in Table 2.
The reaction time varied from 1 h to 4 h, with tension ranging between 0.4 MPa and 1.3 MPa, while the temperature was maintained at 120 °C. At each sampling point, the sulfonated PE fibers are extracted from the reactor by cutting the Kynol fibers and pulling out the PE fiber. These fibers are then wound onto a glass rod and allowed to cool for 10 min. Subsequently, they are immersed in a water bath for 10 min before being air-dried overnight at room temperature. The sulfonated samples are subjected to analysis using techniques such as TGA, DSC, gas pycnometry, FTIR, single filament tensile tests, and light microscopy.

2.2.3. Continuous Dissolution of PA6 and Sulfonation

In the continuous set-up, the dissolution of PA6 and the sulfonation steps are combined and carried out using a single set-up. The setup consists of four borosilicate tanks mounted on a mobile aluminum structure with an acrylic glass enclosure. Each tank is equipped with a rig mounted on its lid to guide the fibers through the tank. The tanks are connected to a lifting mechanism that allows the fibers and rig to be fully lifted out of the tanks. Two sets of godets are positioned at the entrance and exit of the pilot setup to facilitate the movement of fibers through the tanks. Finally, a winder is placed after the exit godet pair to wind the fibers onto a bobbin. During continuous sulfonation, only two of the tanks are utilized. The second tank is filled with approximately 20 L of 96% concentrated sulfuric acid, while the fourth tank is filled with deionized water. After passing through the treatment tank, the fiber is washed in the water tank. Lastly, the fiber is guided through the final godet duo and wound onto a bobbin. The setup is illustrated in Figure 3. Throughout all zones of the continuous stabilization process, the force on the fiber is manually measured immediately after the treatment tank and after the water tank. The tables below provide the parameters for the two different continuous stabilization trials of the HDPE-INS precursor. Zones A.1 and A.2 refer to the dissolution of PA6, while Zones 1, 2, and 3 correspond to the sulfonation zones. In the trial where PA6 is dissolved at 40 °C, the fiber is pulled in a stretch-controlled manner. In the sulfonation zones, the pulling is force-controlled (Table 3). The continuous sulfonation samples are analyzed using gas pycnometry, FTIR, and light microscopy.
In the trial with the dissolution of PA6 at 60 °C, the fiber pulling is force-controlled in all zones (Table 4).

2.3. Carbonization

2.3.1. Batch Carbonization

The sulfonated fibers are carbonized using a batch set-up, as depicted in Figure 4.
The sulfonated fiber is secured on the right side of the furnace and guided through the furnace. After passing through a metal roll, a weight is attached to the fiber to apply a defined tension during the carbonization process. The carbonization is carried out in an inert atmosphere maintained by flowing N2 gas. The carbonization trials are conducted both batchly and continuously (conti) using sulfonated fibers (Table 5). The batch carbonization trials for the samples from batch sulfonation are carbonized to a maximum temperature of 1000 °C, while a force of 0.07 N, equivalent to a fiber tension of 0.1 MPa, is applied to the fiber during the process. Various maximum temperatures and tensions are employed during the carbonization process to evaluate their impact on the resulting carbon fiber. All samples are subjected to a heating rate of 4 °C/min and maintained at the maximum carbonization temperature for 5 min. The carbonization samples are analyzed using gas pycnometry, FTIR, light microscopy, and electron microscopy.
Additionally, one sample is carbonized in the batch carbonization furnace after undergoing continuous carbonization in the continuous LT furnace. The parameters for this procedure are provided in Table 6.

2.3.2. Continuous Carbonization

The continuous carbonization trials for the fibers obtained from continuous stabilization are conducted in a DC-9 low-temperature (LT) carbonization furnace. This furnace is equipped with five separate temperature zones and has a heating length of 1 m. The fibers are guided and pulled through the furnace by two sets of godets and a winder. A schematic representation of the continuous carbonization furnace is shown in Figure 5.
To create an inert atmosphere, the heating tube of the LT-carbonization furnace is flooded with nitrogen. The gases released during the process are removed at both the entrance and exit of the furnace. The maximum temperature achieved in the LT furnace is 900 °C. In this study, a speed of 0.4 m/min is selected, and the pulling of the fiber is controlled by force to minimize potential damage to the fiber. The parameters for the continuous LT-furnace carbonization of the fibers obtained from the continuous dissolution of PA6 at 60 °C (zone A.2) and continuous sulfonation at 120 °C (zone 3) are listed in Table 7. The carbonization samples are subjected to analysis using gas pycnometry, FTIR, light microscopy, and electron microscopy.

2.4. Analytical Methods

2.4.1. Gas Pycnometry

Gas pycnometry relies on the principle of density determination through the displacement of gas volume. The specific gas pycnometer employed in this study is the AccuPyc II 1340 by Micromeritics GmbH, Aachen. During the sulfonation reaction of the PE-precursor, two hydrogen atoms (m = 2 u) are substituted with one sulfonic acid group (m = 81 u), increasing the weight of the fiber. This weight increase competes with a more subtle increase in the fiber diameter. As a result, the fiber’s density can serve as an indicator of the degree of sulfonation of the fiber [24].

2.4.2. Fourier-Transformed Infrared (FTIR) Spectroscopy

The Fourier-transformed infrared (FTIR) spectroscopy measurements were conducted using a Nicolet iS 10 from Thermo Scientific Inc., Waltham, MA, USA and an ATR-unit: PIKE MIRacle HATR, Resultec GmbH, Illerkirchen. FTIR spectroscopy allows qualitative statements concerning specific groups in a molecule. The expected relevant vibration bands are summarized in Table 8.

2.4.3. Thermogravimetric Analysis (TGA)

The TGA device used in this study is the STARe System TGA/DSC1 from Mettler Toledo GmbH, Gießen. The temperature range of TGA is usually between room temperature and 800 °C. The atmosphere is N2. The expected reactions in the thermogravimetric analysis of sulfonated PE-precursor fibers are outlined in Table 9.
The percentage of non-cross-linked PE that gets decomposed, at 400–600 °C should lower with a higher sulfonation degree. The sulfonic acid groups are hydrophilic and absorb water. These groups undergo decomposition between 120 °C and 400 °C, releasing SO2. Starting from 600 °C, dehydrogenation reactions occur, resulting in the release of H2 and the carbonization of the fibers [34].

2.4.4. Differential Scanning Calorimetry (DSC)

The dynamic scanning calorimetry (DSC) tests are conducted using a STARe System DSC1 from Mettler Toledo GmbH, Gießen, Germany. In this study, DSC is employed to detect the presence of a melting curve within the melting temperature range of PA6 (Tmelt ≈ 220 °C). This analysis helps assess whether the PA6 component is effectively dissolved from the INS-PA6/PE precursor fibers.

2.4.5. Light Microscopy

The used microscope is a Leica DM 4000 M from Leica Microsystems GmbH, Wetzlar, Germany. The microscope makes use of the LAS V4.12 software. To prepare the samples, the fibers are embedded in a resin and cross-sectional samples are cut out. The illumination allows for the observation of potential core-shell structures in the sulfonated fibers [39].

2.4.6. Electron Microscopy

The electron microscope makes use of scanning electron microscopy (SEM) technology. The model used is a Jeol JSM-6400 Scanning Electron Microscope from JEOL Ltd., Tokyo (Japan). SEM provides higher depth resolution compared to light microscopy, enabling clearer identification of pores or defects in the analyzed PE-based carbon fibers [40].

3. Results and Discussion

3.1. Development of a Concept for Ultra-Thin CF Production—Batch Analysis

3.1.1. Dissolution of PA6

In this section, the parameters for the dissolution of PA6 (sea component) from the HDPE-INS precursor are investigated. The parameters analyzed include sulfuric acid concentration, reaction temperature, and reaction time. The decision criterion is the temperature dependency of the phase change observed through DSC analysis. This criterion allows the investigation of whether PA6 is dissolved or still present on the fiber after treatment with H2SO4.
Both 15% and 96% sulfuric acid solutions are tested as dissolution media by immersing the HDPE-INS precursor for 3.5 h at 80 °C. The DSC analysis, shown in Figure 6, shows that the PA6-related peak (melting peak of PA6 at 220 °C) is non-existent for the sample treated in 96% concentrated sulfuric acid, thus determining it as the ideal dissolution medium for the PA6 component of the HDPE-INS precursor.
The next trials involve a temperature and reaction time screening with the HDPE-INS precursor. Initially, the dissolution of the PA6 component is tested at various temperatures: 40 °C, 60 °C, 80 °C, 100 °C and 120 °C. These tests are conducted in a batch reactor with an applied fiber tension of 0.4 MPa. Samples of the fiber are collected after 0.5 h, 1.5 h, 2.5 h and 3.5 h of treatment. Exemplary, Figure 7 presents the comparative DSC curves of the samples treated at 40 °C. The remaining DSC curves for the dissolution of PA6 at 60 °C (Figure A1), 80 °C (Figure A2), 100 °C (Figure A3) and 120 °C (Figure A4) can be found in the Appendix A.
The DSC analysis (Figure 7) reveals that the HDPE melting peak at 130 °C is present in the curves of all treated samples. When compared to the DSC curve of the HDPE-INS precursor, the DSC curves of the samples treated for 0.5 h and 1.5 h display a slight decrease in the temperature range of 200–220 °C. This decrease may be attributed to the incomplete dissolution of PA6 on the fiber. However, this behaviour is not observed in the remaining samples, indicating that PA6 is successfully dissolved after 2.5 h at 40 °C in 96% concentrated H2SO4.
Considering these results and the desire to select the most efficient combination of temperature and reaction time, considering energy consumption and time considerations, the combinations 40 °C/2–3 h and 60 °C/2–3 h are chosen as the ideal conditions for the dissolution of PA6 in the PE-INS precursors. Dissolutions at higher temperatures (80–120 °C) are faster, but they lead to sulfonation of the PE component, which is indicated by a dark coloration of the fiber samples. Therefore, these temperatures are not suitable for the remaining work as the desired effect at this stage is the isolated dissolution of PA6 rather than the sulfonation of the PE component. Previous experiments have shown that, when both processes are carried out simultaneously, the result is an inhomogeneous stabilization of the PE-filaments and subsequent fiber rupture, which therefore should be avoided.

3.1.2. Sulfonation

After the dissolution of PA6 from the PE-INS precursors, the PE component is exposed and ready for stabilization through sulfonation. The subsequent step involves investigating the batch sulfonation of the fibers obtained from the dissolution process. To this end, the PA6 component of the HDPE-INS precursor is dissolved under four different conditions: 40 °C/2 h, 40 °C/3 h, 60 °C/2 h and 60 °C/3 h. The exposed PE fibers are then subjected to sulfonation trials at 120 °C in 96% concentrated H2SO4, with a fiber tension of 0.4 MPa (equivalent to 0.44 N). The stabilization parameters and the TGA results for the batch sulfonation trials with the HDPE-INS precursor are listed in Table 10.
Starting with the 40/2 samples, a clear descending trend in the mass loss can be observed. The non-cross-linked HDPE related mass loss in the temperature range of 400–600 °C decreases from 70% after 2 h of sulfonation to 34% at 3 h, and finally reaches 20% after 4 h. The total mass loss follows a similar trend, starting at 85% (2 h), decreasing to 63% (3 h), and reaching 53% after 4 h of sulfonation. Conversely, fiber shrinkage shows an opposite trend, increasing from 18% at 2 h of sulfonation to 23% at 3 h, and finally reaching 30% after 4 h sulfonation. The 40/3 samples exhibit the same trend, with non-cross-linked PE mass loss (T = 400–600 °C) of 75%, 32% and 11% for 2 h, 3 h and 4 h of sulfonation, respectively. The total sample mass loss (T = 35–800 °C) is 88%, 62% and 52% for 2 h, 3 h and 4 h of sulfonation, respectively. Fiber shrinkage increases from 18% to 25% and finally to 28%, with increasing sulfonation reaction time.
The 60/2 samples show similar trends, with a non-cross-linked PE-related mass loss of 68% after 2 h, 32% after 3 h, and 13% after 4 h of sulfonation. The total sample mass loss is 88% at 2 h of sulfonation, decreasing to 63% and 51% after 3 h and 4 h of sulfonation, respectively. Fiber shrinkage exhibits the expected reverse trend, starting at 21% (2 h) and increasing to 37% (3 h) and 30% (4 h). Finally, the TGA results for the 60/3 samples show that the mass loss related to non-cross-linked PE (T = 400–600 °C) decreases from 79% (2 h) to 33% (3 h) and 11% (4 h) with increasing sulfonation reaction time. The total mass loss follows a similar trend, starting at 91% (2 h) and decreasing steadily to 63% (3 h) and 53% (4 h). Fiber shrinkage, encompassing both physical and chemical nature (c.f. Section 3.2.2) increases during the reaction, reaching 24% after 2 h and rising to 32% and 37% after 3 h and 4 h sulfonation, respectively.
Of particular interest for the evaluation of the degree of stabilization and cross-linking of the HDPE-INS fibers is the mass loss in the temperature range of 400–600 °C, as this is the range in which non-cross-linked HDPE decomposes and exits the fiber. Therefore, a lower mass loss percentage is more desirable. Consequently, the samples subjected to 4 h of sulfonation exhibit the lowest values. Among these equivalent samples, the combination with the dissolution at 40 °C and 60 °C for 3 h shows the lowest values (11%), followed closely by the 60/2 sample (13%). The 40/2 sample with 4 h of sulfonation has the highest value (20%). Thus, this treatment combination yields the least preferable results at this stage.

3.1.3. Carbonization

The next step is the investigation of the carbonization. The previously stabilized HDPE-INS precursors undergo batch carbonization to assess the overall feasibility of the CF production and investigate the properties and morphology of the resulting CF. The light microscopy images of the four produced CF samples, named 40/2, 40/3, 60/2 and 60/3, are shown in Figure 8.
Electron microscopy is used to analyze the fiber geometry, assess filament fusion and observe possible fiber surface defects. The electron microscopy images of the batch carbonization trials with the HDPE-INS precursor are presented in Figure 9. The 40/2 CF exhibits filaments with no observable defects or melting of single filaments. The 40/3 CF shows no observable defects but has most filaments fused together, with very few isolated CF filaments.
The 60/2 CF displays filaments without observable defects. However, the 60/3 CF has filaments with a considerably higher filament diameter compared to the other CF samples, which could be an indication of oversulfonation [41,42]. None of the CF from the batch carbonization can be successfully analyzed via single filament tensile tests due to their brittleness, making sample preparation for measurement impossible.
Based on the batch analysis, a dissolution reaction time of 2 h is selected as the preferred option. It combines top-notch results in the investigated trials, particularly in the case of the 60/2 samples with shorter reaction times. The 40/2 samples, on the other hand, offer the lowest energy input in the dissolution process while delivering comparable results. Therefore, the HDPE-INS precursor and these two dissolution temperature/reaction time combinations are selected for use in the subsequent trials using a continuous set-up.

3.2. Implementation and Validation of a Concept for Ultra-Thin CF Production—Continuous Analysis

The implementation and validation of the concept for the production of ultra-thin PE-based CF developed in Section 3.1 are carried out in this chapter. To prepare for continuous stabilization and carbonization trials, the HDPE-INS precursor and the selected dissolution parameters are first tested in batch stabilization trials.

3.2.1. Batch Sulfonation with Higher Fiber Tension

In the batch sulfonation trials with increased fiber tension, the dissolution of PA6 and the sulfonation steps are analyzed. The stabilization parameters, TGA and gas pycnometry results are listed in Table 11.
The HDPE-INS precursor has a density of 1.073 ± 0.001 g/cm3. The TGA measurements show a mass loss value of 84% for ΔmPE and 99% for Δmtotal. For the 40/2 samples, the density increases with increasing sulfonation time. The density values are 1.006 ± 0.001 g/cm3 (1 h), 1.044 ± 0.002 g/cm3 (2 h), 1.212 ± 0.002 g/cm3 (3 h) and 1.397 ± 0.002 g/cm3 (4 h). Initially, the density drops below the precursor density due to the dissolution of PA6, which has a higher density (1.12–1.15 g/cm3). After 3 h of sulfonation, the fiber density considerably increases due to cross-linking and integration of sulfuric acid groups. The cross-linking of the polymer chains contributes to the thermal stability of the PE. As the cross-linking increases, the mass loss during TGA decreases, specifically in the temperature range of 400–600 °C. The TGA results of the 40/2 samples reflect this trend, showing a decrease in ΔmPE and Δmtotal values with longer sulfonation time. The values decrease from 83%/98% (1 h) to 76%/92% (2 h), 38%/69% (3 h), and 17%/60% (4 h).
Similarly, the 60/2 samples exhibit an increasing trend in density with increasing sulfonation time. The density values are 1.020 ± 0.001 g/cm3 (1 h), 1.062 ± 0.002 g/cm3 (2 h), 1.235 ± 0.002 g/cm3 (3 h), and 1.416 ± 0.003 g/cm3 (4 h). The dissolution of PA6 at 60 °C appears to result in a higher degree of cross-linking during sulfonation, possibly due to faster dissolution of PA6 or enhanced swelling of the PE filaments due to uptake of sulfur-containing groups. The faster removal of PA6 allows for easier and faster dissolution of sulfuric acid into the PE filaments, leading to higher cross-linking and density values. The TGA analysis of the 60/2 samples shows increasing ΔmPE/Δmtotal values, which are lower than those of the 40/2 sample. The values for the 60/2 sample are: 78%/95% (1 h), 74%/91% (2 h), 42%/70% (3 h) and 19%/58% (4 h).
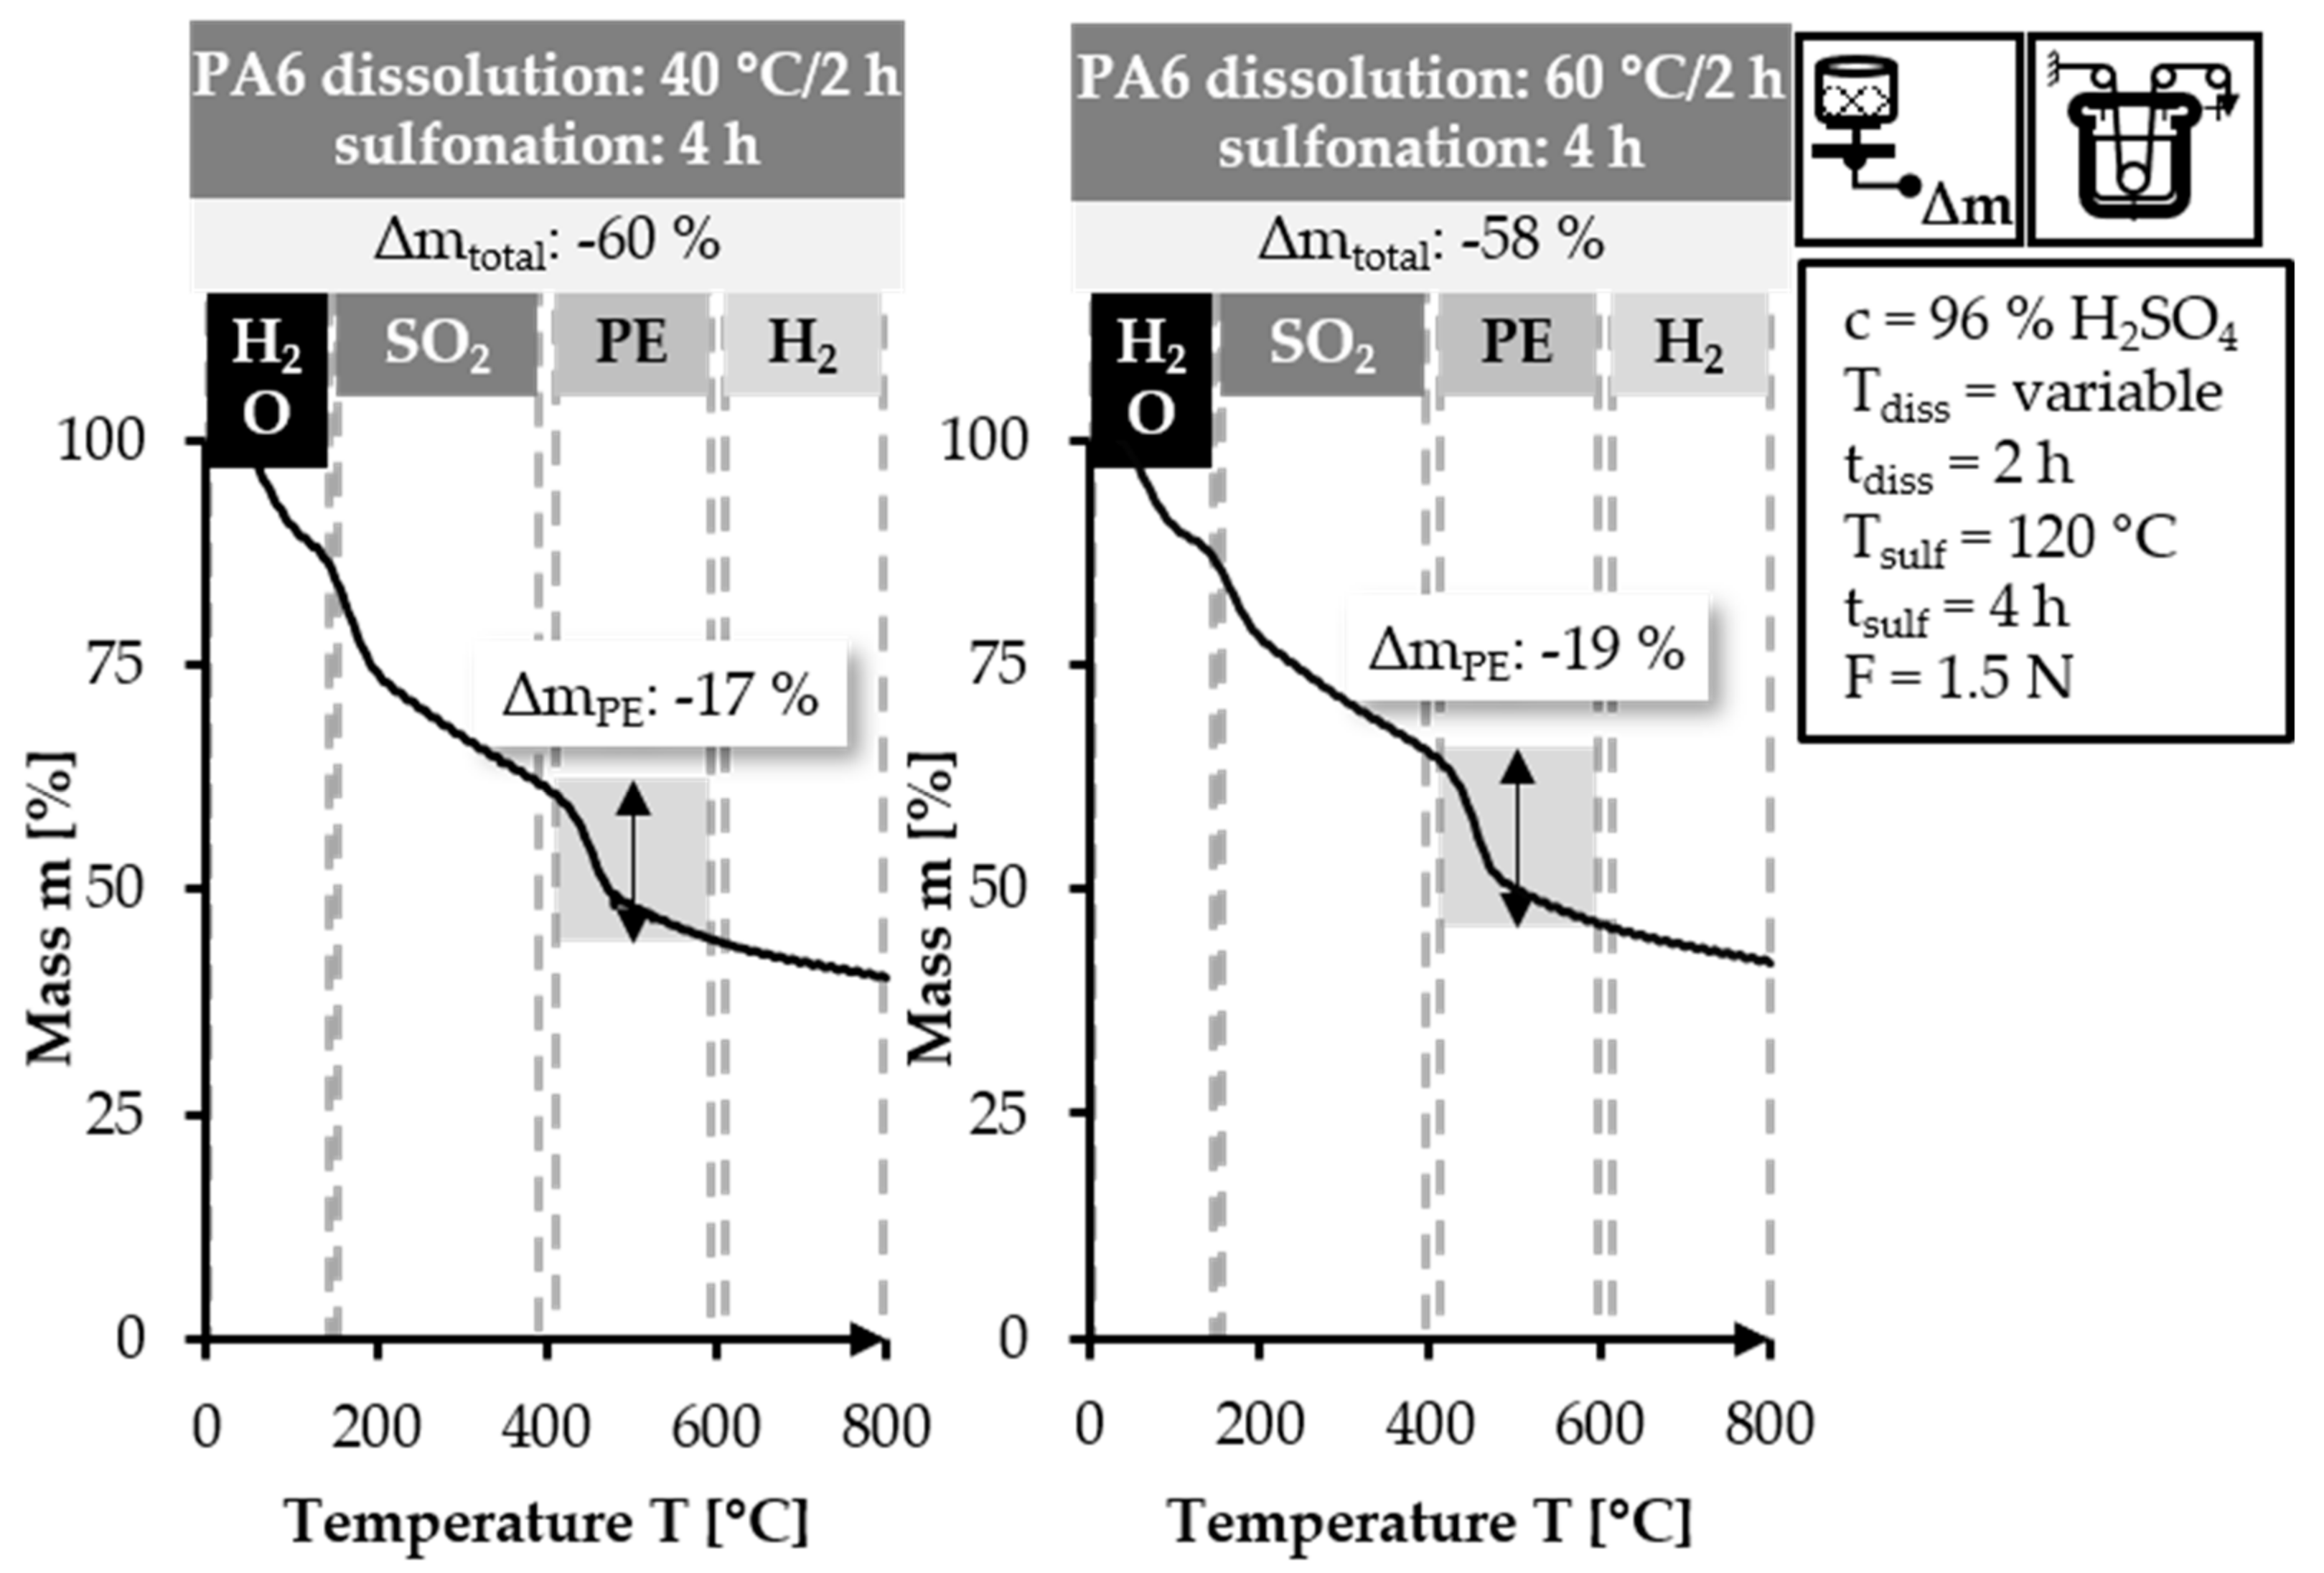
The TGA curves in Figure 10 are similar to each other. The 40/2 sample exhibits a slightly steeper weight loss in the 120–400 °C range. In the temperature range of 400–600 °C, the 40/2 sample has a lower mass loss value (17%) compared to the 60/2 sample (19%). The mass loss in the final temperature range of 600–800 °C is similar in both samples. The two samples shown in Figure 10 have higher values for ΔmPE and Δmtotal than the equivalent samples that are stabilized with lower fiber tension. This is caused by the higher applied fiber tension, which impedes the diffusion of the sulfuric acid into and through the PE filaments [34,38]. This leads to a lower degree of cross-linking levels for the same reaction time and is indicated by higher values for ΔmPE and Δmtotal. Nevertheless, the higher fiber tension is preferred, as it leads to enhanced parallel alignment of the polymer chains and consequently improved mechanical properties.
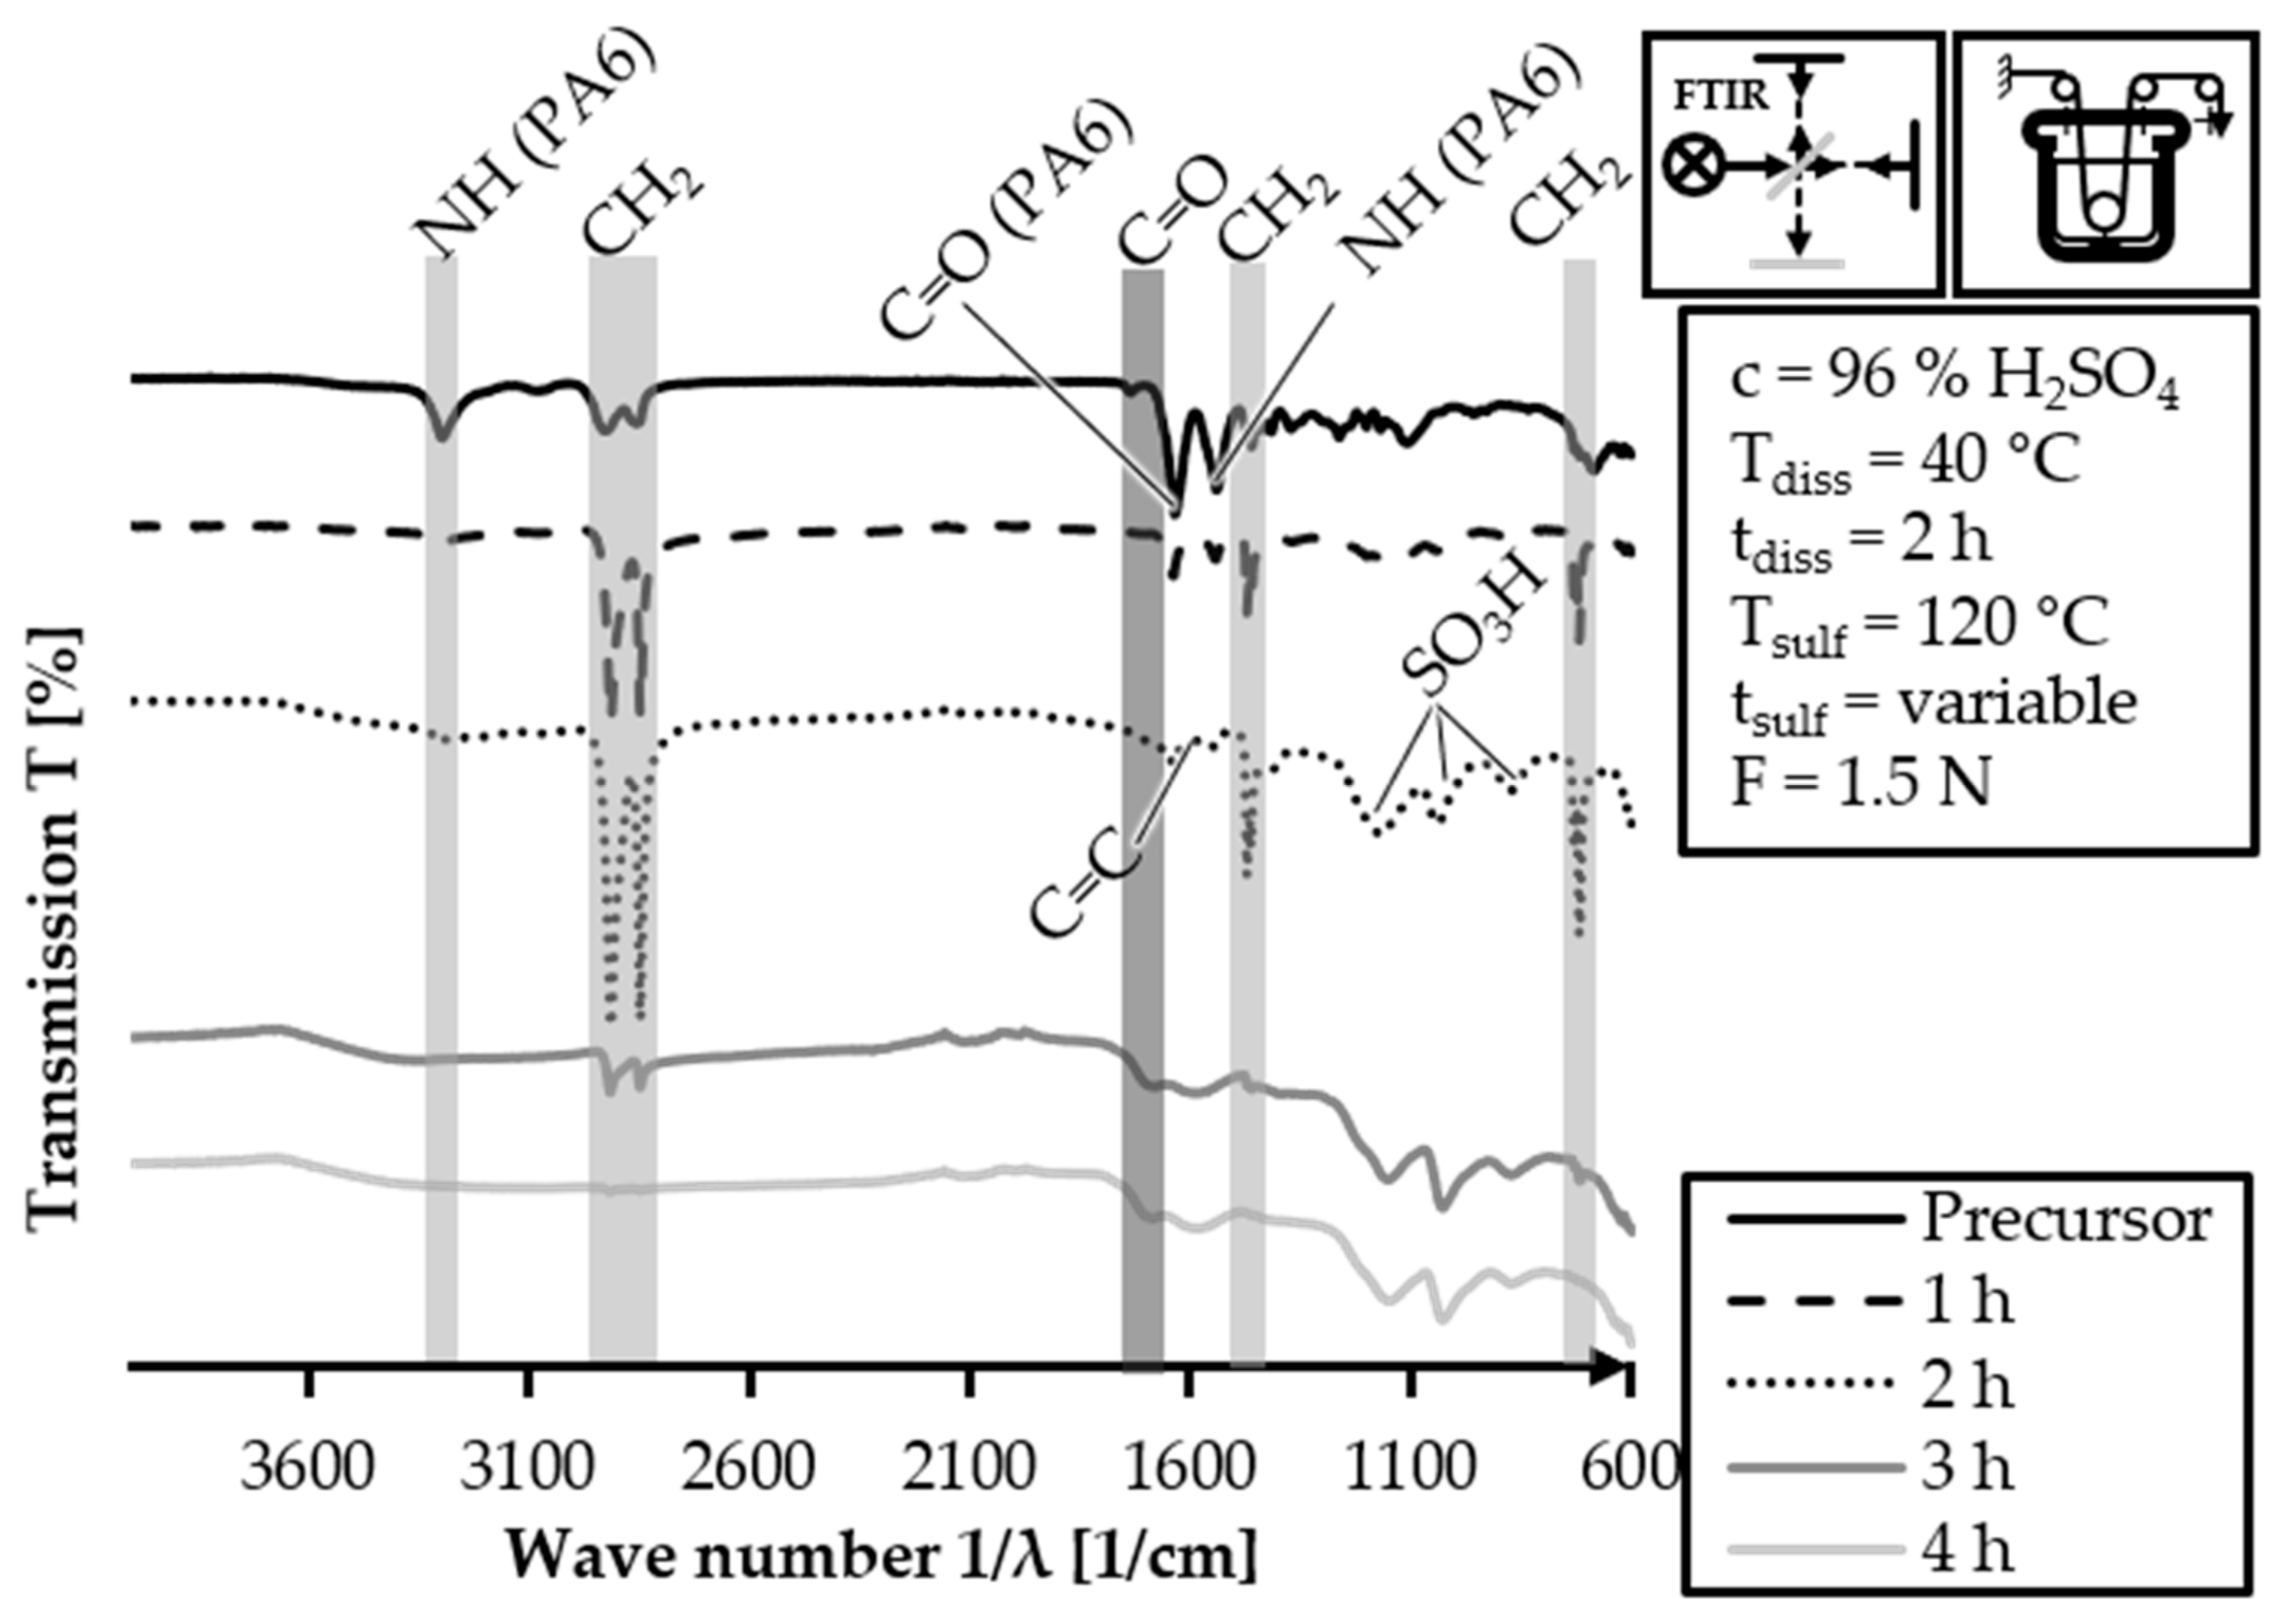
The batch sulfonation trial samples with HDPE-INS are analyzed via FTIR to investigate the evolution of functional groups in the fiber. The FTIR spectra of the HDPE-INS precursor fiber and of the 40/2 samples for different sulfonation times are shown in a stacked manner in Figure 11. The FTIR spectrum of the HDPE-INS precursor exhibits signals related to PE and PA6. The evolution of the structure of sulfonated PE throughout the sulfonation reaction [21] and the resulting FTIR signals [34] have been reported previously in detail in the literature. The PE-related signals appear in the regions of 3000–2840 cm−1 (C-H stretching), 1470–1460 cm−1(CH2 deformation), and 770–720 cm−1 (CH2 deformation). Additionally, PA6-related peaks are observed at 3300 cm−1 (N-H stretching), 1650 cm−1 (C=O stretching) and 1550 cm−1 (N-H stretching). In the spectrum of the 1 h sulfonation sample, the PA6-related peaks are reduced compared to the precursor, but they are still present. This is unexpected since the pretreatment dissolution step should have eliminated any PA6 peaks. However, there is an increase in the intensity of PE-related peaks (3000–2840 cm−1; 1470–1460 cm−1; and 770–720 cm−1) and the appearance of subtle peaks related to sulfones (1150–1050 cm−1: S=O symmetric and asymmetric stretching), indicating the occurrence of sulfonation reactions. In the 2 h sulfonation sample, the PA6-related peaks further diminish in intensity (3300 cm−1; 1650 cm−1; 1550 cm−1), with only very low intensity observed. The alkane-related peaks of PE at 3000–2840 cm−1 (C-H stretching) and 1470–1460 cm−1 (CH2 deformation) become more prominent in this sample. The sulfone-related peak intensities increase (1150–1050 cm−1: S=O symmetric and asymmetric stretching) compared to the 1 h sulfonation sample. In the FTIR spectrum of the 3 h sulfonation sample, the PA6 related peaks are no longer observable. The intensity of the alkane related peaks decreases (3000–2840 cm−1 and 1470–1460 cm−1) compared to the 2 h sulfonation sample, indicating increased cross-linking and sulfonation degree within the fiber. This is demonstrated by the increased intensity of sulfone peaks (1150–1050 cm−1), the appearance of peaks created by the C=C stretching of double bonds in the polymer chains (1620–1570 cm−1), and peaks related to C=O stretching of carboxylic groups (1710–1690 cm−1). The spectrum of the 4 h sulfonation sample shows no peaks related to PA6 and significantly reduced alkane-related peaks (3000–2840 cm−1 and 1470–1460 cm−1). The sulfone related peaks (1150–1050 cm−1), the double bond peaks (1620–1570 cm−1) and the carboxylic group related peak (1710–1690 cm−1) are clearly observable. These results indicate an advanced sulfonation and cross-linking degree within the fiber. Overall, the FTIR analysis confirms the progression of sulfonation and cross-linking reactions during the sulfonation process, leading to the formation of sulfone groups and increased cross-linking within the fiber samples.
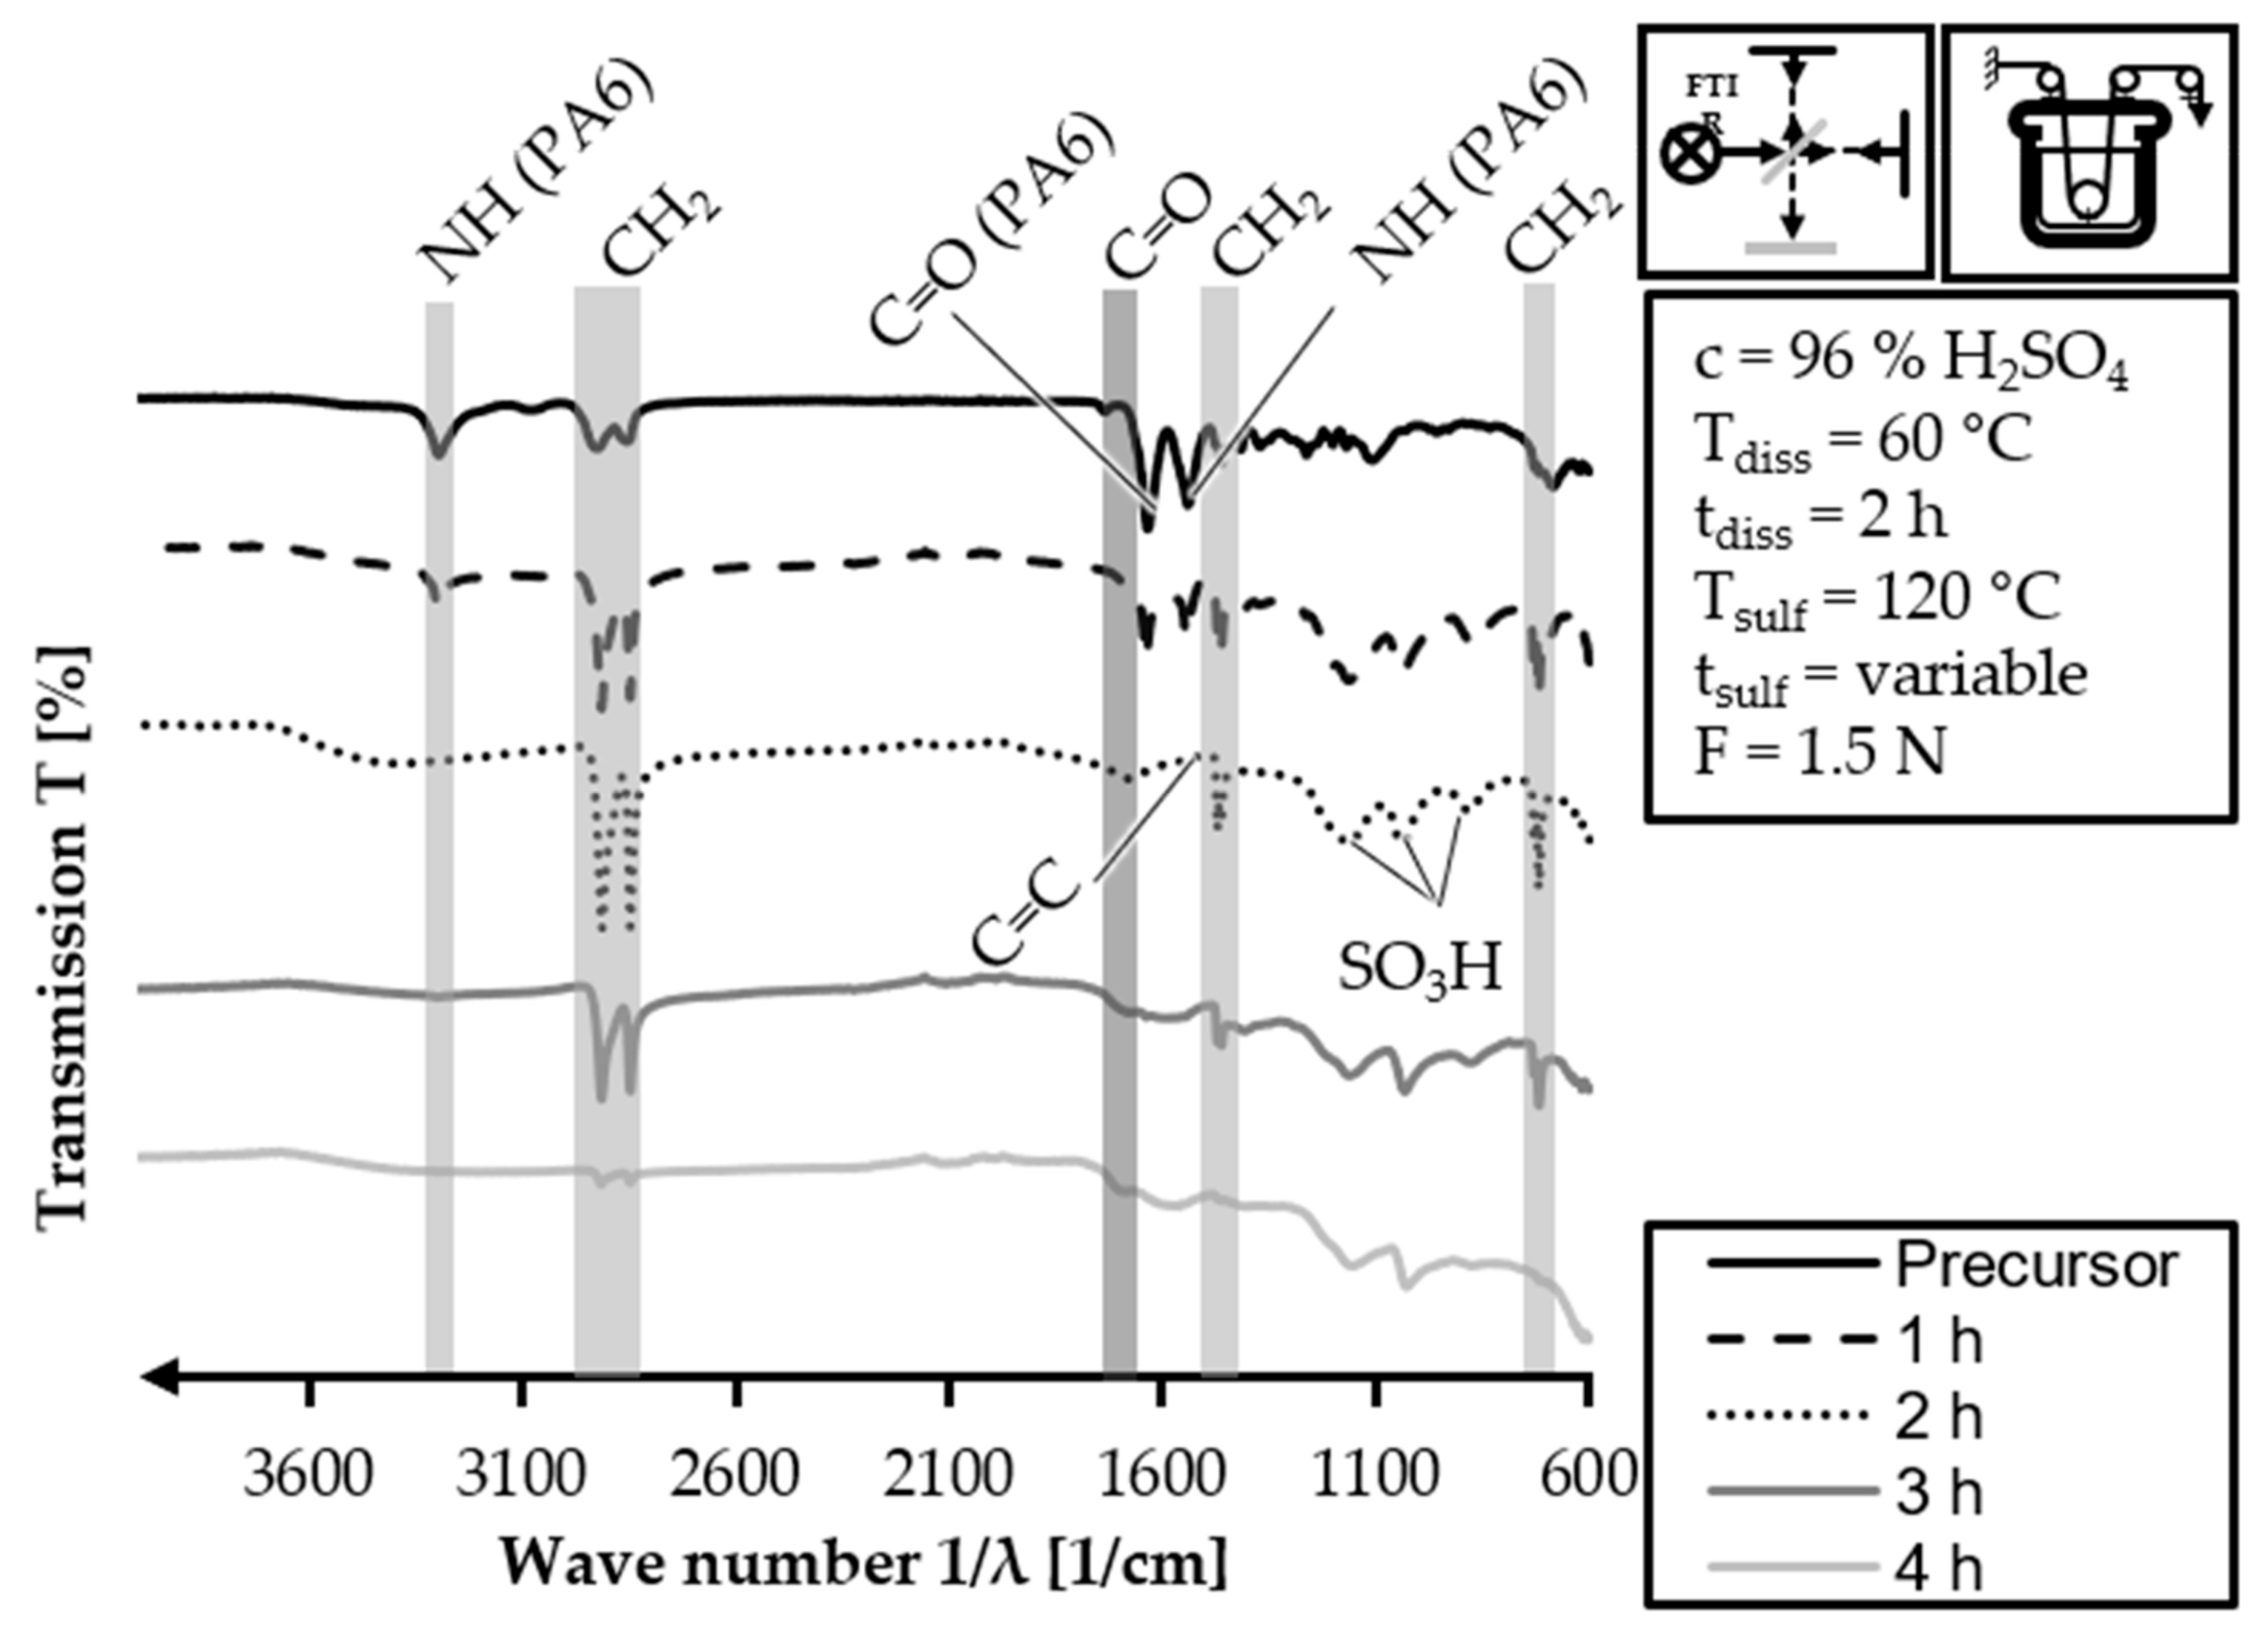
The FTIR analysis is also carried out for the 60/2 samples of the batch sulfonation trials with the HDPE-INS precursor. The stacked FTIR spectra of the 60/2 samples and the HDPE-INS precursor are shown in Figure 12. The FTIR spectrum of the HDPE-INS precursor is consistent with what was expected and described in Figure 11. However, the presence of PA6 related peaks in the 1 h sulfonation sample (3300 cm−1; 1650 cm−1; 1550 cm−1) suggests that the pretreatment did not completely dissolve PA6. The alkane related peaks (3000–2840 cm−1; 1470–1460 cm−1; and 770–720 cm−1) exhibit increased intensity, and the spectrum presents the sulfone related peaks (1150–1050 cm−1) induced by the sulfonation process. In the 2 h sulfonation sample spectrum, there are no observable PA6 related peaks. The alkane- (3000–2840 cm−1; 1470–1460 cm−1; and 770–720 cm−1) and sulfone- (1150–1050 cm−1) related peaks show increased intensity compared to the 1 h sulfonation sample. Additionally, a peak corresponding to the C=O stretching of the carboxylic groups (1710–1690 cm−1) introduced into the polymer via sulfonation is present. In the 3 h sulfonation sample, the PA6 related peaks are absent. Furthermore, the intensity of the alkane-related peaks decreases (3000–2840 cm−1; 1470–1460 cm−1; and 770–720 cm−1), while a peak for C=C stretching of cross-linking induced carboxylic groups (1620–1570 cm−1) becomes observable. The peak for the carboxylic groups induced by sulfonation (1710–1690 cm−1) is also present. The FTIR spectrum of the 4 h sulfonation sample does not exhibit any peaks related to PA6, and the intensities of the alkane-related peaks are significantly reduced (3000–2840 cm−1; 1470–1460 cm−1; and 770–720 cm−1). However, the peaks for the carboxylic groups, double bonds and sulfones in the fiber polymers show a slight increase compared to the 3 h sulfonation sample. These trends indicate that the cross-linking and sulfonation degree of the fiber increase with longer sulfonation reaction time, as expected.
The samples from the batch sulfonation trials with the HDPE-INS precursor are investigated using light microscopy. The images can be found in the appendix (Figure A5 and Figure A6), while the measured filament diameters of the 40/2 and 60/2 samples are shown in Table 12.
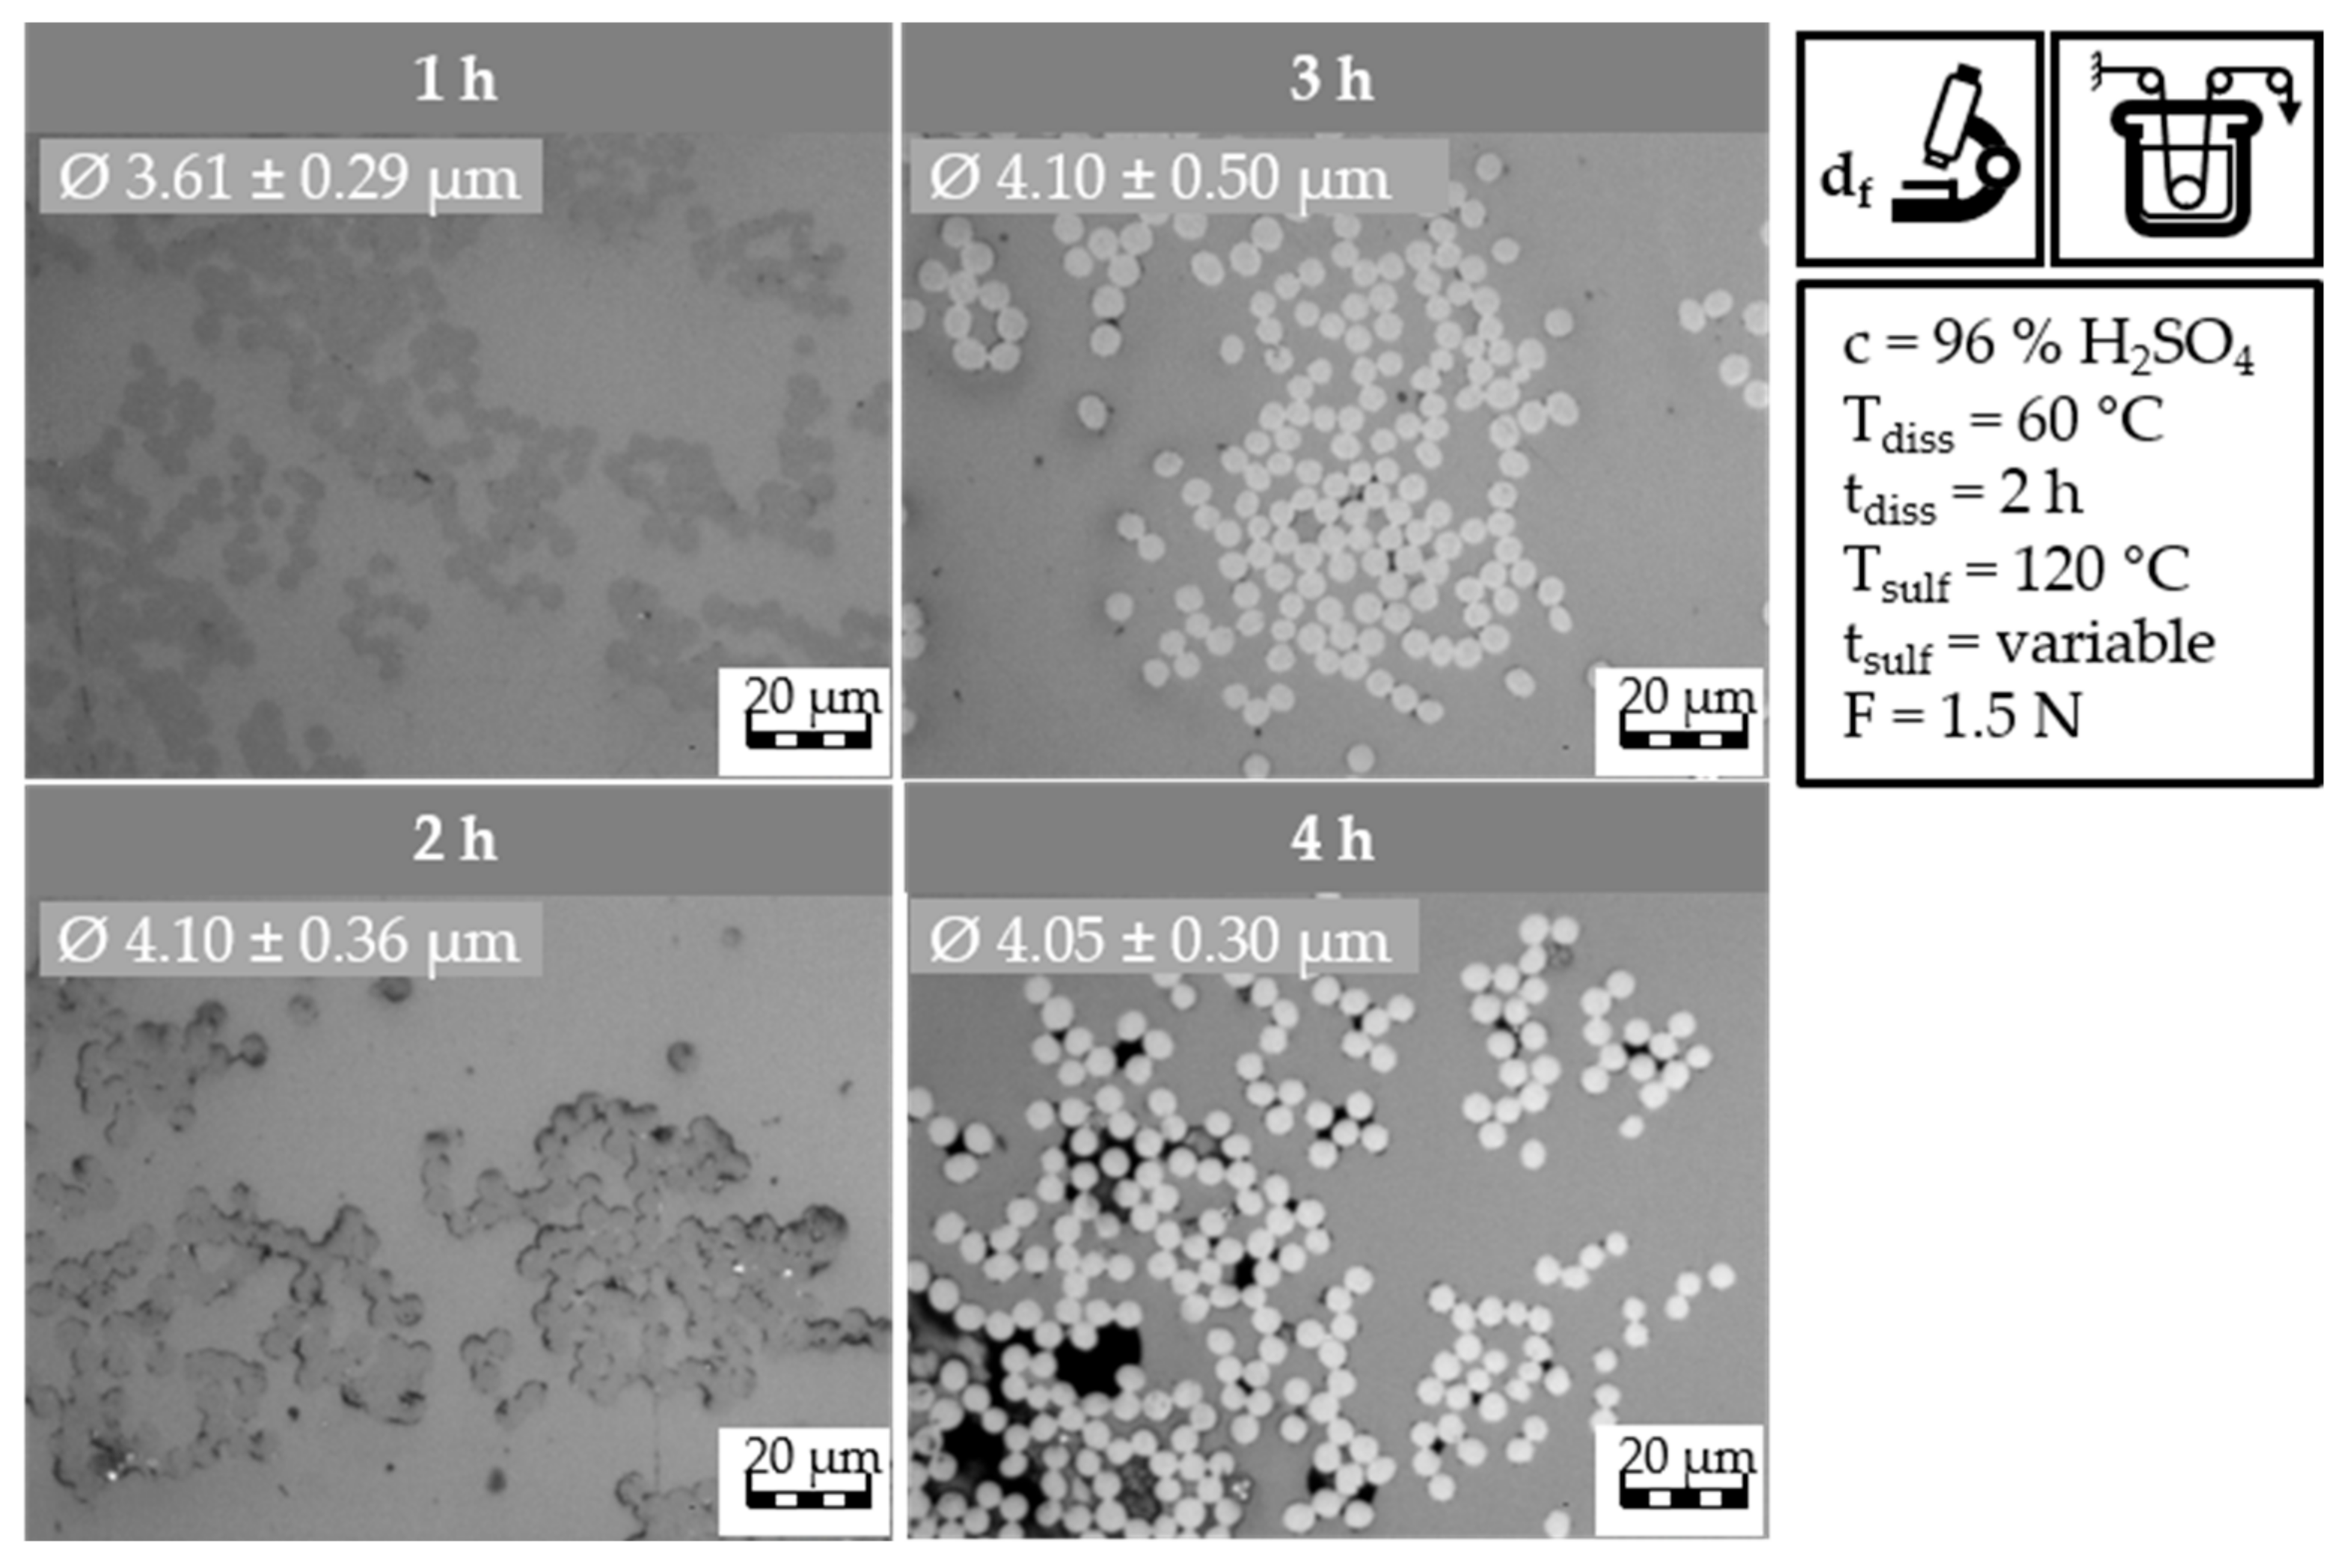
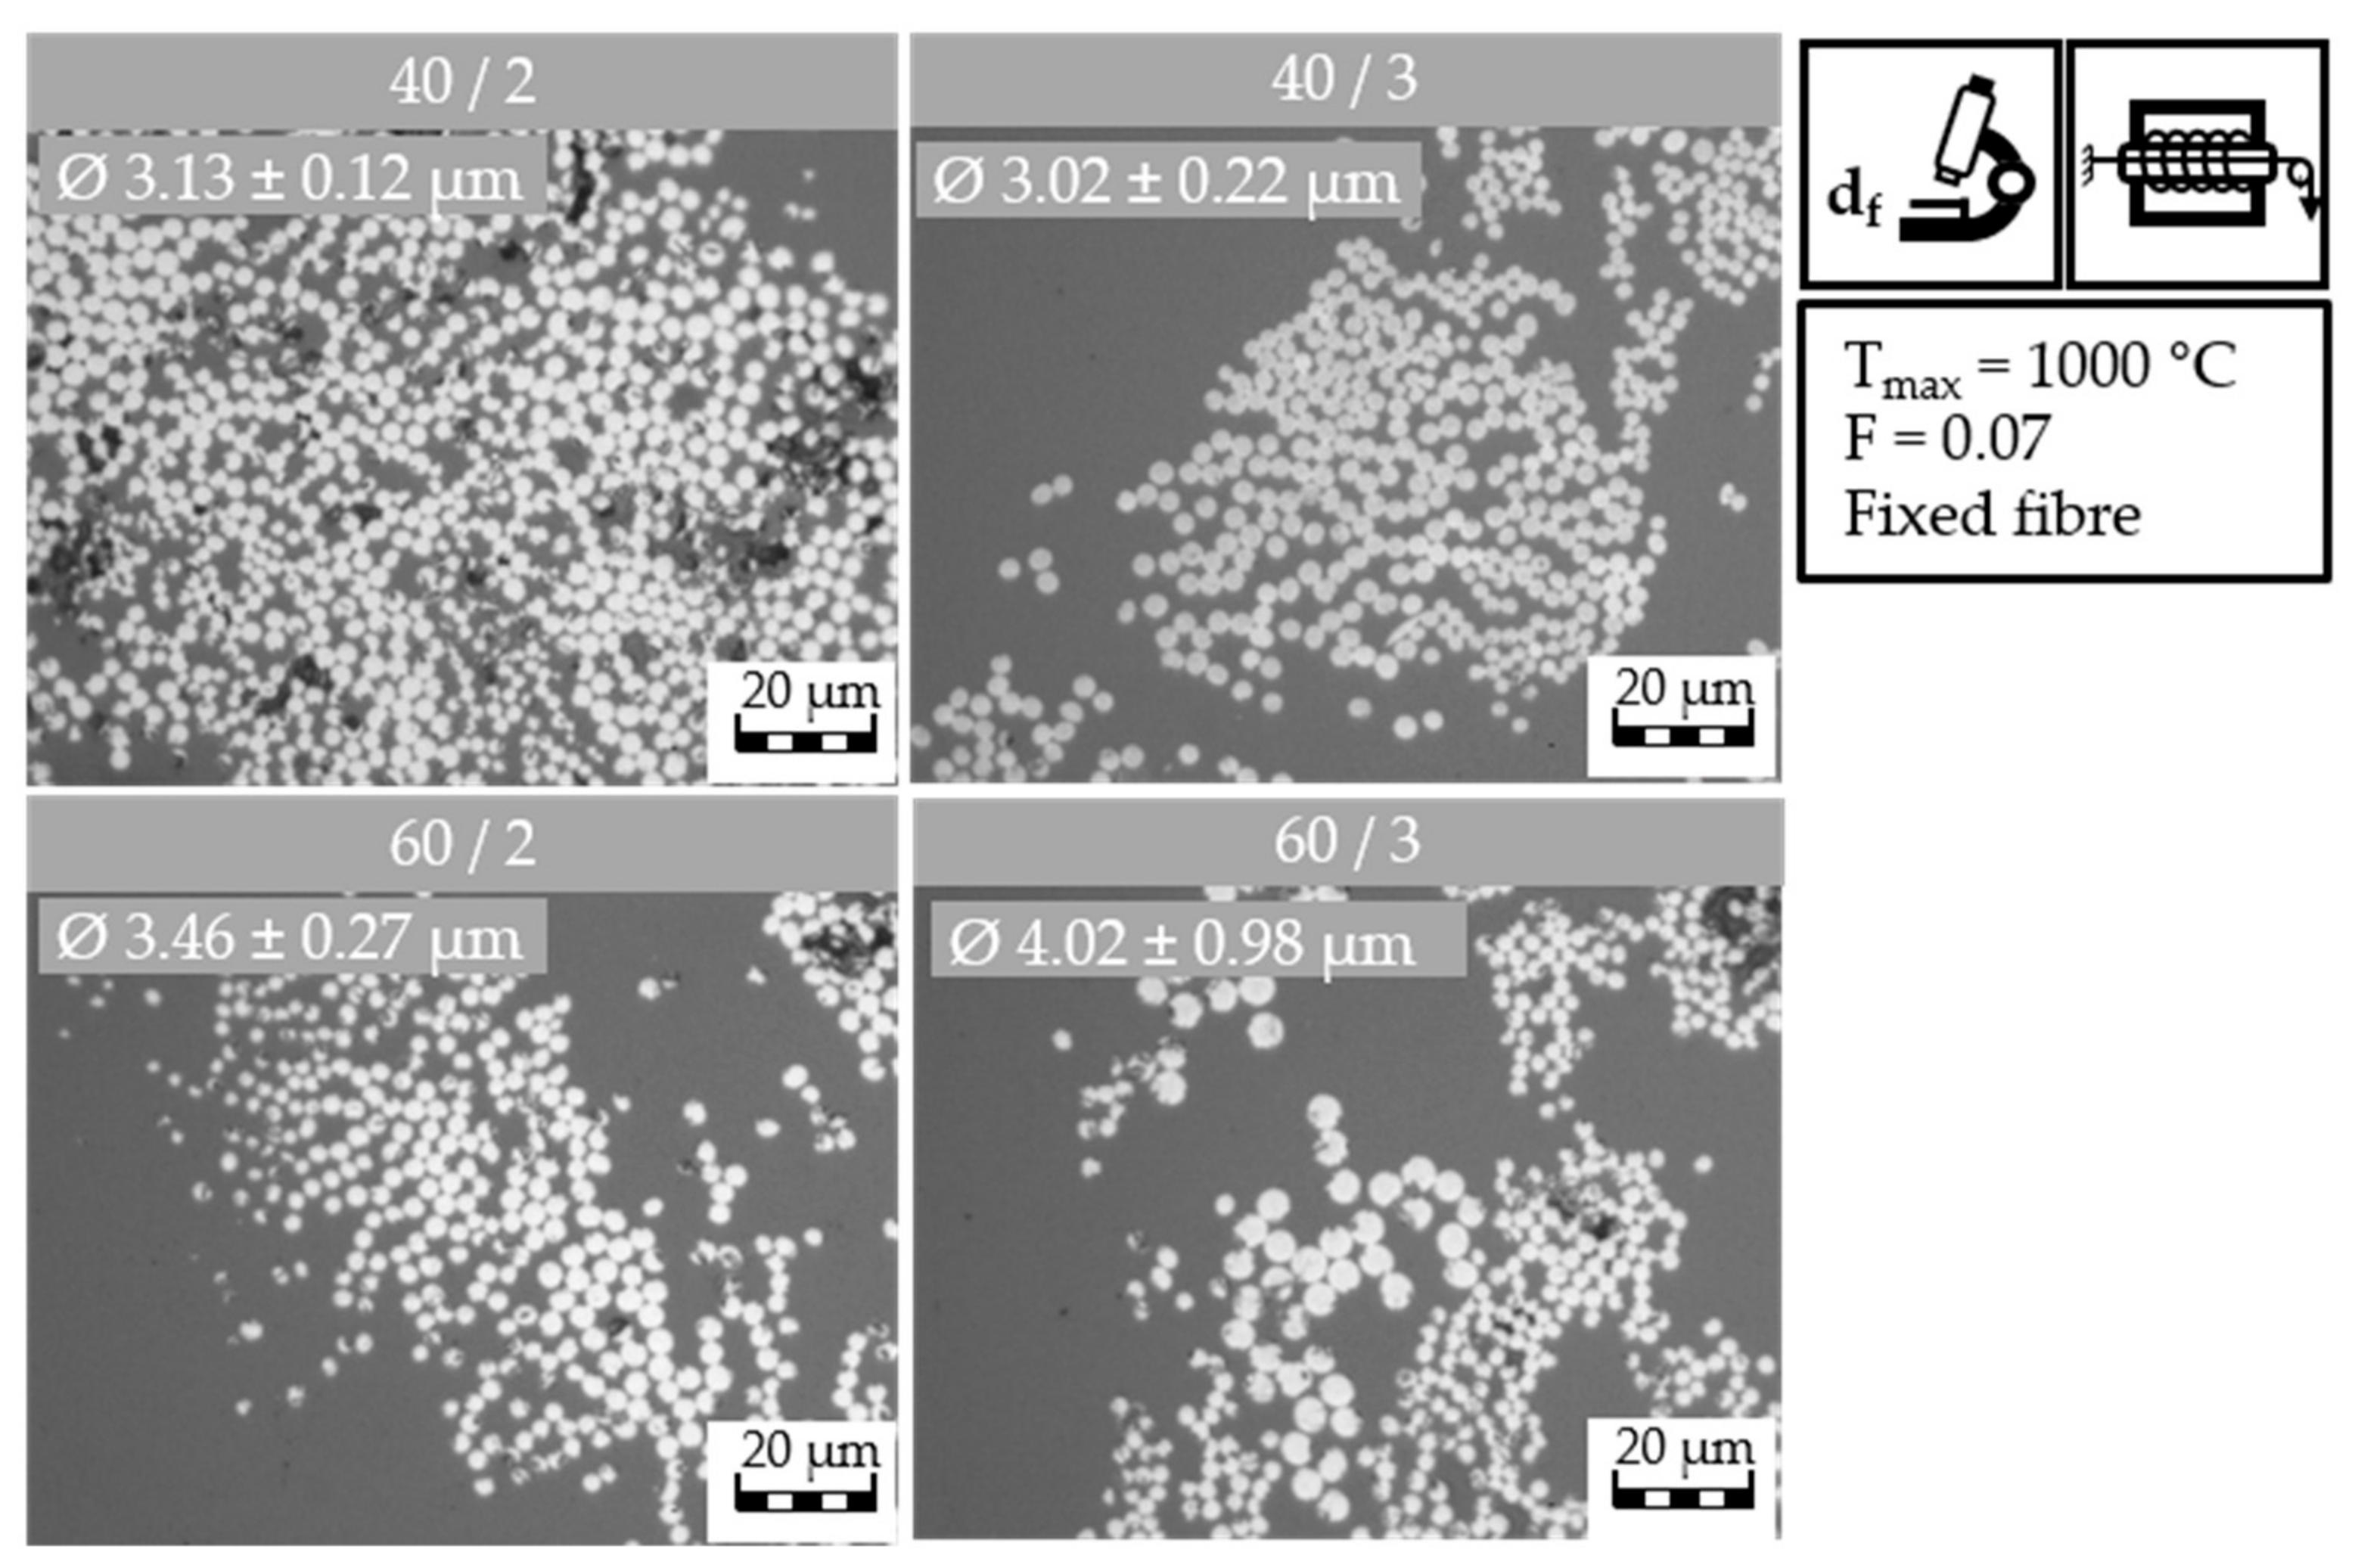
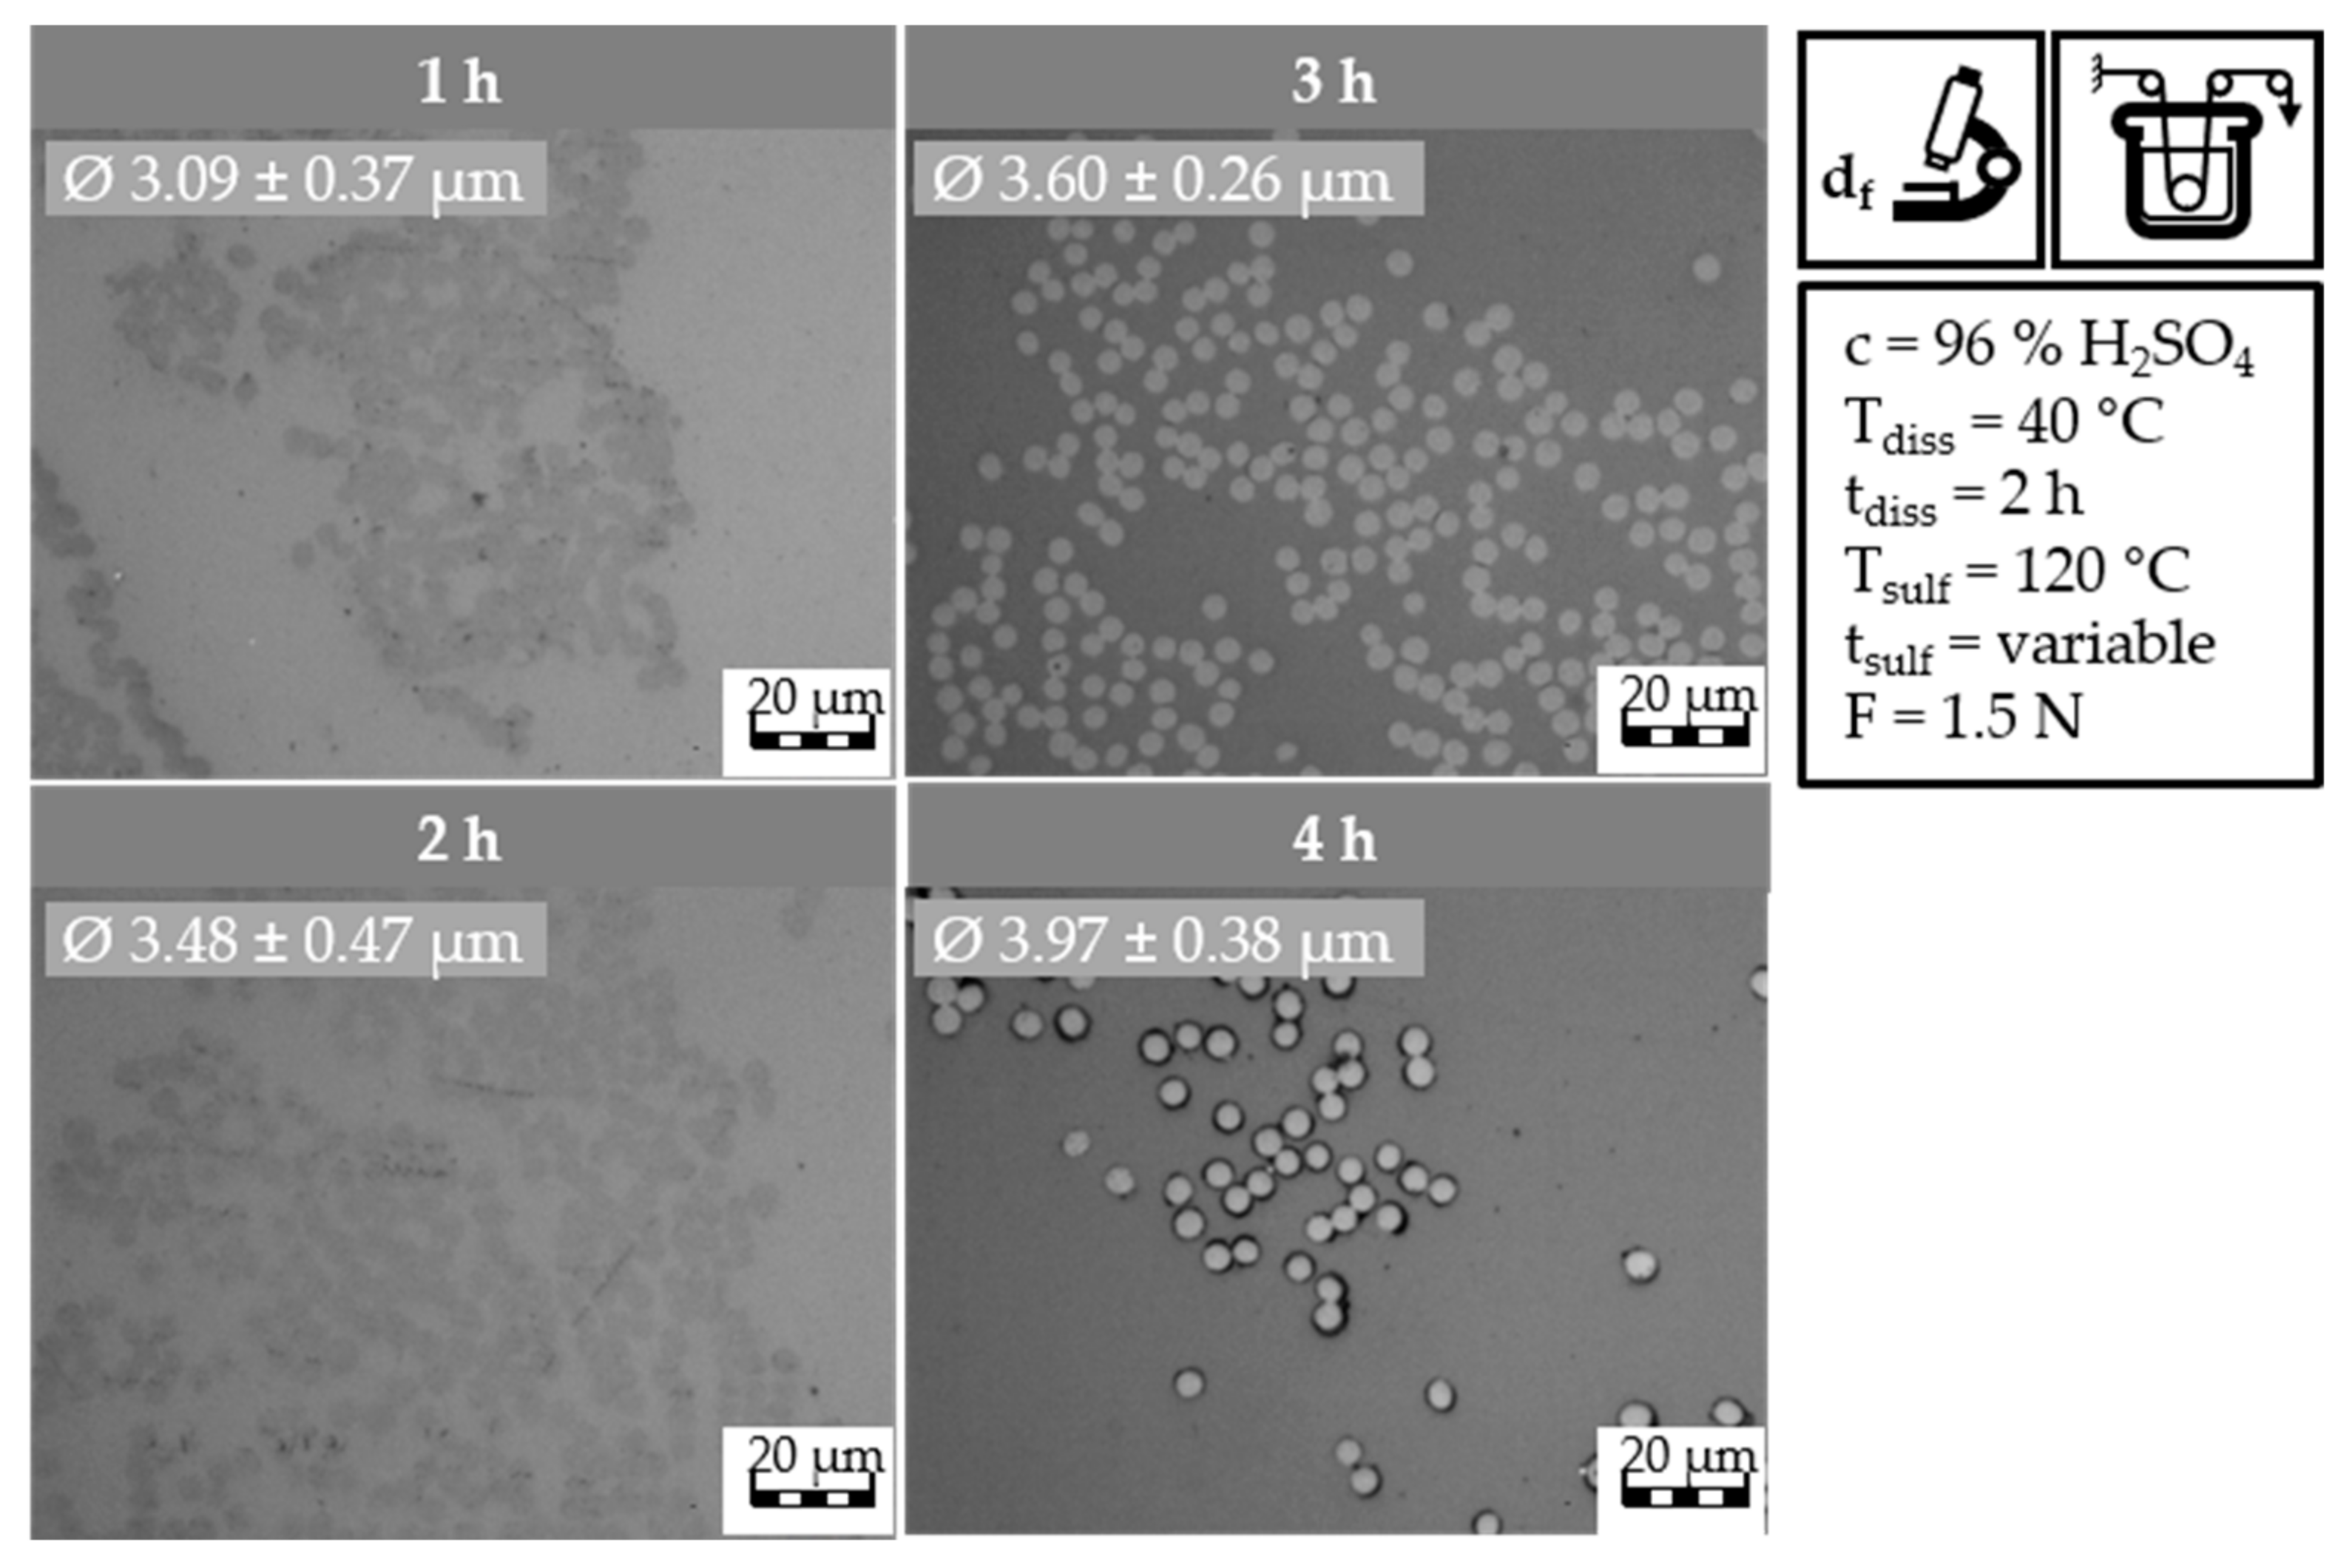
The 40/2 samples all present round filaments with the following filament diameters: 3.09 ± 0.37 μm (1 h), 3.48 ± 0.47 μm (2 h), 3.60 ± 0.26 μm (3 h), and 3.97 ± 0.3 μm (4 h). The filament diameter increases with longer sulfonation time due to swelling and incorporation of sulfur-containing groups. In the light microscopy image of the 1 h sulfonation sample of the 60/2 samples, filaments with a diameter of 3.61 ± 0.29 μm are observed. The 2 h sample in the light microscopy image shows measured filament diameters of 4.10 ± 0.36 μm. These two samples again exhibit some blended contrast, possibly caused by the reaction of the remaining sulfuric acid with the resin used during sample preparation. The 3 h sulfonation sample does not show this effect; instead, isolated and clearly defined mostly round filaments with a filament diameter of 4.05 ± 0.50 μm are observed. Lastly, the image of the 4 h sample presents round filaments with a cross-section diameter of 4.05 ± 0.30 μm. The filament diameter increases to a lesser degree after 2 h of sulfonation, as cross-linking reactions happen parallel to the uptake of new sulfur-containing groups, thereby mitigating the swelling effect. The increase in filament diameter is caused by swelling and the incorporation of sulfur-containing groups. The 60/2 samples exhibit a larger filament diameter compared to the 40/2 samples, suggesting that the fibers incorporate a higher number of sulfur containing groups, which result in higher water uptake through the hygroscopic character of sulfur-containing groups. This could potentially result in a higher sulfonation degree, which could lead to a higher cross-linking degree of the fibers and ultimately result in CF with improved mechanical properties after carbonization.

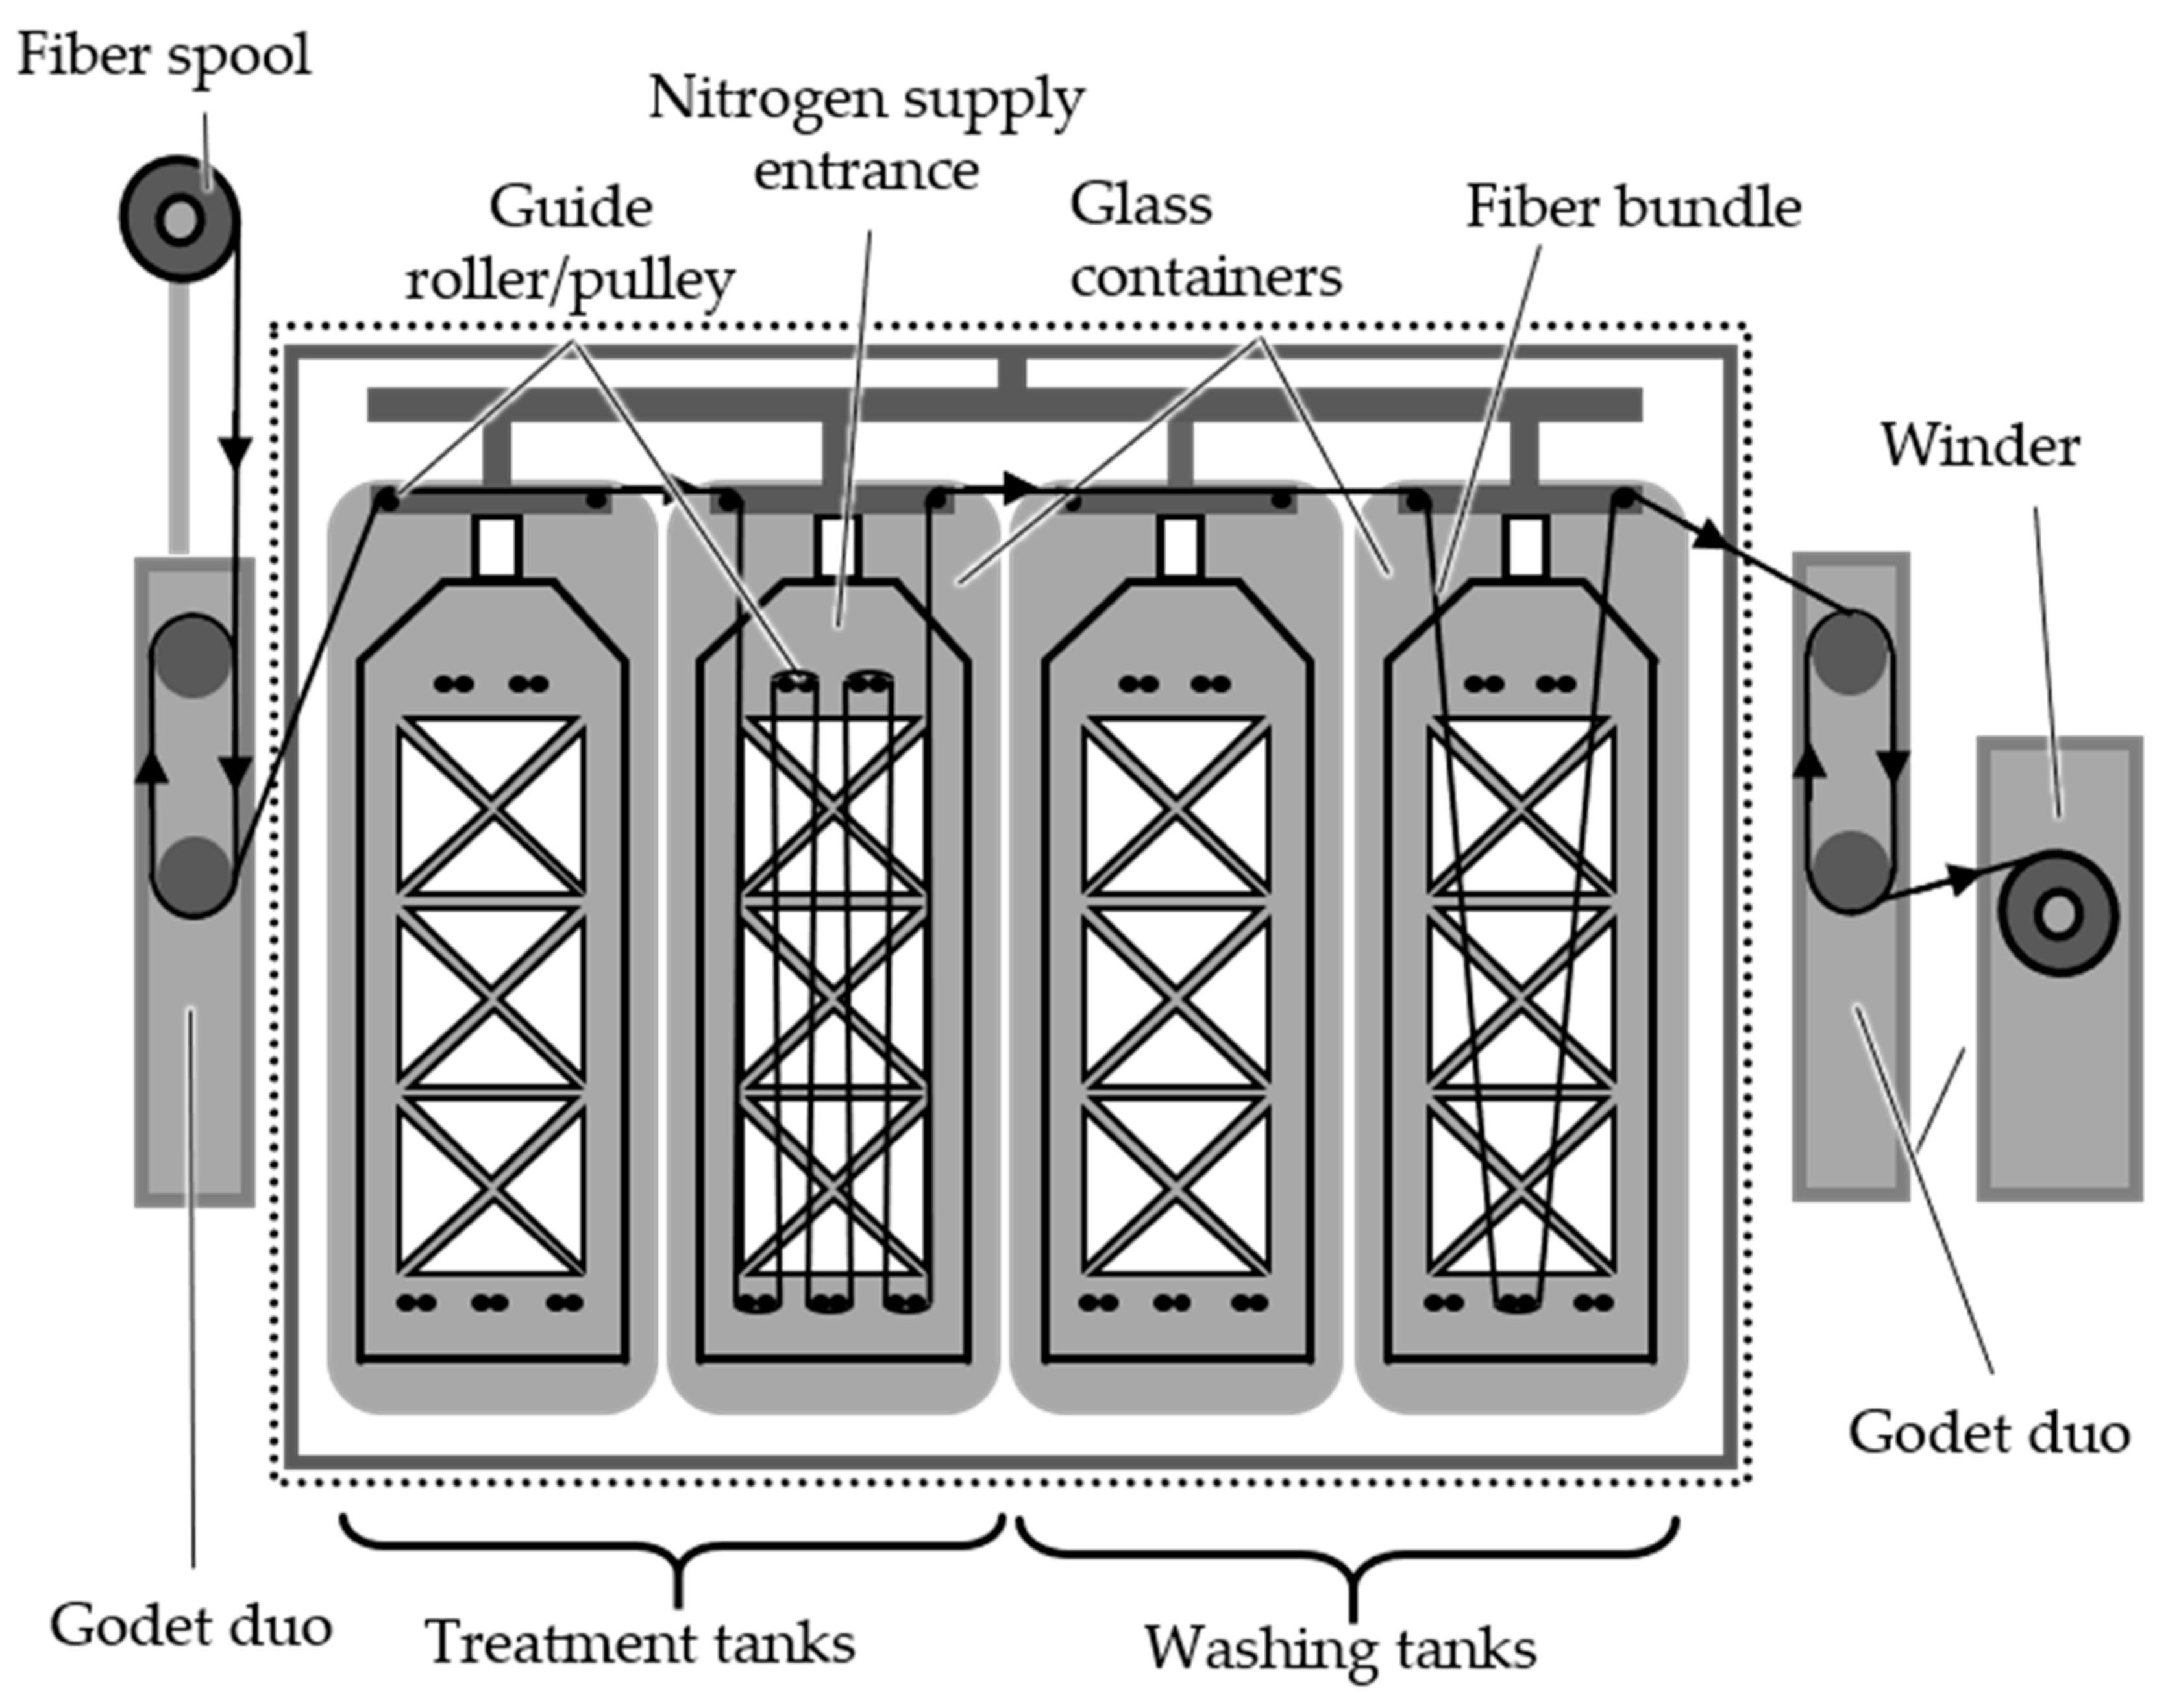
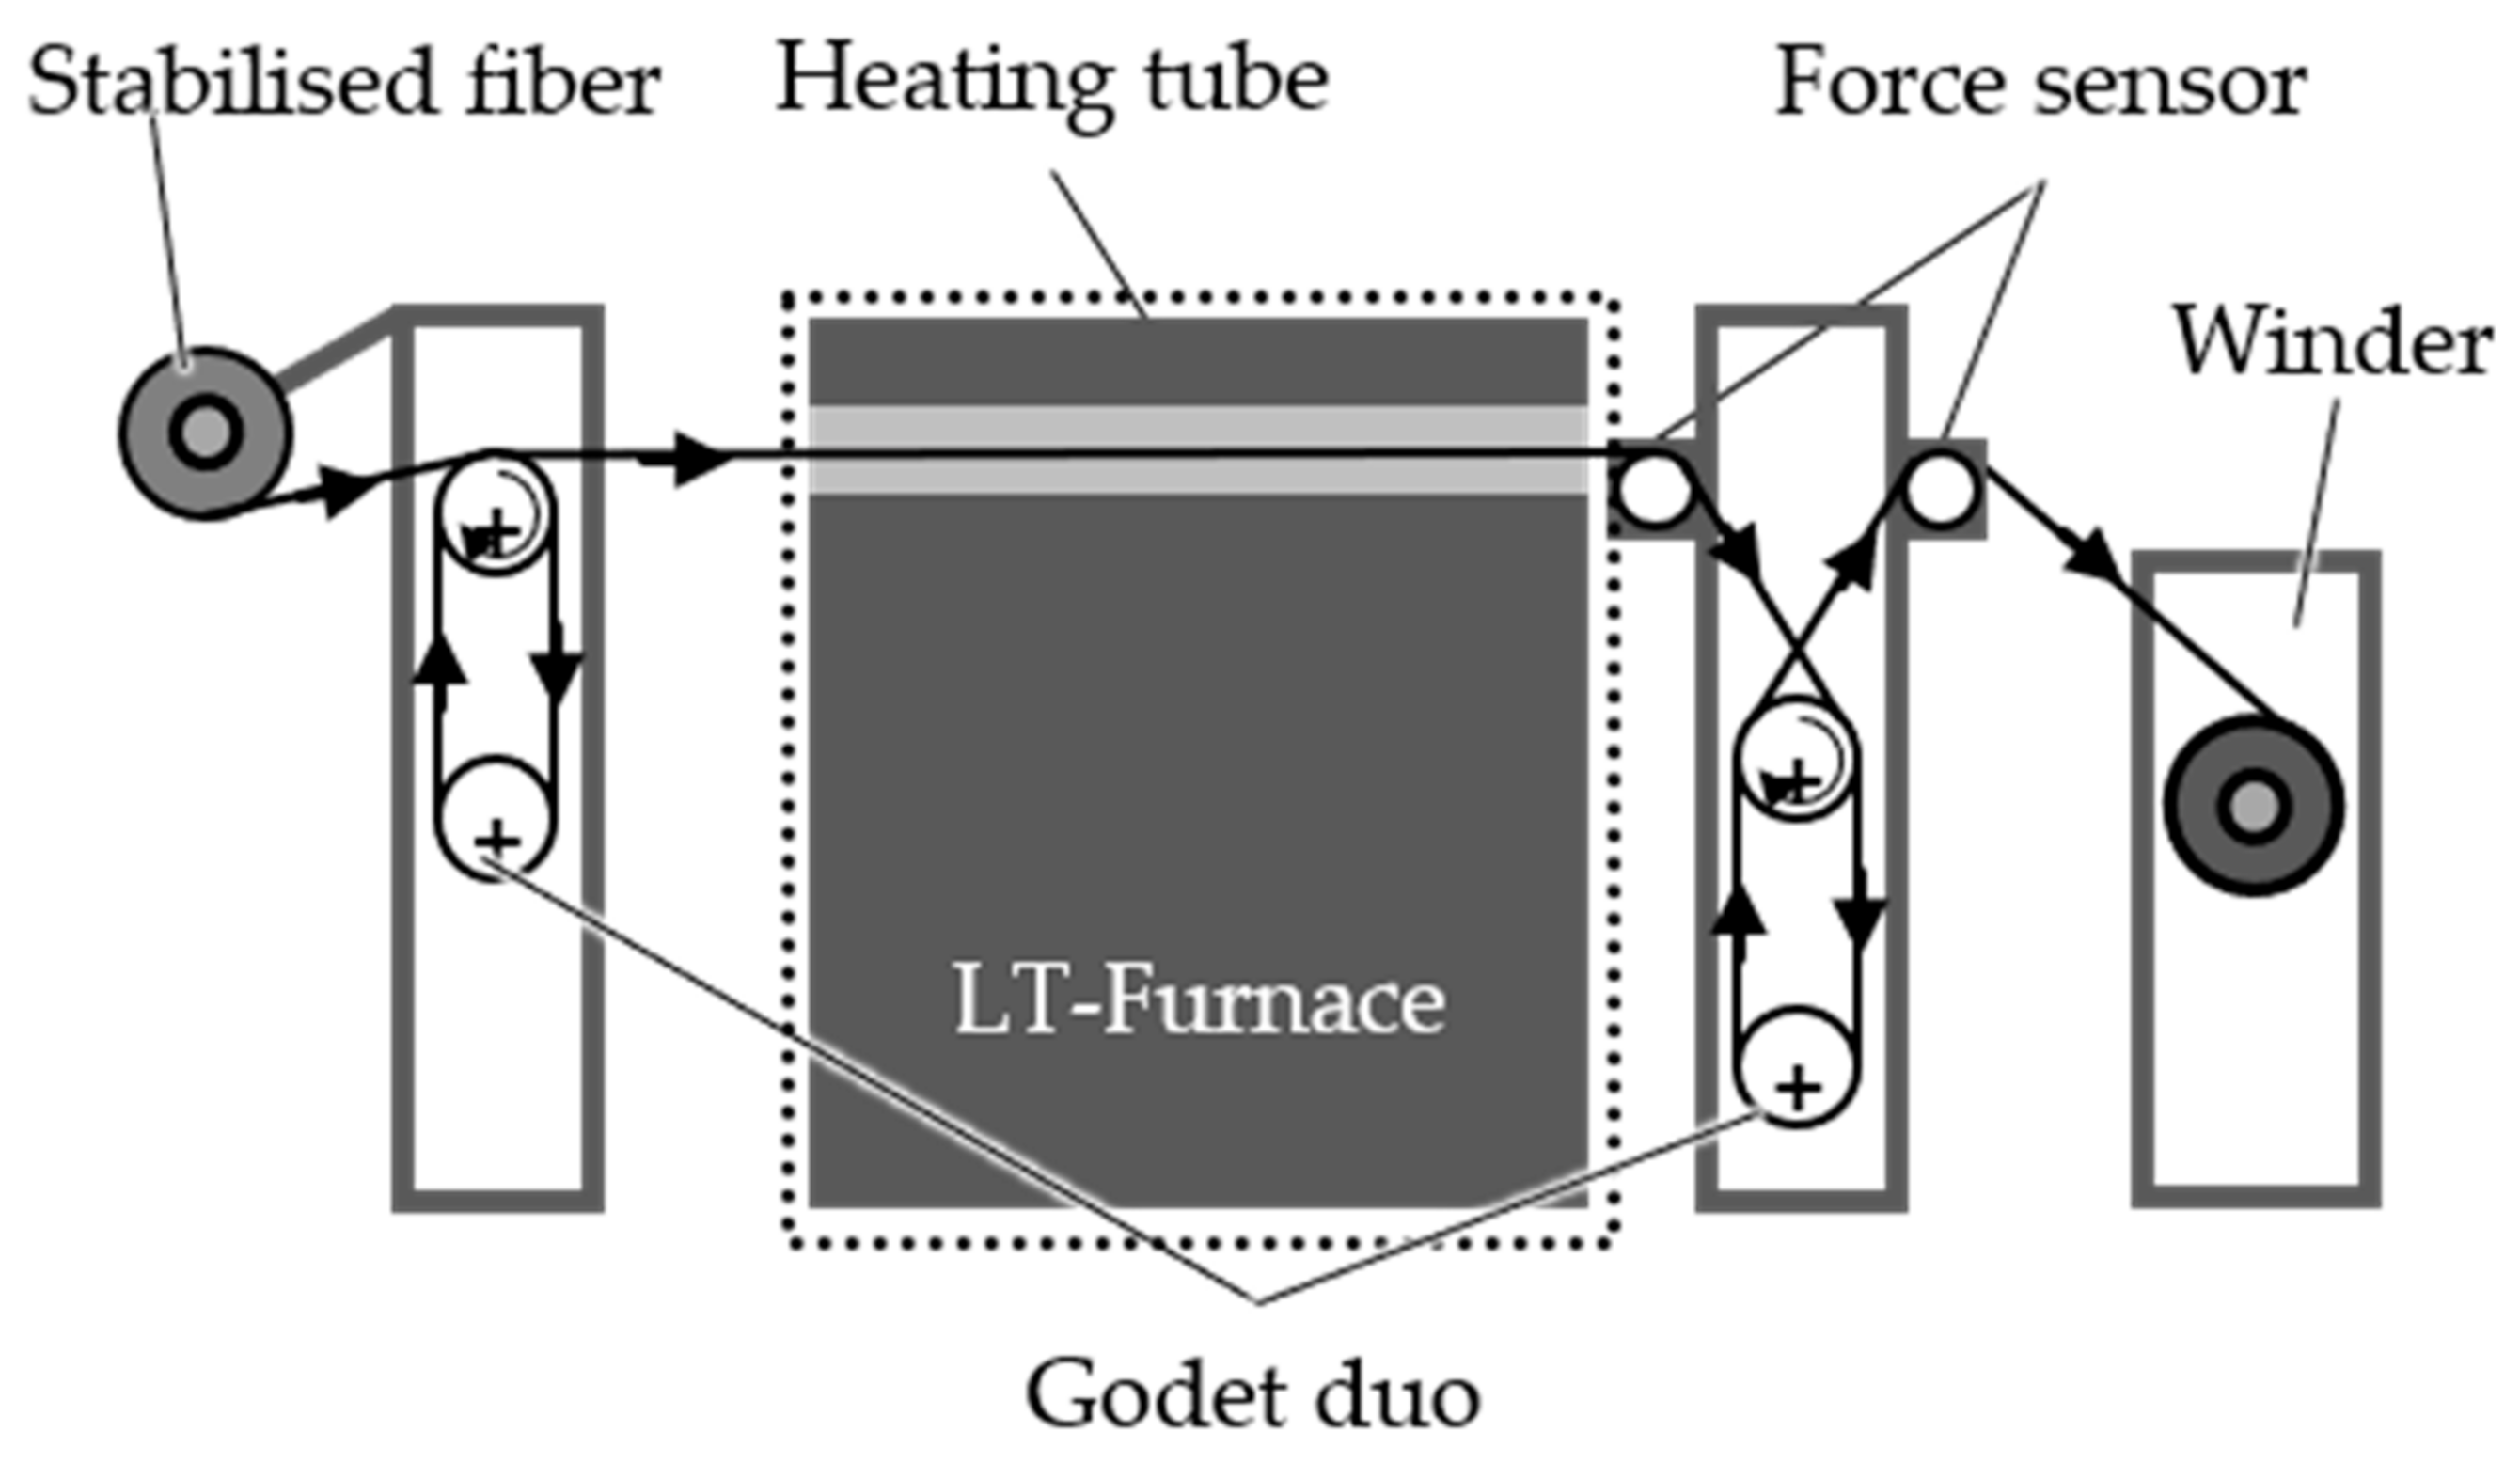
3.2.2. Continuous Stabilization

The batch stabilization trials confirm the feasibility of conducting stabilization with higher fiber tension, which facilitates the implementation of continuous stabilization and subsequent continuous carbonization processes. The first step involves investigating continuous stabilization. The continuous dissolution of PA6 is conducted at 40 °C and 60 °C for 2 h, while sulfonation takes place at 120 °C. Fiber samples are collected after the dissolution treatment (40 °C: zone LA.2; 60 °C: zone A.2) and after zones 1, 2 and 3 of the sulfonation (40 °C: zones L1, L2 and L3; 60 °C: zones 1,2 and 3). The TGA and gas pycnometry results for the continuous stabilization trials using the HDPE-INS precursor are presented in Table 13.
The HDPE-INS precursor has a density of 1.073 ± 0.001 g/cm3. The TGA analysis provides values for ΔmPE and Δmtotal of 84% and 99%, respectively. The density of the samples obtained from the continuous dissolution of PA6 at 40 °C and the subsequent continuous sulfonation are as follows: 0.960 ± 0.001 g/cm3 (zone LA.2), 1.047 ± 0.001 g/cm3 (zone L1), 1.217 ± 0.001 g/cm3 (zone L2) and 1.494 ± 0.003 g/cm3 (zone L3). For the continuous stabilization trials with a dissolution temperature of 60 °C, the density values are as follows: 0.977 ± 0.001 g/cm3 (zone A.2), 1.046 ± 0.002 g/cm3 (zone 1), 1.225 ± 0.001 g/cm3 (zone 2) and 1.494 ± 0.003 g/cm3 (zone 3). In both cases, the density values exhibit a clear increasing trend, which is expected as heavier sulfur-containing groups replace lighter hydrogen atoms and cross-linking occurs within the fibers polymer. Comparing the equivalent density values for both cases, it can be observed that different dissolution temperatures result in similar fiber density values. This indicates that both approaches yield stabilized PE fibers with similarly high-density values after the third sulfonation zone.
The TGA results of the continuous stabilization trials with a dissolution temperature of 40 °C demonstrate the expected decreasing trend in the values of ΔmPE and Δmtotal for the four stabilization zone samples. The highest values are observed in the zone LA.2 sample (ΔmPE = 97%; Δmtotal = 100%) and decrease from zone A1 (ΔmPE = 91%; Δmtotal = 94%) to zone A2 (ΔmPE = 38%; Δmtotal = 71%), reaching the lowest values in zone A3 (ΔmPE = 12%; Δmtotal = 51%). Similarly, the TGA results for the batch stabilization trial samples with a dissolution temperature of 60 °C also exhibit the same decreasing trend in ΔmPE and Δmtotal values. The zone A.2 sample has the highest values (ΔmPE = 94%; Δmtotal = 99%), followed by zone 1 (ΔmPE = 72%; Δmtotal = 90%), zone 2 (ΔmPE = 34%; Δmtotal = 64%) and finally zone 3 (ΔmPE = 12%; Δmtotal = 53%). The most significant differences in the TGA values are observed in the samples from the first sulfonation zone. Zone L1 has a ΔmPE value of 91%, while zone 1 has a ΔmPE value of 72%. This difference can be explained by the incomplete dissolution of PA6 at a dissolution temperature of 40 °C. As a result, in the first sulfonation zone L1, the remaining PA6 needs to be fully dissolved first. The presence of the remaining PA6 prevents the direct occurrence of the sulfonation reaction, hindering the access of sulfuric acid to the PE filaments and resulting in a higher ΔmPE value.
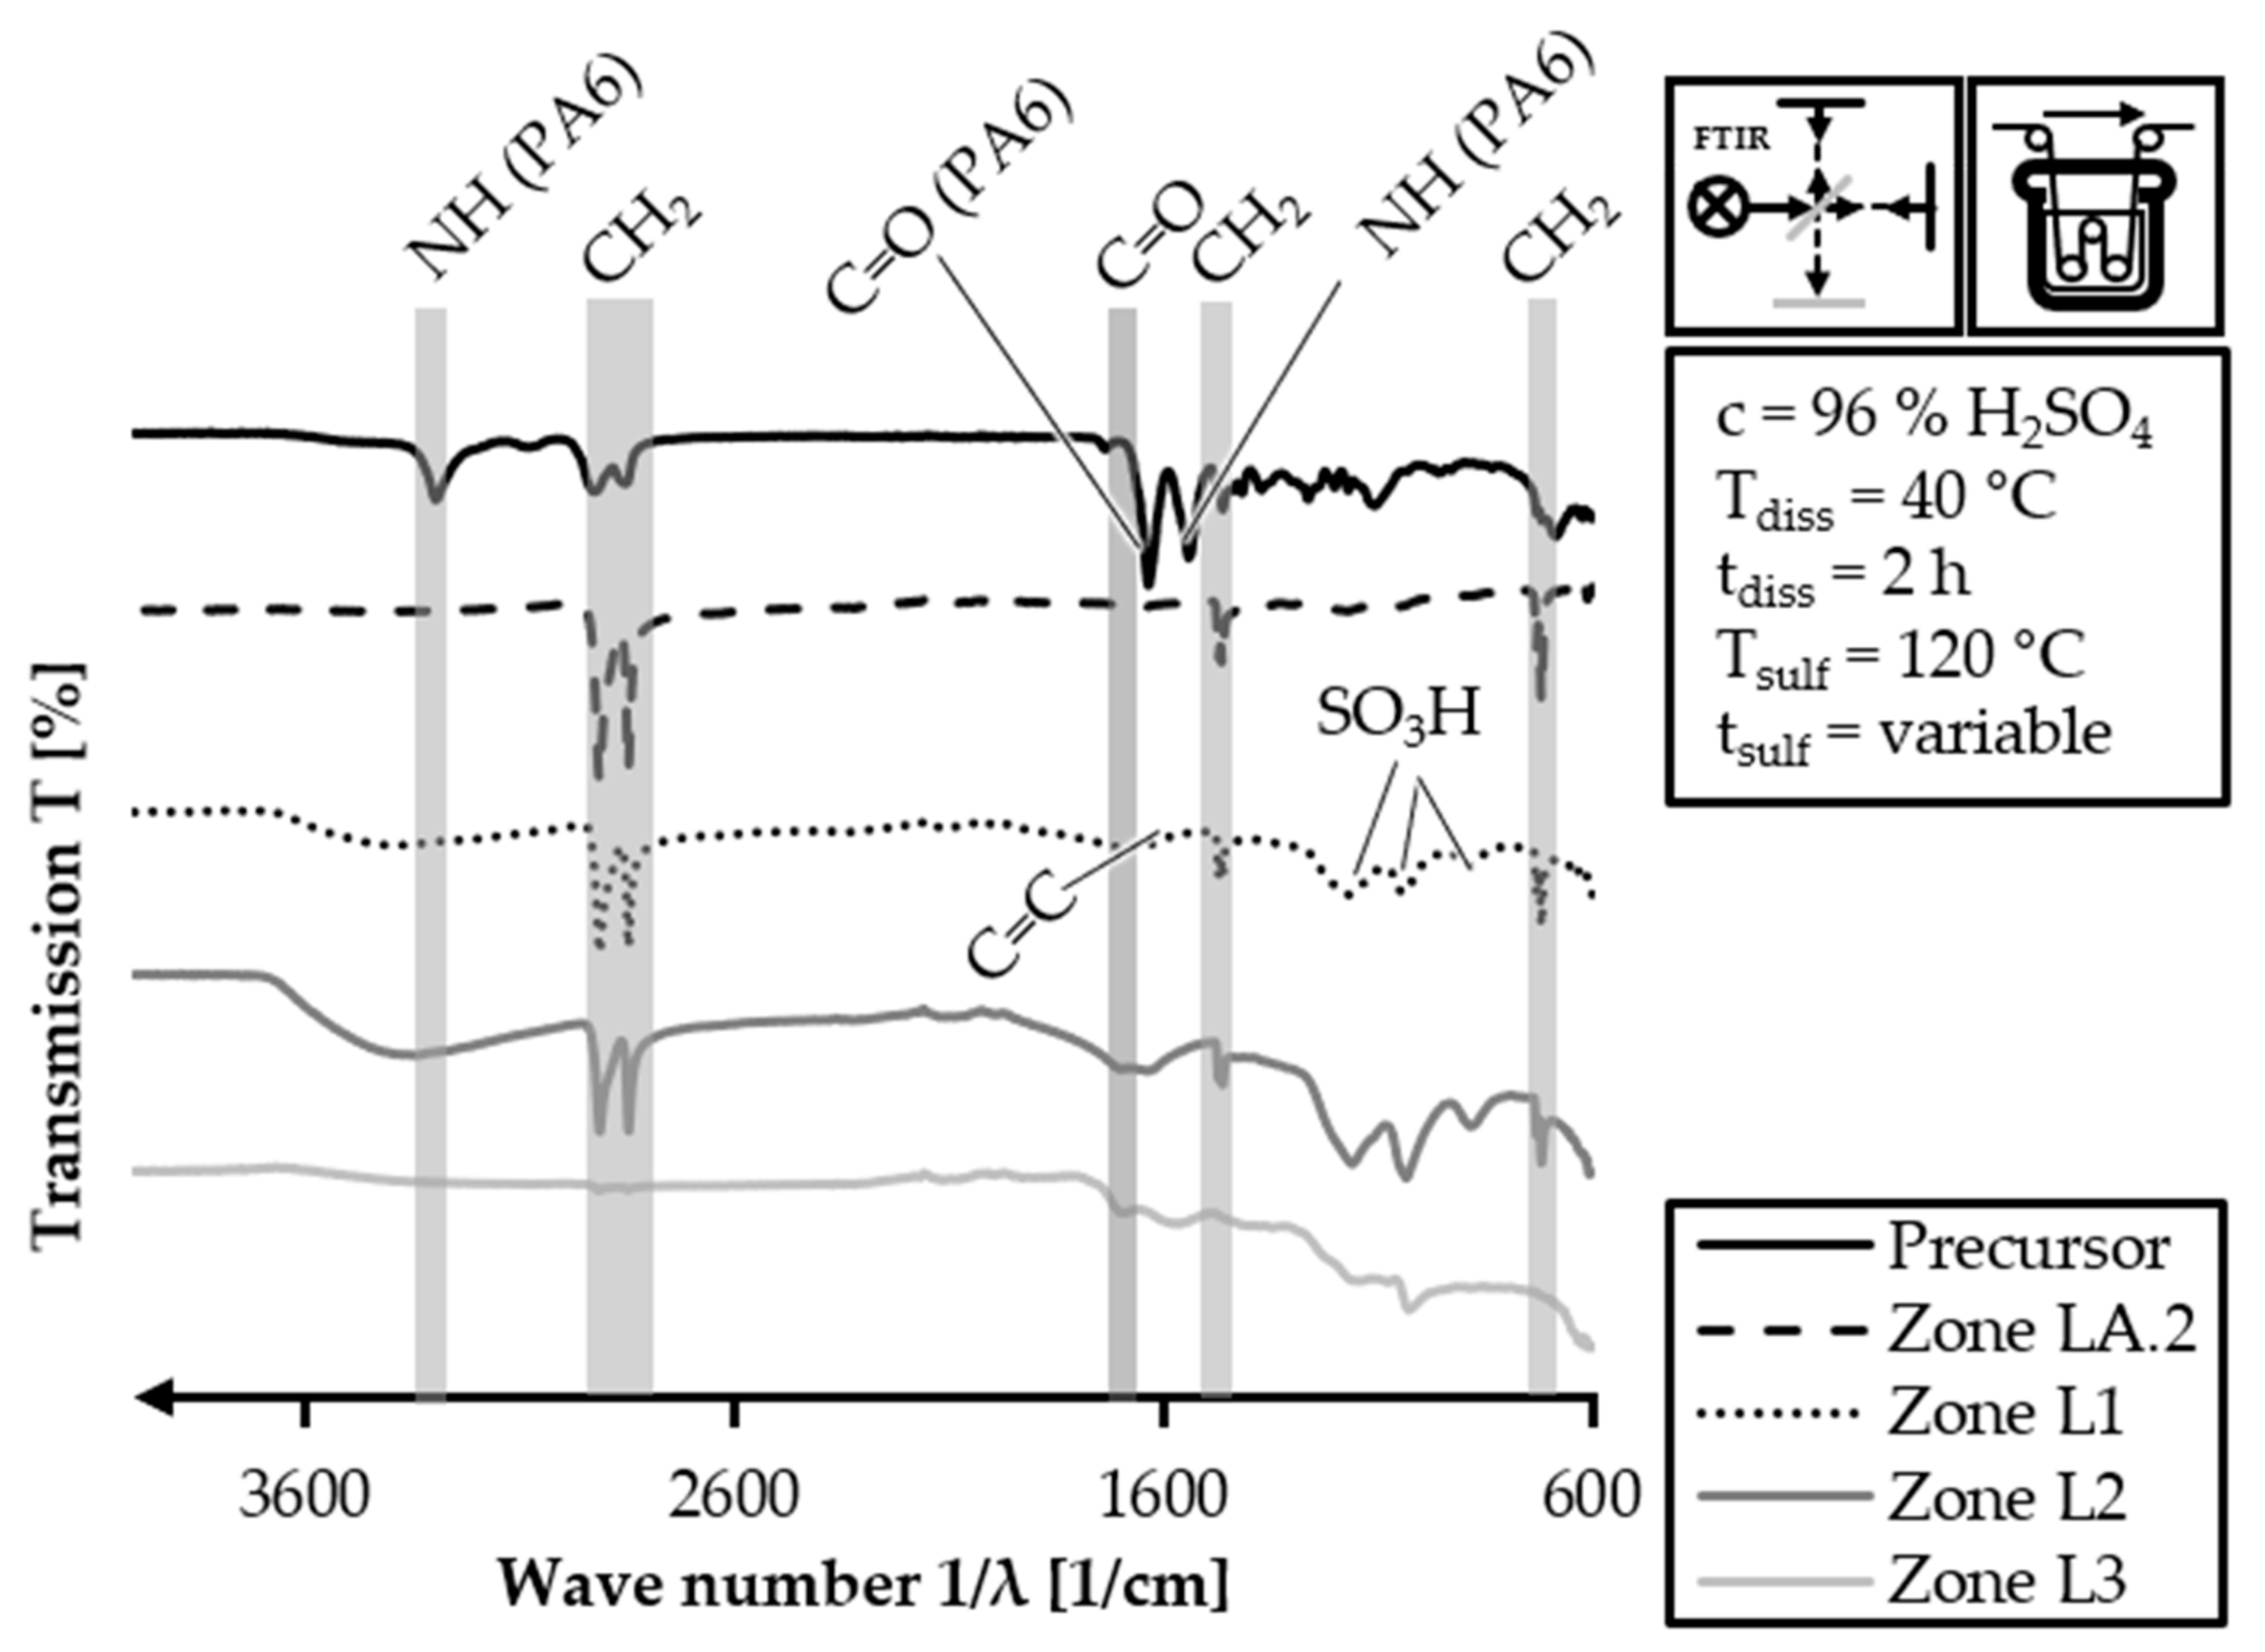
The stacked FTIR spectra of the HDPE-INS precursor and the continuous stabilization trial samples with a dissolution temperature of 40 °C are depicted in Figure 13.
The four samples of the continuous stabilization trials do not exhibit any signals associated with PA6. In the FTIR curve of the zone LA.2 sample, only peaks related to PE are observed. These peaks correspond to the wave numbers 3000–2840 cm−1 (C-H stretching), 1470–1460 cm−1 (CH2 deformation) and 770–720 cm−1 (CH2 deformation). This indicates that the PA6 and its functional groups (amide and carboxylic groups) have dissolved to the extent that they are not detectable in the FTIR analysis. In the FTIR spectra of all three sulfonation samples, there are no peaks associated with PA6. The spectrum of zone L1 exhibits the alkane-related peaks with lower intensity (3000–2840 cm−1 and 1470–1460 cm−1) compared to the zone LA.2 spectrum. However, it shows peaks for sulfone structures (1150–1050 cm−1: S=O symmetric and asymmetric stretching) and carboxylic acid groups (1710–1690 cm−1: C=O stretching). In the FTIR spectrum of zone L2, the peak intensities for alkane structures are further decreased (3000–2840 cm−1 and 1470–1460 cm−1), while the peaks caused by sulfonation increase in intensity (1150–1050 cm−1: S=O symmetric and asymmetric stretching, 1710–1690 cm−1: C=O stretching). Finally, the FTIR spectrum for zone L3 shows almost no observable alkane-related peaks, while the intensities of the sulfone and carboxylic group peaks increase (1150–1050 cm−1: S=O symmetric and asymmetric stretching, 1710–1690 cm−1: C=O stretching). Additionally, a peak related to the C=C stretching of double bonds is identifiable at 1620–1570 cm−1, which is caused by cross-linking and desulfonation reactions.
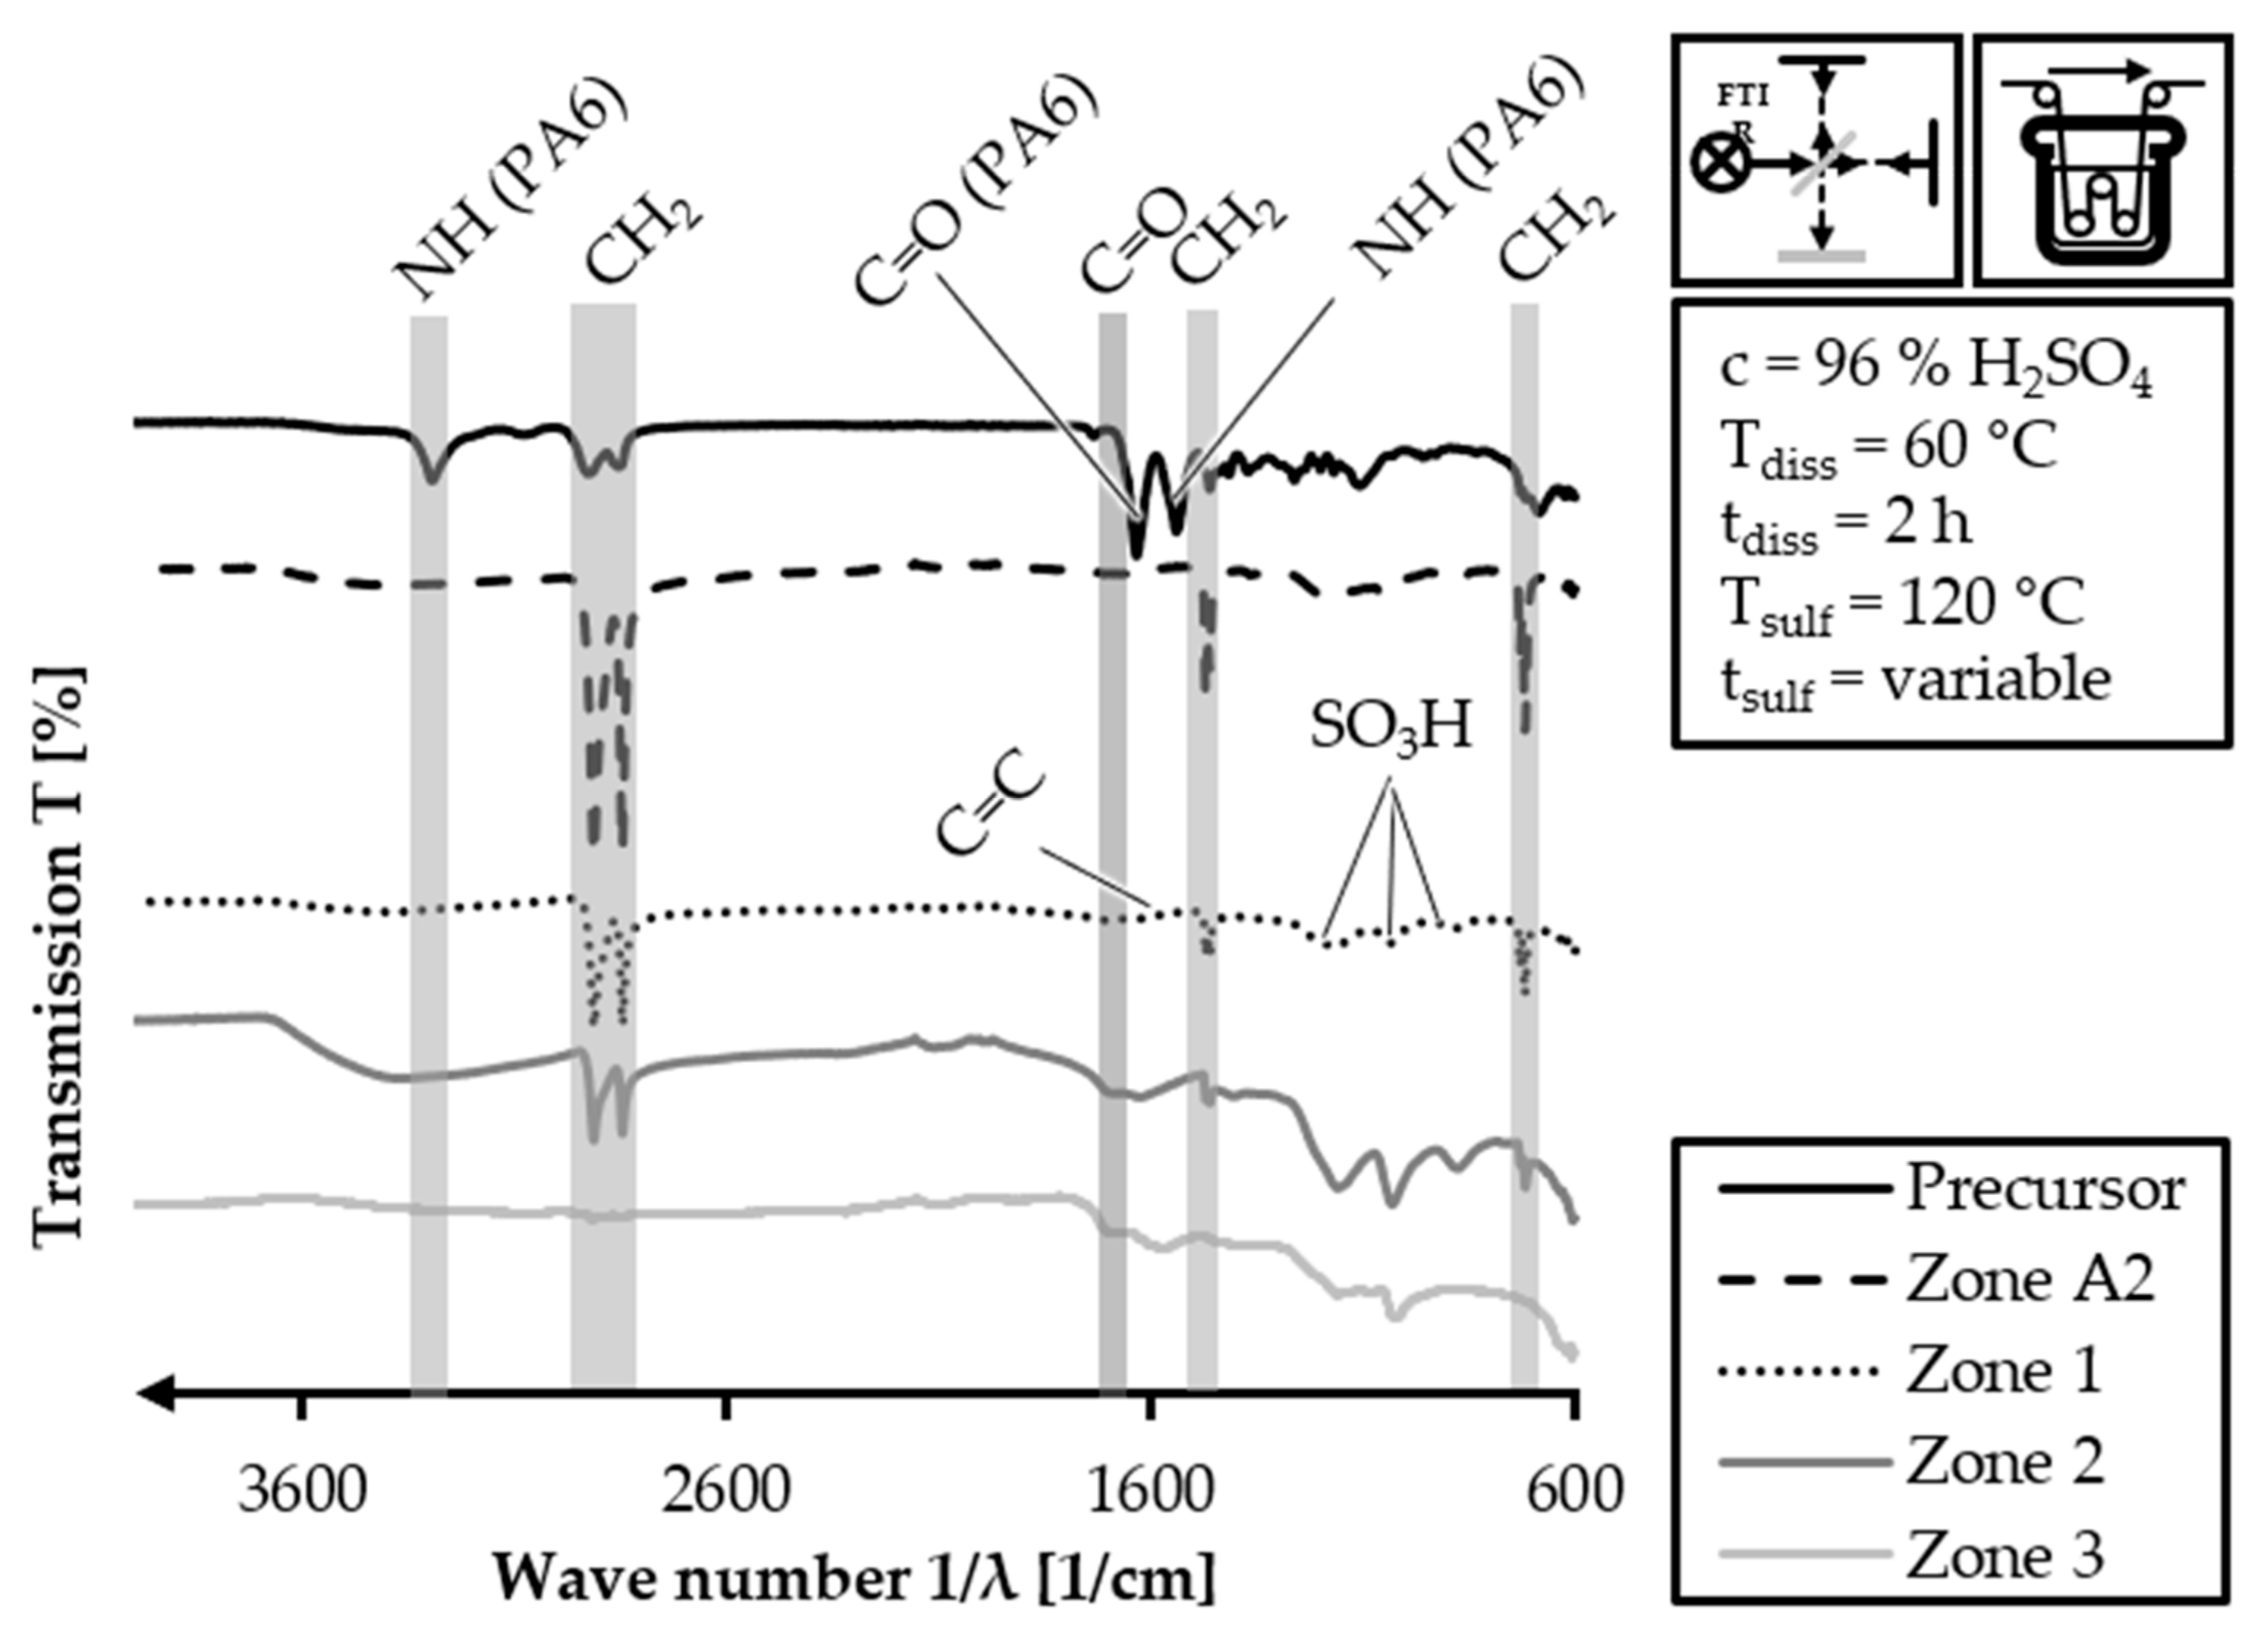
Similarly, the samples of the continuous stabilization trials with a dissolution temperature of 60 °C are also analyzed using FTIR. The spectra of these samples are shown in a stacked manner in Figure 14.
In the FTIR spectrum of the zone A2 sample, no identifiable peaks related to PA6 are observed, similar to the remaining sulfonation zones samples. The spectrum of zone A2 only exhibits peaks associated with PE, with high intensity. The peaks are located at 3000–2840 cm−1 (C-H stretching), 1470–1460 cm−1 (CH2 deformation) and 770–720 cm−1 (CH2 deformation). The FTIR spectrum for zone 1 shows alkane-related peaks (3000–2840 cm−1; 1470–1460 cm−1; and 770–720 cm−1) with lower intensity. Additionally, peaks caused by sulfones are present (1150–1050 cm−1: S=O symmetric and asymmetric stretching). The intensity trend of the observed peaks is continuous in the spectrum of zone 2, with a further reduction in the intensity of alkane-related peaks (3000–2840 cm−1; 1470–1460 cm−1; and 770–720 cm−1), an increase in the intensity of the sulfone-related peaks (1150–1050 cm−1) and the appearance of a peak caused by C=O stretching of carboxylic groups (1710–1690 cm−1). In the spectrum of zone 3, the alkane-related peaks are only marginally present (3000–2840 cm−1; 1470–1460 cm−1; and 770–720 cm−1). The peaks associated with sulfones (1150–1050 cm−1) and carboxylic groups (1710–1690 cm−1) are still present. Additionally, the peak representing the C=C stretching of double bonds in the polymer chains (1620–1570 cm−1) is identifiable, indicating the advanced sulfonation and cross-linking degree of the fiber after zone 3 of sulfonation.
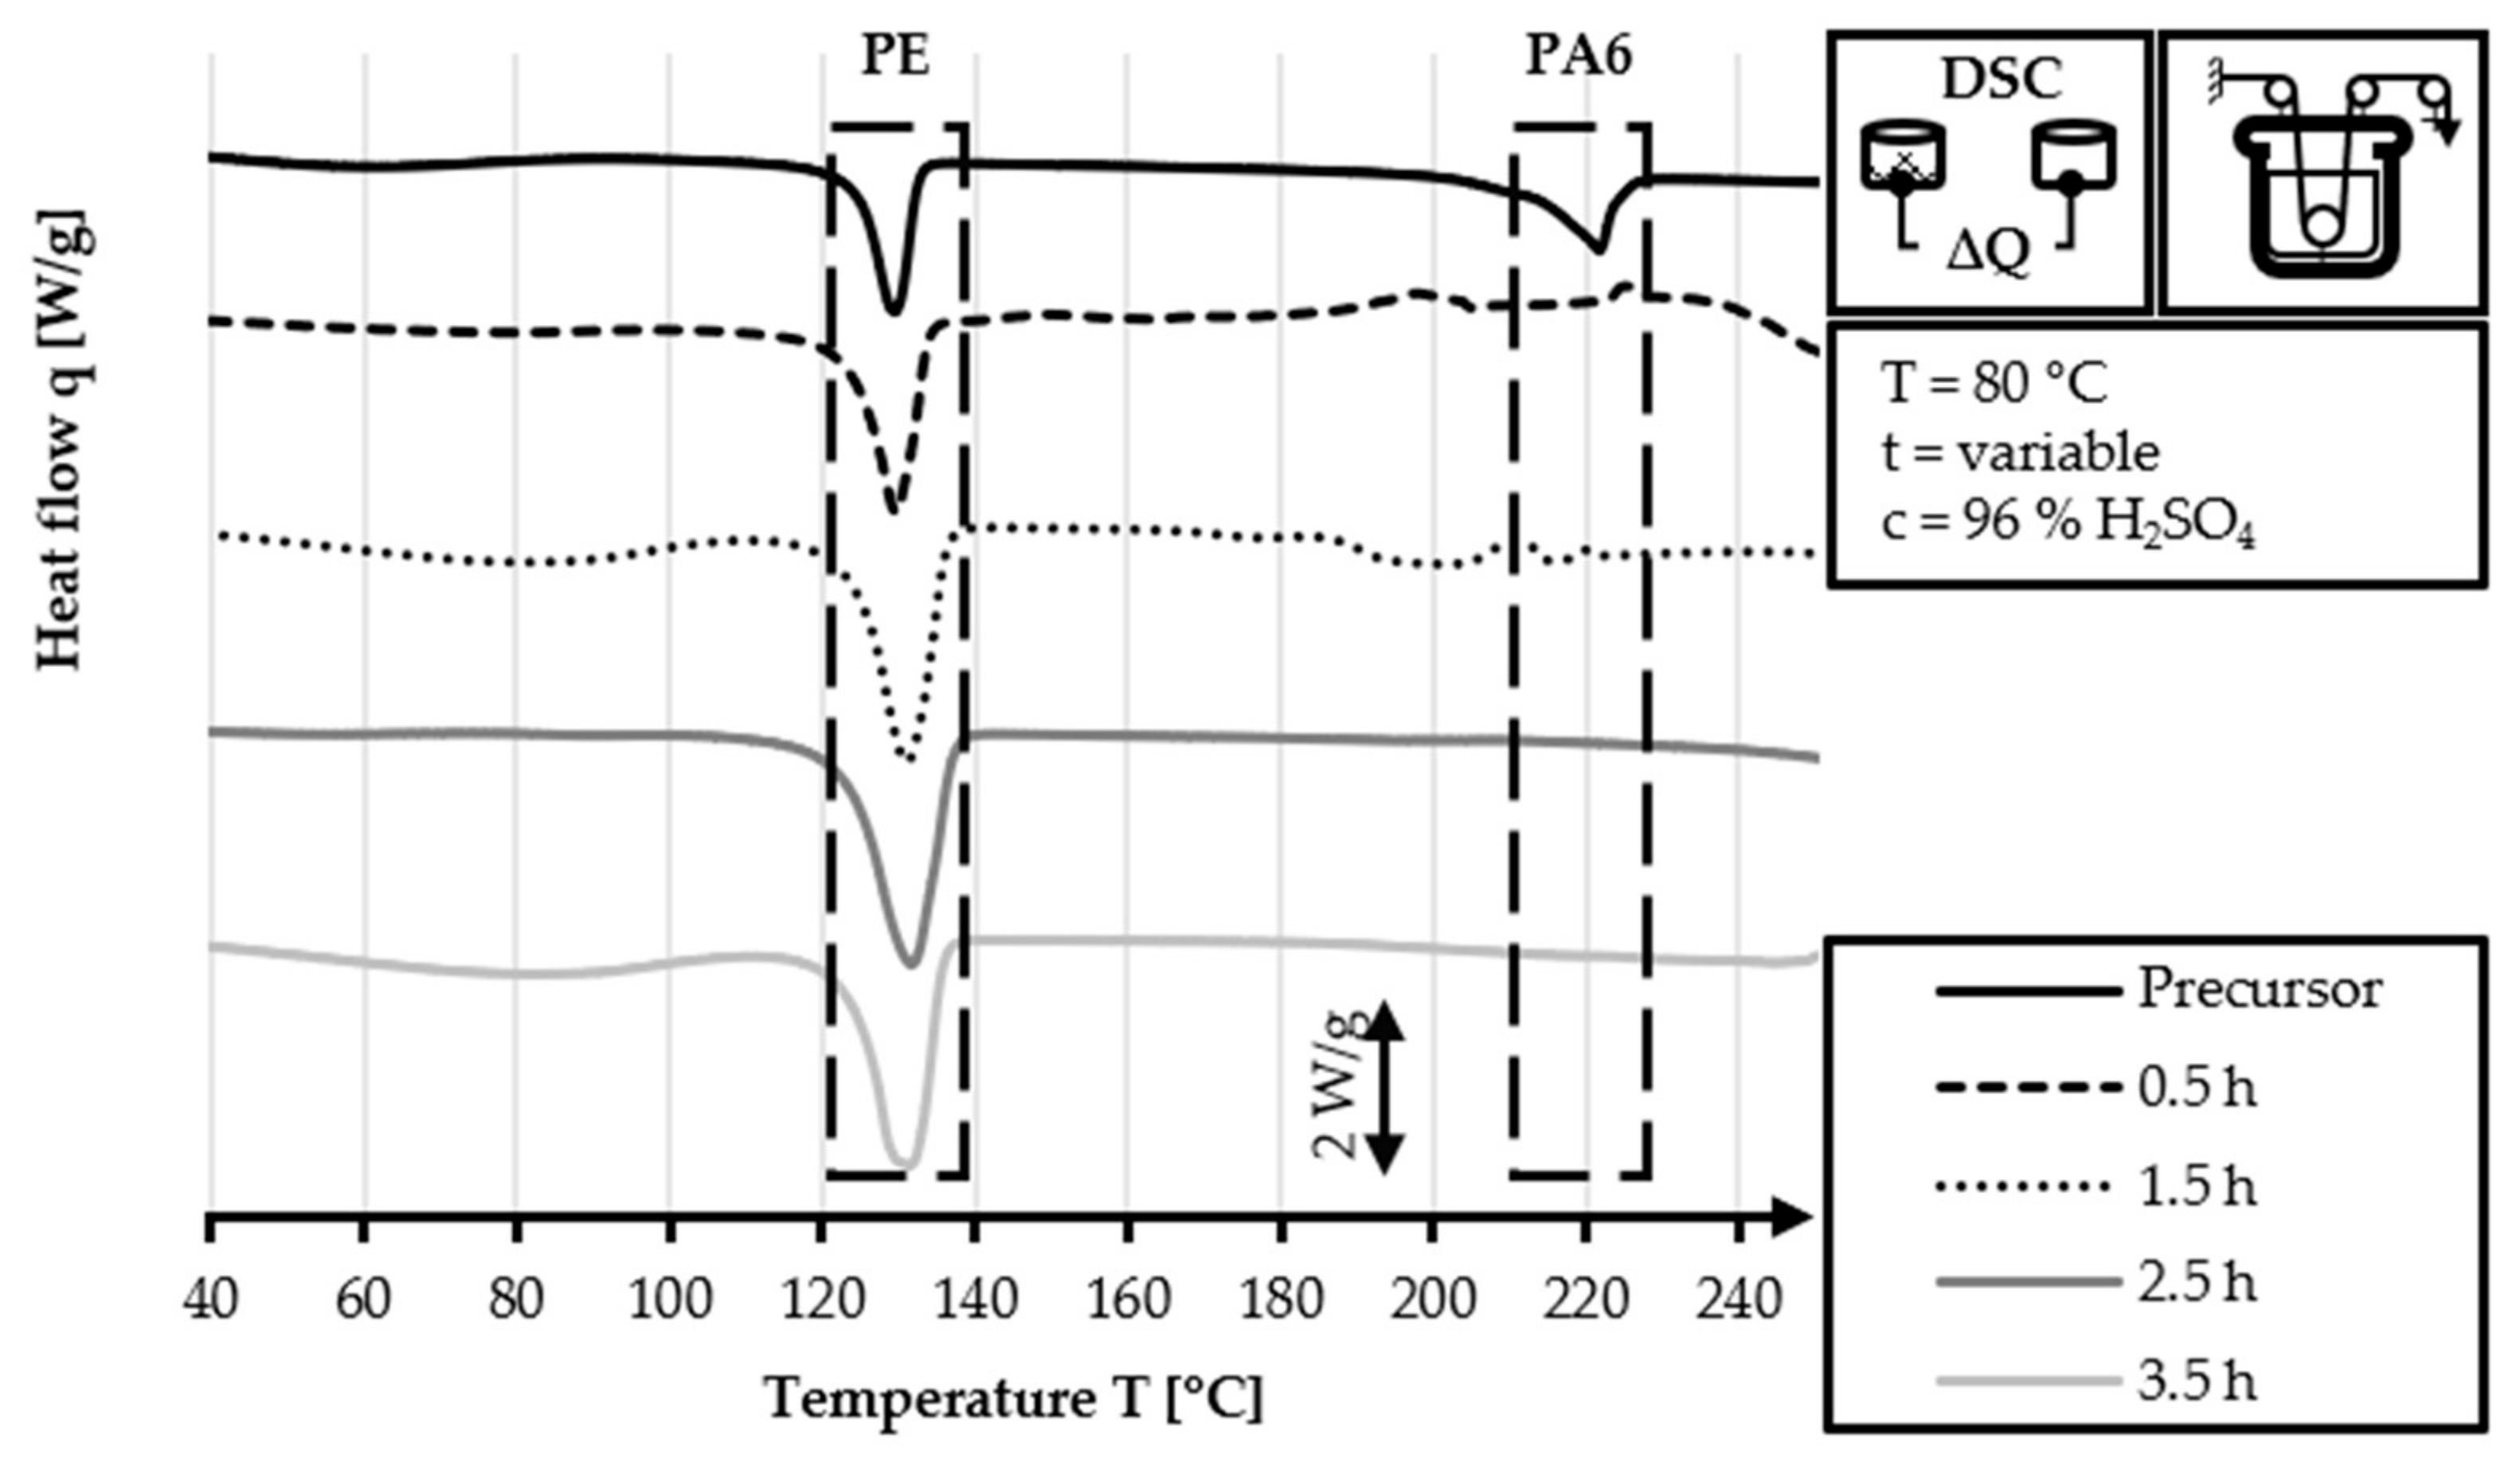
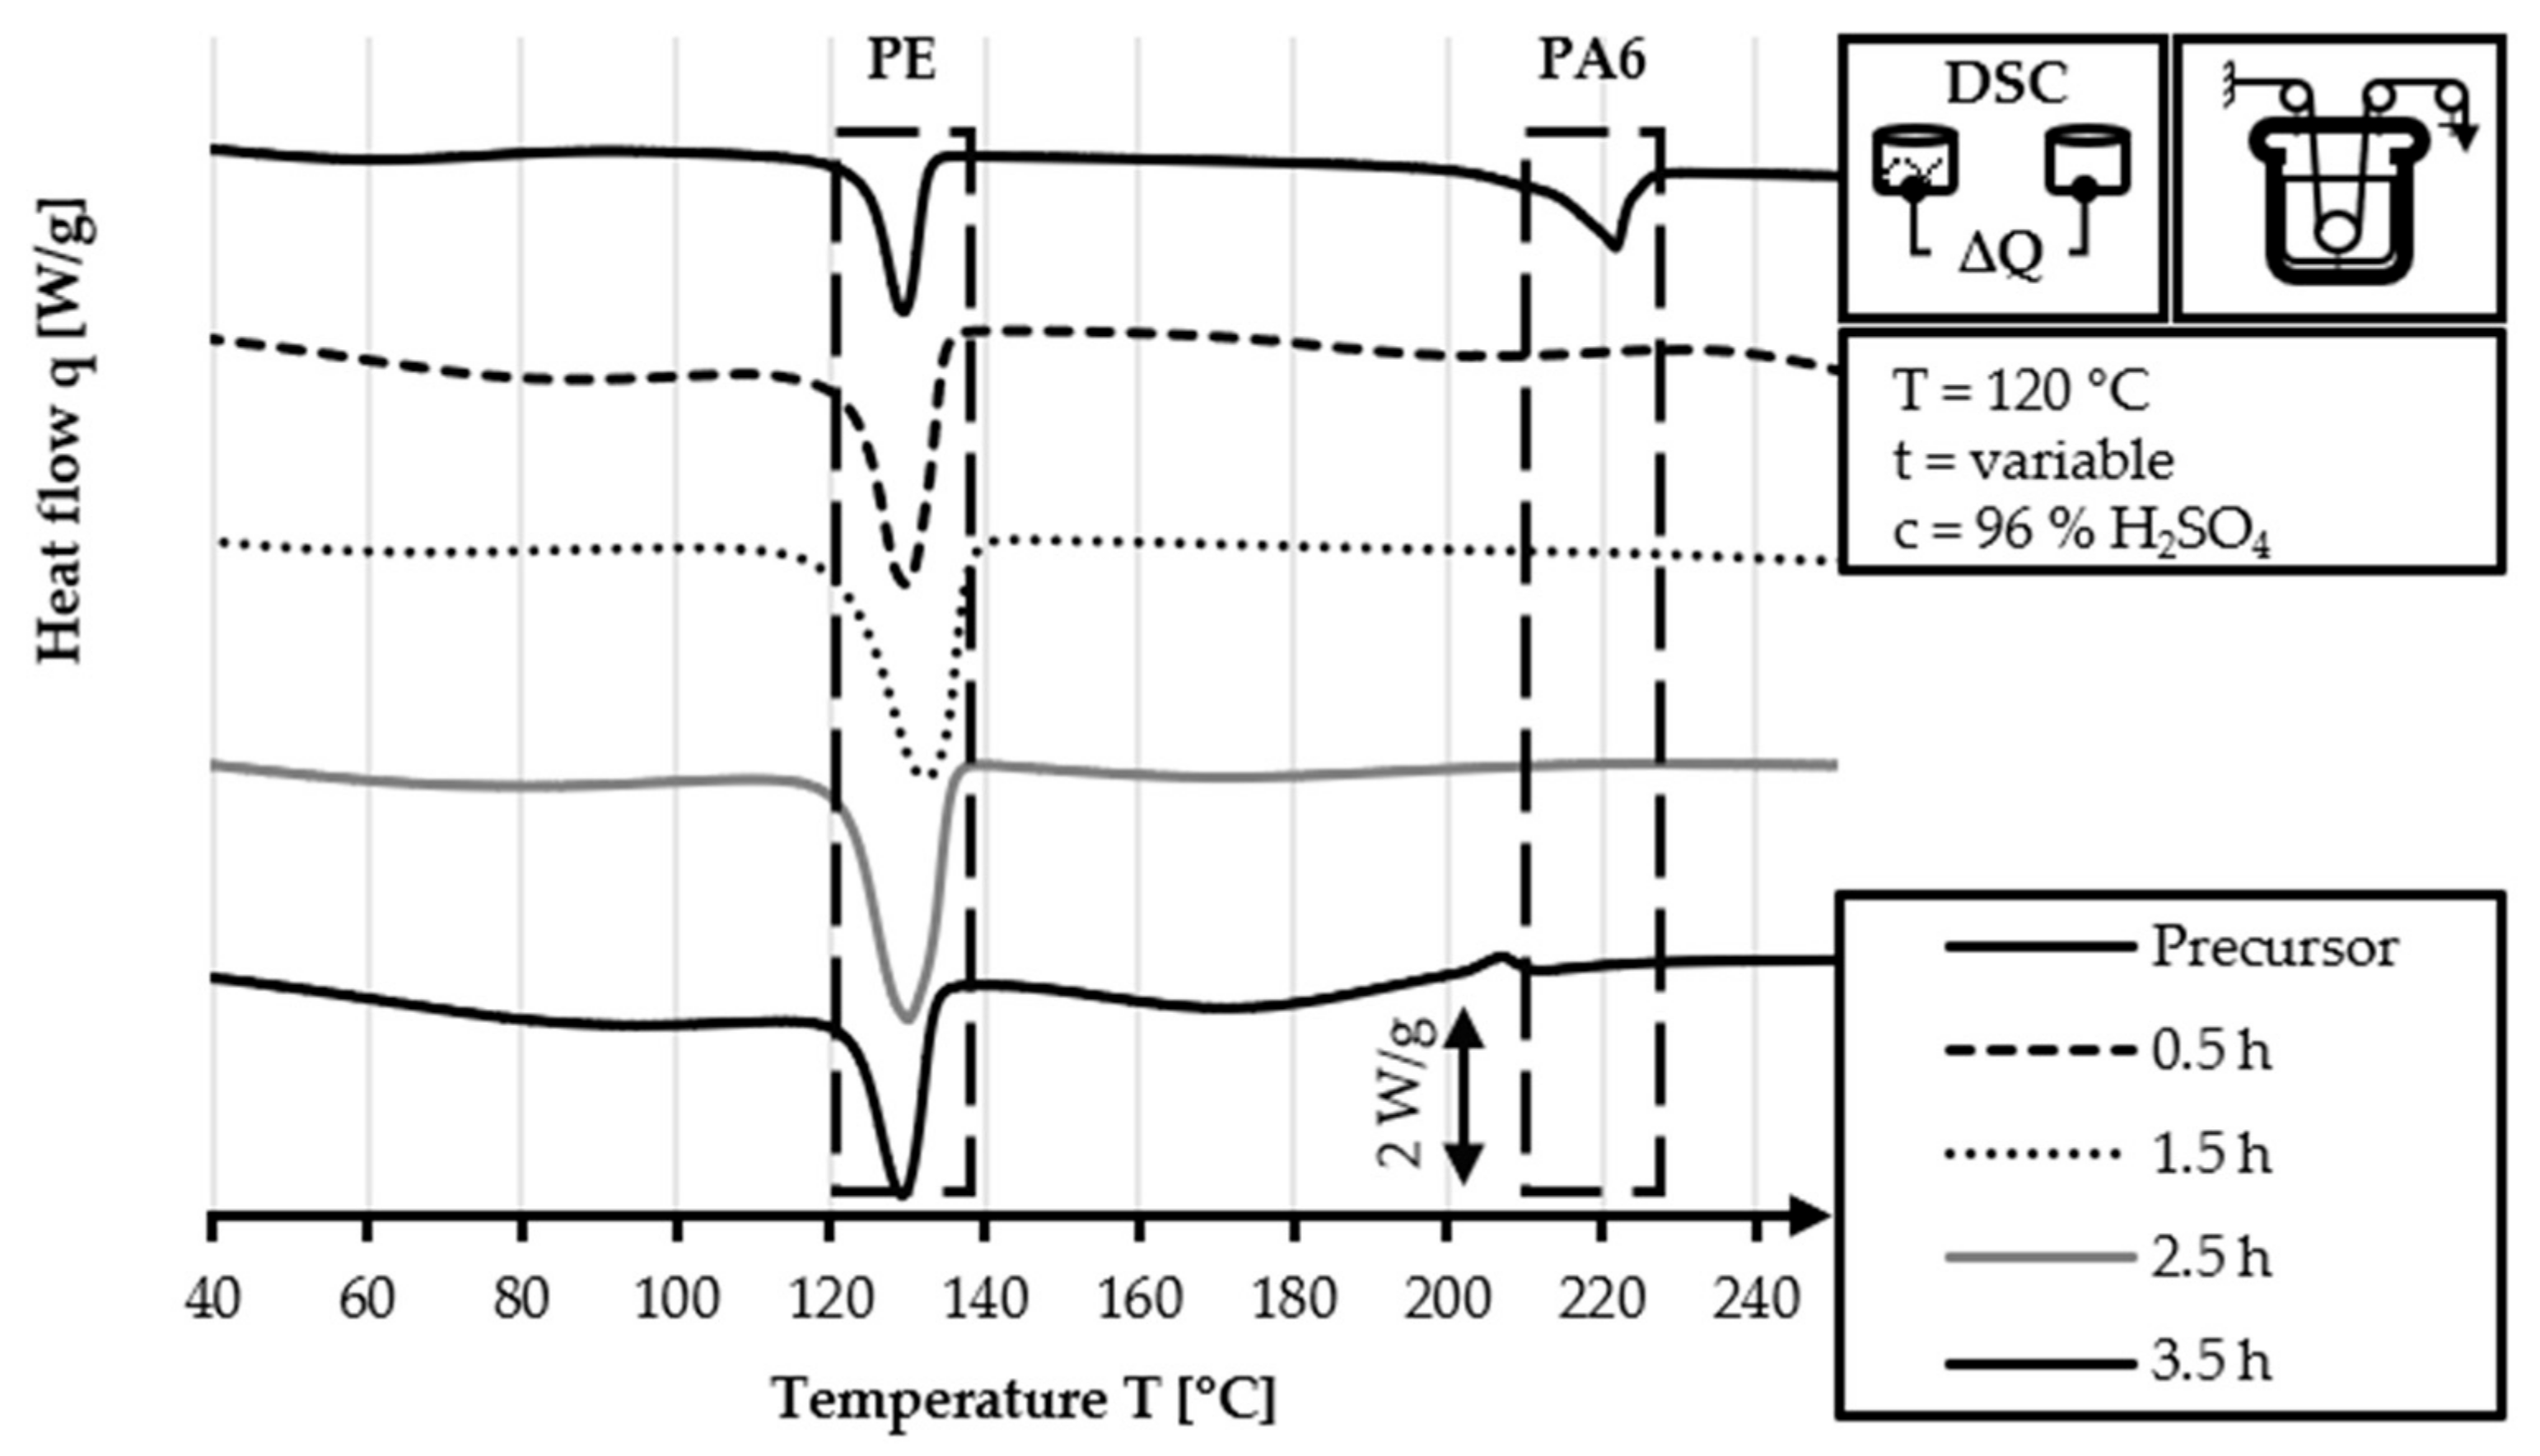
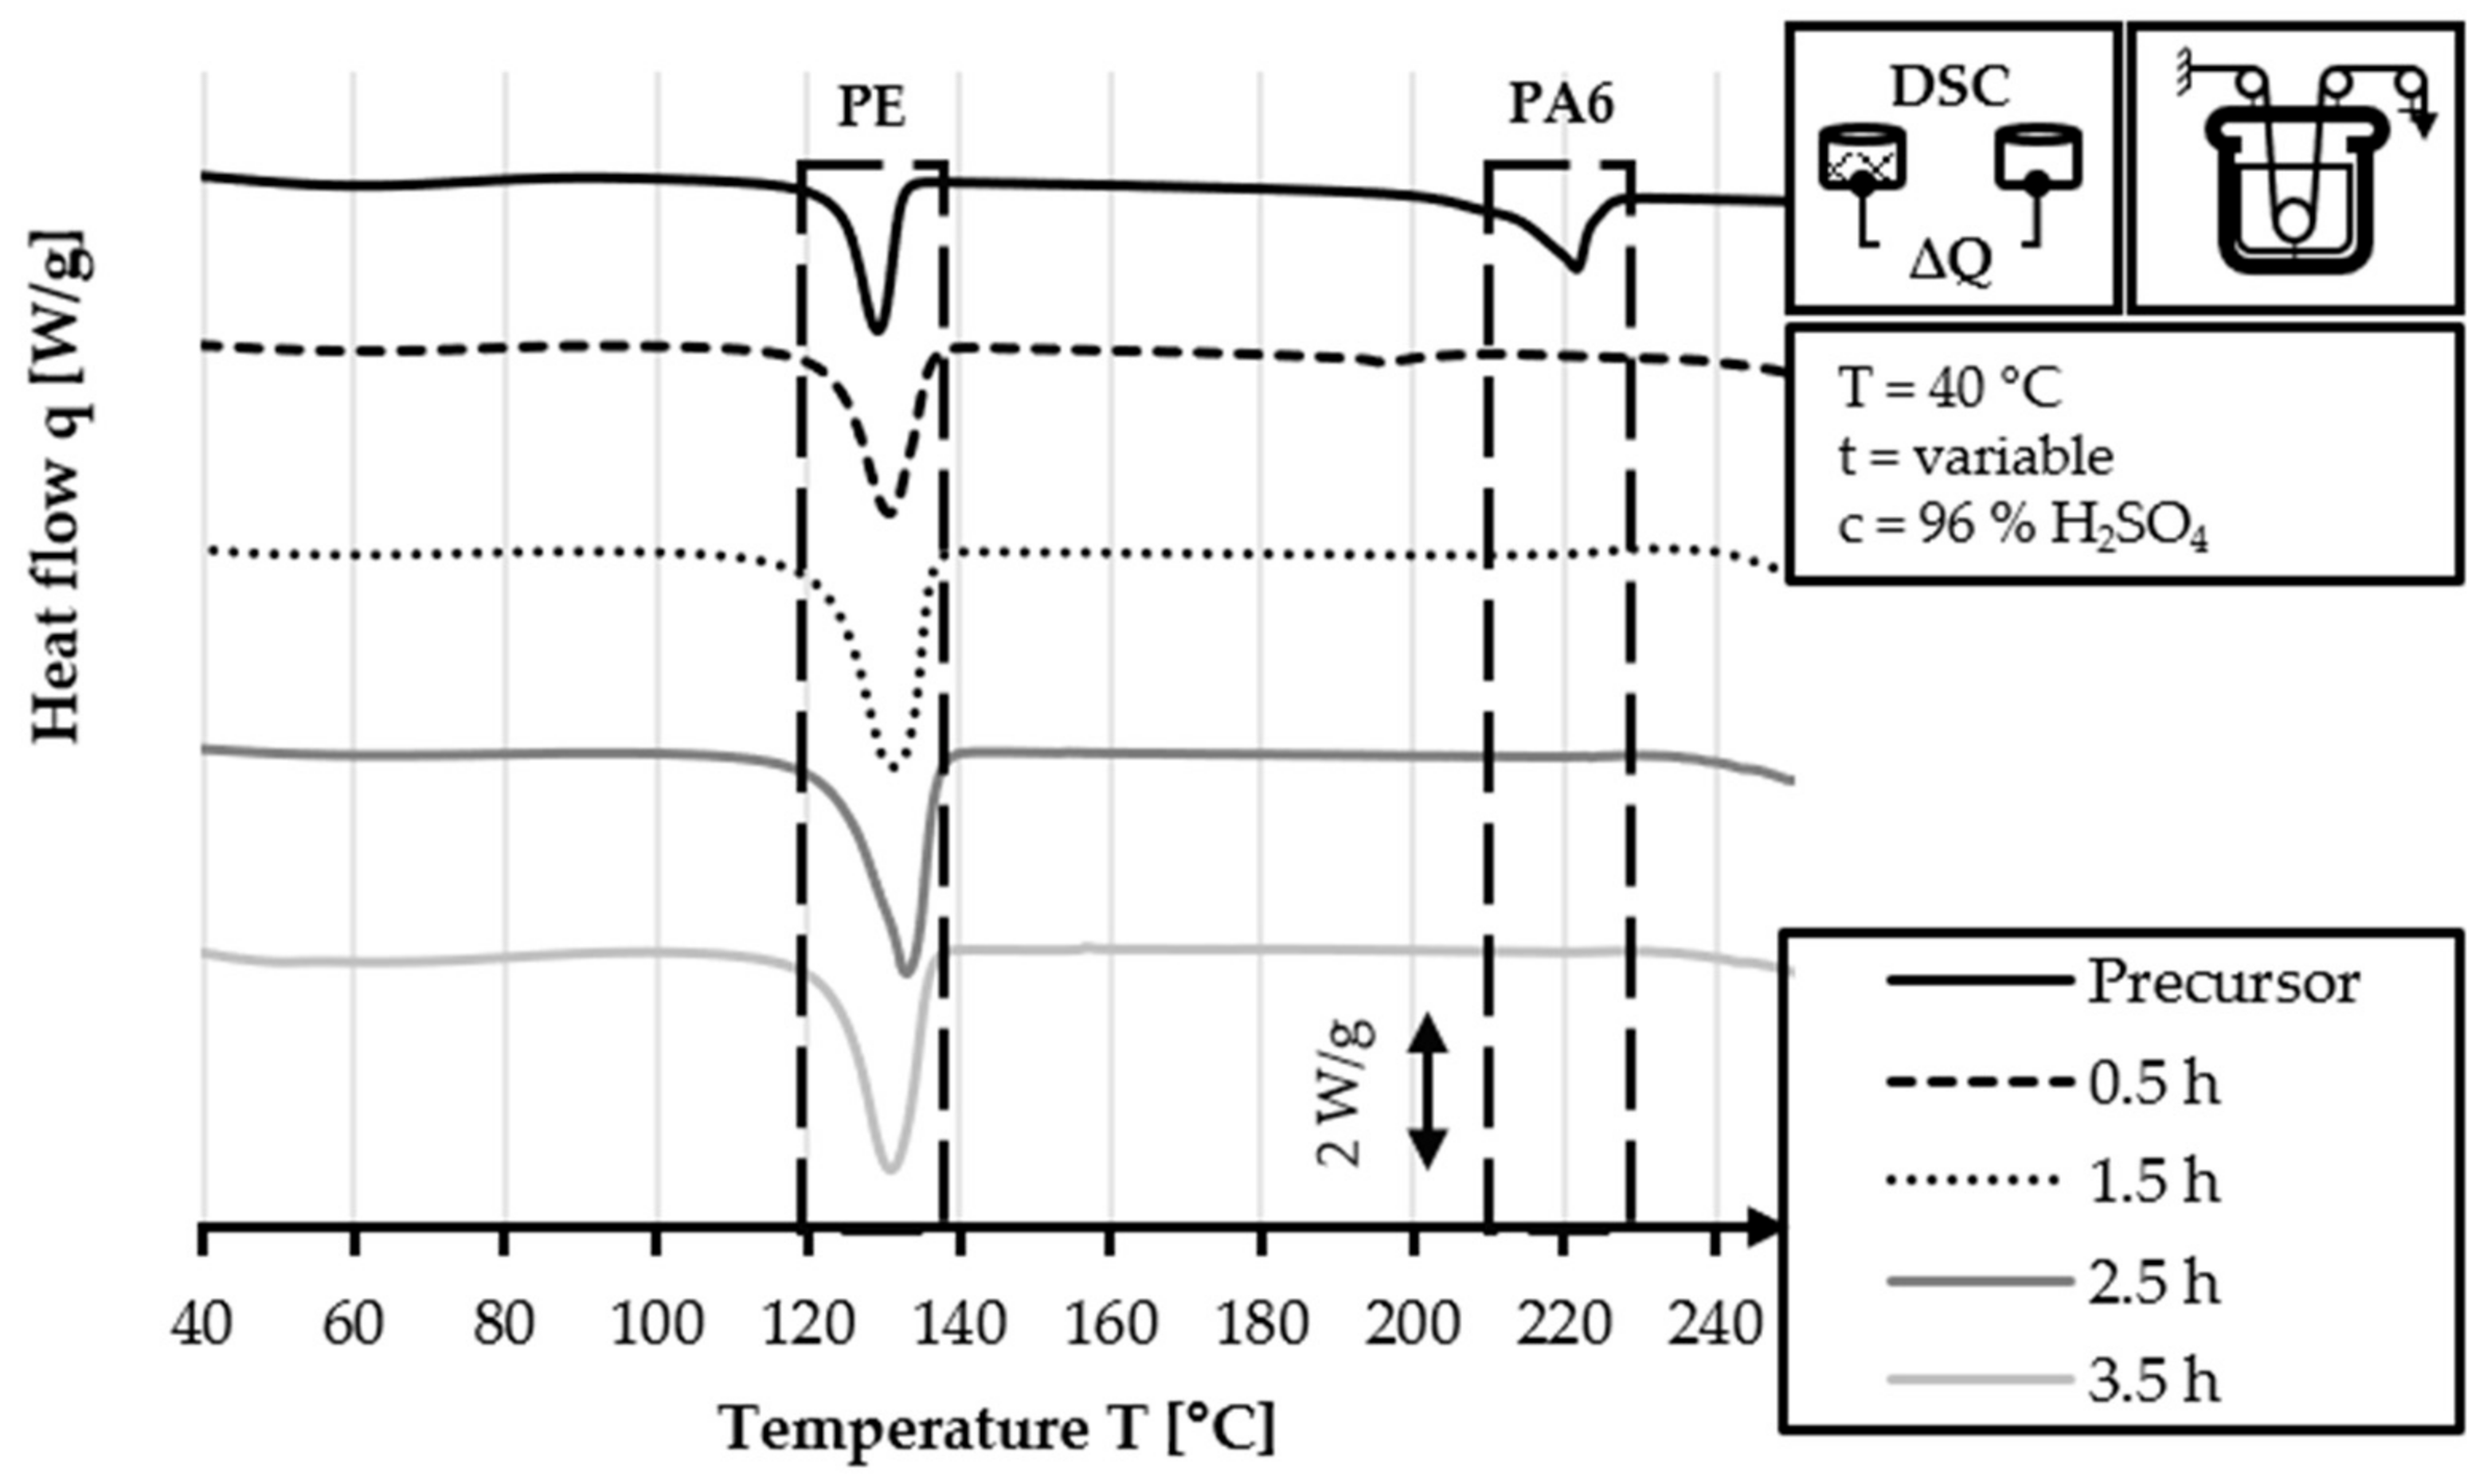
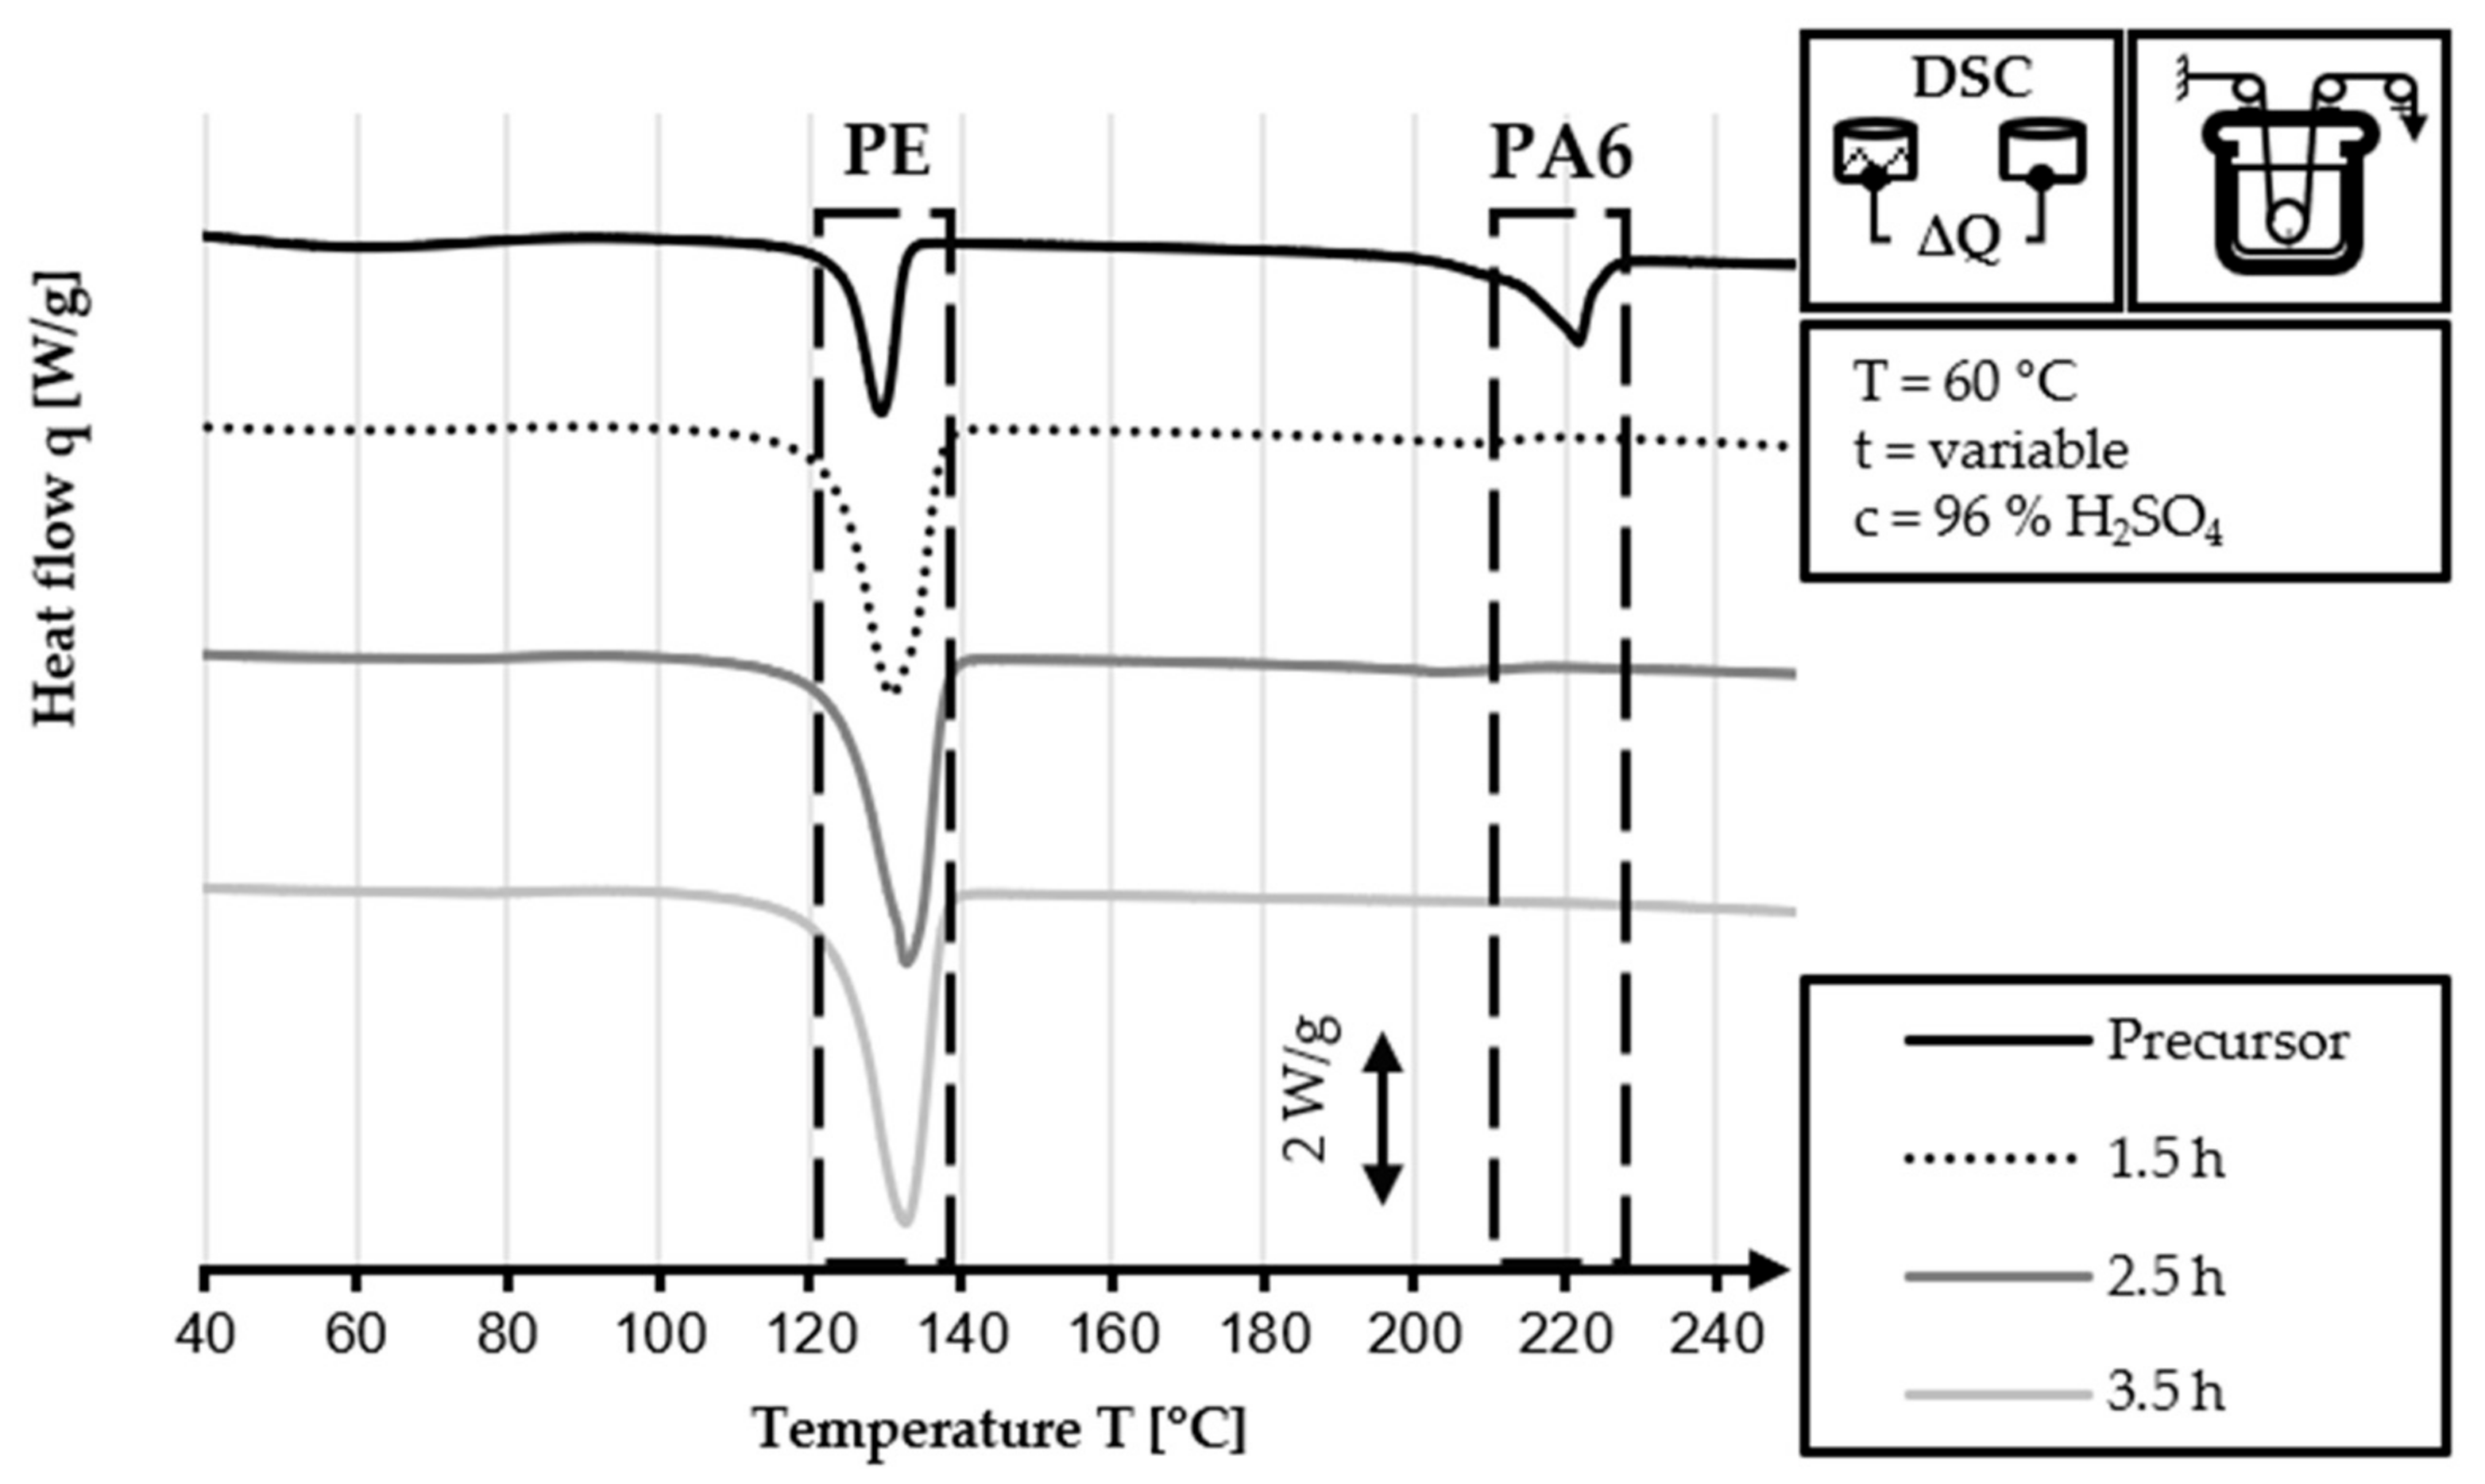
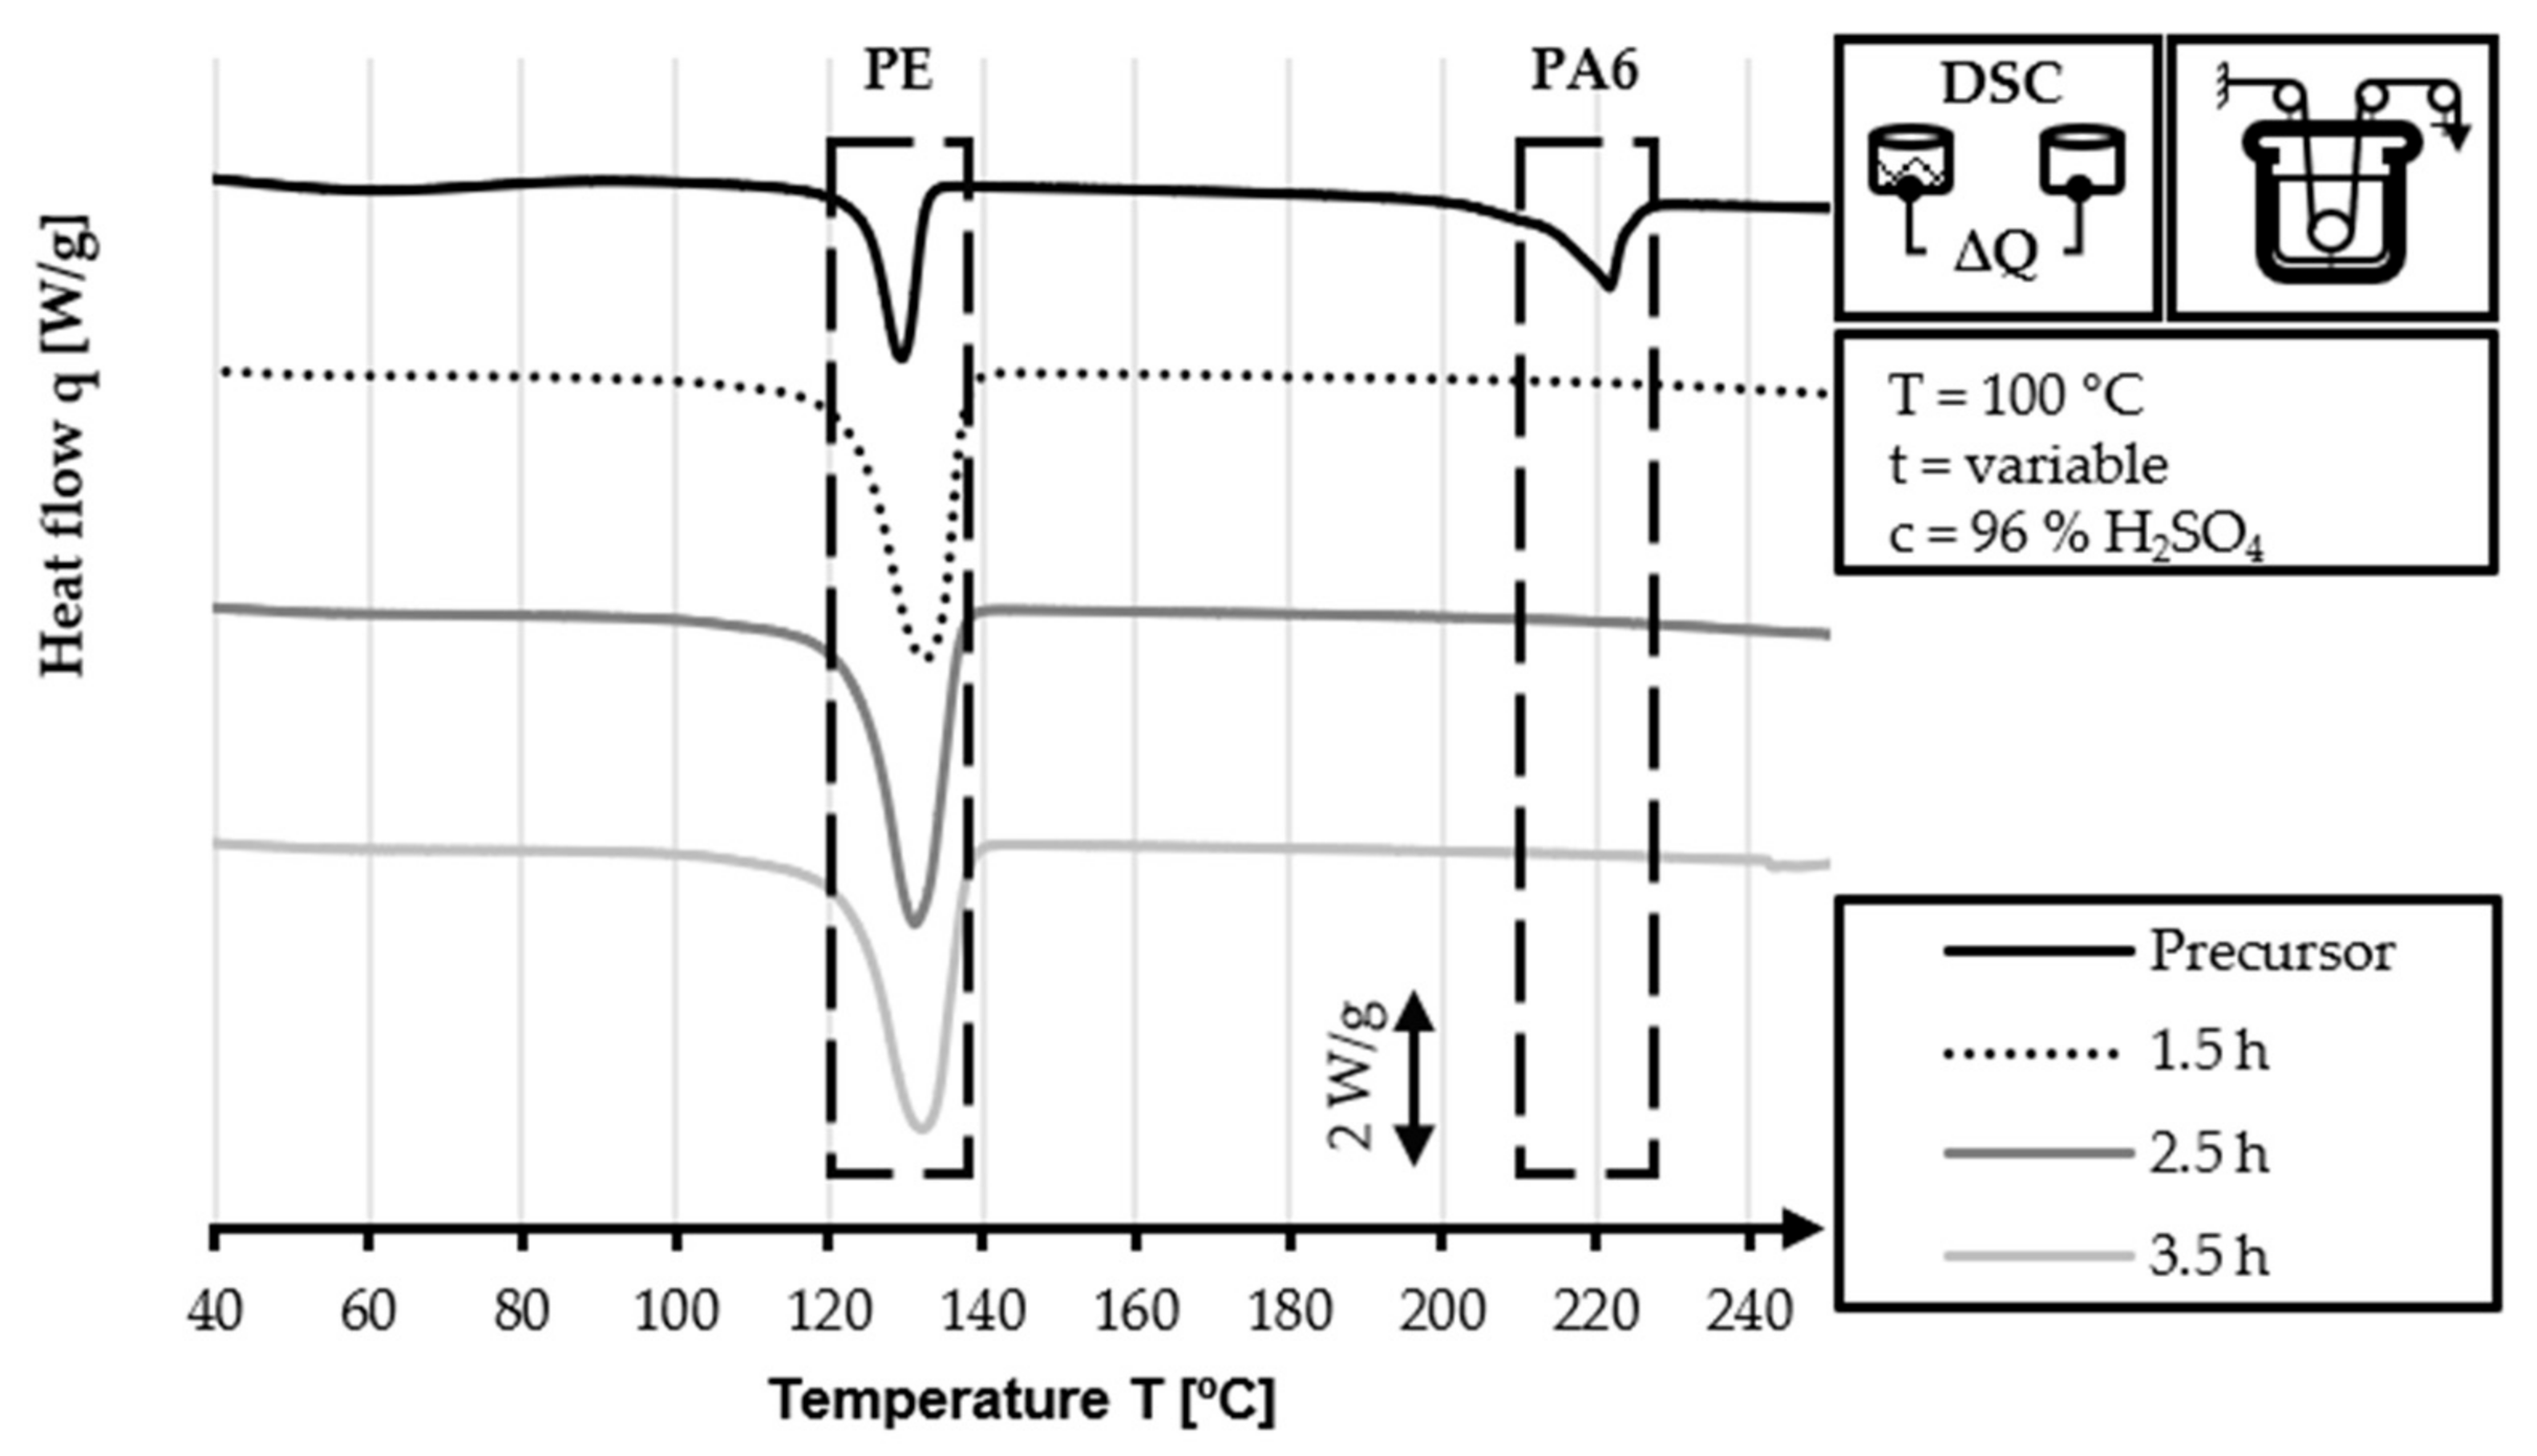
The DSC analysis of the 40/2 and 60/2 samples from the continuous stabilization trials does not exhibit any peaks related to PA6 (220 °C) in their DSC curves, unlike that of the HDPE-INS precursor. Additionally, the sharp PE precursor peak at 130 °C diminishes in size as the sulfonation process progresses and eventually disappears completely in the DSC curve of the samples of zone 3 and zone L3. In the DSC curves of zones 2 and 3 (L2 and L3, respectively), shallow endothermic depressions can be observed in the 60–130 °C and 160–225 °C temperature ranges. These depressions are probably caused by the hygroscopic behavior of sulfonic acid groups incorporated by sulfonation. The DSC measurements of sulfonated PE give only an indication of the dismantling of the crystalline structure and do not provide specific information regarding the cross-linking density and stabilization level, as is the case in stabilized PAN fibers. Comparing the DSC curves of both approaches (40 °C or 60 °C dissolution temperature), no significant identifiable differences are observed.
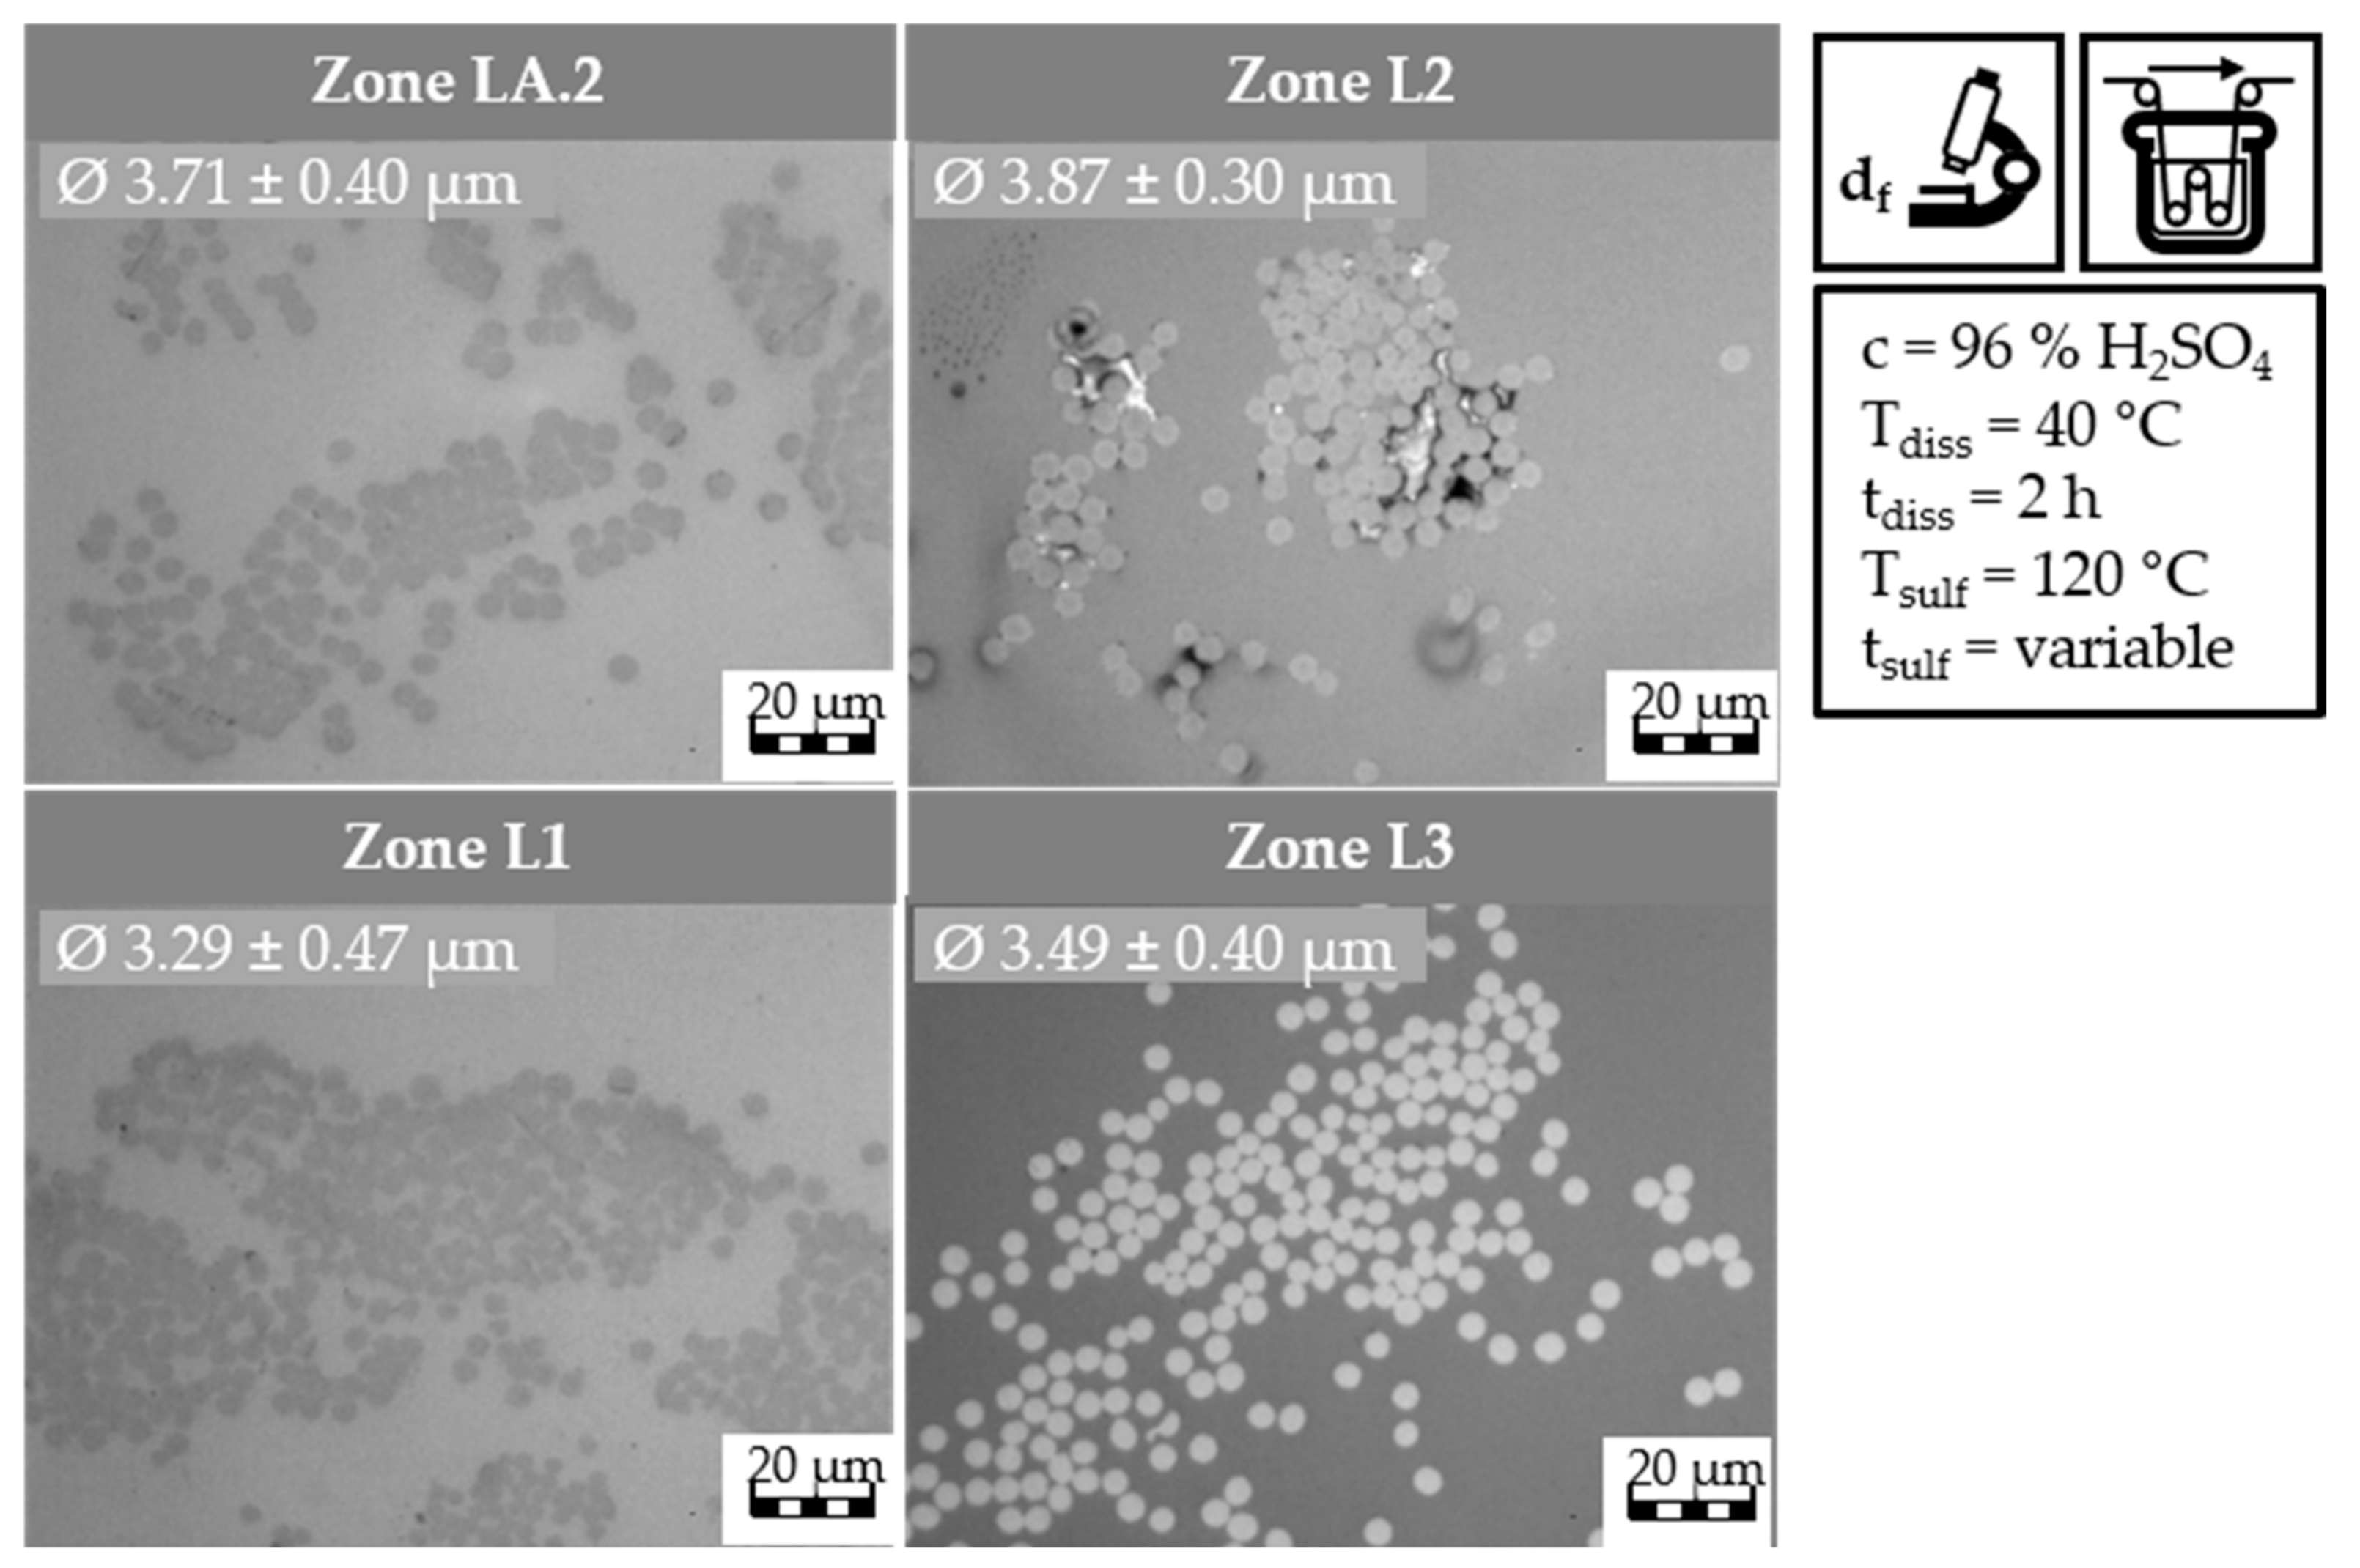
Light microscopy is employed to observe and investigate cross-sections of the filaments. The light microscopy images and the measured filament diameters of the continuous stabilization trials with the dissolution temperature of 40 °C are presented in Figure 15.
The light microscopy image of the continuous stabilization sample from zone LA.2 reveals round filaments with an average filament diameter of 3.71 ± 0.40 μm. In zone L1, the observed filaments are also round, with a slightly smaller average diameter of 3.29 ± 0.47 μm. Moving to zone L2, the filament diameter increases to an average of 3.87 ± 0.30 μm. Lastly, in zone L3, the round filaments exhibit an average diameter of 3.49 ± 0.40 μm. The filament diameter of the continuous stabilization trial samples with 40 °C dissolution temperature follows an interesting trend. From zone LA.2 to zone L1, the diameter shows a slight decrease, suggesting that some residuals from PA6 may still be present in zone LA.2 and that in that zone the swelling of the filaments is more pronounced, resulting in thicker filaments. The swelling is influenced by many factors, such as the applied tension on the fiber and the uptake of water from the washing bath. The latter could contribute to the thicker filaments from zone LA.2. The diameter then increases from zone L1 to zone L2, indicating swelling and incorporation of sulfur-containing groups. In zone L3, the filament diameter becomes slightly smaller compared to zone L2, which could be attributed to desulfonation reactions leading to cross-linking and resulting in thinner filaments. Overall, the filaments obtained from the continuous stabilization trials are thinner, compared to the filament diameters of the fibers from the batch sulfonation trials. This can be attributed to the increased tensile stress applied during the continuous stabilization process.
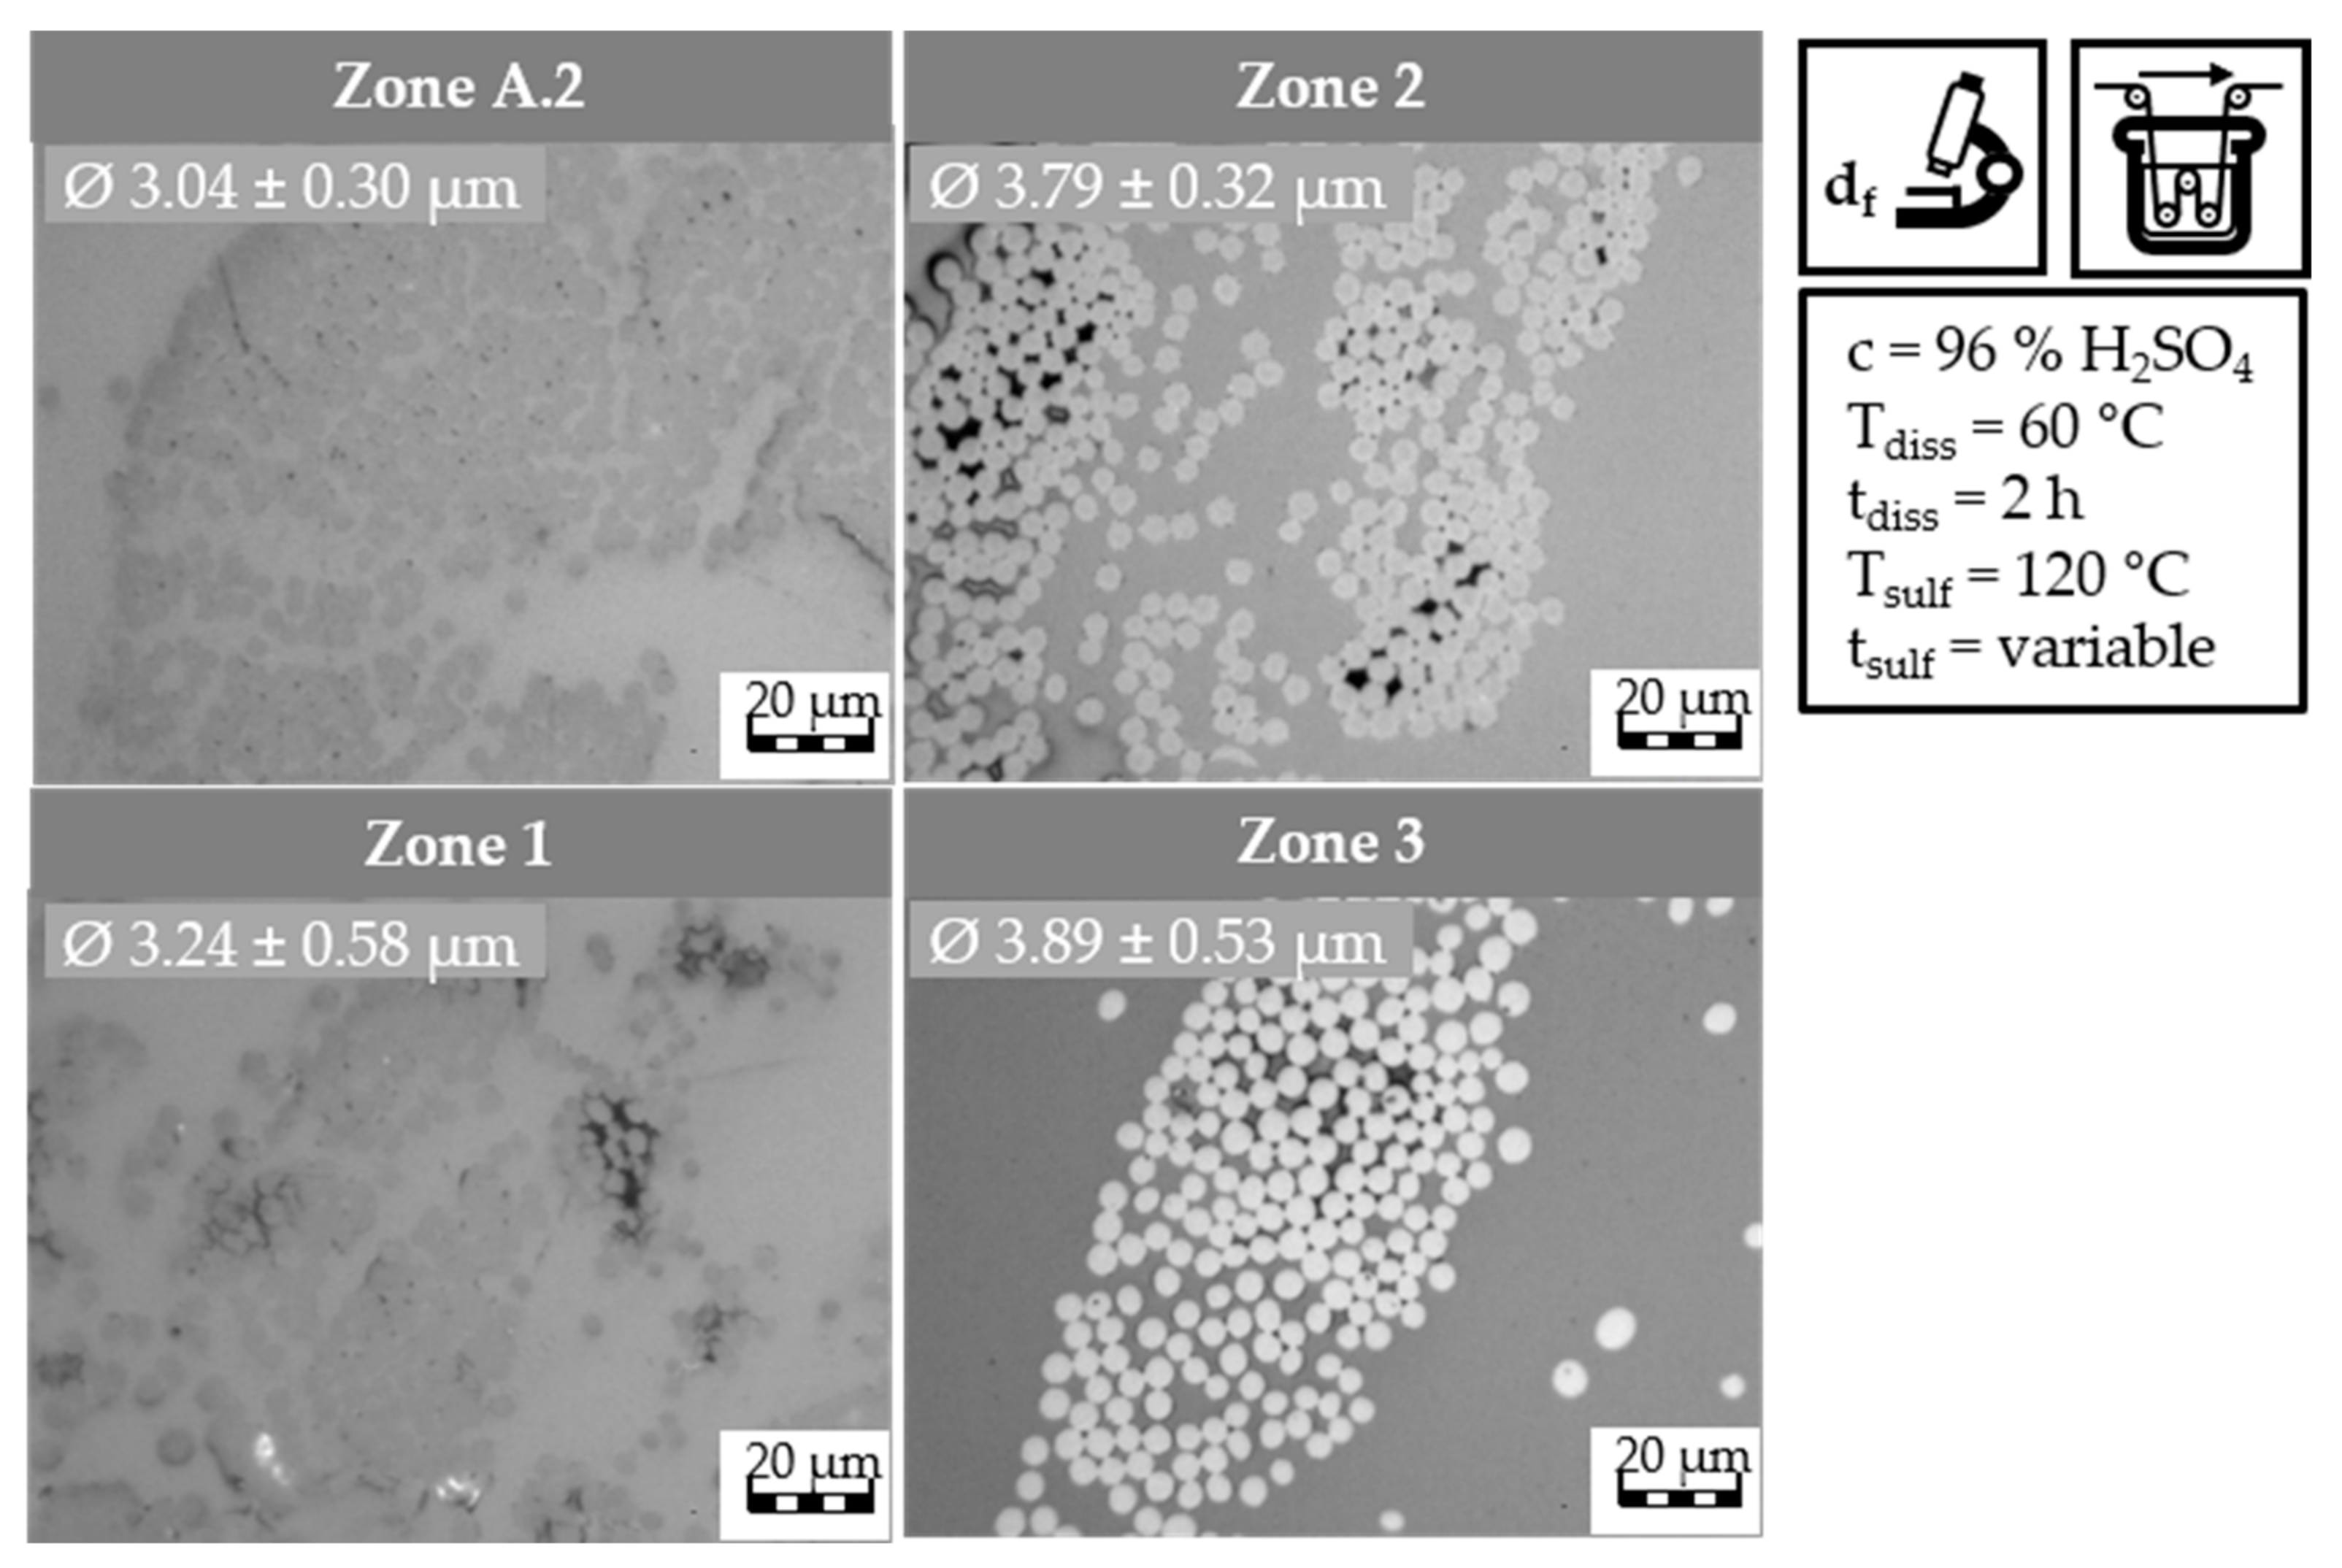
The light microscopy images and filament diameter values for the continuous stabilization trials with 60 °C dissolution temperature are presented in Figure 16.
The filament diameters of the samples from the continuous stabilization trials with a dissolution temperature of 60 °C follow a clear upward trend. The sample from zone A.2 exhibits the smallest filament diameter, measuring 3.04 ± 0.30 μm. The filament diameter increases for the sample from zone 1 (3.24 ± 0.58 μm). The light microscopy image of the sample from zone 2 reveals round filaments with an average filament diameter of 3.79 ± 0.32 μm. Lastly, zone 3 displays thicker round filaments with an average diameter of 3.89 ± 0.53 μm. The filament diameter increases throughout the stabilization processes as a result of swelling and the incorporation of sulfur-containing groups. Comparing the filaments from the continuous stabilization approach to those from batch stabilization, the former provides smaller diameters due to the higher tensile stress applied in the continuous process, which limits filament swelling, by making the incorporation of for example water from the washing bath more difficult. A comparison of the filament diameters for both approaches is presented in Table 14.
The filament diameter of the 60/2 approach exhibits a consistently increasing trend, which aligns with expectations, as swelling and the incorporation of sulfur-containing groups are induced by the sulfonation process. However, the samples from the 40/2 approach deviate from this trend. Specifically, the filament diameter of the fibers after the dissolution of PA6 (zone A.2) should be the lowest, resembling the diameter of PE filaments in the virgin HDPE-INS precursor (2.93 μm). However, this is not the case, as the filament diameter measures 3.71 ± 0.40 μm. This discrepancy suggests that the dissolution of PA6 may not be complete, and a layer of PA6 still coats the individual PE filaments, requiring further dissolution in the first sulfonation zone and delaying the initiation of the sulfonation reactions.
In general, the continuous stabilization process is successful. The fibers stabilized through continuous dissolution of PA6 and continuous sulfonation exhibit round filaments with a diameter of less than 4 μm and demonstrate a high degree of sulfonation and cross-linking. Fibers obtained from zones L3 and zone 3 exhibit thermal stability, making them suitable for carbonization trials to produce CF without significant structural defects or hollow structures.

3.2.3. Carbonization

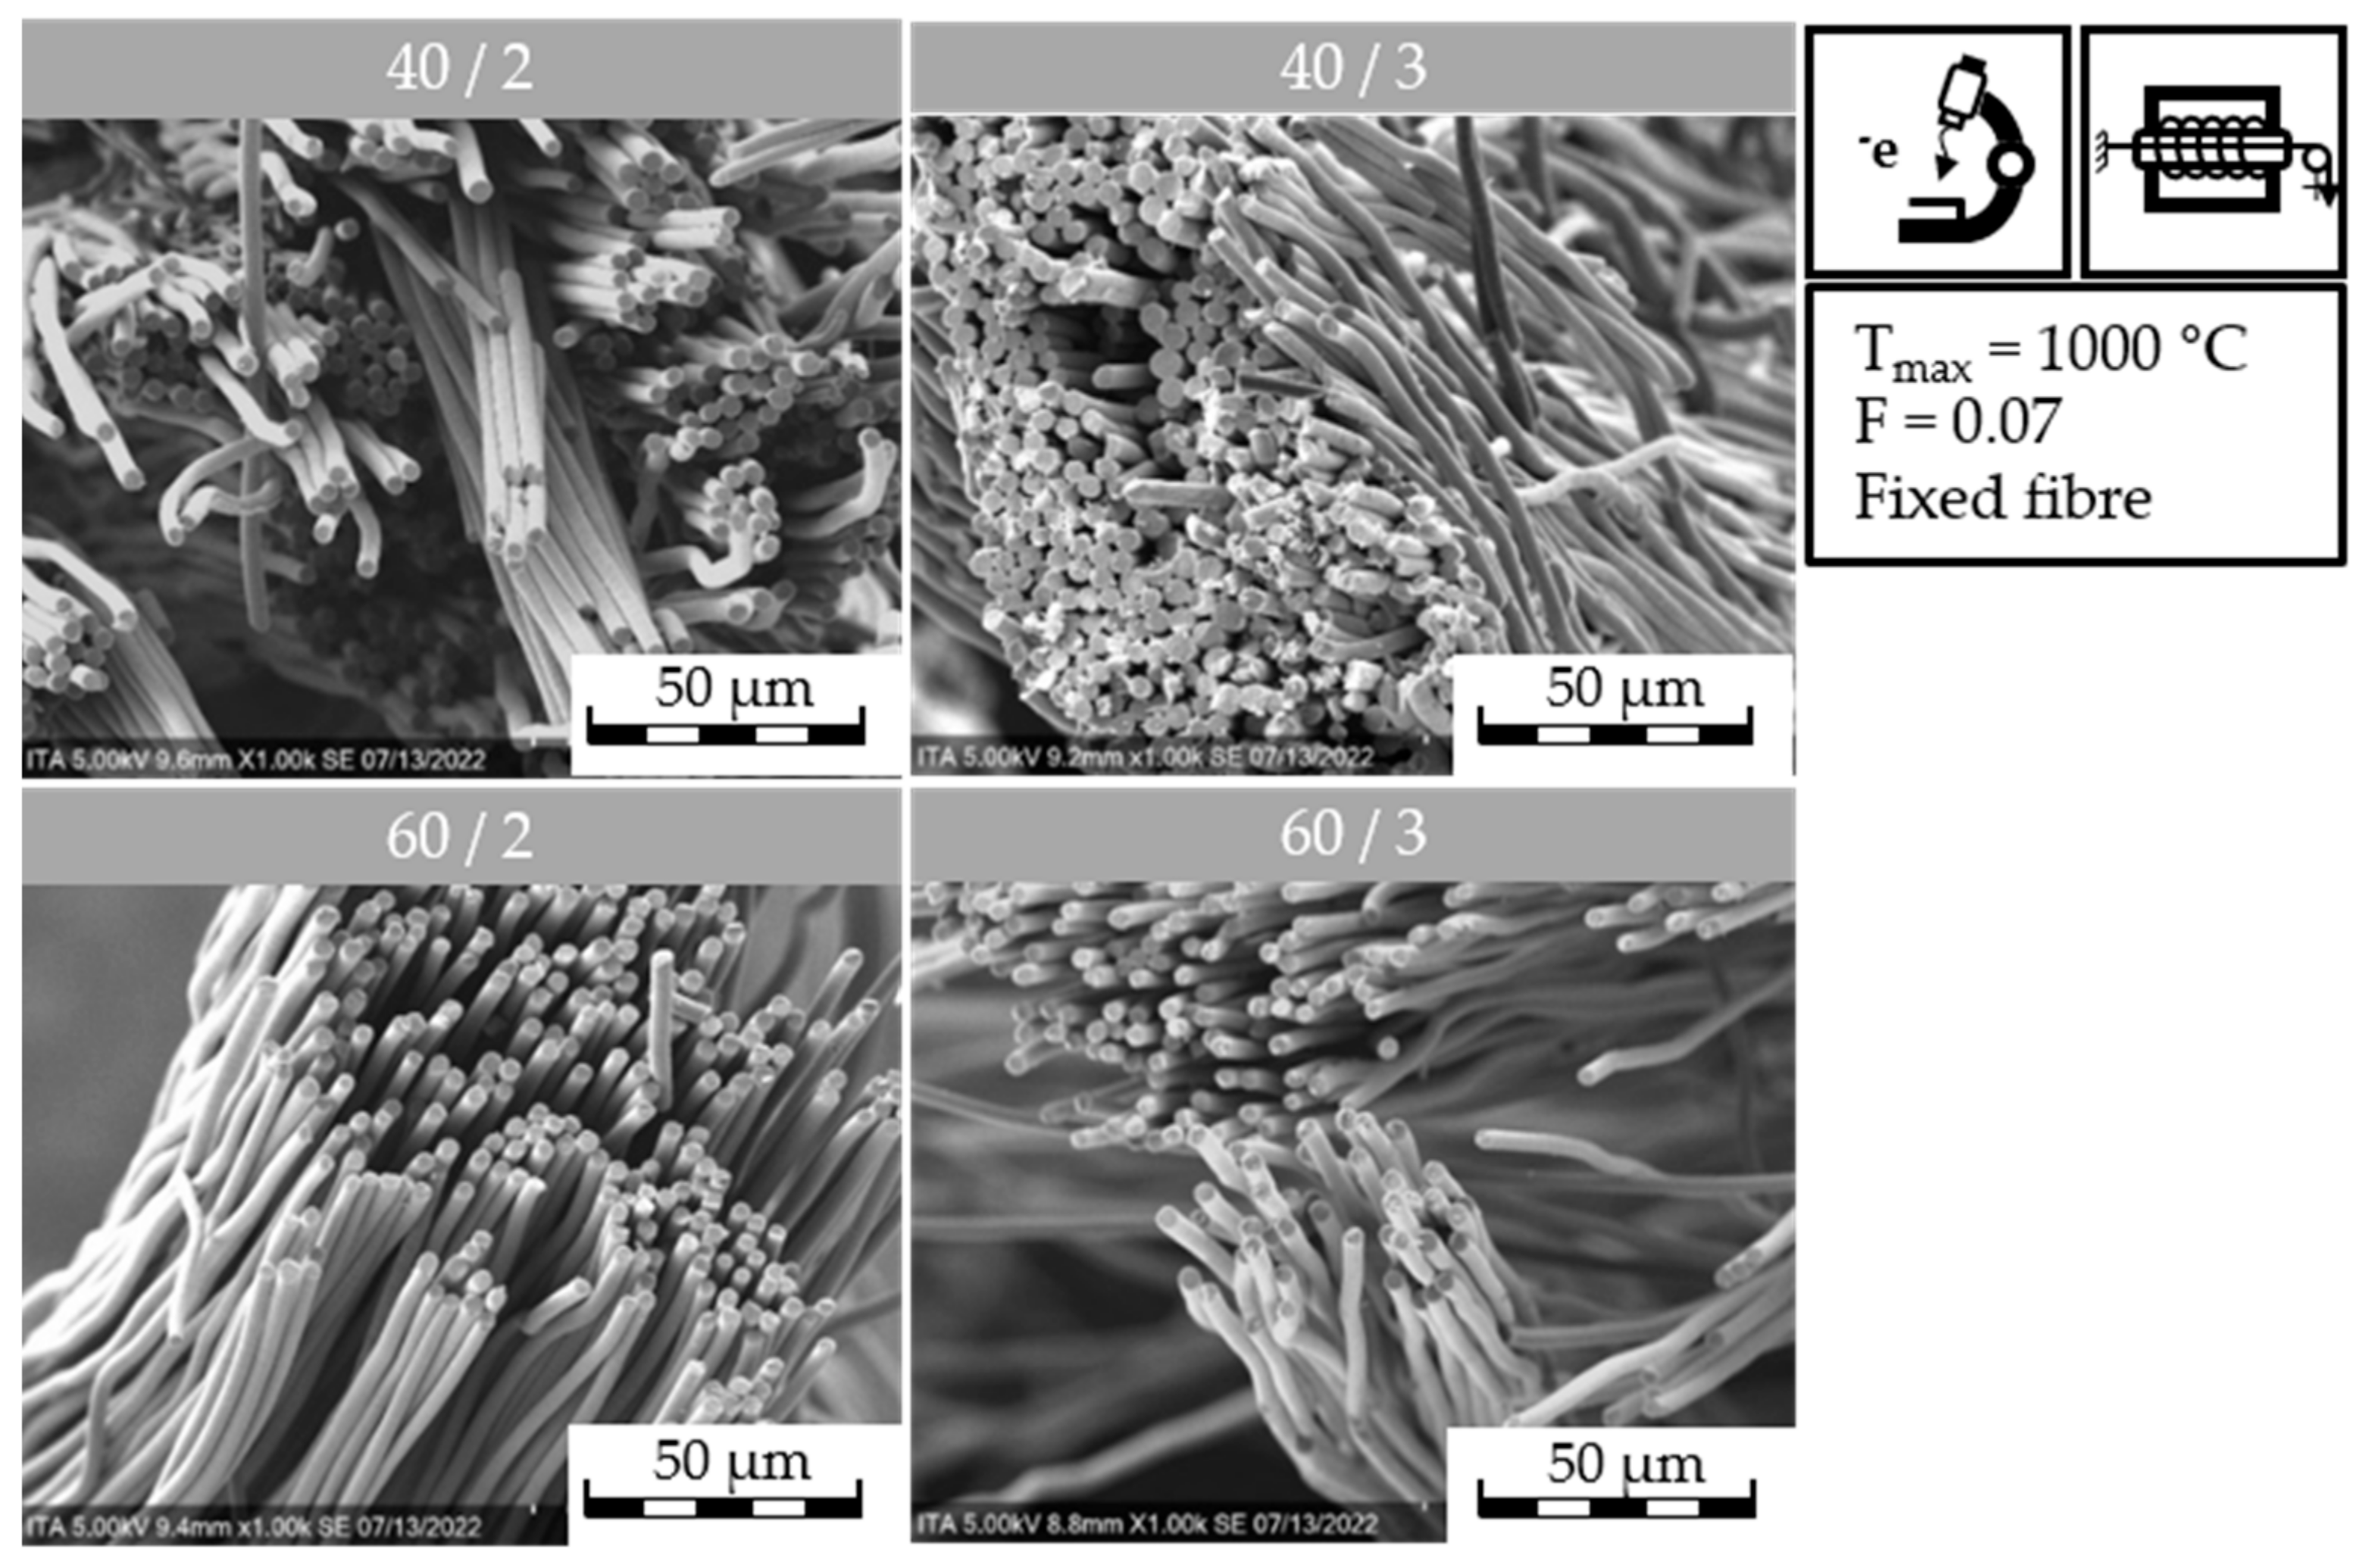
After the successful continuous stabilization of the HDPE-INS precursor, the stabilized fibers undergo carbonization trials to validate the developed concept for ultra-thin CF production. Initially, batch carbonization trials are conducted using both stabilized fibers. The results, including fiber shrinkage, CF filament diameters, and measured fiber density, are summarized in Table 15.
The stabilized fiber from zone L3 undergoes carbonization up to 900 °C with a force of 0.5 N applied to the fiber. During the carbonization process, the 40/2-zL3-900 °C fiber experiences a 13% shrinkage in length, attributed to desulfonation reactions, cross-linking reactions, and thermal shrinkage. The resulting CF has a fiber density of 1.532 ± 0.002 g/cm3 and filaments diameter of 2.45 ± 0.43 μm. When carbonized up to 1100 °C, the 40/2-zL3-1100 °C fiber exhibits an increased fiber shrinkage of 14%. The fiber density increases to 1.634 ± 0.009 g/cm3, while the filament diameter remains similar at 2.51 ± 0.25 μm. These changes align with expectations as higher carbonization temperatures enhance cross-linking and remove non-carbon atoms, leading to increased fiber density, while the applied force on the fiber contributes to further density increases. The release of the sulfur-containing groups happens in the temperature range of 120–400 °C and results in a decrease in fiber density. Nevertheless, the density decrease in this temperature range is compensated by the cross-linking reactions combined with the release of hydrogen atoms from 600 °C onwards. The differences in fiber density of samples carbonized at 900 or 1100 °C are therefore mostly caused by hydrogen release and cross-linking reactions, which indeed increase the fiber density. An extensive description and analysis of the reactions happening in the different temperature ranges throughout the carbonization process were described by Barton et al. [21,34]. Notably, CF with filament diameters below 3 μm is successfully synthesized in both cases. Similarly, the fiber from zone 3 of the continuous stabilization with a dissolution temperature of 60 °C undergoes batch stabilization up to 900 °C (60/2-z3-900 °C) and 1100 °C (60/2-z3-1100 °C). Carbonization up to 900 °C results in a 14% fiber shrinkage. The CF exhibits a density of 1.464 ± 0.004 g/cm3 and a filament diameter of 2.46 ± 0.31 μm. With carbonization up to 1100 °C, the fiber experiences an increased shrinkage of 15%, resulting in CF with a filament diameter of 2.72 ± 0.28 μm and a density of 1.844 ± 0.005 g/cm3. Consistent with the previous case, the higher carbonization temperature leads to increased fiber density due to the removal of non-carbon atoms. Notably, the filament diameters of all samples fall within the desired range of 3 μm. Among the samples, the 60/2-z3-1100 °C CF exhibits the highest fiber density. Both approaches highlight that carbonization up to 900 °C is insufficient to achieve CF densities within the range of 1.8 g/cm3.
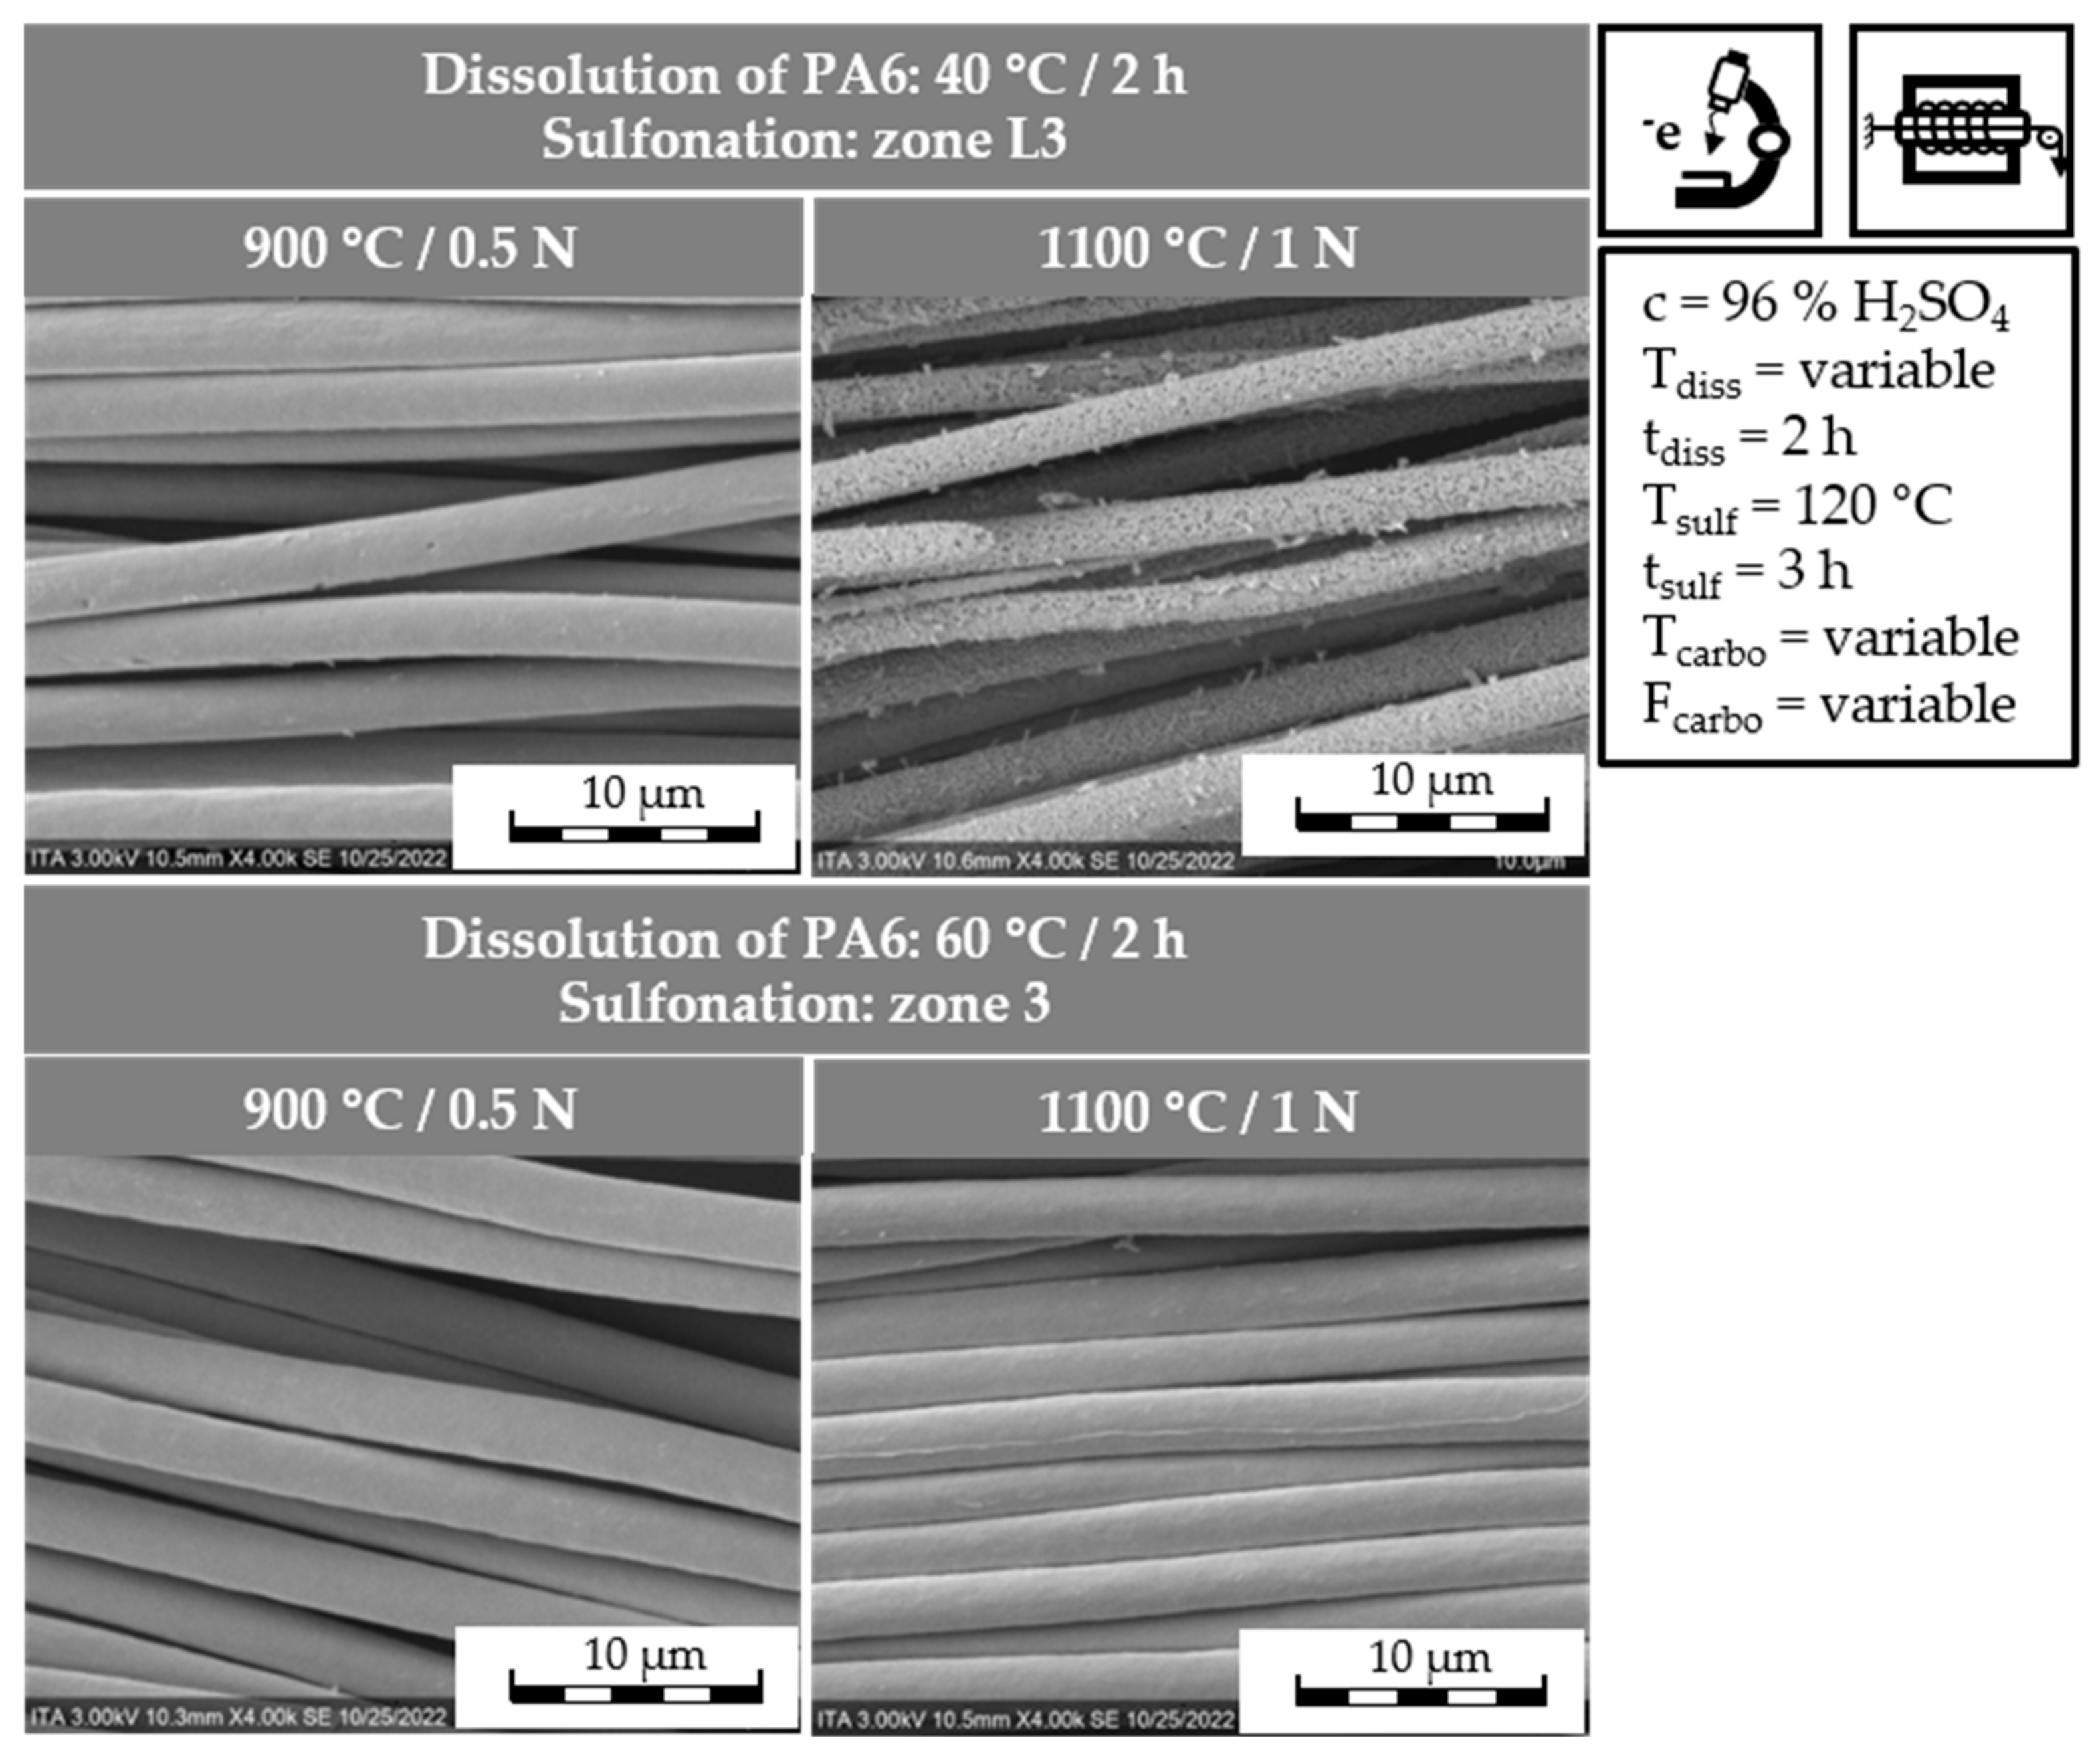
Figure 17 displays electron microscopy images of the CF produced in the batch carbonization trials.
The electron microscopy image of the 40/2-zL3-900 °C CF reveals the presence of small pores on the CF surface, indicating surface defects. These defects become more pronounced in the sample carbonized up to 1100 °C (40/2-zL3-1100 °C), where the filaments exhibit a rough surface with a higher number of pores. These incorporated pores, created during carbonization, have a lower density compared to CF and therefore result in a density decrease. This could potentially impact the mechanical properties of the CF. In contrast, the electron microscopy image of the 60/2-z3-900 °C CF, carbonized up to 900 °C, shows a smooth surface with no identifiable surface defects. Similarly, the filaments of the CF carbonized up to 1100 °C (60/2-z3-1100 °C) also display a smooth surface with no discernible surface defects or pores. These observations explain the higher fiber density values obtained for the 60/2-z3-1100 °C CF from zone 3, compared to the equivalent CF from zone L3. These images validate that the approach with continuous dissolution of PA6 at 60 °C followed by continuous sulfonation results in CF with improved properties compared to the 40 °C dissolution temperature approach.
Due to the thin and brittle nature of the CF filaments, it is not feasible to investigate their mechanical properties through a single filament tensile strength test, as the isolation of single filaments is not possible. Instead, mechanical roving tests could be considered as an alternative method. However, for such tests, the CF would require surface activation and the application of a sizing resin.
In the continuous carbonization trial, the stabilized fiber from continuous stabilization with a dissolution temperature of 60 °C and from zone 3 of the continuous sulfonation undergoes a continuous carbonization trial. Therein, the stabilized fiber undergoes continuous carbonization up to 900 °C in the LT furnace, followed by batch carbonization up to 1100 °C. Samples are taken after both carbonization steps. The carbonization parameters and the gas pycnometry results of the CF are presented in Table 16.
The carbonization process in the LT furnace up to 900 °C (60/2-z3-conti900 °C) results in a fiber shrinkage of 12%. The resulting CF exhibits a fiber density of 1.622 ± 0.003 g/cm3, confirming the findings from the batch carbonization trials. However, carbonization up to 900 °C is insufficient to achieve the desired CF density. Subsequent batch carbonization up to 1100 °C (60/2-z3-conti900–1100 °C) only induces a further 1% fiber shrinkage but increases the density to 1.733 ± 0.017 g/cm3. This increase in density is attributed to enhanced cross-linking of the polymer and the removal of non-carbon atoms from the fiber. Notably, the fiber density achieved through carbonization in the LT furnace is considerably higher than that obtained through batch carbonization up to 900 °C (1.464 ± 0.004 g/cm3). However, the resulting density of 1.622 ± 0.003 g/cm3 remains lower than the typical CF density of approximately 1.8 g/cm3. It is plausible that a similar higher density could be attained through carbonization up to 1100 °C if the process is conducted in a continuous high-temperature furnace (HT-furnace).
The CF filament diameter is determined via light microscopy imaging. The light microscopy image of the CF produced in the LT furnace and carbonized up to 900 °C reveals individual round filaments with a diameter of 3.67 ± 0.30 μm. Subsequent batch carbonization up to 1100 °C causes a reduction in filament diameter, with the round filaments reaching a diameter of 2.54 ± 0.28 μm. This reduction in filament diameter can be attributed to the applied tension during the process and the removal of additional non-carbon atoms from the fiber.
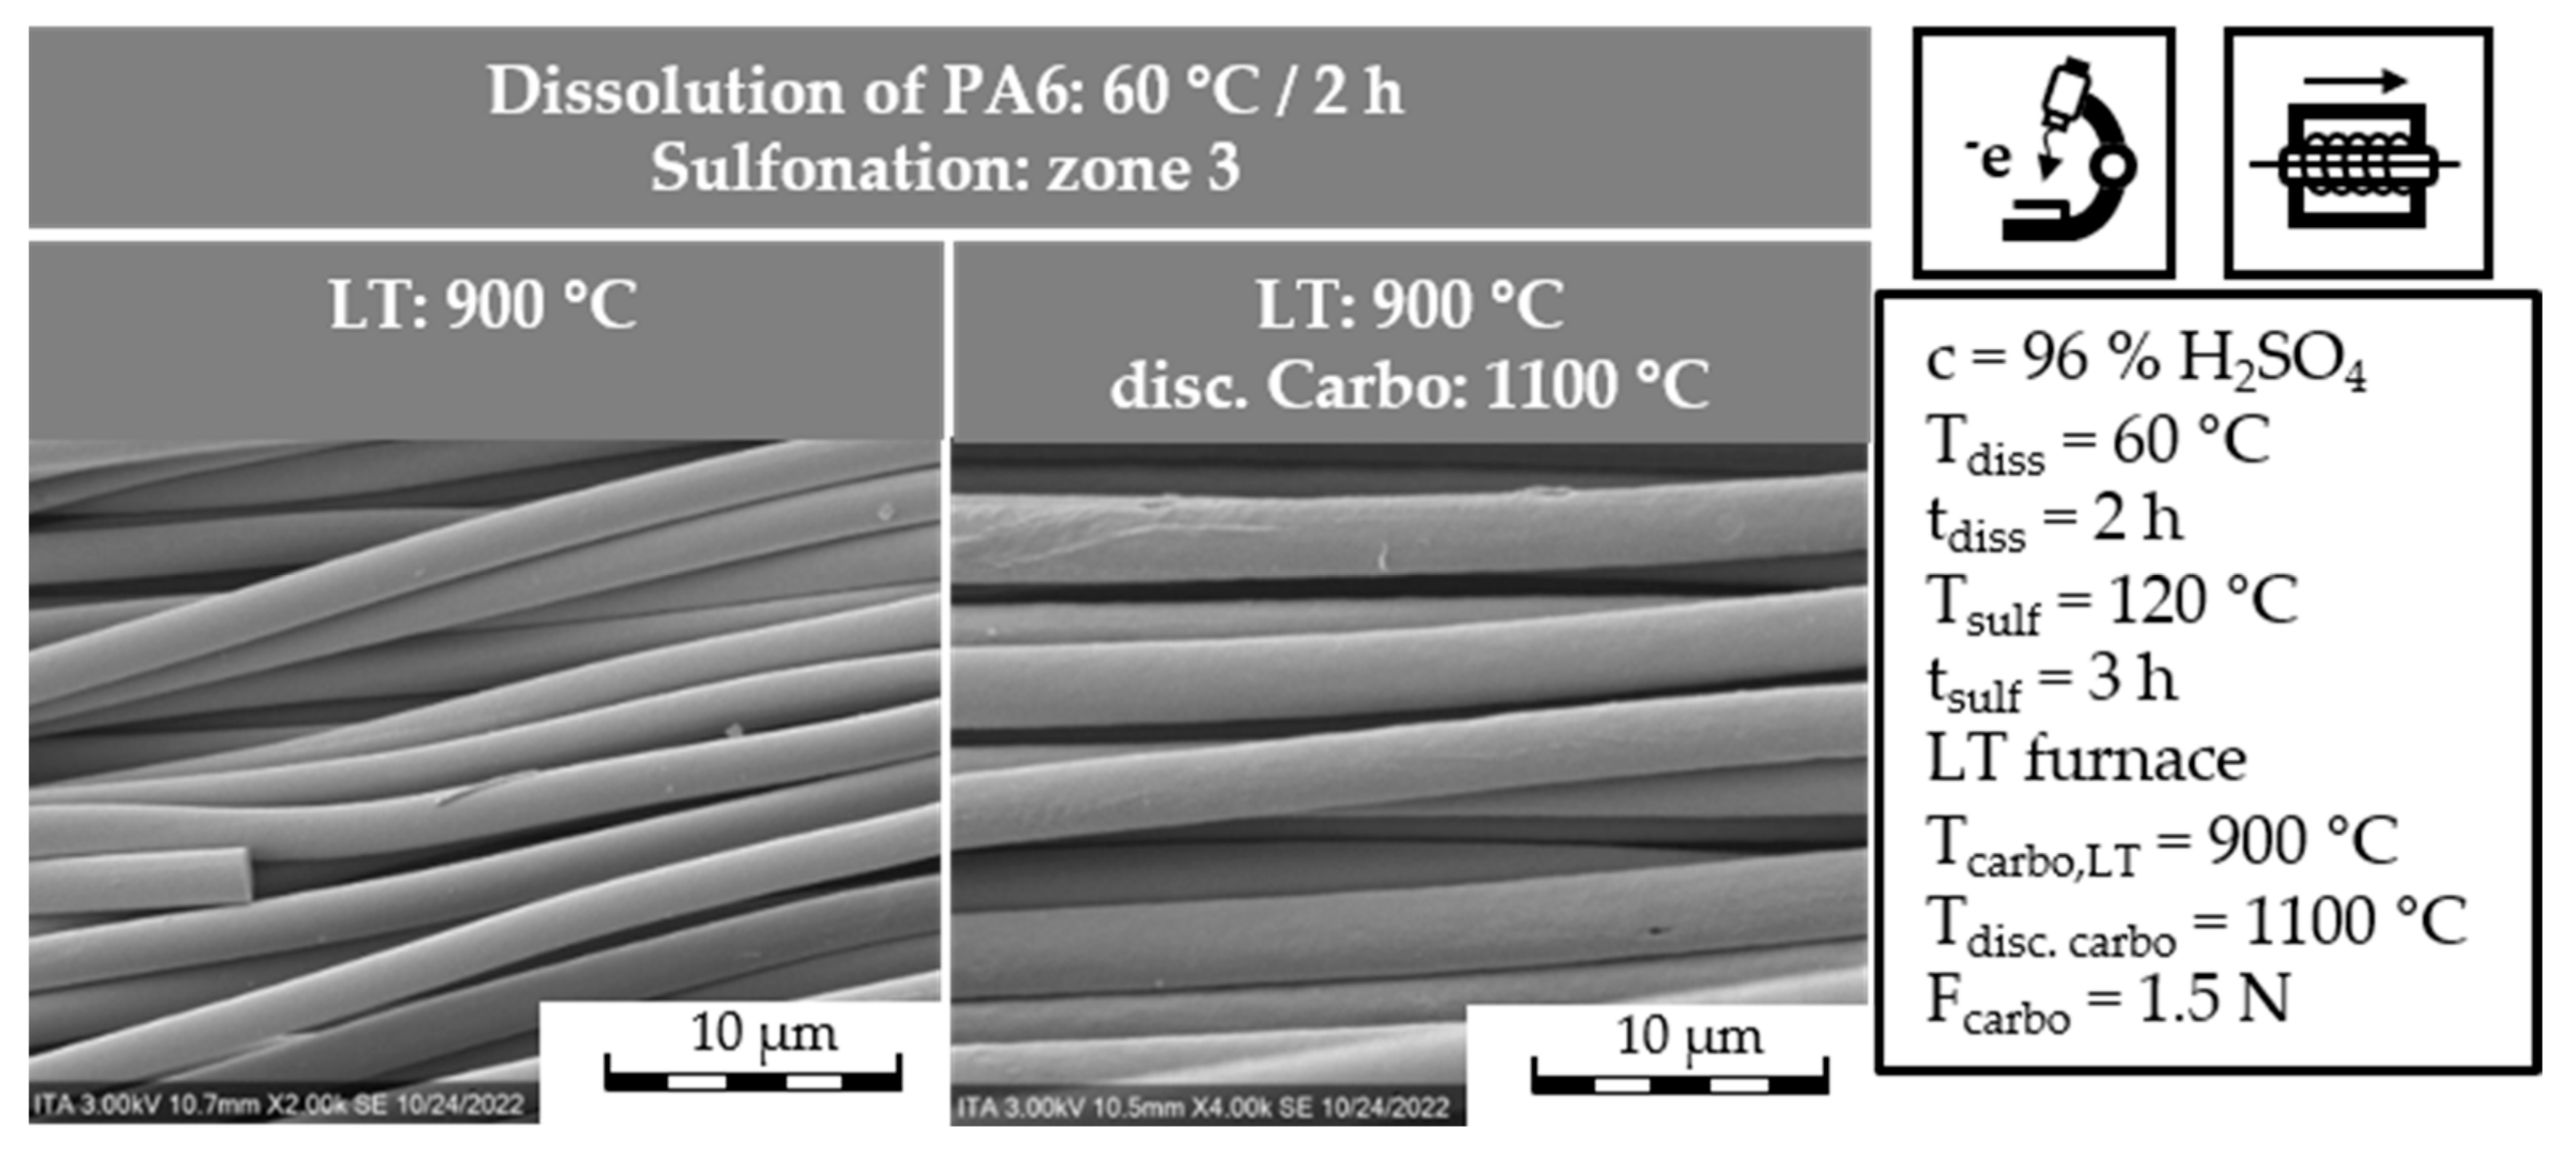
The samples are further analyzed via electron microscopy to assess the structural integrity of the samples in the form of surface structuration or pores in the filament side walls. The electron microscopy images of both CF samples from the continuous carbonization trials are depicted in Figure 18.
The electron microscopy images of the CF produced in the LT furnace exhibit a smooth surface with no discernible structural defects. This observation holds for the CF samples that underwent additional carbonization up to 1100 °C in the batch carbonization furnace. The mechanical properties of the produced CFs cannot be investigated via a single filament tensile strength test, as the isolation of singe filaments from the CF is not possible. The filaments are too thin and brittle. Alternatively, the CF could be investigated with mechanical roving tests. Therefore, the CF would need to undergo surface activation, followed by the application of a sizing resin.
In summary, the continuous carbonization has been successful in producing ultra-thin PE-based carbon fibers with filament diameters below 3 μm and no significant observable defects, even at temperatures up to 1100 °C. Furthermore, CF with a density of 1.622 ± 0.003 g/cm3 has been achieved through continuous carbonization in the LT furnace up to 900 °C. By subjecting the fibers to batch carbonization up to 1100 °C, the density is increased to 1.733 ± 0.017 g/cm. Additionally, even higher CF densities could be attained through continuous carbonization in a HT-furnace up to 1100 °C or 1350 °C.
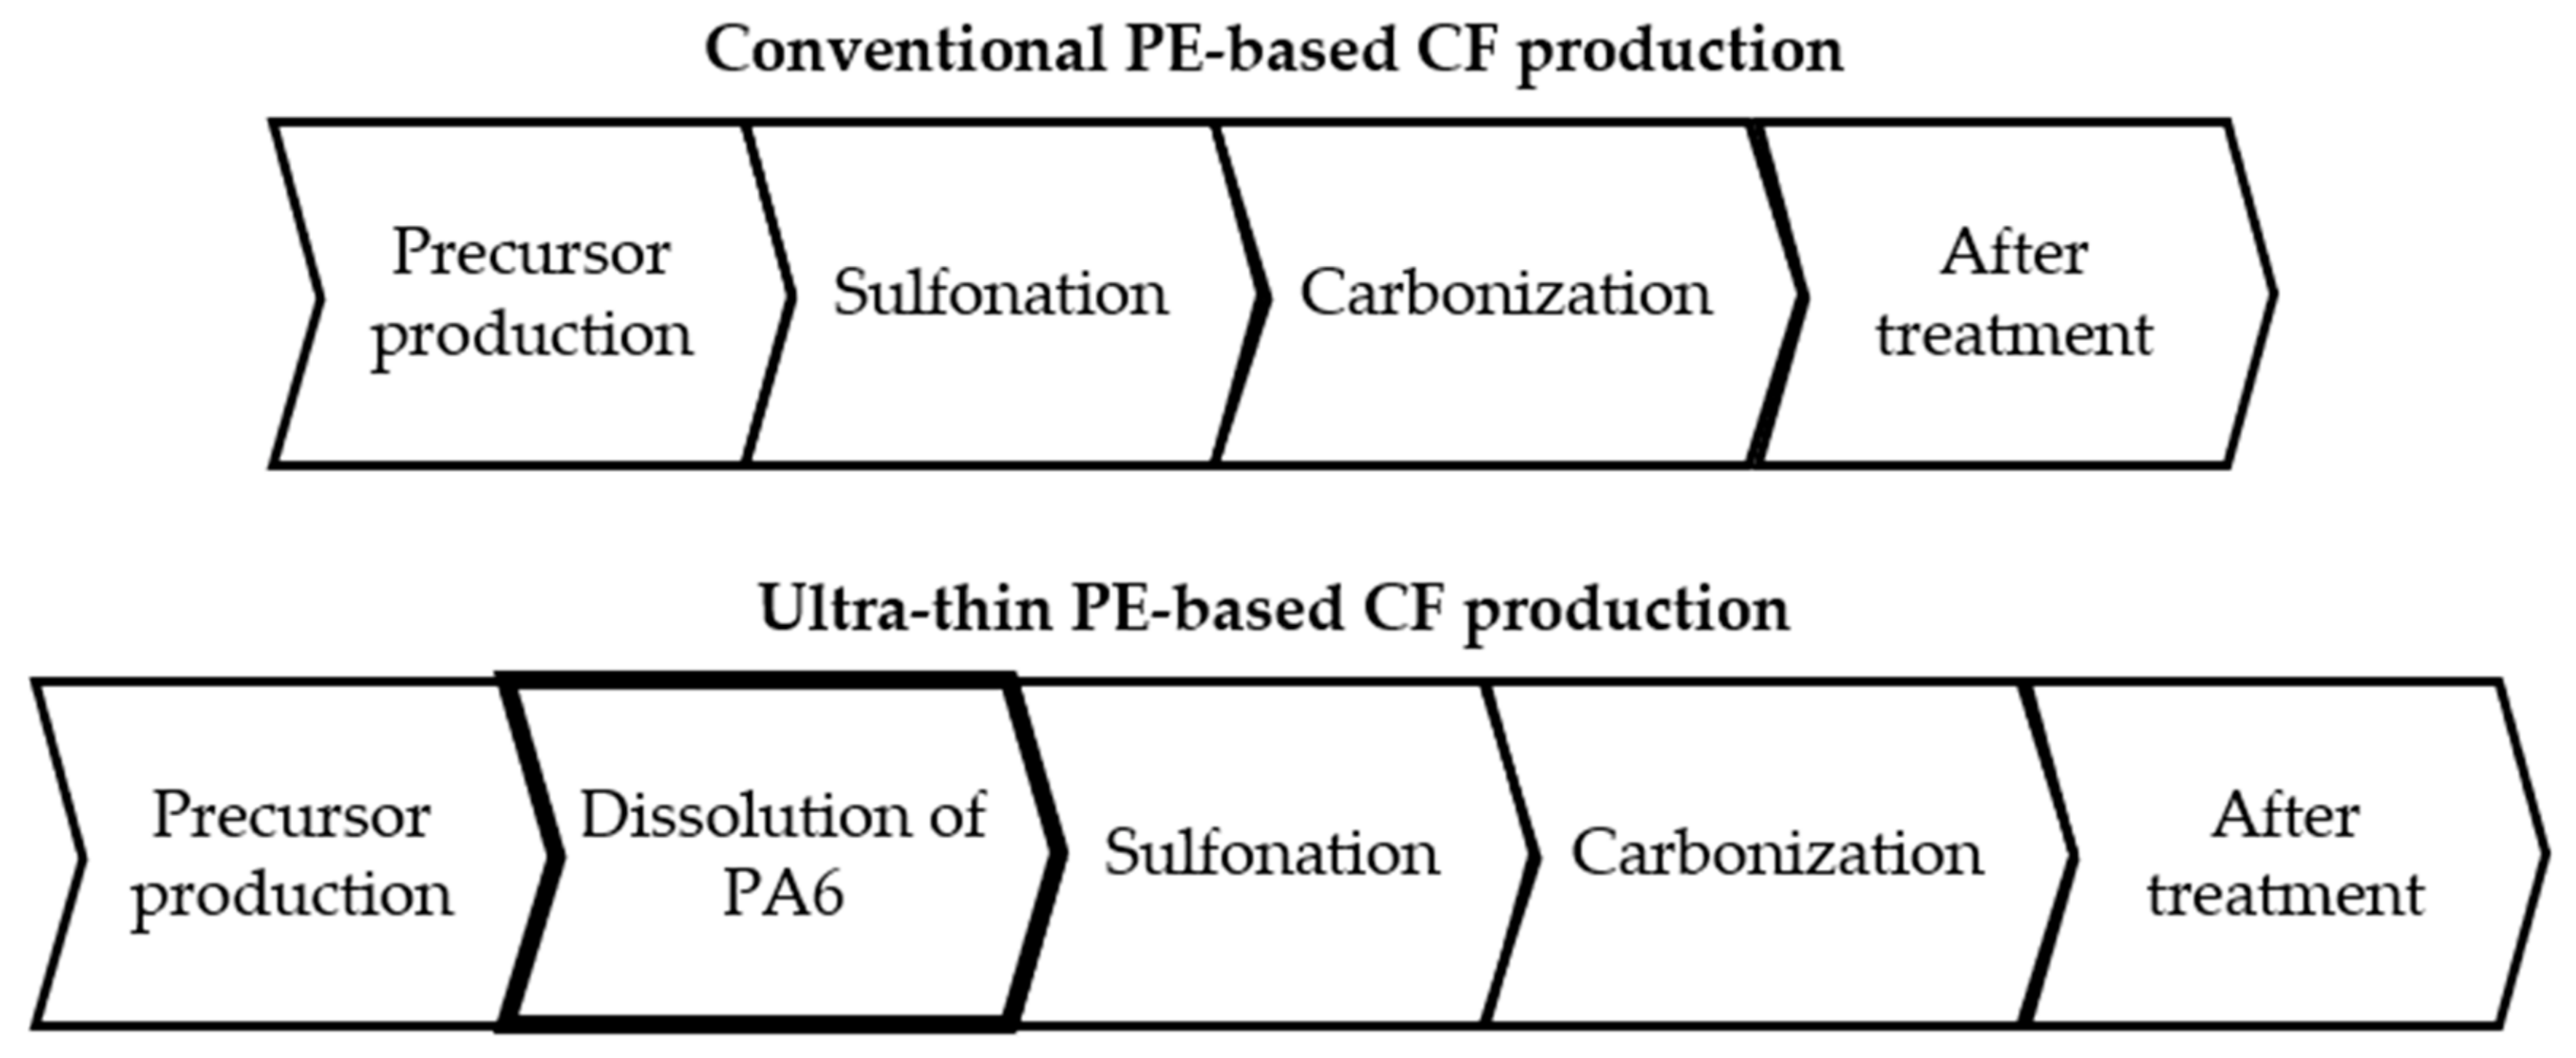
In conclusion, the feasibility of producing ultra-thin PE-based CF has been demonstrated in both batch and continuous set-ups, resulting in CF with a filament diameter of less than 3 μm. The use of the HDPE-INS precursor approach has successfully reduced the required sulfonation reaction time from 4 h to 3 h. However, the complete stabilization process does take longer due to the 2 h PA6-dissolution step. The PE-INS precursor provides ultra-thin PE precursor filaments after the dissolution of the PA6 matrix, which can be effectively stabilized through sulfonation and transformed into CF via carbonization. As a result, the two main objectives of this study have been successfully achieved.
This work serves as a crucial foundation for the innovative approach of producing ultra-thin PE-based CF. However, there are still some unanswered questions and opportunities for improvement. Firstly, the optimization of the PA6 matrix dissolution is necessary, which could involve exploring different parameter conditions, particularly lower fiber tension during this step. Reducing tension would enhance the diffusion of sulfuric acid through the INS precursor, potentially shortening the required reaction time for a complete dissolution of the PA6 component. Alternatively, using a different sea component material that allows for the physical separation of the two components could be considered. Regarding the continuous carbonization of the stabilized fibers, further investigation into higher maximum temperatures is needed to improve the mechanical properties of the resulting CF. Additionally, the use of combinatory analytical methods, such as MS-TGA, which combines TGA with Mass Spectrometry (MS), could be used in future studies, to gain further insight into the structure evolution by directly identifying which molecules are separated during carbonization. This leads to most significant area requiring improvement, namely the development of a new sample preparation method for single filament tensile strength tests. Alternatively, the CF could be analyzed using mechanical roving tests. Addressing these open questions and improvement opportunities would enhance the understanding and performance of the ultra-thin PE-based CF production process.

4. Conclusions

The reported findings show that the production of ultra-thin PE-based CF is achievable in both batch and continuous processes out of an “islands-in-the-sea” precursor, with a polyamide 6 “sea”-matrix and high-density polyethylene “islands” (INS-PA6-HDPE precursor). Even if the mechanical properties of the ultra-thin PE-based CF are relatively low, they can still find valuable applications due to their unique characteristics. The thin filament diameter and high surface-to-volume ratio make them suitable for various applications. For example, they can be utilized in carbon filters for water filtration or embedded in phenolic resins to enhance heat-dissipating composites. In the field of tissue regeneration, ultra-thin CF in the form of CF-webs is being tested as a scaffold for bone-tissue regeneration [43]. Furthermore, there is potential for further exploration of the spinning process to produce non-round filaments with intrinsic filament structures, such as star-shaped, triangular, or hollow filaments. These novel filament structures would facilitate the production of ultra-thin PE-based CF with even higher surface-to volume ratios and customizable morphology [44]. Continued development of the method for producing ultra-thin PE-based CF holds the promise of significantly reducing the cost of CF, thereby expanding its use in a broader range of applications.

Author Contributions

F.A.M.D.: writing—original draft preparation, methodology, validation, investigation, data curation, writing—review and editing, resources, visualization. T.R.: conceptualization, methodology, resources, validation, writing—review and editing, supervision, project administration, funding acquisition. M.B.: writing—review and editing, funding acquisition, project administration. T.G.: writing—review and editing, funding acquisition. All authors have read and agreed to the published version of the manuscript.

Funding

Open Access funding enabled and organized by Projekt DEAL.

Data Availability Statement

Data is contained within the article. The data that supports the findings of this study are available from the corresponding author upon reasonable request.

Acknowledgments

This study work is the result of a scientific collaboration between the Institut für Textiltechnik of the RWTH Aachen University and the Saudi Aramco Technologies Company.

Conflicts of Interest

The authors declare no conflict of interest.

Appendix A

Figure A1. DSC curves of the HDPE-INS precursors treated in 96% concentrated H2SO4 at 60 °C for 0.5 h, 1.5 h, 2.5 h and 3.5 h.
Fibers 11 00075 g0a1
Figure A2. DSC curves of the HDPE-INS precursors treated in 96% concentrated H2SO4 at 80 °C for 0.5 h, 1.5 h, 2.5 h and 3.5 h.
Fibers 11 00075 g0a2
Figure A3. DSC curves of the HDPE-INS precursors treated in 96% concentrated H2SO4 at 100 °C for 0.5 h, 1.5 h, 2.5 h and 3.5 h.
Fibers 11 00075 g0a3
Figure A4. DSC curves of the HDPE-INS precursors treated in 96% concentrated H2SO4 at 120 °C for 0.5 h, 1.5 h, 2.5 h and 3.5 h.
Fibers 11 00075 g0a4
Figure A5. Light microscopy images of the HDPE-INS precursor after dissolution of PA6 at 40 °C/2 h and sulfonation up to 4 h at 120 °C with increased fiber tension.
Fibers 11 00075 g0a5
Figure A6. Light microscopy images of the HDPE-INS precursor after dissolution of PA6 at 60 °C/2 h and sulfonation up to 4 h at 120 °C with increased fiber tension.
Fibers 11 00075 g0a6

References

  1. Eberle, C. Carbon Fiber Production from Textile Acrylics. In Proceedings of the Carbon Fibre Futures Conference, Geelong, VIC, Australia, 1–3 March 2017. [Google Scholar]
  2. Sauer, M. Marktentwicklungen, Herausforderungen und Chancen; Der Composites-Markt Europa: 2019; Market Report; Composites United e.V: Berlin, Germany, 2019. [Google Scholar]
  3. Sauer, M. Marktentwicklungen, Herausforderungen und Chancen; Der Composites-Markt Europa: 2020; Market Report; Composites United e.V: Berlin, Germany, 2020. [Google Scholar]
  4. Sauer, M.; Schüppel, D. The Global Market for Carbon Fibers and Carbon Composites; Market Report; Composites United e.V.: Berlin, Germany, 2022. [Google Scholar]
  5. Pichler, D.; The Carbon Fiber Market. Composites Manufacturing 2021, Winter, pp. 20–21. Available online: https://f000.backblazeb2.com/file/acmanet/C-M-Winter-2021/21/index.html (accessed on 4 July 2023).
  6. Herbeck, L. CFK-RTM-Technologie: Potentiale für Hybride Automobilbauweisen. 2014. Available online: https://www.dlr.de/fa/Portaldata/17/Resources/dokumente/2014/CFK-RTM-Technologie_Potentiale_fuer_hybride_Automobilbauweisen__Herbeck.pdf (accessed on 21 October 2022).
  7. Das, S.; Warren, J.; West, D.; Schexnayder, S.M. Global Carbon Fiber Composites Supply Chain Competitiveness Analysis. 2016. Available online: https://www.nrel.gov/docs/fy16osti/66071.pdf (accessed on 20 September 2022).
  8. Jäger, H.; Cherif, C.; Kirsten, M.; Behnisch, T.; Wolz, D.S.; Böhm, R.; Gude, M. Influence of processing parameters on the properties of carbon fibers—An overview. Mater. Und Werkst. 2016, 47, 1044–1057. [Google Scholar] [CrossRef]
  9. Warren, D. Low Cost Carbon Fiber Overview. 2010. Available online: https://www.energy.gov/eere/vehicles/articles/low-cost-carbon-fiber-overview-0 (accessed on 19 September 2022).
  10. Sloan, J. The State of the Composites Industry. CompositesWorld 2017, November Issue. Available online: https://www.compositesworld.com/articles/state-of-the-composites-industry (accessed on 4 July 2023).
  11. Newcom, B.A. Processing, structure, and properties of carbon fibers. Compos. Part A Appl. Sci. Manuf. 2016, 91, 262–282. [Google Scholar] [CrossRef]
  12. Morgan, P. Carbon Fibers and Their Composites; Taylor & Francis: Boca Raton, FL, USA, 2005. [Google Scholar]
  13. Lengsfeld, H.; Mainka, H.; Altstädt, V. Carbonfasern: Herstellung, Anwendung, Verarbeitung; Carl Hanser Verlag GmbH & Co. KG: München, Germany, 2019. [Google Scholar]
  14. Warnecke, M.; de Palmenaer, A.; Wortberg, G.; Seide, G.; Gries, T. Faserstofftabelle Carbonfasern aus alternativen Precursoren, 1st ed.; Shaker: Aachen, Germany, 2015. [Google Scholar]
  15. Kim, J.W.; Lee, J.S. Preparation of carbon fibers from linear low density polyethylene. Carbon 2015, 94, 524–530. [Google Scholar] [CrossRef]
  16. Cameron, G.G.; Main, B.R. The action of concentrated sulphuric acid on polyethylene and polypropylene: Part 2—Effects on the polymer surface. Polym. Degrad. Stab. 1985, 11, 9–25. [Google Scholar] [CrossRef]
  17. Ihata, J. Formation and reaction of polyenesulfonic acid. 1. Reaction of polyethylene films with SO3. J. Polym. Sci. Part A Polym. Chem. 1988, 26, 167–176. [Google Scholar] [CrossRef]
  18. Kaneko, M.; Kumagai, S.; Nakamura, T.; Sato, H. Study of sulfonation mechanism of low-density polyethylene films with fuming sulfuric acid. J. Appl. Polym. Sci. 2004, 91, 2435–2442. [Google Scholar] [CrossRef]
  19. Xie, B.; Hong, L.; Chen, P.; Zhu, B. Effect of sulfonation with concentrated sulfuric acid on the composition and carbonizability of LLDPE fibers. Polym. Bull. 2016, 73, 891–908. [Google Scholar] [CrossRef]
  20. Hukkanen, E.J.; Barton, B.E.; Patton, J.T.; Schlader, D.R.; Zhang, Y.; Qiu, X.; Brehm, L.; Haskins, B.; Wang, W.; Horstman, N.; et al. A Novel Continuous Multiphase Reactor for Chemically Processing Polymer Fibers. Ind. Eng. Chem. Res. 2018, 57, 6123–6130. [Google Scholar] [CrossRef]
  21. Röding, T.; Langer, J.; Modenesi Barbosa, T.; Bouhrara, M.; Gries, T. A review of polyethylene-based carbon fiber manufacturing. Appl. Res. 2022, 1, 3. [Google Scholar] [CrossRef]
  22. Sumitomo Chemical Company, Ltd. Process for Production of Carbon Fibre and Precursor; GB 1,458,571,1974; Sumitomo Chemical Company, Ltd.: Tokyo, Japan, 1974. [Google Scholar]
  23. Horikiri, A.; Iseki, T.; Minobe, I. Process for Production of Carbon Fiber. US 4,070,446.1978. Available online: https://patents.google.com/patent/US4070446A/en (accessed on 4 July 2023).
  24. De Palmenaer, A. Ermittlung der Prozessparameter zur kontinuierlichen Herstellung von Polyolefinbasierten Carbonfasern. Ph.D. Thesis, RWTH Aachen University, Aachen, Germany, 2017. [Google Scholar]
  25. Wortberg, G. Entwicklung polyethylenbasierter Precursoren für die thermochemische Stabilisierung zur Carbonfaserherstellung. Ph.D. Thesis, RWTH Aachen University, Aachen, Germany, 2017. [Google Scholar]
  26. Spalding, M.A.; Dibbs, M.; Sikirica, S. Scale-up of Novel Low-Cost Carbon Fibers Leading to High-Volume Commercial Launch; The Dow Chemical Company: Singapore, 2014. [Google Scholar]
  27. Behr, M.J.; Landes, B.G.; Barton, B.E. Structure-property model for polyethylene-derived carbon fiber. Carbon 2016, 107, 525–530. [Google Scholar] [CrossRef]
  28. Greb, C.; Röding, T. Polyethylene-Based Low-cost Carbon Fibers Manufacturing. In Proceedings of the Nonmetallic 2nd Symposium, Lyon, France, 17–18 December 2019. [Google Scholar]
  29. Bennett, S.C.; Johnson, D.J. Strength-structure relationships in PAN-based carbon fibers. J. Mater. Sci. 1983, 18, 3337–3347. [Google Scholar] [CrossRef]
  30. Yu, W.; Yao, J. Tensile strength and its variation of PAN-based carbon fibers. I. Statistical distribution and volume dependence. J. Appl. Polym. Sci. 2006, 101, 3175–3182. [Google Scholar] [CrossRef]
  31. Hollaway, L.C. Key issues in the use of fiber reinforced polymer (FRP) composites in the rehabilitation and retrofitting of concrete structures. In Service Life Estimation and Extension of Civil Engineering Structures; Elsevier: Amsterdam, The Netherlands, 2011; pp. 3–74. [Google Scholar]
  32. Hu, J.; Kumar, B.; Lu, J. Handbook of Fibrous Materials, 1st ed.; Wiley-VCH: Weinheim, Germany, 2020. [Google Scholar]
  33. Nylacast Holdings Ltd. Chemical Resistance Table Polyamides. 2019. Available online: https://www.nylacast.com/wp-content/uploads/2019/04/NylacastChemicalResistanceTable19.pdf (accessed on 6 February 2022).
  34. Barton, B.E.; Patton, J.; Hukkanen, E.; Behr, M.; Lin, J.-C.; Beyer, S.; Zhang, Y.; Brehm, L.; Haskins, B.; Bell, B.; et al. The chemical transformation of hydrocarbons to carbon using SO3 sources. Carbon 2015, 94, 465–471. [Google Scholar] [CrossRef]
  35. Maillo, J.; Pages, P.; Vallejo, E.; Lacorte, T.; Gacén, J. FTIR spectroscopy study of the interaction between fiber of polyamide 6 and iodine. Eur. Polym. J. 2005, 41, 753–759. [Google Scholar] [CrossRef]
  36. Pretsch, E.; Bühlmann, P.; Affolter, C.; Badertscher, M. Spektroskopische Daten zur Strukturaufklärung organischer Verbindungen, 4th ed.; Springer: Berlin, Germany, 2001. [Google Scholar]
  37. Menczel, L.D.; Prime, R.B. Thermal Analysis of Polymers; John Wiley: Hoboken, NJ, USA, 2009. [Google Scholar]
  38. Younker, J.M.; Saito, T.; Hunt, M.A.; Naskar, A.K.; Beste, A. Pyrolysis pathways of sulfonated polyethylene, an alternative carbon fiber precursor. J. Am. Chem. Soc. 2013, 135, 6130–6141. [Google Scholar] [CrossRef] [PubMed]
  39. Jörg, F. Präparative und mikroskopische Verfahren in der Materialprüfung: Grundlagen, angewandte Mikroskopie; Ecomed: Landsberg, Germany, 1991. [Google Scholar]
  40. Lange, R.H.; Blödorn, J. Das Elektronenmikroskop TEM + REM. Leitfaden für Biologen und Mediziner; Georg Thieme: Stuttgart, Germany, 1981. [Google Scholar]
  41. Postema, A.R.; De Groot, H.; Penning, A.J. Amorphous carbon fibres from linear low density polyethylene. J. Mater. Sci. 1990, 25, 4126. [Google Scholar] [CrossRef]
  42. Penning, J.P.; Lagcher, R.; Pennings, A.J. The effect of diameter on the mechanical properties of amorphous carbon fibres from linear low density polyethylene. Polym. Bull. 1991, 25, 405. [Google Scholar] [CrossRef]
  43. Aoki, K.; Usui, Y.; Narita, N.; Ogiwara, N.; Iashigaki, N.; Nakamura, K.; Kato, H.; Sano, K.; Ogiwara, N.; Kametani, K.; et al. A Thin Carbon-Fiber Web as Scaffold for Bone-Tissue Regeneration. Small 2009, 5, 1540–1546. [Google Scholar] [CrossRef] [PubMed]
  44. Hunt, M.A.; Saito, T.; Brown, R.H.; Kumbhar, A.S.; Naskar, A.K. Patterned Functional Carbon Fibers from Polyethylene. Adv. Mater. 2012, 24, 2386–2389. [Google Scholar] [CrossRef] [PubMed]
Figure 1. Process of the production of conventional PE-based CF (top) and ultra-thin PE-based CF (bottom) from an INS precursor.
Fibers 11 00075 g001
Figure 2. Picture of the double-walled glass reactor (left) and schematic construction of the reactor (right).
Fibers 11 00075 g002
Figure 3. Schematic depiction of the continuous sulfonation set-up.
Fibers 11 00075 g003
Figure 4. Picture and schematic representation of the construction of the batch carbonization furnace.
Fibers 11 00075 g004
Figure 5. Picture and schematic representation of the construction of the batch carbonization furnace.
Fibers 11 00075 g005
Figure 6. DSC curves of the HDPE-INS precursor treated in 15% and 96% concentrated H2SO4 at 80 °C for 3.5 h.
Fibers 11 00075 g006
Figure 7. DSC curves of the HDPE-INS precursors treated in 96% concentrated H2SO4 at 40 °C for 0.5 h, 1.5 h, 2.5 h and 3.5 h.
Fibers 11 00075 g007
Figure 8. Light microscopy images of CF produced from the HDPE-INS precursor, with different PA6-dissolution conditions.
Fibers 11 00075 g008
Figure 9. Electron microscopy images of CF produced from the HDPE-INS precursor, with different PA6-dissolution conditions.
Fibers 11 00075 g009
Figure 10. TGA curves for batch stabilization of HDPE-INS precursor with increased fiber tension.
Fibers 11 00075 g010
Figure 11. FTIR analysis of the HDPE-INS precursor and 40/2 samples of the batch sulfonation trials with increased fiber tension.
Fibers 11 00075 g011
Figure 12. FTIR analysis of the HDPE-INS precursor and 60/2 samples of the batch sulfonation trials with increased fiber tension.
Fibers 11 00075 g012
Figure 13. FTIR analysis of continuous stabilization of the HDPE-INS precursor with dissolution of PA6 at 40 °C.
Fibers 11 00075 g013
Figure 14. FTIR analysis of continuous stabilization of the HDPE-INS precursor with dissolution of PA6 at 60 °C.
Fibers 11 00075 g014
Figure 15. Light microscopy images of fibers from continuous stabilization of HDPE-INS precursor with dissolution of PA6 at 40 °C.
Fibers 11 00075 g015
Figure 16. Light microscopy images of fibers from continuous stabilization of HDPE-INS precursor with dissolution of PA6 at 60 °C.
Fibers 11 00075 g016
Figure 17. Electron microscopy images from the batch carbonization trials of continuously stabilized HDPE-INS precursor.
Fibers 11 00075 g017
Figure 18. Electron microscopy images from the continuous carbonization trials of continuously stabilized HDPE-INS precursor.
Fibers 11 00075 g018
Table 1. Reaction conditions for the batch dissolution trials of the PA6 component of the INS-precursor fibers.
Temperature
T [°C]
H2SO4 Concentration
c [%]
Time
t [h]
Force
F [N]
Tension
σ [MPa]
80153.50.440.4
40, 60, 80, 100, 120960.5, 1.5, 2.5, 3.50.440.4
40, 60962, 31.51.3
Table 2. Reaction conditions for the batch sulfonation trials.
Dissolution of PA6
T/t/F [°C/h/N]
Time
t [h]
Force
F [N]
Tension
σ [MPa]
40/2/0.44, 40/3/0.44, 60/2/0.44, 60/3/0.442, 3, 40.440.4
40/2/1.5, 60/2/1.51, 2, 3, 41.51.3
Table 3. Parameters during the stabilization of the HDPE-INS precursor, with the dissolution of PA6 at 40 °C (zones LA.1 and LA.2) and sulfonation at 120 °C (zones L1, L2, and L3).
ZoneTemperature
T [°C]
Godet Duo Speeds
v1/v2 [m/min]
Force at Entry
Fstart [N]
Force after Treatment FH2SO4 [N]Force after Washing
FH2O [N]
LA.1400.06/0.0654.47.0
LA.2400.06/0.064.56.19.2
L11200.06/0.063.55.89.0
L21200.06/0.063.57.211.2
L31200.06/0.0524.88.5
Table 4. Parameters during the stabilization of the HDPE-INS precursor, with the dissolution of PA6 at 60 °C (zones A.1 and A.2) and sulfonation at 120 °C (zones 1, 2, and 3).
ZoneTemperature
T [°C]
Godet Duo Speeds
v1/v2 [m/min]
Force at Entry
Fstart [N]
Force after Treatment FH2SO4 [N]Force after Washing
FH2O [N]
A.1600.06/0.055.54.06.9
A.2600.06/0.0454.53.65.6
11200.06/0.0654.57.5
21200.06/0.0556.29.8
31200.06/0.05524.87.8
Table 5. Conditions for the batch carbonization trials of fibers from continuous sulfonation.
Dissolution of PA6
T/t/F [°C/h/N]
Continuous Sulfonation Zone [ ]Temperature
Tmx [°C]
Force
F [N]
Tension
σ [MPa]
conti/40/239000.50.4
conti/40/23110010.9
conti/60/239000.50.4
conti/60/23110010.9
Table 6. Conditions for the batch carbonization trial of sample from continuous carbonization in the LT-furnace.
Dissolution of PA6
T/t/F [°C/h/N]
Continuous Sulfonation Zone [ ]Temperature
Tmx [°C]
Force
F [N]
Tension
σ [MPa]
conti/60/2311001.51.3
Table 7. Parameters for the continuous LT furnace carbonization of the fibers from continuous dissolution of PA6 at 60 °C (zone A.2) and continuous sulfonation at 120 °C (zone 3).
ParameterUnitFurnace Temperature Zones
12345
Temperature T[°C]305432575737900
Heating rate ΔT[K/min]2
Entry godet speed v1[m/min]0.45
Exit godet speed v2[m/min]0.4
Shrinkage vv[%]12
Force F[N]1.5
Tension σ[MPa]1.3
Table 8. Expected absorption bands for sulfonated PE-fibers [34,35,36].
Absorption [cm−1]IntensityVibration TypeMolecule Type
3300MediumN-H stretchingAmide
3000–2840Medium, doubletC-H stretchingAlkane
1710–1690MediumC=O stretchingCarboxylic groups
1650MediumC=O stretchingAmide
1620–1570StrongC=C stretchingAlkene, aromatic compounds
1550MediumN-H stretchingAmide
1470–1460MediumCH2 deformationAlkane
1150–1050Very strongS=O symmetric and asymmetric stretchingSulfone
770–720StrongCH2 deformationAlkane
Table 9. Expected reactions in the thermogravimetric analysis of sulfonated PE [34,37,38].
Temperature Range
T [°C]
35–120120–400400–600>600
ReactionDryingCross-linkingPE decompositionDehydrogenation
Released gasH2OSO2HydrocarbonsH2
Table 10. Stabilization parameters and TGA results for batch stabilization at 40 °C and 60 °C of the HDPE-INS precursor.
Dissolution of PA6
T/t [°C/h]
Sulfonation
T/t [°C/h]
Force on Fiber
F [N]
Mass Loss PE
ΔmPE [%]
Total Mass Loss
Δmtotal [%]
Fiber Shrinkage
Δl [%]
40/2120/20.44708518
120/30.44346323
120/40.44205330
40/3120/20.44758814
120/30.44326225
120/40.44115228
60/2120/20.44688821
120/30.44326327
120/40.44135130
60/3120/20.44799124
120/30.44336332
120/40.44115337
Table 11. Stabilization parameters, TGA and gas pycnometry results for batch stabilization of HDPE-INS precursor with increased fiber tension.
Dissolution of PA6
T/t [°C/h]
Sulfonation
T/t [°C/h]
Force on Fiber
F [N]
Density
ρ [g/cm3]
Linear Density
[dtex]
Mass Loss PE
ΔmPE [%]
Total Mass Loss
Δmtotal [%]
Precursor 1.073 ± 0.0010.0728499
40/2120/11.51.006 ± 0.0010.0758398
120/21.51.044 ± 0.0020.0997692
120/31.51.212 ± 0.0020.1233869
120/41.51.397 ± 0.0020.1731760
60/2120/11.51.020 ± 0.0010.1047895
120/21.51.062 ± 0.0020.1407491
120/31.51.235 ± 0.0020.1634270
120/41.51.416 ± 0.0030.1821958
Table 12. Filament diameter of the batch sulfonation trials with increased fiber tension, determined via light microscopy imaging.
SampleSulfonation Time t [h]Fiber Diameter Ø [µm]
40/213.09 ± 0.37
23.48 ± 0.47
33.60 ± 0.28
43.97 ± 0.38
60/213.61 ± 0.29
24.10 ± 0.36
34.10 ± 0.50
44.05 ± 0.30
Table 13. TGA and gas pycnometry results for continuous stabilization trials of the HDPE-INS precursor.
SampleSulfonation Zone
[ ]
Fiber Density
ρ [g/cm3]
Linear Density
[dtex]
Mass Loss PE
ΔmPE [%]
Total Mass Loss
Δmtotal [%]
Precursor-1.073 ± 0.0010.0728499
40/2LA.20.960 ± 0.0010.10497100
L11.047 ± 0.0010.0899194
L21.217 ± 0.0010.1433871
L31.494 ± 0.0030.1431251
60/2A.20.977 ± 0.0010.0719499
11.046 ± 0.0020.0867290
21.225 ± 0.0010.1383464
31.494 ± 0.0030.1781453
Table 14. Evolution of the filament diameter, determined via light microscopy, in the continuous stabilization trials.
SampleSulfonation Zone [ ]Fiber Diameter Ø [µm]
40/2LA.23.71 ± 0.40
L13.29 ± 0.47
L23.87 ± 0.30
L33.49 ± 0.40
60/2A.23.04 ± 0.30
13.24 ± 0.58
23.79 ± 0.32
33.89 ± 0.53
Table 15. CF properties from the batch carbonization trials of continuously stabilized HDPE-INS precursor.
FiberCF Filament Diameter
Ø [µm]
Fiber Shrinkage
Δl [%]
Density
ρ [g/cm3]
40/2-zL3-900 °C2.45 ± 0.43131.532 ± 0.002
40/2-zL3-1100 °C2.51 ± 0.25141.634 ± 0.009
60/2-z3-900 °C2.46 ± 0.31141.464 ± 0.004
60/2-z3-1100 °C2.72 ± 0.28151.844 ± 0.005
Table 16. CF properties from the continuous carbonization trials of continuously stabilized HDPE-INS precursor.
FiberCF Filament Diameter
Ø [µm]
Fiber Shrinkage
Δl [%]
Density
ρ [g/cm3]
60/2-z3-conti900 °C3.67 ± 0.30121.622 ± 0.003
60/2-z3-conti900–1100 °C2.54 ± 0.2811.733 ± 0.017
Disclaimer/Publisher’s Note: The statements, opinions and data contained in all publications are solely those of the individual author(s) and contributor(s) and not of MDPI and/or the editor(s). MDPI and/or the editor(s) disclaim responsibility for any injury to people or property resulting from any ideas, methods, instructions or products referred to in the content.

