Article

Post-Cracking Behaviour of Fibre-Reinforced Shotcrete: A Numerical Comparison between Beams and Panels

1
PE Construction and Architecture, 117 43 Stockholm, Sweden
2
Division of Concrete Structures, KTH Royal Institute of Technology, 114 28 Stockholm, Sweden
3
Institute for Construction and Environment, Eastern Switzerland University of Applied Sciences, 8640 Rapperswil, Switzerland
*
Author to whom correspondence should be addressed.
Fibers 2023, 11(7), 59; https://doi.org/10.3390/fib11070059
Submission received: 19 May 2023 / Revised: 15 June 2023 / Accepted: 19 June 2023 / Published: 4 July 2023

Abstract

:
Fibre-reinforced shotcrete is an essential part of the support of hard rock tunnels. Due to the complexity of the design, a combination of empirical and numerical analysis is commonly used in the design. The required dosage of fibres for structural purposes is determined based on minimum energy absorption or residual flexural strength. The latter is derived from tests on beams, while energy absorption is tested on panels. It is widely known that tests on beams suffer from a large scatter in results due to the short fracture zone in combination with the natural variation in the number and orientation of fibres which bridge the crack. This impacts the characteristic strength derived from these tests negatively. This paper presents a numerical study to investigate how the test method affects the required dosage of fibres. First, a non-linear model for shotcrete based on continuum damage mechanics is presented. Thereafter, the model is tuned against test results for beams and panels. A model tuned on beams is then used to simulate the response of a panel and vice versa. The results indicate that the size of the fracture zone has a significant effect on the post-cracking behaviour and that the required dosage of fibres could be decreased if specimens with longer fracture zones, i.e., panels or slabs, are used.

1. Introduction

Shotcrete, or sprayed concrete, is a vital part of the support of tunnels in hard rock. Even though unreinforced shotcrete could be used in some cases, fibre-reinforcement is commonly used to increase the ductility of the shotcrete. The design of tunnels and rock support involves many uncertainties, such as rock mass quality, fracture level, and water condition. Thus, the design of rock support is complex, and the design is commonly based on a rock mass classification system, e.g., the Q-method by Barton et al. [1] or the Rock Mass Rating (RMR) system by Bieniawski [2]. In these methods, an empirical relationship was established between the geometry of the tunnel, the quality of the rock mass, and the required rock support, i.e., the thickness and ductility of shotcrete and distance between rock bolts. The rock support design could also be based on analytical equations in which the scenarios described by Barrett and McCreath [3] are often used. Two examples are shown in Figure 1: a flexural failure governed by the ductility of the shotcrete and a shear failure. For a design based on a rock mass classification system, the fibre dosage is typically determined based on minimum energy absorption at a given vertical deformation. For an analytical design, the residual flexural strength is normally used. As shown by Sjölander et al. [4], the volume fraction of fibres depends on the design philosophy and the material. Commonly, a volume fraction between 0.5 and 1.0% of fibres is sufficient, with respect to structural performance.

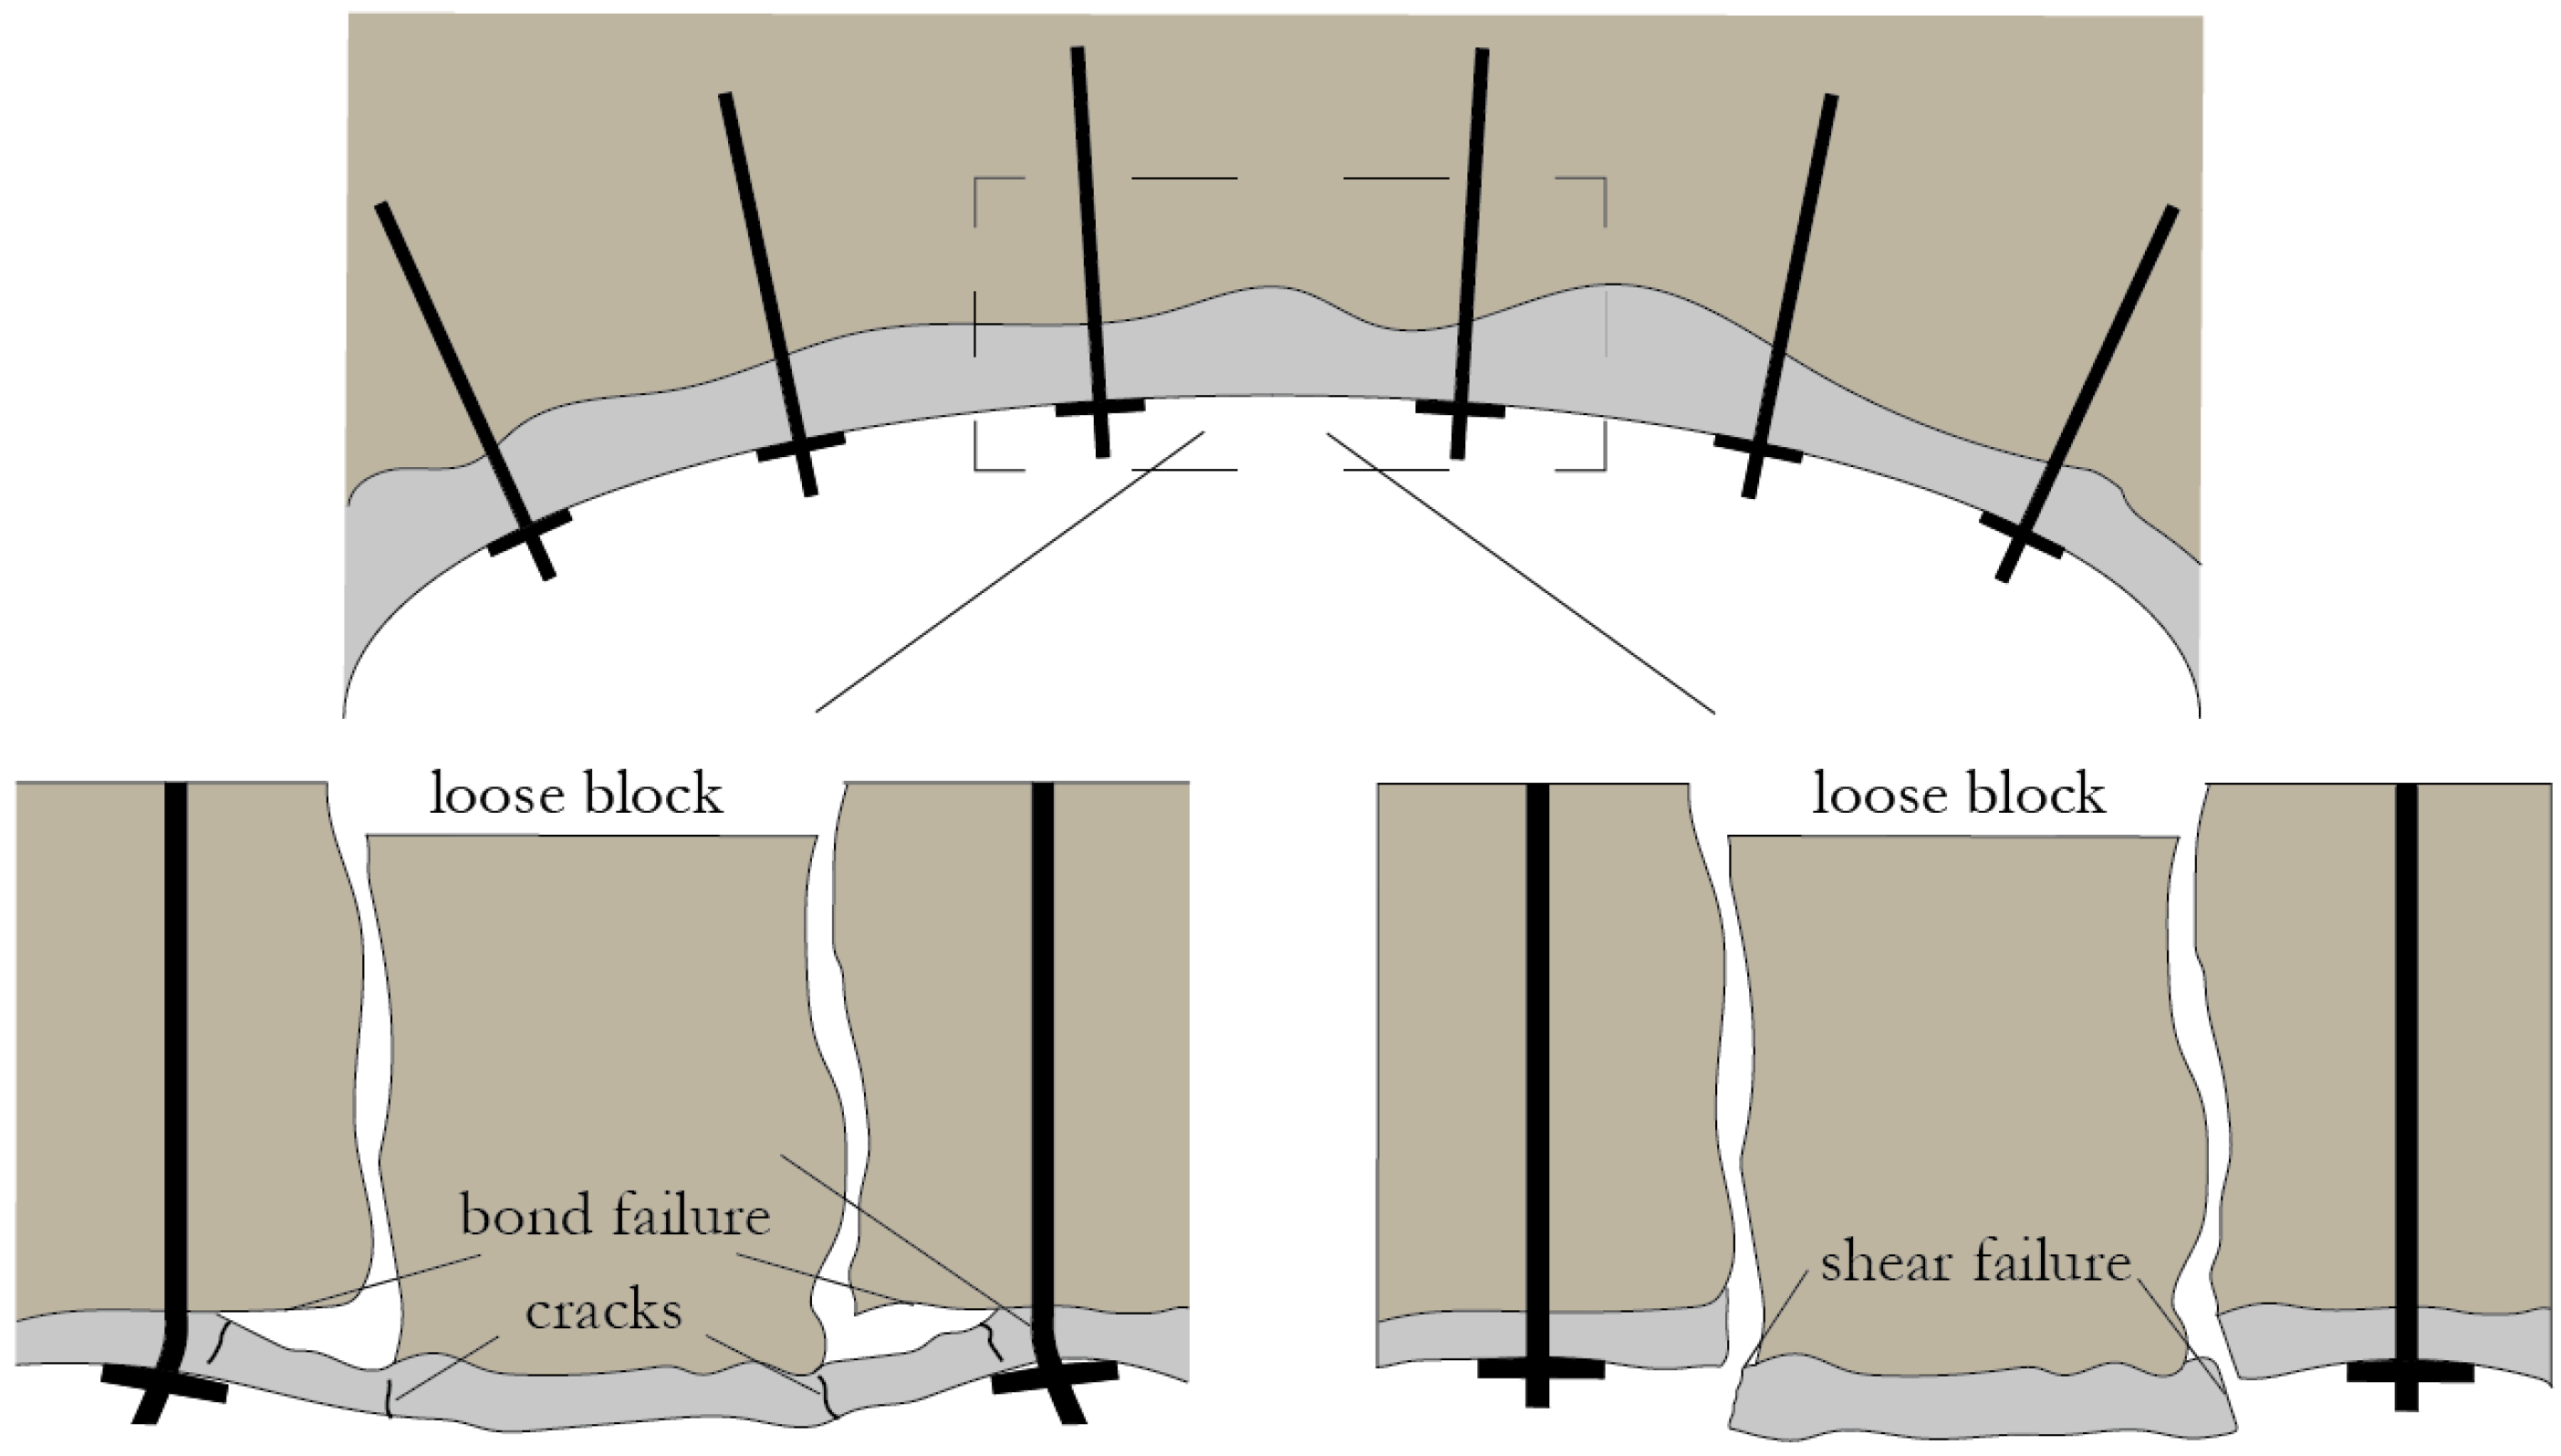
1.1. Structural Testing of Shotcrete

The energy absorption of fibre-reinforced shotcrete (FRS) is determined based on testing of round [5] or square panels [6]. Other than the geometrical difference between the panels, the structural response and energy absorption also differ significantly between the tests. This is because the round panels are supported by three pivoted supports and are statically determinate, while the square panels are continuously supported by a steel frame along all edges. This, in combination with the friction between concrete and steel [7], results in a higher energy absorption for the square panels. The residual flexural capacity is determined based on testing of beams [8]. It is well known that the scatter in test results is much higher for beams compared to panels [9,10]. The main reason for this is the length of the fracture zone, i.e., the crack. For beams, one single crack occurs during the testing, and the length of the fracture zone is equal to the width of the beam, i.e., 125 mm for tests, based on EN 14488-3 [8]. For the round panels [5], three cracks should develop during the test, and the total length of the fracture zone is around 1200 mm. Since the post-cracking performance of FRS is governed by the number and orientation of fibres bridging the crack, it is clear that when the size of the fracture zone decreases, i.e., for tests on beams, the effect of the natural variation in fibre distribution is more pronounced compared to a specimen with a longer fracture zone, i.e., a panel. The scatter in results for beams is clearly visible in results presented by, e.g., Sjölander et al. [11] and Conforti et al. [12].
Due to this, the scientific community has investigated if any correlation can be found between tests on beams and panels [12,13,14,15,16]. So far, no commonly accepted correlation between beams and panels has been established. Nevertheless, a linear correlation between energy absorption and residual strength is suggested in several papers, e.g., [14,15,16]. In Bernard [13], a correlation between the absorbed energy of a round panel at 40 mm vertical deformation E R 40 and a square panel at 25 mm vertical deformation E S 25 is presented. The correlation is strongly linear and expressed as follows:
E S 25 = 2.5 E R 40
During construction, continuous testing of FRS should be performed to evaluate the structural performance and ensure that the specific project requirements are achieved. The evaluation criterion is specified in each test, and, since different committees have developed these, the standard to pass a test differs. Below, some key differences between the tests are pointed out. The test frequency for FRS is defined in EN 14487-1 [17] and depends on the selected inspection category. For the residual flexural strength f re , the mean value of a test series of three samples must reach the target f re . Moreover, all individual tests must reach 90% of the target f re . Thus, due to the large scatter in results, the last requirement will heavily influence the value of f re from the test series. For tests on panels, the criterion to pass the tests is more forgiving. For tests based on ASTM C1550 [5], two out of three tests should reach the target energy absorption, while the mean energy absorption from test series based on EN 14488-5 [6] is used to evaluate the quality. Here, it is clear that the evaluation process differs between the different test series and that the variation in test results is more penalised for tests on beams compared to panels since both the mean and individual values of the test series must reach a target value. Furthermore, tests on beam experience a larger scatter compared to panels, which negatively affects the characteristic f re . Thus, if different test methods are allowed within the same project, a consistent evaluation of the test result should be implemented. The consequence of a test result that does not reach the target depends on the project, but could lead to an increased test frequency or an investigation of the structural capacity of the applied shotcrete. Both scenarios are likely to increase the cost and potentially delay the project. Thus, the consequence of the large scatter and stricter evaluation of test results will likely lead to larger dosages of fibres being added to the mix. This is a waste of natural resources and money.

1.2. Aim of This Paper

The aim of this paper is to numerically investigate how the length of the fracture zone affects the structural behaviour of fibre-reinforced shotcrete. In particular, this paper investigates if the dosage of fibres may be reduced by changing the test method. This is achieved by numerical simulations using the finite element method. First, a non-linear material model capable of simulating the post-cracking response of shotcrete reinforced with various types of fibres is presented. After that, experimental results are used to verify the numerical model, and a case study is presented, in which the length of the fracture zone is investigated. The numerical simulations are based on the work by Brodd and Östlund [10].

2. Numerical Model for Fibre-Reinforced Shotcrete

Below, a non-linear material model to simulate cracking of FRS is presented. The model was based on Continuum Damage Mechanics (CDM) and implemented in the finite element software Comsol Multiphysics [18]. After this, the material model properties were determined based on experimental testing of beams and panels.

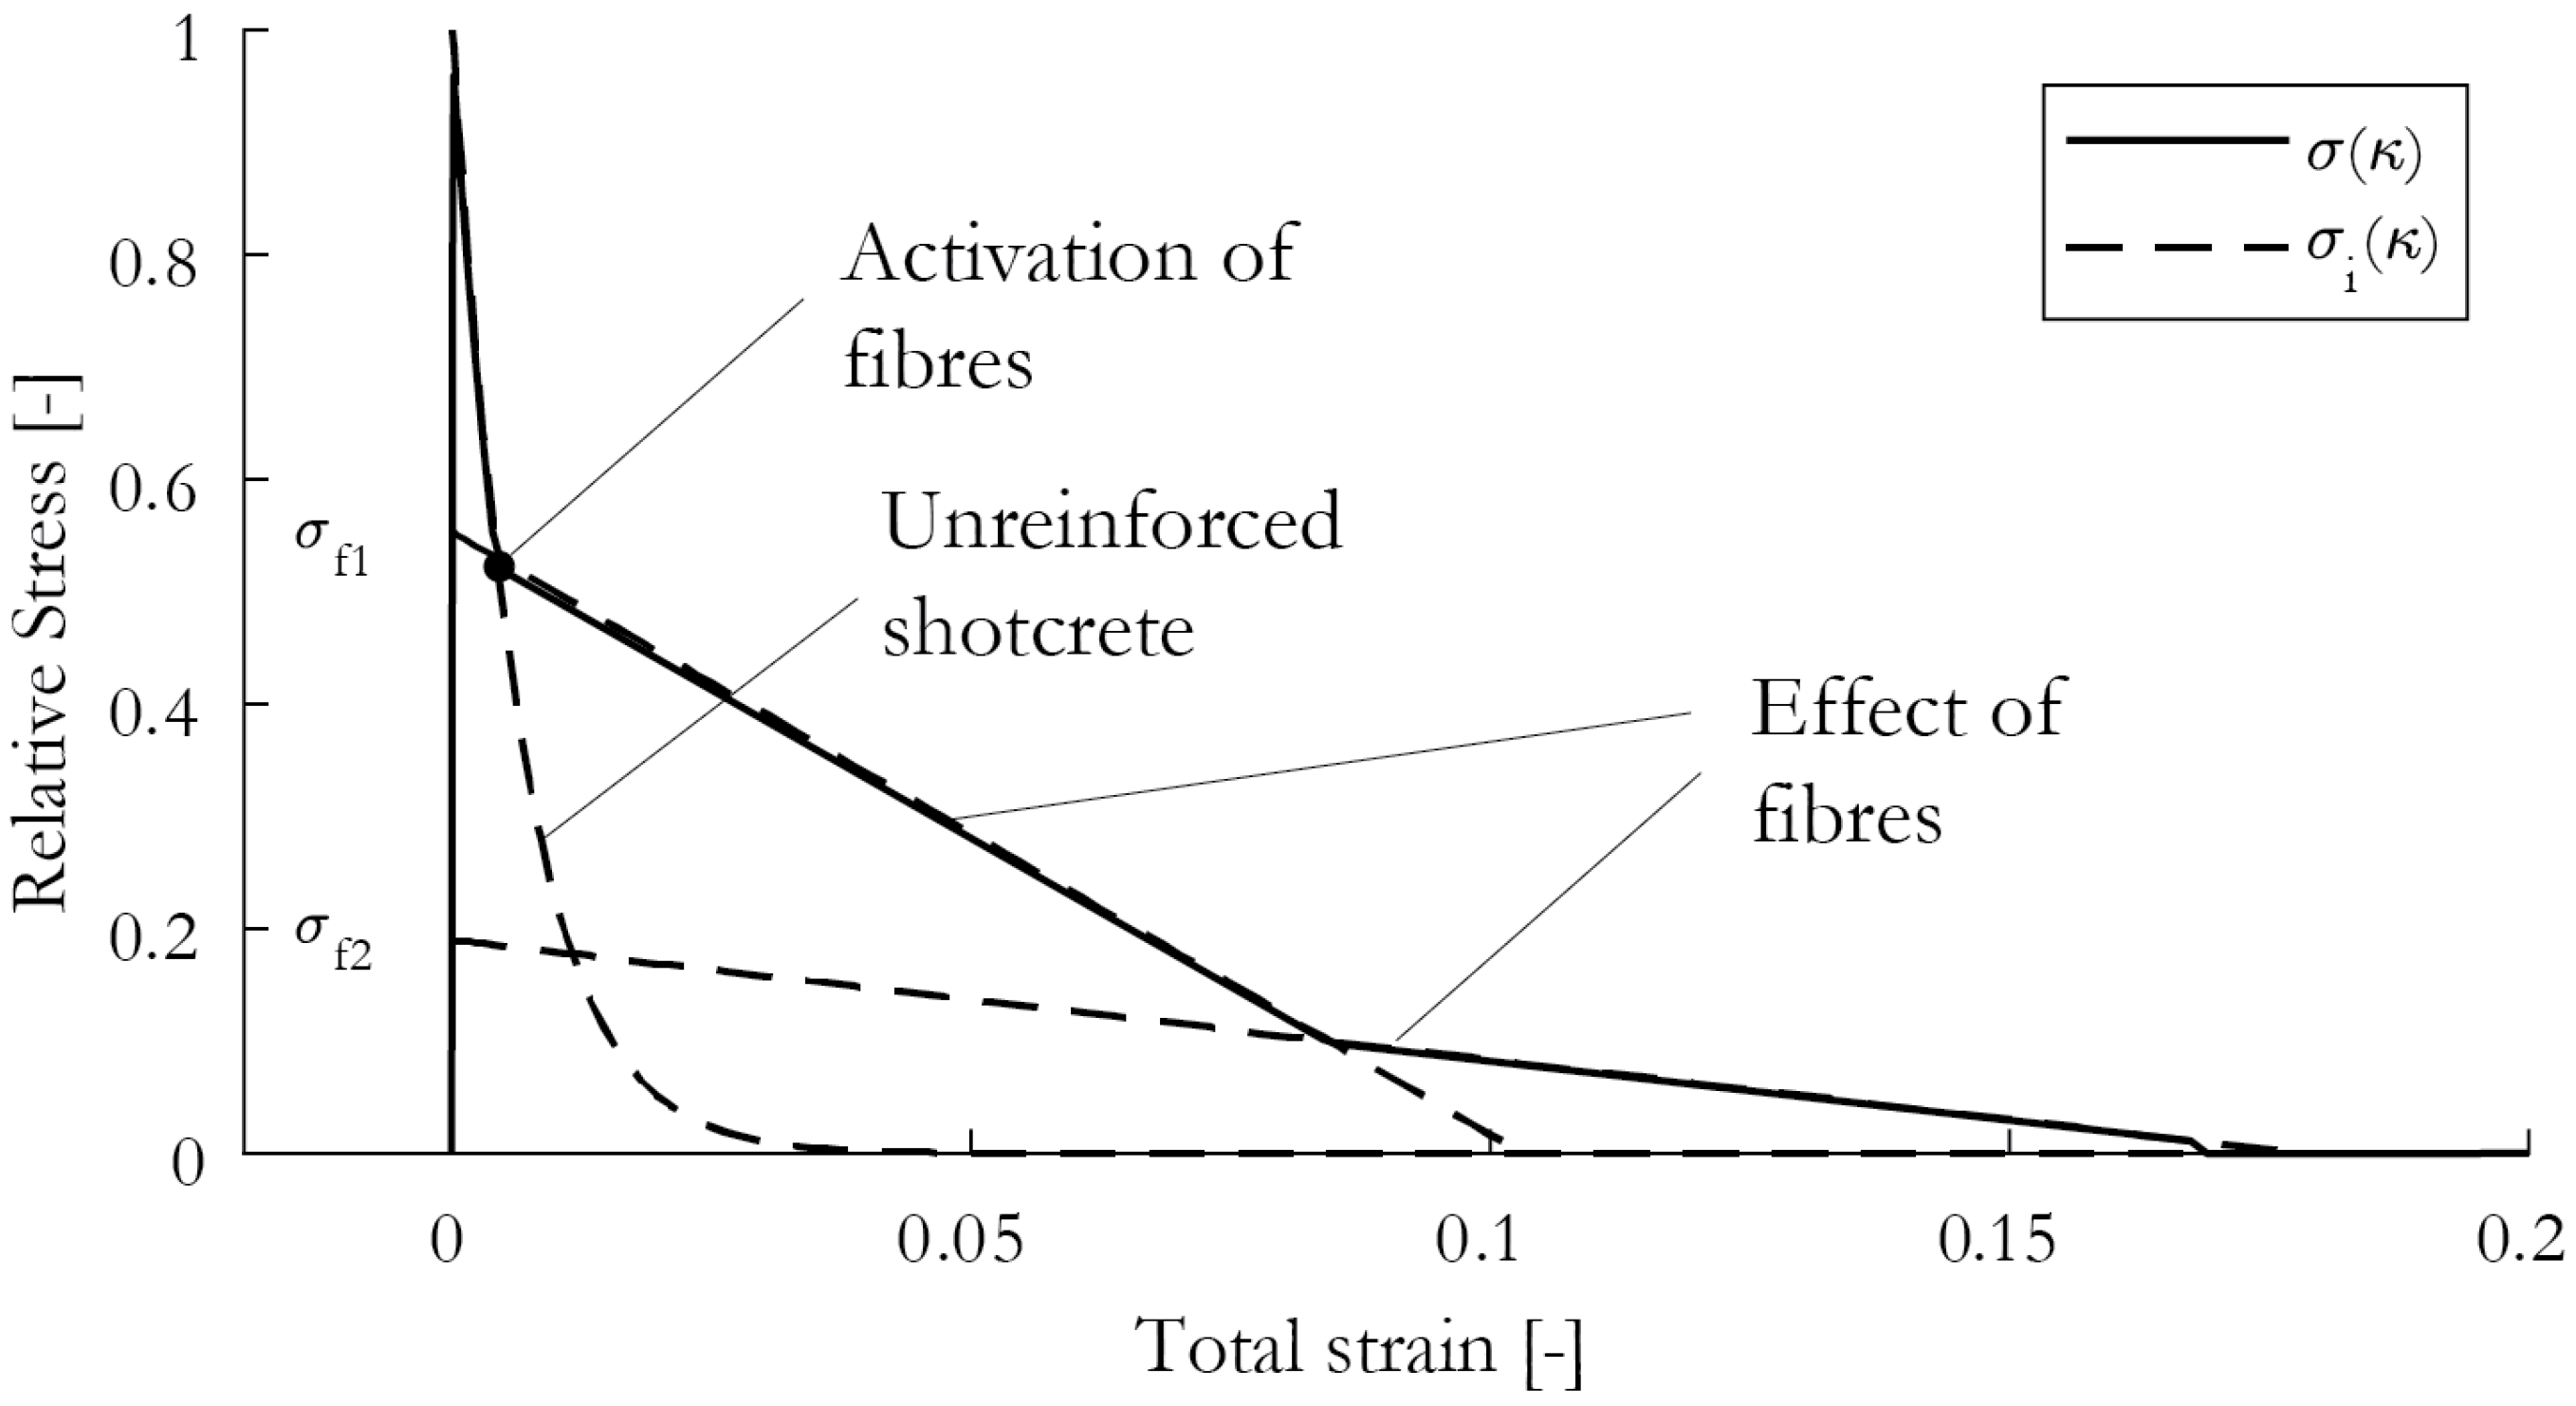
2.1. Damage Model for Shotcrete

A CDM based on the work by Oliver et al. [19] and its implementation in a general finite element (FE) software by Gash [20] was used to simulate cracking of fibre-reinforced shotcrete. The original model could simulate unreinforced concrete, and the extension of the damage model to consider the effect of fibres was presented by Sjölander et al. [21,22]. The damage model is isotropic, i.e., damage is equal in all directions, and the damage evolution can be described with a single scalar ω . Equation (2) describes the evaluation of stresses for a 1D case, in which a linear-elastic response based on Young’s modulus for the undamaged material E and the equivalent strain ε eq is assumed up to the tensile strength f t :
σ = ( 1 ω ) E ε eq
In this model, only tensile stress is considered, and damage is irreversible. To track the maximum strain in each element, a history-dependent variable κ was used to log the strain in each time step. Thus, κ is defined as the maximum strain between the current ε eq and previous time-step κ old :
κ = max ( ε eq , κ old )
Furthermore, the evolution of damage follows a Kuhn–Tucker condition, as presented in Equations (4) and (5). Based on these, damage only increases if the current state of strain ε eq is larger than the history-dependent strain κ :
f ( ε eq , κ ) = ε eq κ 0
f 0 ; κ 0 ; κ f = 0
After cracking, the fracture process was described by the Cohesive Crack Model presented by Hillerborg et al. [23] and illustrated in Figure 2. Hence, the post-cracking response was based on an assumed relationship between stress σ and crack width w, i.e., a σ ( w ) -function, until a stress-free crack-opening w c was reached. The crack band theory was used to reduce mesh dependency, in which the effect of micro-cracks is smeared over a crack bandwidth. The damage model was implemented in terms of strain ε eq , and the relationship between ε eq and crack width w was defined by the element size h f :
w = ( κ ε 0 ) h for ε 0 < κ
To model the post-cracking response of fibre-reinforced shotcrete, the contributions of the shotcrete and fibres were separated. This is illustrated schematically in Figure 3. Here, the strain levels were fictitious and the true strain at the intersection points were defined and implemented as crack width according to Equation (6). The reason for this modelling approach is that a small crack opening is required to activate the fibres fully. Thus, the initial response was governed by the unreinforced shotcrete, which is described with an exponential softening function. The slope of the curve is described by ε f , which is governed by the strain at cracking ε 0 , fracture energy G f , and tensile strength f t of the shotcrete—as shown in Equations (7) and (8) below:
σ ( κ ) = σ t exp κ ε 0 ε f for ε 0 κ
ε f = ε 0 2 + G f f t
At a certain crack-opening ( w 1 ), defined by the strain limit ε 1 , the fibres are activated, and a bi-linear function describes the ductile response caused by the fibres:
σ 1 ( κ ) = σ f 1 k 1 κ for ε 1 κ < ε 2
This function is continuous; σ f 1 defines the stress at the intersect (see Figure 3), and k 1 defines the slope of curve. The damage function ω ( κ ) was derived by setting Equation (2) equal to Equations (7) and (9), yielding the following:
ω ( κ ) = 1 ε 0 κ exp κ ε 0 ε f for ε 0 κ < ε 1
ω 1 ( κ ) = 1 σ f 1 k 1 κ E κ for ε 1 κ < ε 2

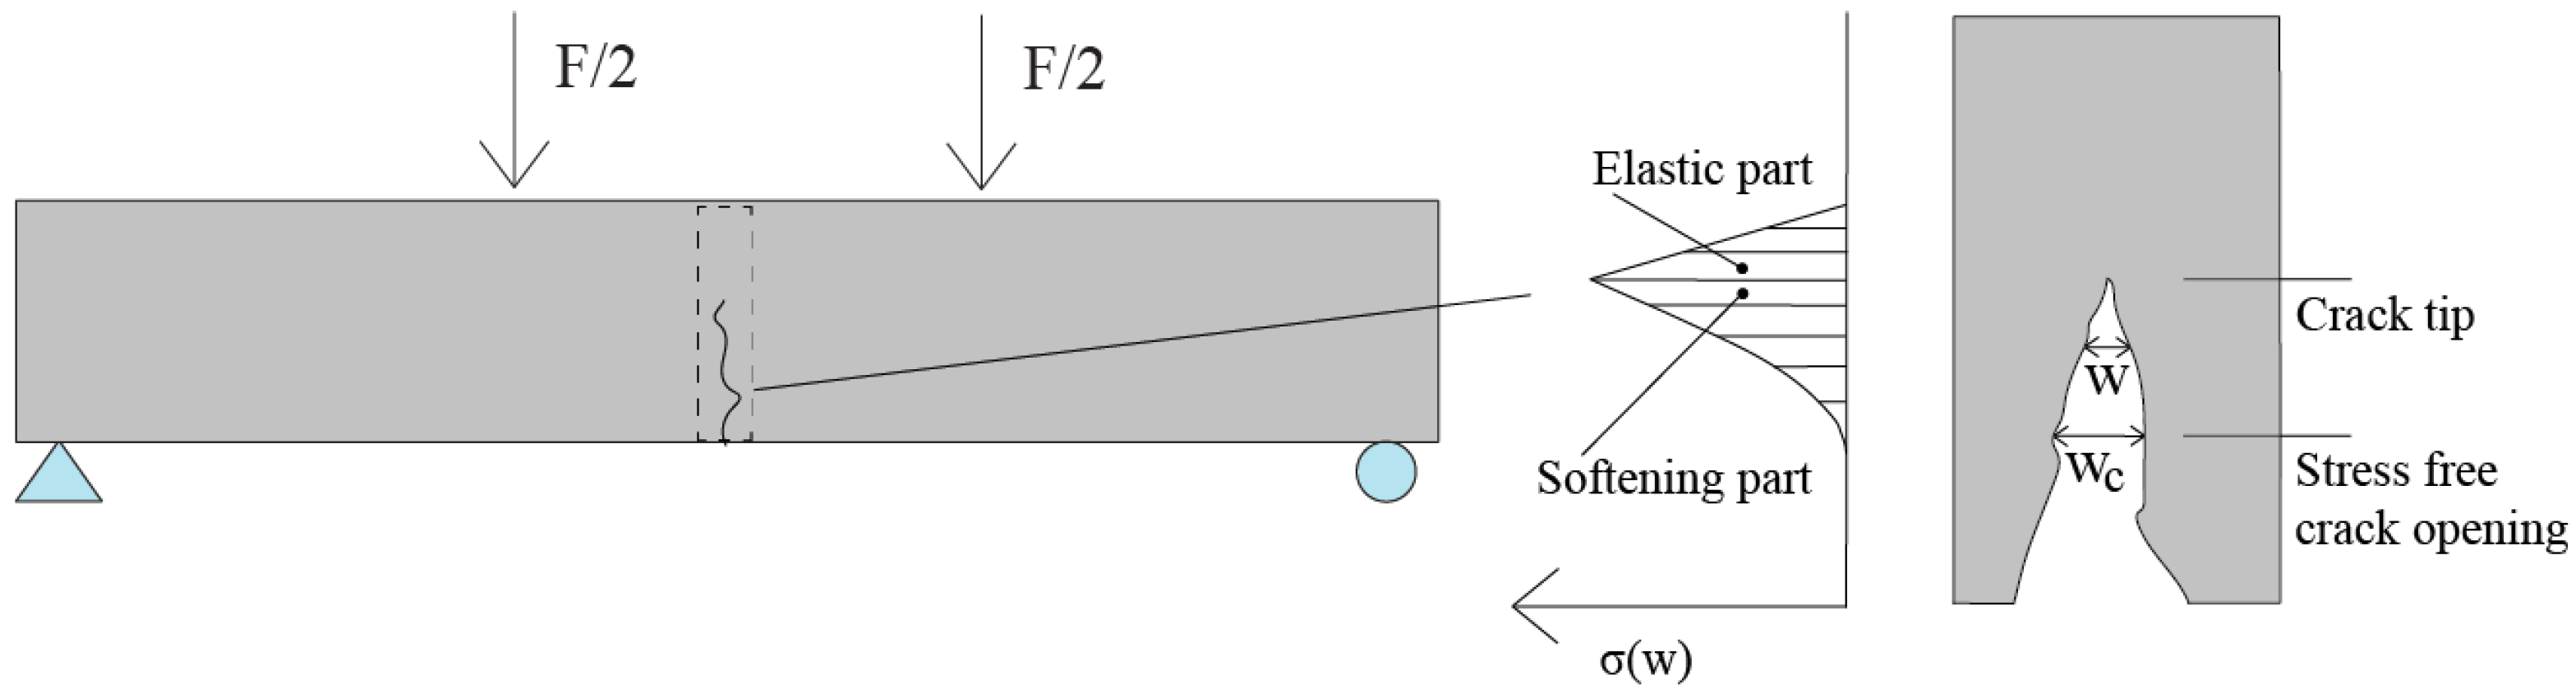
2.2. Simulation of Beams

The material parameters for the damage model were determined based on simulations of test results for beams, tested according to EN-14488-3 [8], as presented by Sjölander et al. [4,24]. Here, macro fibres, i.e., structural fibres, made of steel (Dramix 3D and 4D), synthetic (BarChip 54), and basalt (MiniBar), were used in various dosages to investigate the structural performance. More details on the tests are given in [4,24]. The EN-14488-3 is a four-point bending test on a simply supported beam with dimensions 500 × 125 × 75 mm (Length × Width × Height). The beam was modelled in 2D, using a fixed and a roller boundary condition, and a prescribed displacement of 5 mm was applied along two 12.5 mm long lines. A quasi-static solver was used, i.e., inertia effects were not considered, and a mesh of 8 mm triangular elements was selected based on a convergence study. In addition to the mechanical parameters of shotcrete, i.e., Young’s modulus, tensile strength, and fracture energy, the crack widths w 1 , w 2 , and w 3 and stress ratios α 2 and α 3 are necessary to define the material model completely. Here, w 2 w 3 and α 2 α 3 determine the intersection points for the material model shown in Figure 3. Based on curve fitting, Young’s modulus was between 27 and 29 GPa for all tests. From the test series, a total of six tests with four different fibre types were used for the simulation. The fibre type, dosage, and material parameters for the damage model are presented in Table 1. For this type of test, the crack occurs anywhere between the two point loads due to the constant moment. To enable the crack to localise in the simulations, the tensile strength was slightly increased in all elements, with the exception of a small centric line, as seen in Figure 4.
Comparisons between experimental and numerical results for beams reinforced with 40 kg/m 3 of 3D steel fibres and 16 kg/m 3 of basalt fibres are shown in Figure 4. Here, the capability of the numerical model to simulate different types of softening behaviour is seen, together with a typical scatter for tests on beams.

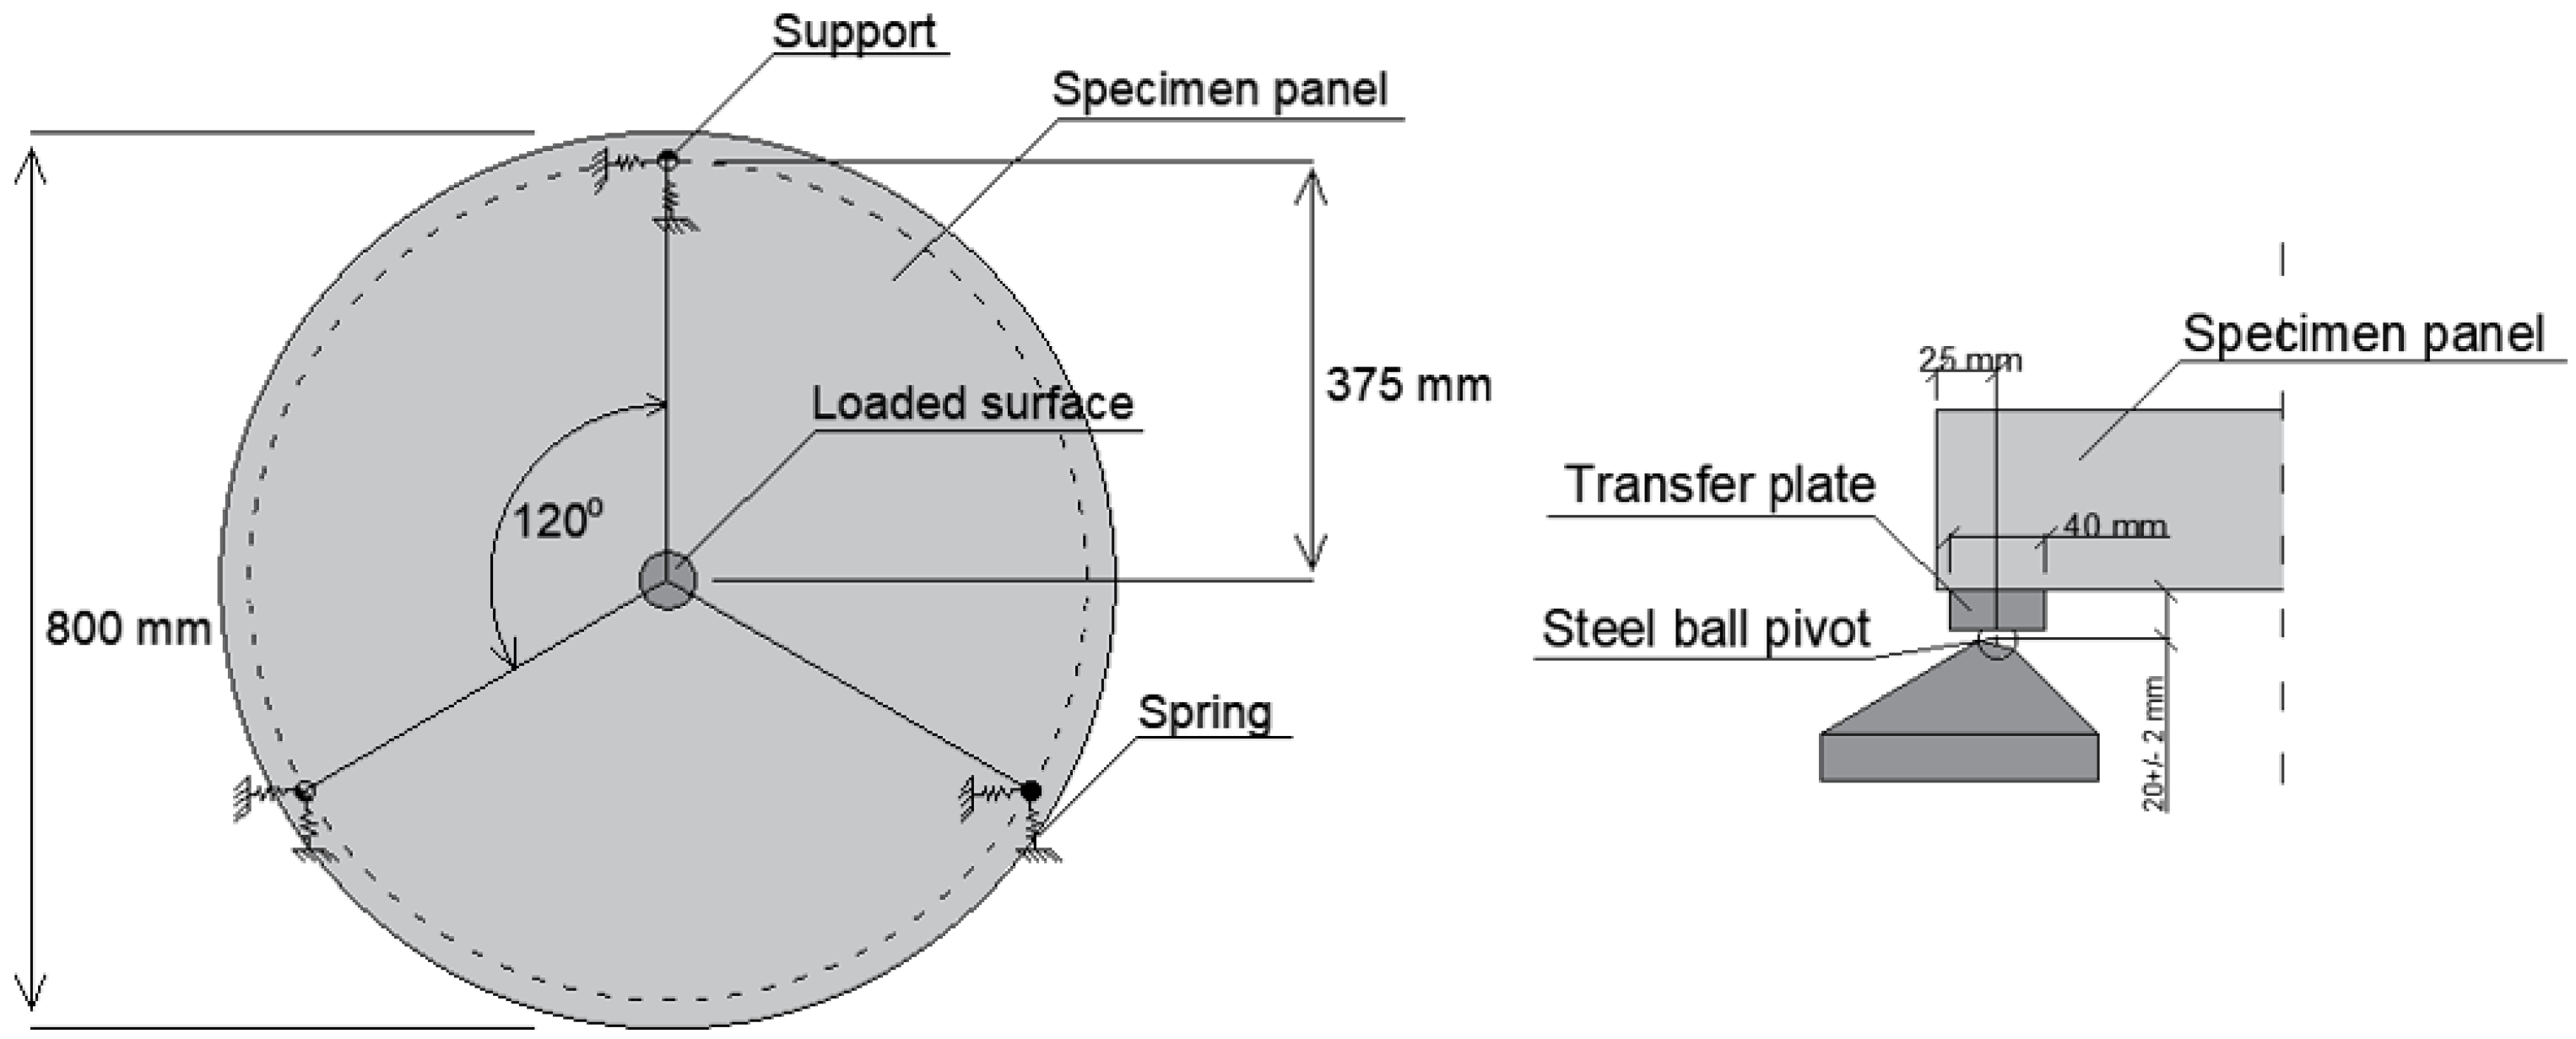
2.3. Simulation of Panels

The damage model was also used to simulate experimental results for round panels [5]. The geometry of the panel and a close-up of the pivot support is shown in Figure 5. The diameter and thickness of the panel were 800 and 75 mm, respectively, and the supports were placed 25 mm from the outer perimeter. Moreover, the support constrained the panel in the vertical direction, but the pivot support allowed radial displacements up to 0.5 mm. To simulate this, springs were implemented in the horizontal direction, as seen in Figure 5. Based on a sensitivity analysis, the spring stiffness was set to 1 kN/m. A 3D model was created with a 25 mm tetrahedral mesh. In the test, the load was applied by a piston with a hemispherical shape. In the simulation, the loaded area was assumed to be 50 mm, and a prescribed displacement of 40 mm was applied using a quasi-static solver.
The mechanical parameters for the damage model to simulate the panels are presented in Table 2. Comparisons between experimental and numerical results for panels reinforced with 20 kg/m 3 of 4D steel fibres and 9 kg/m 3 of synthetic fibres are shown in Figure 6. Again, the numerical model shows good agreement with the experimental results, and the scatter in the results is significantly lower compared to the beams.

3. Comparison between Beams and Panels

To investigate how the length of the fracture zone affects the expected structural behaviour of fibre-reinforced shotcrete, a straightforward numerical simulation campaign was conducted, as described below. The set-up of the numerical model and used mechanical parameters are described in Section 2.
  • Define Material Model A based on fitting of numerical simulations to experimental results for tests on beams (see Table 1);
  • Define Material Model B based on fitting of numerical simulations to experimental results for tests on panels (see Table 2);
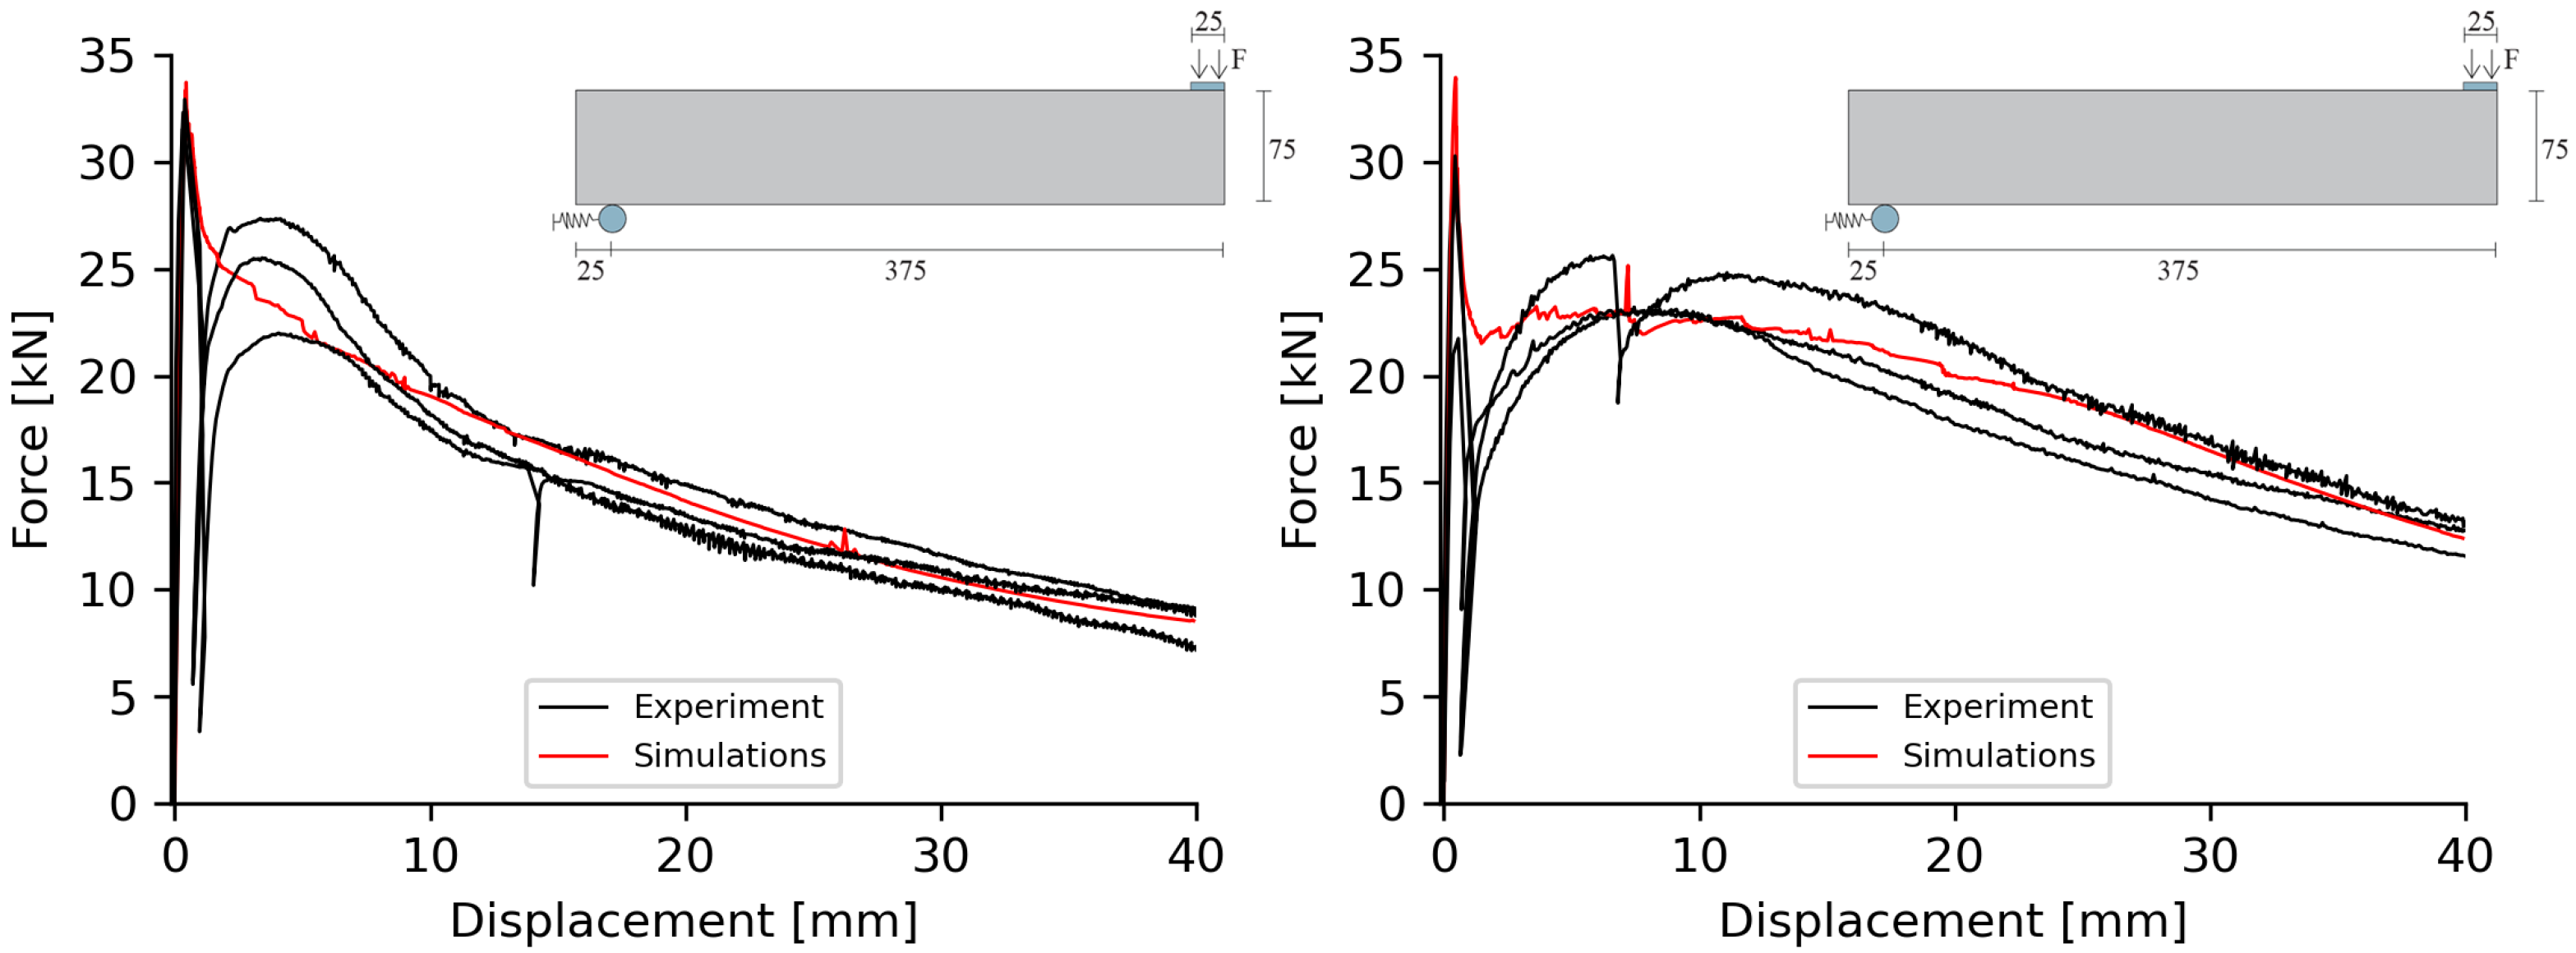
  • Use Material Model A to simulate the structural response of a panel;
  • Compare results between experiments on a panel and simulations with Material Model A;
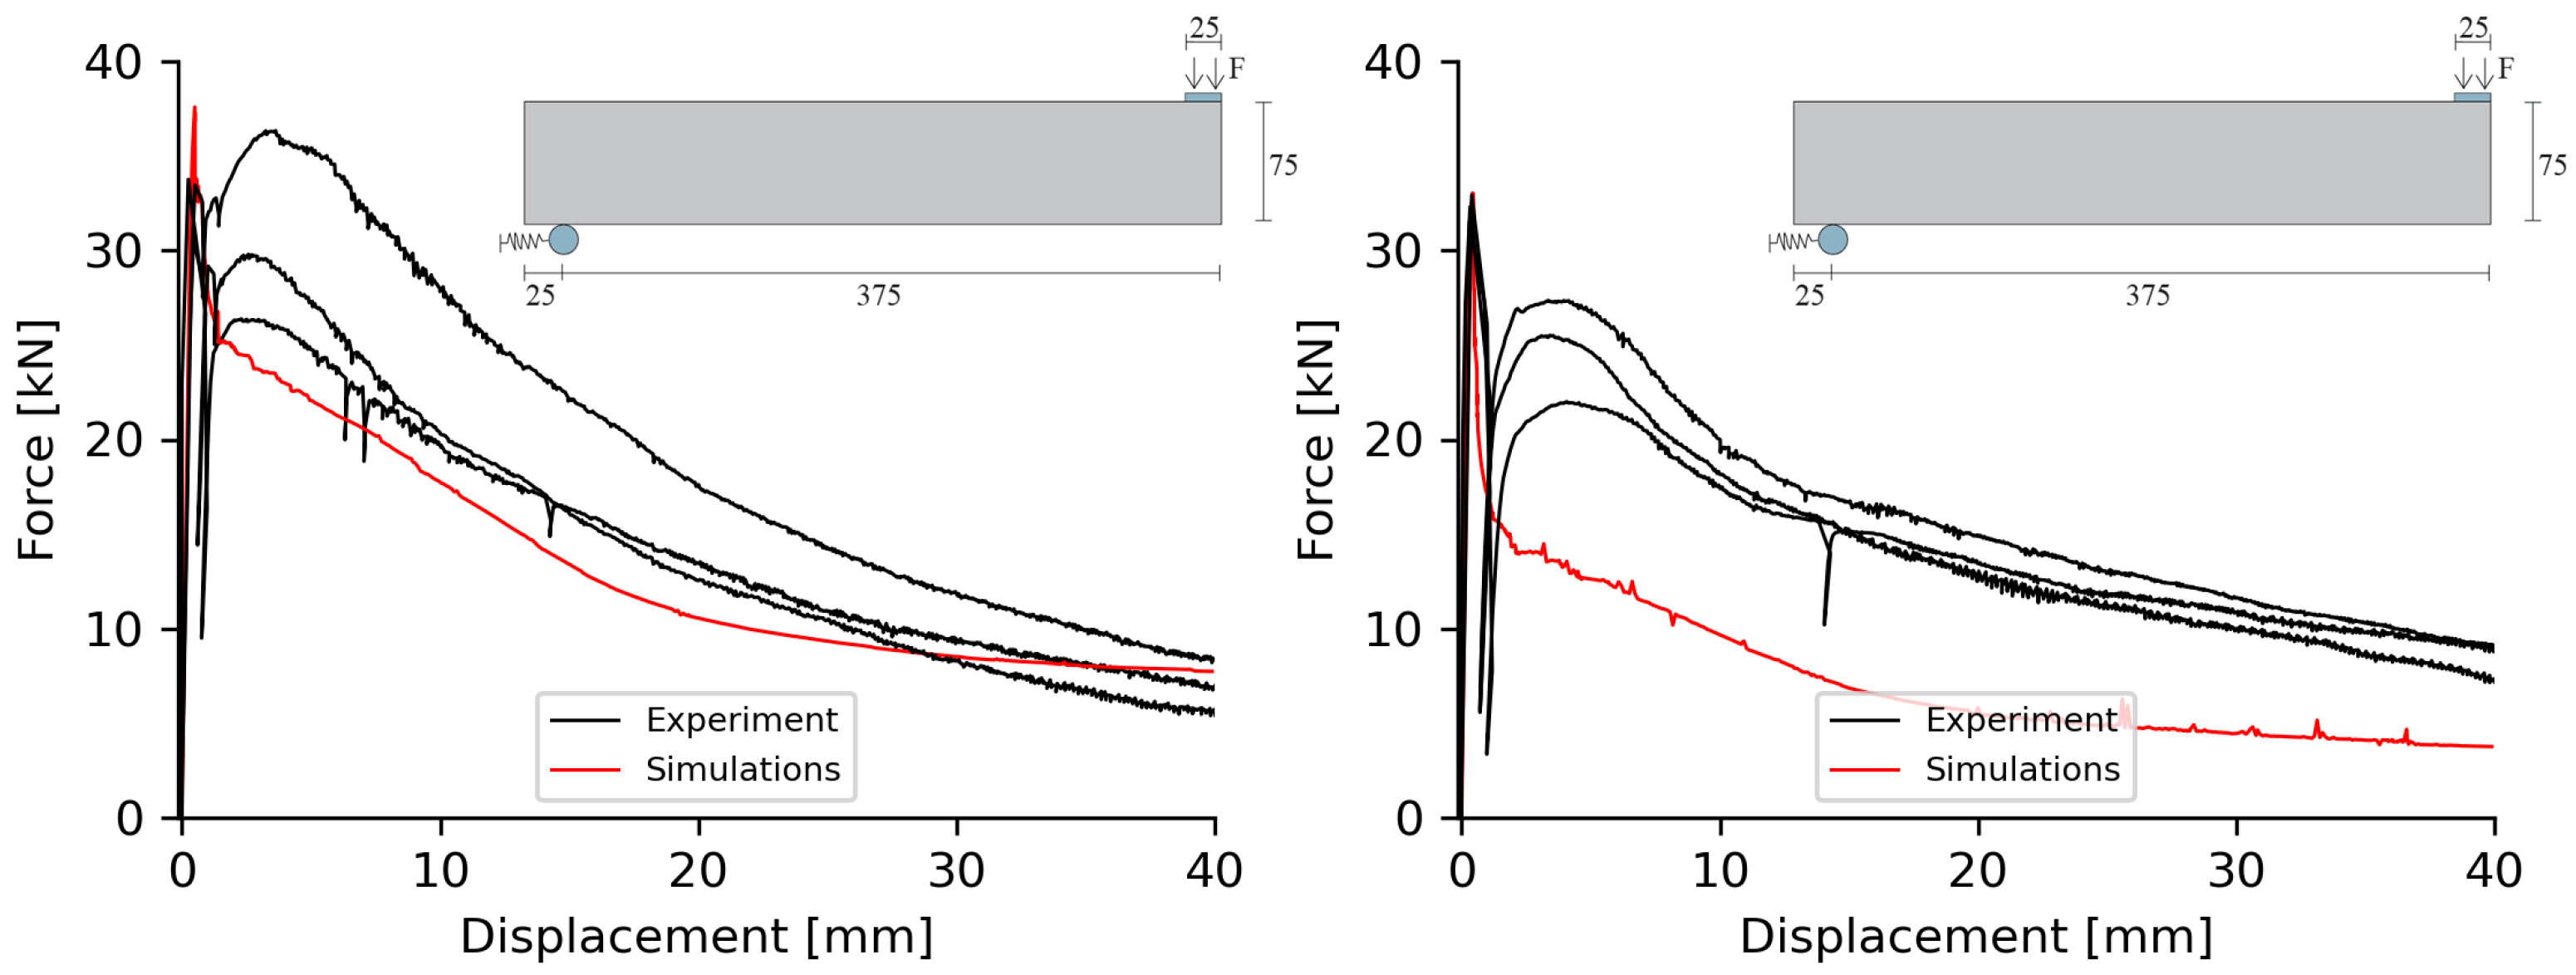
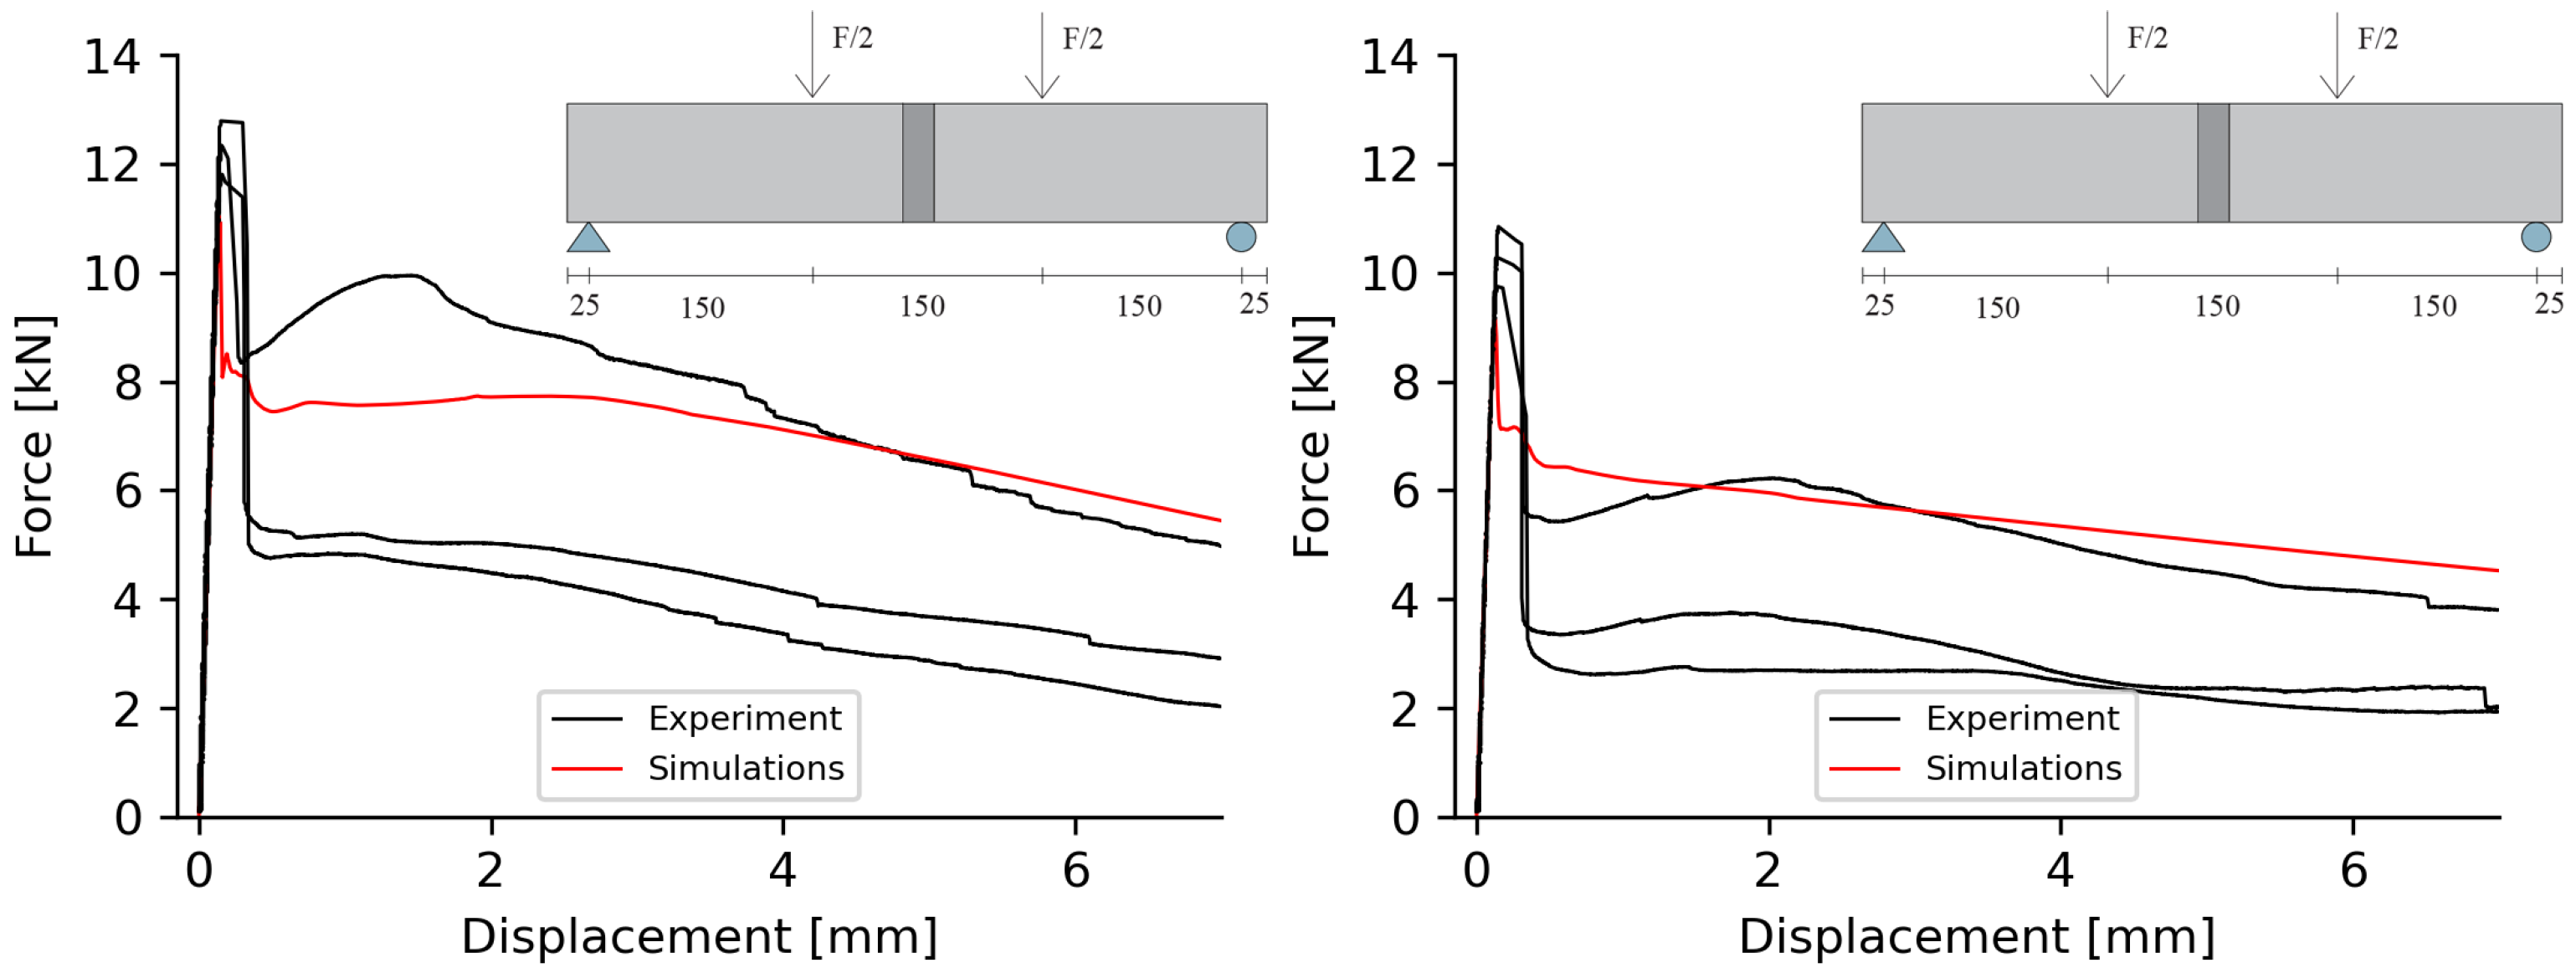
  • Use Material Model B to simulate the structural response of a beam;
  • Compare results between experiments on a beam and simulations with Material Model B.
The parameters for Material Model A and B were selected to replicate the mean of the three tests (see Figure 4 and Figure 6). Thus, the material model was tuned for the same dosage of fibres, but Material Model A was tuned for the response of a fracture zone around 1/10 the size of Material Model B. If the structural response is unaffected by the fracture zone’s length, the comparison of results defined in points 4 and 6 will show no significant difference.

4. Results and Discussion

In this section, the results from the comparison is presented. The results from the simulation of the panels are presented first, followed by the results from the beams.

4.1. Simulation of Panels

In Figure 7, a comparison between experimental results on panels (three specimens) and numerical simulations with Material Model A, i.e., a material model tuned for tests on beams, is shown. For the panel reinforced with 40 kg/m 3 of steel 3D fibres, the simulated response is similar to the lowest experimental results, while a significant difference exists between simulated and experimental results for a panel reinforced with 20 kg/m 3 of steel 4D fibres. A possible explanation for this is the large difference in fibre content between the two tests: 40 and 20 kg/m 3 . With the short fracture zone, the scatter in results may be more pronounced for low-fibre volumes, which is reflected in the calibration of the material model. The experimental and simulated energy absorption for the panels at 40 mm vertical deflection is presented in Table 3. The last column presents the ratio between the simulated energy (Sim.) and the mean value from the experimental tests (Exp.). The simulations only absorbed between 49 and 87% of the energy from the experiments. The significant difference between simulations is likely a result of the scatter in results for tests on beams, and the results clearly indicate that the length of the fracture zone during testing affects the results.

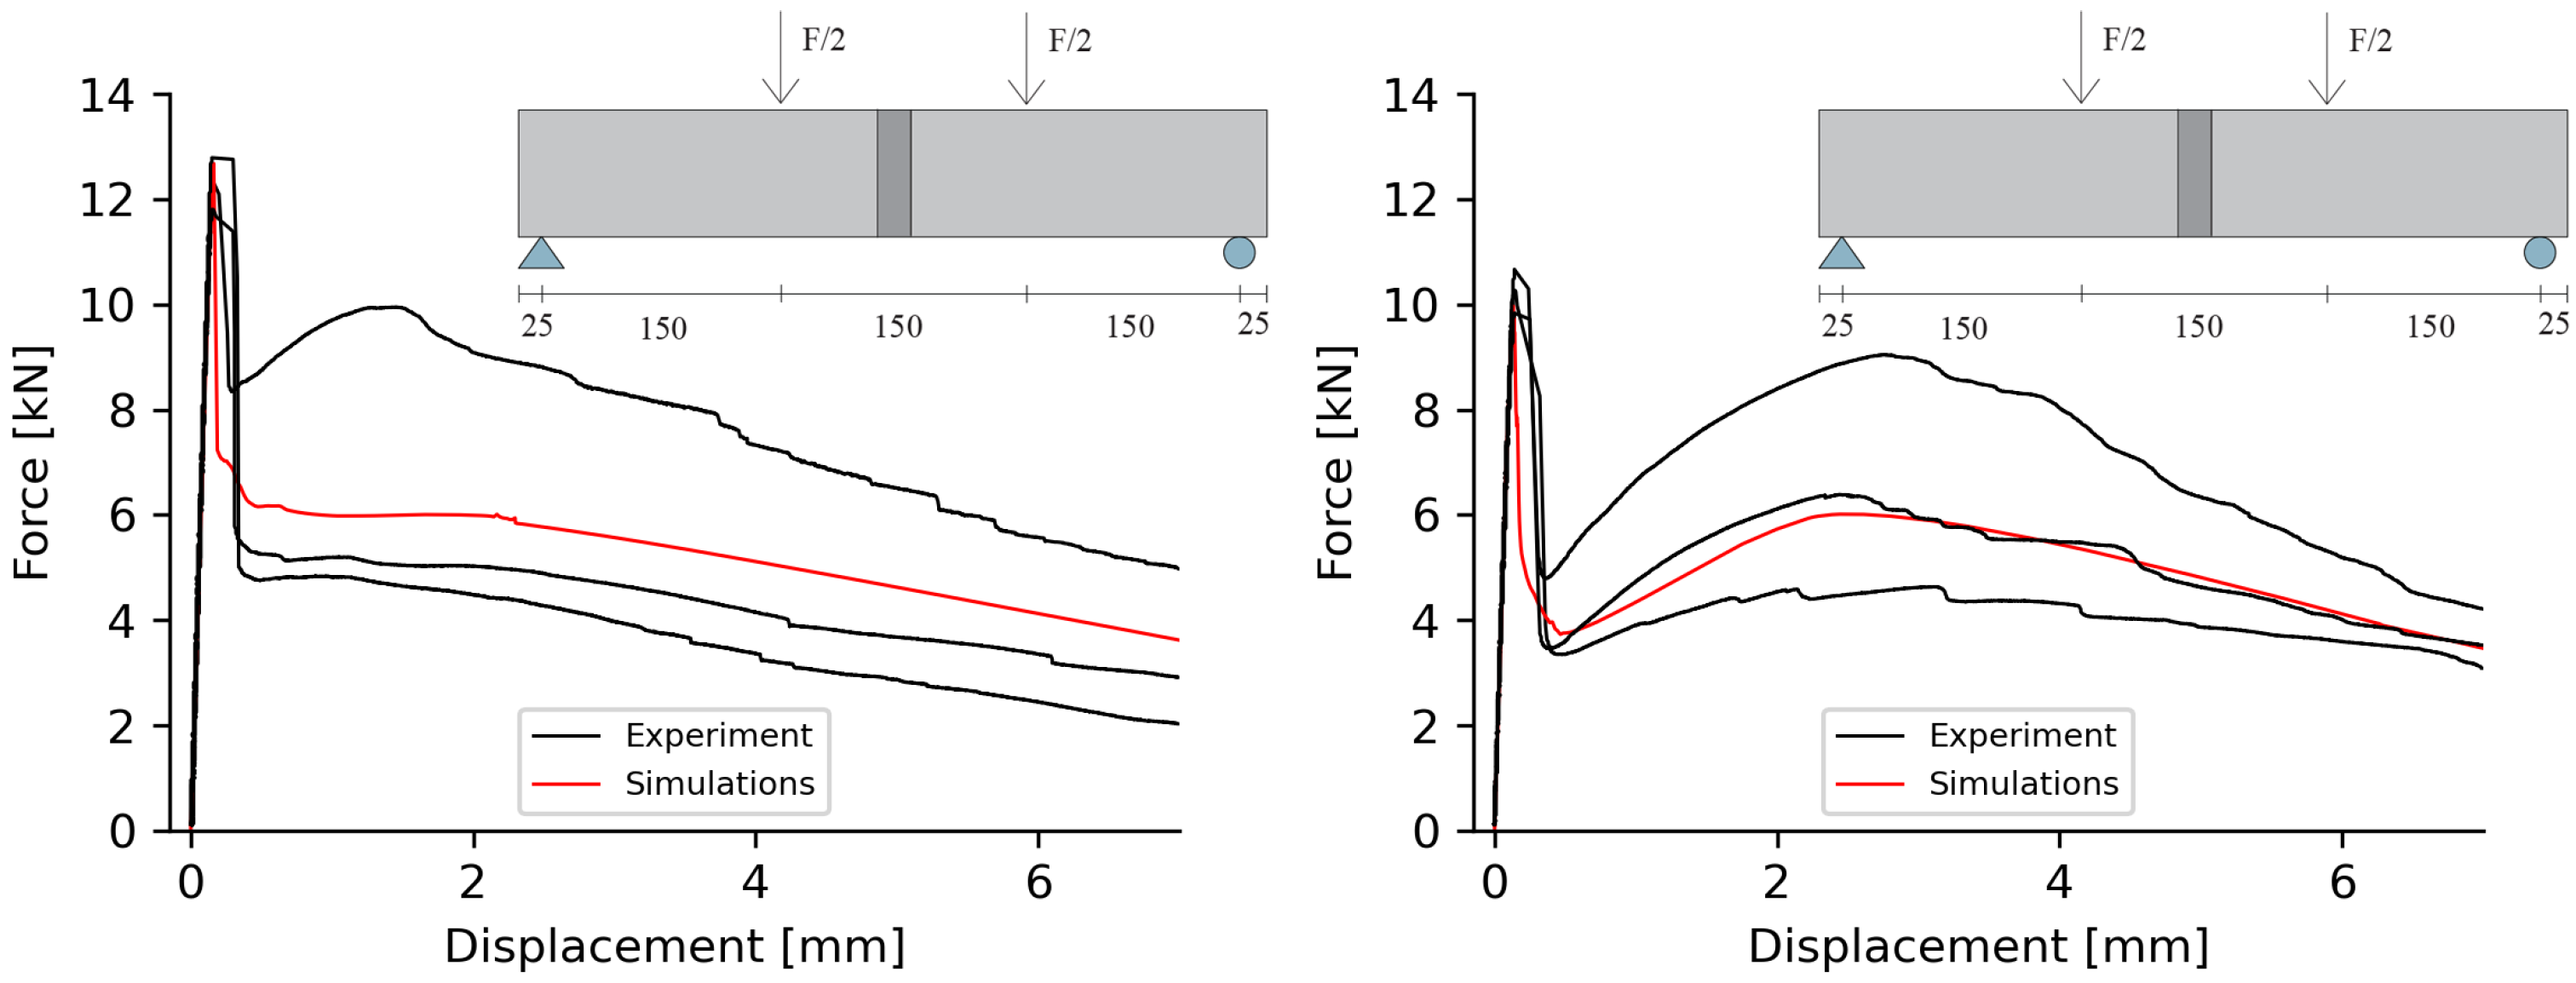
4.2. Simulation of Beams

Figure 8 shows a comparison between experimental results on beams (three specimens) and numerical simulations with Material Model B, i.e., a material model tuned for testing on panels. In both cases, the simulated performance of the beam is close to, or better, than the best beam from the experimental testing. Table 4 presents the residual flexural strength at 2 mm vertical deformation f r 2 for all tested beams. Moreover, the mean value for the experiments and the highest allowed characteristic value f r 2 exp are also presented, together with the results from the simulations f r 2 sim . The value f r 2 ch was calculated based on [17], i.e., the value of each test was required to be at least 90% of the target value. Here, the simulated f r 2 ch was between 9 and 37% higher than the experimental results. As for the results with the panels, this clearly indicates that the length of the fracture zone strongly affects the results.

4.3. Interpretation of Results

The simulation results show that the length of the fracture zone significantly affects the post-cracking performance of fibre-reinforced shotcrete. Tests on specimens with a short fracture zone, i.e., beams, suffer more from the natural variation in the number and orientation of fibres bridging the crack compared to specimens with longer fracture zones, i.e., panels. This could be explained as follows: the post-cracking performance of FRS is purely governed by the number and orientation of fibres bridging the crack. Since individual fibres are not explicitly modelled, the mechanical parameters for the damage model are selected to represent the average number and efficiency of the fibres bridging the crack. Moreover, the mechanical parameters in this study were selected to represent the average structural response for three tests, as shown in Figure 4 and Figure 6. Thus, the mechanical parameters for the damage model could, in a simplified way, be explained as representing the average number of fibres along the fracture zone. A short fracture surface will, thereby, be more affected by local variations in the number and orientation of fibres. If the damage model was instead tuned to represent the best structural performance from the beam test, the difference between the simulated and experimental results of the panel, shown in Figure 7, would likely be smaller.
However, tests on beams are the most commonly used method to obtain the residual flexural strength, which is required for the analytical design of shotcrete. Thus, it is not possible to only perform tests on panels with the design codes and philosophy used today. Nevertheless, the results from the simulation indicate that fibre volume could be decreased if numerical simulations of beams, with a material model tuned after tests on panels, were used instead of experimental testing. Hence, using test methods with longer fracture zones, e.g., the test method on notched slabs proposed by EFNARC [25], could perhaps decrease the required fibre volumes in the design to save material and natural resources. The slab is supported along two edges and behaves, similar to a beam. Introducing a notch allows a more stable crack propagation since the crack must follow a predefined path. However, this may also affect the results, since the crack may not necessarily propagate along the weakest plane. Moreover, the geometry and relationship between the notch and depth of the specimen may also affect the results [26]. A second alternative is to use a theoretical approach, as presented by Bernard [14] to calculate the residual flexural strength of FRS based on panel tests. This approach is based on yield line theory and the assumption that cracks in the panels will propagate from the centre towards the edge along the mid-section of each support.

5. Conclusions

This paper presented a numerical model capable of simulating the non-linear, i.e., post-cracking, response of fibre-reinforced shotcrete. The material model’s parameters were defined based on fitting between experimental and numerical results for beams (Model A) and panels (Model B). A numerical study was, thereafter, conducted, in which the material model based on beams was used to simulate panels and vice versa.
The results show that a numerical model tuned against results on a panel, i.e., a longer fracture zone, performs better compared to a model tuned against results from a beam. Panels simulated with Model A (beam) consequently showed lower results compared to the experimental data, while beams simulated with Model B (panel) showed higher results compared to the experiments. This is because the beams with a small fracture zone are more sensitive to the natural variation in the number and orientation of fibres which bridge the crack. This is reflected in the material parameters of the material model that were chosen to replicate an average response of the three specimens that were tested. When the length of the fracture zone increases, the specimen becomes less sensitive to local variations in the number and orientation of fibres bridging the crack.
In practice, the strict criteria for acceptance, in combination with the large scatter in test results for beams, leads to conservative values of the residual flexural strength f re . To compensate for this, large dosages of fibres are used to reach the project-specific values of f re . The results in this paper indicate that the required dosage of fibres could be decreased if testing and design were based on tests performed on larger specimens, i.e., panels.

Author Contributions

Conceptualisation, L.Ö., A.S. and E.B.; methodology, L.Ö. and A.S.; software, L.Ö.; validation, L.Ö.; formal analysis, L.Ö.; investigation, L.Ö., A.S. and E.B.; writing—original draft preparation, L.Ö and A.S; writing—review and editing, E.B.; visualisation, L.Ö. and E.B.; supervision, A.S.; funding acquisition, A.S. All authors have read and agreed to the published version of the manuscript.

Funding

This research was funded by the Swedish Road Administration (Trafikverket).

Institutional Review Board Statement

Not applicable.

Data Availability Statement

Data from experimental testing available in Sjölander, Andreas; Ansell, Anders; Nordström, Erik (2022); “Data from structural testing of sprayed and cast shotcrete reinforced with fibres of steel, basalt and synthetic material”, Mendeley Data, V1, https://doi.org/10.17632/d7n5mvb2sg.1 [24].

Acknowledgments

The authors would like to thank Mattias Roslin and Per Vedin at the Swedish Road Administration who initiated the project.

Conflicts of Interest

The authors declare no conflict of interest.

Abbreviations

The following abbreviations are used in this manuscript:
RMRRock Mass Rating
FRSFibre-Reinforced Shotcrete
CDMContinuum Damage Model

References

  1. Barton, N.; Lien, R.; Lunde, J. Engineering classification of rock masses for the design of tunnel support. Rock Mech. 1974, 6, 189–236. [Google Scholar] [CrossRef]
  2. Bieniawski, Z. Engineering classification of jointed rock masses. Civ. Eng. S. Afr. 1973, 15, 335–343. [Google Scholar] [CrossRef]
  3. Barrett, S.; McCreath, D. Shortcrete support design in blocky ground: Towards a deterministic approach. Tunn. Undergr. Space Technol. 1995, 10, 79–89. [Google Scholar] [CrossRef]
  4. Sjölander, A.; Ansell, A.; Nordström, E. On the design of permanent shotcrete rock support. Fibers 2023, 11, 20. [Google Scholar] [CrossRef]
  5. ASTM. ASTM C1550-20; Standard Test Method for Flexural Toughness of Fiber Reinforced Concrete (Using Centrally Loaded Round Panel). Technical Report. ASTM International: Pennsylvania, PA, USA, 2020. [Google Scholar]
  6. CEN. EN 14488-5; Testing Sprayed Concrete—Part 5: Determination of Energy Absorption Capacity of Fibre Reinforced Slab Specimens. Technical Report. European Committee for Standardisation: Brussels, Belgium, 2006. [Google Scholar]
  7. Bjontegaard, O. Energy Absorption Capacity for Fibre Reinforced Sprayed Concrete. Effect of Friction in Round and Square Panel Tests with Continuous Support (Series 4); Technical Report; Statens Vegvesen: Oslo, Norway, 2009. [Google Scholar]
  8. CEN. EN 14488-3; Testing Sprayed Concrete—Part 3: Flexural Strengths (First Peak, Ultimate and Residual) of Fibre Reinforced Beam Specimens. Technical Report. European Committee for Standardisation: Brussels, Belgium, 2006. [Google Scholar]
  9. Rengarajan, M. Laboratory Testing of Shotcrete with Fibres of Steel, Basalt or Synthetic Materials. Master’s Thesis, KTH Royal Institute of Technology, Stockholm, Sweden, 2020. [Google Scholar]
  10. Brodd, E.; Östlund, L. Environmental and Technical Evaluation of Cement Reduction and Test Methods for Fibre Reinforced Shotcrete in Tunnels. Master’s Thesis, KTH Royal Institute of Technology, Stockholm, Sweden, 2022. [Google Scholar]
  11. Sjölander, A.; Ansell, A. Probabilistic modelling of fibre reinforced shotcrete. In Proceedings of the WTC 2019 ITA-AITES World Tunnel Congress, Naples, Italy, 3–9 May 2019. [Google Scholar]
  12. Conforti, A.; Minelli, F.; Plizzari, G.A.; Tiberti, G. Comparing test methods for the mechanical characterization of fiber reinforced concrete. Struct. Concr. 2018, 19, 656–669. [Google Scholar] [CrossRef]
  13. Bernard, E.S. Correlations in the behaviour of fibre reinforced shotcrete beam and panel specimens. Mater. Struct. 2002, 35, 156–164. [Google Scholar] [CrossRef]
  14. Bernard, E.S. Development of a 1200 mm Diameter Round Panel Test for Post-crack Assessment of Fiber Reinforced Concrete. ASTM Int. Adv. Civ. Eng. Mater. 2013, 2, 457–471. [Google Scholar] [CrossRef]
  15. Buratti, N.; Incerti, A.; Tilocca, A.; Mazzotti, C.; Paparella, M.; Draconte, M. Energy absorption tests on fibre-reinforced-shotcrete round and square panels. In Proceedings of the Tunnels and Underground Cities: Engineering and Innovation Meet Archaeology, Architecture and Art, Naples, Italy, 3–9 May 2019; pp. 1842–1851. [Google Scholar]
  16. Parmentier, B.; De Grove, E.; Vandewalle, L.; Van Rickstal, F.; Walraven, J.; Stoelhorst, D. Dispersion of the mechanical properties of FRC investigated by different bending tests. In Proceedings of the Fib Symposium “Tailor Made Concrete Structures”, Amsterdam, The Netherlands, 19–21 May 2008; pp. 507–512. [Google Scholar]
  17. CEN. EN 14487-1; Sprayed Concrete—Part 1: Definitions, Specifications and Conformity. Technical Report. European Committee for Standardisation: Brussels, Belgium, 2005. [Google Scholar]
  18. Comsol. Comsol Multiphysics Ver. 5.4 Documentation; Comsol: Stockholm, Sweden, 2019. [Google Scholar]
  19. Oliver, J.; Cervera, M.; Oller, S.; Lubliner, J. Isotropic damage models and smeared crack analysis of concrete. In Proceedings of the 2nd International Conference on Computer Adided Analysis and Design of Concrete Strucutres, Zell Am See, Austria, 4–6 April 1990; pp. 945–957. [Google Scholar]
  20. Gasch, T. Multiphysical Analysis Methods to Predict the Ageing and Durability of Concrete. Ph.D. Thesis, KTH Royal Institute of Technology, Stockholm, Sweden, 2019. [Google Scholar]
  21. Sjölander, A.; Hellgren, R.; Ansell, A. Modelling aspects to predict failure of a bolt-anchored and fibre reinforced shotcrete lining. In Proceedings of the 8th International Symposium on Sprayed Concrete, Trondheim, Norway, 11–14 June 2018. [Google Scholar]
  22. Sjölander, A.; Hellgren, R.; Malm, R.; Ansell, A. Verification of failure mechanisms and design philosophy for a bolt-anchored and fibre-reinforced shotcrete lining. Eng. Fail. Anal. 2020, 116, 104741. [Google Scholar] [CrossRef]
  23. Hillerborg, A.; Modéer, M.; Petersson, P.E. Analysis of crack formation and crack growth in concrete by means of fracture mechanics and finite elements. Cem. Concr. Res. 1976, 6, 773–781. [Google Scholar] [CrossRef]
  24. Sjölander, A.; Ansell, A.; Nordström, E. Data from structural testing of sprayed and cast shotcrete reinforced with fibres of steel, basalt and synthetic material. Mendeley Data 2022, V1. [Google Scholar] [CrossRef]
  25. EFNARC. EFNARC Three Point Bending Test on Square Panel with Notch; Technical Report; EFNARC: Flums, Switzerland, 2011. [Google Scholar]
  26. Meng, W.; Yao, Y.; Mobasher, B.; Khayat, K.H. Effects of loading rate and notch-to-depth ratio of notched beams on flexural performance of ultra-high-performance concrete. Cem. Concr. Compos. 2017, 83, 349–359. [Google Scholar] [CrossRef]
Figure 1. Flexural and shear failure modes for shotcrete subjected to loading from a single block.
Fibers 11 00059 g001
Figure 2. The fracture process zone in front of the crack tip for the cohesive crack model, and the elastic stress distribution behind the crack tip.
Fibers 11 00059 g002
Figure 3. Schematic view of the numerical model for fibre-reinforced shotcrete.
Fibers 11 00059 g003
Figure 4. Comparison between experimental and numerical results for beams reinforced with 40 kg/m 3 of steel 3D fibres (left) and 16 kg/m 3 of basalt fibres (right).
Fibers 11 00059 g004
Figure 5. Geometry of the panel (left) and a close-up of the pivot support (right). From Brodd and Östlund [10].
Fibers 11 00059 g005
Figure 6. Comparison between experimental and numerical results for panels reinforced with 20 kg/m 3 steel 4D fibres (left) and 9 kg/m 3 synthetic fibres (right).
Fibers 11 00059 g006
Figure 7. Comparison between experimental and numerical simulations of panels reinforced with 40 kg/m 3 of steel 3D fibres (left) and 20 kg/m 3 of steel 4D fibres (right) using Material Model A. From Brodd and Östlund [10].
Fibers 11 00059 g007
Figure 8. Comparison between experimental and numerical simulations of beams reinforced with 40 kg/m 3 of steel 3D fibres (left) and 20 kg/m 3 of steel 4D fibres (right) using Material Model B. From Brodd and Östlund [10].
Fibers 11 00059 g008
Table 1. Mechanical properties for damage model for various dosages and type of fibres in beam tests.
FibreDosage σ t G f w 1 w 2 w 3 α 2 α 3
[MPa][N/m][mm][mm][mm][-][-]
Steel 3D30 kg/m 3 4.51250.0451.6570.180.01
Steel 3D40 kg/m 3 4.91250.0421.570.20.01
Steel 4D20 kg/m 3 41250.071.260.150.01
Steel 4D30 kg/m 3 4.31250.052170.290.01
Synthetic9 kg/m 3 4.41250.0882.1100.170.01
Basalt16 kg/m 3 3.61250.081.660.320.01
Table 2. Mechanical properties for damage model for various dosages and type of fibres in beam tests.
FibreDosage σ t G f w 1 w 2 w 3 α 2 α 3
[MPa][N/m][mm][mm][mm][-][-]
Steel 3D30 kg/m 3 4.11250.041580.140.0001
Steel 3D40 kg/m 3 4.51250.0361.880.290.0002
Steel 4D20 kg/m 3 3.81250.0425130.160.009
Steel 4D30 kg/m 3 4.11250.0352160.270.01
Synthetic9 kg/m 3 4.11250.0531.7170.310.0008
Basalt16 kg/m 3 3.61250.041.740.460.002
Table 3. Energy absorption at 40 mm deflection of round panels, from [4,24]. Results from experiments and calculated results from beam parameters.
FiberDosageExp. 1Exp. 2Exp. 3MeanSim.Sim./Exp.
[J][J][J][J][J][-]
Steel 3D30 kg/m 3 47251656451745287%
Steel 3D40 kg/m 3 59779259266053481%
Steel 4D20 kg/m 3 58357765360429549%
Steel 4D30 kg/m 3 -83592788153561%
Synthetic9 kg/m 3 70380673674839353%
Basalt16 kg/m 3 51164437951242182%
- Test not complete.
Table 4. The residual strength from FRS beam experiments, from [4,24], the achievable required strength for each test series, f r 2 ch , and the calculated strength from simulations, f r 2 sim .
FiberDosageExp. 1Exp. 2Exp. 3Mean f r 2 ch f r 2 sim f r 2 sim / f r 2 ch
f r 2 [MPa] f r 2 [MPa] f r 2 [MPa] f r 2 [MPa][MPa][MPa][-]
Steel 3D30 kg/m 3 52.82.83.53.13.4110%
Steel 3D40 kg/m 3 3.22.95.73.93.23.8119%
Steel 4D20 kg/m 3 1.72.442.71.92.6137%
Steel 4D30 kg/m 3 4.94.43.44.23.84.3113%
Synthetic9 kg/m 3 2.12.62.82.52.32.5109%
Basalt16 kg/m 3 5.23.72.83.93.13.7119%
Disclaimer/Publisher’s Note: The statements, opinions and data contained in all publications are solely those of the individual author(s) and contributor(s) and not of MDPI and/or the editor(s). MDPI and/or the editor(s) disclaim responsibility for any injury to people or property resulting from any ideas, methods, instructions or products referred to in the content.

