Article

Shear and Flexural Behavior of Flat Slabs Casted with Polyolefin Fiber-Reinforced Concrete

by
Abdulnasser M. Abbas
,
Haleem K. Hussain
* and
Mohammed Farhan Ojaimi
Civil Engineering Department, Engineering College, University of Basrah, Basrah City 61004, Iraq
*
Author to whom correspondence should be addressed.
Fibers 2022, 10(4), 34; https://doi.org/10.3390/fib10040034
Submission received: 1 March 2022 / Revised: 28 March 2022 / Accepted: 30 March 2022 / Published: 12 April 2022

Abstract

:
This paper presents the influence of polyolefin fiber on the flexural and shear attitude on the flat slabs. Three slab sets (80 cm × 80 cm) were tested, each with a thickness of 10 cm. In the first set (S1), the effect of fiber content on the flexural behavior of the flat slab was considered. Therefore, four slab specimens were cast, one of which was considered as a control specimen with no fiber content, while the other three included fibers at 0.5, 1, and 1.5 percent of the total concrete volume. The second series of experiments studied the flexural behavior of flat slabs (S2) with an opening of 15 cm × 15 cm. The first specimen contained nil polyolefin, while the second included 1% polyolefin. In the third set (S3), consideration was taken for 0 and 1% of Polyolefin to realize the shear behavior of the flat slab. The increase in polyolefin fiber content from 0 to 1.5% (for slab set 1) will decrease the deflection from 4.5 mm to 2.3 mm, with an average of 3.58 mm, which is close to the deflection of a 1% polyolefin fiber specimen. Three dimensional models for the tested slabs were simulated numerically via ABAQUS software program. The ratio of the maximum deflection between the experimental and the numerical outcomes were varied with a range of 1.01 to 1.28, with an average of 1.14.

1. Introduction

Concrete technology developed widely throughout the last century, which provided broader performance and superior materials fit for modern demands. Concrete is considered the primary material in construction; thus, an enormous amount of research and implementation is provided in this field. Concrete mechanical performance, such as flexural stresses, tensile stresses, fatigue, durability difficulties, and ductility, are among the majority of relevant concerns. The most pertinent innovations applied are likely high-strength concrete, reinforced fiber, and self-compacting. Although it possesses some of the familiar disadvantages of steel, such as its weight, durability, or cost, steel fiber has proven appropriate for such structural purposes.
Fibers such as polyolefin have become more significant in everyday applications as a result of recent progress in polymer studies, engineering, and chemical combinations. High strength, tensile properties, perfect corrosion resistance, toughness, strong chemical resistance, and inexpensiveness have all promoted its use. The evolution of synthetic microfibers of the polyolefin-based concrete, with enhanced mechanical characteristics, has broadened the application of such plastic fibers in concrete beyond their traditional usage in controlling shrinkage and cracking [1].
Rajai examines the feasibility of employing polypropylene fibers on 25 slabs to study the capacity of punching shear and crack patterns of two-way reinforced concrete slabs with the influence of drop-weight. The included parameters are slab thickness of 70 mm and 90 mm, various fiber proportions from 0% to 1.2% (increments of 0.3%), and impact load of 1.2 m and 2.4 m height. Three sets of slabs were considered: in the first set, there was no impact load; while in the second set, the taken impact load was 1.2 m height; and the final set studied impact load with 2.4 m height. When polypropylene fibers were added in amounts of 0.3% to 1.2% via concrete volume, and the thickness of the slab rose from 70 mm to 90 mm, there was a significant improvement in the gross attitude of the slabs and the impedance to slab impact loading [2].
The attitude of RC slabs was investigated by Ramadevi and Babu utilizing steel and polyolefin (Hybrid Fiber HF). The study concerns a concrete design mix (M25 grade) depending on IS: 10262:2009, with different fiber proportions (by cement weight) in amounts of 0.5 to 3%. Concrete characteristics, such as flexural strength, compressive strength, and tensile split, were determined with the slab control sample. Five one-way slab models, which were simply supported and loaded by couple (static) line loads, cast HF propositions of 0.75, 1.5, 2, and 3%. The gained outcomes revealed that with 2% of HF, the ultimate load and deflection increased by 136.16% and 125%, respectively, compared with the control specimen [3].
Marcos et al. presented an experimental work to estimate essential characteristics of various dosages of polyolefin fiber-reinforced concrete (PFRC) utilizing traditional and self-compacting concrete. The outcomes showed considerable PFRC performance and, thus, enhanced concrete residual strength within the extent of small deformation. Therefore, polyolefin gathering with steel-hooked fibers was achieved to enhance the gained outcomes. When the quantity of polyolefin was 4.5 kg/m3, the fracture energy rose by 14.2 times that of ordinary concrete. The utilizing fibers with 26 kg/m3 of steel-hooked fibers, gave an increase in fracture energy of about 20 times the fracture energy of plain concrete. However, when the two kinds of fiber were combined, the fracture energy was 38 times of ordinary concrete [4].
Dan and Traian suggested a procedure to estimate the strength of reinforced concrete punching shear for a flat slab with no reinforcement for shear at the interior column junction. The process depended on the assumption that the strength of punching shear was shown via a variable inclination angle of the crack, and it was induced by punching shear that presented a failure of the conic surface. Furthermore, the critical section position has not been set. However, the location of the critical section depends on several factors, such as the effective depth, material strengths, and reinforcement ratio. On the other hand, the numerical studies reflect that an increase in the thickness of the slab induced an increase in the compression stress angle and in punching shear crack inclination. Depending on the test outcome database, at the ultimate state, the flat slab structural behavior was controlled by many parameters, like flexural characteristics, slab slenderness, and strength of the concrete [5].
Marko et al. compared their experimental punching shear results on slabs that were strengthened and non-strengthened with shear reinforcement and anticipated outcomes from similar slabs when designed according to ACI Code 318, Eurocode 2, and Model Code 2010. Results obtained from the experimental work were confirmed to be underestimated for slabs with no shear reinforcement, compared with the three mentioned codes. However, in the existence of shear reinforcement, the observed shear strength was found to be overestimated, according to Eurocode 2. Six thin slabs were tested with a thickness of 12.5 cm. Three slabs were reinforced for a shear, while the others were kept without shear reinforcement. Expressions related to Eurocode 2 were more accurate than the other models. Slabs that were reinforced against shear gained a shear force with an approximate average of 17% more when compared with those of no shear reinforcement. Moreover, an increase of 36% was gained in the slab deformation capacity [6].
Recently, the shear strength of precast and prestressed hollow core slabs was studied numerically for different specimen thicknesses. The FE analysis was used to compare the results with the experimental program test by evaluating the shear stress distribution and crack patterns according to international standards such as EC2, EN, and ACI codes. The outcome shows the sensitivity of the shear stress distribution to shear failure. The essential variations in web width and depth, as well as concrete chords at the top and bottom of the void, results in a shear capacity related to the hollow-core shape and related noncircularity. The proposed formula to predict the shear capacity of considered slabs provided accurate and conservative (20%) estimates for slabs with normal depth and void [7].
Adding fibers to the concrete mix is an effective way to improve the mechanical properties of concrete. Use of steel fiber is crucial to enhancing the behavior of structural elements against cracks. Sadowska et al. used two types of fiber, steel fiber and polypropylene fibers, at 1% of the weight of the concrete mixture, in the concrete mix to reinforce the compression zone (30 mm layer thickness) with fibers. The outcome showed a 12% enhancement in the load capacity of the slab, compared with normal specimens. Cracks in modified concrete slabs developed throughout the width of the composite slabs, while in reference samples, crack development and spread were more observable [8].
Knowledge in this area is not yet comprehensively available for fiber-reinforced concrete slabs. Zuzana Marcalikova et al. studied the effect of steel fiber in the concrete mixture for slabs. They focused on the stress evaluation of the undersoil, where the samples were loaded with centric and eccentric loads. In general, the fiber significantly reduced the cracks in concrete and increased load-bearing capacity. As compared with centric loads, eccentric loads have relatively little difference in their maximum load capacity [9].
Rawnaq et al. presented a study that aimed to examine the effect of utilizing infiltrated fiber mortar concrete, which is a repair material in critical zones that require a particular kind of rehabilitation, such as defense structures, pavements, and deck of bridges. The investigation consisted of three levels. In the beginning, the physical characteristics of mortar slurry sneaked fiber (flexural, bond strengths, splitting tensile, and compressive) were determined via utilizing various fiber types such as micro steel fiber, polypropylene fiber, synthetic fiber, and end hooked steel fiber. In the next stage, a control slab, ordinary concrete, was cast in the dimensions of 900 × 900 × 80 mm. Here, two damaged slab sets of 900 × 900 × 50 mm dimensions were rehabilitated with an infiltrated fiber mortar layer of 30 mm thickness. Each set consisted of five damaged slabs: the first set was repaired in the compression zone, while the reparation was done in the tension zone for the second set. In the last step, the authors investigated the infiltrated fiber influence on the flexural attitude of the repaired slabs (ductility, flexural strength, and deflection) by a hydraulic jack using four concentrated loads. A significant enhancement in the flexural attitude was indicated for the testing specimens of the repaired specimen, as compared with the control slab. An increase of 2–39% in ultimate load was recorded in slabs repaired in the compression zone, while the increase in ultimate load was 4–71% for slabs fixed in the tension region [10].
Concrete characteristics have not been sufficiently examined to determine how hybrid fiber combinations affect them. Ali A. et al. performed an experiment to predict that constitutive curve of concrete specimens mixed with two types of fibers (steel and polyvinyl alcohol fiber) for compressive strength varied between 40 to 120 MPa. In order to better understand hybrid fiber-reinforced concrete elements, case studies were investigated to determine the behavior of the structural element [11].
Kytinou et al. investigated numerically the flexural performance of structural reinforced concrete with presence of steel fiber using nonlinear finite element analysis method. In this study, different longitudinal reinforcement ratios and steel fiber ratios varying between 0.3% and 1.5% were used. Smeared cracks approach was used to simulate the tensile response of specimens, rather than stress–strain relationships under tension. The fracture behavior of the material, and stress versus crack width, can be modeled with tension softening. The outcome showed that the steel fibers contributes positively to the short-term post crack behavior [12].
Due to lack of FE numerical data, an attempt was made to develop hybrid fiber-reinforced concrete to formulate the constitutive material model of concrete sample with fiber. Zainal et al. used five type hybrid synthetic fiber to conduct optimum fiber ratio enhancing mechanical properties. Cube sample and cylinder were used to study compressive strength and tensile strength. By determining the plastic hardening relationship between the damage parameters and the compression strength of relevant hybrid fiber concrete, constitutive curve models were developed. The study developed the constitutive models for all five types of fibers for use in future. FE analysis can be used the developed concrete damage plasticity (CDP) for modeling the structural elements [13].
The main goal of this study is to distinguish the influence of various proportions polyolefin fiber on the RC flat slab concrete structural behavior.

2. Characterization of Experimental Program

In the recent work, the whole eight RC flat slabs were prepared and tested in the construction materials laboratory of Civil Engineering Department, College of Engineering, University of Basra.

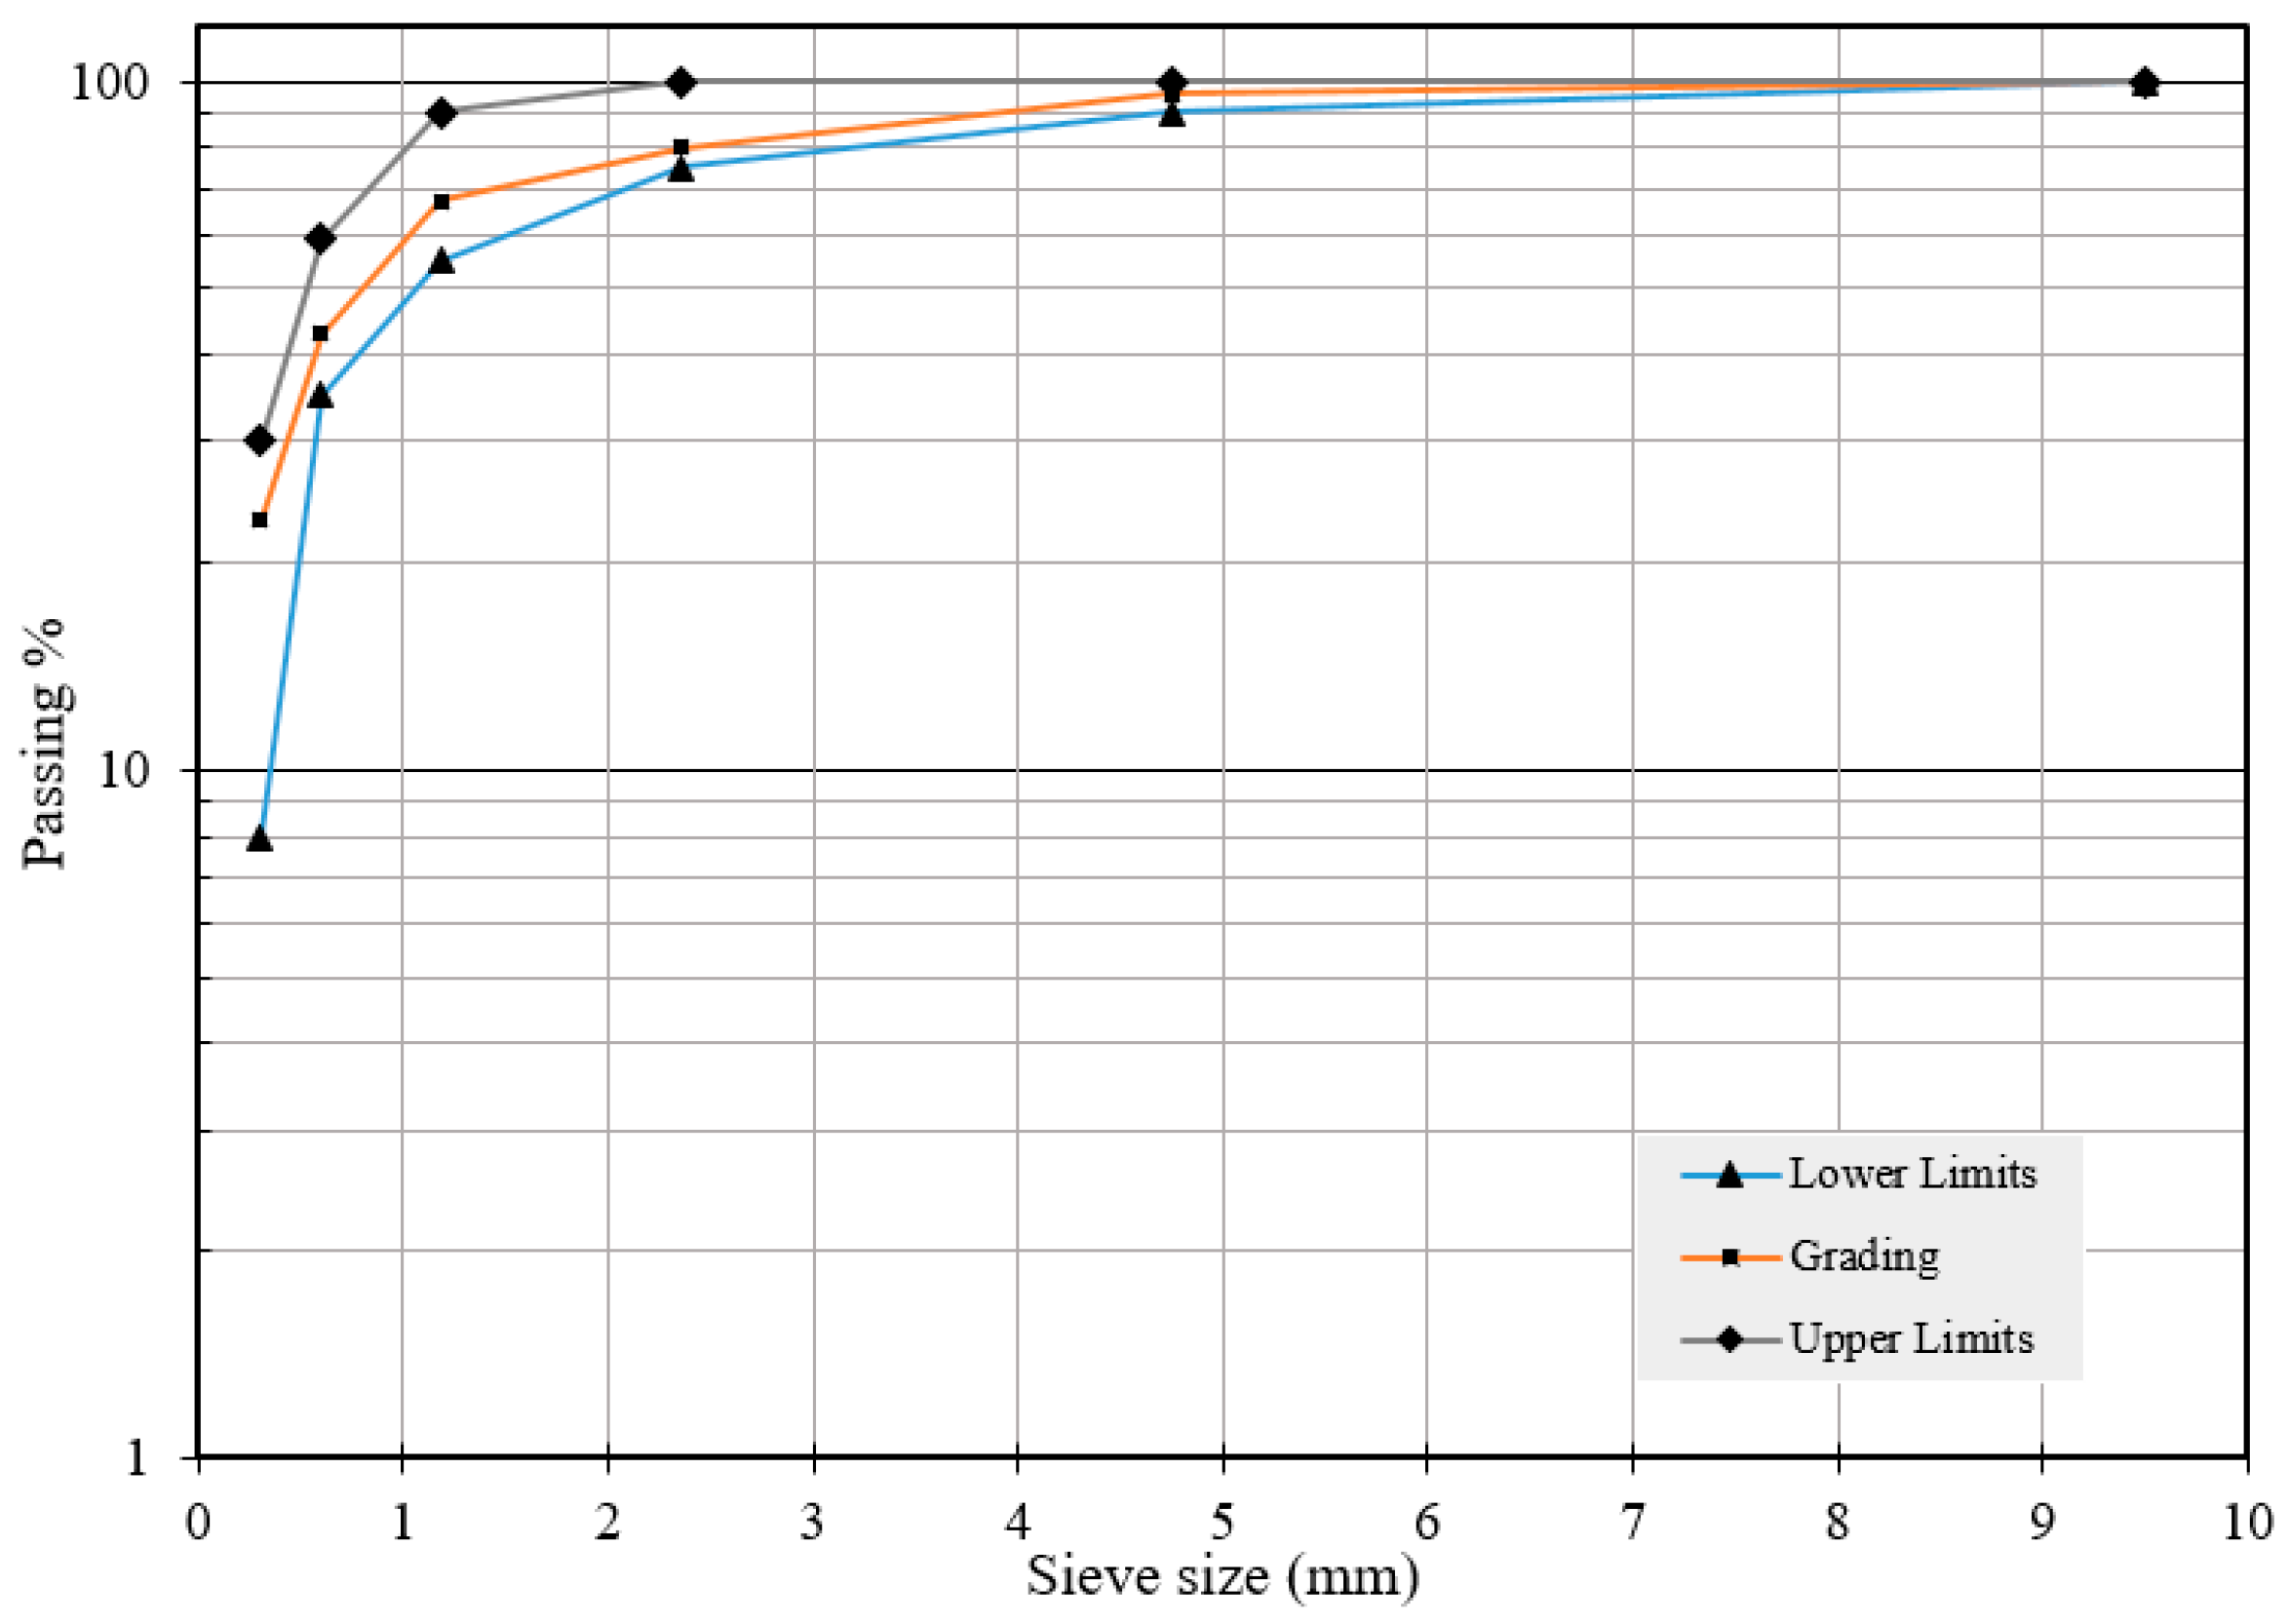
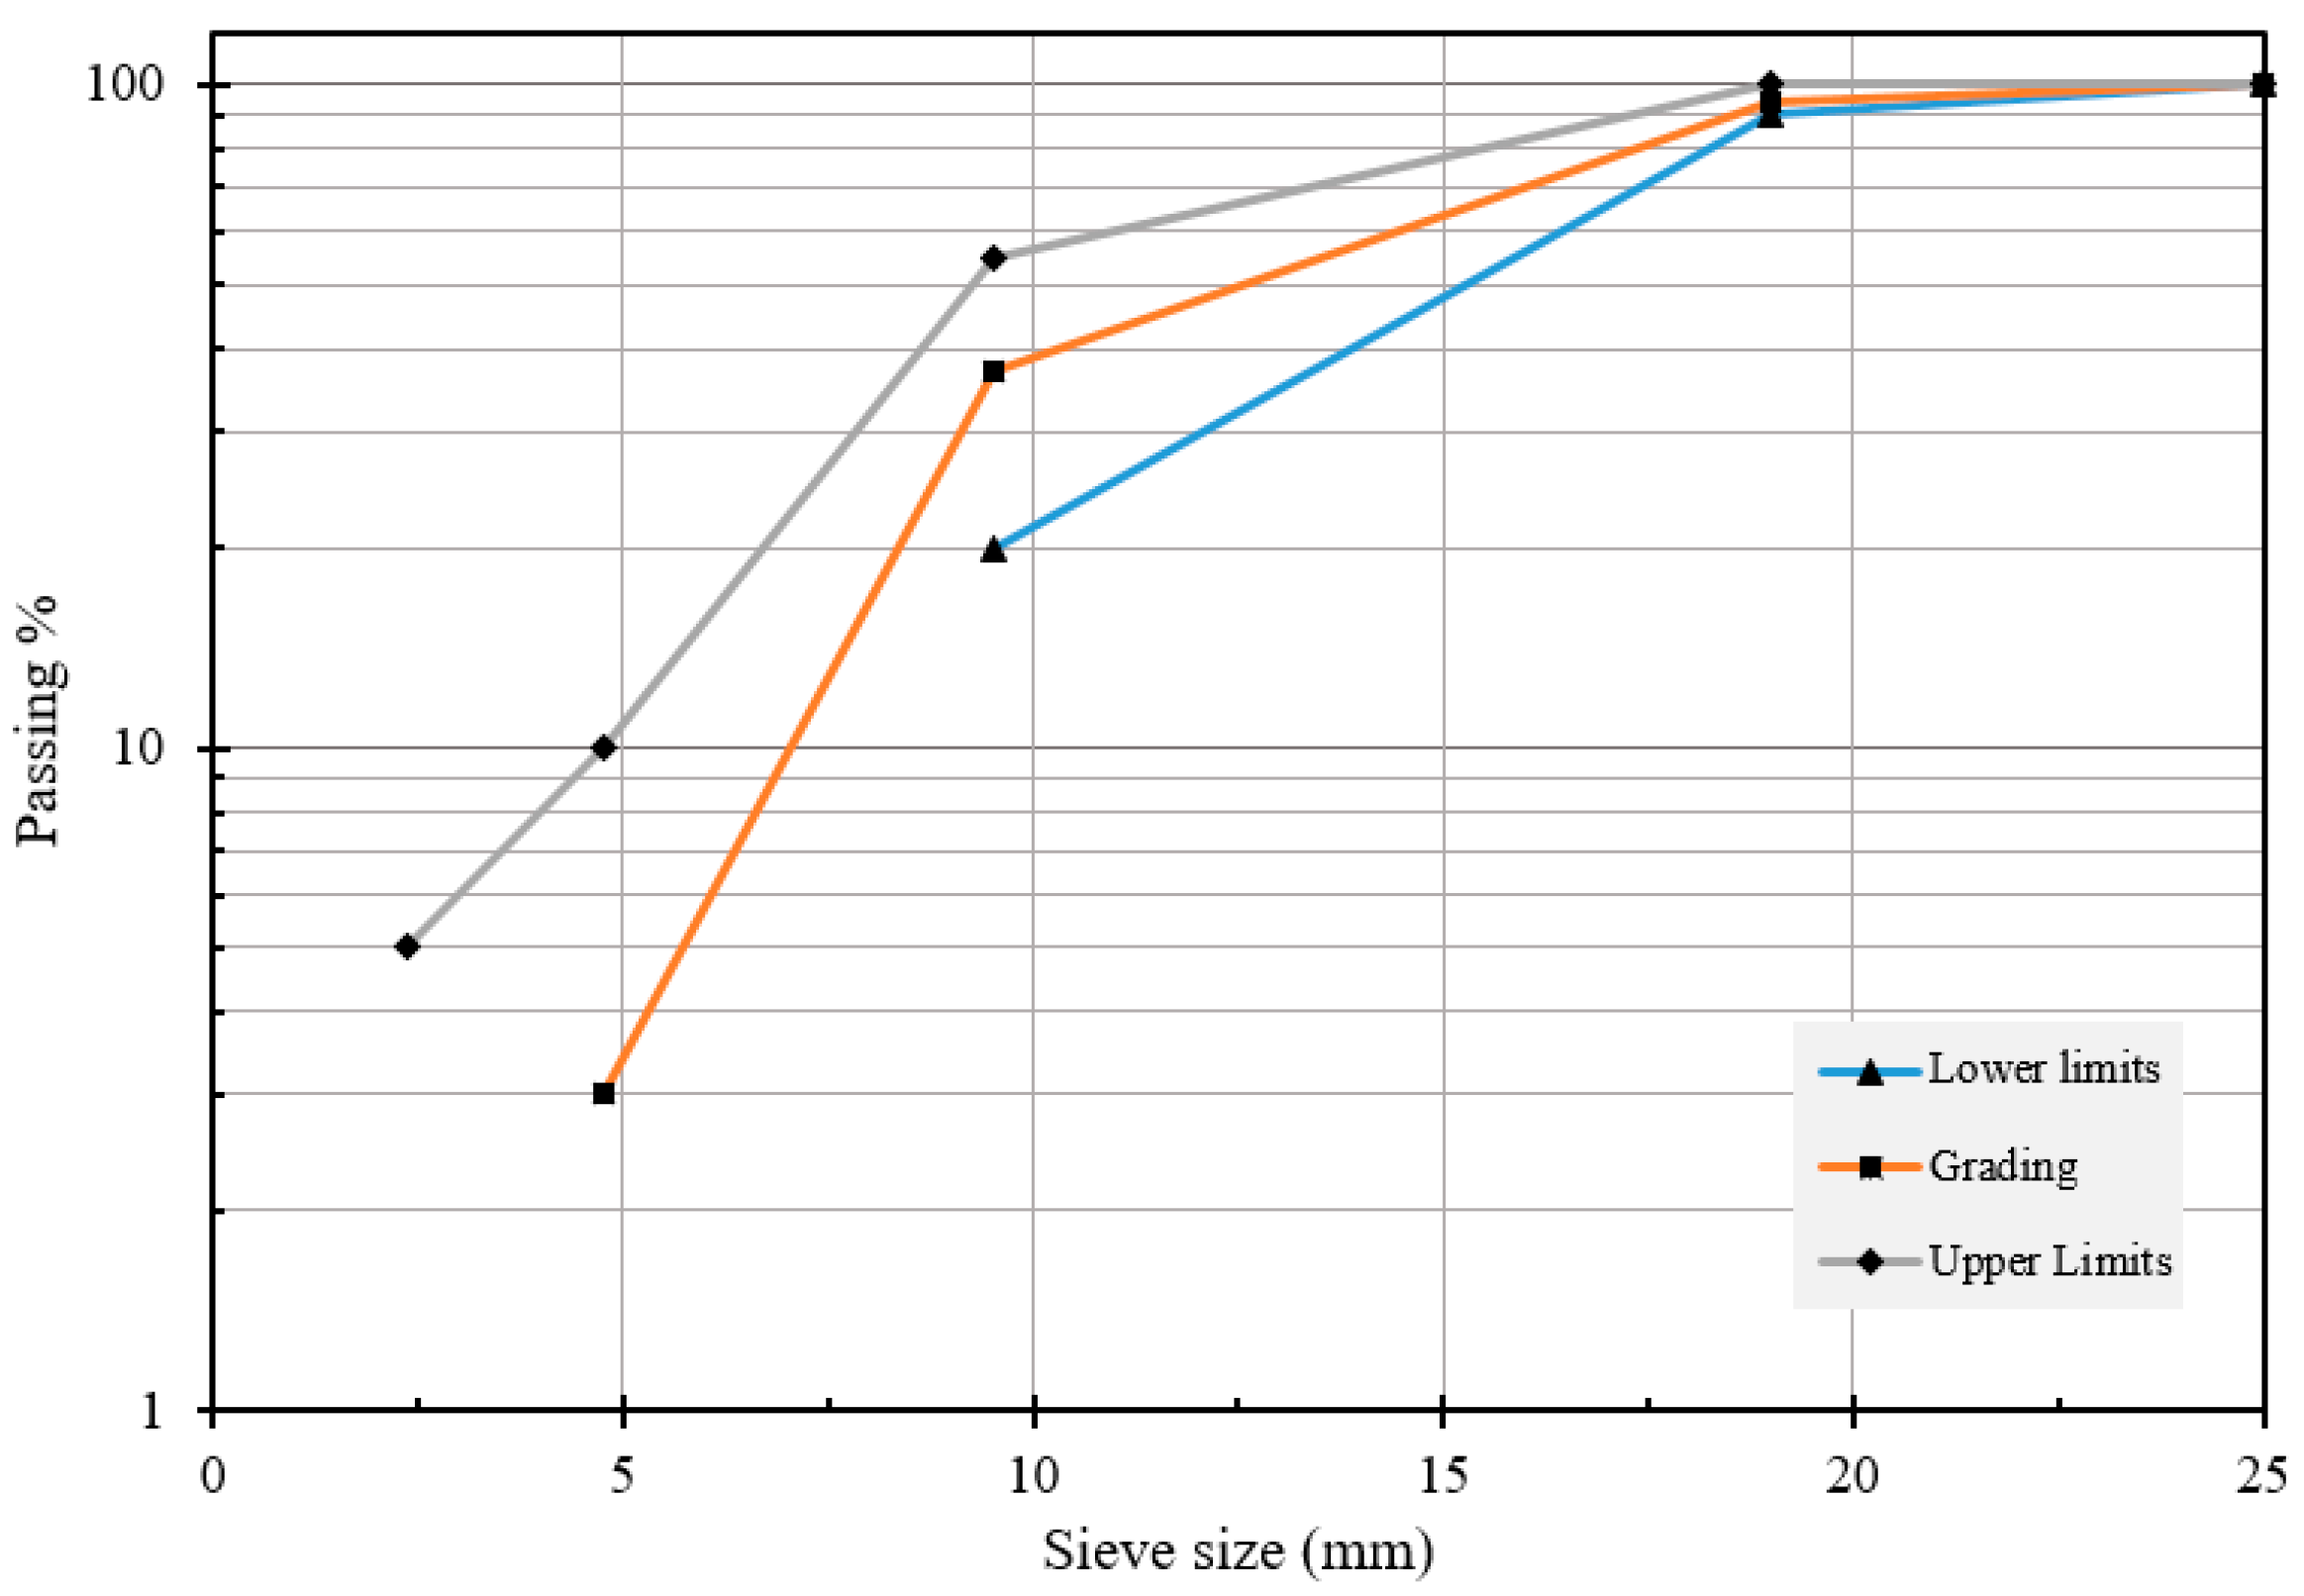
2.1. Concrete Mixture

In the current investigation, the used cement in the concrete mixture, OPC (type I), is made in Iraq, named Mabroka. Cement physical and chemical characteristics are shown in Table 1 and Table 2, respectively. The other components are sand, gravel, and tap water.
According to Iraq specifications No. 45/1984 [17], local natural sand lies within zone 2, and were used as shown in Figure 1, which represents the sand grading after the sieve analysis.
On the other hand, the properties of the natural gravel meet with the (ASTM C33/86) requirements [18], as shown in Figure 2.
The characteristics of mixture are cement = 370 kg/m3, sand = 740 kg/m3, gravel = 1100 kg/m3, water = 181.3 kg/m3, and W/C (%) = 0.49. The used aggregate was dried in the oven, while the absorption tolerance was taken for sand as 0.85% and for gravel as 2.3%. Superplasticizer (F-180 G visco-Crete) was supplied to the mix, as stated by ASTM C494 [19], at a proportion of 0.6% of the whole cement weight.
The used drum mixer had a capacity of 0.1 m3. First, the gravel was placed, then sand, before the cement. Before adding water, the substances were mixed dry for 1 min. The process of mixing carried on for 4 min, then the fibers were added into the mixture. To ensure that the fibers were dispersal properly, the mixing continued for a further 2 min. Finally, the concrete was set in the molds.

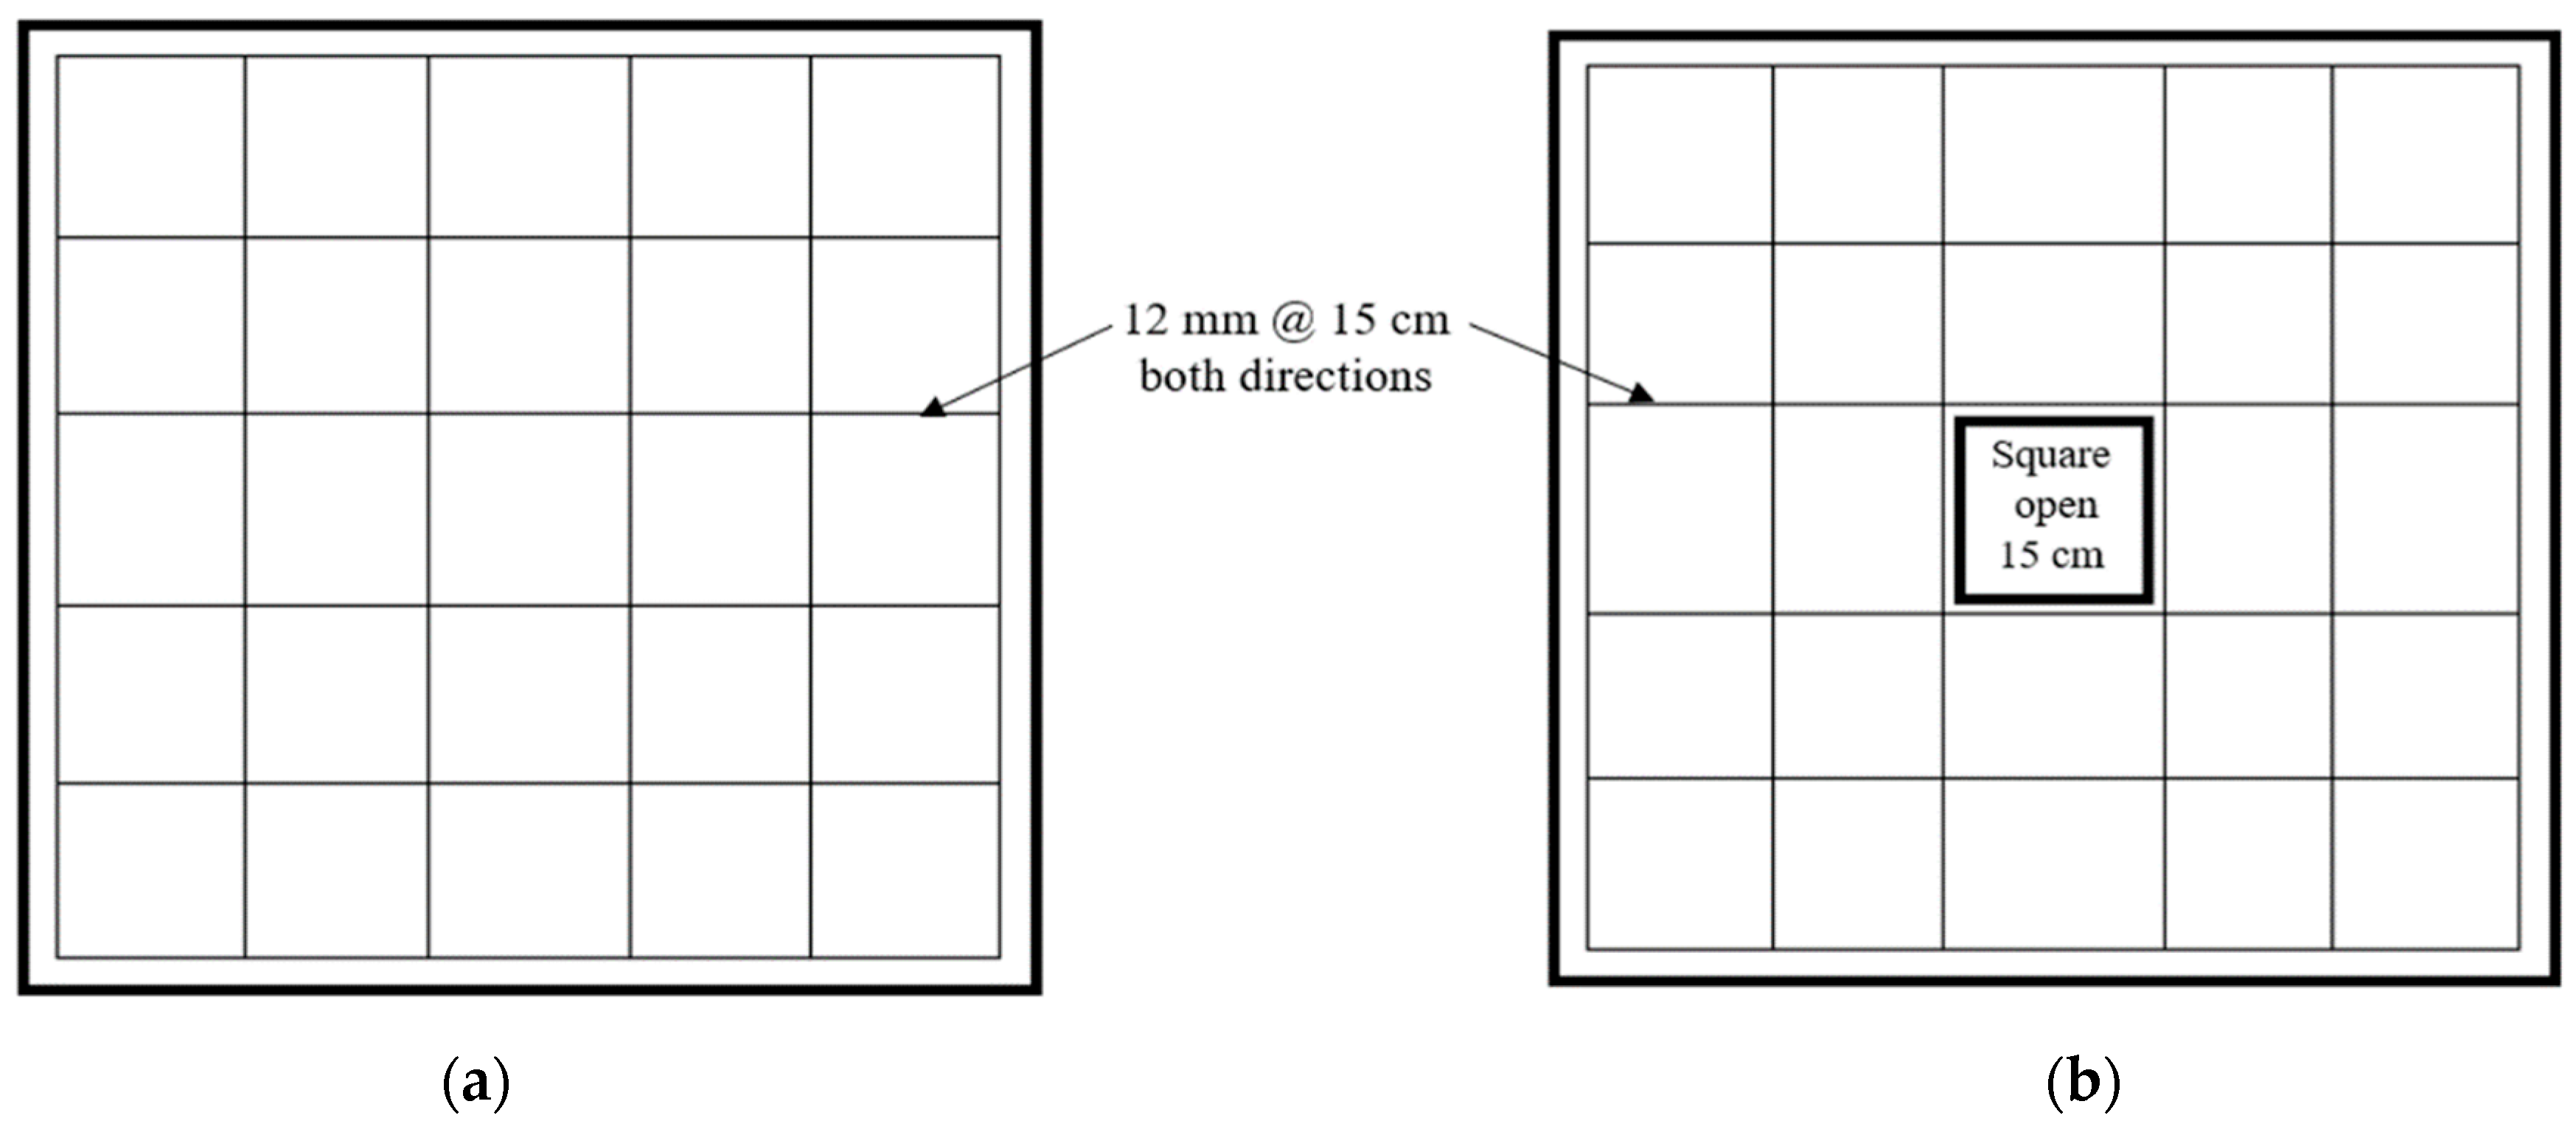
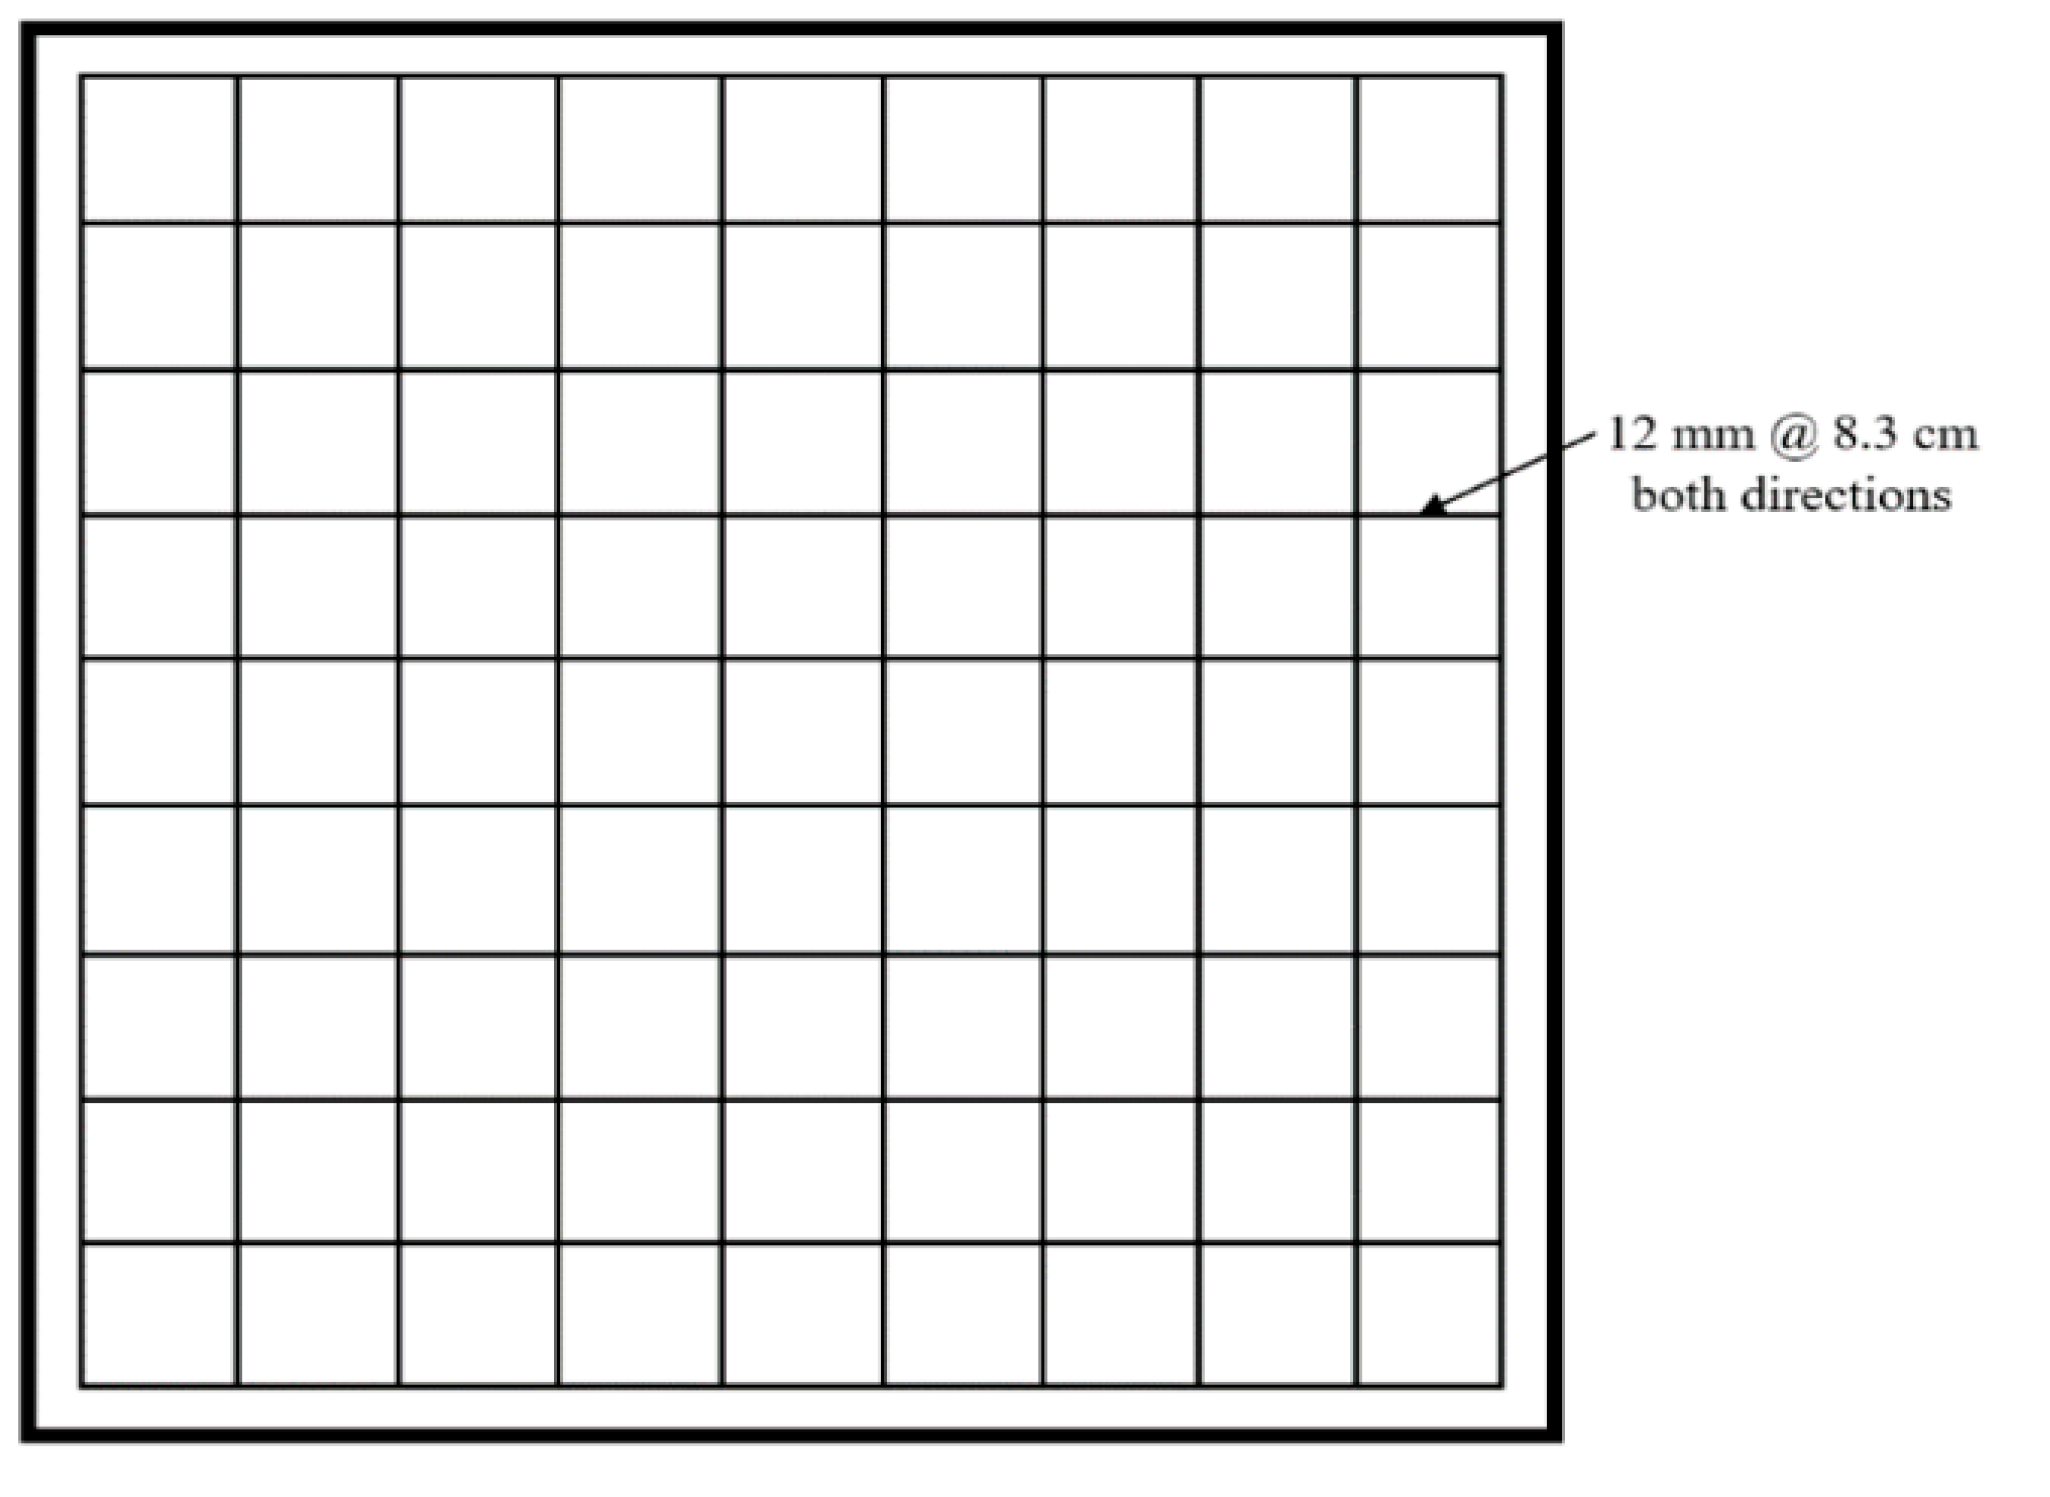
2.2. Steel Reinforcement

Deformed rebar of 12 mm diameter was utilized as a flexural reinforcement for the whole slabs, with two ratios of rebar reinforcement applied. Throughout the testing of several rebar’s samples, the determined average yield strength was 430 N/mm2. The testing was held accordance with the requirements of ASTM A615 G 60 [20], see Table 3.

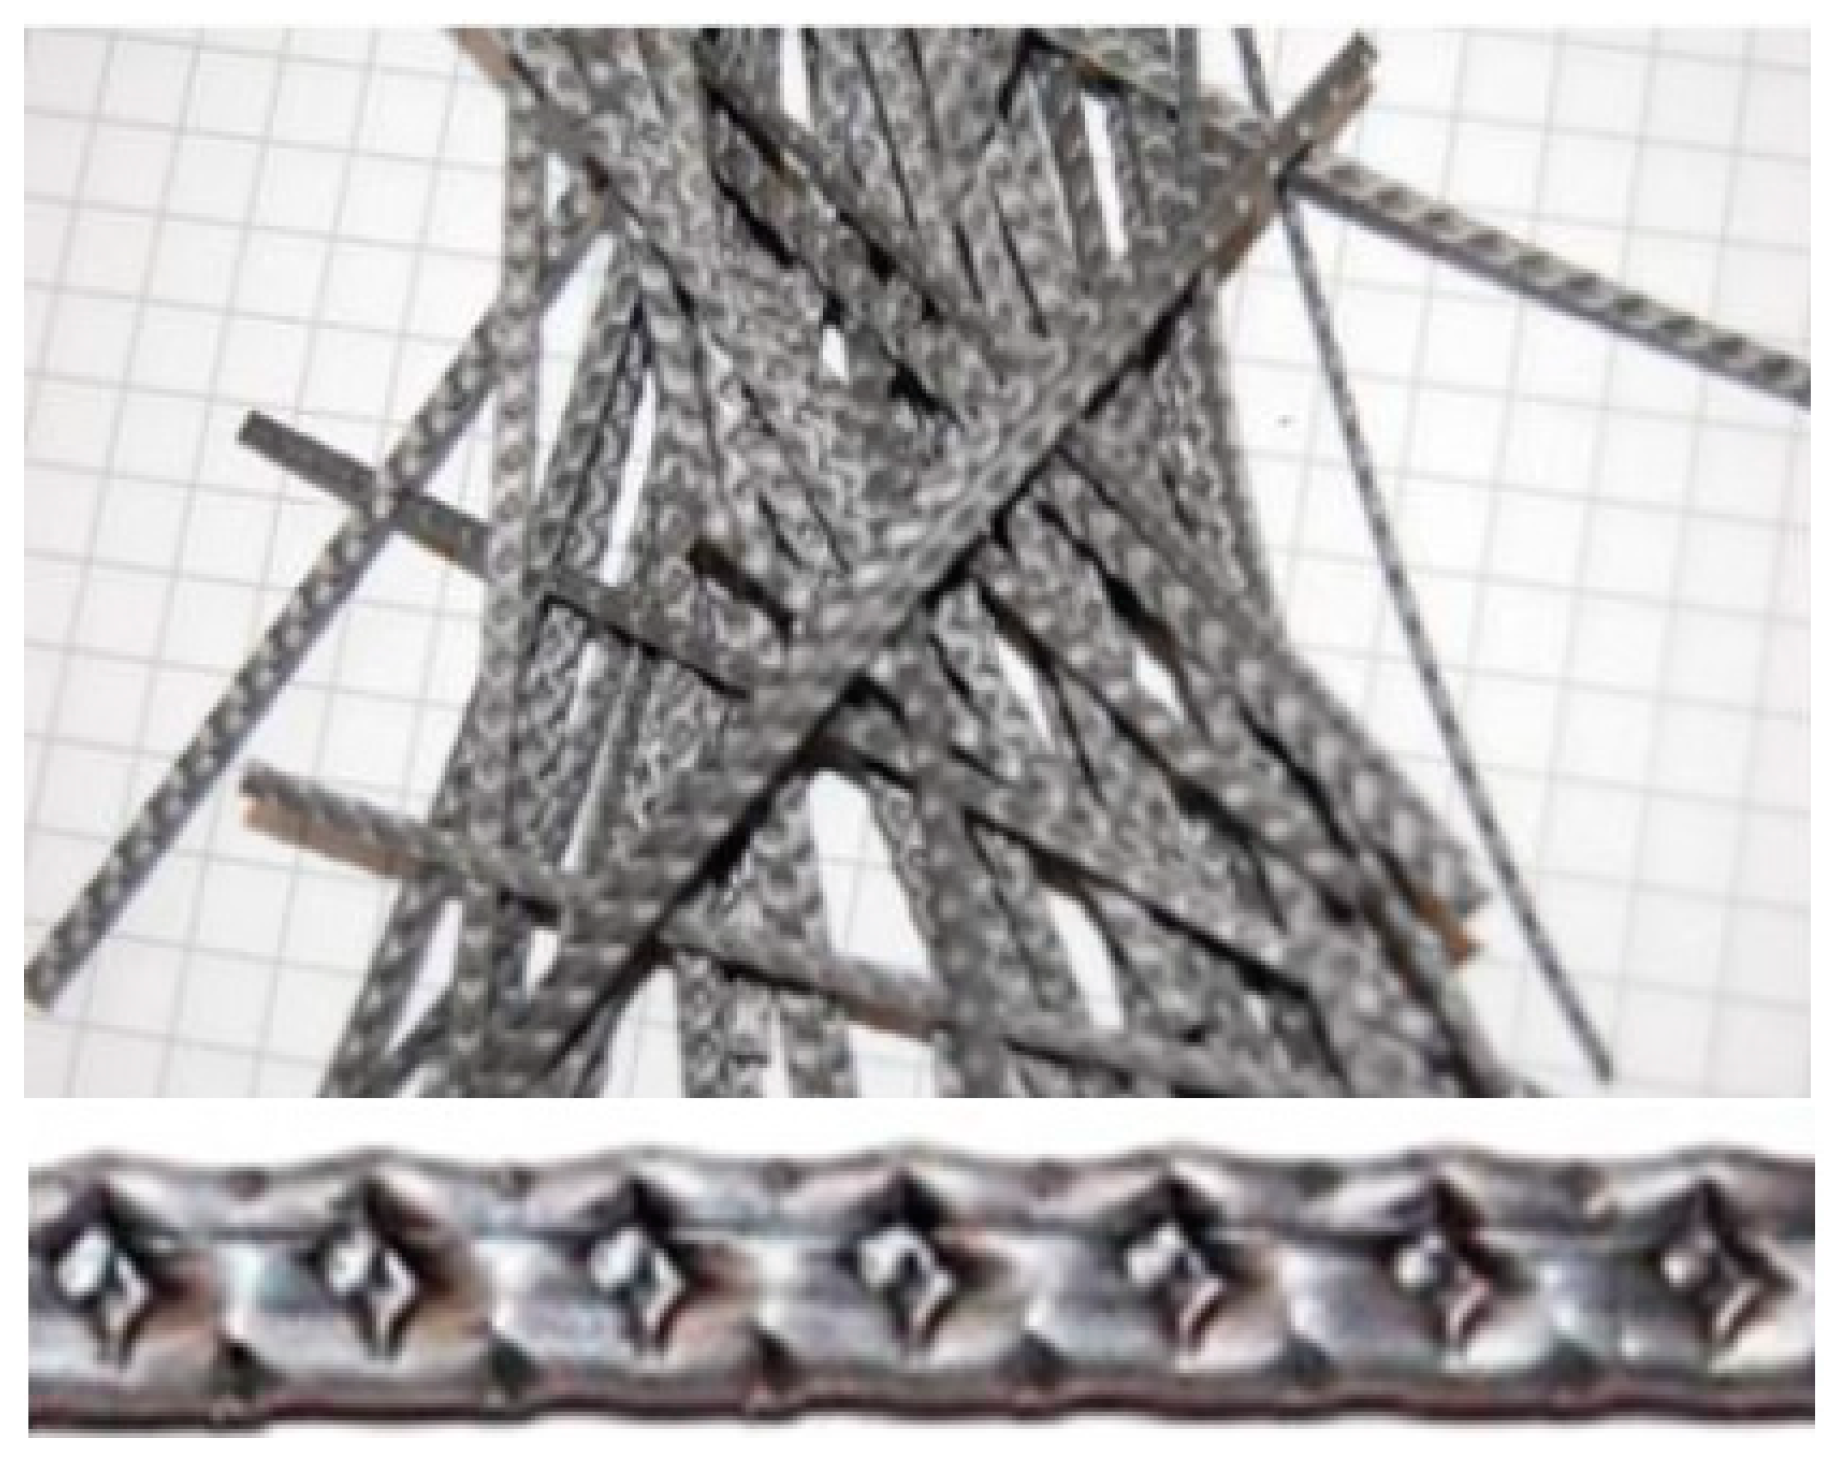
2.3. Polyolefin Fibers

Rough surface straight polyolefin fiber was utilized in this study, with four ratios of 0, 0.5, 1, and 1.5% of the slab concrete volume. The main characteristics of the polyolefin fiber, gained from the data sheet of the SikaFiber® Force-60 product, are listed in Table 4, see Figure 3.

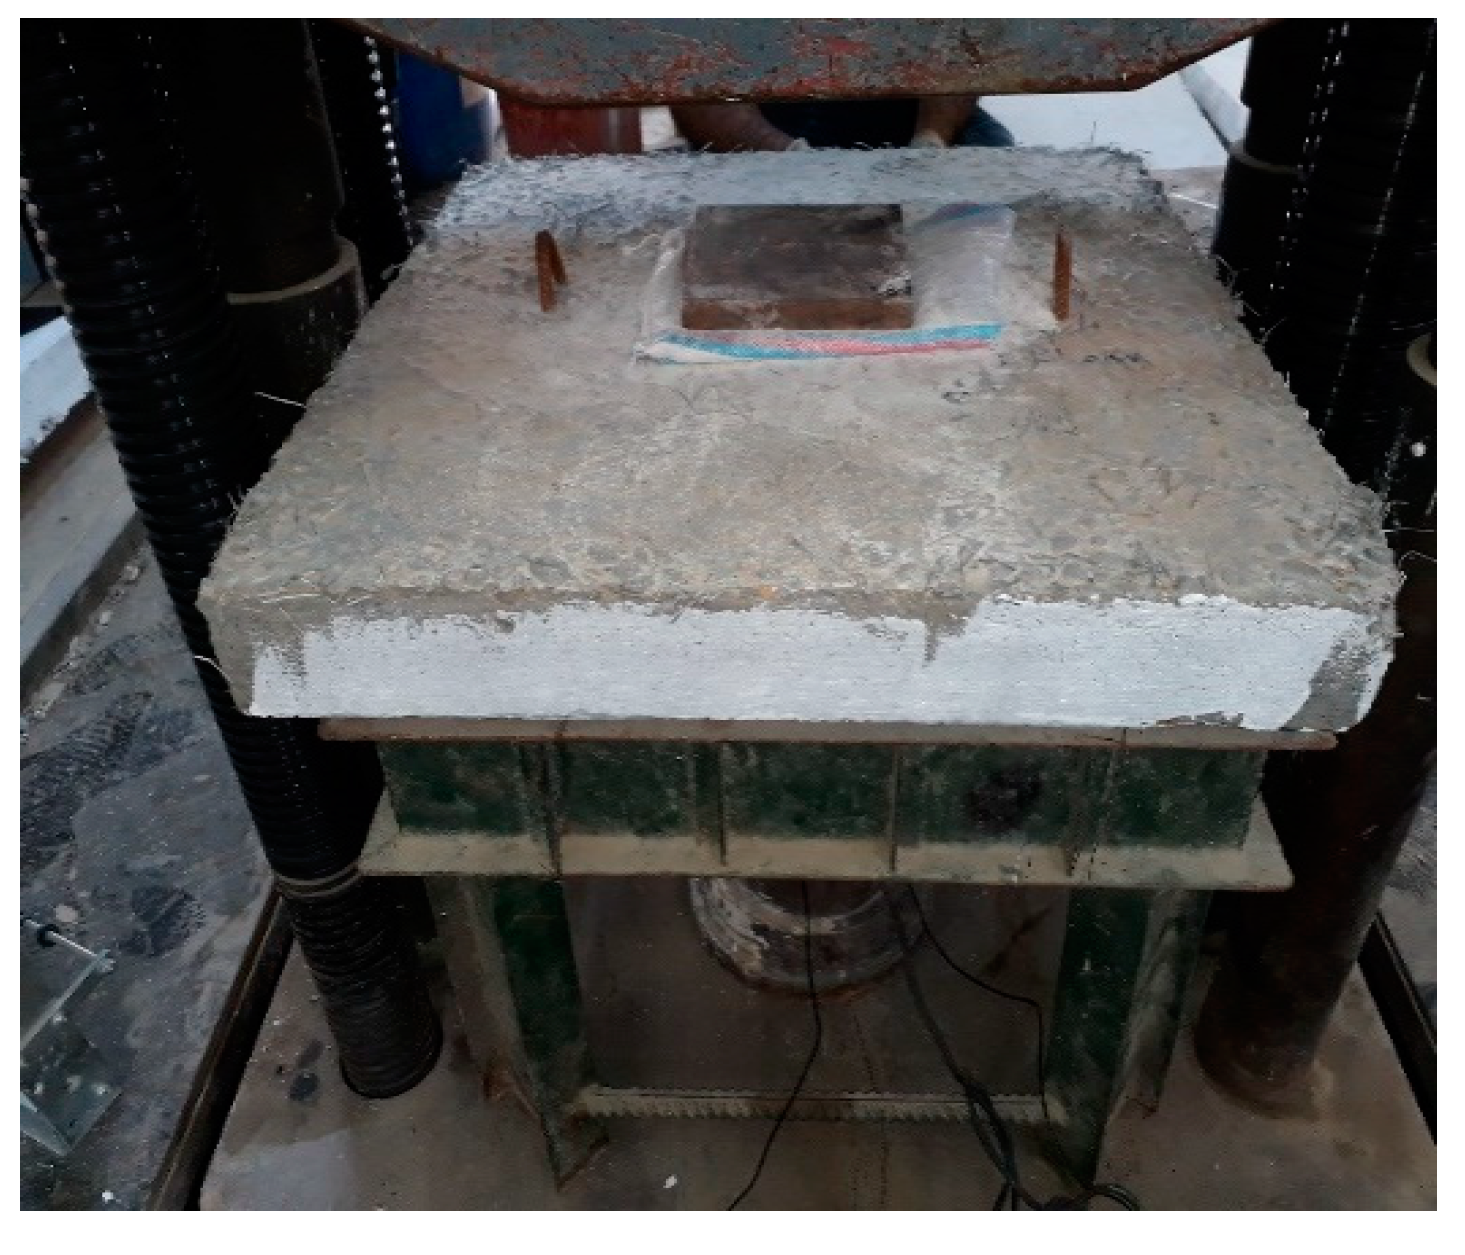
3. Preparing of Specimens

The whole specimens of the studied flat slabs were taken with dimensions of 80 cm length × 80 cm width × 10 cm thickness to suit the machine used in the test. Each specimen was placed on a metal structure with a supporting span of 70 cm. The load was applied at the slab center throughout the baring plate of dimensions (20 cm × 20 cm).
Three sets of specimens were prepared in the recent research. The first group was designed to fail in bending; therefore, slab reinforcement was taken as 6 12 mm @ 15 cm in both directions, see Figure 4a. The second group of slabs had a 15 cm × 15 cm hole at the midpoint of the slab, see Figure 4b, also designed to fail in bending with the same reinforcement and spacing as in group 1. In the third group, punching shear was considered; thus, slab reinforcement was taken as 12 mm @ 8.3 cm (ten bars) in both directions, see Figure 5. Three 15 × 15 × 15 cm cubes, three 30 × 15 cm cylinders, and one 50 × 15 × 15 cm prism beam were prepared for each concrete mixture.
Molds made from wood were used to cast the flat slab specimens. The molds were constructed as a bed with four sides, fixed with screws. Molds were oiled, then slabs were steel reinforced at the lower side of the molds before casting the concrete; meanwhile, the slab samples, were casted and cured. The specimens were painted a white color, a day before the test. Support locations, also the instrument of a digital dial gauge with a sensitivity of 0.01 mm, and load position were marked at the testing date, see Figure 6. During the test, the slab was loaded incrementally using a Universal test machine at the department of civil engineering laboratory, Engineering college, Basrah University.

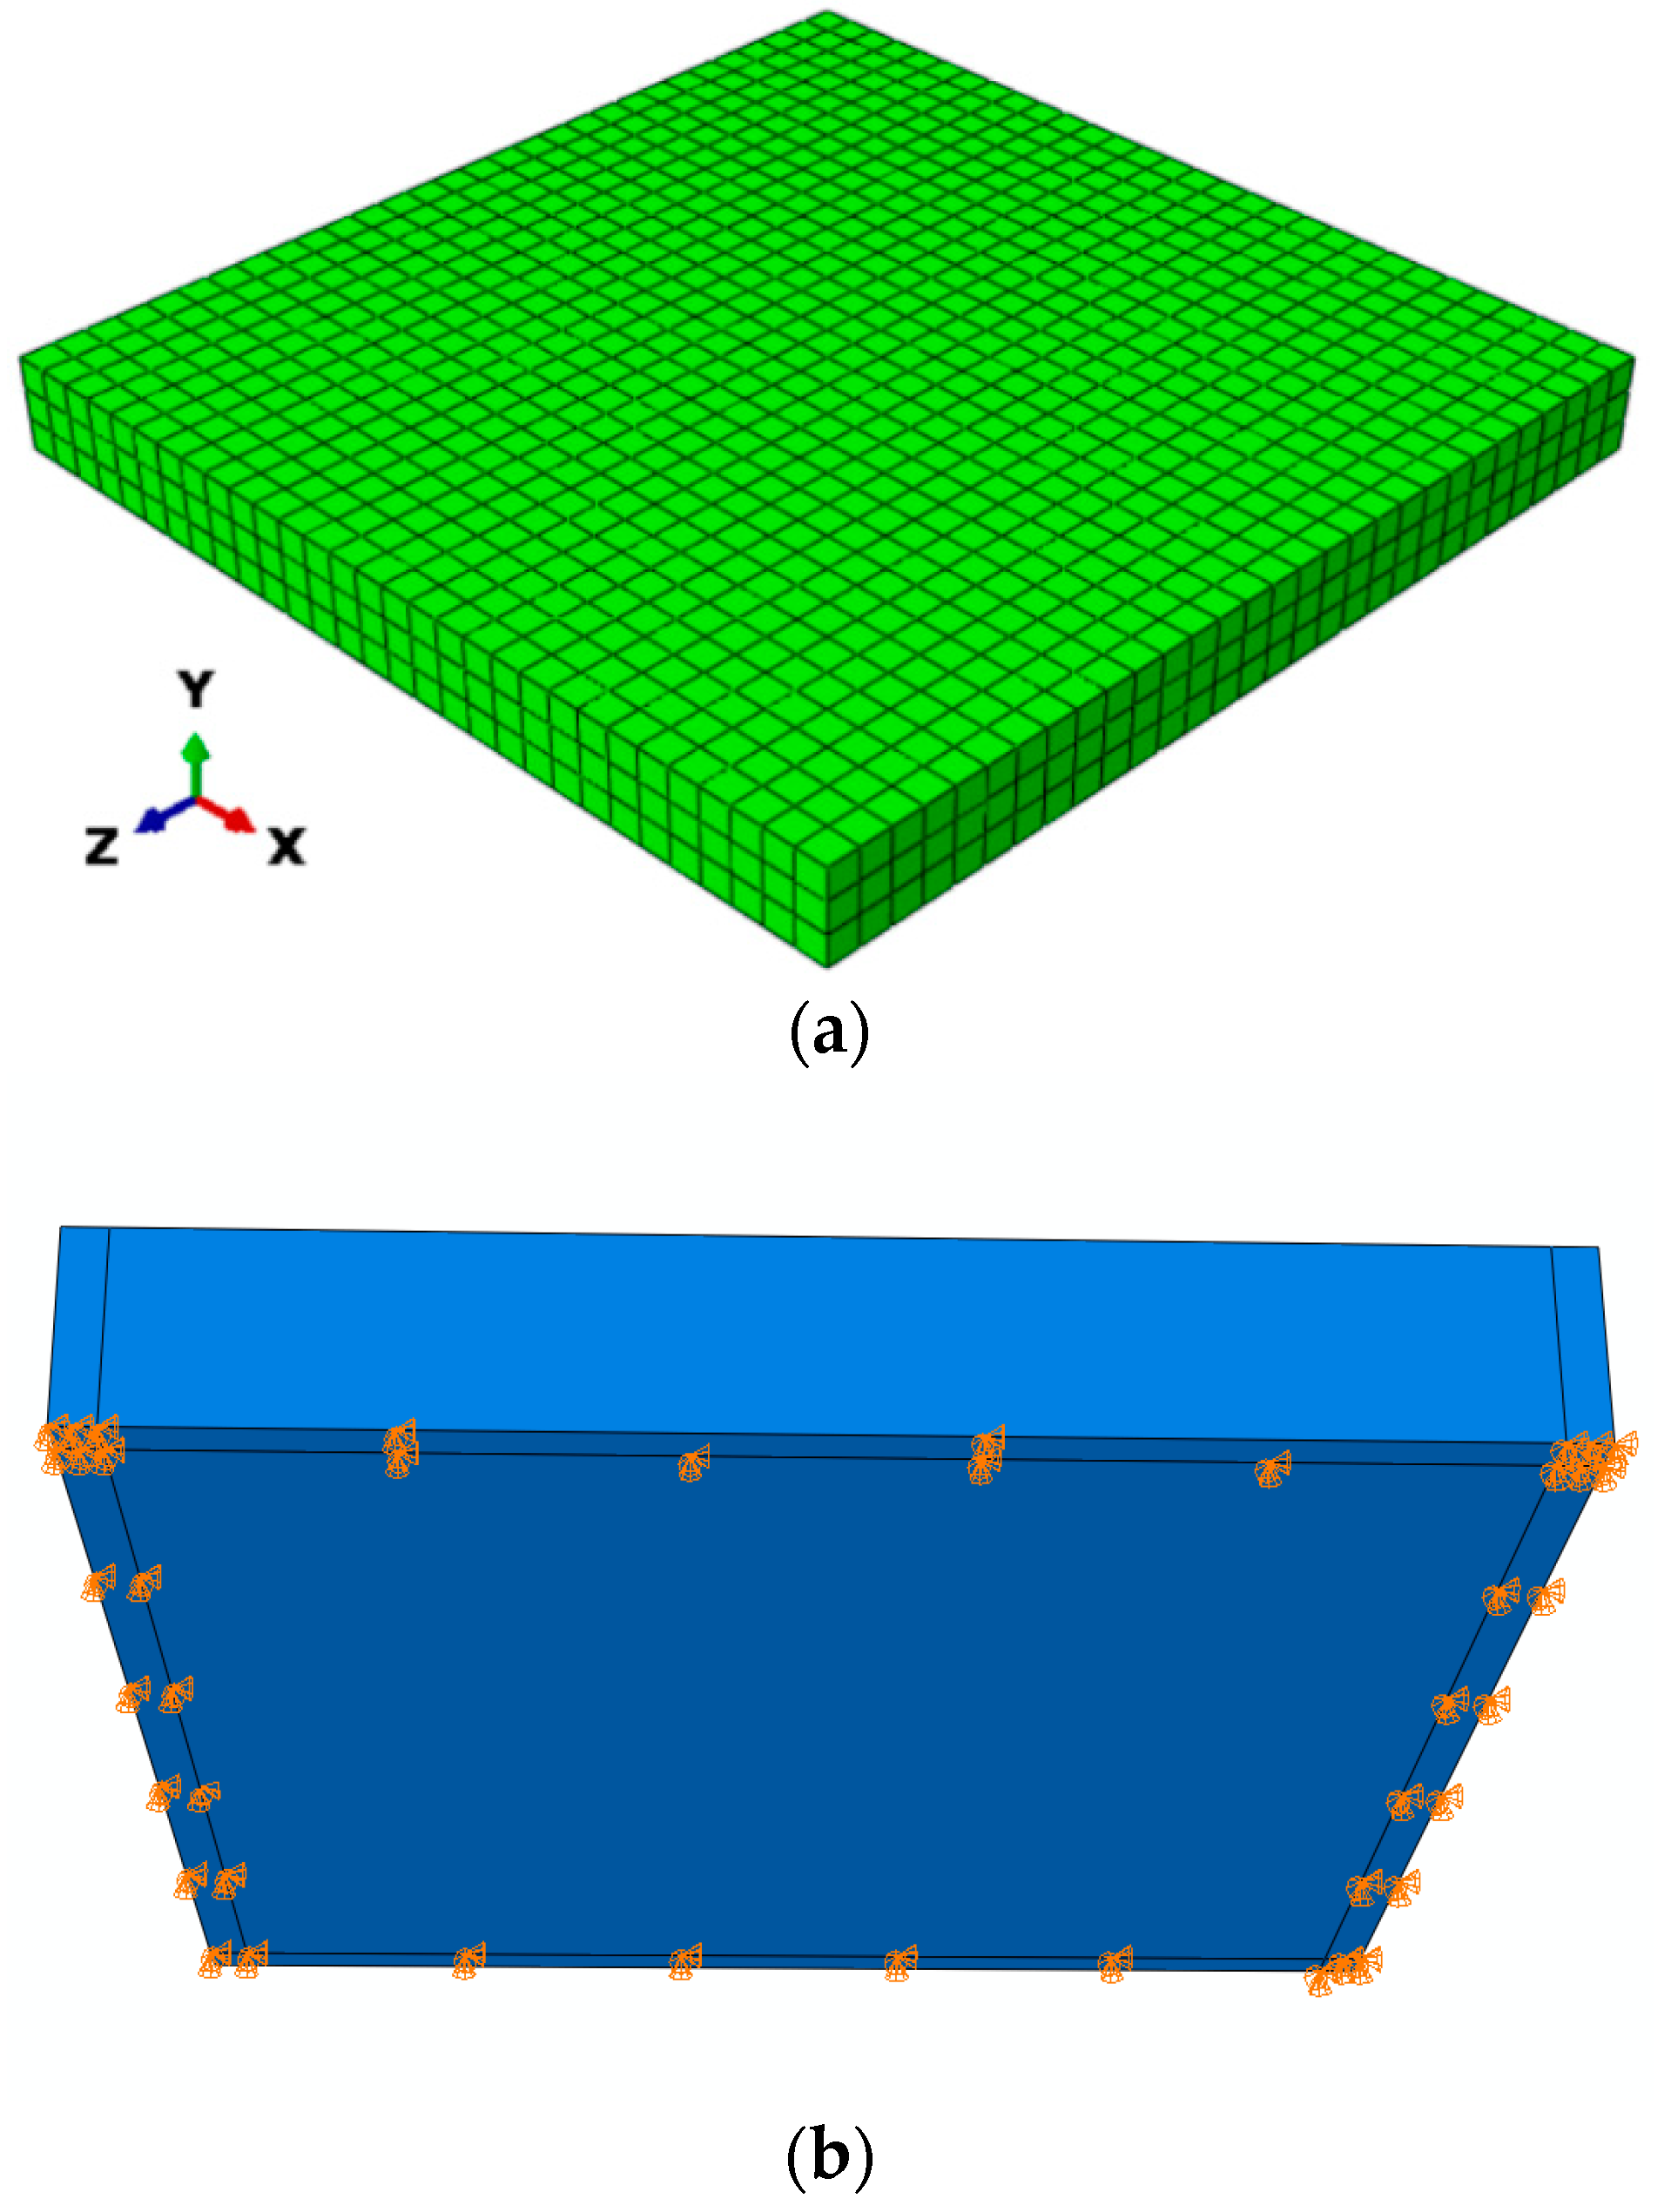
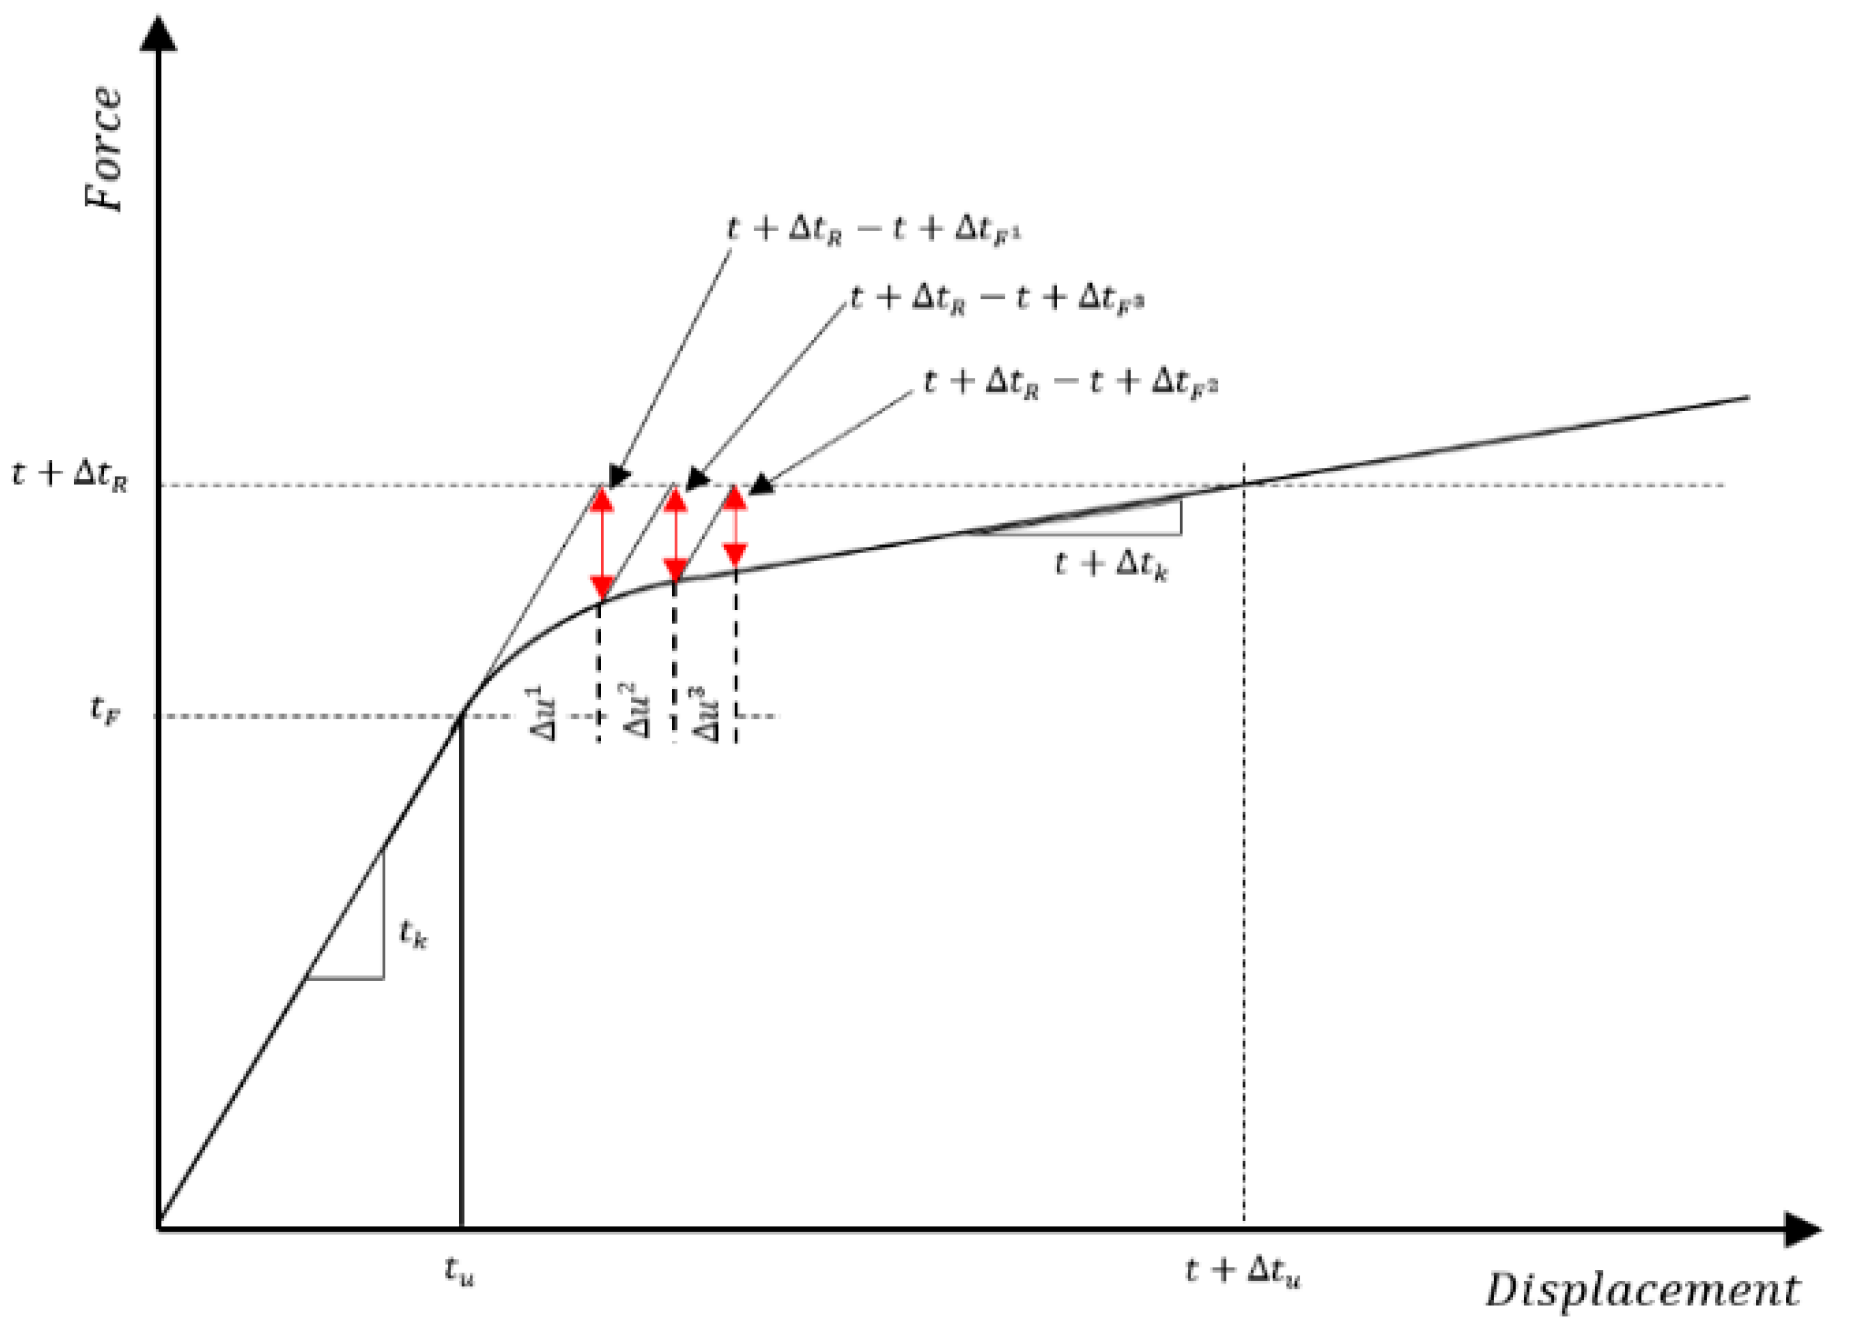
3.1. Non-Linear Analysis

In this section, an ABAQUS simulation program was used to simulate the flat slabs that were tested in the laboratory. The 3D-slab sample was divided into small elements to construct the model mesh. The element C3F8R was used for the concrete, while the element T3D2 truss was used for the slab reinforcements.
The term “concrete damage plasticity” (CDP) was adopted in FEM simulation samples to define the nonlinear behavior of concrete. The default values for the parameters of concrete material for compressive and tensile behavior were considered in this study. The modeling of reinforcing rebars was idealized in stress–strain curves, depending on experimental test results of reinforcement, as in Ref. [21].
This analysis was achieved by utilizing the method of Newton–Raphson with gradual increments. The external load was split up into slight load fractures continuously increased to the actual applied load.

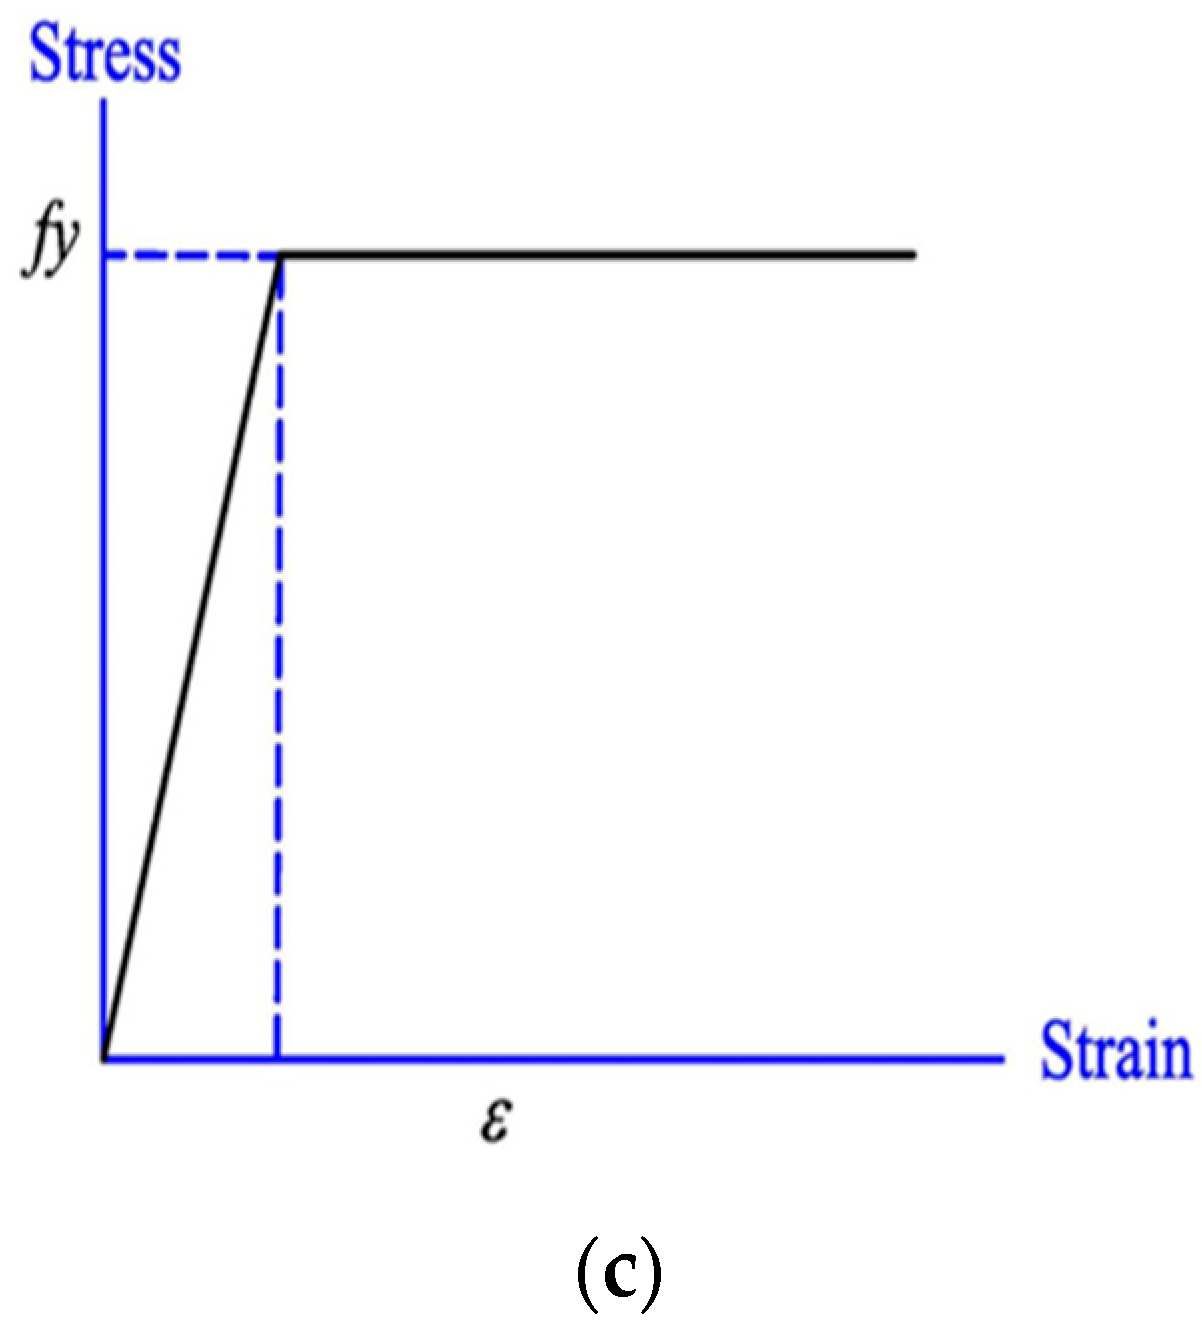
3.2. Constitutive Material Stress—Strain Curve

3.2.1. Concrete

For this study, constitutive curves were used to represent linear (elastic) and nonlinear (plastic) behavior of concrete. This analysis was based on a plasticity-based constitutive model of concrete. In compression, a multilinear stress–strain behavior of concrete was adopted. Concrete stress increased gradually up to the maximum compressive strength, and at the ultimate strain (0.0035), the failure occurred by crushing.
In tension, the stress–strain curve for the concrete was linear and elastic up to the maximum tensile strength. As a result, the concrete started to crack and gradually decreased in strength. Figure 7a,b shows the constitutive curves for concrete in compression and tension.

3.2.2. Steel

In ABAQUS, for the beam and truss elements, uniaxial stress–strain curve model was used. Several idealized stress–strain curves for steel can be used. There are a number of different simplified stress–strain curves depending on the purpose of the analysis. In this study, the elastic perfectly plastic model was used. Figure 7c shows the elastic–plastic stress strain curve of used steel.
The mesh size of concrete element was chosen based on several tries with different sized elements to obtain constant results as a verification of models. Figure 8a,b shows the mesh and boundary condition of solid slab model was used in Abaqus analysis.
For any load increment, the process of iteration makes the value of the residual force extremely slight to fulfil the seeking convergence. The stiffness tangent matrix was computed concurrently. In the last stage, a modern matrix for stiffness was generated depending on the final step [22], as shown in Figure 9.
On the other hand, the plasticity damage pattern covered the effect of moderate reverse pressure and permanent damage, concentrating on the failure mechanism of concrete [23]. The concrete slab (punching shear cone) was demonstrated due to sudden cracks at the ultimate load.
The damage pattern assumed initiating cracks at the essential positive ultimate strain. Material specifications are listed in Table 5.

4. Result Discussion

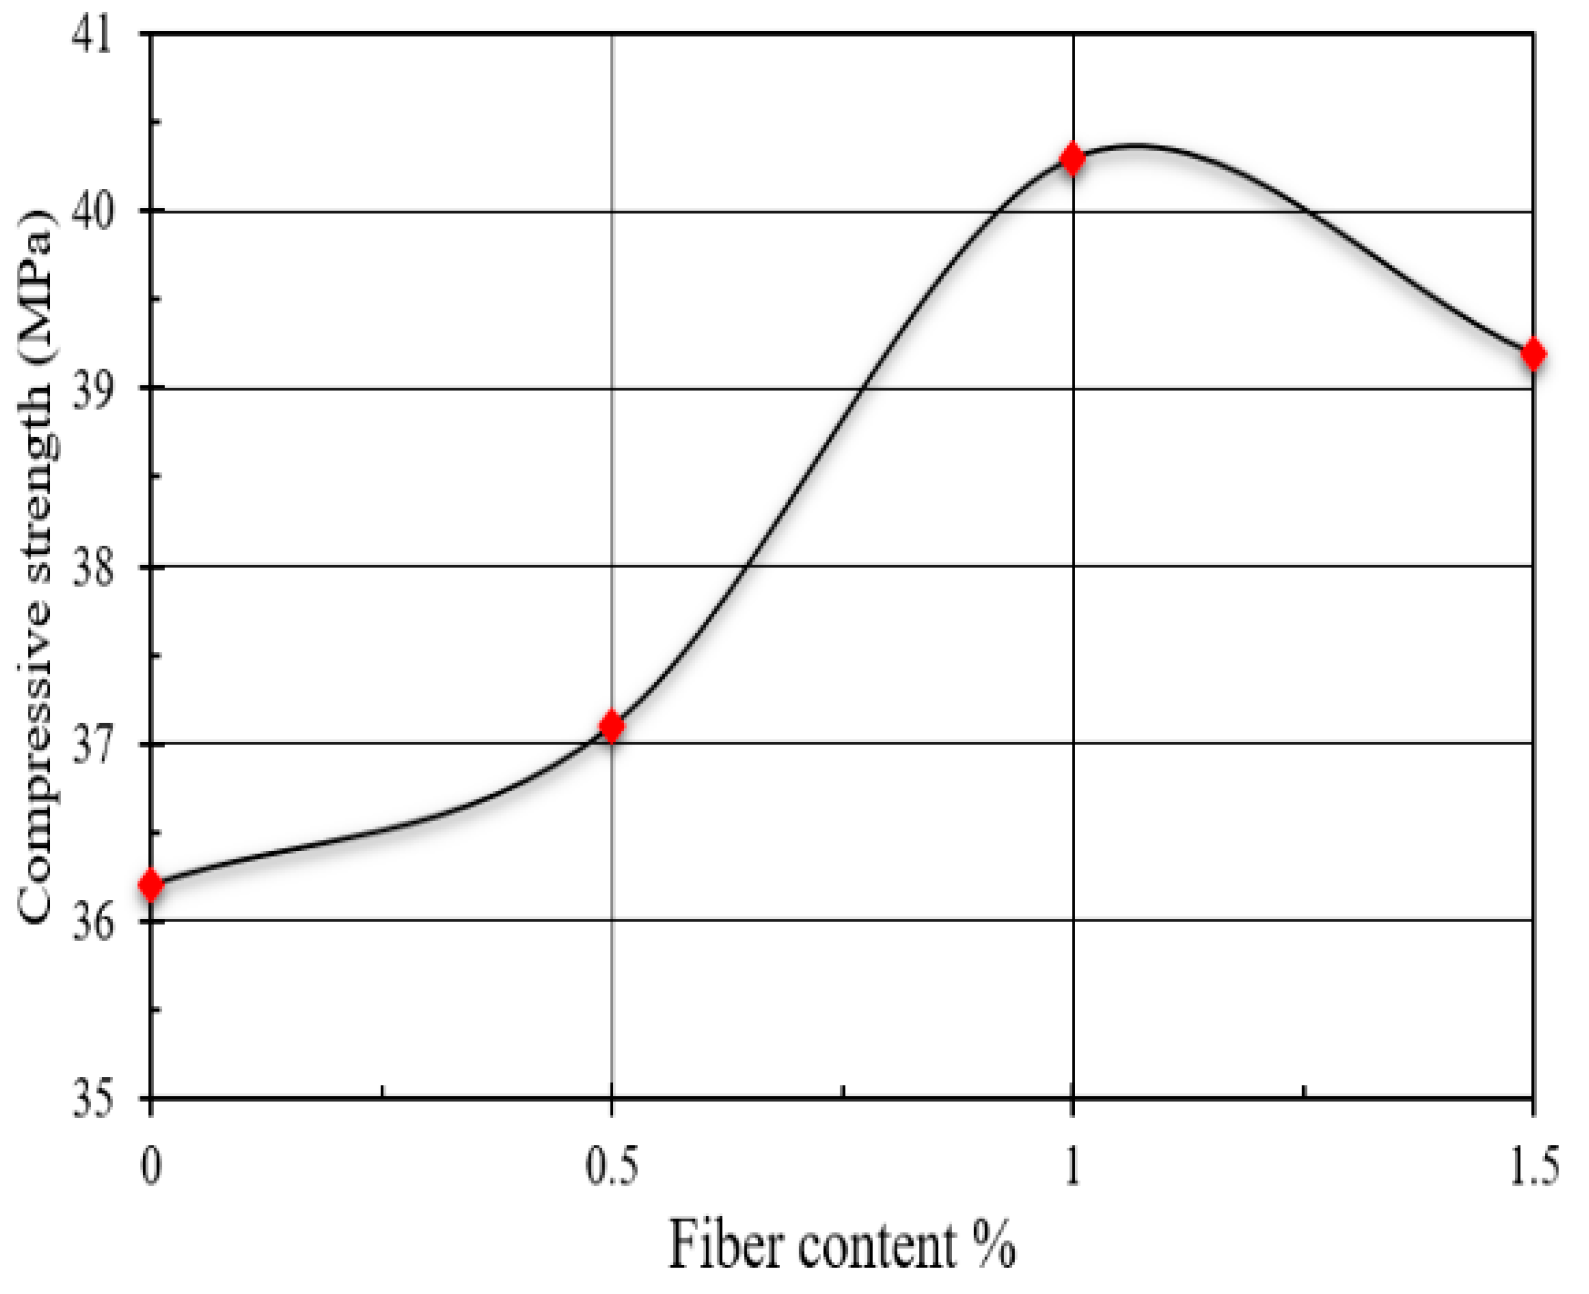
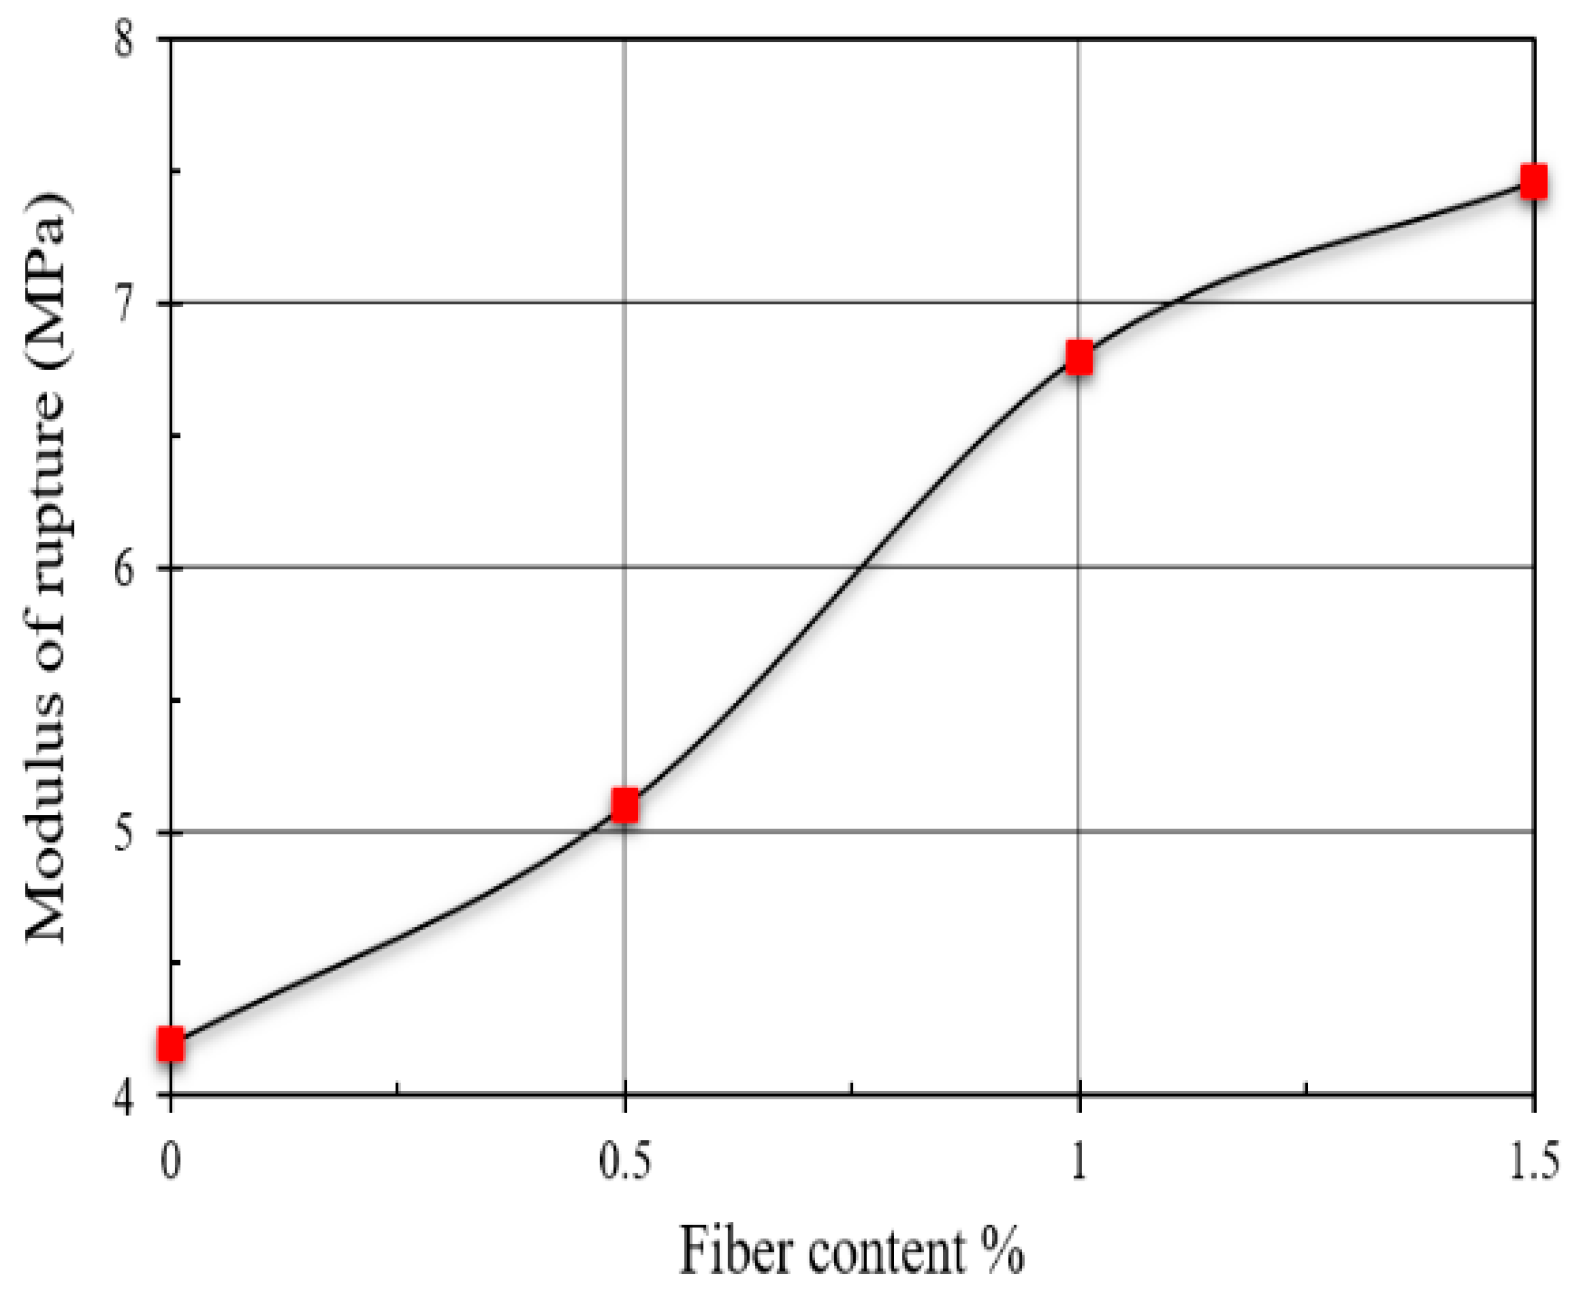
4.1. Concrete Specifications

The influence of polyolefin fiber quantity on the mechanical characteristics was considered through the compressive strength of concrete cubes with dimensions 150 × 150 × 150 mm at 28 days according to the BS EN 12390-3:2009 [24], see Figure 10. The splitting strength (direct tension) was found for a cylinder with dimensions of 150 mm diameter × 300 mm height, as shown in Figure 11, according to ASTM C496/C496M [25]. Finally, the flexural strength of concrete (using a simple beam with third-point loading) with dimensions of 100 × 100 × 300 mm was observed, according to ASTM C78/C78M [26], see Figure 12. Table 6 presented the gained outcomes.

4.2. Load–Deflection Curves

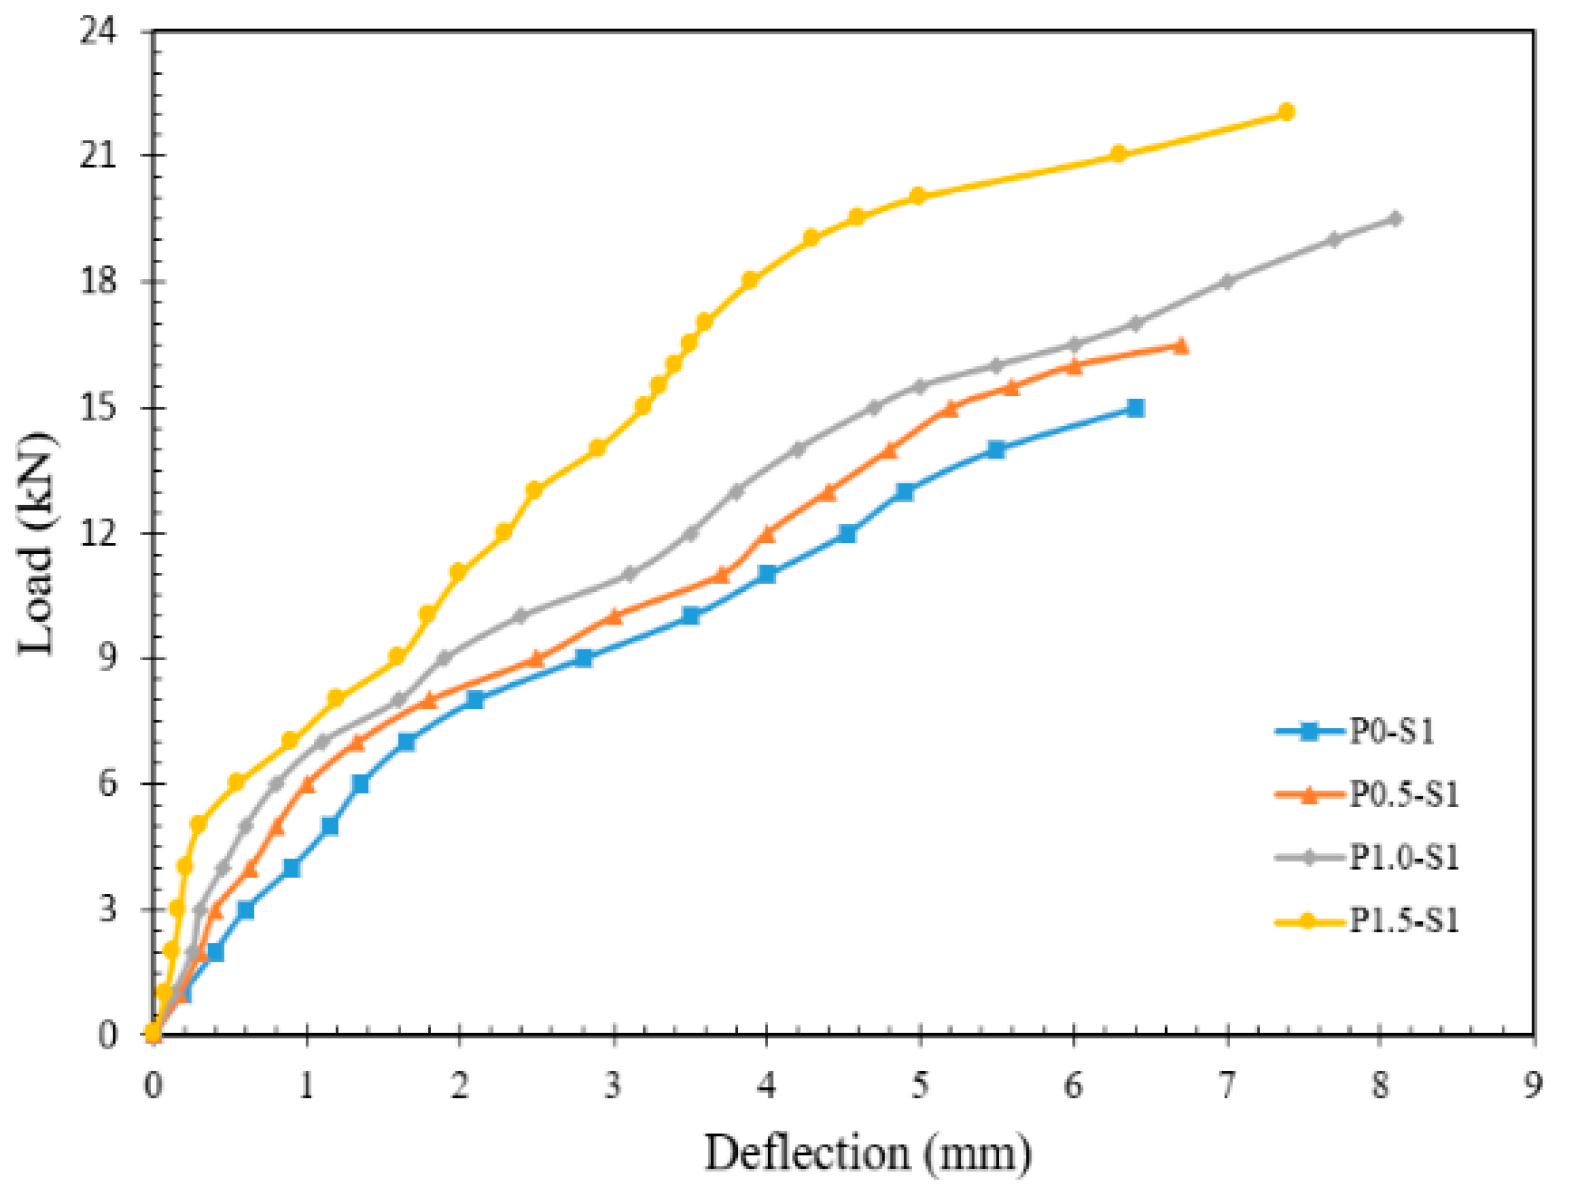
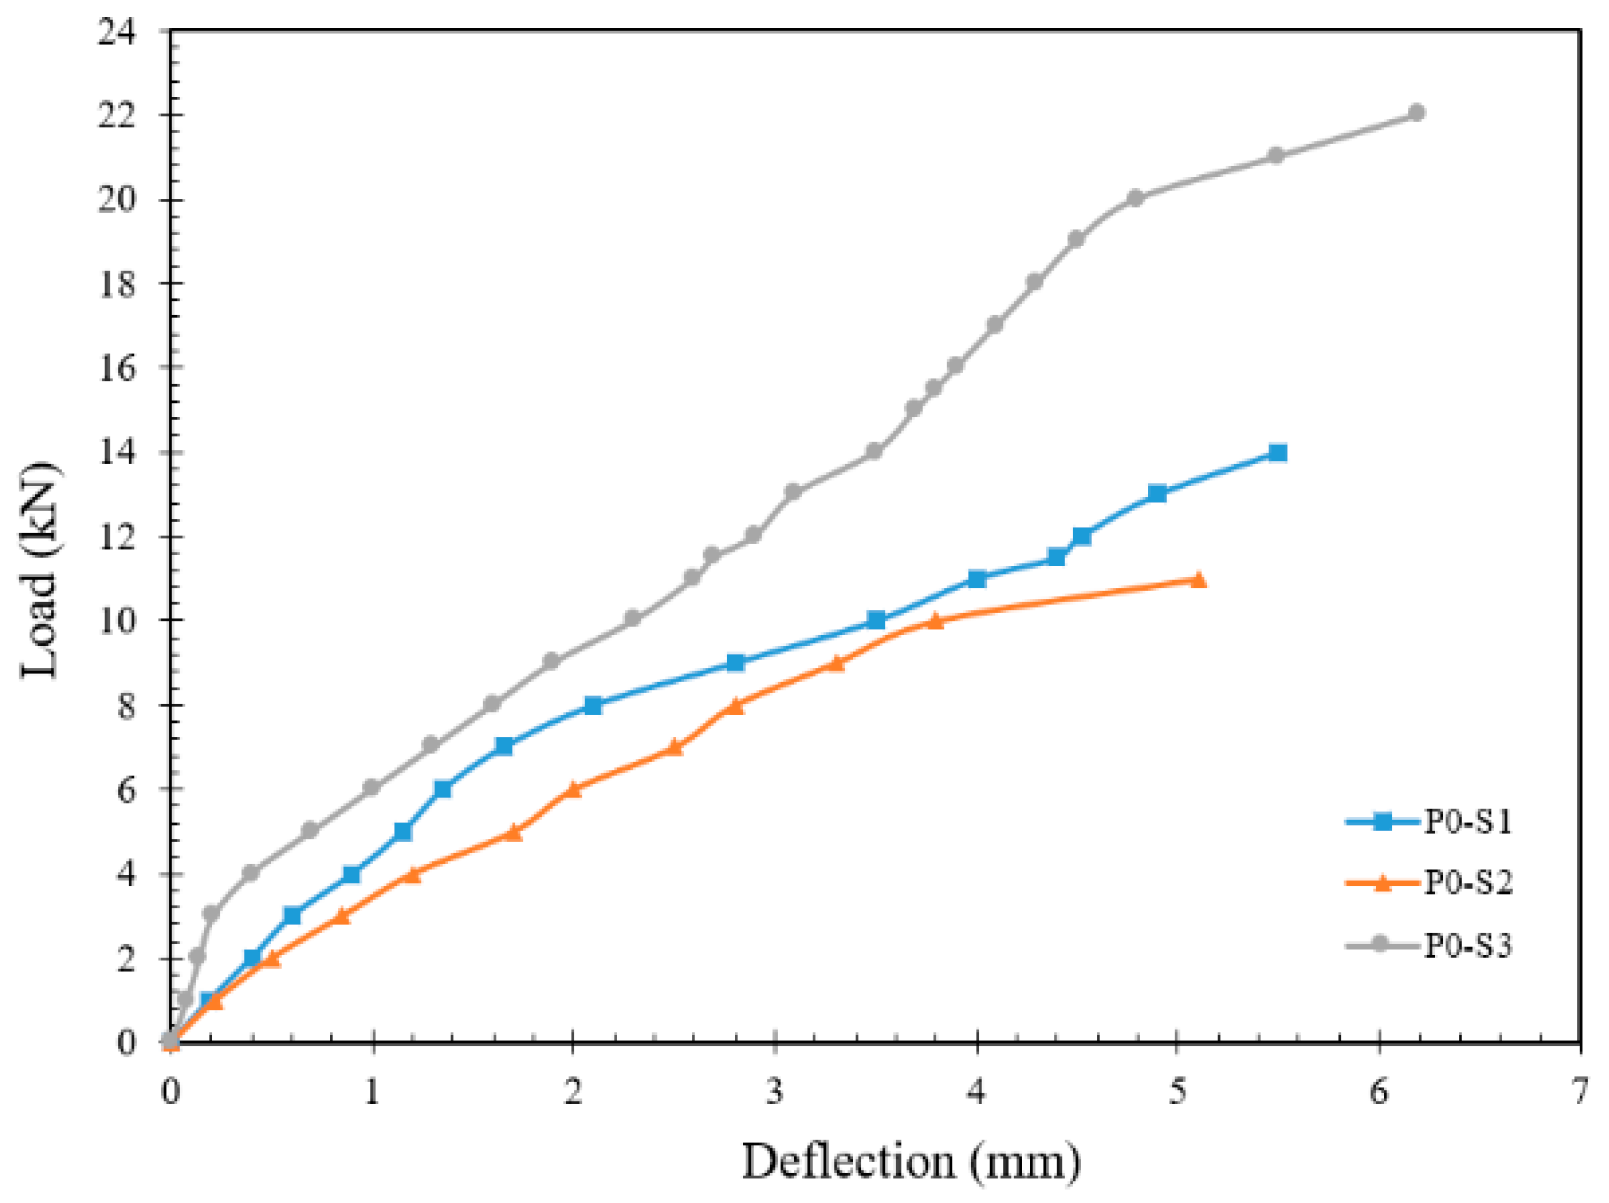
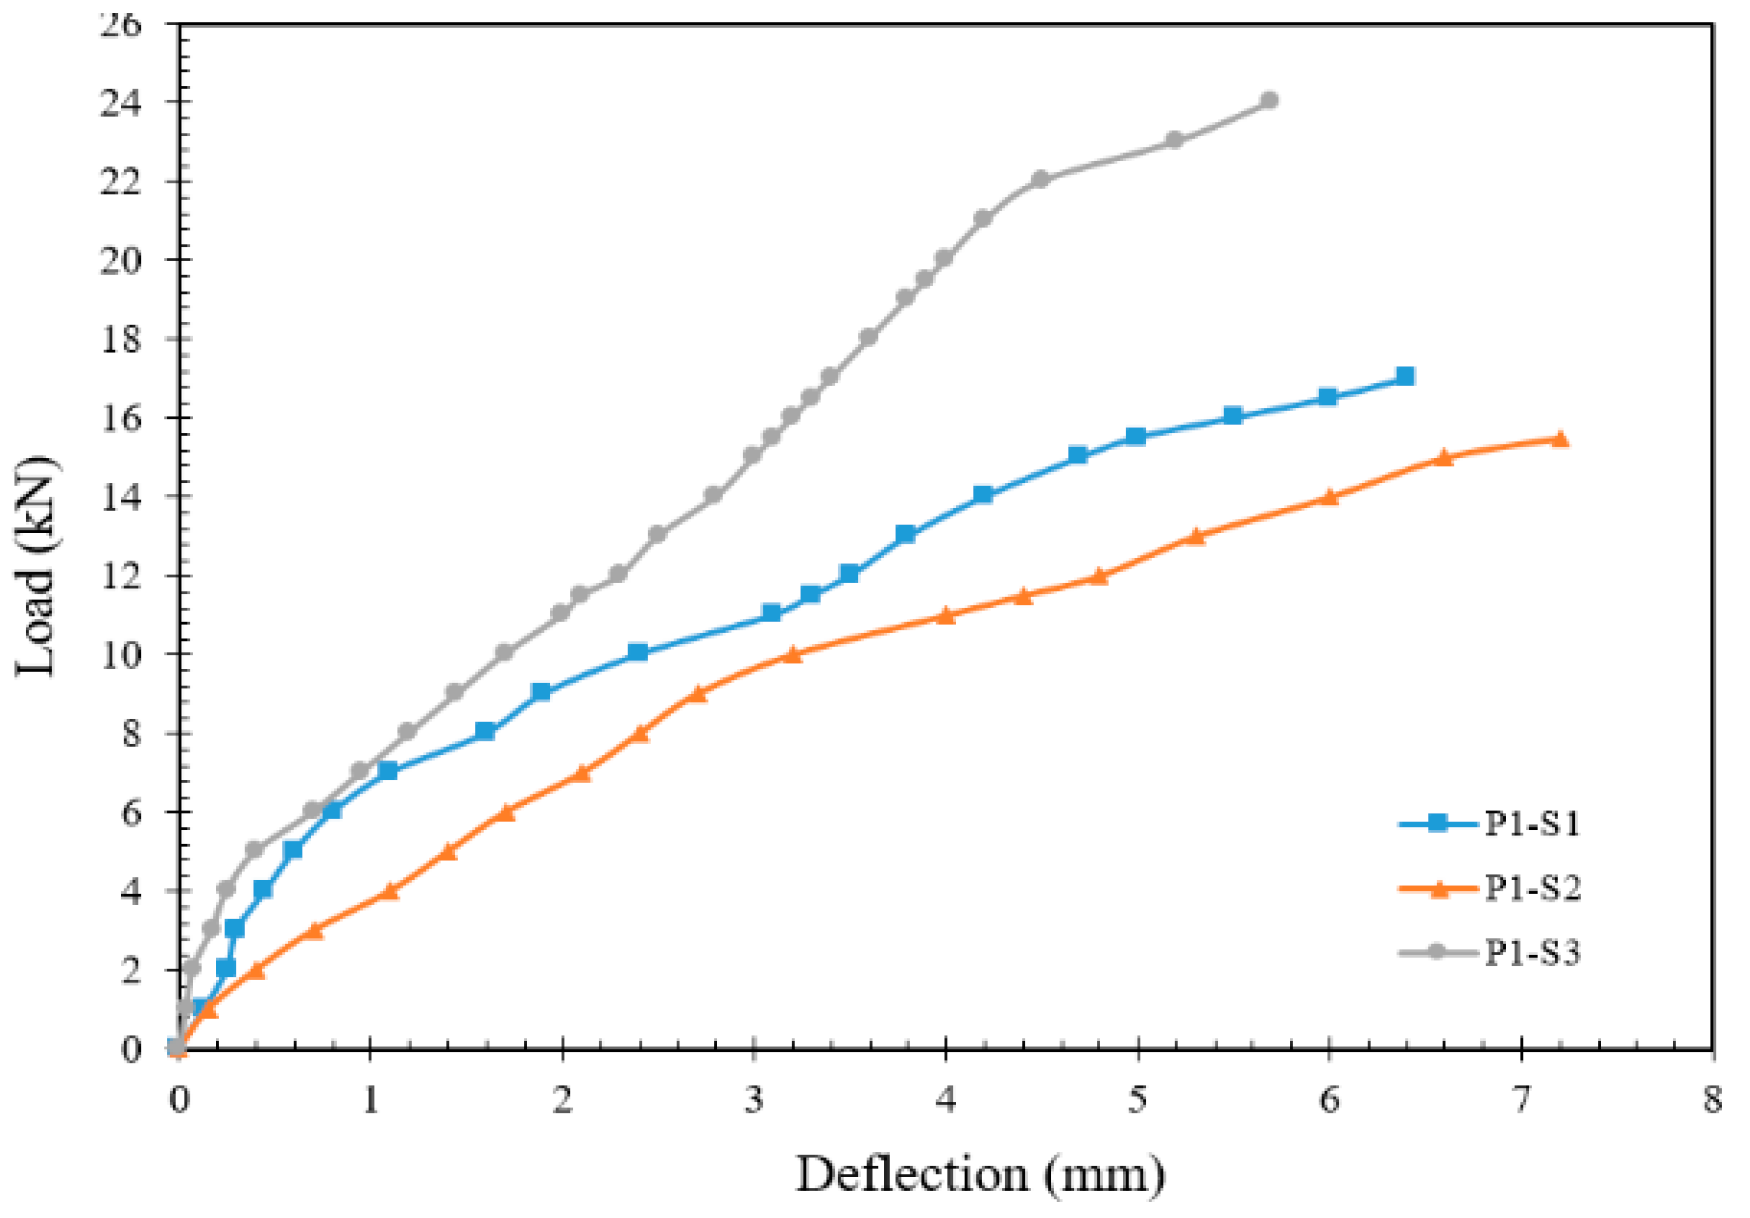
4.2.1. Experimental Tested Slabs

Due to a gradual increase in loading, cracks started near the center of slab and became more apparent across the whole specimen. In the meantime, these cracks propagated to a particular pattern. For instance, when opening cracks (flexural) began, they may be propagated to sliding cracks (shear), and initiate a punching shear cone shape. The monitored crack pattern for slab specimens that failed in bending (flexural failure) took form as a triangular crack adjacent to the loading area, accompanied by a diagonal cracking spread outside the loading area.
Some specimens were observed to fail in flexural (P0-S1 to P1.0-S2), while other specimens (P0-S3 and P1.0-S3) failed in shear, due to increasing of the steel reinforcement. Figure 13a–d shows the cracks formulation for some tested slabs.
Three phases were distinguished for all load-deflection curves. At first, the curve behaved linearly within the elastic region of the load–deflection relationship. Yet, when this stage ended, the first crack was initiated. Then, the steel reinforcement started to yield, and the linear region became curvier. In the last stage, deflection increased with load until failure. These three phases are clearly observed in specimens P0.5-S1, P1.0-S1, P1.5-S1, P0-S3, and P1.0-S3, while in specimens P0-S1, P0-S2, and P1.0-S2, the first and second phases seem to be in phase due to the absence of polyolefin fiber in the specimen P0-S1 and the presence of an opening in specimens P0-S2, and P1.0-S2.
Figure 14 shows the deflection variation of loads for slab set S1 with four percentages of polyolefin fiber, 0, 0.5%, 1%, and 1.5%. With the increase in polyolefin fiber percentage, the value of deflection decreased. For instance, at a load of 12 kN, the deflection values varied as 4.52 mm, 4 mm, 3.5 mm, and 2.3 mm when the polyolefin changed to nil, 0.5%, 1%, and 1.5%, respectively, with an average value of 3.58 mm. That indicates that the presence of polyolefin fiber enhances the efficiency of the slab strength. The average value of the deflection was 3.58 mm, and close to the value of deflection for 1% polyolefin fiber with an error of 2.29%. The same concept was applicable for slab sets S2 and S3, as shown in Figure 15 and Figure 16, respectively.
Figure 17 and Figure 18 reflect the load–deflection relation for the three sets with nil and 1% polyolefin fiber percent. The deflection of slab S2 gives more values than the S1 and S2, due to the presence of an opening. The increasing reinforcement ratio in slab S3 led to deflection values lower than S1.

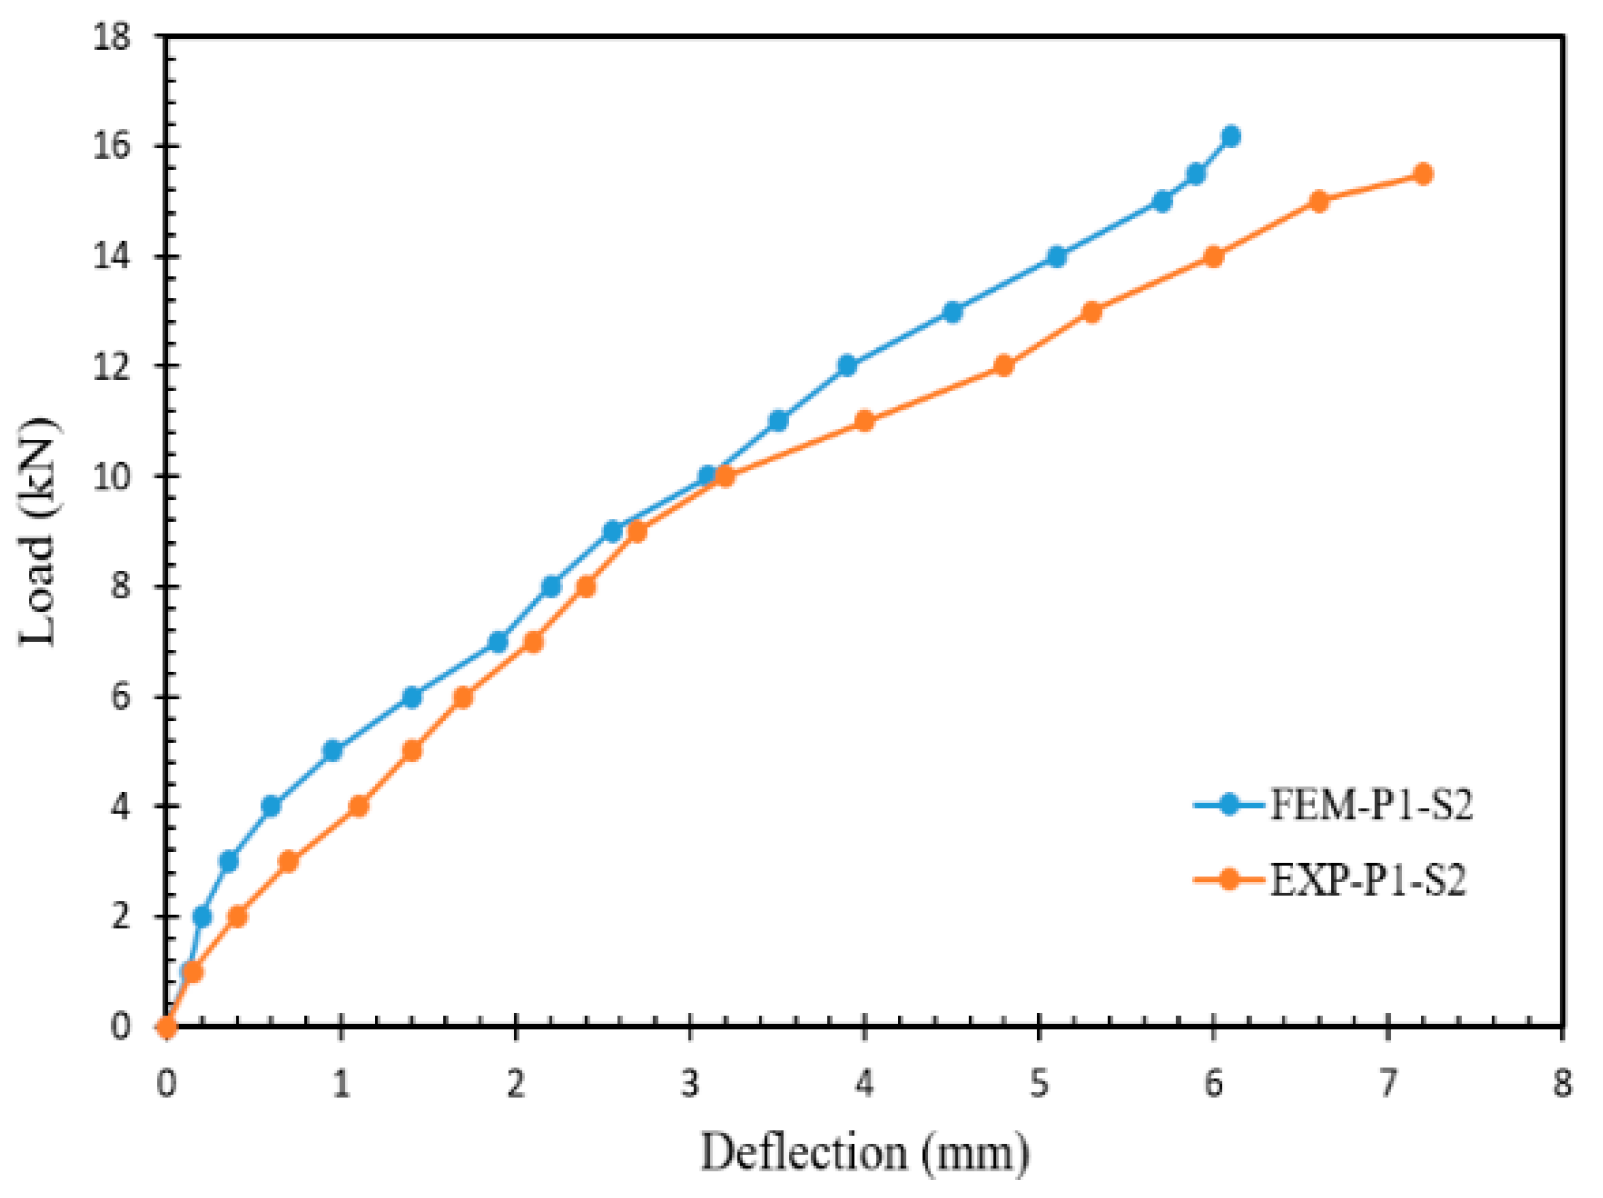
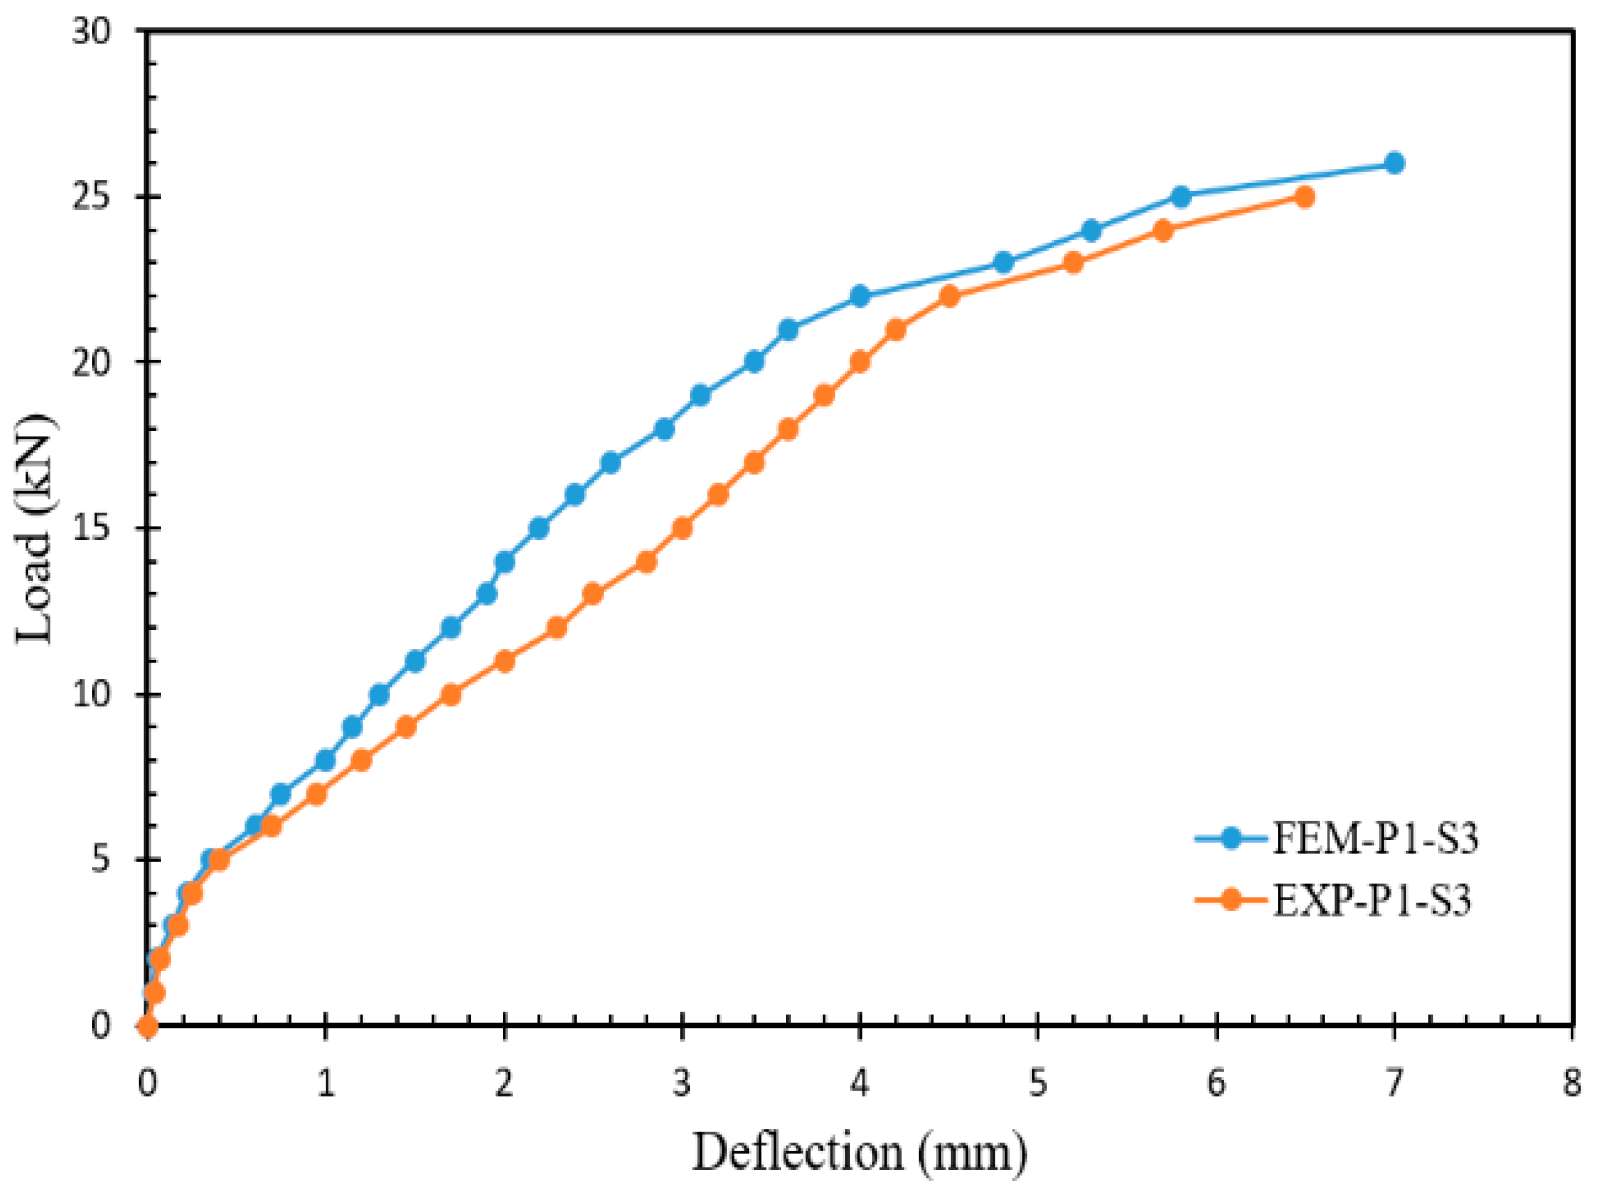
4.2.2. Comparison with the Numerical Outcomes

Figure 19, Figure 20 and Figure 21 show a comparison between the tested and the simulated samples for fiber content of 1%. The load deflection curves for the investigated specimens show that the numerical approach always gave more values of load and deflection, as compared with the experimental outcomes.
Table 7 listed the ultimate load that the slab carried, and the maximum deflection for both the experimental and numerical models. Form the table, it can be seen that the ratio between the loads observed from the experimental model and the recorded ones from the numerical model varied from 0.91 to 0.98 with an average of 0.95, while the maximum deflection ratio varied from 1.01 to 1.28 with an average of 1.14.
When the ratio of experimental to numerical values approached 1.0, good agreement was gained between them. For instance, specimens P0-S3 (0.98) and P1.0-S3 (0.97) for the maximum loading, while for maximum deflection, specimens P0-S1 (1.01) and P1.5-S1 (1.06) seemed to have good agreement
Figure 22 shows the non-linear model analysis using Abaqus software for the solid slab and slab with rectangular hole for deflection.

5. Conclusions

In this research, eight specimens of flat slabs were tested experimentally and numerically until failure to investigate the polyolefin fiber effect on the flexural and shear behavior of the flat slab. Depending on the outcomes, the following can be concluded:
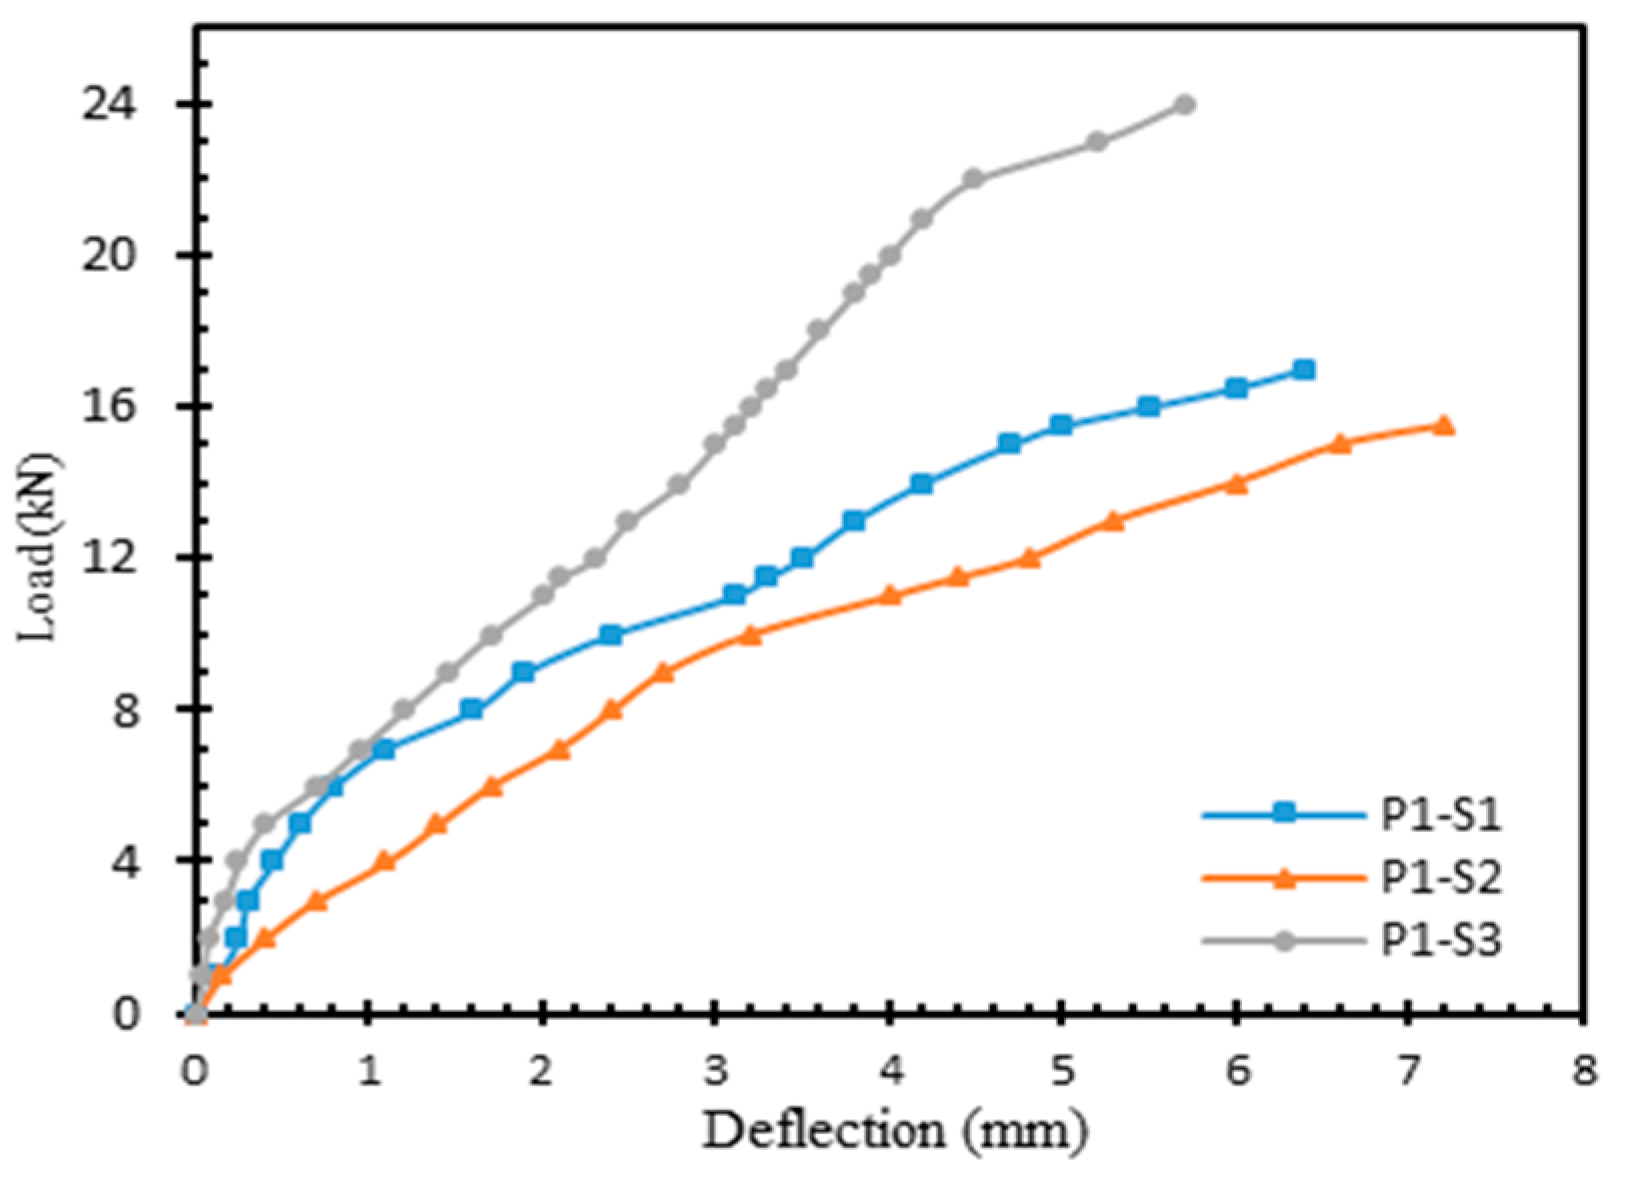
  • The presence of polyolefin fiber improved the strength behavior of the slab. As the polyolefin fiber content increased, the observed deflection values decreased. For example, at a load of 12 kN, the deflection values varied from 4.52 mm to 4 mm, 3.5 mm, and 2.3 mm, when fiber content changed from zero to 1.5%;
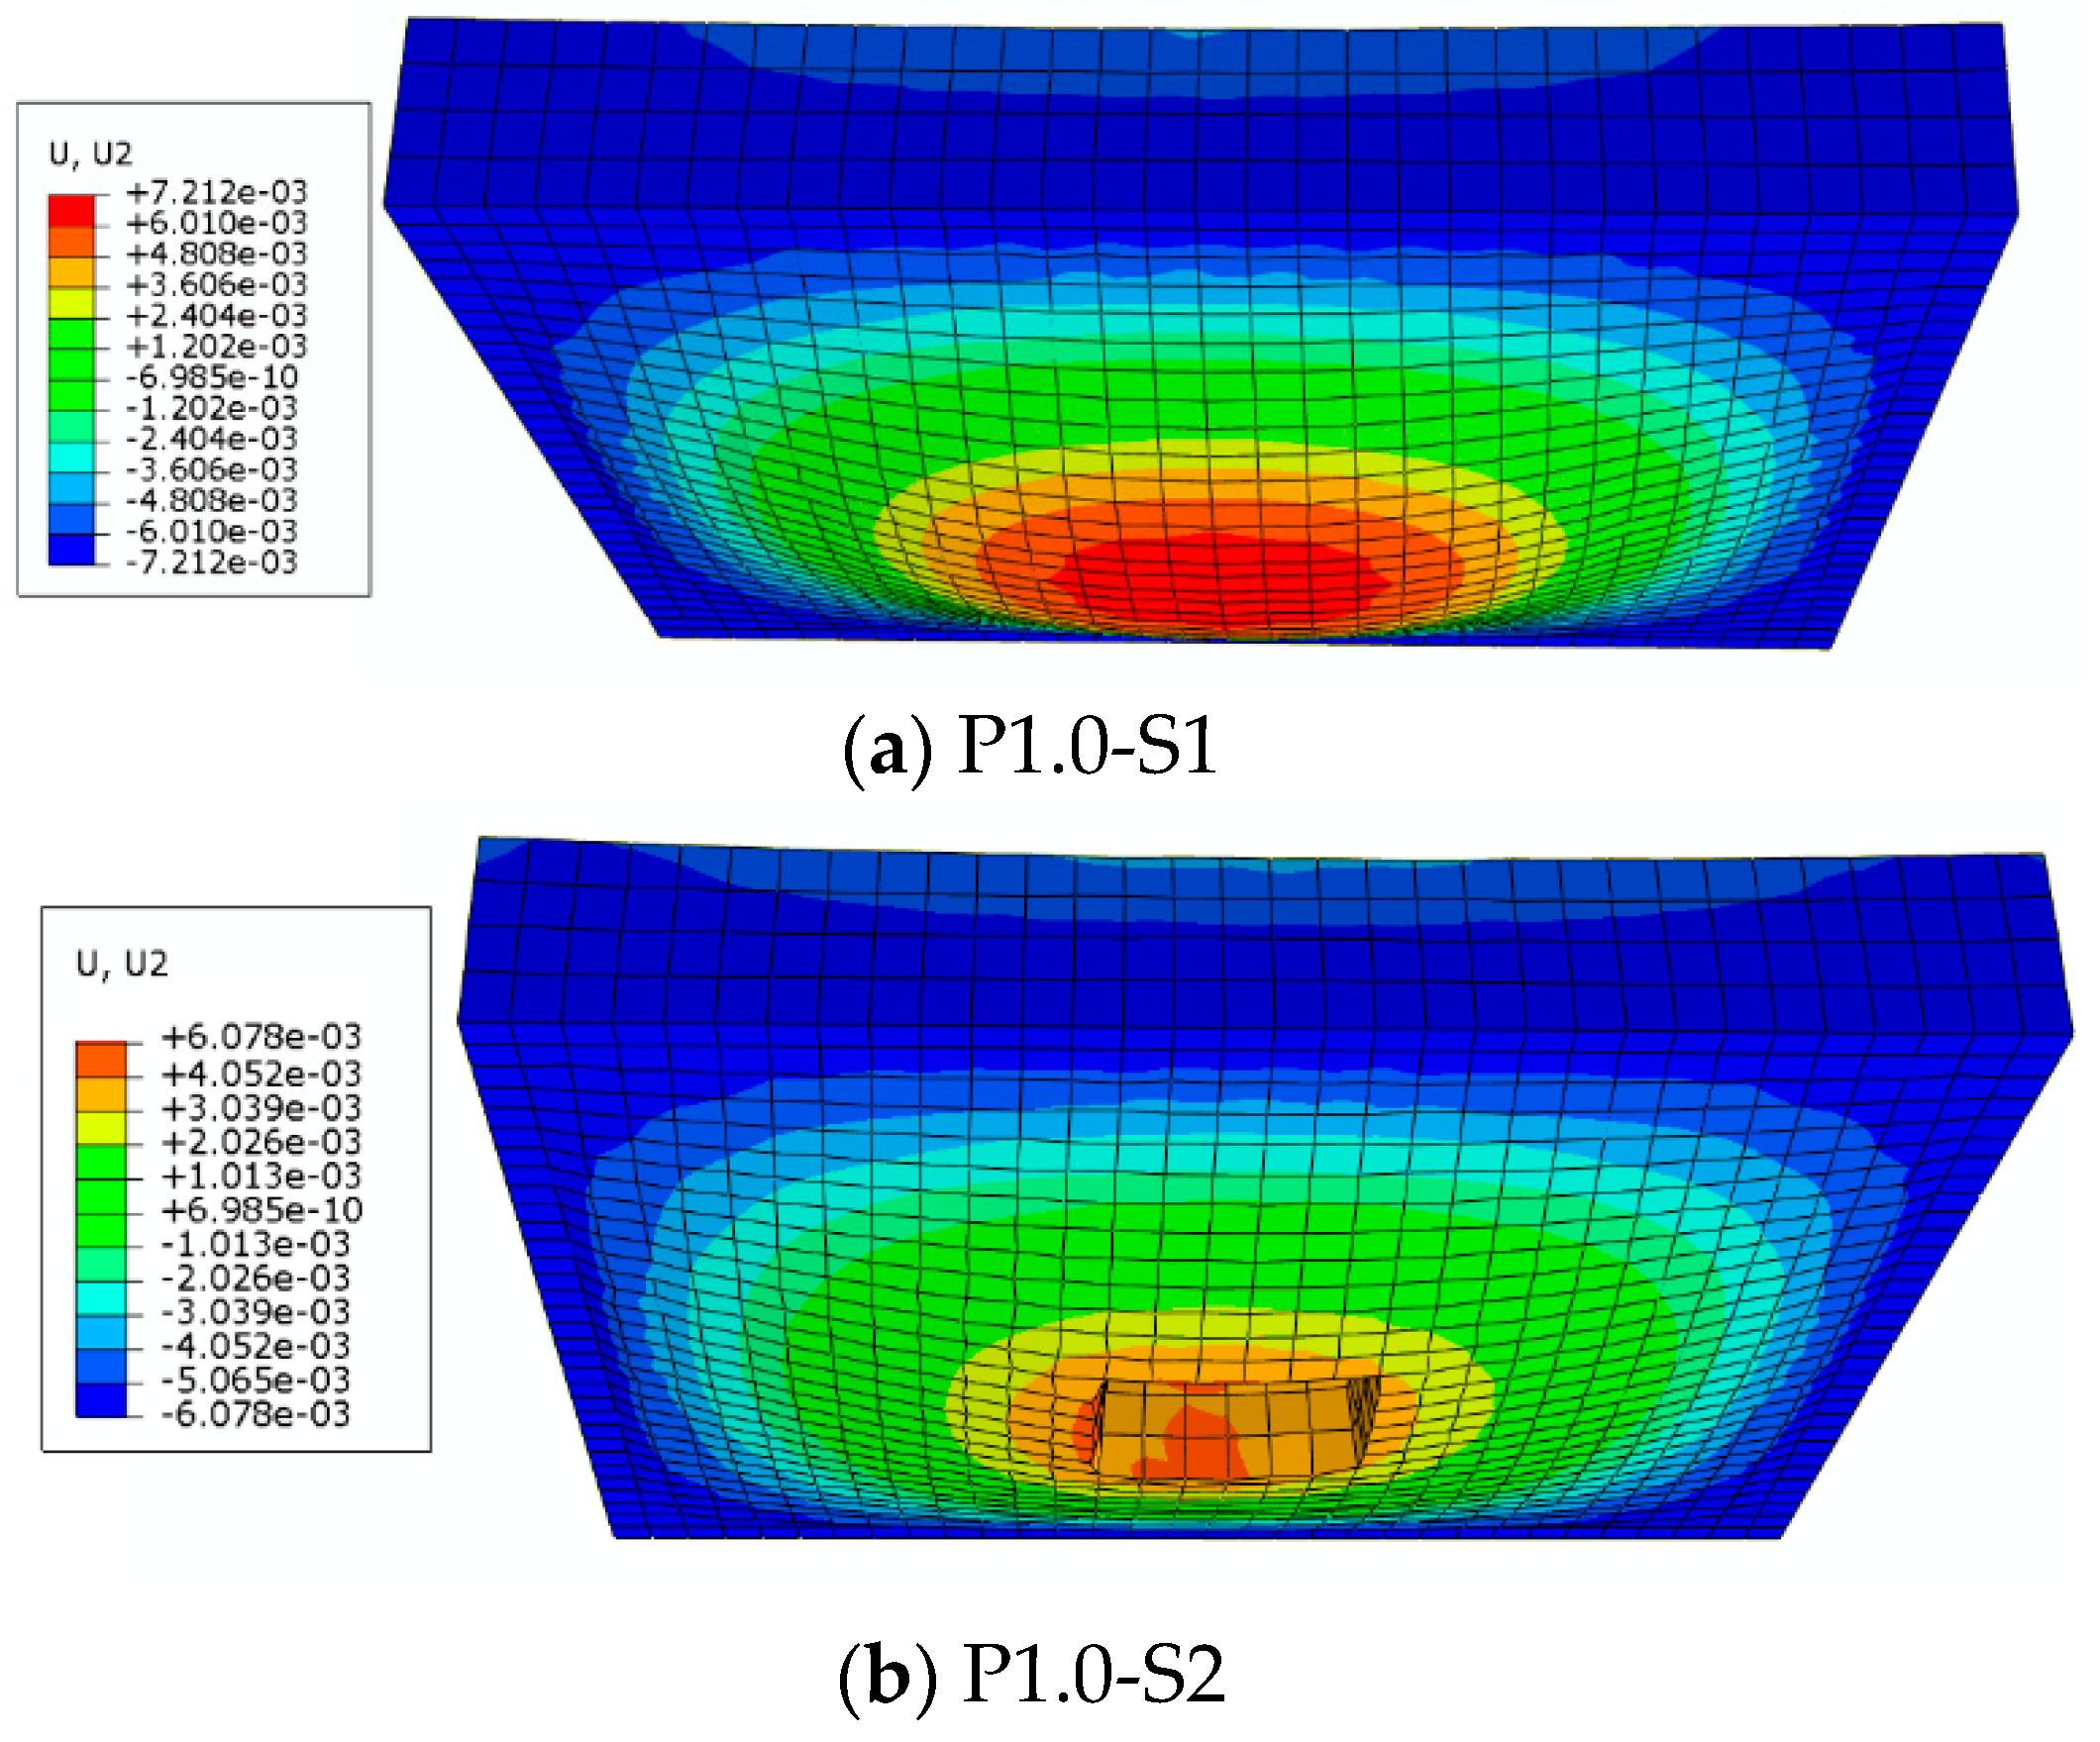
  • Deflection values increased for specimens with a hole in the slab set 2, as compared with slab sets 1 and 3;
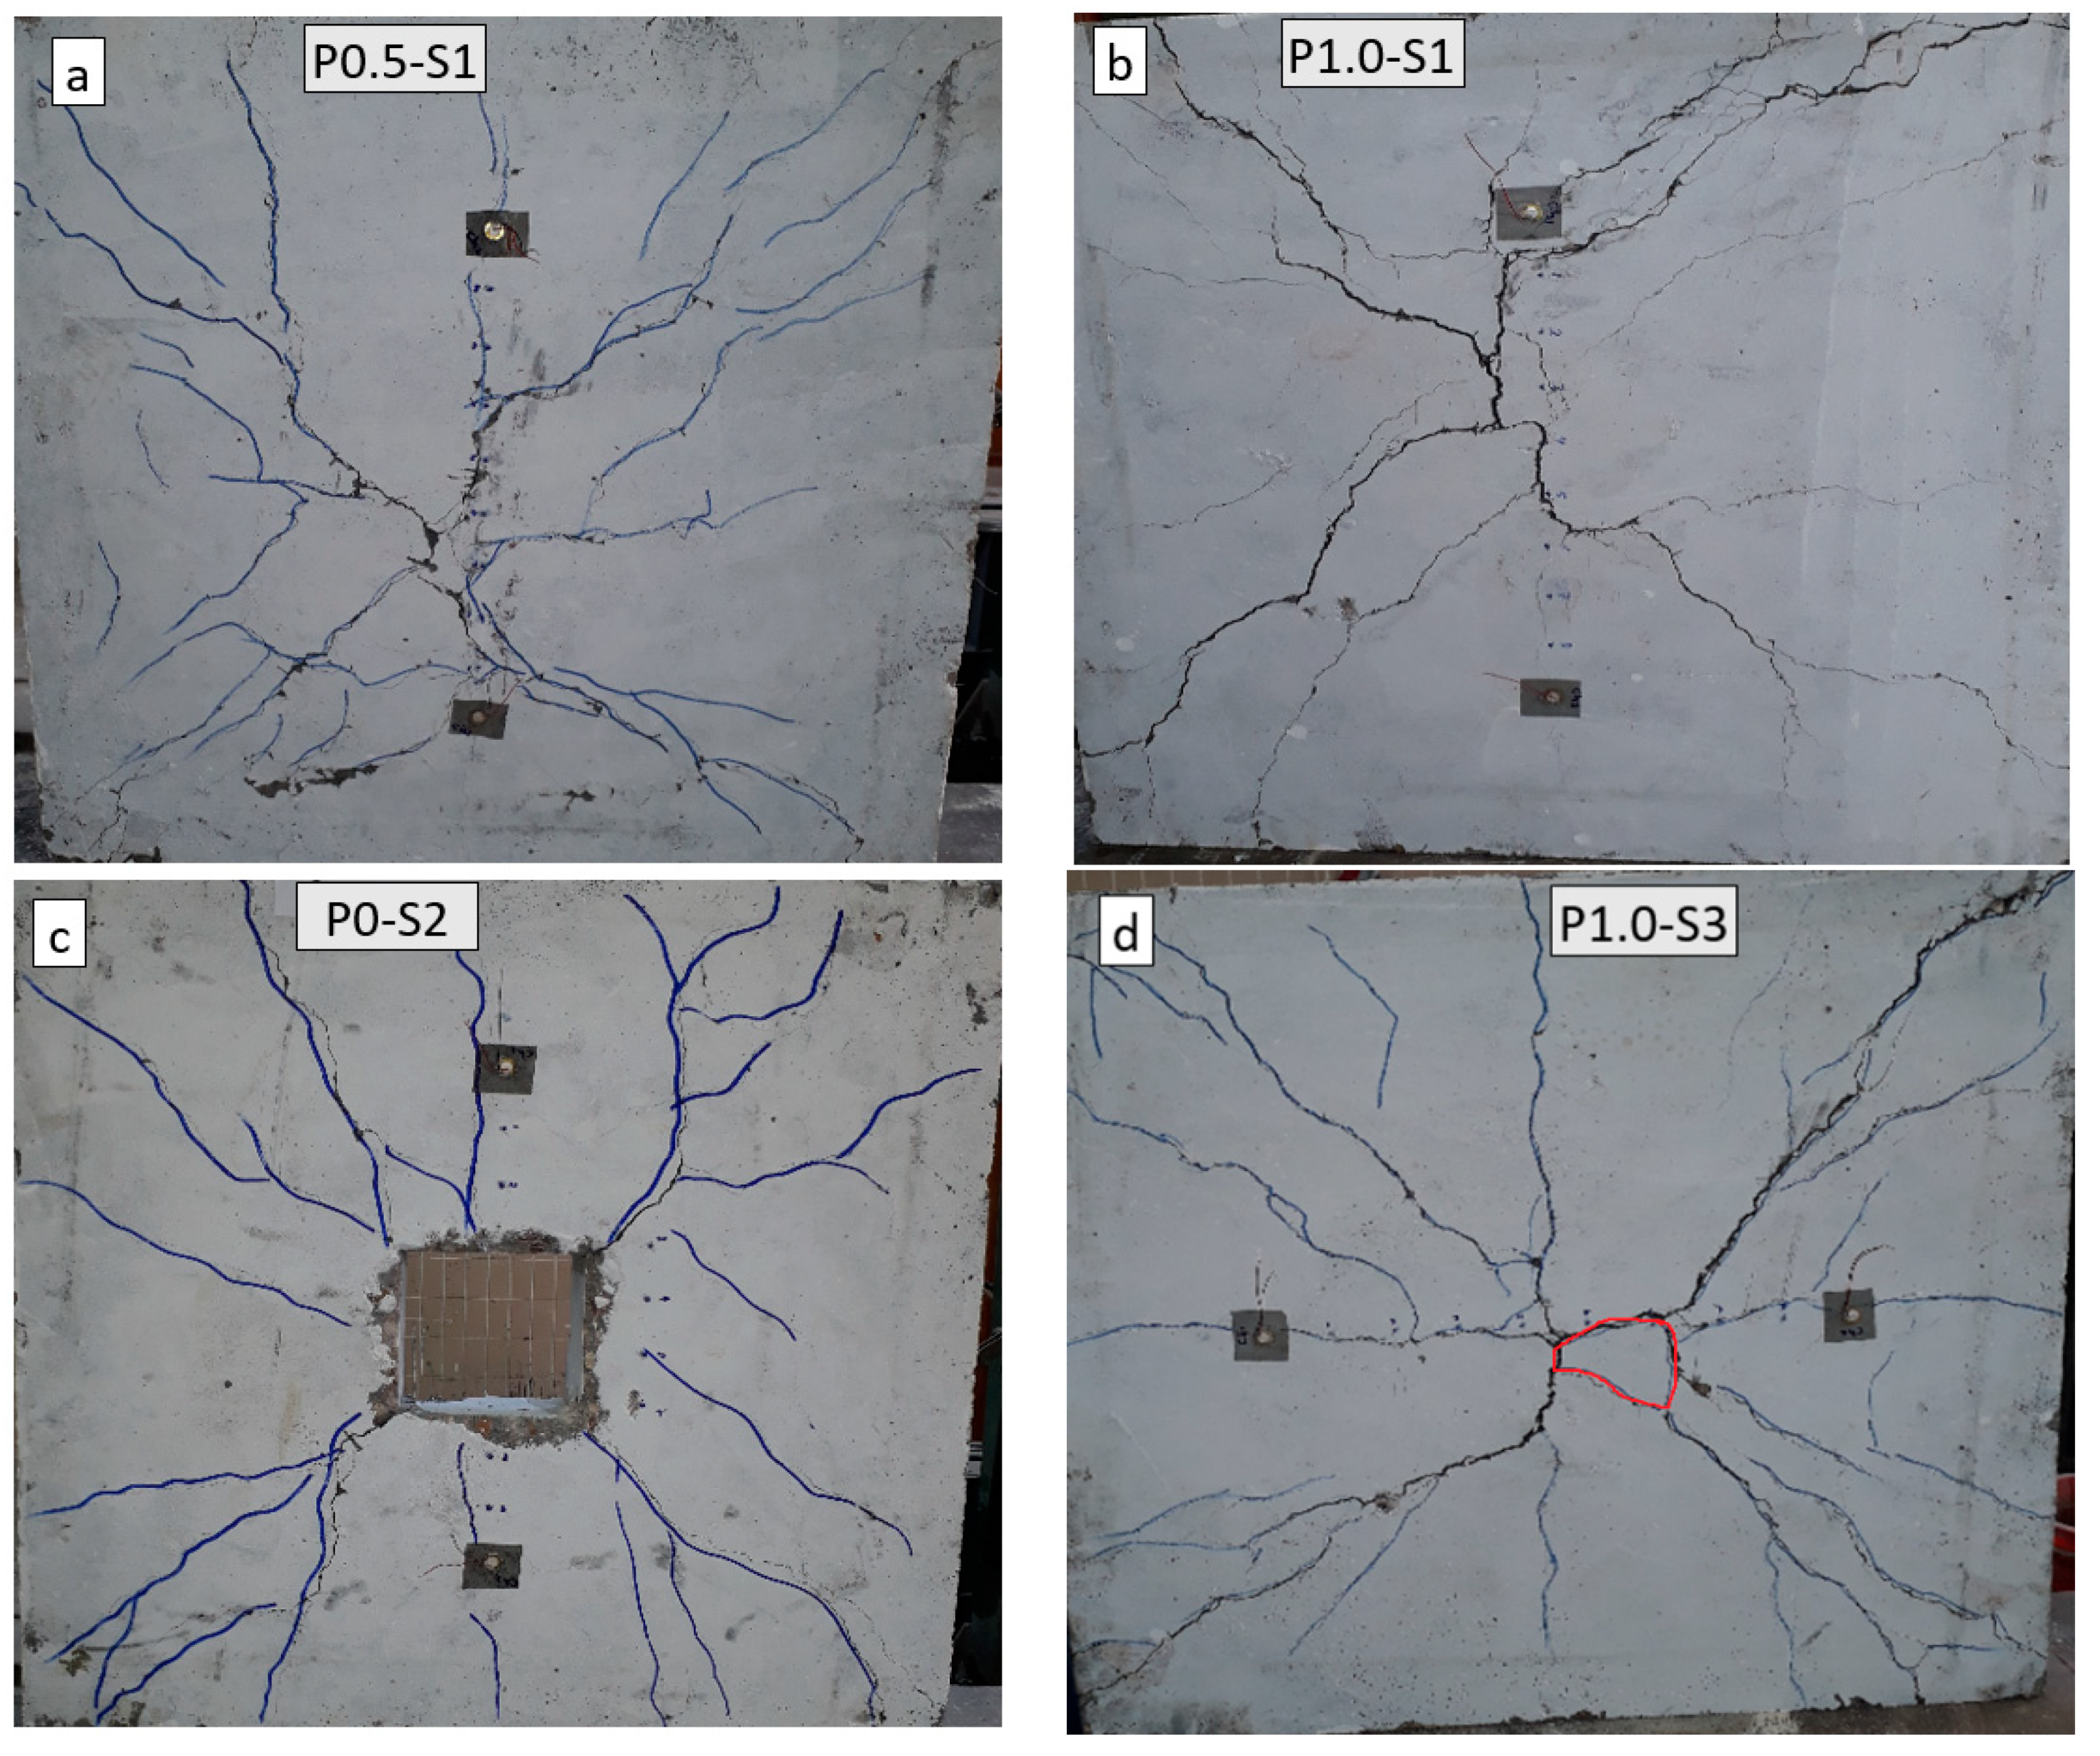
  • Two types of failure were observed, flexural for samples (P0-S1 to P1.0-S2) and shear failure for specimens (P0-S3 and P1.0-S3). In the meantime, punching occurred for all slab sets;
  • The average deflection value for slab set 1 was 3.58 mm, which was close to the deflection values for 1% polyolefin fiber with an error of 2.29%;
  • The computed maximum load and deflection ratios between the experimental and numerical values varied from 0.91 to 0.98 and 1.01 to 1.28, respectively. Excellent consent was found for maximum load, especially in specimens P0-S3 (0.98) and P1.0-S3 (0.97). The same was true for maximum deflection with samples P0-S1 (1.01) and P1.5-S1 (1.06).

Author Contributions

Conceptualization; A.M.A. and H.K.H.; formal analysis, H.K.H. and A.M.A.; investigation, A.M.A. and M.F.O.; methodology, H.K.H., A.M.A. and M.F.O.; project administration, A.M.A.; data curation, A.M.A.; resources, H.K.H. and A.M.A.; supervision, H.K.H. and M.F.O.; writing—original draft, A.M.A.; writing—review and editing, H.K.H.; funding acquisition, H.K.H., A.M.A. and M.F.O. All authors have read and agreed to the published version of the manuscript.

Funding

This research received no external funding.

Institutional Review Board Statement

Not applicable.

Informed Consent Statement

Not applicable.

Data Availability Statement

Not applicable.

Acknowledgments

Special thanks goes to the staff of the Laboratory of Civil Engineering Department, Engineering College, Basrah, for their effort on performing the experimental work in this study.

Conflicts of Interest

The authors declare no conflict of interest.

References

  1. Alberti, M.; Enfedaque, A.; Gálvez, J.; Agrawal, V. Reliability of polyolefin fibre reinforced concrete beyond laboratory sizes and construction procedures. Compos. Struct. 2016, 140, 506–524. [Google Scholar] [CrossRef]
  2. Al-Rousan, R.Z. Failure Analysis of Polypropylene Fiber Reinforced Concrete Two-Way Slabs Subjected to Static and Impact Load Induced by Free Falling Mass. Lat. Am. J. Solids Struct. 2018, 15, 05. [Google Scholar] [CrossRef] [Green Version]
  3. Ramadevi, K.; Babu, D.L.V. Behaviour of hybrid fiber reinforced concrete slabs in frames under static loading. Ecol. Environ. Conserv. 2012, 18, 975–979. [Google Scholar]
  4. Alberti, M.G.; Enfedaque, A.; Galvez, J. Improving the Reinforcement of Polyolefin Fiber Reinforced Concrete for Infrastructure Applications. Fibers 2015, 3, 504–522. [Google Scholar] [CrossRef] [Green Version]
  5. Bompa, D.V.; Oneţ, T. Punching shear strength of RC flat slabs at interior connections to columns. Mag. Concr. Res. 2016, 68, 24–42. [Google Scholar] [CrossRef] [Green Version]
  6. Bartolac, M.; Damjanović, D.; Duvnjak, I. Punching strength of flat slabs with and without shear rein-forcement. Građevinar 2015, 67, 771–786. [Google Scholar]
  7. Brunesi, E.; Nascimbene, R. Numerical web-shear strength assessment of precast prestressed hollow core slab units. Eng. Struct. 2015, 102, 13–30. [Google Scholar] [CrossRef]
  8. Sadowska-Buraczewska, B.; Szafraniec, M.; Barnat-Hunek, D.; Łagód, G. Flexural Behavior of Composite Concrete Slabs Made with Steel and Polypropylene Fibers Reinforced Concrete in the Compression Zone. Materials 2020, 13, 3616. [Google Scholar] [CrossRef]
  9. Marcalikova, Z.; Bilek, V.; Sucharda, O.; Cajka, R. Analysis of Fiber-Reinforced Concrete Slabs under Centric and Eccentric Load. Materials 2021, 14, 7152. [Google Scholar] [CrossRef]
  10. Helal, R.A.; Al-Baghdadi, H.M.; Al-Salim, N.H.A. Using Mortar Infiltrated Fiber Concrete as Repairing Materials for Flat Slabs. Civ. Eng. J. 2020, 6, 1956–1973. [Google Scholar] [CrossRef]
  11. Abdulhameed, A.A.; Al-Zuhairi, A.H.; Al Zaidee, S.R.; Hanoon, A.N.; Al Zand, A.W.; Hason, M.M.; Abdulhameed, H.A. The Behavior of Hybrid Fiber-Reinforced Concrete Elements: A New Stress-Strain Model Using an Evolutionary Approach. Appl. Sci. 2022, 12, 2245. [Google Scholar] [CrossRef]
  12. Kytinou, V.K.; Chalioris, C.E.; Karayannis, C.G. Analysis of Residual Flexural Stiffness of Steel Fiber-Reinforced Concrete Beams with Steel Reinforcement. Materials 2020, 13, 2698. [Google Scholar] [CrossRef] [PubMed]
  13. Zainal, S.M.I.S.; Hejazi, F.; Aziz, F.N.A.A.; Jaafar, M.S. Constitutive Modeling of New Synthetic Hybrid Fibers Reinforced Concrete from Experimental Testing in Uniaxial Compression and Tension. Crystals 2020, 10, 885. [Google Scholar] [CrossRef]
  14. ASTM C349; Standard Test Method for Compressive Strength of Hydraulic-Cement Mortars (Using Portions of Priss Broken in Flexure). ASTM International: West Conshohocken, PA, USA, 2018; pp. 1–4. [CrossRef]
  15. ASTM C204; Standard Test Methods for Fineness of Hydraulic Cement by Air—Permeability. ASTM International: West Conshohocken, PA, USA, 2019; pp. 1–11. [CrossRef]
  16. ASTM C191; Standard Test Methods for Time of Setting of Hydraulic Cement by Vicat Needle. ASTM International: West Conshohocken, PA, USA, 2021; pp. 1–8. [CrossRef]
  17. Iraqi Specifications No. (45), 1984 for Aggregates of Natural Resources Used for Concrete and Construction. Available online: http://www.sciepub.com/reference/124724 (accessed on 1 March 2022).
  18. ASTM C33/86; Standard Specification for Concrete Aggregates. ASTM International: West Conshohocken, PA, USA, 1986.
  19. ASTM C494; Standard Specification for Chemical Admixtures for Concrete. ASTM International: West Conshohocken, PA, USA, 2019; pp. 1–15. [CrossRef]
  20. ASTM A615/615M-05a; Standard Specification for Deformed and Plain Carbon Structural Bars for Concrete Reinforcement. Annual Book of ASTM Standards: 2005. ASTM: West Conshohocken, PA, USA, 2005; Volume 01.
  21. Alshaikh, I.M.; Abu Bakar, B.; Alwesabi, E.A.; Zeyad, A.M.; Magbool, H.M. Finite element analysis and experimental validation of progressive collapse of reinforced rubberized concrete frame. Structures 2021, 33, 2361–2373. [Google Scholar] [CrossRef]
  22. Agrahari, S.; Ramancharla, P.K. Understanding The Behavior of Flat Slab by Linear and Nonlinear Finite Element Analysis. In Proceedings of the New Technologies for Urban Safety of Mega Cities in Asia, Conference: USMCA17, Sendai, Japan, 26–28 November 2017. [Google Scholar]
  23. Georgewill, V.A.; Ngekpe, B.E.; Akobo, I.Z.S.; Jaja, G.W.T. Punching Shear Failure of Reinforced Concrete Flat Slab System—A Review. Eur. J. Adv. Eng. Technol. 2019, 6, 10–16. [Google Scholar]
  24. BS EN 12390-3:2009; Testing Hardened Concrete. Compressive Strength of Test Specimens. British Standards Institution: London, UK, 2009.
  25. ASTM C496/C496M; Standard Test Method for Splitting Tensile Strength of Cylindrical Concrete Specimens. ASTM International: West Conshohocken, PA, USA, 2017; pp. 1–5. [CrossRef]
  26. ASTM C78/C78M; Standard Test Method for Flexural Strength of Concrete (Using Simple Beam with Third-Point Loading). ASTM International: West Conshohocken, PA, USA, 2018; pp. 1–5. [CrossRef]
Figure 1. Fine aggregate grading curves.
Fibers 10 00034 g001
Figure 2. Coarse aggregate grading curves.
Fibers 10 00034 g002
Figure 3. Polyolefin fiber [4].
Fibers 10 00034 g003
Figure 4. Reinforcement grid for (a): slab set S1, (b) Slab set S2.
Fibers 10 00034 g004
Figure 5. Reinforcement grid for slab set S3.
Fibers 10 00034 g005
Figure 6. Slab set up for test.
Fibers 10 00034 g006
Figure 7. (a) Compressive stress–strain curve of concrete. (b) Tensile stress–strain curve of concrete. (c) Elastic perfect plastic stress–strain of steel.
Fibers 10 00034 g007aFibers 10 00034 g007b
Figure 8. (a) Mesh size. (b) Slab boundary condition.
Fibers 10 00034 g008
Figure 9. Convergence steps [19].
Fibers 10 00034 g009
Figure 10. Compressive cube test.
Fibers 10 00034 g010
Figure 11. Modulus of rupture (MPa).
Fibers 10 00034 g011
Figure 12. Splitting tensile strength (MPa).
Fibers 10 00034 g012
Figure 13. Cracks formation of tested slabs (a) solid slab with 0.5% fiber, (b) solid slab with 1.0% fiber, (c) slab with opening–0% fiber, (d) solid slab with 1.0% fiber and extra steel bar reinforcement.
Fibers 10 00034 g013
Figure 14. Load–deflection relationship with four polyolefin fiber rates (S1).
Fibers 10 00034 g014
Figure 15. Load–deflection relationship with two polyolefin fiber rates (S2).
Fibers 10 00034 g015
Figure 16. Load–deflection relationship with two polyolefin fiber rates (S3).
Fibers 10 00034 g016
Figure 17. Load–deflection relationship of three slab categories with nil% of the polyolefin fiber.
Fibers 10 00034 g017
Figure 18. Load–deflection relationship of three slab categories with 1% of the polyolefin.
Fibers 10 00034 g018
Figure 19. Load deflection relationship for experimental and numerical models (sample P1.0-S1).
Fibers 10 00034 g019
Figure 20. Load deflection relationship for experimental and numerical models (sample P1.0-S2).
Fibers 10 00034 g020
Figure 21. Load deflection relationship for experimental and numerical models (sample P1.0-S3).
Fibers 10 00034 g021
Figure 22. Simulation of deflection for (a) solid slab and (b) Slab with hole.
Fibers 10 00034 g022
Table 1. Cement physical characteristics.
CharacteristicsASTM StandardsExamination MethodOutcome
Compressive StrengthC349 [14]After 3 days (MPa) 18.5
After 7 days (MPa)27.1
FinenessC204 [15]Mesh 170%5.8
Permeability of Blain air (m2/kg)311
Setting TimeC191 [16]Initial (Min.)141
Final (Min.)257
Table 2. Cement chemical structure.
Cement Main StructureCement Chemical Composition
C3SC3AC2SC4AFSiO2Fe2O3MgOK2OInsoluble ResidueNa2OLOICaOAl2O3SO3
50.16.3124.110.220.43.41.450.560.520.331.261.95.11.88
Table 3. Rebar test results.
Nominal Diameter
mm
Actual Diameter
mm
Yield Stress
MPa
Ultimate Stress
MPa
1211.86430465
Table 4. Characteristics of the polyolefin fiber (SikaFiber® Force-60 data sheet).
Length
mm
Valent Diameter
mm
Density
kg/L
Elastic Modulus
GPa
Tensile Strength
MPa
600.840.917.5465
Table 5. Specifications of concrete.
MaterialPoisson’s RatioDensity
kg/m3
Young Modulus
MPa
Concrete0.20240025.789
Steel bar0.307800209
Table 6. Mechanical properties of concrete mixture for different polyolefin fiber ratios.
SymbolsFiber Content
(%)
Compression Cube Test
(MPa)
Splitting Tensile Strength
(MPa)
Modulus of Rupture
(MPa)
P00.036.22.324.20
P0.50.537.12.645.10
P1.01.040.33.126.80
P1.51.539.23.617.46
Table 7. Maximum load and deflection for the tested specimens.
Slab ItemMaximum Load (kN) Exp. Num. Maximum Deflection (mm) Exp. Num. Failure Mode
ExperimentalNumericalExperimentalNumerical
P0-S115.517.00.917.171.01Flexural
P0.5-S116.518.00.927.761.28Flexural
P1.0-S119.521.00.938.17.21.13Flexural
P1.5-S122.023.20.957.471.06Flexural
P0-S211.512.00.966.35.41.17Flexural
P1.0-S215.516.10.966.86.11.11Flexural
P0-S323.023.50.986.15.41.13Shear
P1.0-S326.026.70.978.771.24Shear
Publisher’s Note: MDPI stays neutral with regard to jurisdictional claims in published maps and institutional affiliations.

