Abstract
There are many types of concrete protection materials, but silane-based protective materials have excellent performance and durability. Experimental usage of silane sol-based waterproof materials is relatively mature and research studies on microscale mechanisms are relatively sparse. In this paper, molecular dynamics simulations are used to explain the microscopic transmission mechanism by analyzing the transport of water molecules and siloxane molecules in the gel pores, the local structure at the interface, and the molecular dynamics in the pores. Firstly, four models with different concentrations were constructed (0, 0.3, 0.6, and 0.9 mol/L). By comparison, it can be found that as the concentration increases, so does the effect of inhibiting the transport of water molecules in the pores. Based on the determination of the concentration, this paper corrects the arrangement. Next, the three commonly used silanes in the experiment were selected for simulation. It was found that octyltriethoxysilane has good stability and a waterproof effect. Among them, octyltriethoxysilane has a longer alkyl chain and is more stable at the interface, which destroys the original spatial correlation and weakens the capillary adsorption.
1. Introduction
Concrete is the most widely used building material in modern civil engineering and is the most important structural material [1,2,3,4]. As the material becomes more and more common, its users are paying more and more attention to the huge losses caused by its lack of durability [5]. Concretes are generally macroscopically uniform, microscopically porous, and uneven [6]. The decline in concrete durability is closely related to the water migration process [7]. There are many kinds of protective materials that can be used for concrete, mainly asphalt, epoxy resins, and polyurethane [8,9,10,11]. Among them, silane sol materials have a low surface tension, a good penetration ability, and can be widely used to lower the surface energy of concrete substrates [12].
Cement is an important part of concrete. Calcium silicate hydrate gel (C–S–H), the main hydration product of cement powder, is an important source of strength for the concrete and plays an important role in bonding materials [13]. C–S–H gels are mainly composed of calcium silicate layers, in which the diffusion of water and ions determines the strength, as well as the chemical and physical reactivity, of concrete [14]. Water molecules transport harmful ions when diffusing into concrete. The reaction of these harmful ions with hydration products causes the cracking of concrete, reduces the bond strength of cement-based materials, and affects durability [15]. According to engineering practices, permeable silane sol materials have a better waterproof effect. When applying such a material to the concrete surface, it will gradually penetrate into the concrete through capillary pore adsorption [16]. The goal is to prevent water molecules from invading the concrete without blocking the pores on the concrete surface. Therefore, this step is of primordial concern. We must fully understand the mechanisms for water transport inhibition to improve the waterproofing efficiency. It is of great importance to study its mechanism of action from a microscopic point of view. Molecular dynamics simulations are based on a molecular force field and they calculate the various properties of a molecule to help interpret experimental research results. Studying the interaction between the osmotic silane sol material and the interface between water molecules and calcium silicates at the molecular scale can provide a better basis to model the durability of concrete materials.
Hou et al. studied the interaction of water molecules and ions with the interface of calcium silicate gel pores under unsaturated transport conditions [2,7,14,17,18,19]. In this paper, molecular dynamics simulations are used to simulate the incorporation of different concentrations of silicone emulsions through the transport properties of the water molecules in the calcium silicate gel pores, as well as determine the structural and dynamic properties at the interface between the water and siloxane molecules in the gel pores. After the silane-based material penetrates the capillary pores of the concrete, the silane sol hydrolyzes to form silanols under the action of moisture and water in the pores. Then, the nascent silanols react with the silicate substrate [20]. This paper mainly studies the structure and mechanism of the reaction in the gel pores. The molecular formula of silanols is used in the simulation.
1.1. Model Construction
The crystal simulation structure used in this paper is mainly based on the 11-Å tobermorite structure [21]. Murray et al. [22] improved its validity and accuracy in the LAMMPS Molecular Dynamics Simulator by transforming the tobermorite structure from monoclinic to orthogonal coordinates. The 11-Å tobermorite structure was used as the initial structure. Firstly, it was expanded to obtain a super unit cell that was then cut along the [0 1 0] crystal direction to obtain the upper gel pore structure required for the unsaturated transport model, as shown in Figure 1. After expansion, the length in the X-direction was 2.3 nm, the length in the Y-direction was 11 nm, and the length in the Z-direction was 7 nm. The upper gel channel was mainly composed of two layers of hydrated calcium silicates parallel to the Y-direction, with a pore width of about 3.5 nm for a length of about 11 nm. The size of gel pores ranged from 0.5 to 10 nm as proposed in previous research, taking into account the chain length of different silane molecules. The selected pore width was 3.5 nm [23,24]. Cutting along the [0 1 0] direction created non-bridged oxygen (ONB) on the surface of the gel hole. H atoms were added to the atoms perpendicular to the Z-direction to perform surface hydroxylation treatment and form silanol groups, in addition to being closer to the actual situation [25]. The molecular structure of the siloxane is shown in Figure 1. Given the width of the gel channel and the size of the siloxane molecule, three different concentrations of 0.3, 0.6, and 0.9 mol/L were compared to a pure aqueous solution. The free water density was set to 1 g/cm3. Furthermore, 27, 56, and 84 siloxane molecules were randomly placed in the lower emulsion to simulate different concentrations of a silicone emulsion. Periodic boundaries were set in the X- and Z-directions. To prevent molecules from escaping in the Y-direction, an invisible substrate was placed on the upper surface of the emulsion, a 7-nm vacuum layer was left in the upper layer in the Y-direction, and a 3-nm vacuum layer was left in the lower layer in the Y-direction [26].
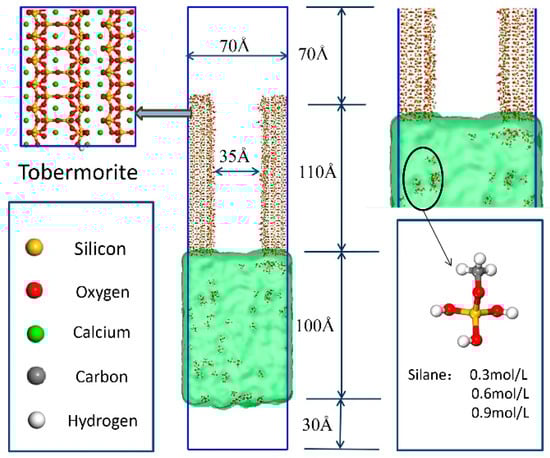
Figure 1.
Initial model structure: the red and yellow sticks represent the silicate chains; the green balls are calcium atoms. The green transparent film underneath represents a water film. Silixolecular structure: the gray balls are carbon ions, the yellow balls are silicon ions, the red balls are oxygen ions, and the white balls are hydrogen atoms.
1.2. Force Field and Molecular Dynamics Procedure
In this simulation, the clayff force field and cvff force field were employed to describe the structure. Due to its good transmission and stability, the clayyff force field is widely used to simulate hydration processes. It can also be used to describe the reaction between a multi-component mineral system and an aqueous solution. The parameters used in this paper were mainly taken from the clayff force field [27,28]. Based on the behavior of water and hydroxyl groups in the traditional simple point-charge water (SPC) model [29], the interactions between hydroxide, oxyhydroxide, and clay phases yielded parameters for the interaction between Ca, Si, O, and H atoms in C–S–H gels. The potentials of the Si, C, H, and O atoms in the siloxane-based molecule were defined by the cvff force field parameters. The cvff force field is mainly used for the calculation of structures such as organic matter with a relatively small molecular mass. Diagonal terms of the cvff force field were employed to describe the deformation energy of bond lengths, bond angles, inversions, torsion angles, and non-bonded terms. The arithmetic mean rule for the distance parameter and the geometric mean rule for the energy parameter were used to calculate the interaction parameters between different types of atom [30,31]. They were originally used to simulate the root-mean-square (RMS) deviation of the fixed phase of proteins.
The software used by the molecular dynamics (MD) institute in this article was LAMMPS (2013) [32]. It increases the efficiency of molecular modeling for large-scale systems. Periodic boundaries were set in the all directions. The energy was minimized to eliminate the problem of improper configuration of atomic coordinates that may occur during modeling. The simulation temperature was set to 300 K for a time step of 0.002 ps. The molecular dynamics simulation was performed according to the following procedure: firstly, an invisible substrate was placed between the emulsion and the gel channel, and the substrate structure was frozen. The whole emulsion system moved for 1000 ps under the regular NVT ensemble (a collection of systems of the same molecular number N, the same volume V, and the same temperature T) and the micro-regular NVE ensemble (a collection of systems of the same molecular number N, the same volume V, and the same energy E), to reach an equilibrium state after relaxation. Then, the invisible substrate was released, and the emulsion could move freely in the gel channel. The operation then continued for 5000 ps under the NVT and NVE conditions. Sampling was done every 2 ps, and 2500 steps of balanced motion trajectory information was used for the analysis of the model structure and transmission. This ensured the accuracy of the analysis.
2. Results and Discussion
2.1. Four Different Concentration Models
2.1.1. Water and Ion Transport in the Nanometer Pores
A screenshot of the motion of four models at 800 ps was selected to compare the inhibitory effects of the four different concentrations of siloxane molecules, as shown in Figure 2. By comparing the screenshots at the same time, we found that the penetration depth of the pure aqueous solution shown in Figure 2a almost reached the upper part of the gel channel after 800 ps, while the penetration depths of the other three models were significantly lower. The four models showed significant capillary absorption characteristics during water migration. The advanced frontier of the emulsion exhibited an obvious meniscus shape. The angle between the water molecules and the C–S–H gel channel interface was less than 90°, reflecting the hydrophilic properties of the hydrated calcium silicate interface and validating the model.

Figure 2.
Screenshots of the four models of water molecules at 800 ps.
The contact angle of bulk solution was measured according to the capillary flow process, as shown in Figure 3. The final contact angles of the three models incorporating siloxane were larger than those of the pure aqueous solution. The contact angle in the 0.3 mol/L model was similar to that in the 0.6 mol/L model (around 27°) when equilibrated. When the concentration of the model was 0.9 mol/L, the contact angle in the model was around 40°, meaning the reduction of hydrophilicity of the C–S–H surface and capillary force.
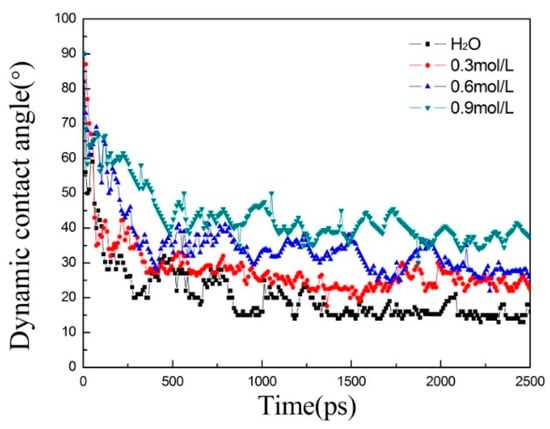
Figure 3.
The evolution of dynamic contact angle of the solution with simulation time.
Water and siloxane molecules in the gel pores could be studied further using intrusion depth plots. The average of the centroid positions of all molecules in the gel channel was selected as the average invasive depth. Ow (oxygen in water molecules) represents the depth of penetration of the water molecules and Si (Si in siloxane molecules) represents the depth of penetration of the siloxane. According to Figure 4a, the depth of invasion of the water molecules in the gel pores increased parabolically with time and reached the tip at 1500 ps. The siloxane molecules entered the gel pore at the same time as the water molecules and inhibited the transport of the water molecules after interacting with the interface. Compared with a pure aqueous solution, the intrusion depth of the emulsion added with siloxane was slower. The inhibitory effect of the 0.9 mol/L emulsion was slightly higher than for the 0.6 mol/L emulsion. According to the intrusion depth curve for siloxane molecules in Figure 4b, a concentration of 0.6 mol/L resulted in a faster invasion of the gel pores, and the interaction with the pore interface was weaker than for the other two concentrations. The inhibition effect on the transport velocity of the water molecules was small. In combination with Figure 2 at 800 ps, we can preliminarily conclude that the transport velocity of the water molecules in the hydrated calcium silicate gel coated with a silane-based coating was reduced.
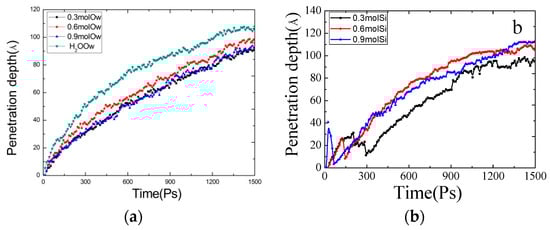
Figure 4.
Penetration depth of (a) four different models of water molecules, and (b) three different models of siloxane molecules.
The water molecule movement state at 500–560 ps was selected to draw the water molecule displacement color map to observe the water migration process more intuitively. As shown in Figure 5, we found that the four models entered the gel channel and had a meniscus shape. The transmission speed was the highest near the interface and in the middle of the channel. This is consistent with the actual situation. In the experiment, when the concrete pores are not saturated, the contact of the concrete with the solution increases the capillary pore pressure and the solution is absorbed into the concrete pores. Since the hydrated calcium silicate interface is hydrophilic, the contact angle between the aqueous solution and the capillary wall is less than 90°, which creates a concave liquid surface.
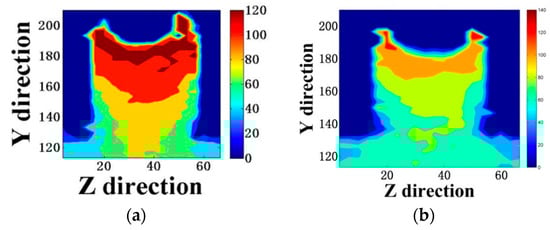
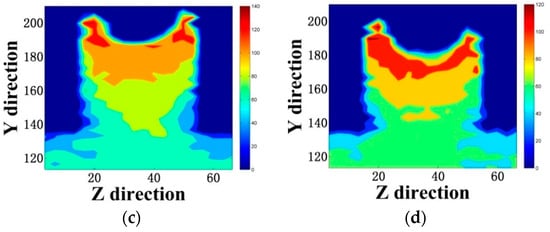
Figure 5.
Displacement color map of (a) a pure aqueous solution, (b) 0.3 mol/L emulsion, (c) 0.6 mol/L emulsion, and (d) 0.9 mol/L emulsion. (The unit in the Y and Z directions is Å).
Comparing (a), (b), (c), and (d) in Figure 5, the general trend of the four models was the same. We found that the rate of water movement of the doped siloxane molecules was significantly reduced. In the model of the pure aqueous solution, the water molecules formed an H-bond only with an unbridged oxygen at the interface, as shown in Figure 6a. In emulsions containing siloxane molecules, the exposed hydroxyl groups in the siloxane interacted with the surface of the gel pores, reducing the stability of the H-bond formed by water molecules and interfacial hydroxyl groups. The methyl groups were exposed to the emulsion, as shown in Figure 6b. Since the methyl group is a hydrophobic group, there was a certain inhibition of water transport, which prevented water molecules from entering the gel pores.
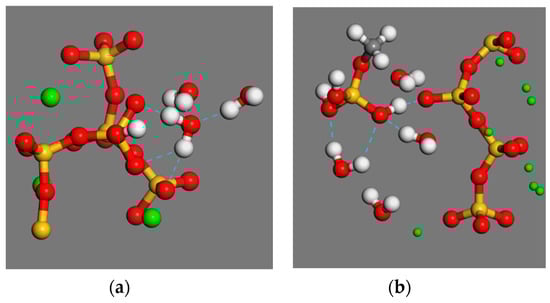
Figure 6.
(a) Water molecules and interface hydrogen bond. (b) Schematic diagram of hydrogen bonding between siloxane molecules and interfaces.
2.1.2. Structure of Surface Water
The structural characteristics of the molecular distribution in the liquid were obtained by analyzing the radial distribution function (RDF). The radial distribution function is the ratio of the local density to the bulk density of the system. It is an important parameter to analyze the degree of order in the emulsion [33]. In Figure 7a, three peaks appeared in Ow–Ow, indicating that the layered structure of water molecules was consistent with the results of earlier studies [25]. When observing the spatial correlation between oxygen (Ow) in water and non-bridged oxygen (Os: oxygen at the interface) at the interface of the gel channel in Figure 7b, shoulder peaks appeared in all four models and the shoulder for pure aqueous solution was centered around 3.4 Å. The shoulder for the model with siloxane molecules was located at 3.1 Å. It indicates that the degree of order between water molecules was not only affected by the silicate chain, but also by the siloxane molecules. Next, the correlation between the siloxane molecule and the interface was calculated, as shown in Figure 7c,d. In Figure 7c, the Osi (oxygen in silanol) and Caw (Ca at the gel channel interface) showed the first peak at 2.7 Å. The bonding of Caw–Osi demonstrated that Caw and Osi had spatial correlation and stability in short distances. Calcium ions have a positive electrical charge of +2 and the electronegativity of the oxygen atoms is high, which contributed to the adsorption of the siloxane molecules at the gel pore interface. In addition, Caw–Osi had two RDF peaks at 4.9 Å and 7.8 Å and extended up to 8 Å, demonstrating a strong spatial correlation between Caw and Osi over longer distances. In Figure 7d, an intermolecular force was generated between hydrogen (Hsi: H in the siloxane hydroxyl group) and surface oxygen (Os), which enhanced the adsorption of siloxane at the interface. The spatial correlation between the water molecules and the silicate chains was destroyed by the addition of siloxane. Therefore, the RDF shoulder peak of the Ow–Os doped with the siloxane molecule was reduced.
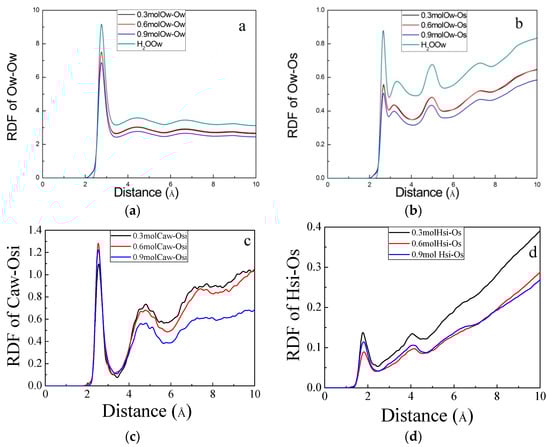
Figure 7.
Radial distribution function (RDF) of (a) Ow (oxygen in water)–Ow, (b) Ow–Os (oxygen at the interface), (c) Caw (Ca at the gel channel interface)–Osi (oxygen in silanol), and (d) Hsi (hydrogen in the siloxane hydroxyl group)–Os.
2.1.3. Dynamic Properties of Water
Mean square displacement (MSD) [34] is used to describe the average of the squared displacement of a particle. It can be used to evaluate the motion characteristics of a solution. The magnitude of the value indicates that the speed of the atomic motion is an important parameter in the dynamics, given by
where ri(t) represents the position of atom n at time t and ri(0) is the original position for atom i, while < > represents the average and || represents the absolute value.
MSD(t) = < |ri(t) − ri(0)|2 >
Figure 8 shows the calculated MSD in the four model water molecules. From Figure 8a, the MSD in the pure aqueous solution was the fastest, whereas the MSD doped with the silicone emulsion was smaller. The effects of the 0.6 mol/L emulsion were increased. The numbers of adsorbed water molecules and ions on the C–S–H channel at 2000 ps are shown in Table 1. The value of the aqueous solution was reduced from 1.3 to about 1.1, and the value of siloxane in the emulsion increased with concentration. The reasons for this phenomenon can be explained as follows: firstly, the interaction between water molecules is destroyed by the addition of siloxane molecules, and capillary adsorption is weakened. Secondly, the methyl group of the siloxane is hydrophobic and inhibits the transport of water molecules. Thirdly, clustering occurs in the gel pores due to the size of the siloxane molecules and hinders the transport of the water molecules.
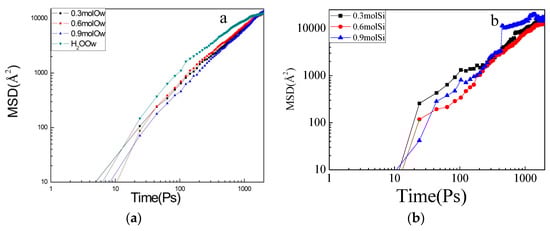
Figure 8.
Mean square displacement (MSD) evolution for (a) water molecules in different concentration models, and (b) siloxane molecules at in different concentrations.

Table 1.
Number of adsorbed water molecules and ions* on the calcium silicate hydrate (C–S–H) channel at 2000 ps.
Since the siloxane molecules generate clusters themselves, the MSD of the 0.3 mol/L siloxane emulsion was larger than the MSD of the high concentration, as shown in Figure 8b.
2.2. Different Kinds of Models
Through the above simulations, it can be found that the increase of concentration had a good effect on inhibiting the transport of water molecules in concrete pores, which is basically consistent with the conclusions in the experiment. After determining the concentration, the pattern was verified next, as shown in Figure 9. Firstly, we placed the silanol molecules in an emulsion. This process simulated the interaction of silane with the C–S–H gel pores on the concrete surface as water entered the capillary channels. The second type unidirectionally aligned the silane on the surface of the cementitious material. This process involved the condensation reaction of silanes with hydroxyl groups, which formed a network of membranes that inhibited the transport of water. Comparing the two models, we can find that the second model had a better suppression effect and was close to reality.
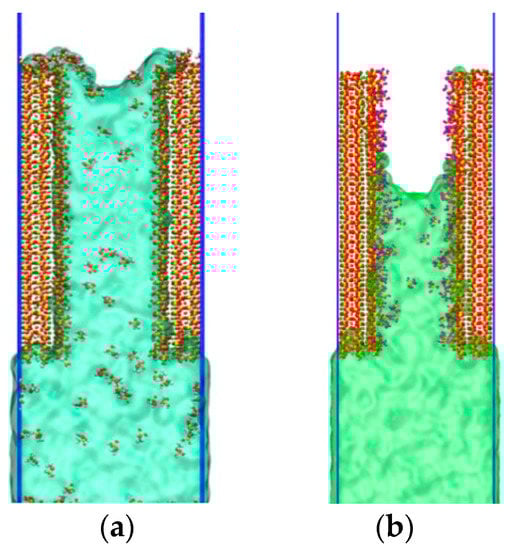
Figure 9.
Screenshots of two models of water molecules at 800 ps. (a) Silicone emulsion, (b) Silicone molecules arranged on the surface.
Based on the conclusion, this paper selected the three silane species commonly used in the experiments for simulation. They were methyltriethoxysilane (MTES), vinyltriethoxysilane (VTEO), and octyltriethoxysilane. Schematic diagrams of the molecular structures are shown in Figure 10.
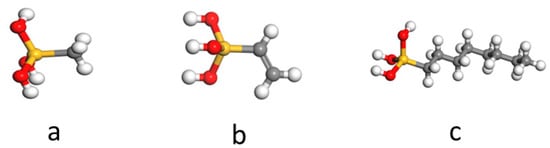
Figure 10.
The molecular structures of (a) methyltriethoxysilane (MTES), (b) vinyltriethoxysilane (VTEO), and (c) octyltriethoxysilane.
As shown in the Figure 11, comparing the penetration of the model with three different silane materials and the uncoated model penetration depth at 800 ps, it is apparent that the effect of octyltriethoxysilane was superior to the other two materials. Due to the complexity of the transfer at the C–S–H interface, we describe the interaction of the silane with the gel pore interface by analyzing the atomic intensity.
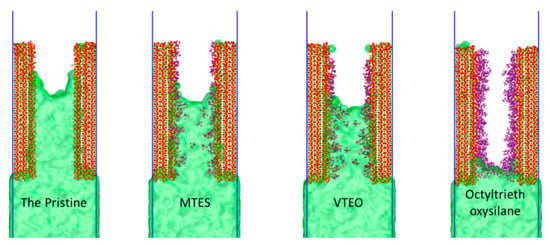
Figure 11.
Screenshots of the four models of water molecules at 800 ps.
When silane was applied to the surface of the channel, the transport mechanism of water molecules in the C–S–H gel channel was affected and changed. The analysis was performed using an atomic density map along the Z-direction, as shown in Figure 12. In the four models, calcium was distributed inside C–S–H, the hydroxyl group was distributed near the interface, and water was distributed in the gel channel. At the interface, the molecular strength of water increased compared to the channel, showing stratification. As shown in (a–d), it can be found that the water of the other three models had a peak distribution at the same position at the interface as compared with the pure aqueous solution. However, the peak of water molecules was significantly weakened. It fully demonstrates that, after coating the silane material, the silane reduced the interaction of the water molecules with the interface. This weakened the spatial order of the water molecules. Among them, octyltriethoxysilane had the strongest effect, mainly due to its long alkyl chain. Moreover, the alkyl group has strong hydrophobicity and has a great influence on the spatial order of water molecules at the interface.
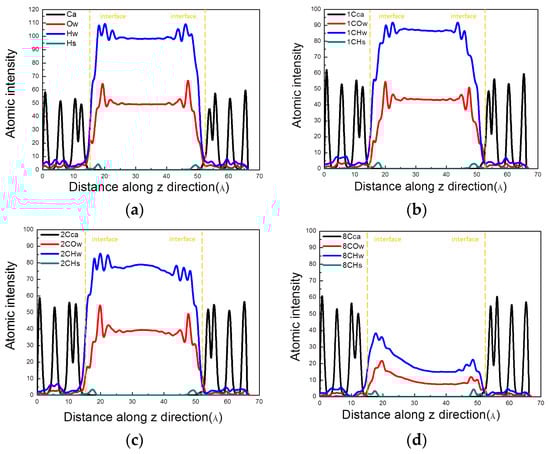
Figure 12.
Intensity distribution of atoms along the Z-direction at 2500 ps. (a) Blank; (b) MTES; (c) VTEO; (d) octyltriethoxysilane. (Ow and Hw: oxygen and hydrogen in water molecules, respectively; Hs: hydrogen in surface hydroxyls of calcium silicate hydrate (C–S–H); 1C represents MTES; 2C represents VTEO; 8C represents octyltriethoxysilane).
For a better understanding of the spatial distribution, Figure 13 exhibits the evolution of water density profile along the emulsion penetration direction. As shown in Figure 13a, the time-dependent density maps of water molecules show that water molecules gradually occupied the gel pores. There was an obvious transition zone of density gradient between water and vacant areas, due to the transport rate of water molecules near the interface of the capillary channel being faster than that in the center of the tunnel. The transition area gradually widened with the simulation time increasing. The density of water molecules entering the tunnel was 0.9 g/cm3, mainly due to the faster transport of water molecules in the gel pores and the inability to reach saturation in time. As shown in Figure 13b,c, since the silane material formed a waterproof mesh at the interface, the amount of water molecules entering the cells was limited, and the water molecule density decreased to 0.7–0.8 g/cm3. At the same time, the necking effect appeared at the entrance of the channel, as shown in Figure 14. This necking effect not only reduced the rate of water molecule transport, but also caused defects in the transport of water molecules in the channel. It moved upward as the silane molecules moved in the pores of the gel.
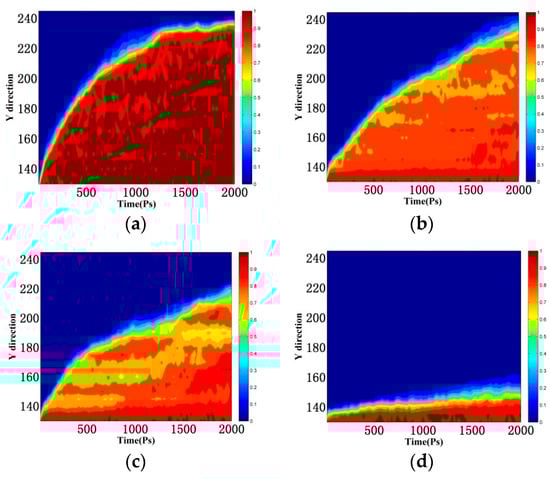
Figure 13.
Concentration distribution of water molecules along the Y-direction. (a) Blank; (b) MTES; (c) VTEO; (d) octyltriethoxysilane. (The unit in the Y and Z directions is Å).
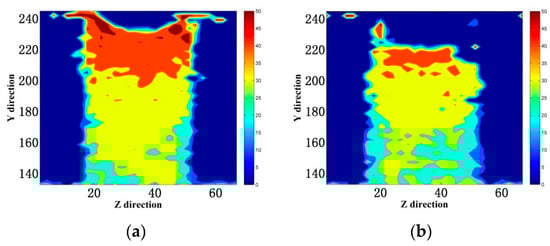
Figure 14.
Atomistic displacement distribution of water molecules in YZ-plane (a) MTES; (b) VTEO. (The unit in the Y and Z directions is Å.).
When the silane material was coated on the surface of the nanopore, the hydroxyl groups at the interface were capable of adsorbing silanol, which resulted in a sharp Si peak at the interface, as shown in Figure 15a. The peak positions of the three silane materials were the same, and octyltriethoxysilane exhibited a high intensity, indicating a strong spatial correlation at the nanochannel interface. Due to the different alkyl chain lengths of the three materials, the positional distribution of C in the channel had a large difference in the positional distribution. MTES and VTEO were mainly distributed near the interface of the channel. The spatial order of water molecules in the pores was less affected. The alkyl group in octyltriethoxysilane was located closer to the center of the channel. Therefore, the inhibition of water molecules in the pores was obvious.
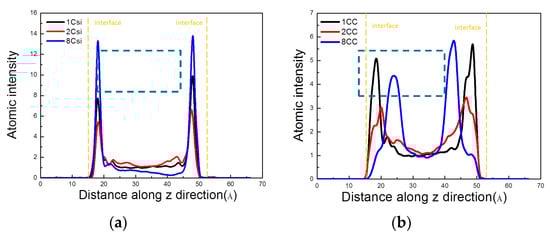
Figure 15.
Atomic intensity distribution of the (a) Si and (b) C.
In combination with the coordination number, 2.3826 octyltriethoxysilane molecules were adsorbed onto the channel surface at the same concentration, about two more than the other two materials, as shown in Table 2. This quantitatively proved that molecules in octyltriethoxysilane were more easily adsorbed at the interface, which is why they were more stable in the pores.
Table 2.
Number of adsorbed ions* onto the C–S–H channel at 2000 ps. MTES—methyltriethoxysilane; VTEO—vinyltriethoxysilane.
3. Conclusions
We used molecular dynamics simulations to analyze the structure and kinetic characteristics of water in nanometric gel pores under different concentrations and different types of silicone emulsion to investigate several hypotheses. The simulated results were basically similar to the test results [35,36,37]. The addition of siloxane molecules could inhibit the unsaturated transport of water. Firstly, the methyl group in the siloxane is a hydrophobic group with a high relative molecular mass, which sterically inhibits the transport of water molecules in the gel pores. Secondly, the siloxane molecules are adsorbed onto the surface mainly via the strong interaction between surface calcium ions and oxygen in the siloxane hydroxyl group and hydrogen in the surface oxygen and hydroxyl groups. The presence of siloxane at the interface destroys the original spatial correlation and stability and weakens capillary adsorption, which further slows down the transfer of the water molecules.
Author Contributions
Conceptualization, S.L. and D.H.; Methodology, W.Z.; Software, S.Z.; Formal Analysis, B.Y.; Investigation, Y.G.; Resources, X.L.; Writing—Original Draft Preparation, W.Z.; Writing—Review and Editing, S.L.
Funding
Financial support from the National Natural Science Foundation of China (Nos. 51778308, 51308316, 51420105015), the State Key Laboratory of Silicate Materials for Architectures (Wuhan University of Technology) (SYSJJ2016-06).
Acknowledgments
The Cooperative Innovation Center of Engineering Construction and Safety in the Shandong Blue Economic Zone is gratefully acknowledged.
Conflicts of Interest
The authors declare no conflict of interest.
References
- Dong, B.; Qiu, Q.; Gu, Z.; Xiang, J.; Huang, C.; Fang, Y.; Xing, F.; Liu, W. Characterization of carbonation behavior of fly ash blended cement materials by the electrochemical impedance spectroscopy method. Cem. Concr. Compos. 2016, 65, 118–127. [Google Scholar] [CrossRef]
- Hou, D.; Zhao, T.; Ma, H.; Li, Z. Reactive molecular simulation on water confined in the nanopores of the calcium silicate hydrate gel: Structure, reactivity, and mechanical properties. J. Phys. Chem. C 2015, 119, 1346–1358. [Google Scholar] [CrossRef]
- Šavija, B.; Luković, M. Carbonation of cement paste: Understanding, challenges, and opportunities. Constr. Build. Mater. 2016, 117, 285–301. [Google Scholar] [CrossRef]
- Zhang, J.; Liu, C.; Sun, M.; Li, Z. An innovative corrosion evaluation technique for reinforced concrete structures using magnetic sensors. Constr. Build. Mater. 2017, 135, 68–75. [Google Scholar] [CrossRef]
- Papadakis, V.G.; Vayenas, C.G.; Fardis, M.N. Physical and chemical characteristics affecting the durability of concrete. Mater. J. 1991, 88, 186–196. [Google Scholar]
- Grattan-Bellew, P. Microstructural investigation of deteriorated Portland cement concretes. Constr. Build. Mater. 1996, 10, 3–16. [Google Scholar] [CrossRef]
- Hou, D.; Li, Z. Molecular dynamics study of water and ions transported during the nanopore calcium silicate phase: Case study of jennite. J. Mater. Civ. Eng. 2013, 26, 930–940. [Google Scholar] [CrossRef]
- Cailleux, E.; Pollet, V. Investigations on the Development of Self-healing Properties in Protective Coatings for Concrete and Repair Mortars; Belgian Building Research Institute: Limelette, Belgium, 2009. [Google Scholar]
- Ibrahim, M.; Al-Gahtani, A.S.; Maslehuddin, M.; Dakhil, F.H. Use of surface treatment materials to improve concrete durability. J. Mater. Civ. Eng. 1999, 11, 36–40. [Google Scholar] [CrossRef]
- Bertolini, L.; Elsener, B.; Pedeferri, P.; Redaelli, E.; Polder, R. Corrosion of Steel in Concrete; Wiley Online Library: Hoboken, NJ, USA, 2013. [Google Scholar]
- Almusallam, A.A.; Khan, F.M.; Dulaijan, S.U.; Al-Amoudi, O.S.B. Effectiveness of surface coatings in improving concrete durability. Cem. Concr. Compos. 2003, 25, 473–481. [Google Scholar] [CrossRef]
- Christodoulou, C.; Goodier, C.I.; Austin, S.A.; Webb, J.; Glass, G.K. Long-term performance of surface impregnation of reinforced concrete structures with silane. Constr. Build. Mater. 2013, 48, 708–716. [Google Scholar] [CrossRef]
- Hou, D.; Li, Z. Molecular dynamics study of water and ions transport in nano-pore of layered structure: A case study of tobermorite. Microporous Mesoporous Mater. 2014, 195, 9–20. [Google Scholar] [CrossRef]
- Hou, D.; Tao, L.; Pan, W. molecular dynamics study on the structure and dynamics of NaCl solution transport in the nanometer channel of CASH gel. ACS Sustain. Chem. Eng. 2018, 6, 9498–9509. [Google Scholar] [CrossRef]
- Gjørv, O.; Vennesland, Ø. Diffusion of chloride ions from seawater into concrete. Cem. Concr. Res. 1979, 9, 229–238. [Google Scholar] [CrossRef]
- Zhu, Y.G.; Kou, S.C.; Poon, C.S.; Dai, J.G.; Li, Q.Y. Influence of silane-based water repellent on the durability properties of recycled aggregate concrete. Cem. Concr. Compos. 2013, 35, 32–38. [Google Scholar] [CrossRef]
- Hou, D.; Li, D.; Yu, J.; Zhang, P. Insights on capillary adsorption of aqueous sodium chloride solution in the nanometer calcium silicate channel: A molecular dynamics study. J. Phys. Chem. C 2017, 121, 13786–13797. [Google Scholar] [CrossRef]
- Kalinichev, A.G.; Wang, J.; Kirkpatrick, R.J. Molecular dynamics modeling of the structure, dynamics and energetics of mineral–water interfaces: Application to cement materials. Cem. Concr. Res. 2007, 37, 337–347. [Google Scholar] [CrossRef]
- Hou, D.; Ma, H.; Zhu, Y.; Li, Z. Calcium silicate hydrate from dry to saturated state: Structure, dynamics and mechanical properties. Acta Mater. 2014, 67, 81–94. [Google Scholar] [CrossRef]
- McGettigan, E. Silicon-based weatherproofing materials. Concr. Int. 1992, 14, 52–56. [Google Scholar]
- Bonaccorsi, E.; Merlino, S.; Kampf, A.R. The crystal structure of tobermorite 14 Å (plombierite), a C–S–H phase. J. Am. Ceram. Soc. 2005, 88, 505–512. [Google Scholar] [CrossRef]
- Murray, S.J.; Subramani, V.J.; Selvam, R.P.; Hall, K.D. Molecular dynamics to understand the mechanical behavior of cement paste. Transp. Res. Rec. 2010, 2142, 75–82. [Google Scholar] [CrossRef]
- Ma, H.; Hou, D.; Liu, J.; Li, Z. Estimate the relative electrical conductivity of C–S–H gel from experimental results. Constr. Build. Mater. 2014, 71, 392–396. [Google Scholar] [CrossRef]
- Ma, H.; Li, Z. Realistic pore structure of Portland cement paste: Experimental study and numerical simulation. Comput. Concr. 2013, 11, 317–336. [Google Scholar] [CrossRef]
- Yang, J.; Jia, Y.; Hou, D.; Wang, P.; Jin, Z.; Shang, H.; Li, S.; Zhao, T. Na and Cl immobilization by size controlled calcium silicate hydrate nanometer pores. Constr. Build. Mater. 2019, 202, 622–635. [Google Scholar] [CrossRef]
- Yu, J.; Zheng, Q.; Hou, D.; Zhang, J.; Li, S.; Jin, Z.; Wang, P.; Yin, B.; Wang, X. Insights on the capillary transport mechanism in the sustainable cement hydrate impregnated with graphene oxide and epoxy composite. Compos. Part B Eng. 2019, 173, 106907. [Google Scholar] [CrossRef]
- Cygan, R.T.; Greathouse, J.A.; Heinz, H.; Kalinichev, A.G. Molecular models and simulations of layered materials. J. Mater. Chem. 2009, 19, 2470–2481. [Google Scholar] [CrossRef]
- Cygan, R.T.; Liang, J.-J.; Kalinichev, A.G. Molecular models of hydroxide, oxyhydroxide, and clay phases and the development of a general force field. J. Phys. Chem. B 2004, 108, 1255–1266. [Google Scholar] [CrossRef]
- Berendsen, H.J.; Postma, J.P.; van Gunsteren, W.F.; Hermans, J. Interaction models for water in relation to protein hydration. In Intermolecular Forces; Springer: Dordrecht, The Netherlands, 1981; pp. 331–342. [Google Scholar]
- Dauber-Osguthorpe, P.; Roberts, V.A.; Osguthorpe, D.J.; Wolff, J.; Genest, M.; Hagler, A.T. Structure and energetics of ligand binding to proteins: Escherichia coli dihydrofolate reductase-trimethoprim, a drug-receptor system. Proteins 1988, 4, 31–47. [Google Scholar] [CrossRef]
- Asensio, J.L.; Martin-Pastor, M.; Jimenez-Barbero, J. The use of CVFF and CFF91 force fields in conformational analysis of carbohydrate molecules. Comparison with AMBER molecular mechanics and dynamics calculations for methyl α-lactoside. Int. J. Biol. Macromol. 1995, 17, 137–148. [Google Scholar] [CrossRef]
- Plimpton, S.; Crozier, P.; Thompson, A. LAMMPS-large-scale atomic/molecular massively parallel simulator. Sandia Natl. Lab. 2007, 18, 43. [Google Scholar]
- Yan, L.M.; Zhu, S.H. Theory and Practice of Molecular Dynamics Simulation; Science Press: Beijing, China, 2013. [Google Scholar]
- Hou, D.; Li, Z.; Zhao, T.; Zhang, P. Water transport in the nano-pore of the calcium silicate phase: Reactivity, structure and dynamics. Phys. Chem. Chem. Phys. 2015, 17, 1411–1423. [Google Scholar] [CrossRef]
- Zhao, T.J. Translucent Coating Surface Treatment and Concrete Durability; Science Press: Beijing, China, 2009. [Google Scholar]
- Zhang, C. Preparation of Silane Emulsion/Silica Sol Waterproof Material and Its Effect on Concrete Durability. Master’s Thesis, Qingdao University of Technology, Qingdao, China, June 2015. [Google Scholar]
- Zhang, X.Y. Preparation of Silane Protective Materials for Concrete and Its Effect on Concrete Durability. Master’s Thesis, Qingdao University of Technology, Qingdao, China, June 2014. [Google Scholar]
© 2019 by the authors. Licensee MDPI, Basel, Switzerland. This article is an open access article distributed under the terms and conditions of the Creative Commons Attribution (CC BY) license (http://creativecommons.org/licenses/by/4.0/).