Article

Detection of Volatile Organic Compounds Using Surface Acoustic Wave Sensor Based on Nanoparticles Incorporated in Polymer

by
Izabela Constantinoiu
and
Cristian Viespe
*
Laser Department, National Institute for Laser, Plasma and Radiation Physics, 077125 Magurele, Romania
*
Author to whom correspondence should be addressed.
Coatings 2019, 9(6), 373; https://doi.org/10.3390/coatings9060373
Submission received: 7 May 2019 / Revised: 4 June 2019 / Accepted: 6 June 2019 / Published: 8 June 2019

Abstract

:
In this work, surface acoustic wave (SAW) sensors with two types of polymer sensing films, polyethyleneimine (PEI) and polydimethylsiloxane (PDMS), containing embedded ZnO, TiO2, and WO3 nanoparticles (NPs) for detecting volatile organic compounds (VOCs) were produced and studied. The NPs were obtained using the pulsed laser ablation method, with the same deposition conditions used for all three materials studied. After incorporation of the NPs into the polymer, the suspension obtained was deposited using the airbrush method onto the quartz substrate of the sensor. Sensors were tested for four types of VOCs: Ethanol, toluene, acetone, and dichloroethane. Those based on PEI-sensitive films showed a superior sensitivity to those with PDMS. It was also found that the sensors with WO3 NPs had the best results for ethanol, acetone, and dichloroethane. The limit of detection (LOD) of the PEI/WO3 sensor was 6 ppm for ethanol, 15 ppm for acetone, and 9 ppm for dichloroethane. For toluene, the best response was obtained using the PEI/ZnO sensor, which produced a LOD of 9 ppm.

1. Introduction

Human health, a subject of great interest to our society today, depends to a large extent on the quality of the environment. An environment with a polluted atmosphere leads to the occurrence of lung diseases, skin diseases, and other more dangerous diseases such as cancer and diabetes [1,2]. By monitoring air quality, a number of these diseases can be prevented. In this context, the development of sensors capable of detecting substances harmful to the human body at ambient temperatures is currently a field of considerable importance.
Volatile organic compounds (VOCs) are part of a class of carbon-based chemical substances that volatilize very easily at room temperature and pressure. They enter the atmosphere through industrial processes, building materials, household or personal cleaning products, cosmetics, paints, varnishes, and waxes, etc. Some examples of VOCs are chlorofluorocarbons, benzene, toluene, methylene chloride, dichloromethane, dichloroethane, acetone, ethanol, and methanol [3,4,5].
Several types of sensors for VOC detection have been developed so far, including capacitive [5] and resistive [6] gas sensors, chemical sensors [7], potentiometric sensors [8], and surface acoustic waves sensors (SAW) [9].
The SAW sensor is characterized by very good sensitivity, selectivity, and reversibility, as well as a short response time, low cost, and ease of manufacturing and wireless operation [10,11]. Some types of materials used in SAW-sensor-sensitive films are oxides, polymers, and composites consisting of nanoparticles (NPs) embedded in polymers [9,11,12,13,14,15,16].
The use of polymer/NP composites leads to improved sensor properties due to the synergistic effect of the sensitivities of their components. The sensitivity of polymeric films may be explained by the large number of functional groups linked in the polymeric chain that can interact with the gas molecules. Some of the polymers most commonly used in gas detection are polyethyleneimine, polyepichlorohydrin, polydimethylsiloxane, and polyisobutylene [16,17]. The great sensitivity of the NPs is given by their high specific surface area, which is inversely proportional to their size, for the same total mass, and it has been demonstrated that sensors with nanoparticles embedded in polymers have provided better results than those without nanoparticles [9]. Among the most well-known oxides with applications in sensors for VOC detection are SnO2, WO3, ZnO, TiO2, Co3O4, TeO2, and In2O3 [11,13,14]. These oxides interact with different reducing or oxidizing gases through chemisorption or redox reactions [11].
In addition to being made available via chemical synthesis methods, oxide NPs can be obtained by physical synthesis methods such as pulsed laser deposition (PLD). PLD allows for control of NP morphology and produces NPs with high purity [18,19].
Some of the methods by which polymer/NP suspensions can be deposited are spin coating, air brushing, and drop casting [9,20]. Airbrushing contributes to the uniform distribution of NPs on the surface of the film and also favors more rapid evaporation of the solvent.
This paper describes the fabrication of SAW sensors for the detection of VOCs. The novelty of this article is its comparison of the responses of SAW sensors with sensitive films of two types of polymers and sensitive films of polymers with embedded nanoparticles. Sensors were tested in the presence of four VOCs: ethanol, toluene, acetone, and dichloroethane. The role of NPs in determining the performance of sensors, namely with regard to their frequency shift, sensitivity, and limit of detection (LOD), was investigated.

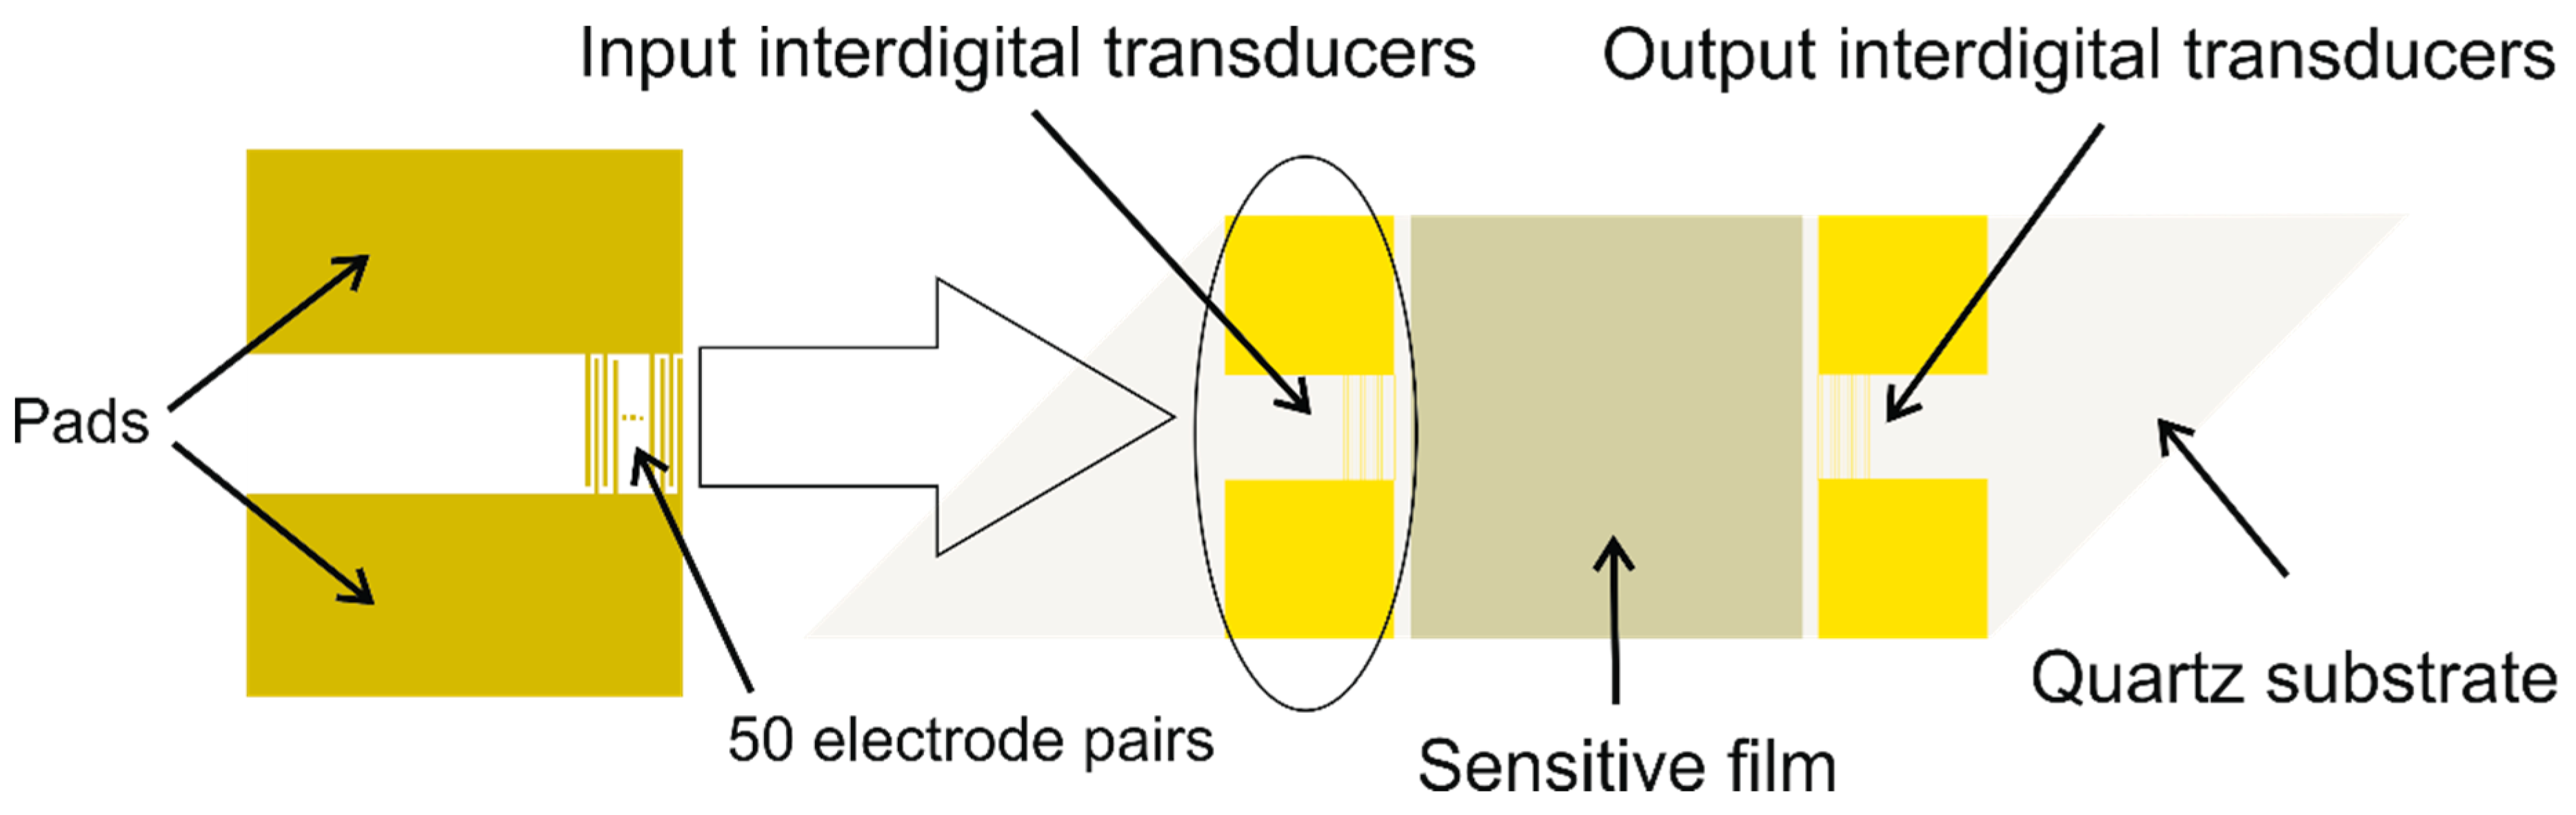
2. Materials and Methods

The NPs were produced by laser ablation using a Nd-YAG laser (EKSPLA NL301HT, Ekspla, Vilnius, Lithuania) with pulse durations of 5 ns and a repetition rate of 10 Hz. A laser wavelength of 532 nm and energies per pulse of 160 MJ were used to obtain the NPs in an irradiation chamber with a controlled O2 atmosphere. The laser beam was focused, leading to a fluence of 14.5 J/cm2 on the target surface.
The ablation was made using ZnO, TiO2, and WO3 targets (all from Goodfellow). The resulting NPs were collected on membranes (Merck Millipore Isopore, Darmstadt, Germany, 0.1 µm pore size) placed 35 mm from the target, at room temperature.
A high vacuum was obtained in the irradiation chamber prior to deposition using a vacuum system consisting of a preliminary pump (Pfeiffer, Asslar, Germany, PK D44 725) and a turbomolecular pump (Pfeiffer PMP02830). The NPs were obtained using an oxygen flow of 500 standard cubic centimeter per minute (SCCM), which was achieved using a valve (MKS, Munchen, Germany, Tru digital mass-Flo 1179B, 1000 SCCM maximum flux), connected to a controller (MKS multigas 647). The pressure in the chamber during deposition was maintained at 160 Torr by a system which included a “throttle valve” (MKS 253B) and a controller (MKS 600) connected to a preliminary vacuum pump (Agilent Varian–DS602, Leini, Italy).
According to Figure 1, the acoustic wave from the interdigital transducers travels at the quartz surface of the sensor on which the sensitive thin film is located. When a mass, mechanical, and/or electrical change occurs at the surface of the film, the oscillation frequency of the system is disturbed.
The SAW sensor was a “delay-line” type. It was designed as a two-port resonator and fabricated on an ST-X cut quartz substrate with an oscillating frequency of ~69 MHz. The gold interdigital transducers (IDTs) (~150 nm thickness) were deposited by photolithographic techniques by Nanostructures, Inc. onto chromium layers (~10 nm thickness) to ensure the adhesion of gold to the quartz. The configuration of the IDTs was “double-comb”, which consisted of 50 electrode pairs at the input and output, a 2500 µm acoustic aperture, and a 45.2 µm wavelength. The quartz substrate was cut in a parallelogram geometry (38 mm × 10 mm) with a 45° angle to reduce the reflection of unwanted acoustic waves.
Sensitive sensor layers were deposited via the airbrush spray method. In order to protect the IDTs of the sensors, the IDTs were covered by a mask during deposition. Synthetic air (20% O, 80% N, CnHm < 0.1 ppm) was used as a carrier gas.
The polymers used were commercially available polyethyleneimine (PEI) and polydimethylsiloxane (PDMS) (both from Sigma-Aldrich, St. Louis, MO, USA). The compositions of the sensitive films are presented in Table 1.
The sensitive layers S1 and S5 were obtained by mixing PEI with ethanol and PDMS with toluene, respectively, at a concentration of 10 mg/mL. Sensitive films for the sensors S2, S3, S4, S6, S7, and S8 were obtained by mixing an amount of NPs with the polymer solutions (PEI with ethanol and PDMS with toluene) at the above concentration to obtain a concentration of 0.8 mg/mL, as presented in Table 1. The suspension obtained was sonicated before deposition on the quartz substrate. The thickness of the layers and the roughness measurements were determined using a SURFCOM 180A (Tokyo Seimitsu, Tokyo, Japan).
The set-up used for sensor characterization was composed of a DHPVA-200 FEMTO amplifier (Messtechnik GmbH, Berlin, Germany) and a CNT-91 Pendulum frequency counter (Spectracom Corp, Rochester, NY, USA) connected to a computer with Time View 3 software.
The sensors with composite films were tested at room temperature for four types of volatile organic compounds: ethanol, toluene, acetone, and dichloroethane. Different concentrations of VOCs were injected into the gas mixer chamber. The mixture was obtained as previously described in [9]. The mixture was circulated using a diaphragm pump (Pfeiffer MVP 035-2) and the flow rate of the VOC–air mixture was maintained constant at 150 cm3/s for all the measurements. The sensitivity and the LOD were determined. The sensitivity represented the frequency shift in Hz per unit analyte concentration in ppm and the LOD was defined as three times the noise level per sensitivity [21].
The surface morphology of the films was studied using scanning electron microscopy (SEM)with a field emission scanning electron microscope (JSM-531 Inspect S Electron Scanning Microscope, FEI Company, Tokyo, Japan).

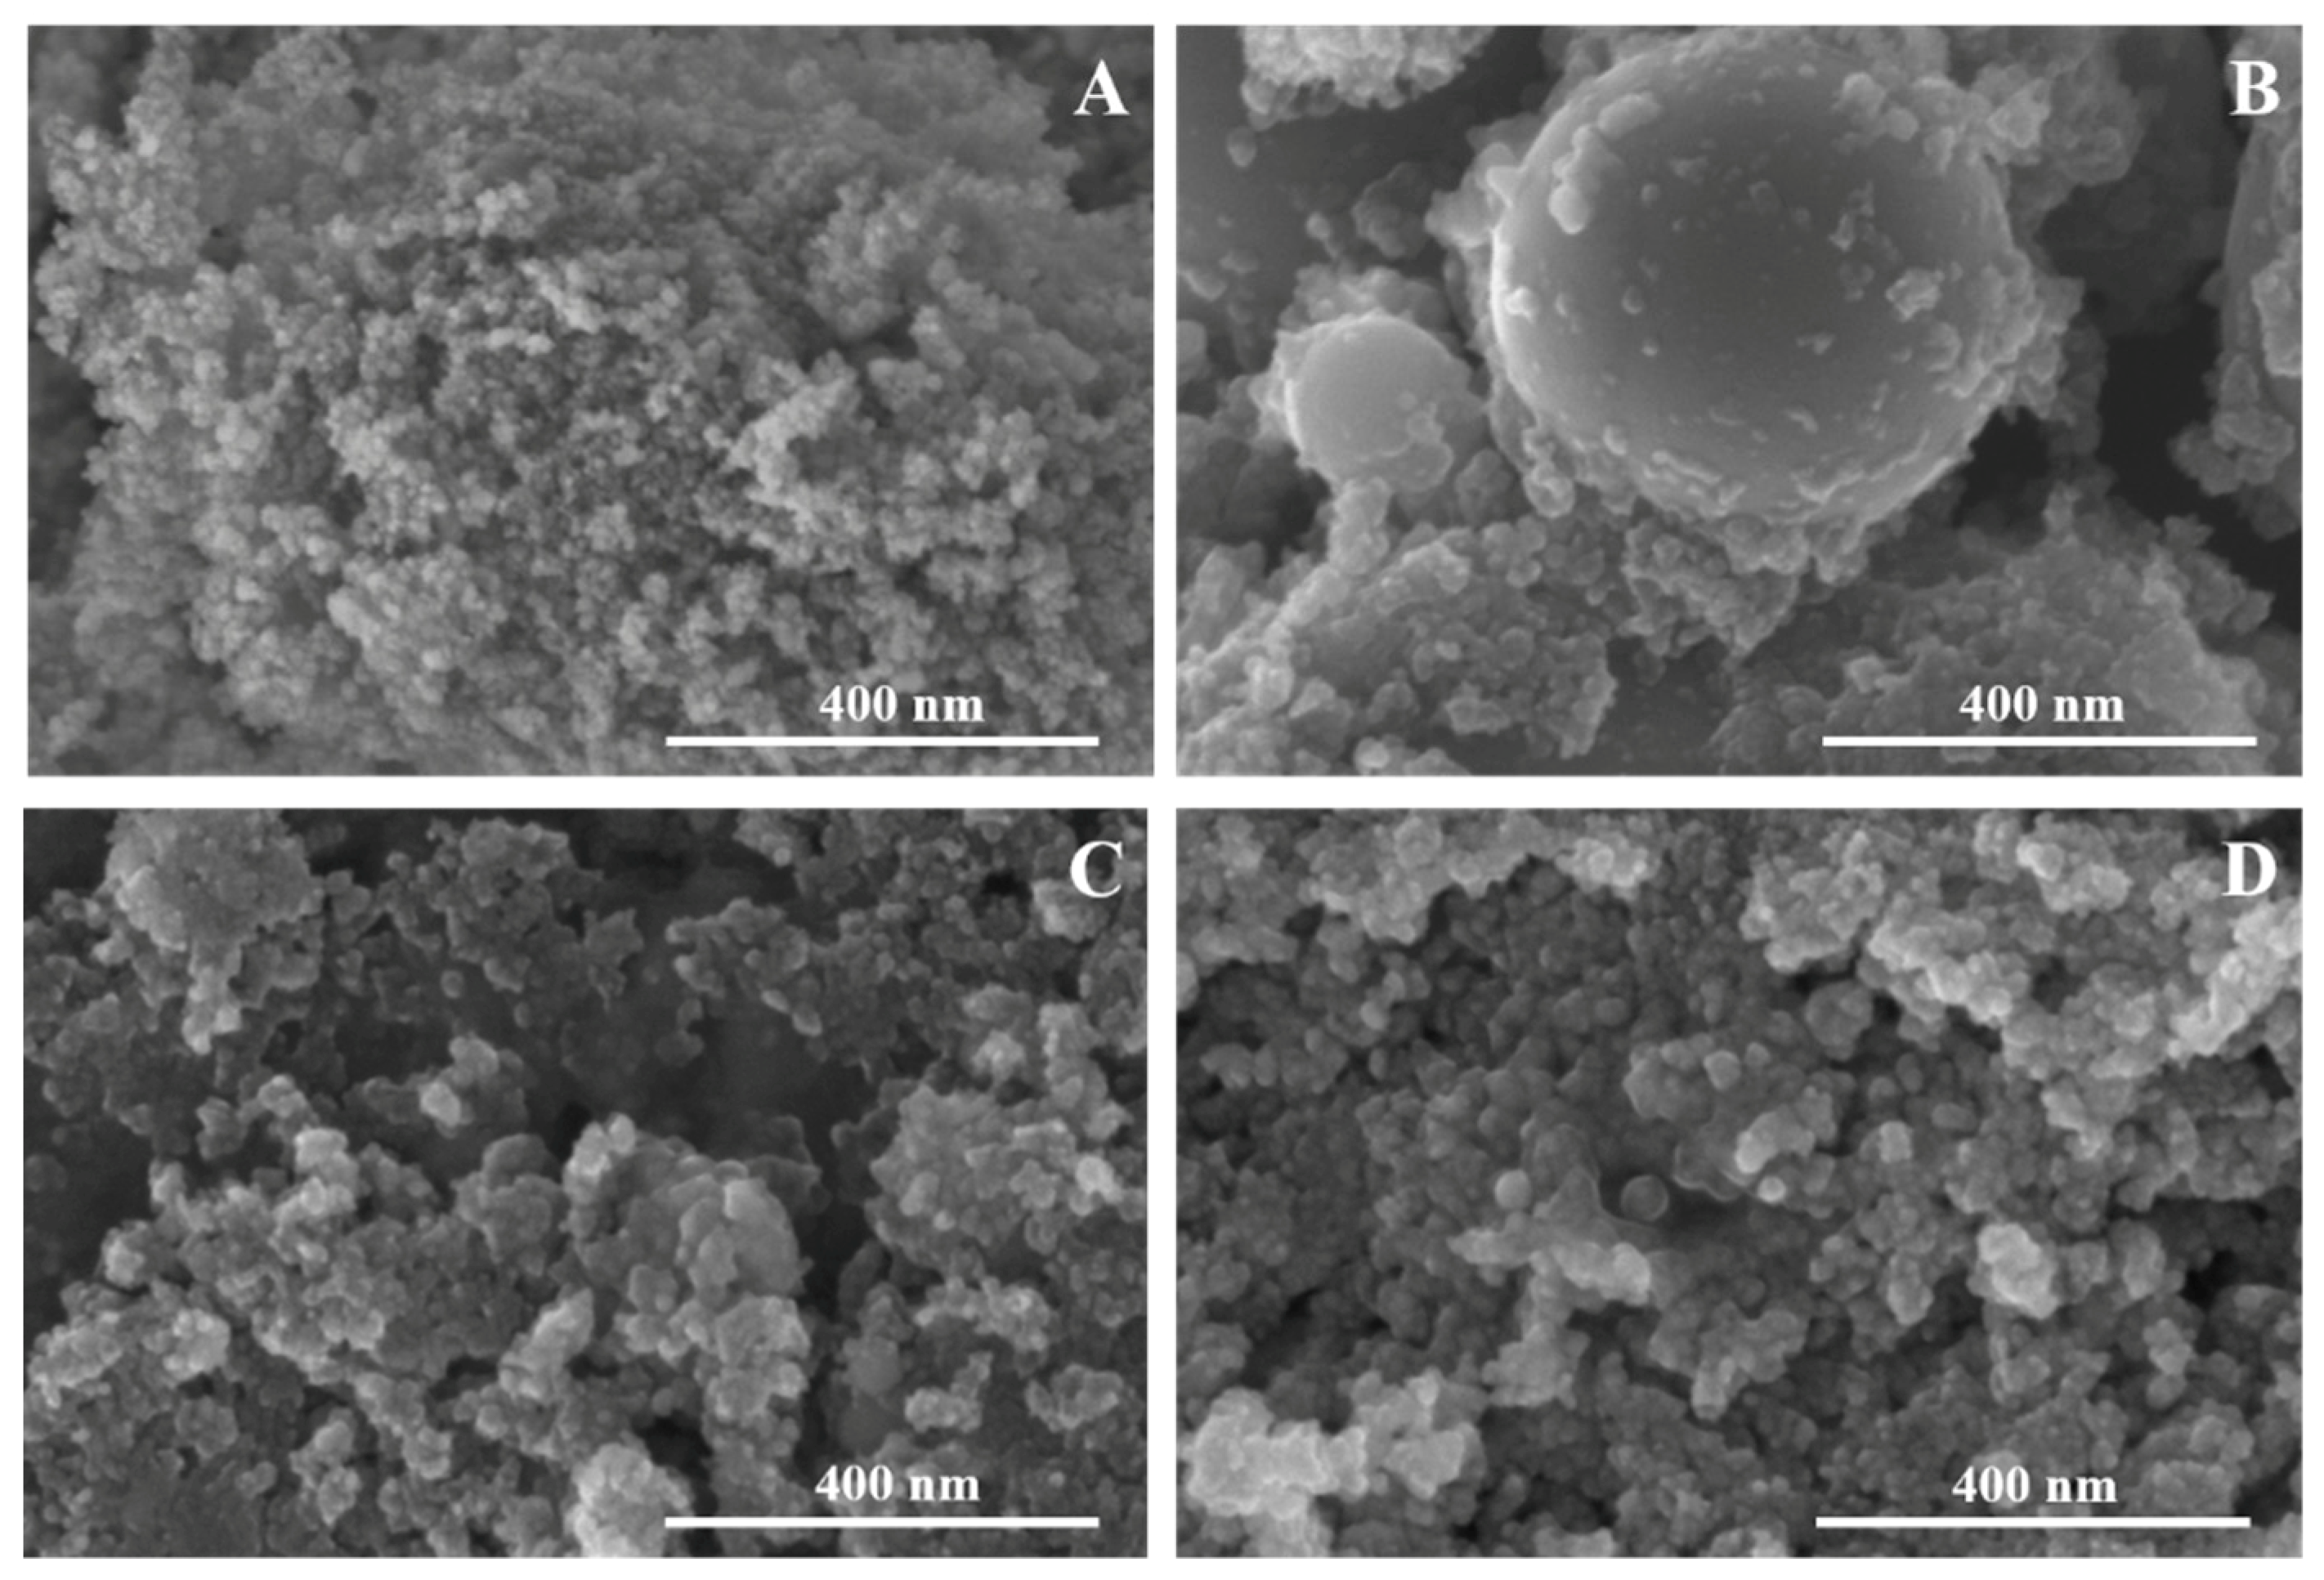
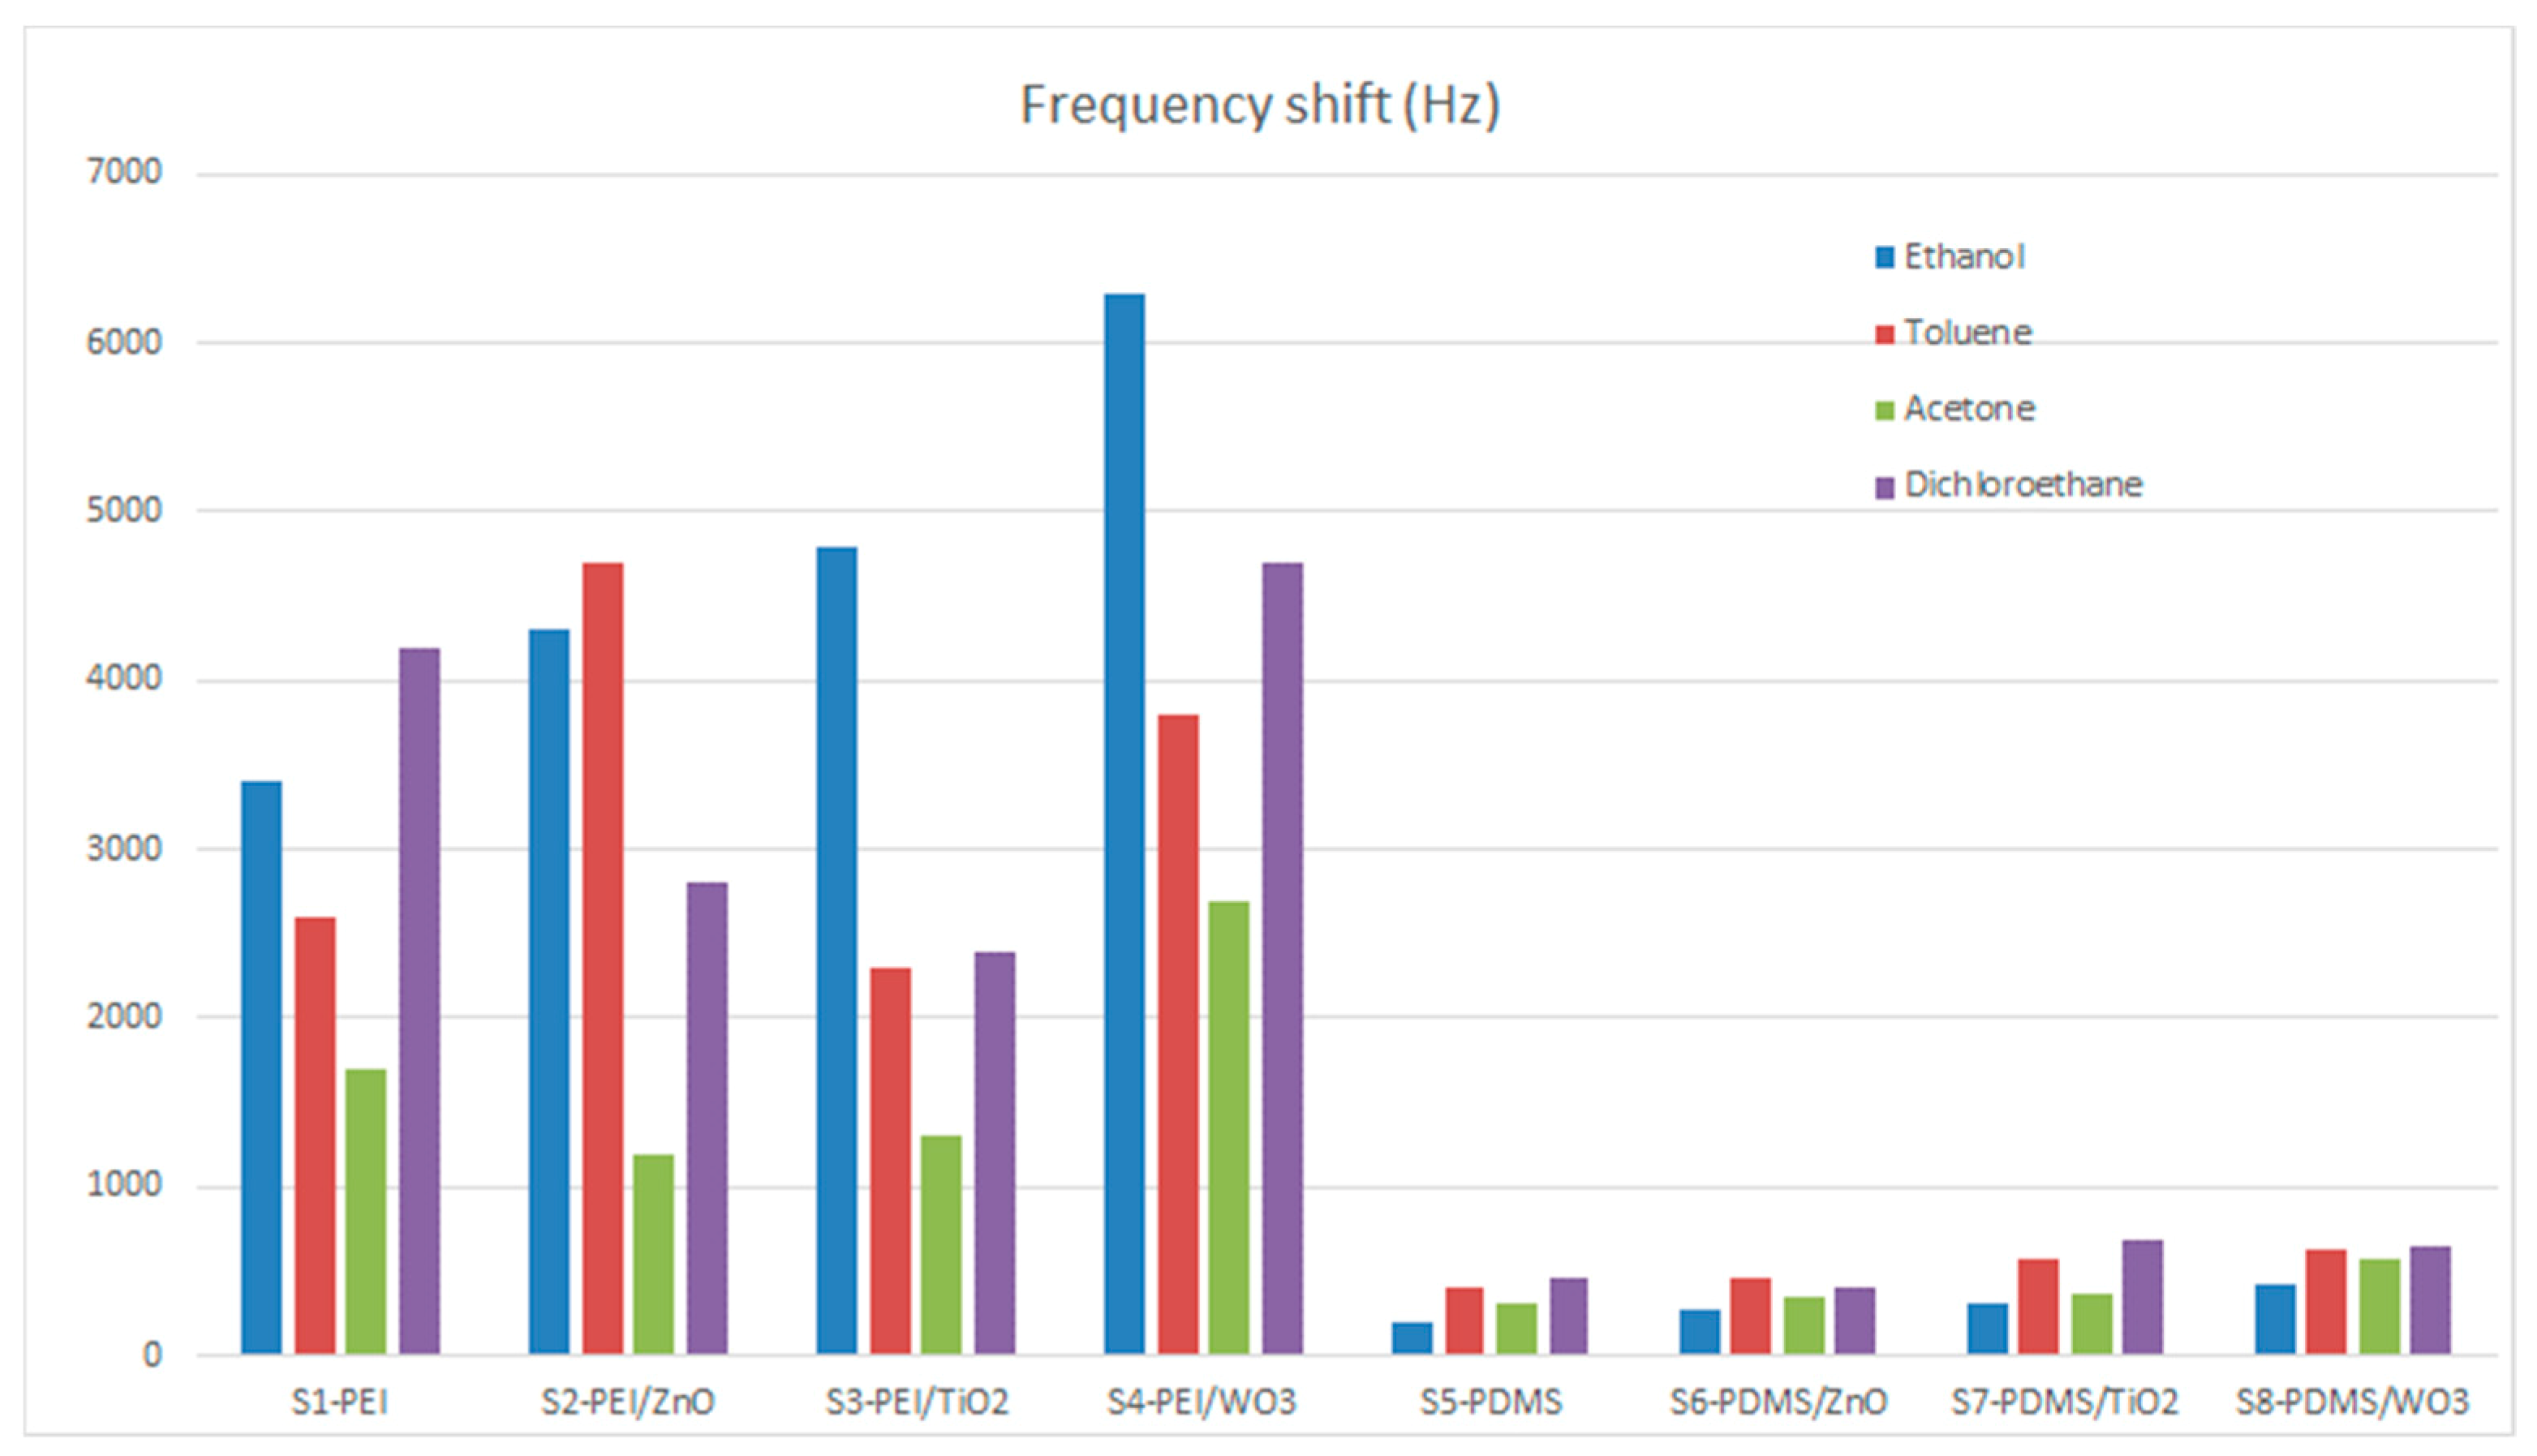
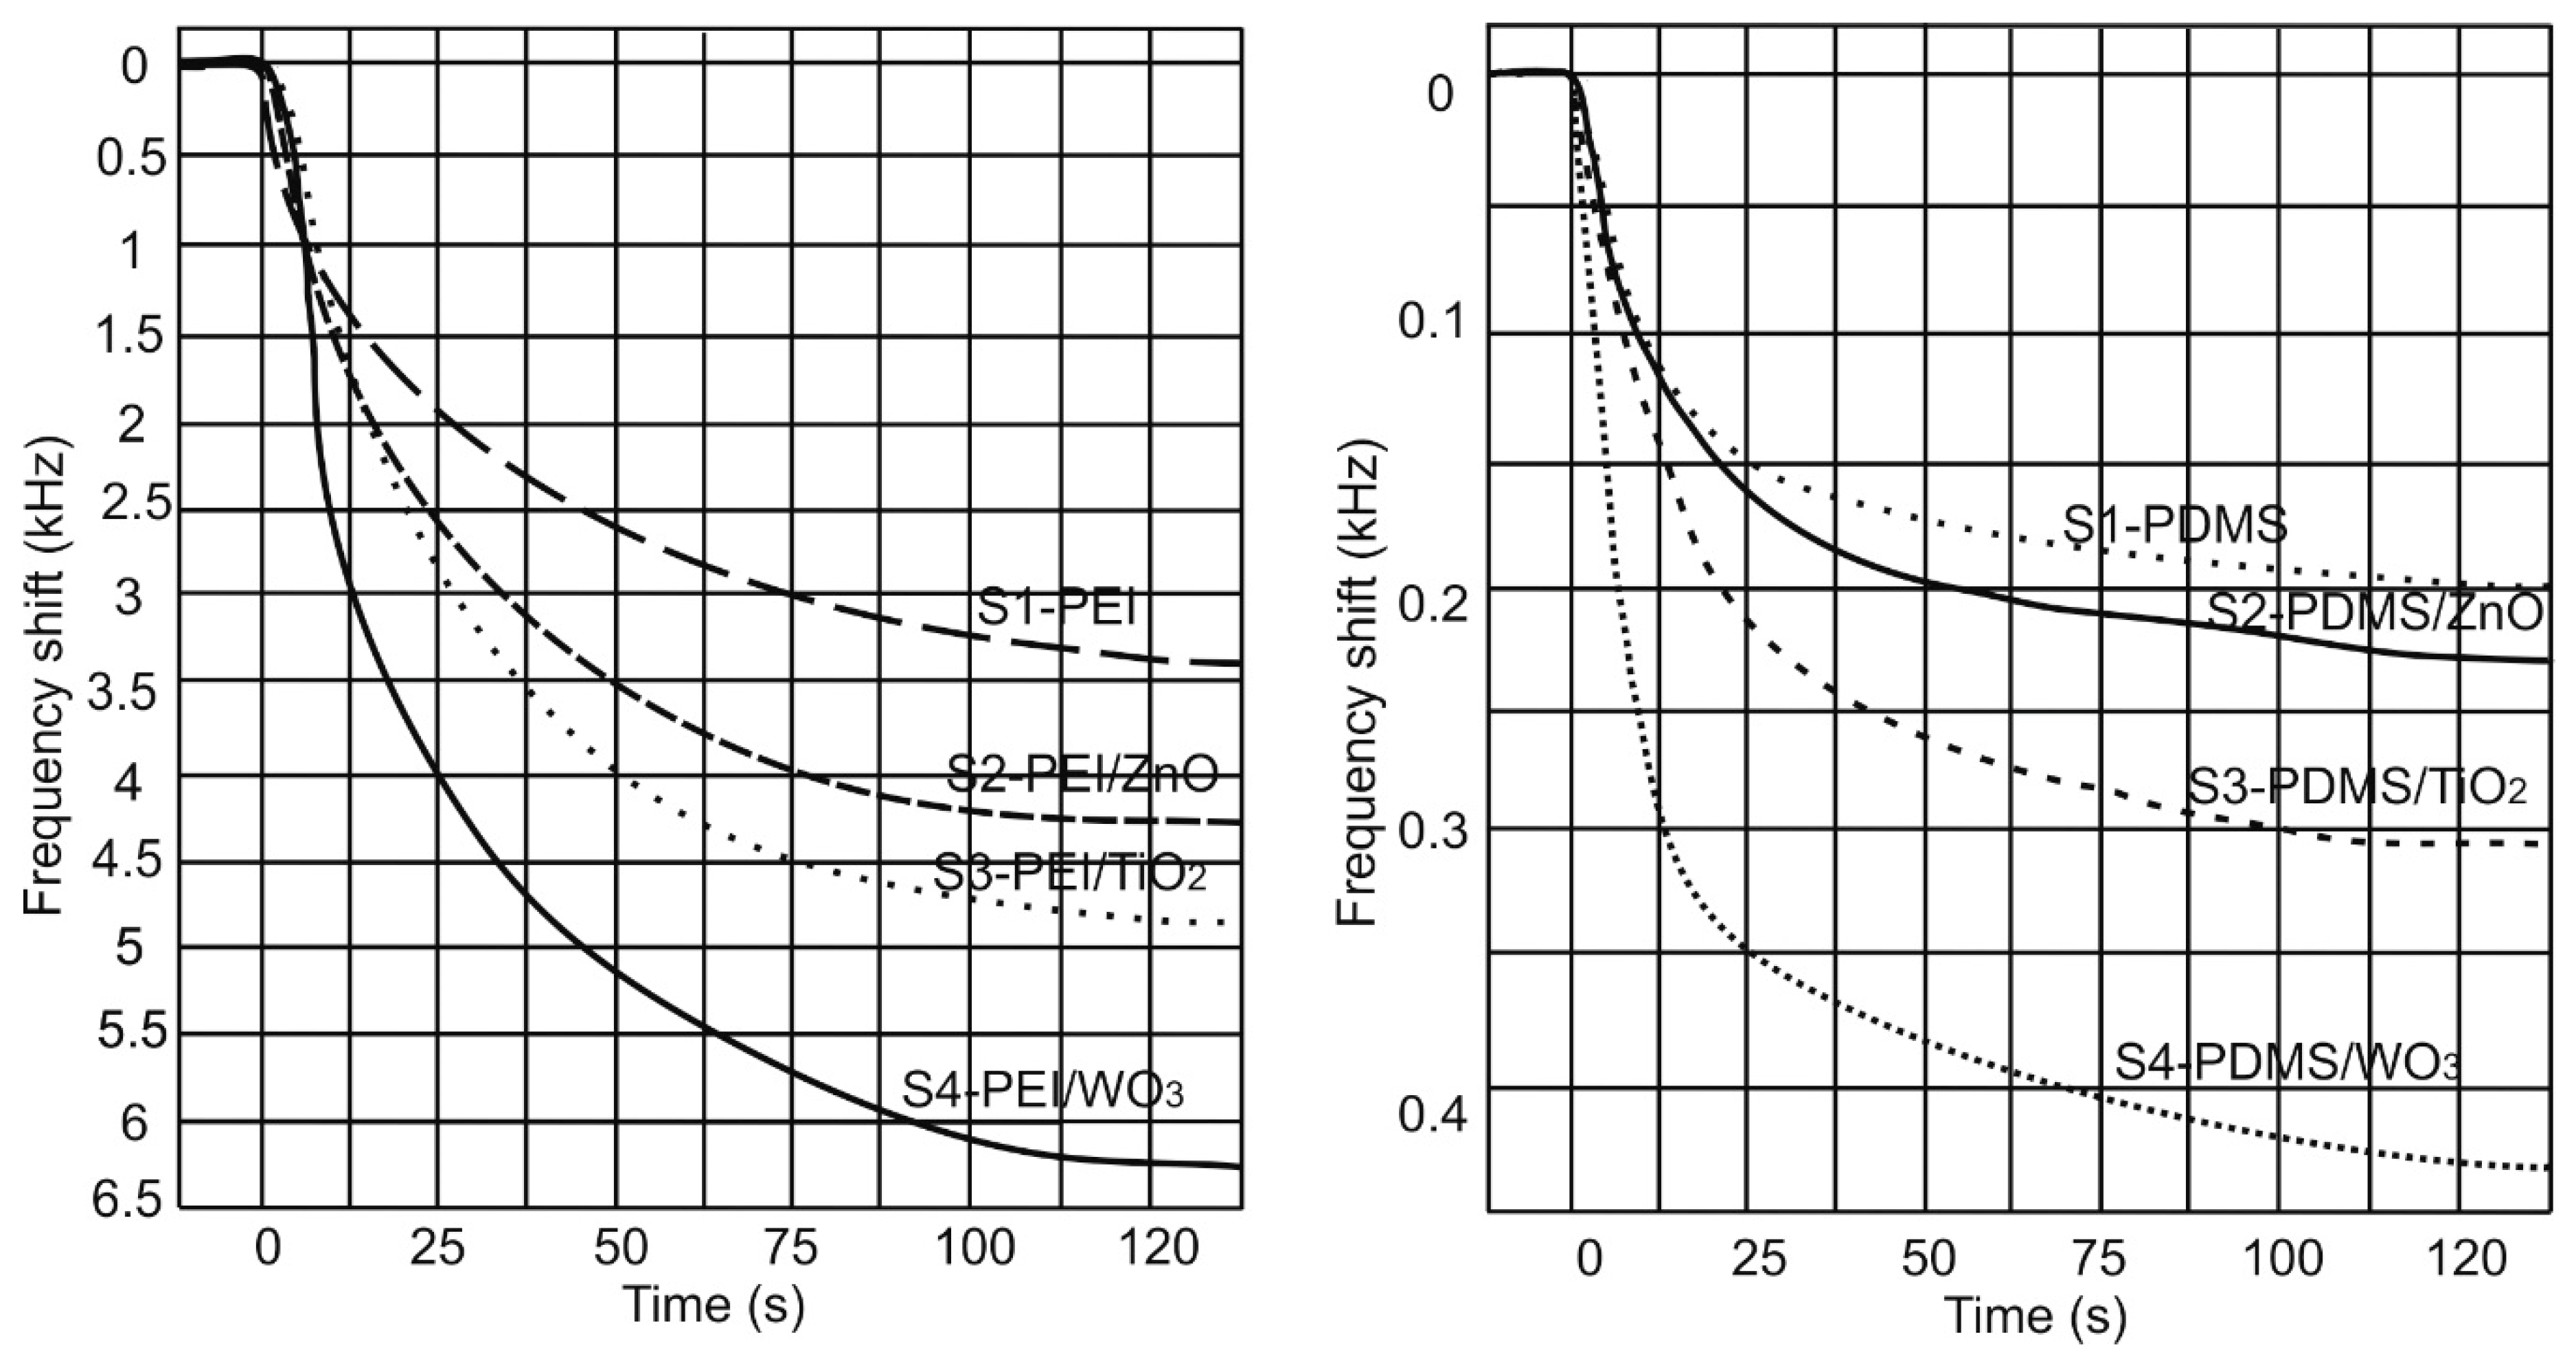
3. Results and Discussion

In SEM images (Figure 2), agglomerates of spherical NPs of different sizes can be observed. ZnO NPs (Figure 2a) have dimensions between 10–20 nm and those of WO3 between 10–30 nm (Figure 2d). In the case of TiO2, the obtained particles had not only nanometric dimensions but also micrometric dimensions (~1 µm) (Figure 2d,c). On grains with micrometric dimensions can be observed 10–20-nm-sized NP (Figure 2b). Several SEM images that confirm the range size of nanoparticles have been added to Supplementary Materials. Since the NP synthesis was performed under the same ablation conditions, these differences in dimensions are related to the nature of the material and the specific behavior during ablation.
The thickness of the polymer films was about 200 nm. By measuring the roughness of the films (Table 2), it was observed that the layers with PEI had a higher roughness than the those with PDMS. The introduction of NPs led to a decrease in film roughness, except for those with TiO2, because of their larger dimensions (~1 µm). This could be explained by the ability of the NPs to reduce the droplet surface tension and to improve the wetting capacity of the quartz surface [22]. The roughness increased the surface interaction of the film with the gas but it also increased the noise level (Table 3). When the propagation wave fronts met irregularities on the surface of the films there was a loss of coherence with a direct effect on the signal-to-noise ratio [21].
Figure 3 shows the frequency shift of the sensors for different VOC concentrations. In the majority of cases the highest frequency shift was obtained for sensors with WO3 NPs, both for PEI and PDMS. This is also confirmed by the LODs of ethanol, acetone, and dichloroethane, calculated in Table 3, which indicate that for the same type of polymer, the smallest values were generated for sensors with WO3 NPs (S4 and S8). One exception is that in the presence of toluene, sensor S2 (Figure 3c) produced the highest frequency shift, as well as the lowest LOD (Table 3). Repeating 10 measurements of the frequency deviation for each of the eight sensors yielded errors below ±4%.
It can also be observed that the responses of S4 and S8 in the presence of acetone (Figure 3e,f) differ by a higher frequency shift from the rest of the sensor responses for this VOC concentration. The sensitive films of sensors S4 and S8 are based on different polymers but both have embedded WO3 NPs. The mechanism of interaction between the WO3 NPs and acetone gas molecules starts from the adsorption of oxygen molecules from air onto the surface of the film. The WO3 NPs interact with oxygen by transferring electrons to oxygen, resulting in the formation of ionic oxygen species as in Equation (1). When a reductive gas (like acetone) reaches the sensor, the gas reacts with the oxygen species and releases electrons into the conduction band. The electrons created, as illustrated in Equation (2), modify the electrical properties of the thin film, producing changes in the acoustic wave propagation mode. Due to its increased adsorption capacity, generated by the presence of functional groups, the polymer also favors the detection of acetone. For PEI sensors it was possible to make determinations at much lower concentrations than those with PDMS because of the strong interaction between the nucleophilic center of the amino group (–NH2) in PEI and the electrophilic center from acetone, which is given by the carbon that forms the double bound (C=O) [23].
Thus, combining the increased adsorption capacity of the polymer with the formation of ionic oxygen species generated by WO3 and the ability of acetone to interact with both species, we can assert that the composite film for the SAW sensor with polymer and WO3 NPs is selective for acetone and not the other VOCs tested [24,25].
O 2   ( g a s ) O 2   ( a d s ) O 2   ( a d s ) + e O 2   ( a d s ) O 2   ( a d s ) + e 2 O ( a d s )
CH 3 COCH 3   ( a d s ) + 8 O ( a d s ) 3 CO 2 + 3 H 2 O + 8 e
Sensor responses were also influenced by the type of polymer used. From Figure 4, which shows the response of the sensors to the four gases at a concentration of 800 ppm, a major difference in the frequency shift between the two types of polymers used can be observed. For the PEI sensors in comparison with the PDMS sensors, the frequency shift is about 10 times higher. This result may also be explained by the presence of amino groups (–NH2) in PEI, which act as a nucleophilic center that very easily attacks carbon atoms from VOCs [23].
The response time for the ethanol concentration of 800 ppm (Figure 5) was between 60–75 s for sensors with PEI and between 50–60 s for sensors with PDMS. The type of nanoparticle did not have a considerable effect on the response times of the sensors.

4. Conclusions

In this work, SAW sensors with composite sensitive films composed of polymers (PEI and PDMS) and NPs for VOC detection were fabricated. Oxide NPs were obtained by laser ablation and their morphology was investigated by SEM. ZnO and WO3 NPs were obtained with dimensions of approximately 10–30 nm; for TiO2 both nanometric and micrometric particles were generated. Sensitivity measurements were made for four VOCs, namely, ethanol, toluene, acetone, and dichloroethane. The results indicated that PEI has a sensitivity which is about 10 times higher than PDMS and that the sensors with WO3 NPs (S4 and S8) had the best sensitivity for almost all types of gases tested. For ethanol, acetone, and dichloroethane, the best results were obtained with the S4 sensor, which produced LODs of 6, 15, and 9, ppm respectively. For toluene, the best result was obtained with S2 sensor, which produced a LOD of 9 ppm. It was also established that sensing films based on polymer-based composites containing WO3 NPs provide selectivity for acetone.

Supplementary Materials

The following are available online at https://www.mdpi.com/2079-6412/9/6/373/s1, Figure S1: SEM image for TiO2, Figure S2: SEM image for TiO2, Figure S3: SEM image for WO3, Figure S4: SEM image for WO3, Figure S5: SEM image for ZnO, Figure S6: SEM image for ZnO.

Author Contributions

I.C. contributed to writing—original draft preparation. C.V. contributed to sensor development and experiment design and detection measurements. I.C. contributed to sample morphological analysis. Conceptualization, writing—review and editing, and methodology were contributed to by C.V. and I.C.

Funding

This work was supported by a grant from the Romanian Ministry of Research and Innovation, CCCDI-UEFISCDI, project number PN-III-P1-1.2-PCCDI-2017-0172/15PCCDI and project NUCLEU 16N/08.02.2019.

Acknowledgments

The authors want to thank Gianina Popescu Pelin for the SEM analysis and Dana Miu for her feedback regarding this work.

Conflicts of Interest

The authors declare no conflict of interest.

References

  1. Zhao, Q.; Wang, Q.; Li, Y.; Ning, P.; Tian, S. Influence of volatile organic compounds (VOCs) on pulmonary surfactant monolayers at air-water interface: Implication for the pulmonary health. Colloids Surf. A-Physicochem. Eng. Asp. 2019, 562, 402–408. [Google Scholar] [CrossRef]
  2. Duffy, E.; Morrin, A. Endogenous and microbial volatile organic compounds in cutaneous health and disease. Trac-Trends Anal. Chem. 2019, 111, 163–172. [Google Scholar] [CrossRef]
  3. Cincinelli, A.; Martellini, T. Indoor air quality and health. Int. J. Environ. Res. Public Health 2017, 14, 1286. [Google Scholar] [CrossRef] [PubMed]
  4. Chang, Y.; Tang, N.; Qu, H.; Liu, J.; Zhang, D.; Zhang, H.; Pang, W.; Duan, X. Detection of volatile organic compounds by self-assembled monolayer coated sensor array with concentration-independent fingerprints. Sci. Rep. 2016, 6, 23970. [Google Scholar] [CrossRef] [PubMed]
  5. Zeinali, S.; Homayoonnia, S.; Homayoonnia, G. Comparative investigation of interdigitated and parallel-plate capacitive gas sensors based on Cu-BTC nanoparticles for selective detection of polar and apolar VOCs indoors. Sens. Actuator B–Chem. 2019, 278, 153–164. [Google Scholar] [CrossRef]
  6. Liu, Z.; Yang, T.; Dong, Y.; Wang, X. A room temperature VOCs gas sensor based on a layer by layer multi-walled carbon nanotubes/poly-ethylene glycol composite. Sensors 2018, 18, 3113. [Google Scholar] [CrossRef]
  7. Szulczynski, B.; Gebicki, J. Currently commercially available chemical sensors employed for detection of volatile organic compounds in outdoor and indoor air. Environments 2017, 4, 21. [Google Scholar] [CrossRef]
  8. Sadaoka, Y.; Mori, M. Detection of VOC in air with a planar-type potentiometric gas sensor based on YSZ with a Pt electrode modified with TiO2. Sens. Actuator B–Chem. 2017, 248, 878–885. [Google Scholar] [CrossRef]
  9. Viespe, C.; Miu, D. Characteristics of surface acoustic wave sensors with nanoparticles embedded in polymer sensitive layers for VOC detection. Sensors 2018, 18, 2401. [Google Scholar] [CrossRef]
  10. Viespe, C. Surface acoustic wave sensors based on nanoporous films for hydrogen detection. Key Eng. Mater. 2014, 605, 331–334. [Google Scholar] [CrossRef]
  11. Devkota, J.; Ohodnicki, P.R.; Greve, D.W. SAW sensors for chemical vapors and gases. Sensors 2017, 17, 801. [Google Scholar] [CrossRef] [PubMed]
  12. Marcu, A.; Viespe, C. Surface acoustic wave sensors for Hydrogen and Deuterium detection. Sensors 2017, 17, 1417. [Google Scholar] [CrossRef] [PubMed]
  13. Lee, I.; Choi, S.J.; Park, K.M.; Lee, S.S.; Choi, S.; Kim, I.D.; Park, C.O. The stability, sensitivity and response transients of ZnO, SnO2 and WO3 sensors under acetone, toluene and H2S environments. Sens. Actuator B–Chem. 2014, 197, 300–307. [Google Scholar] [CrossRef]
  14. Mirzaei, A.; Leonardi, S.G.; Neri, G. Detection of hazardous volatile organic compounds (VOCs) by metal oxide nanostructures—Based gas sensors: A review. Ceram. Int. 2016, 42, 15119–15141. [Google Scholar] [CrossRef]
  15. Viespe, C.; Miu, D. Surface acoustic wave sensor with Pd/ZnO bilayer structure for room temperature Hydrogen detection. Sensors 2017, 17, 1529. [Google Scholar] [CrossRef]
  16. Benetti, M.; Cannatà, D.; Verona, E.; Palla Papavlu, A.; Dinca, V.C.; Lippert, T.; Dinescu, M.; Di Pietrantonio, F. Highly selective surface acoustic wave e-nose implemented by laser direct writing. Sens. Actuator B–Chem. 2019, 283, 154–162. [Google Scholar] [CrossRef]
  17. Torino, S.; Conte, L.; Iodice, M.; Coppola, G.; Prien, R.D. PDMS membranes as sensing element in optical sensors for gas detection in water. Sens. Biosensing Res. 2017, 16, 74–78. [Google Scholar] [CrossRef]
  18. Kim, M.; Osone, S.; Kim, T.; Higashi, H.; Seto, T. Synthesis of nanoparticles by laser ablation: A review. KONA Powder Part. J. 2017, 34, 80–90. [Google Scholar] [CrossRef]
  19. De Vero, J.C.; Jasmin, A.C.; Dasallas, L.L.; Garcia, W.O.; Sarmago, R.V. Synthesis of iron oxide nanostructures via carbothermal reaction of Fe microspheres generated by infrared pulsed laser ablation. Coatings 2019, 9, 179. [Google Scholar] [CrossRef]
  20. Vidap, R.V.; Mathe, V.L.; Shahane, G.S. Structural, optical and gas sensing properties of spin coated nanocrystalline zinc oxide thin films. J. Mater. Sci.–Mater. Electron 2013, 24, 3170–3174. [Google Scholar] [CrossRef]
  21. Ballantine, D.S.; White, R.M.; Martin, S.J.; Rico, A.J.; Frye, G.C.; Zellers, E.T.; Wohltjen, H. Acoustic Wave Sensors: Theory, Design, and Physico-Chemical Applications; Academic Press: San Diego, CA, USA, 1997; pp. 31–35. [Google Scholar]
  22. Viespe, C.; Grigoriu, C. Surface acoustic wave sensors with carbon nanotubes and SiO2/Si nanoparticles based nanocomposites for VOC detection. Sens. Actuator B–Chem. 2010, 147, 43–47. [Google Scholar] [CrossRef]
  23. Zhao, Q.; He, Z.; Jiang, Y.; Yuan, Z.; Wu, H.; Su, C.; Tai, H. Enhanced acetone-sensing properties of PEI thin film by GO-NH2 functional groups modification at room temperature. Front. Mater. 2019, 5, 82. [Google Scholar] [CrossRef]
  24. Zhang, H.; Liu, Z.; Yang, J.; Guo, W.; Zhu, L.; Zheng, W. Temperature and acidity effects on WO3 nanostructures and gas-sensing properties of WO3 nanoplates. Mater. Res. Bull. 2014, 57, 260–267. [Google Scholar] [CrossRef]
  25. Wei, S.; Zhao, G.; Du, W.; Tian, Q. Synthesis and excellent acetone sensing properties of porous WO3 nanofibers. Vacuum 2016, 124, 32–39. [Google Scholar] [CrossRef]
Figure 1. Scheme of a surface acoustic wave (SAW) sensor delay line. The identical input and output interdigital transducers (IDTs) are shown in the inset. The IDTs were detailed with the pads on which the contact threads were made.
Coatings 09 00373 g001
Figure 2. SEM images for ZnO (a), TiO2 (b,c), and WO3 (d) NPs made by pulsed laser deposition (PLD).
Coatings 09 00373 g002
Figure 3. Frequency shift of the sensors for different concentrations of ethanol (a,b), toluene (c,d), acetone (e,f), and dichloroethane (g,h).
Coatings 09 00373 g003
Figure 4. Frequency shifts of sensors at 800 ppm concentrations of ethanol, toluene, acetone, and dichloroethane.
Coatings 09 00373 g004
Figure 5. Response time of the sensors at an ethanol concentration of 800 ppm.
Coatings 09 00373 g005
Table 1. The composition of sensitive layers of the sensors studied. Legend: NP, nanoparticle; PEI, polyethyleneimine; PDMS, polydimethylsiloxane.
Sensor NamePolymerSolvent for PolymersNP
S1PEIEthanol
S2PEIEthanolZnO
S3PEIEthanolTiO2
S4PEIEthanolWO3
S5PDMSToluene
S6PDMSTolueneZnO
S7PDMSTolueneTiO2
S8PDMSTolueneWO3
Table 2. Roughness measurements for the sensitive films. Legend: Ra, arithmetical mean deviation of the profile; Rq, root mean square deviation of the profile.
SAWRa (nm)Rq (nm)
S1-PEI4152
S2-PEI/ZnO2330
S3-PEI/TiO279101
S4-PEI/WO32431
S5-PDMS2028
S6-PDMS/ZnO1623
S7-PDMS/TiO24050
S8-PDMS/WO31925
Table 3. Sensitivity and limit of detection (LOD) for the sensitive films. Legend: Δf, frequency change; c, volatile organic compound (VOC) concentration.
SAW
Sensors
EthanolTolueneAcetoneDichloroethaneNoise Level Hz
Sensitivity
Δf/c Hz/ppm
LOD
ppm
Sensitivity
Δf/c Hz/ppm
LOD
ppm
Sensitivity
Δf/c Hz/ppm
LOD
ppm
Sensitivity
Δf/c Hz/ppm
LOD
ppm
S1-PEI4.25173.25222.13345.251424
S2-PEI/ZnO5.3895.8891.50343.501517
S3-PEI/TiO26.00192.88391.63683.003737
S4- PEI/WO37.8864.75113.38155.88917
S5-PDMS0.252400.501200.381600.5610720
S6-PDMS/ZnO0.341330.56800.441030.509015
S7-PDMS/TiO20.392320.731240.461950.8510630
S8-PDMS/WO30.54840.78580.71630.815515

