Article

Tartrate-Based Electrolyte for Electrodeposition of Fe–Sn Alloys

by
Simona Mrkonjić Zajkoska
1,2,*,
Edmund Dobročka
3,
Selma Hansal
1,
Rudolf Mann
1,
Wolfgang E. G. Hansal
1 and
Wolfgang Kautek
2
1
Hirtenberger Engineered Surfaces GmbH, Leobersdorfer Strasse 31-33, A-2552 Hirtenberg, Austria
2
Department of Physical Chemistry, University of Vienna, Währinger Strasse 42, A-1090 Vienna, Austria
3
Institute of Electrical Engineering, Slovak Academy of Sciences, Dúbravská cesta 9, 841 04 Bratislava, Slovak Republic
*
Author to whom correspondence should be addressed.
Coatings 2019, 9(5), 313; https://doi.org/10.3390/coatings9050313
Submission received: 11 April 2019 / Revised: 3 May 2019 / Accepted: 7 May 2019 / Published: 10 May 2019

Abstract

:
Magnetic properties of the sustainable Fe–Sn alloys are already known. However, there is lack of information in the field of Fe–Sn electrodeposition. In the present study, a novel Fe(III)–Sn(II) electrolyte with tartaric acid as a single complexing agent is introduced. The influence of the pH and the current density on the structural properties of the Fe–Sn deposit was studied. The stability of the electrolytes as a main attribute of sustainability was tested. The ferromagnetic phases Fe5Sn3 and Fe3Sn were electrodeposited for the first time, and it was found that the mechanism of the Fe–Sn deposition changes from normal to anomalous at a pH value 3.0 and a current density of approximately 30 mA/cm2. A possible reason for the anomalous deposition of Fe–Sn is the formation of Fe-hydroxides on the cathode surface. Two electrolyte stability windows exist: The first stability window is around a pH value of 1.8 where bimetallic Fe–Sn tartrate complexes were formed, and second one is around a pH value of 3.5 where most of the Sn ions were present in the form of [Sn(tart)2]2− and Fe in the form of [Fe(tart)]+ complexes.

1. Introduction

The Fe–Sn alloys recently gained attention due to their potential for various magnetic applications [1,2]. Among the five intermetallic phases FeSn2, FeSn, Fe3Sn2, Fe5Sn3, and Fe3Sn present in the Fe–Sn phase diagram, the iron-rich phases are of particular interest due to their ferromagnetic properties [3]. The tin-rich phases FeSn2 and FeSn are antiferromagnetic [3]. Various Fe–Sn alloys have been prepared by mechanical milling [4,5], magnetron sputtering [6,7], or by mechanical alloying [8]. The available literature in the field of Fe–Sn electrodeposition is very limited. Yamamoto et al. [9] detected the FeSn2 phase after annealing samples of electrodeposited Sn on Fe substrate. Chisholm et al. [10] have studied the electrodeposition of Fe–Sn from a gluconate based electrolyte. The authors have studied the influence of electrolyte pH, temperature, current density, and Sn:Fe ion ratio in the electrolyte. It was found out that in all studied cases, the electrodeposition of Fe–Sn from an Fe(II)–Sn(II) gluconate-based electrolyte exhibits normal co-deposition. Tin-rich deposits with amorphous Sn–Fe and antiferromagnetic FeSn2 phases were deposited in this way.
Electrolyte stability is one of the main issues for sustainable electrodeposition. The standard reduction potential of oxygen (E0 = 1.229 V) is more positive than the one from Fe3+ to Fe2+ (E0 = 0.771 V). Therefore, the spontaneous oxidation of Fe2+ to Fe3+ will occur due to the presence of dissolved oxygen in the electrolyte. As a result, the cathodic current efficiency will decrease. Usage of the reducing agents can inhibit, but not eliminate, the oxidation of Fe2+ to Fe3+. Moreover, the kinetics of the reduction depends on the electrolyte pH [11]. Another option to avoid the problem of Fe oxidation is the use of Fe(III) salts for electrodeposition.
The aim of this is study is the electrodeposition of Fe–Sn alloys from a novel Fe(III)–Sn(II) electrolyte with tartaric acid as single complexing agent. The influence of the electrolyte pH and deposition current density on the stoichiometry and structure of the deposit was studied. The potentiodynamic measurements and electrolyte speciation distributions were used to explain the mechanism of the Fe–Sn electrodeposition. The stability of the electrolyte was tested, and the results were compared with the electrolyte speciation distribution.

2. Materials and Methods

The mechanism of the Fe–Sn electrodeposition was studied in electrolytes containing: 0.11 M FeCl3 (VWR Chemicals, Leuven, Belgium), 0.11 M SnCl2 (abcr GmbH, Karlsruhe, Germany), 0.44 M C4H4O6 (Alfa Aesar, Karlsruhe, Germany), and 0.45 M (NH4)2SO4 (VWR Chemicals, Leuven, Belgium). Supporting electrolytes were prepared by dissolving 0.45 M (NH4)2SO4 and 0.44 M C4H4O6 in DI water. Single metal electrolytes were containing 0.11 M of either Fe or Sn. The pH of the electrolytes was changed in the range from 1.8 to 4.5 and a solution of 30% NaOH was used to adjust the pH. The temperature of the electrolytes was kept at 60 °C with a hot plate.
Calculations of the metal speciation were performed in Visual MINTEQ 3.1 [12]. The redox reaction of Fe(III)–Sn(II) was not considered in the chemical equilibrium modeling. Consequently, Hyperquad Simulation and Speciation (HySS) software (HySS2009) [13] was used for the calculation of species´ concentration and visualization.
Electrochemical measurements were carried out in an open glass beaker using a three-electrode setup with the Ag/AgCl (sat. KCl) used as a reference and Pt as a counter electrode. In the manuscript, all potential values are vs. standard hydrogen electrode (SHE) as a reference. Potentiodynamic measurements were performed using an IPS PGU 20V-2A-E potentiostat (IPS Elektroniklabor GmbH & Co. KG, Münster, Germany). For the cyclic voltammograms (CV), a CHI 101 stationary gold disc electrode (Φ = 2 mm) was used as working electrode. Before every experiment, the gold cathode was wet polished to a mirror bright finish with 4000 grid silicon paper and rinsed with deionized water. Cyclic voltammograms were recorded at a scan rate of 50 mV/s from the Open Circuit Potential (OCP) towards cathodic direction up to −1303 mV vs. SHE and during the reverse scan up to +697 mV vs. SHE.
The estimation of the deposition potential of Fe in the tartrate electrolyte was carried out in an electrolyte containing 0.11 M of Fe as a single electroactive species. A series of CVs with a variation of the cathodic reverse potential from −703 to −1303 mV vs. SHE with the step of −100 mV and the scan rate of 50 mV/s was recorded. The appearance of the anodic dissolution peak of Fe indicated the position of the Fe reduction potential.
Galvanostatic Fe–Sn deposits were obtained from Hull cell experiments, which were carried out in a standard 267 mL cell (Kocour, Chicago, IL, USA) [14]. As a substrate brass (Kocour, 69 at % Cu, 31 at % Zn) was used. The surface of the working electrode was activated with 10% H2SO4 for 30 s before the Hull cell experiments. A total constant current of 2000 mA was applied for 7 min on a brass substrate. The current density on the Hull cell substrate varied from 1 to 80 mA/cm2. In this way, it has been guaranteed that the deposition takes place above the deposition potential across the whole testing plate. Structural characterization of the Fe–Sn deposits was performed on the 1 × 1 cm2 samples cut from the Hull cell electrode along the current density of 20 and 80 mA/cm2.
The surface topography and the deposit stoichiometry were analyzed with the scanning electron microscope (SEM) Hitachi S-4800 (Hitachi, Tokyo, Japan) equipped with an energy dispersive X-ray detector (EDX). XRD analysis has been carried out using diffractometer Bruker D8 DISCOVER (Bruker, Billica, MA, USA) equipped with an X-ray tube with a rotating Cu anode operating at 12 kW. All measurements were performed in parallel beam geometry with a parabolic Goebel mirror in the primary beam. A LiF monochromator was inserted into diffracted beam in order to suppress the fluorescent radiation. The X-ray diffraction patterns were recorded in a grazing incidence set-up with the angle of incidence α = 6° in the angular range of 20°–100° with step size 0.02° and measuring time of 1 s per step. The lattice parameters and crystallite size, in terms of volume weighted column-length, were determined by the Pawley method using the software TOPAS 3.0 from Bruker-AXS. The approximate mass fractions of the detected phases were determined by the Rietveld method using the same software.
In order to revise electrolyte stability, 250 mL of each electrolyte was prepared in an open glass beaker and kept on a hot plate at 60 °C while stirring with 250 rpm. If precipitates developed, they were isolated after approximately 3 h of ageing and they were dried in air.

3. Results and Discussions

3.1. Electrolyte Speciation

In aqueous solutions, both stannous and ferric ions can be present as free ions as well as in the form of complexes with tartrate, chloride, and sulphate. Based on the chemical equilibrium, the ferric-stannous redox reaction was not considered. The calculation of the metal speciation was performed with the Software Visual MINDTEQ 3.1 [12]. The pH-dependent speciation of the electrolytes was calculated by the HySS software [13]. The results are depicted in 
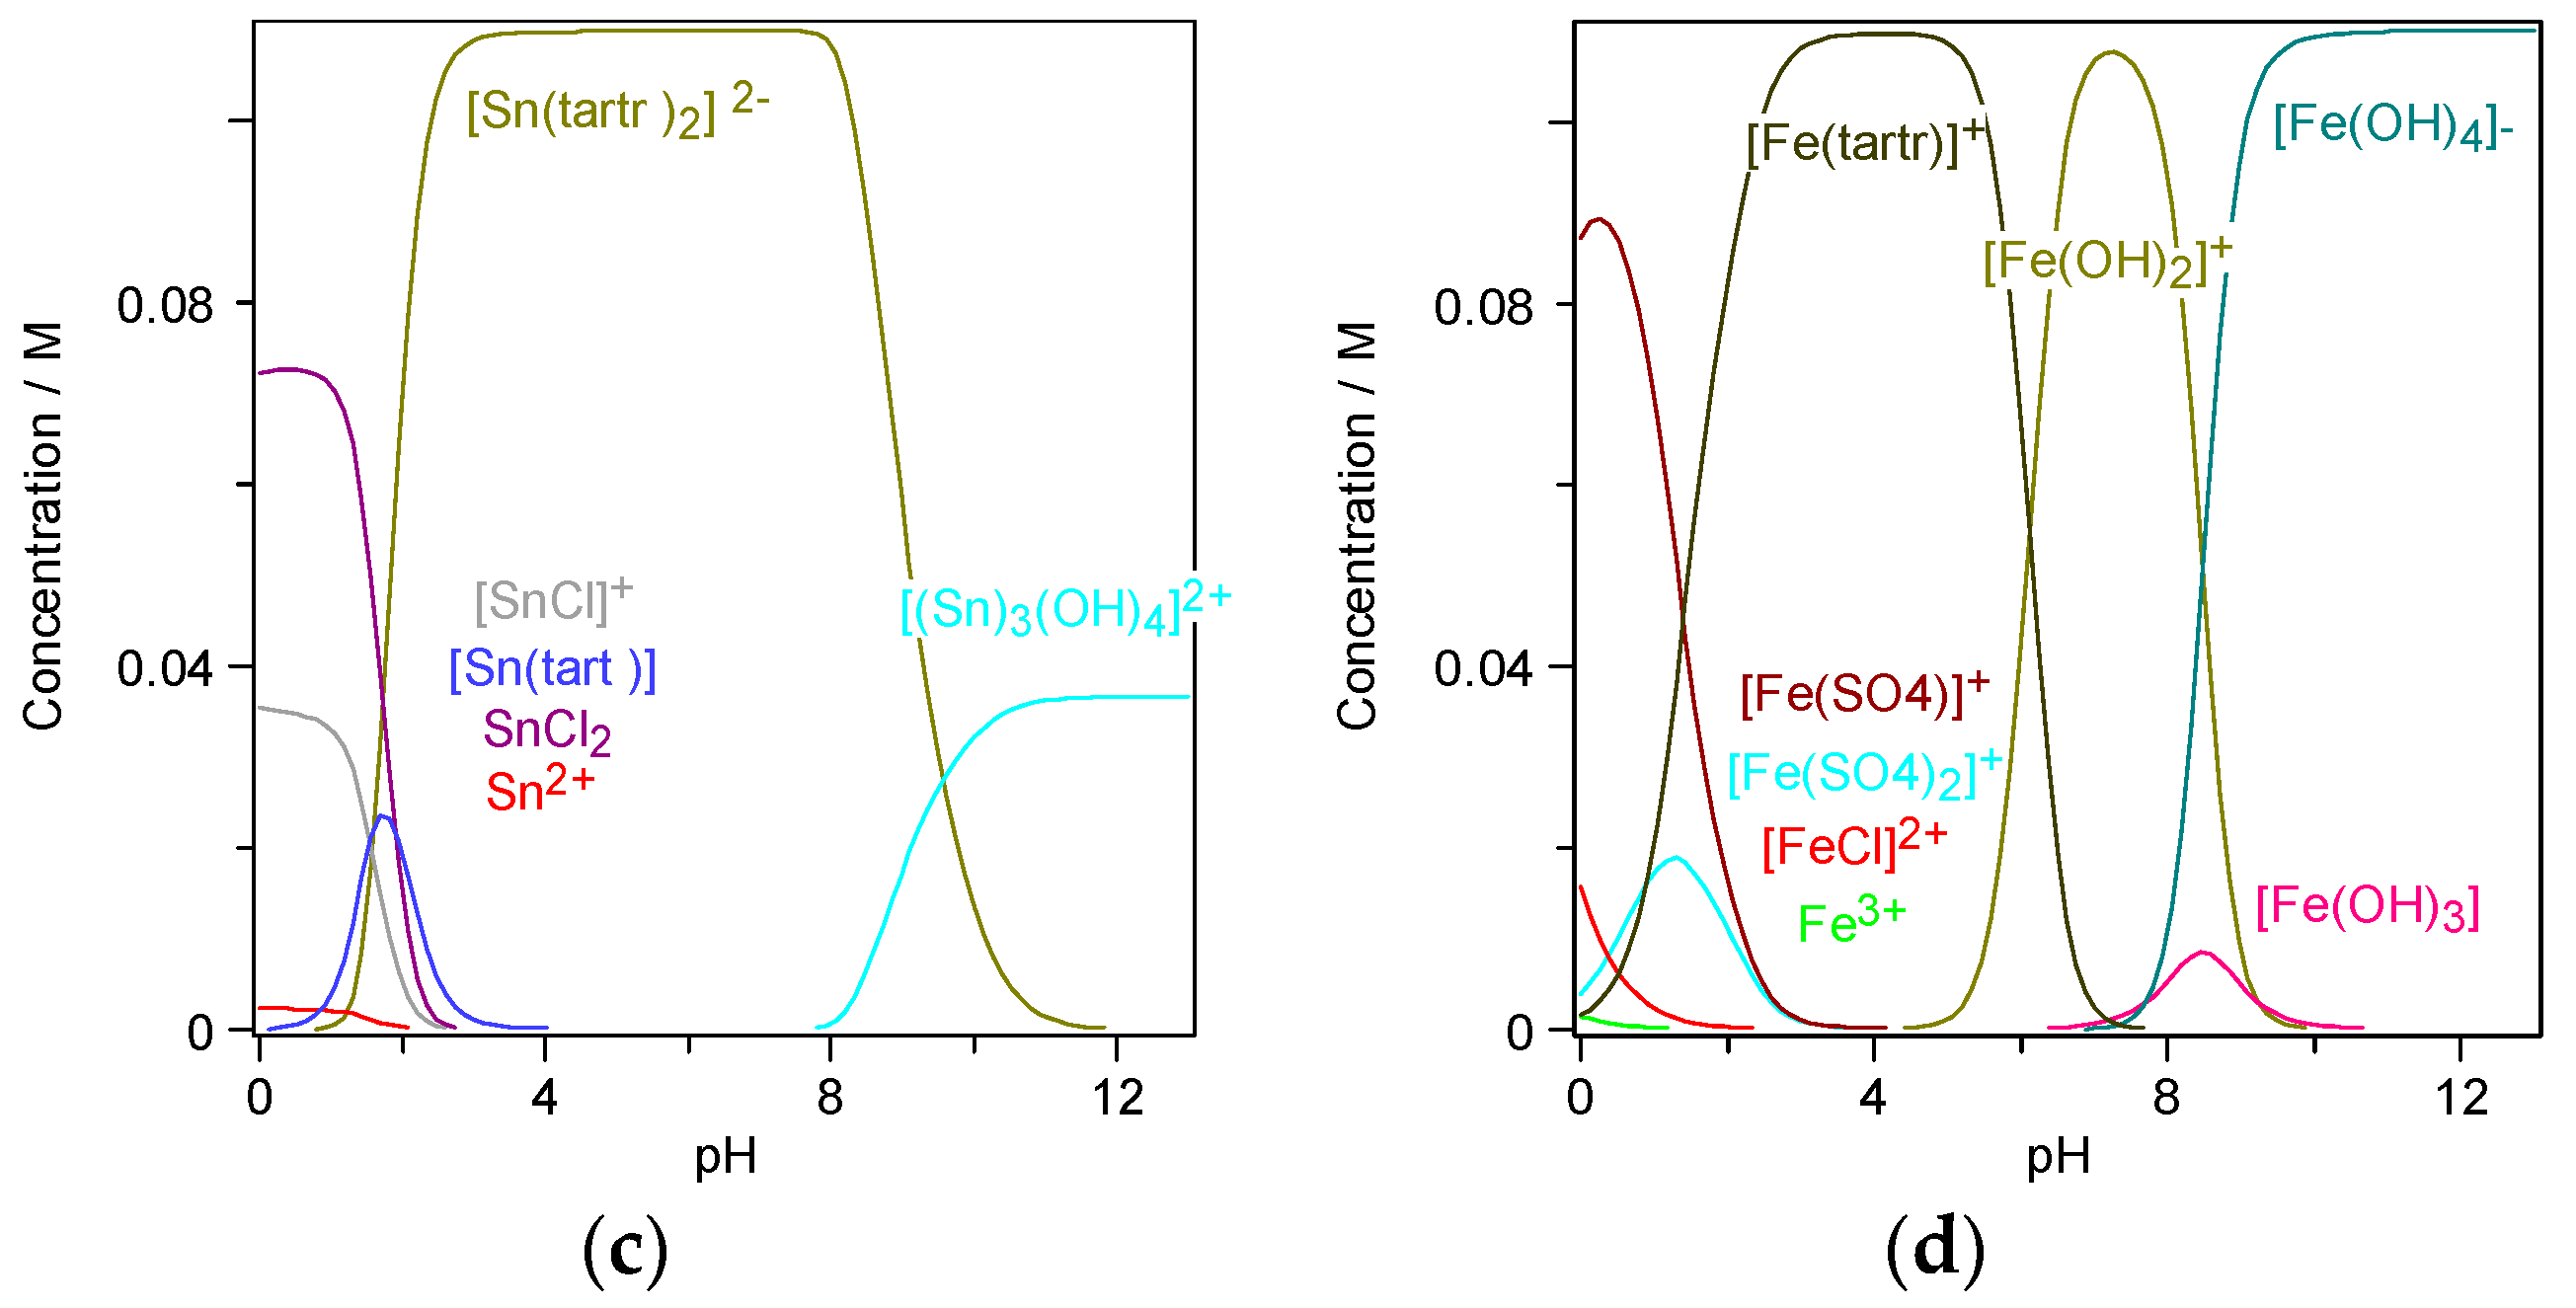
Figure 1. In the acidic region of mixed Fe–Sn electrolytes stannous ions are present either as free ions, charged or neutral chloride complexes, or as neutral Sn-tartrate complexes. In the pH region from 3.0 to 8.0, all tin molecules are present in the stable form of [Sn(tartr)2]2− complexes. In the weak alkaline region, tin(II) hydroxides are observed (Figure 1c). Ferric ions in the mixed Fe–Sn acidic electrolytes are present as free ions or charged chloride and sulfate complexes. In the pH range from 3.0 to 5.0, all ferric molecules are present in the stable complex [Fetart]+. Soluble [Fe(OH)2]+ starts to appear around pH 5.0, while insoluble hydroxides Fe(OH)3 and [Fe(OH)4] are formed in the weak alkaline region (pH ~8.0) (Figure 1d). Considering the pH dependence of electrolyte speciation, the pH range for stable ferric-stannous electrolytes was assumed to be between the values of 3.0 and 5.0.

3.2. Electrochemical Characterization

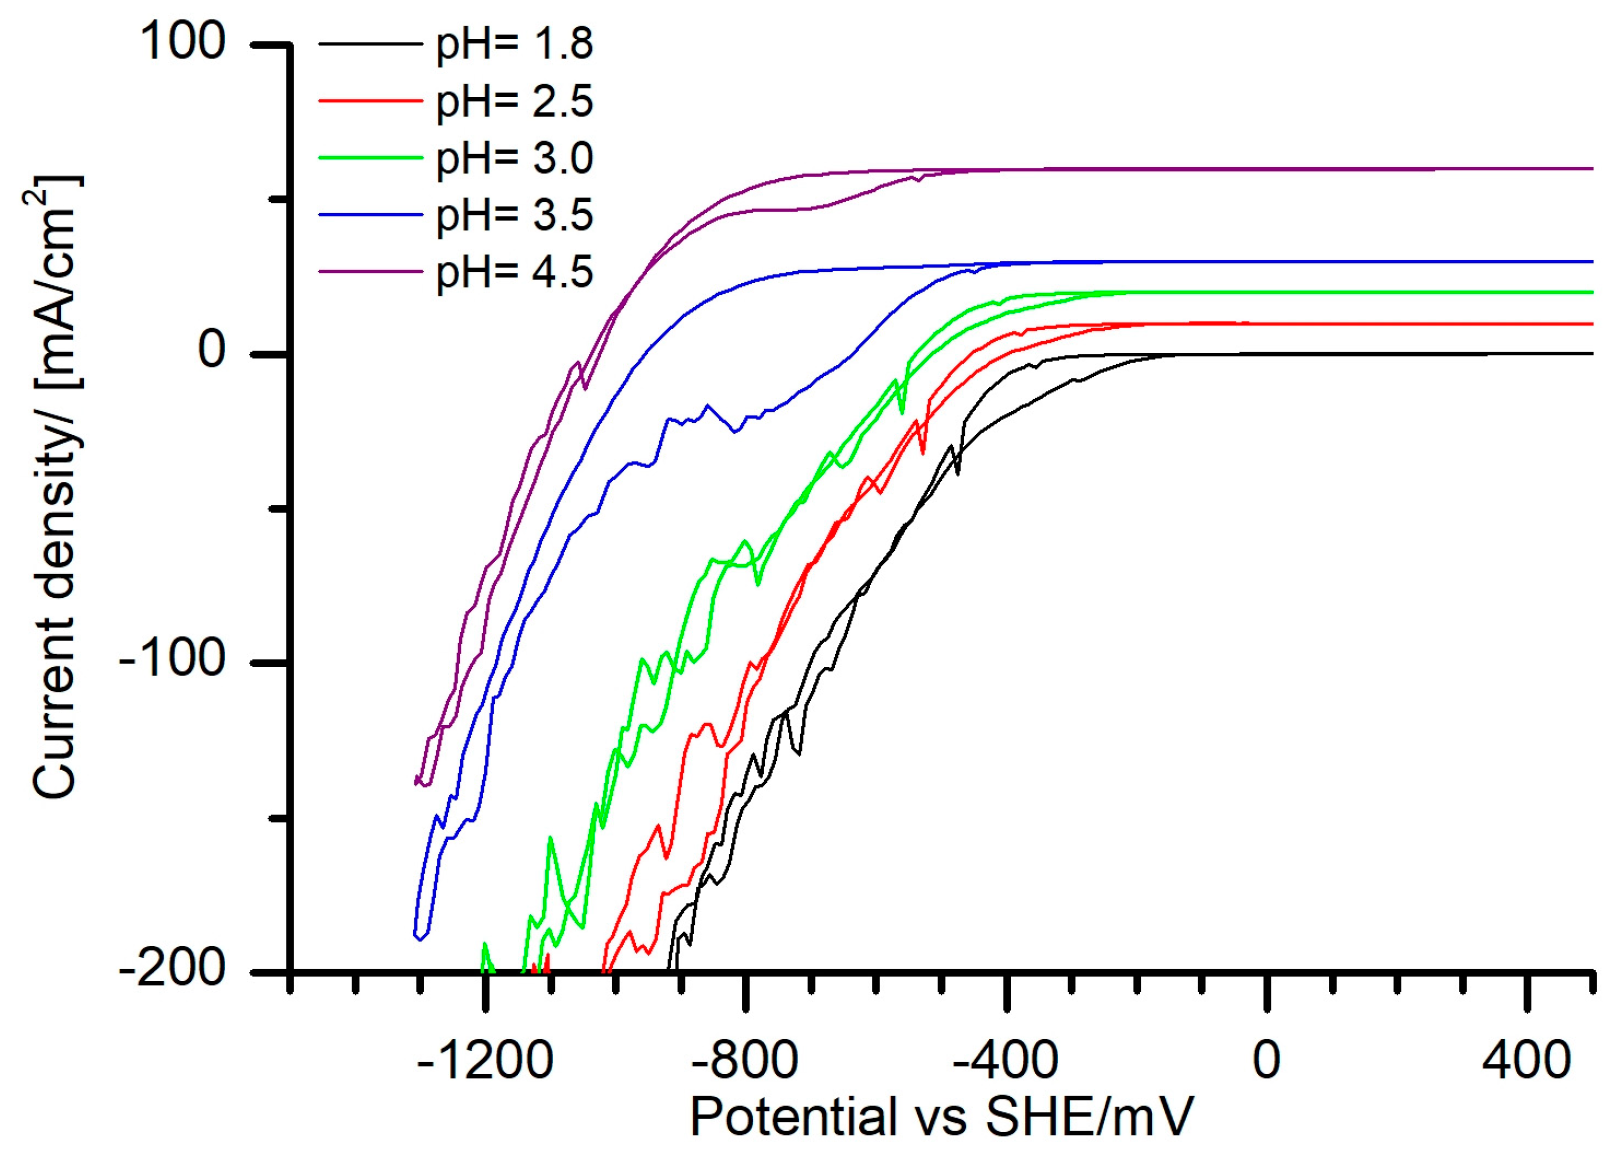
As a first step, CVs in the supporting electrolyte, without any metal ions, at different pH values were measured (Figure 2). For all measured CVs, reduction peaks attributed to hydrogen reduction were observed in the cathodic sweeps, independent of the pH values of the electrolytes. At higher pH, with the beginning at a pH value of 3.0, a reduction peak around −800 mV started to appear. This peak, reaching its maximum intensity at the pH value of 3.5, was not related to any oxidation peak (Figure 2). According to the speciation of the supporting electrolyte (Figure 1a) within the pH range of 2.0 to 4.0 the most of the tartrate ligands were present in the form of [H2(tart)] and [H(tart)]. Predominant species around pH value of 3.5 was [H(tart)]. Therefore, the cathodic peak, observed around −800 mV (Figure 2), could be related to the reduction of hydrogen ions from the [H(tart)] ion [15]. During the anodic sweep of the CVs, no oxidation peaks were detected (Figure 2). Therefore, it can be assumed that no oxidation of tartaric acid or its anions occurred.
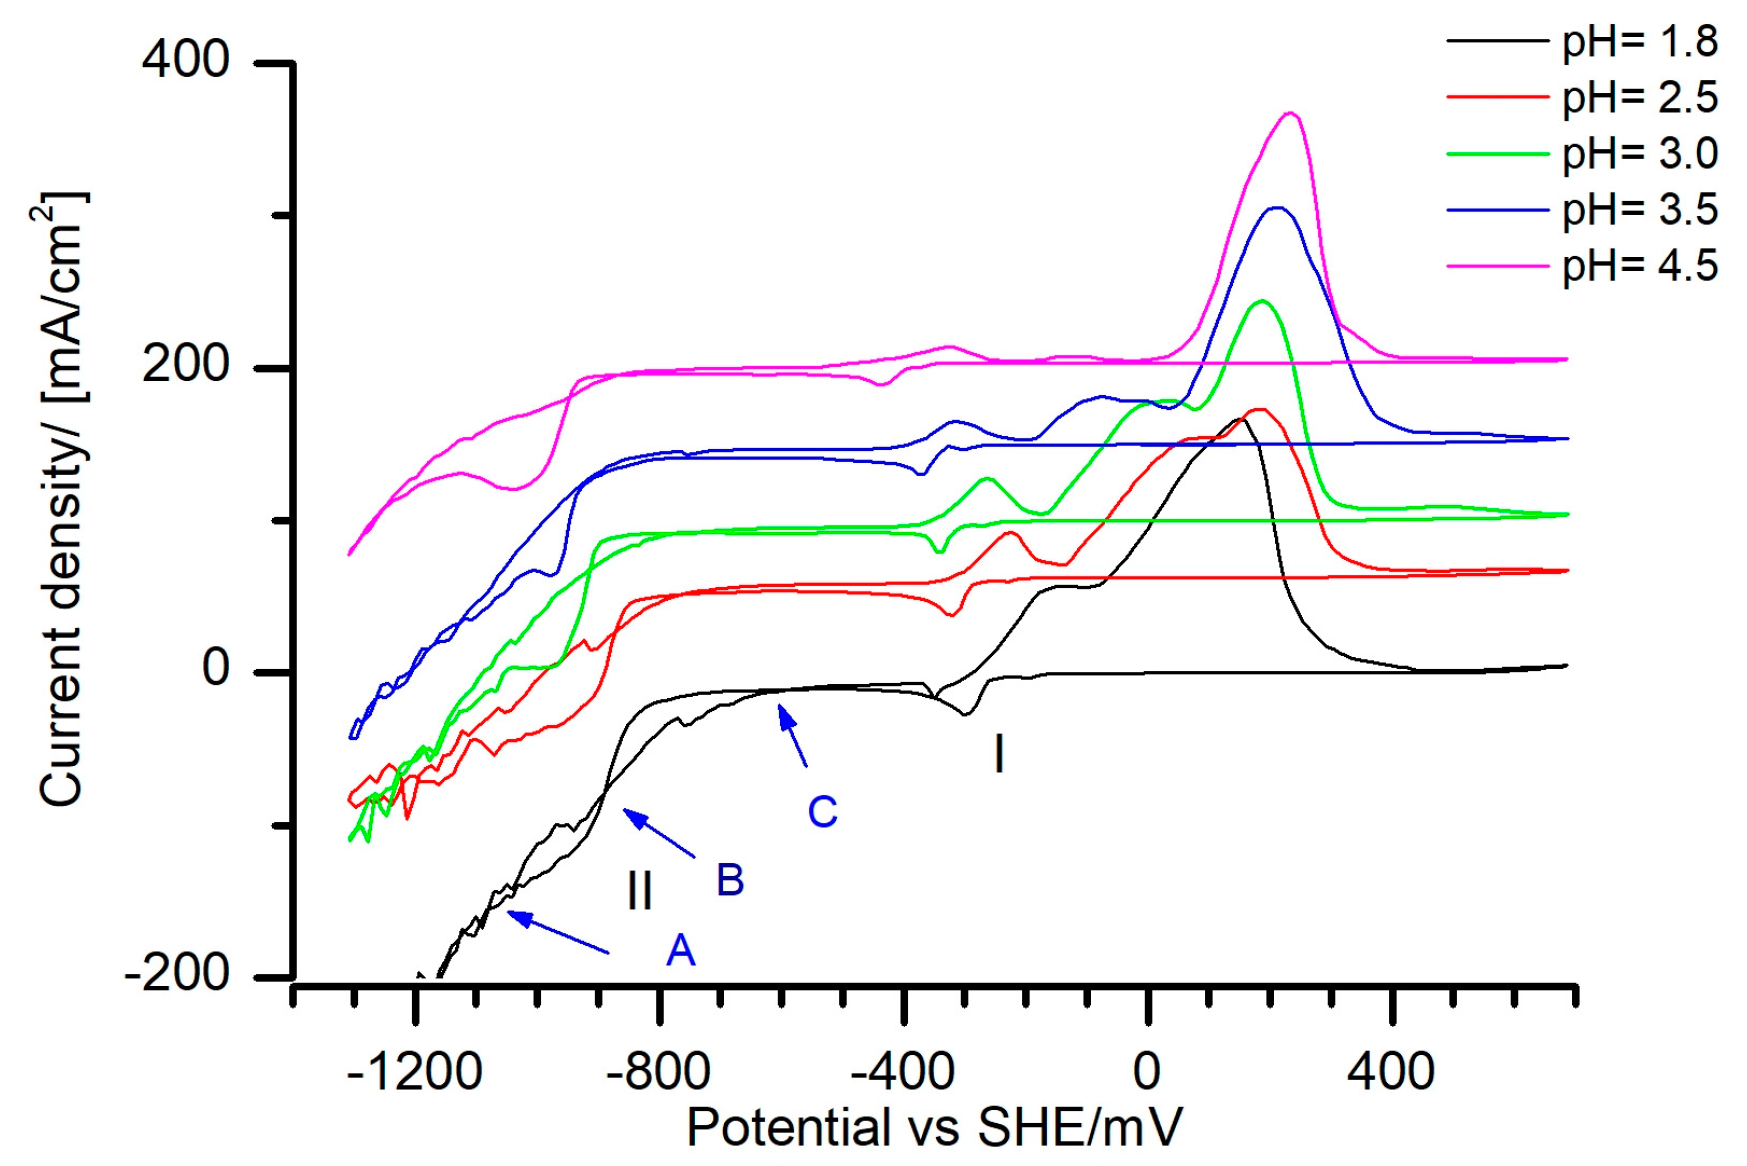
Results of the cyclic voltammograms (CVs) in the Fe(III)–Sn(II) electrolyte for various pH values are depicted in the Figure 3. In the cathodic branch, two reduction peaks (I, II) and three crossovers (A, B, C) were detected. The peak Nr. I was assigned to the Sn reduction and it is strongly pH dependent. By increasing the pH, the Sn reduction peak was shifted towards more negative potentials. Such a shift was also observed by Lingane [16] in the Sn(II)-tartrate electrolytes. The author explained it with the fundamental difference in the composition of Sn(II)-tartrate complexes in the acidic and alkaline media. Moreover, according to the polarographic measurements, the presence of ferric ions in the tartrate electrolyte containing a 1:1 ratio of Sn(II) and Fe(III) did not change the reduction potential of Sn(II) [17]. According to the electrolyte speciation (Figure 1c), in the case of Fe(III)–Sn(II) tartrate electrolyte, the character of the stannous complexes changed from the [SnCl], [SnCl], and [Sn(tart)] in the acidic media through [Sn(tart)]+ in weak acidic-neutral towards [Sn3(OH)4]2+ in the alkaline media. The concentration of the [Sn(tart)2]2− complexes within the pH values of 3.0 and 7.0 is almost constant. Moreover, the pKs2 value of tartaric acid is 4.34 [18]. Due to the dissociation of [H(tart)], the change of concentration of [tart]2− reaches a maximum around this pH value (Figure 1a). Therefore, it is reasonable to assume that the shift of the Sn reduction potential in this pH region is due to the increased stability of the [Sn(tart)2]2− complex.
A decrease of the Sn reduction peak intensity as a function of a pH was detected (Figure 3). A possible explanation could be the suppression of Sn reduction due to the presence of ferric ions. A similar effect was observed in the Ni–Fe anomalous co-deposition [19] where the electrodeposition of the more noble Ni was suppressed by the presence of Fe at relatively low overpotentials. The suppression of Ni began when Fe-hydroxides where formed on the cathode surfaces. According to the Fe(III)–Sn(II) electrolyte speciation, soluble Fe-hydroxides are starting to form around pH value of 4.0 (Figure 1d). Due to the local rise of the pH on the cathode surface, Fe-hydroxides might also be present in electrolytes with a bulk pH below 4.0. This finding indicates, that with the increase of the electrolyte pH, Fe–Sn might undergo anomalous deposition.
The Sn reduction peak was followed by the diffusion limiting current density plateau in all of the studied electrolytes (Figure 3). According to the Nernst equation [20], the standard hydrogen evolution potential (E0) is shifted from −104 to −261 mV for pH values of 1.8 and 4.5 respectively. This indicates that hydrogen evolution (HER) is present as a side reaction over the whole deposition potential range [21]. The presence of various additives and complexing agents in the electrolyte can shift the HER to higher overpotentials than E0. In the case of the Fe(III)–Sn(II) electrolyte used, the HER potential was shifted to values of −900 mV and below, and a linear increase of the current density was observed (Figure 3).
The reduction peak Nr. II was shifted from −890 towards −962 mV for the pH values of 1.8 and 4.5, respectively. In the vicinity of peak Nr. II two crossovers (A, B) of cathodic and anodic scans were observed (Figure 3). Generally, for single metal electrodeposition, the presence of a crossover indicates the existence of a nucleation process. The first crossover corresponds to the nucleation overpotential, since the potential of metal deposition on itself is more positive than for the metal deposition on a foreign substrate. The second crossover corresponds to the equilibrium potential of Metal/Metaln+ couple [22]. On the other hand, the reduction peak around −800 mV in the supporting electrolyte was assigned to the reduction of the hydrogen from the [H(tart)] and [H2(tart)] species (Figure 1a and Figure 2). For these reasons, the cathodic peak Nr. II in the Fe(III)–Sn(II) electrolyte (Figure 3) might be related either to the reduction of some metal phase or to hydrogen reduction from [H(tart)] and [H2(tart)] complexes.
The anodic sweeps of the CVs exhibited a rather complex behavior. Two different current peaks were detected at pH values of 1.8 and 2.5. Starting from the pH value of 3.0, three different current peaks appeared (Figure 3). Considering the observed pH influence on the Sn reduction potential and the increased number of the stripping peaks, it was assumed that starting from the pH value of 3.0 additional Fe–Sn metal phases could be deposited.
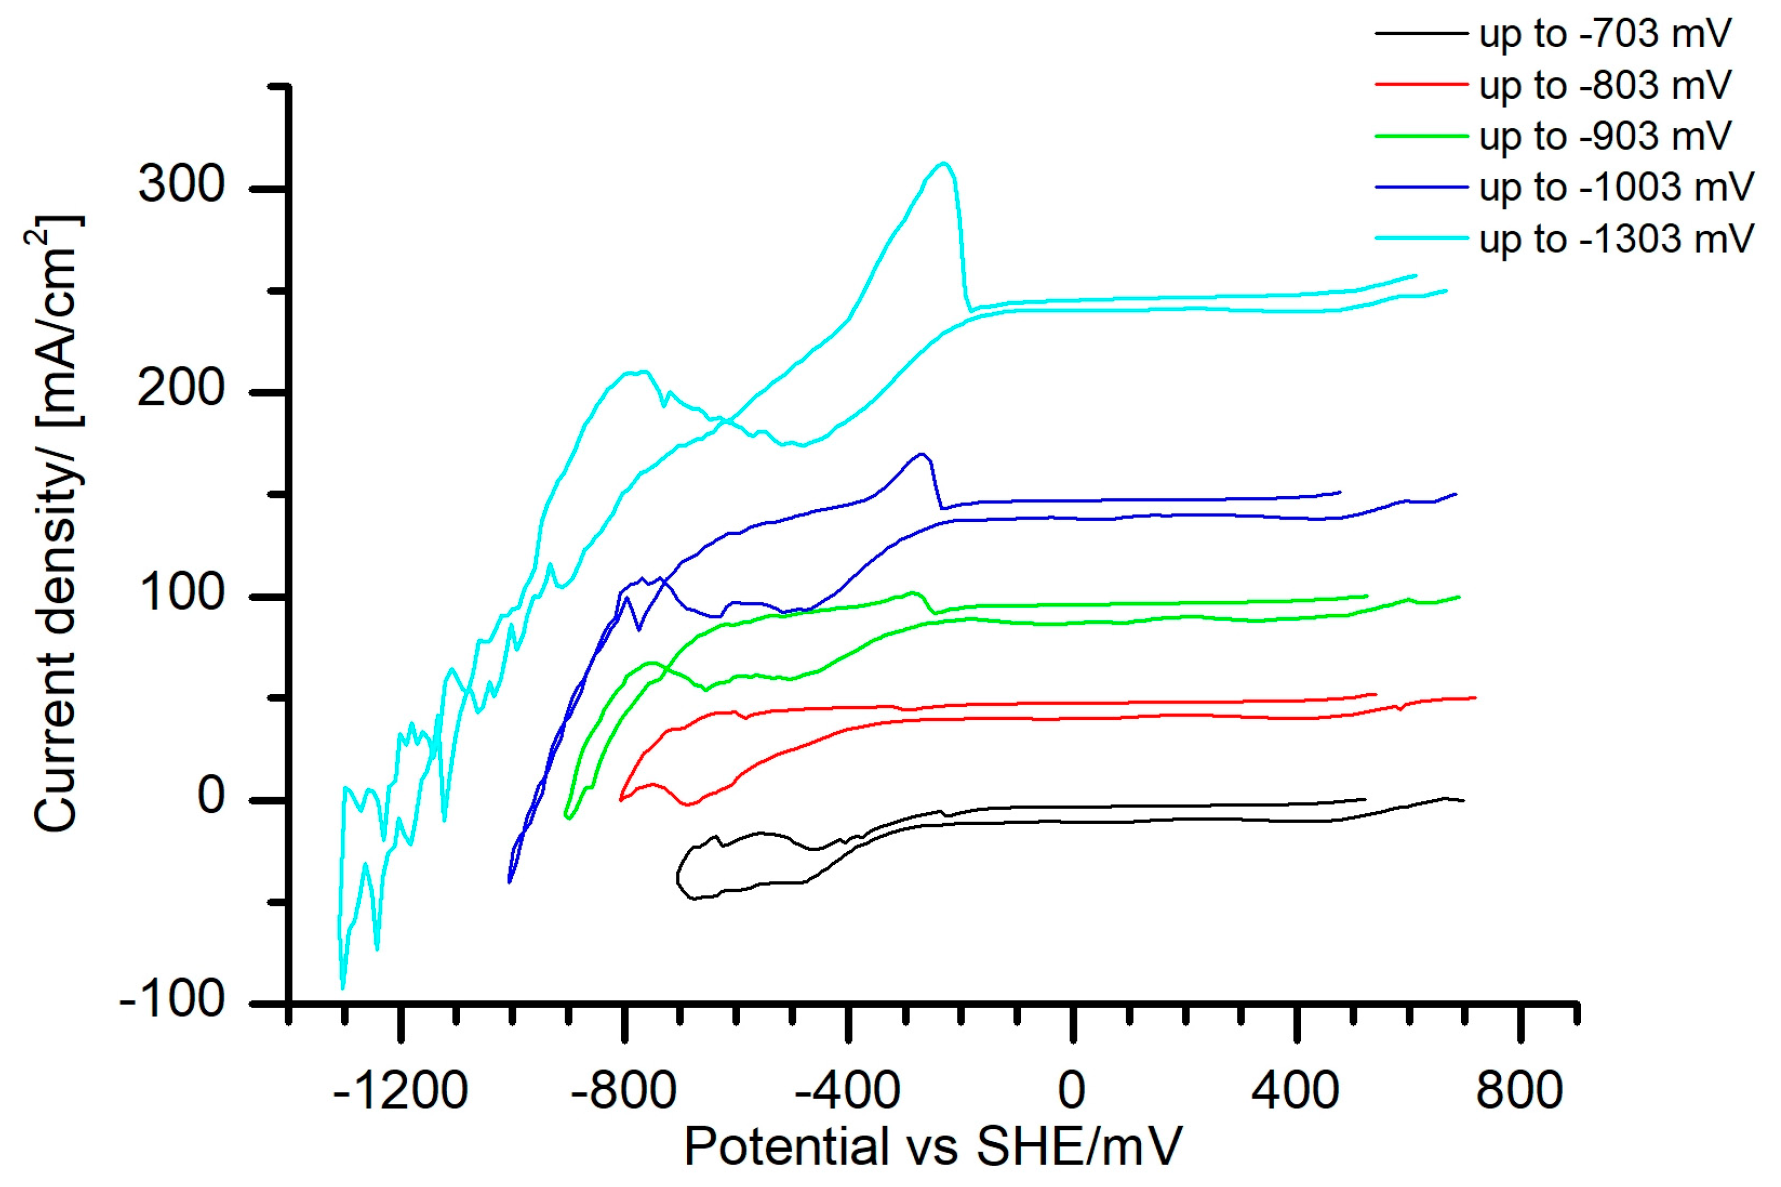
In order to relate the peak Nr. II (Figure 3) with hydrogen or with metal phase reduction, the iron deposition potential was studied. For this purpose, CVs with different cathodic reverse potentials in the single metal Fe(III)-tartrate electrolyte were measured (Figure 4). An anodic dissolution peak was first observed when the electrode was polarized cathodically up to −903 mV. On the other hand, no dissolution peak was observed when the electrode was polarized to −803 mV. Hence, the position of Fe deposition potential at the pH value of 1.8 was located between −803 and −903 mV. This finding confirms that the cathodic peak Nr. II in the mixed Fe–Sn electrolyte (Figure 3) could be also related to the deposition of Fe or an Fe–Sn phase.

3.3. Structural Characterization

In order to study the Fe–Sn electrodeposition in the current density range from 1 to 80 mA/cm2, Hull cells were used. SEM topography images and deposit stoichiometries are listed in Table 1. The surface of the Hull cell cathodes, deposited from electrolytes in the pH range of 1.8 to 3.0, was covered with dendrites over the whole current density range. At higher pH values, 3.5 and 4.5, the character of the dendrites changed to powder (not shown). In order to analyze the compact layer below the dendrites and the powder, these were removed from the samples by a cotton pad with isopropanol. In all studied samples, a high amount of oxygen was observed (Table 1). The oxygen content varied from 48.7 to 21 at % for the samples deposited at pH value 1.8 with 20 mA/cm2 and the pH value of 4.5 with the current density of 80 mA/cm2, respectively. Samples deposited at the pH value of 1.8 had the highest surface roughness and therefore, also the biggest surface area. Additionally, no Fe or Sn hydroxides should be present at such an acidic pH (Figure 1c,d). Therefore, it could be assumed that the high oxygen content is a surface phenomenon dependent on the deposit surface roughness. From the EDX analyses, it is obvious that, with the increase of the electrolyte pH, the amount of Sn in the deposit decreased. Iron-rich deposits were obtained with both 20 mA/cm2 (pH values of 3.5 and 4.5) and 80 mA/cm2 (pH range from 3.0 to 4.5) (Table 1). This observation agrees with the potentiodynamic results, in which suppression of the reduction of the more noble Sn with the increasing pH was detected (Figure 3).
Anomalous co-deposition, enhanced deposition of the less noble metal, and suppression of the reduction of the more noble one, has been reported for various iron alloys [19,23,24,
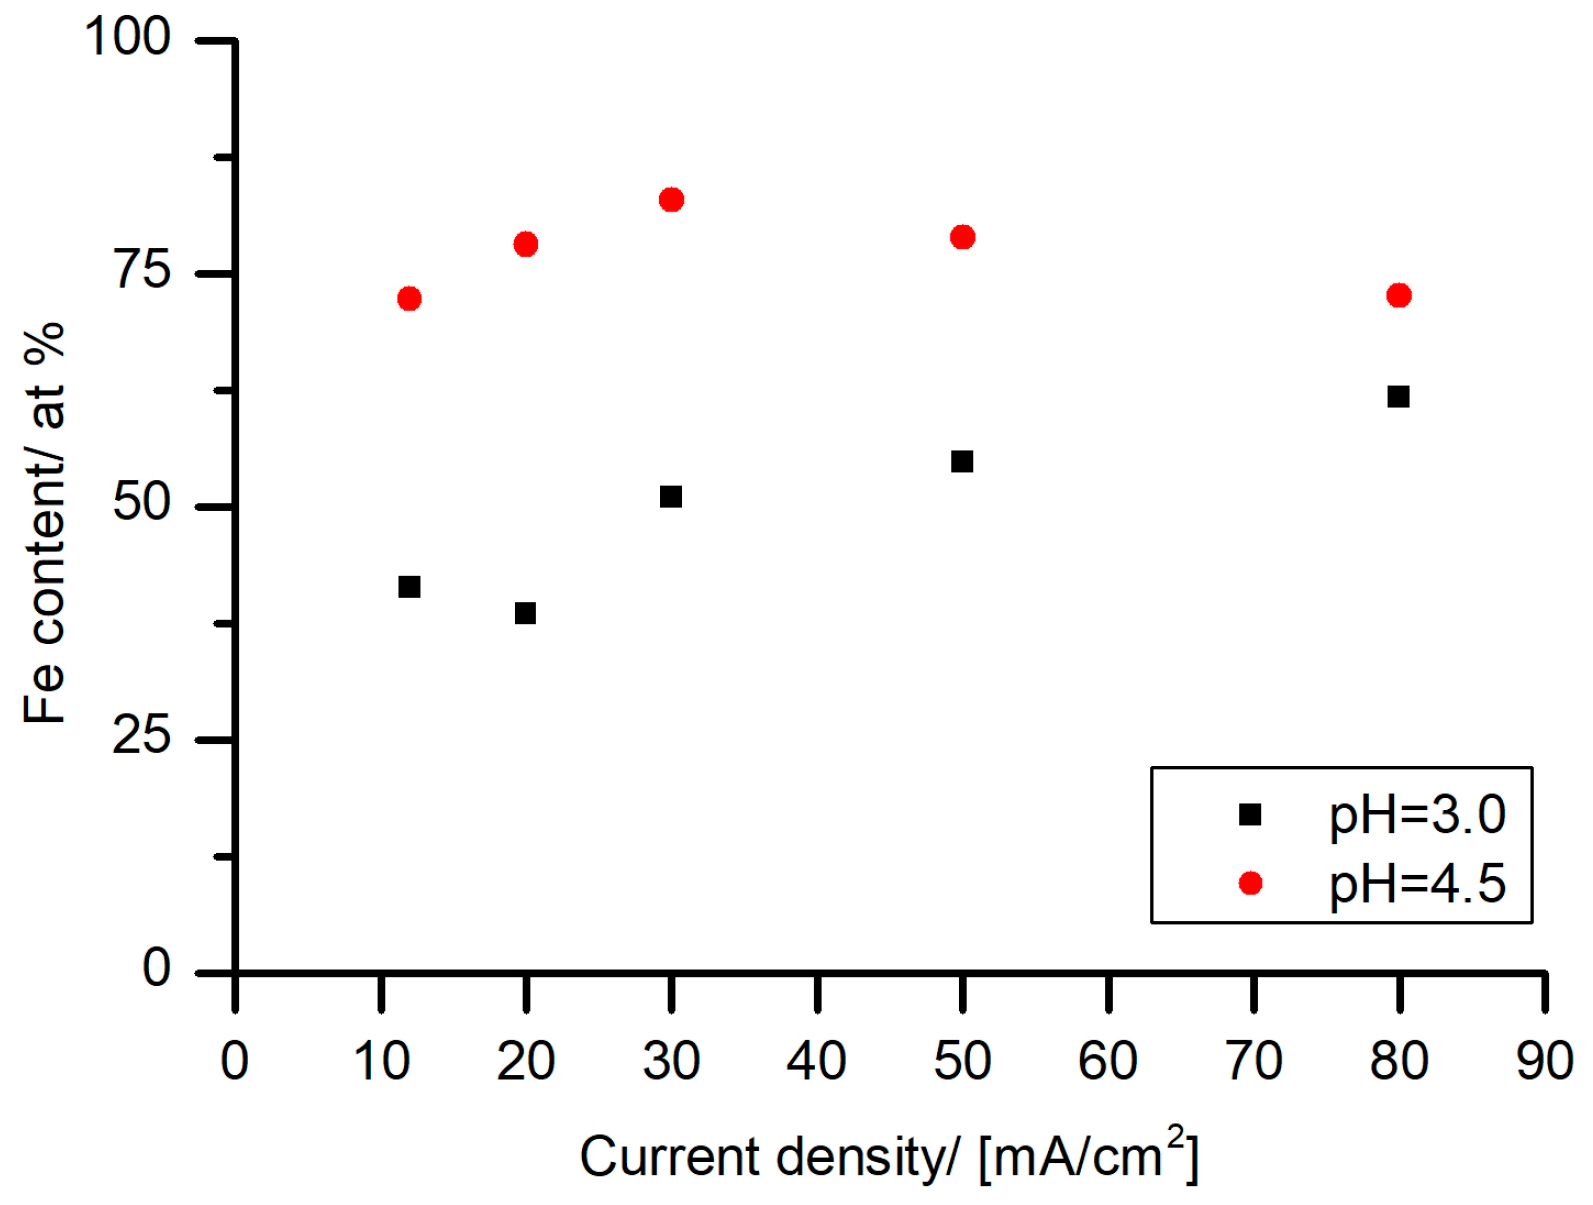
25]. A literature overview showed no report of an anomalous codeposition in the Fe–Sn system. The iron content, as a function of current density in the Hull cells, was studied (Figure 5). The assumptions, based on the CVs results (Figure 3), of the suppression of the Sn reduction and Fe–Sn anomalous co-deposition were confirmed. In the samples deposited at the pH value of 3.0, Fe-rich deposits were obtained starting with 30 mA/cm2. In the case of the electrolyte with the pH value of 4.5, Fe-rich deposits were obtained over the whole studied current density range. These findings indicate that anomalous deposition of Fe–Sn from tartrate electrolyte starts to appear at a current density of around 30 mA/cm2 and a pH value of 3.0. Moreover, the Fe–Sn anomalous deposition is a pH- and current density-dependent phenomenon. One of the possible explanations for the anomalous co-deposition is blocking of the cathode surface with hydroxides [19,21]. According to the species simulation (Figure 1c,d), Fe hydroxides starts to form from around the pH value of 4 and Sn hydroxides start to appear around the pH value of 8.0. Consequently, it can be assumed that the possible reason for the Fe–Sn anomalous co-deposition is the presence of Fe hydroxides on the cathode surface.
The layers on the Hull cell samples deposited with 20 and 80 mA/cm2 at different pH values were characterized by XRD diffraction. The XRD-diffraction patterns were recorded in the angular range of 20°–100°. For the phase identification, the most relevant was the 2θ range 27°–47° (Figure 6). Three intermetallic phases, FeSn2 (PDF-04-006-5524), Fe5Sn3 (PDF-03-065-7052), Fe3Sn (PDF-03-065-3524), and Sn (PDF-04-008-4977) were observed in all of the electrodeposited samples, independent of current density and the electrolyte pH. Additionally, α-Fe (PDF-01-089-4186) was detected at the samples deposited with 20 mA/cm2 with the pH values between 3.0 and 4.5 as well as with 80 mA/cm2 with the pH values of 3.0 and 3.5. A decrease in the intensity and broadening of the peaks (30.7°, 32° and 45°) related to the diffraction of β-Sn was observed with the increasing electrolyte pH for both studied current densities (Figure 6). The same tendency was observed for the Fe5Sn3 diffraction peak at 30° for the samples deposited with 20 mA/cm2. These findings indicate that with an increase of the pH of the electrolyte, the amount of the electrodeposited β-Sn and Fe5Sn3 decreased and the crystallite size got smaller. The detected Fe-rich intermetallic phases Fe5Sn3 and Fe3Sn have hexagonal structure (P63/mmc) and exhibit ferromagnetic properties [2,3]. In the thermodynamic Fe–Sn phase diagram, both appear at temperatures above 1000 K [3]. Experimentally, they were prepared by DC-magnetron sputtering [6] and solid state reaction [2,3]. The available literature on electrodeposition in the Fe–Sn system showed no results for the preparation of Fe5Sn3 and Fe3Sn [10,26,27].
The Rietveld method was applied to the recorded XRD-diffraction patterns in order to quantify the amount of detected metal phases. The results, together with the calculated size of the crystallites (L-vol), are listed in the Table 2. The recorded diffraction patterns were complex and with overlapping diffraction maxima (Figure 6). Hence, in the calculated values of the mass fractions and crystallite sizes, a significant error might occur. These values are marked with an asterisk in Table 2. Generally, based on the calculated values, several conclusions could be made. The results of the crystallite size and mass fraction calculations (Table 2) confirmed the assumptions based on the diffractograms observation (Figure 6). By increasing the pH of the electrolyte at both current densities, the amount of the electrodeposited β-Sn, and its crystallite size decreased. The same tendency was observed in the case of the Fe5Sn3 phase deposited with a current density of 20 mA/cm2. In contrast, the amount of α-Fe, electrodeposited with a current density of 20 mA/cm2, increased as a function of the electrolyte pH. It also seems that the iron-rich phase Fe5Sn3 is preferentially deposited with a current density of 20 mA/cm2. On the other hand, the tin-rich phase FeSn2 is preferentially deposited with a current density of 80 mA/cm2. The obtained results (Table 2) also suggest that the amount of Fe3Sn is not depending on the electrolyte pH nor on the current density.

3.4. Electrolyte Stability

In the electrolyte speciation’s simulation, several unstable or insoluble species such as [Sn(tart)] or the iron hydroxides appeared (Figure 1). For the chemical equilibria calculation, the redox reaction of Fe(III)–Sn(II) and the existence of bimetallic Fe–Sn-tartrate complexes were not considered. In order to revise the reliability of the species distribution, the stability of the electrolytes was studied. The stoichiometry of the precipitates was studied by EDX and the results are presented in Table 3.
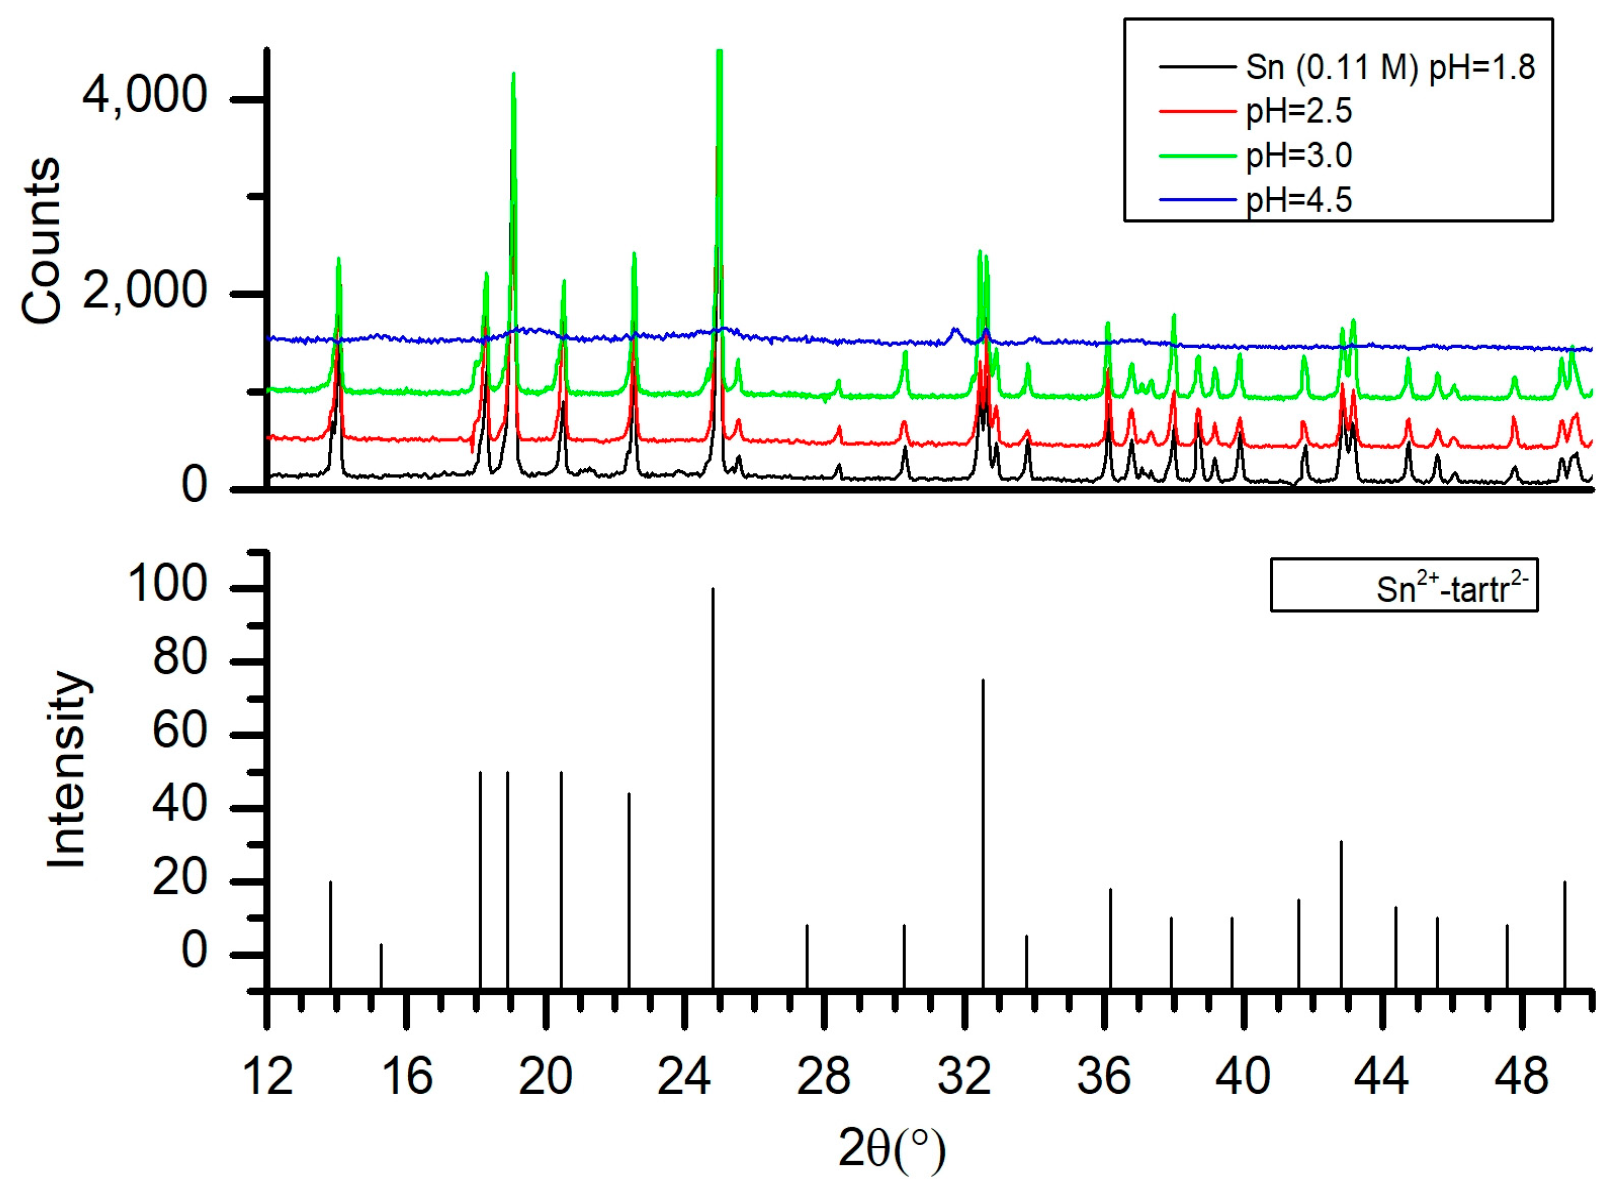
The single metal Sn electrolyte (0.11 M) at the pH value of 1.8 was rapidly precipitating. The XRD diffraction spectra on the Sn precipitate showed rather complex crystalline behavior (Figure 7). Although not all the diffraction peaks were successfully assigned, most of them (e.g., 13.8°, 15.3°, 18.2°, 18.9°, 24.9°, etc.) were in good correlation with the powder diffractogram of [Sntartr]0 (PDF-00-001-0529). This finding agrees with the species distribution of the single metal Sn electrolyte (Figure 1b) where at the pH value of 1.8 approximately 0.04 M of the Sn ions are present as neutral tartrate complex.
The Sn(II) electrolyte (pH = 1.8) was stabilized with the addition of FeCl3. The mixed Fe(III)–Sn(II) electrolyte with the pH value of 1.8 was stored and observed for a week and during this time, no precipitates or change of color appeared (Table 3). Two explanations for the stabilization of the Sn(II) electrolyte by the FeCl3 are possible. The first one is based on the calculated species distribution (Figure 1b–d). With the addition of the 0.11 M of FeCl3 into the solution, the concentration of the Cl anions increased to 0.55 M. Consequently, the concentration of Sn–chloride complexes in the acidic region rose in respect to the concentration of [Sn(tart)] complexes which dropped to approximately half of its initial value (0.02 M) (Figure 1b,c) and therefore does not precipitate. The second possible explanation is based on the existence of bimetallic Sn–Fe-tartrate complexes [17]. In order to decide which explanation is correct, the concentration of Cl anions in the single metal Sn electrolyte was adjusted to 0.55 M by adding (NH4)Cl and the modified electrolyte was aged on a hot plate. After approximately half an hour, large amounts of a Sn-rich precipitate appeared. Based on this observation, we might conclude that single metal Sn electrolyte at the pH value of 1.8 was stabilized by the creation of bimetallic Fe–Sn-tartrate complexes.
As the pH of the mixed Fe(III)–Sn(II) electrolyte increased to the value of 2.5 and 3.0, crystalline [Sn(tart)] precipitates appeared again (Table 3, Figure 7). According to the species distribution (Figure 1c), at the pH value around 3.5, the concentration of the [Sn(tart)] drops down to 0 M. In the aged electrolyte at this pH value, only marginal amount of the precipitation appeared. After the filtration of the initial precipitate, the electrolyte appeared stable, without color change and further precipitation for more than a week. The amount of the filtered precipitate was not sufficient for a detailed analysis and the EDX and XRD analyses were not conclusive. For this reason, the electrolyte with the pH value of 3.5 was considered as stable.
In the electrolyte with a pH value of 4.5, Fe-rich amorphous precipitates were detected (Table 3, Figure 7). This finding agrees with the speciation distribution, where Fe-hydroxides start to appear around the pH value of 4.0 (Figure 1d). During the electrodeposition process, the Fe hydroxides could be formed at bulk electrolyte pH values lower than 4.0 due to the local increase of the pH on the cathode surface. This observation agrees with the assumption that the Fe–Sn anomalous co-deposition is caused by the presence of Fe hydroxides on the cathode surface.

4. Conclusions

A novel Fe(III)–Sn(II) tartrate electrolyte for electrodeposition of Fe–Sn was introduced. Structural characterization on Hull cell samples deposited with current densities of 20 and 80 mA/cm2 in the pH range of 1.8 to 4.5 was performed. Electrolyte stability was investigated in the same pH range and the results were compared with the electrolyte speciation. The anomalous co-deposition of Fe–Sn was observed for the first time. It was found out that the mechanism of the Fe–Sn electrodeposition changed from regular to anomalous at a pH value of 3.0 and a current density of approximately 30 mA/cm2. The possible explanation is that the Sn reduction was suppressed by the Fe-hydroxides which developed on the electrode surface at higher pH values.
The ferromagnetic Fe5Sn3 and Fe3Sn phases, which were electrodeposited for the first time, were detected in all samples. Besides them, pure Sn and FeSn2 were present in all studied samples. Additionally, α-Fe was detected in the samples deposited with a current density of 20 mA/cm2 with the pH values between 3.0 and 4.5 as well as with 80 mA/cm2 with the pH values of 3.0 and 3.5.
Two electrolyte stability windows were found. In the first one, with the pH value around 1.8, the electrolyte is stabilized by forming bimetallic Fe–Sn-tartrate complexes. Moreover, the optimum conditions for Fe5Sn3 electrodeposition were found to be at this pH value and the current density of 20 mA/cm2. The second electrolyte stability window was found around the pH value of 3.5 where Sn was mostly present in the form of [Sn(tart)2]2− complexes and Fe in the form of [Fe(tart)]+ complexes. At this pH value, Fe–Sn undergoes anomalous co-deposition over the whole current density range.

Author Contributions

Conceptualization, S.M.Z. and S.H.; Methodology, S.M.Z. and S.H.; Software, S.M.Z.; Validation, S.M.Z., E.D. and R.M.; Investigation, S.M.Z. and E.D.; Resources, W.E.G.H.; Writing–Original Draft Preparation, S.M.Z. and W.E.G.H.; Writing–Review & Editing, S.M.Z., R.M. and W.E.G.H.; Visualization, S.M.Z.; Supervision, W.E.G.H. and W.K.; Project Administration, W.E.G.H.; Funding Acquisition, W.E.G.H.

Funding

This research was funded by HORIZON2020 SELECTA project (No. 642642).

Acknowledgments

Authors would like to thank Veronika Grman (HES) for conducting the SEM/EDX analyzes.

Conflicts of Interest

The authors declare no conflict of interest. The founding sponsors had no role in the design of the study; in the collection, analyses, or interpretation of data; in the writing of the manuscript, or in the decision to publish the results.

References

  1. Dionisio, P.H.; Vasquez, A.; Hallouche, B.; Mosca, D.H., Jr.; Teixeira, S.R.; Schreiner, W.H.; Pasa, A.A. Structural and magnetic properties of iron-tin thin films. Thin Solid Films 1992, 217, 152–155. [Google Scholar] [CrossRef]
  2. Sales, B.C.; Saparov, B.; McGuire, M.A.; Singh, D.J.; Parker, D.S. Ferromagnetism of Fe3Sn and alloys. Sci. Rep. 2014, 4, 7024. [Google Scholar] [CrossRef] [PubMed]
  3. Giefers, H.; Nicol, M. High pressure X-ray diffraction study of all Fe–Sn intermetallic compounds and one Fe–Sn solid solution. J. Alloy. Compd. 2006, 422, 132–144. [Google Scholar] [CrossRef]
  4. Gerasimov, K.B.; Boldyrev, V.V. On mechanism of new phases formation during mechanical alloying of Ag–Cu, Al–Ge and Fe–Sn systems. Mater. Res. Bull. 1996, 31, 1297–1305. [Google Scholar] [CrossRef]
  5. Yelsukov, E.P.; Voronina, E.V.; Konygin, G.N.; Barinov, V.A.; Godovikov, S.K.; Dorofeev, G.A.; Zagainov, A.V. Structure and magnetic properties of Fe100−xSnx (3.2 < x < 62) alloys obtained by mechanical milling. J. Magn. Magn. Mater. 1997, 166, 334–348. [Google Scholar]
  6. Haftek, E.; Tan, M.; Barnard, J.A. Microstructure and magnetic properties of ferromagnetic Fe–Sn alloy thin films. Ultramicroscopy 1992, 47, 400–407. [Google Scholar] [CrossRef]
  7. Kadyrzhanov, K.K.; Rusakov, V.S.; Korshiyev, B.O.; Turkebaev, T.E.; Vereschak, M.F. Thermally induced processes of intermetalloid phase formation in laminar systems Fe–Sn. Hyperfine Interact. 2004, 156, 623–628. [Google Scholar] [CrossRef]
  8. Kientz, M.O.; Le Caer, G.; Delcroix, P.; Fournes, L.; Fultz, B.; Matteazzi, P.; Malaman, B. 57Fe and 117Sn mossbauer spectrometry studies on nanocrystallone Fe–Sn solid solutions. NanoStruct. Mater. 1995, 6, 617–620. [Google Scholar] [CrossRef]
  9. Yamamoto, T.; Nohira, T.; Hagiwara, R.; Fukunaga, A.; Sakai, S.; Nitta, K. Electrochemical behavior of Sn–Fe alloy film negative electrodes for a sodium secondary battery using inorganic ionic liquid Na[FSA]–K[FSA]. Electrochim. Acta 2016, 211, 234–244. [Google Scholar] [CrossRef]
  10. Chisholm, C.U.; El-Sharif, A.; Kuzmann, E.; Stichleutner, S.; Homonnay, Z.; Vertes, A. Electrodeposition of Sn–Fe alloys using gluconate electrolytes and X-ray diffractometry and Mössbauer studies of the deposits. Mater. Chem. Phys. 2010, 120, 558–565. [Google Scholar] [CrossRef]
  11. Hsieh, Y.H.P.; Hsieh, Y.P. Kinetics of Fe(III) reduction by ascorbic acid in aqueous solutions. J. Agric. Food Chem. 2000, 48, 1569–1573. [Google Scholar] [CrossRef] [PubMed]
  12. Gustafsson, J.P. Visual MINDTEQ 3.1 2014. Available online: https://vminteq.lwr.kth.se/ (accessed on 11 April 2019).
  13. Hyperquad Simulation and Speciation Software. Available online: http://www.hyperquad.co.uk/hyss.htm (accessed on 11 April 2019).
  14. Andrle, C.; Jelinek, T.W. Hull-Zelle: zur Untersuchung von Galvanischen Elektrolyten, 1st ed.; Eugen G. Leuze Verlag: Bad Saulgau, Germany, 2007. [Google Scholar]
  15. Guaus, E.; Torrent-Burgués, J. Voltammetric study of Sn(II) reduction on a glassy-carbon electrode from sulfate-tartrate baths. Russ. J. Electrochem. 2006, 42, 141–146. [Google Scholar] [CrossRef]
  16. Lingane, J.J. Polarographic characteristics of stannous and cupric tartrate complexes and amperometric titration of tin with cupric ion in tartrate medium. J. Am. Chem. Soc. 1943, 65, 866–872. [Google Scholar] [CrossRef]
  17. Smith, T.D. Chelates formed by tin(II) with citric and tartaric acids, and their interaction with certan transition-metal ions. J. Chem. Soc. 1965, 0, 2145–2150. [Google Scholar] [CrossRef]
  18. Lide, D.R. CRC Handbook of Chemistry and Physics, 85th ed.; CRC Press: Boca Raton, FL, USA, 2004. [Google Scholar]
  19. Akiyama, T.; Fukushima, H. Recent study on the mechanism of the electrodeposition of iron-group metal alloys. ISIJ Int. 1992, 32, 787–798. [Google Scholar] [CrossRef]
  20. Lowenheim, F.A. Electroplating; McGraw-Hill: New York, NY, USA, 1978. [Google Scholar]
  21. Hansal, W.E.G. Pulse Plating; Eugen G. Leuze Verlag: Bad Saulgau, Germany, 2012. [Google Scholar]
  22. Pletcher, D.; Greff, R.; Peat, R.; Peter, L.M.; Robinson, J. Instrumental Methods in Electrochemistry; Woodhead Publishing Limited: Cambridge, UK, 2001. [Google Scholar]
  23. Zech, N.; Podlaha, E.J.; Landolt, D. Anomalous codeposition of iron group metals: I. Experimental results anomalous codeposition of iron group metals. J. Electrochem. Soc. 1999, 146, 2886–2891. [Google Scholar] [CrossRef]
  24. Dahms, H.; Croll, I.M. The anomalous codeposition of iron-nickel alloys. J. Electrochem. Soc. 1965, 112, 771–775. [Google Scholar] [CrossRef]
  25. Zangari, G. Electrodeposition of alloys and compounds in the era of microelectronics and energy conversion technology. Coatings 2015, 5, 195–218. [Google Scholar] [CrossRef]
  26. El-Sharif, M.; Chisholm, C.U.; Kuzmann, E.; Sziráki, L.; Stichleutner, S.; Homonnay, Z.; Süvegh, K.; Vértes, A. The structure and composition of novel electrodeposited Sn–Fe and Sn–Co–Fe alloys from a flow circulation cell system. Hyperfine Interact. 2009, 192, 1–12. [Google Scholar] [CrossRef]
  27. Kuzman, E.; Sziraki, L.; Lak, G.B.; Stichleutner, S.; Havancsak, K.; Süvegh, K.; El-Sharif, M.; Chisholm, C.U.; Homonnay, Z.; Vértes, A. Mössbauer, X-ray diffraction, and microscopy investigations of novel electrodeposited amorphous alloys. AIP Conf. Proc. 2012, 1489, 3–12. [Google Scholar]
Figure 1. Calculated electrolyte speciation from the pH value 0 to 13: (a) Supporting electrolyte, without any metal ions, (b) Sn (0.11 M) single metal electrolyte, (c) Sn(II) species in the mixed Fe(III)–Sn(II) electrolyte, and (d) Fe(III) species in the mixed Fe(III)–Sn(II) electrolyte.
Coatings 09 00313 g001aCoatings 09 00313 g001b
Figure 2. Cyclic voltammograms (CVs) of the supporting electrolyte recorded at different pH values of the electrolyte (offset 10 mA/cm2) with the scan rate of 50 mV/s.
Coatings 09 00313 g002
Figure 3. CVs in the Fe(III)–Sn(II) electrolytes (both Fe and Sn 0.11 M) recorded at different pH values. The cathode was polarized first until −1303 mV and then until −703 mV vs. standard hydrogen electrode (SHE) with the scan rate of 50 mV/s.
Coatings 09 00313 g003
Figure 4. CVs in single metal Fe(III)-tartrate electrolyte recorded with the scan rate of 50 mV/s at the pH value of 1.8. The cathodic reverse potential was varied from −703 to −1303 mV vs. SHE. The position of Fe reduction potential was estimated according to the appearance of the anodic dissolution peak.
Coatings 09 00313 g004
Figure 5. Change of the iron content in the deposits as a function of the current density. Samples were prepared from the Fe(III)–Sn(II) electrolytes with the pH values of 3.5 and 4.5. Iron-rich deposits were prepared starting from the current density 30 mA/cm2 at the pH = 3.5.
Coatings 09 00313 g005
Figure 6. The most relevant part of the XRD diffraction pattern (2θ: 27–47°) for the phase identification. Samples were deposited from the Fe(III)–Sn(II) electrolytes (both Fe and Sn 0.11 M) at different pH values with the current density of: (a) 20 mA/cm2, (b) 80 mA/cm2.
Coatings 09 00313 g006
Figure 7. XRD diffraction patterns of precipitates isolated from the Sn- single metal and mixed Fe(III)–Sn(II) electrolytes at the different pH values.
Coatings 09 00313 g007
Table 1. SEM topography images and energy dispersive X-ray detector (EDX) stoichiometry results from Hull cells samples deposited with the approximate current densities of 20 and 80 mA/cm2.
pH20 mA/cm280 mA/cm2
SEM 2kO:Sn:Fe (at %)SEM 2kO:Sn:Fe (at %)
4.5 Coatings 09 00313 i00130.8:16.8:52.4 Coatings 09 00313 i00221.0:21.5:57.5
3.5 Coatings 09 00313 i00330.8:26.8:42.4 Coatings 09 00313 i00429.9:20.1:50.0
3 Coatings 09 00313 i00540.4:37.5:22.1 Coatings 09 00313 i00634.4:24.9:40.7
2.5 Coatings 09 00313 i00738.5:46.3:15.2 Coatings 09 00313 i00831.2:38.1:30.7
1.8 Coatings 09 00313 i00948.7:45.0:6.3 Coatings 09 00313 i01036.6:38.1:25.3
Table 2. Comparison of the mass fractions and crystallite sizes of the detected metallic phases of the deposited samples. Mass fractions were calculated with the use of the Rietveld method and the crystallite sizes were determined by the Pawley method by volume weighted column length.
pHJ
(mA/cm2)
SnFeSn2Fe5Sn3Fe3SnFe
wt %Cryst. Size
(nm)
wt %Cryst. Size
(nm)
wt %Cryst. Size
(nm)
wt %Cryst. Size
(nm)
wt %Cryst. Size
(nm)
4.5209.764319.7143.2770.442366.8 *14 *
3.511.4 *52 *26.6 *14 *11.8 *5.4 *0.111450.1512
3.048.754025.3 *15 *12.95320.3 *19 *12.8 *10 *
2.577.9 *80 *10.566411.5648
1.862.99915.696420.87530.6 *19 *
4.58010.181684.2 *13 *5.5 *9.5 *0.079
3.516.057134.7 *10 *5.2 *7.3 *0.291643.2915
3.019.413833.3 *14 *3.6 *19 *0.5 *10 *43.2 *14 *
2.567.827329.4 *16 *2.1 *7 *0.7 *19 *
1.837.66552.1 *9 *10.2340.1 *10 *
*: data with higher uncertainty due to the overlapping diffraction maxima.
Table 3. Stoichiometry of the precipitates isolated after approximately 3 h of the electrolyte aging.
pHO:Sn:Fe
(at %)
4.583.0:1.8:15.2
3.5electrolyte does not precipitate
387.4:11.3:1.3
2.585.1:14.1:0.8
1.8electrolyte does not precipitate
1.8 *89.2:10.8:–
*: Sn single metal electrolyte (0.11 M).

