Abstract
Glass fiber-reinforced composites are exposed to hydrolytic degradation in subsea and offshore applications. Fiber-matrix interphase degradation was observed after the matrix was fully saturated with water and typical water absorption tests according to ASTM D5229 were stopped. Due to water-induced dissolution, fiber-matrix interphase flaws were formed, which then lead to increased water uptake. Cutting sample plates from a larger laminate, where the fibers were running parallel to the 1.5 mm long short edge, allowed the hydrolytic degradation process to be studied. The analysis is based on a full mechanistic mass balance approach considering all the composite’s constituents: water uptake and leaching of the matrix, dissolution of the glass fibers, and dissolution of the composite interphase. These processes were modeled using a combination of Fickian diffusion and zero-order kinetics. For the composite laminate studied here with a saturated epoxy matrix, the fiber matrix interphase is predicted to be fully degraded after 22 to 30 years.
Keywords:
composites; sizing; interphase; glass fibers; environmental degradation; aging; model; kinetics; durability; hydrolysis 1. Introduction
Fiber-reinforced polymer (FRP) composites have experienced a rapid rise in use in the past 50 years due to their high strength, stiffness, relatively light weight and good corrosion resistance, especially when compared with more traditional structural materials such as steel and aluminum [1]. The reason for such superior performance is the synergistic interaction between the constituent materials inside the composite [1]. One such material is the sizing, which is a multi-component coating on the surface of the fibers. During the manufacture of FRPs, this results in the formation of a sizing-rich composite interphase between the reinforcing fibers and the matrix polymer [2]. This composite interphase is of vital importance since the mechanical properties of composite materials are often determined by whether the mechanical stresses can be efficiently transferred from the matrix to the reinforcing fibers [3,4,5]. The quality of the interfacial interaction is strongly dependent on the adhesional contact and the presence of flaws in the interphase [6]. It is generally agreed that the composite interphase is often the mechanical weak link and a potential source for the initiation of defects in fiber-reinforced composite structures [5].
Composite laminates are often exposed to aqueous and humid environments. Environmental aging is especially interesting for marine, offshore and deep-water applications of composites, such as oil risers and tethers [7,8,9,10,11,12]. It has been reported that water and humid environments negatively impact the mechanical properties of FRPs partially because of a loss of the interfacial bonding [5,12,13,14,15]. Flaws in the interphase can be introduced due to the interaction of the interphase with water taken up from the environment [6]. The removal of the sizing material can also lead to a microcrack initiation at the surface of glass fibers. Furthermore, various sizing components can be extracted by water, resulting in the loss of the material [16,17,18,19,20]. Quantifying the water-induced aging is especially important for glass fiber-reinforced composites since the glass fibers are highly hygroscopic [5]. The environmental durability is one of the limiting factors in the structural applications [21], since the superior strength and stiffness of such materials are often compromised by the uncertainty of the material’s interaction with the environment [22]. Durability is a primary issue because environmental factors such as moisture, temperature and the state of stress to which the material is exposed can degrade interfacial adhesion as well as the properties of the constituent phases. Environmental aging is mainly important at high temperatures, since the dissolution reactions are accelerated at higher temperatures. Therefore, it is of great importance to understand the environmental aging and dissolution kinetics of a sizing-rich composite interphase.
1.1. Sizing and its Composition
The sizing which forms the interphase, has typically a proprietary composition. Available information about commercial glass fibers tends to contain only one or two sizing-related details. The first is an indication of the chemical compatibility of the sizing with the matrix polymer, e.g., epoxy, as in this case. The second is a value for the loss on ignition (LOI), which indicates the amount of sizing [23]. The key functions of the sizing are: (1) to protect the glass fibers during handling and production; (2) to ensure a high level of stress transfer capability across the fiber-matrix interphase; and (3) to protect the composite matrix interphase against environmental degradation [12].
A typical sizing consists of about 20 chemicals. The most important chemical is an organofunctional silane commonly referred to as a coupling agent [24,25,26], which is the main component that promotes adhesion and stress-transfer between the polymer matrix and the fiber [12]. It also provides improvements in the interphase strength and hygrothermal resistance of the composite interphase [26,27,28]. The silane coupling agents have the general structure [X–Si(–O–R)3] where R is a methyl or ethyl group and X is a reactive group towards the polymer, in this case, an amine group. When applied to fibers, a silane coupling agent is first hydrolyzed to a silanol in presence of water. It is unstable and further condenses onto the fibers by producing a siloxane/poly(siloxane) network, which then partially becomes covalently bonded to the glass fiber surface. During the composite manufacture, the X reactive groups of the silane may react with the thermosetting matrix polymer, leading to a strong network bridging between the fiber and the matrix [12].
Although there are many different silane molecules available, the aminosilanes form the largest proportion of silanes employed in the composites industry [12]. The most common coupling agent is an aminosilane compound called γ-aminopropyltriethoxysilane (γ-APS), also known as APTES, which is the coupling agent in the studied sizing [16]. Usually sizings contain about 10 wt % of the coupling agent [29].
The composition of the sizing also consists of a number of multi-purpose components, such as a film former which holds the filaments together in a strand and protects the filaments from damage through fiber–fiber contact. Film formers are as closely compatible to the polymer matrix as possible. Epoxies, such as in this case, are very common film formers [12]. Usually sizings contain about 70–80 wt % of the film former [12,29].
Much less is known about the other chemicals in the sizing [12]. The sizing may also contain other compounds such as cationic or non-ionic lubricants, antistatic agents, emulsifiers, chopping aids, wetting agents or surfactants, and antioxidants [2,12,30]. Poly(propylene oxide) (PPO) or its co-polymer with poly(ethylene oxide) (PEO) is often used as a surfactant in sizings [2]. Polydimethylsiloxane (PDMS) is a common adhesion promoter, wetting agent, or surface tension reducer [2].
The exact composition of the sizing used in this study was not known to the authors, but based on technical details on the given R-glass fibers elsewhere [16], it is assumed that the sizing is based on the general characteristics described above. The results obtained are compatible with this assumption.
1.2. The Structure of the Sizing-Rich Composite Interphase
The structure of the sizing-rich composite interphase is very complex [12], as the sizing itself is heterogeneous and not uniform [12,31,32]. Furthermore, it has been observed by various researchers, that sizing is coated on fibers in “islands”, “islets” or in patches, meaning that the fiber surface is only partially covered by the sizing, also giving some roughness to the surface [12,33,34,35,36,37,38]. Thomason and Dwight have concluded that epoxy-compatible sizings cover at least 90% of the glass fiber surface [39]. Mai et al. investigated APTES sizings using atomic force microscopy (AFM) and concluded that sized fibers are rougher than unsized fibers [38]. Also, similar conclusions were drawn by a few other researchers, including Turrión et al., who have shown that thickness of the sizing on the glass fibers varies from some nanometers up to a few hundred nanometers due to roughness [6,31,37].
With regards to the molecular structure of the interphase, APTES forms chemical covalent and physico-chemical hydrogen bonds and van der Waals interactions with the glass fibers and the amine epoxy [12,40]. The majority of APTES molecules which react with the glass surface can only form single Si–O–Si bonds with the glass due to steric limitations, while the vast majority of Si–O–Si bond formation in the silane interphase is due to polymerization—formation of the poly(siloxane) network [12]. A multilayer is formed on the glass fiber surfaces where the amino groups form intramolecular ring structures [32,41].
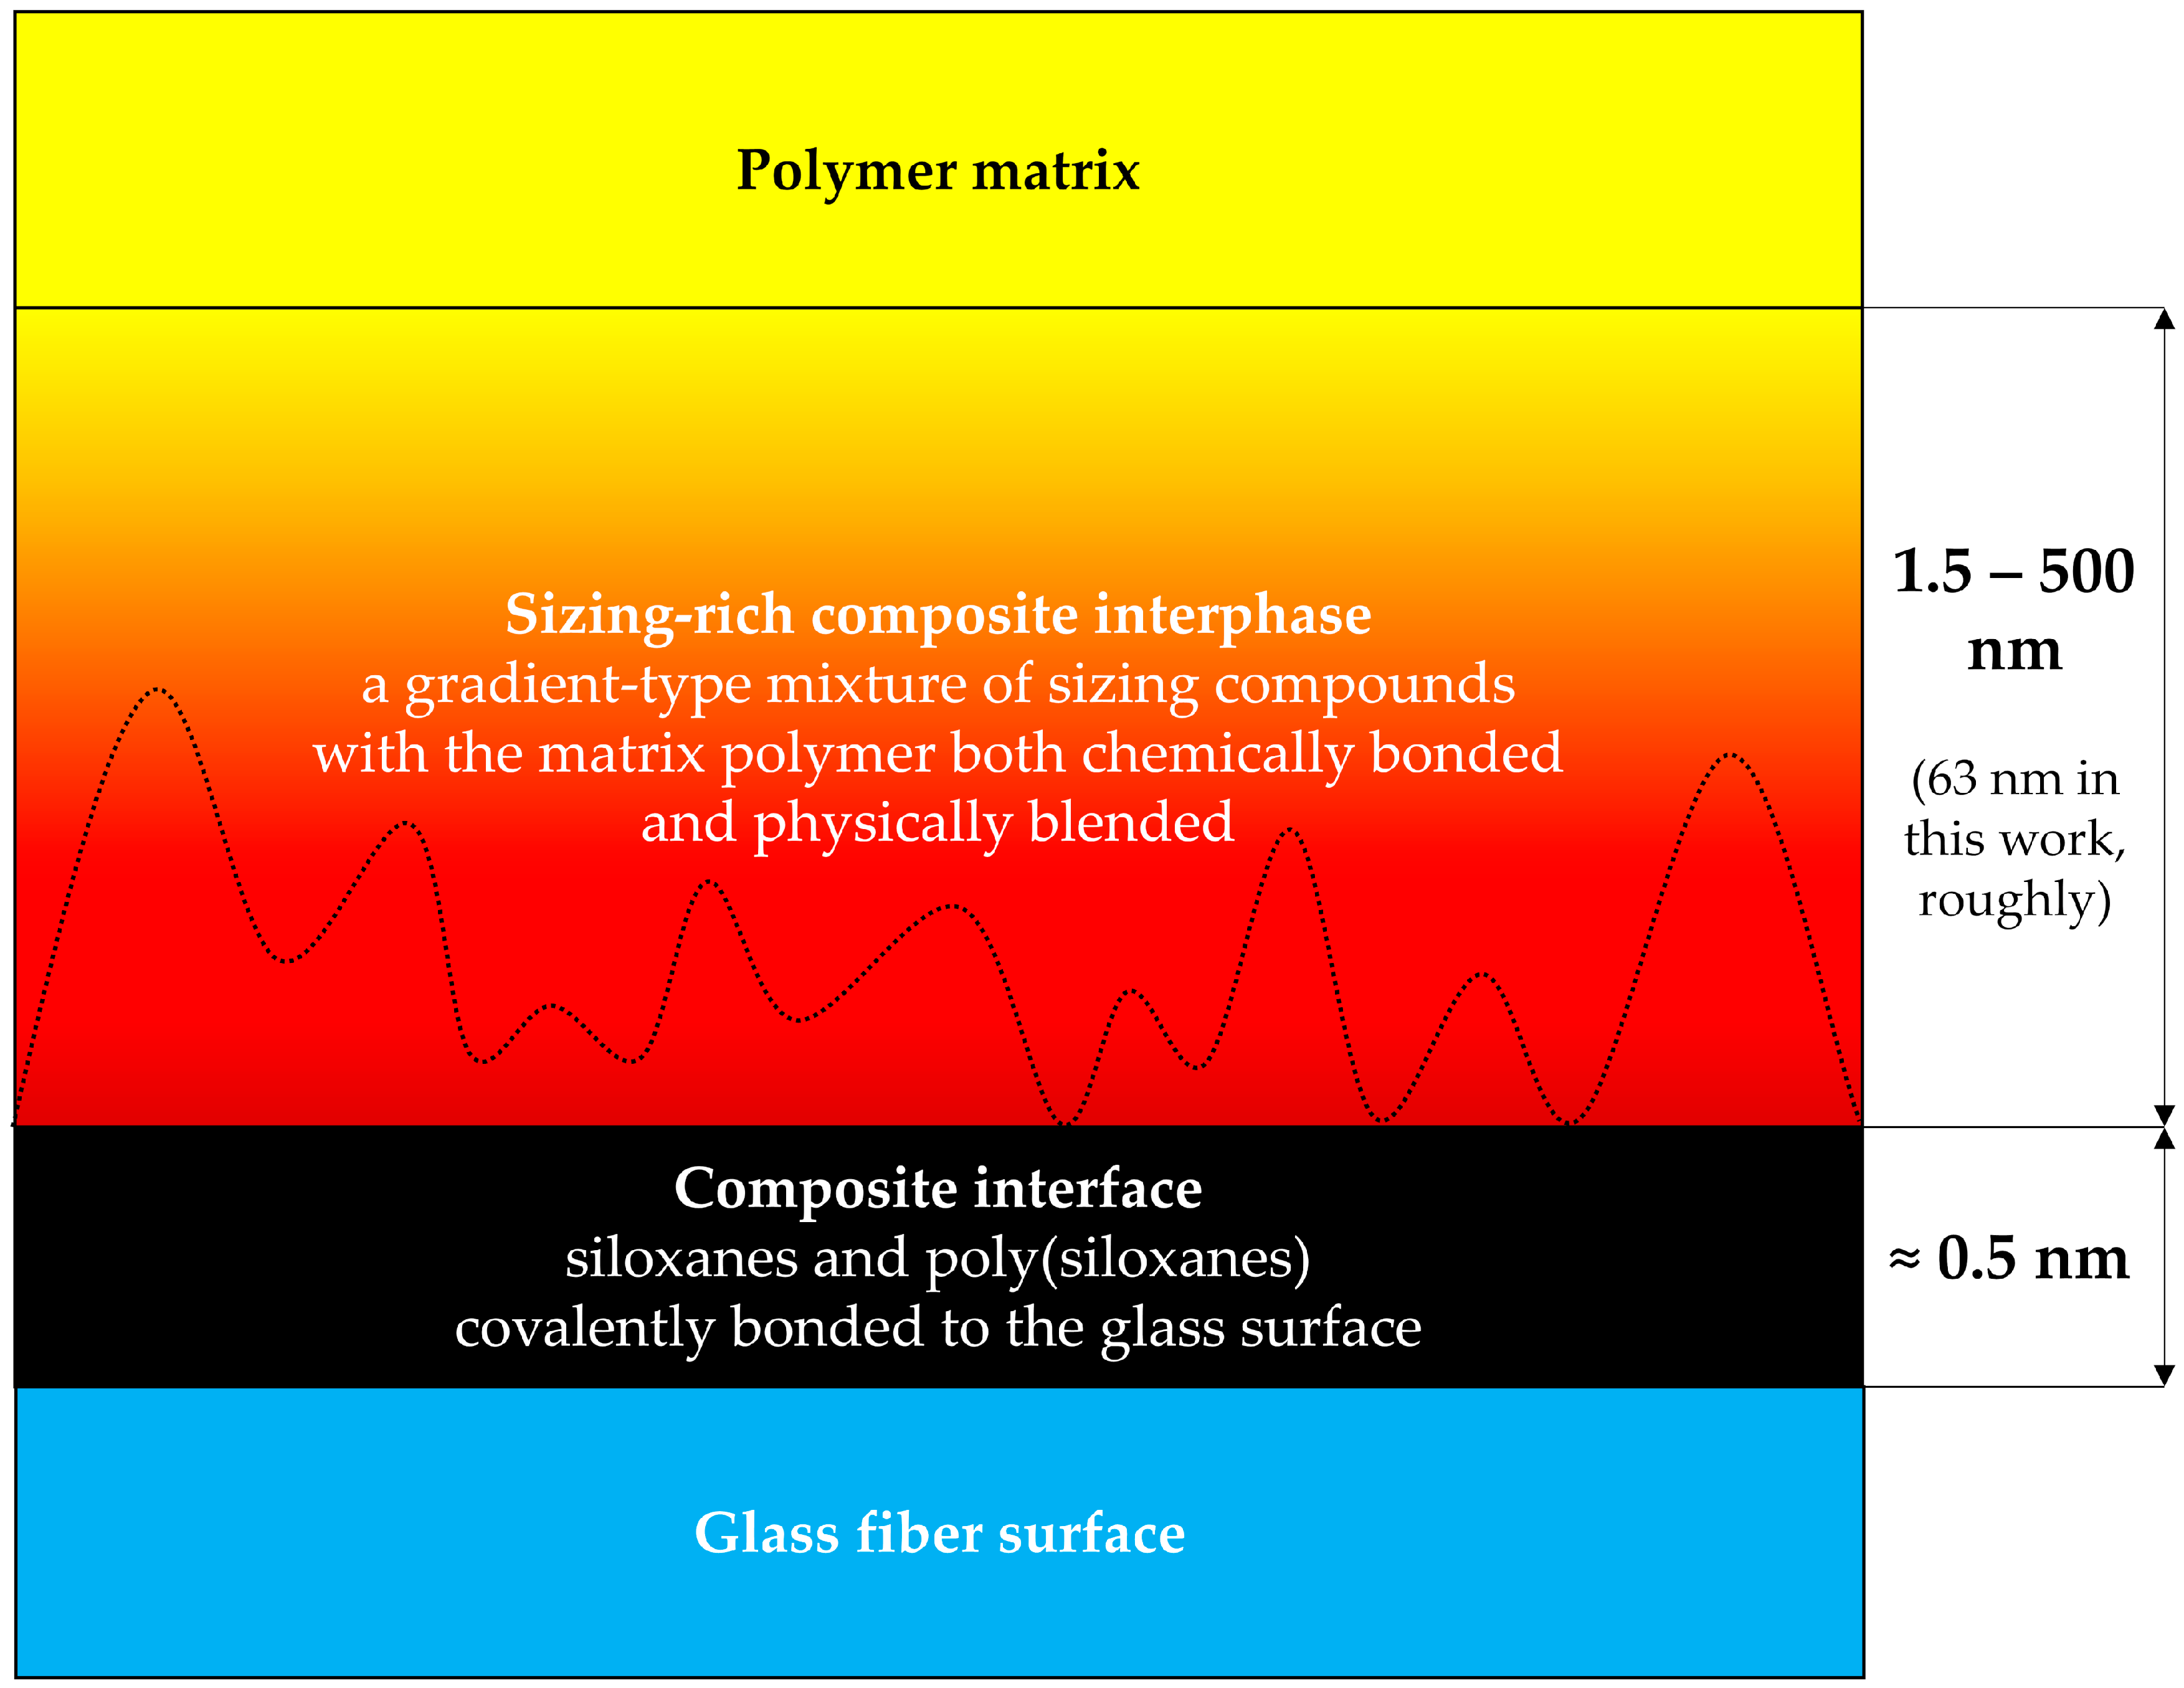
The concept of a composite interphase can be represented by a matrix polymer/poly(siloxane)/glass fiber model (shown in Figure 1) [5].
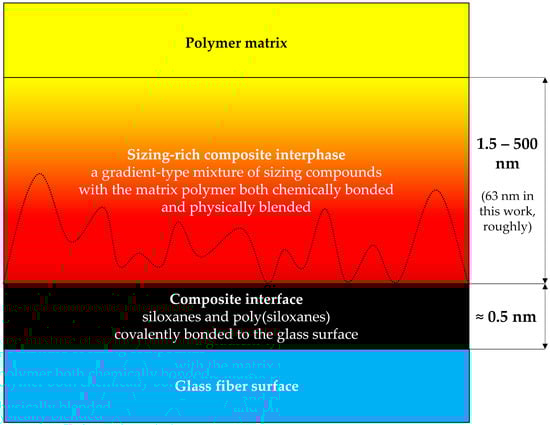
Figure 1.
The concept of a polymer–siloxane–glass interphase, after [5]. The dotted line indicates that the sizing is rough [6,31,38].
The siloxanes and poly(siloxanes) form covalent bonds with the glass fiber surface, resulting in a two-dimensional interface, the thickness of which is governed by the length of the chemical bonds, and is of an ångstrøm-scale (one tenth of a nanometer) [5].
The composite interphase is a gradient-type blend of the sizing compounds and the bulk matrix polymer, usually being about a micrometer in thickness [5,12,29,42,43]. It was observed, that an interfacial failure occurs at 0.5–4 nm from the glass surface in glass/γ-APS/epoxy interphase, indicating that the interphase region, rather than the two-dimensional interface is the weak link [5].
1.3. The Aim of This Work
Composites take up water from their surroundings and may release some molecules into the surrounding water. Water uptake curves for composites are not straightforward to interpret since each constituent (matrix, fibers, sizing-rich interphase) interacts differently with the absorbed water. The mass uptake curve presents the combined effect of all these individual interactions.
Testing of water absorption is usually stopped when the composite material’s water uptake has reached a maximum. The typical test procedures follow ASTM D5229 [44], where testing is stopped when two subsequent measurements do not differ by more than 0.5% [44]. However, when exposure to water is extended for longer periods, experiments performed in this work showed that degradation of the composite continues and additional mass gain and loss processes are involved. A similar observation was made by Perreux et al. [45], who studied immersion in water of 2.7 mm thick glass fiber epoxy composite plates for up to 10 years. They found that the weight gain of plates aged at 60 °C increased strongly after saturation. After about five years in water at 60 °C, a composite plate started to continuously lose mass with time [45]. This study will show that these effects can be related to the hydrolytic degradation of the fiber/matrix interphase.
The aim of this manuscript is to describe the degradation of the fiber/matrix interphase with special emphasis on the reaction kinetics.
2. Materials and Methods
2.1. Materials
Composite laminates were made with an amine-cured epoxy. The epoxy was prepared by mixing reagents Epikote Resin RIMR135TM (Hexion, Columbus, OH, USA) and amine based Epikure Curing Agent RIMH137TM (Hexion), stoichiometrically, in a ratio of 100:30 by weight. The mixture was degassed in a vacuum chamber for 30 min in order to remove bubbles. The density of the polymer (ρm) was 1.1 g/cm3. Resin and hardener system consisted of the following compounds by composition: 0.63 wt % bisphenol A diglycidyl ether (DGEBA), 0.14 wt % 1,6-hexanediol diglycidyl ether (HDDGE), 0.14 wt % poly(oxypropylene)diamine (POPA) and 0.09 wt % isophorondiamine (IPDA) [46].
A typical glass fiber used for marine and oil and gas applications was selected: boron-free and fluorine-free high-strength, high-modulus 3B HiPer-TexTM W2020 R-glass (3B-the fiberglass company, Hoeilaart, Belgium). Stitch-bonded mats were used. The average fiber diameter was 17 ± 2 μm [47,48]. The density of glass (ρf) was 2.54 g/cm3 [47,48].
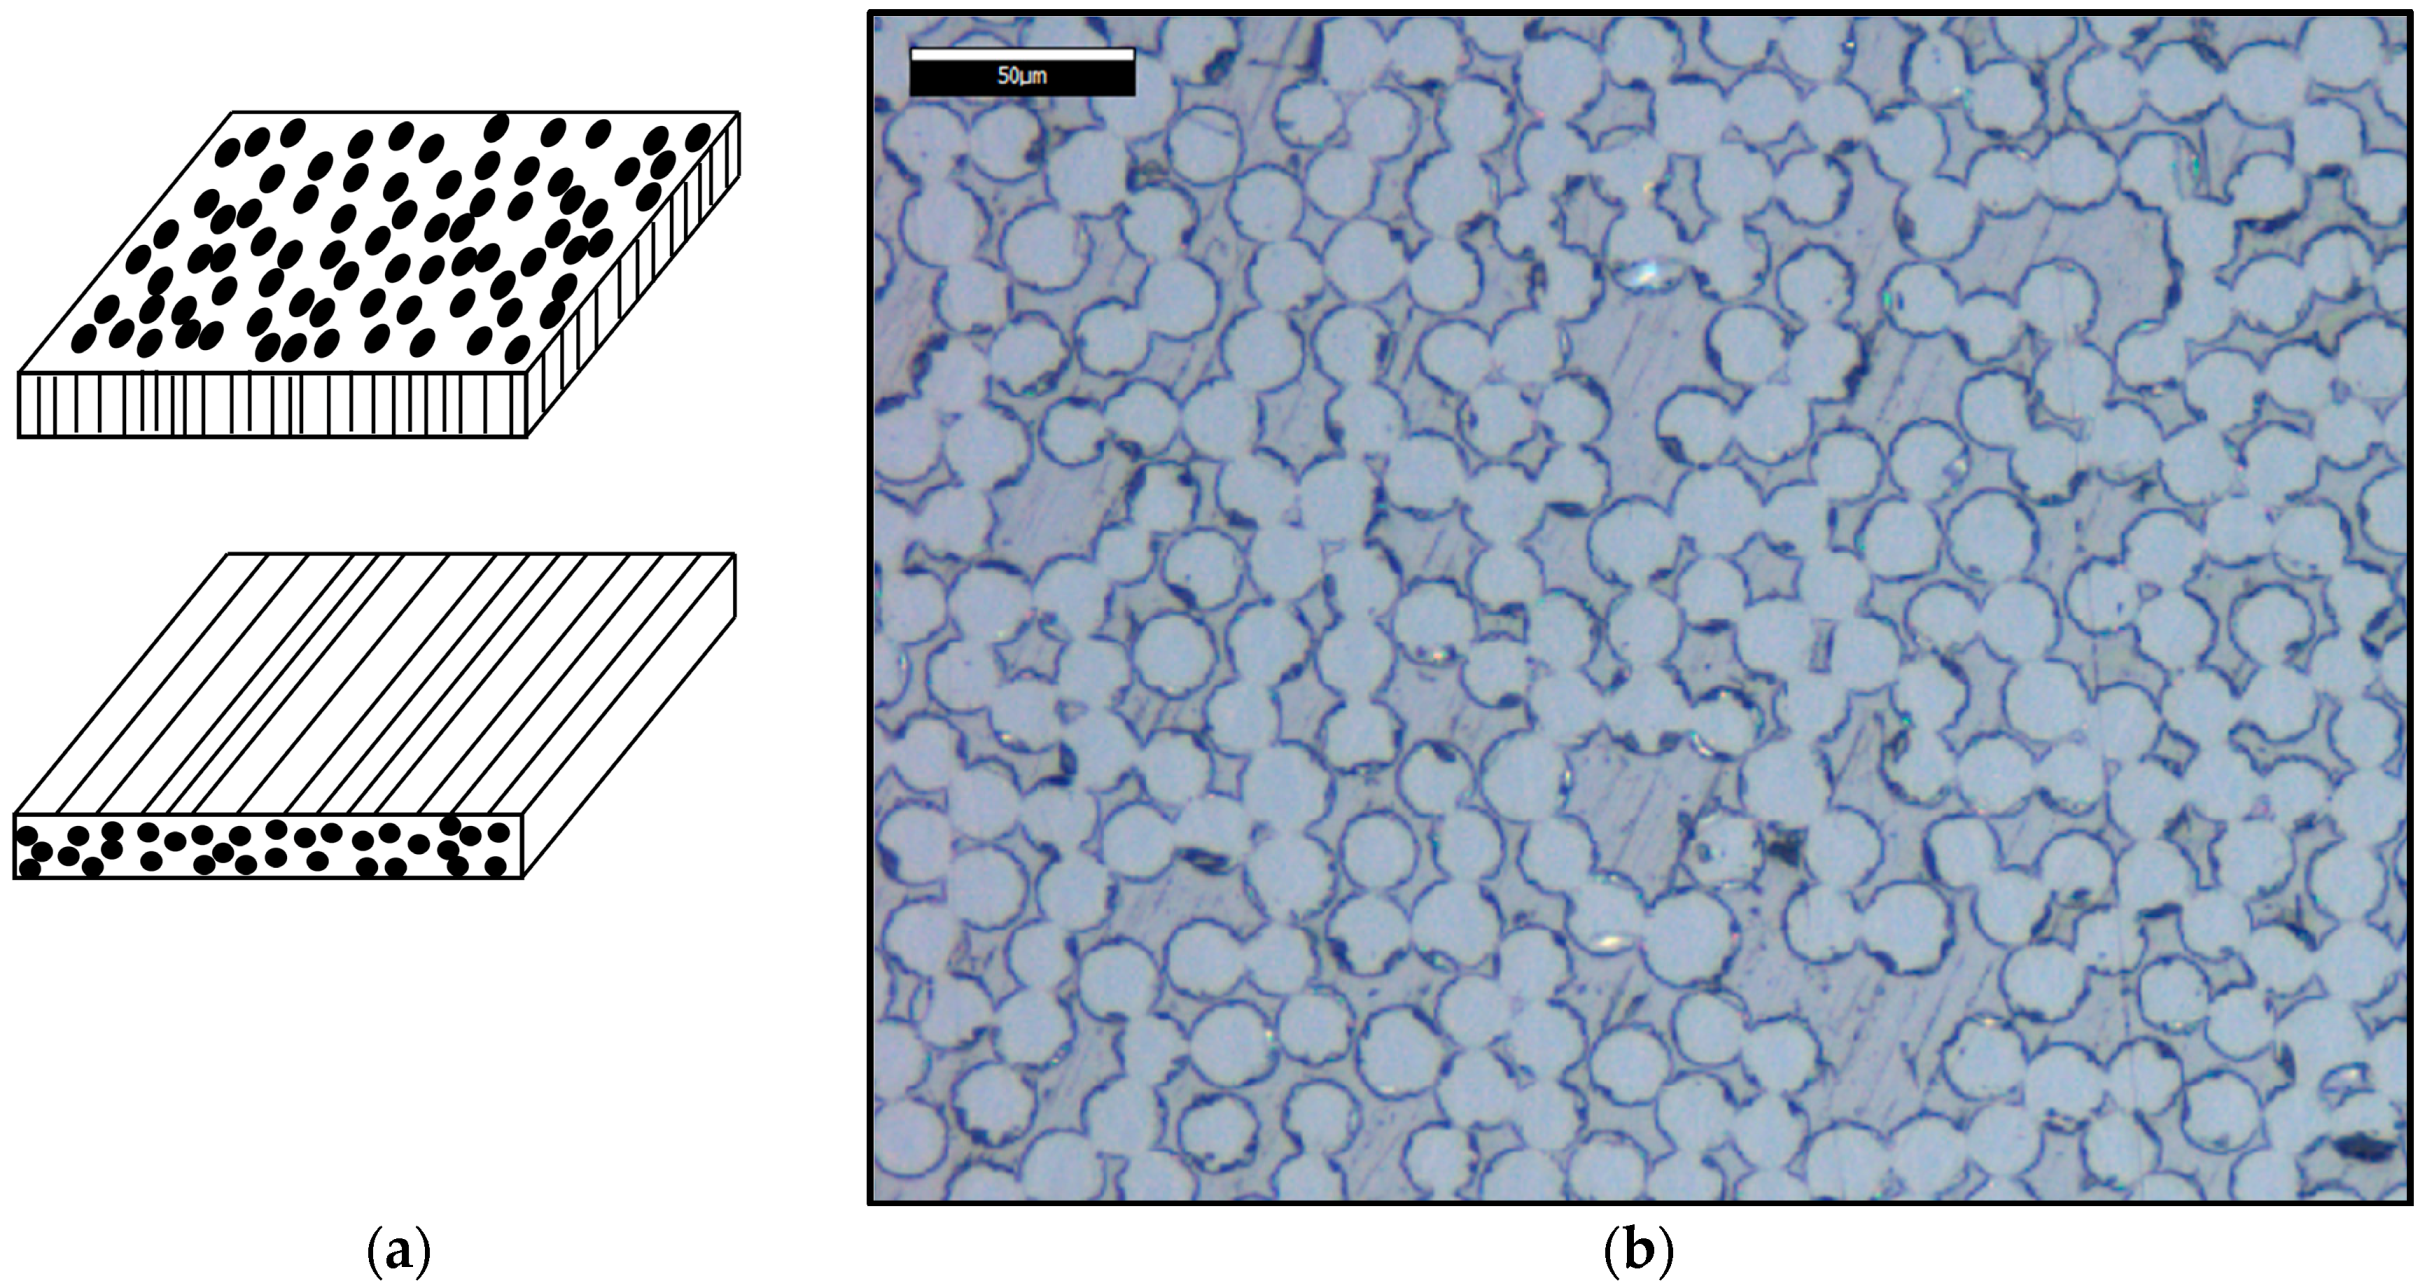
Composite laminates 50 mm thick were prepared via vacuum-assisted resin transfer molding (VARTM). Laminates were manufactured using the aforementioned fabrics and epoxy resin. The curing was performed at room temperature for 24 h, continued by post-curing in an air oven (Lehmkuhls Verksteder, Oslo, Norway) at 80 °C for 16 h. Full cure was achieved [46,49]. The composite laminates were cut into specimens with dimensions of 50 mm × 50 mm × 1.5 mm. The geometry of the samples and cross section of the fibers is shown in Figure 2. Two configurations C1 and C3 were cut, as shown in Figure 2. Configurations. C1 is representative of a typical composite where fibers are parallel to one of the long sides. The surface area of cut fibers with exposed cross sections is 50 mm × 1.5 mm. Configuration C3 was cut in a way that a maximum number of cut fibers were obtained having exposed cross sections (50 mm × 50 mm). The length of the fibers was just 1.5 mm. This unusual specimen was made to obtain maximum fiber exposure towards the water. The same specimens were also used to measure anisotropic diffusivity in a separate study [49]. The specified dimensions were achieved within 5% tolerance. The thickness was adjusted using a grinding and polishing machine Jean Wirtz PHOENIX 2000 (Jean Wirtz, Dusseldorf, Germany) and SiC discs (Struers, Cleveland, OH, USA; FEPA P500, grain size 30 µm).
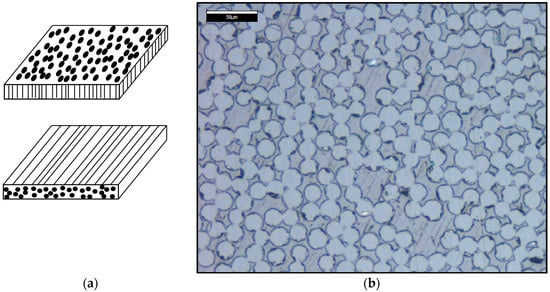
Figure 2.
Glass fiber-reinforced epoxy composite plates: (a) sample configuration indicating alignment of the fibers in the plate: C3 at the top; C1 at the bottom; (b) micrograph of the largest face of the composite plate showing the cross section of the fibers at the surface.
Figure 2 also shows a micrograph of a surface with visible cross sections of cut fibers from a specimen with C3 configuration. The micrograph was taken with a confocal microscope InfiniteFocus G4 (Alicona, Graz, Austria).
Distilled water (resistivity 0.5–1.0 MΩ·cm) was used for conditioning of the composite samples. It was produced using the water purification system Aquatron A4000 (Cole-Parmer, Vernon Hills, IL, USA). The pH of the distilled water was 5.650 ± 0.010, being lower than neutral due to dissolved CO2 from atmosphere in equilibrium.
2.2. Experimental Methods
2.2.1. Loss on Ignition
The loss on ignition (LOI) value of the fiber bundles was determined according to the standard practice ASTM D4963 [23]. This technique allows measurement of the weight loss of a sized glass sample. Since the weight loss is due to the burning off of the sizing, the method can be used to determine the amount of sizing on the fiber [12]. According to the LOI measurements, the sizing was 0.64 wt % of the sized fibers. The temperature during the LOI measurement was about 565 °C applied for about 5–5.5 h.
The obtained LOI is consistent with literature. LOI of most glass fiber reinforcement products is below 1.2 wt % [12]. For instance, Zinck and Gerard [50] also studied an APTES-based sizing which had a similar LOI value of 0.77 wt %.
2.2.2. Constituent Volume and Mass Fractions of the Composite
The fiber volume fraction of the composite was 59.5% and was determined using the burn-off test, after the ASTM Standard D3171 [51]. The void volume fraction of the composite was 0.44% and was measured by image analysis of optical microscope images, as was described elsewhere by Gagani et al. [49]. Fiber, matrix, interphase and voids volume fractions were 59.5%, 39.2%, 0.9% and 0.44%, respectively. The interphase volume fraction was obtained using the LOI value (0.64 wt %), the mass of sized glass fibers (about 5.6 g), the density of the interphase (1.1 g/cm3) and the mass of the composite (about 7.2 g). Fiber, matrix and interphase mass fractions were 77.2%, 22.3% and 0.5%, respectively. The fiber surface area of one plate was about 0.5 m2 on average. The composite interphase mass fraction () was calculated as:
where mfibers is the mass of the sized fibers; mcomp is the mass of the composite.
2.2.3. Conditioning of Composite Plates
Water uptake and hygrothermal aging of the composite laminates was conducted using a batch system. A heated bath with distilled water (60 ± 1 °C) was used for conditioning the samples. Samples were weighed using analytical scales AG204 (±0.1 mg; Mettler Toledo, Columbus, OH, USA). Samples were conditioned for a period of about a year. Three parallels were performed.
2.2.4. Specific Surface Area of the Fibers Obtained by N2 Sorption/Desorption and Brunauer–Emmett–Teller (BET) Theory
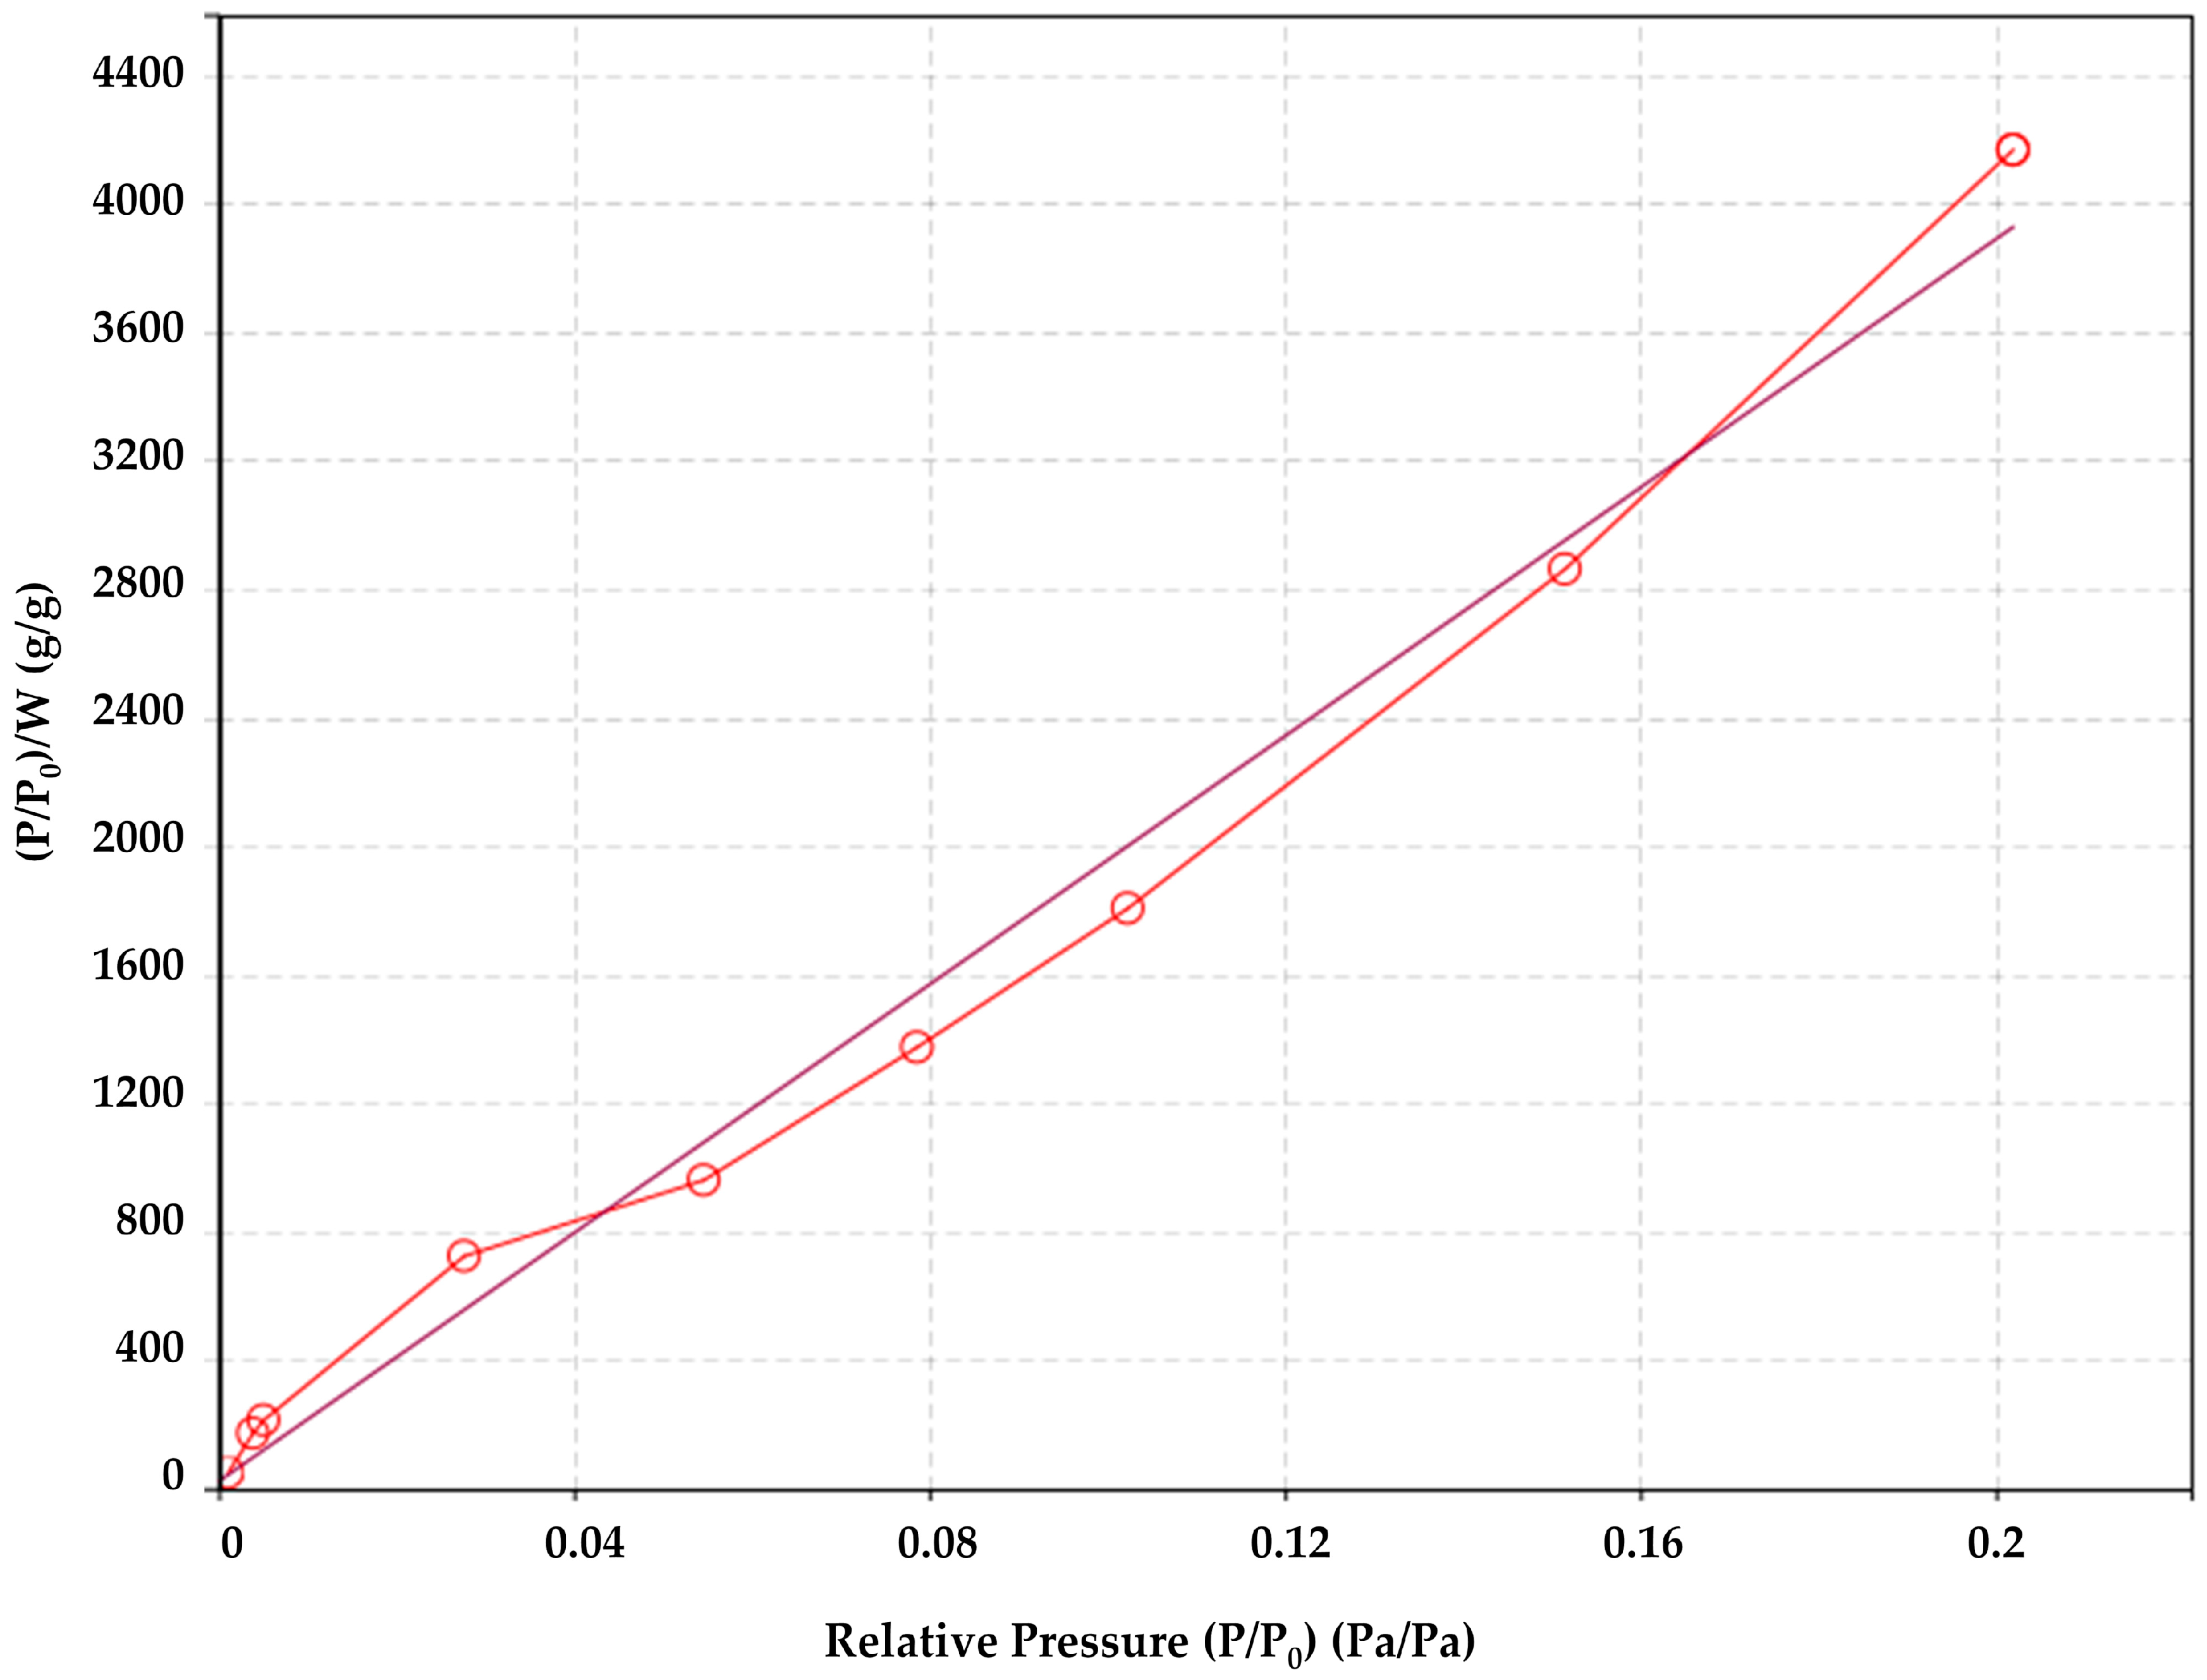
The specific surface area of the sized and unsized glass fibers was obtained via N2 sorption and desorption. The method uses physical adsorption and desorption of gas molecules based on the Brunauer–Emmett–Teller (BET) theory [52]. The specific surface area was measured using QUADRASORB SI (Quantachrome Instruments, Boynton Beach, FL, USA) equipment. BET tests for specific surface area determination were performed according to the international standard ISO 9277:2010(E) [53]. The method is based on the determination of the amount of adsorptive gas molecules covering the external surface of the solid [53].
Since the sizing’s surface is rough [12], the BET tests can provide the specific surface area. The BET theory explains the physical adsorption of gas molecules on a solid surface of a material, and it is the basis for the specific surface area determination.
Due to the roughness of the sizing on the fiber surface, the specific surface area of sized glass fibers measured with BET was 0.180 m2/g (see Figure 3), being higher than the specific surface area of unsized glass fibers of 0.09 m2/g (geometrical considerations as described in Section 2.1) or 0.084 m2/g using the BET method. For the unsized and sized glass fibers, the data with the BET model fit was with a determination coefficient R2 of 0.968 and 0.994, respectively.
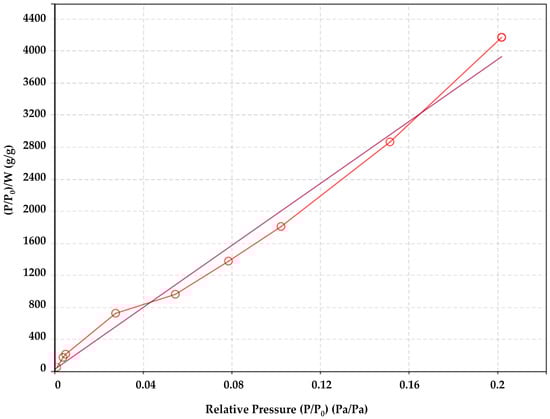
Figure 3.
Brunauer–Emmett–Teller (BET) analysis of the specific surface area of the sized fibers.
3. Analytical Model
3.1. Mass Balance
When polymers take up water from the environment, their mass is affected by the water uptake itself, leaching and aging mechanisms such as hydrolysis, chain scission or oxidation [46,54]. For the studied epoxy, there is no significant mass loss due to chemical bond scission, since hydrolysis and chain scission are not occurring [46,55].
The combination of the phenomenological perspective and mass balance approach provide a useful tool for analyzing mass uptake/loss processes in composites during hygrothermal aging by breaking down a complex process into constituent-related processes. The processes that affect weight gain or loss of composites are summarized in Table 1.

Table 1.
Summary of the processes during hygrothermal aging of composites that affect the mass balance.
Gravimetric measurements determine the sample’s mass over time during conditioning in water. The mass consists of the following terms:
The dissolution of the interphase is then simply given by:
The proposed model equation should be a phenomenologically full representation of the interaction between the composite material and the water environment. More details will now be given for each of the terms.
3.2. Water Uptake
The water uptake for composites includes three sub-processes: the uptake by the polymer matrix, by the interphase, and by the voids [49]. The glass fibers themselves do not absorb any water.
The water taken up by the polymer matrix at any point of time is limited by the diffusivity and the water saturation level [49,54]. The Fickian diffusion model can be used to model the water uptake by the polymer and the interphase [49]. In addition, the effect of voids being filled with water has to be considered [12,49]. The water content at saturation of the studied epoxy is 3.44 wt % if no voids are present [56]. Saturation has been defined as the moment when the difference in two consecutive water absorption measurements is lower than 0.5%, as defined by ASTM D5229 [44]. The composite’s saturation water content M∞ was determined to be 0.96 wt % [49]. It can be calculated by Equation (4) [49]:
where ρm is the matrix density, ρf is the fiber density, ρwater is the water density, νf is the fiber volume fraction, νm is the matrix volume fraction, νi is the interphase volume fraction, νv is the void volume fraction (νf + νm + νi + νv = 1), is the matrix saturation water content (3.44 wt %) and is the void saturation water content (100 wt %). Fiber, matrix, interphase and voids volume fractions are 59.5%, 39.2%, 0.9% and 0.44%, respectively.
The sizing-rich interphase is assumed to have the same saturation water content as the epoxy matrix, since it contains about 70–80 wt % epoxy film-former [12,29,56]. Since the volume of the sizing is very small compared to the composite’s volume any deviation from this assumption would have a minimal effect on the water uptake.
It is assumed here that the small voids will be completely filled with water , as was measured experimentally for the composite described here [49].
The water diffusivity of the studied epoxy polymer and the composites C1 and C3 in the thickness direction (with the fibers running transverse and parallel to the thickness direction for C1 and C3, respectively; see Figure 2) are systematized in Table 2 [49]. The higher diffusivity of the composite C3 is due to the fact that the diffusivity of the interphase in the direction parallel to the fibers is almost an order of magnitude higher than that of the polymer, after [49].
Table 2.
Diffusivities in the through-the-thickness direction, after [49].
The following equation links the mass uptake to diffusivity from solving the 1-D Fickian diffusion equation, as described by Crank [58]:
By fitting the exact solution of the diffusion equation to an exponential function, the ASTM standard simplified equation is the following [44]:
where M(t) is the water content, M∞ is the water saturation content, t is time, h is the thickness and D is the diffusivity in the thickness direction of the plate.
More details and 3-D Fickian model calculations can be found elsewhere [49]. 1-D and 3-D Fickian models gave the same result. Thus, for the sake of simplicity, the 1-D diffusion model for water uptake is used in this work.
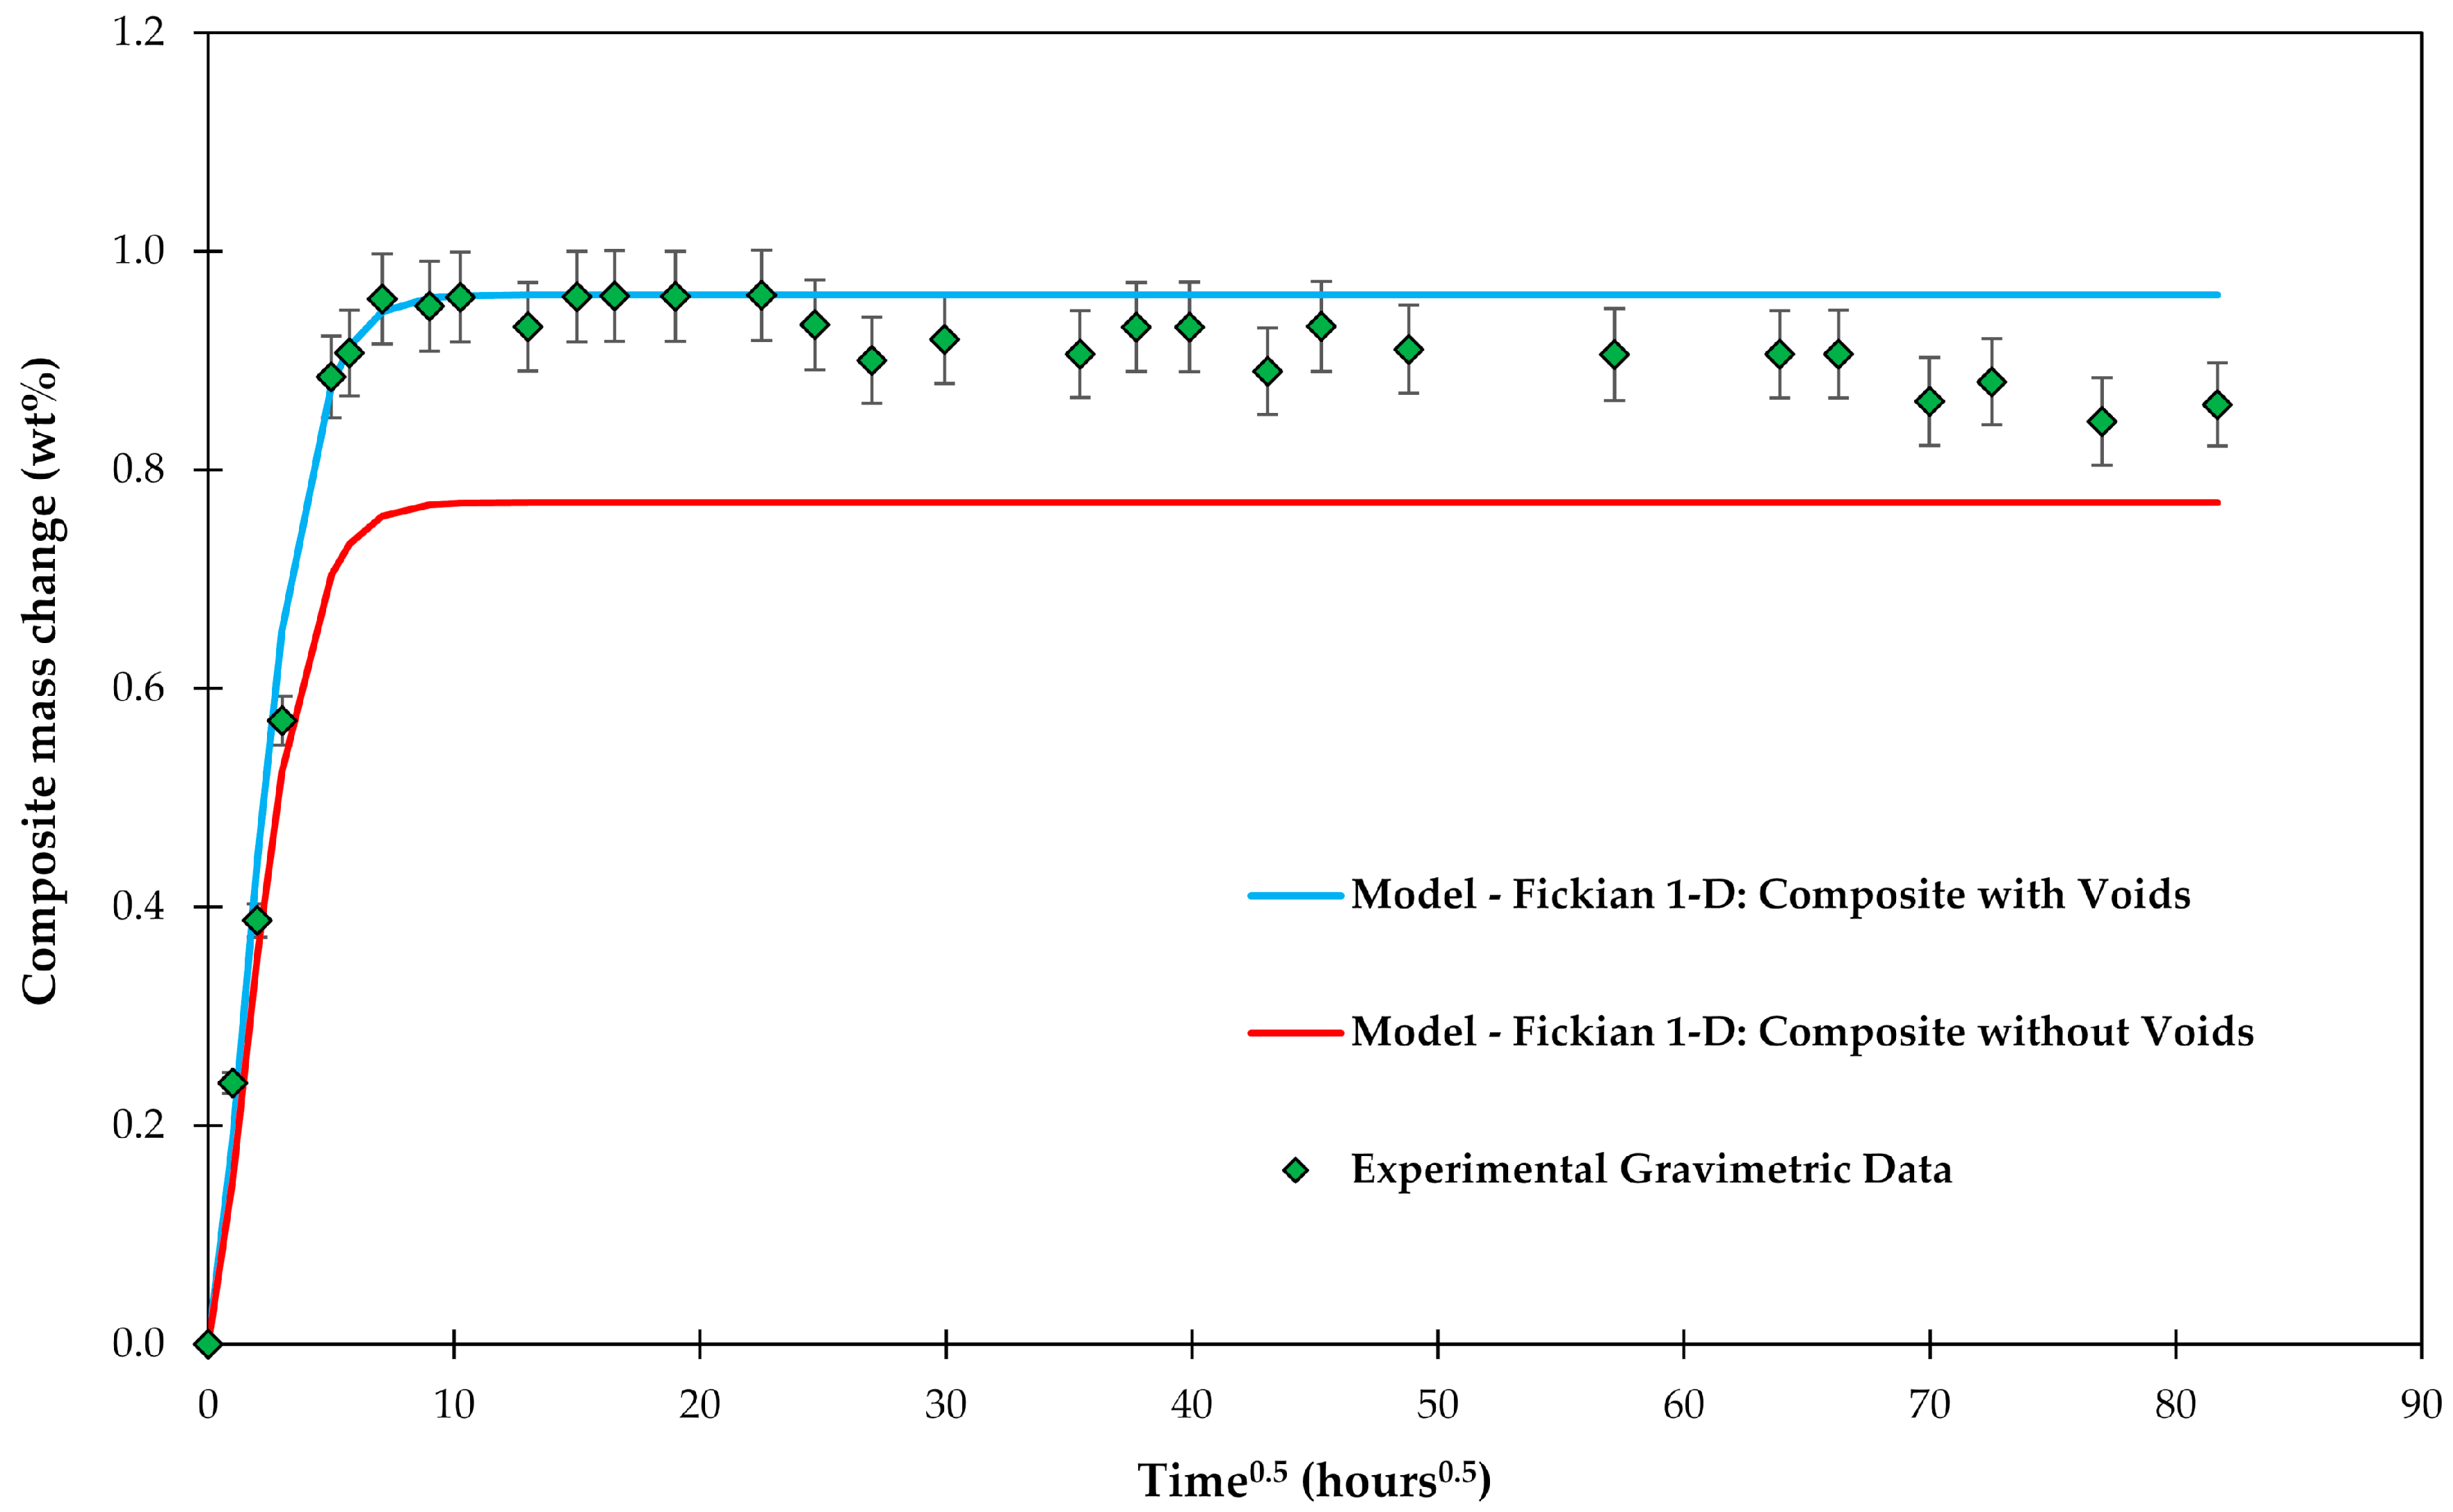
Experimental gravimetric measurements and modeled water uptake curves using Equation (6) are shown in Figure 4 for a composite C3 with and without voids. It can be clearly seen that the absorption of water in the voids needs to be modeled to get a good fit with the experimental data.
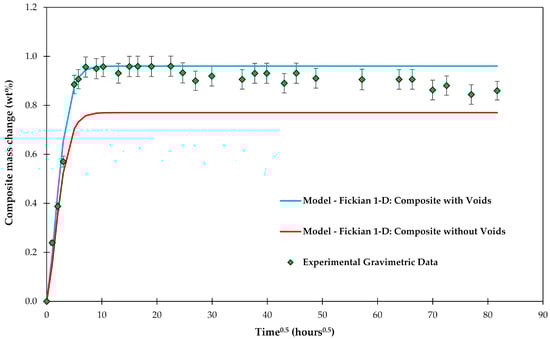
Figure 4.
Experimental gravimetric measurements of composite C3 plates conditioned in water and modeled water uptake curves using the Fickian 1-D model.
3.3. Oxidation of the Epoxy Matrix
Photo-oxidation is not present as the material is not exposed to high-energy irradiation [46]. The effect of thermo-oxidation on mass gain due to water uptake is negligible. Thermo-oxidation for the studied epoxy polymer occurs via the carbonyl formation mechanism in the carbon-carbon backbone via nucleophilic radical attack, as is described elsewhere [46].
3.4. Leaching of Molecules out of the Epoxy Matrix
Water molecules can migrate into the epoxy polymer while at the same time small molecules may leach out of the matrix [59,60]. The leaching phenomenon may occur due to initially present additives, impurities, unreacted hardener or degradation products diffusing out of the epoxy network into the water environment, which is in contact with the polymer. Often leaching follows Fickian-type diffusion [61]. The driving force of this process is due to the difference in concentration of these chemicals inside the polymer, and in the surrounding aqueous environment.
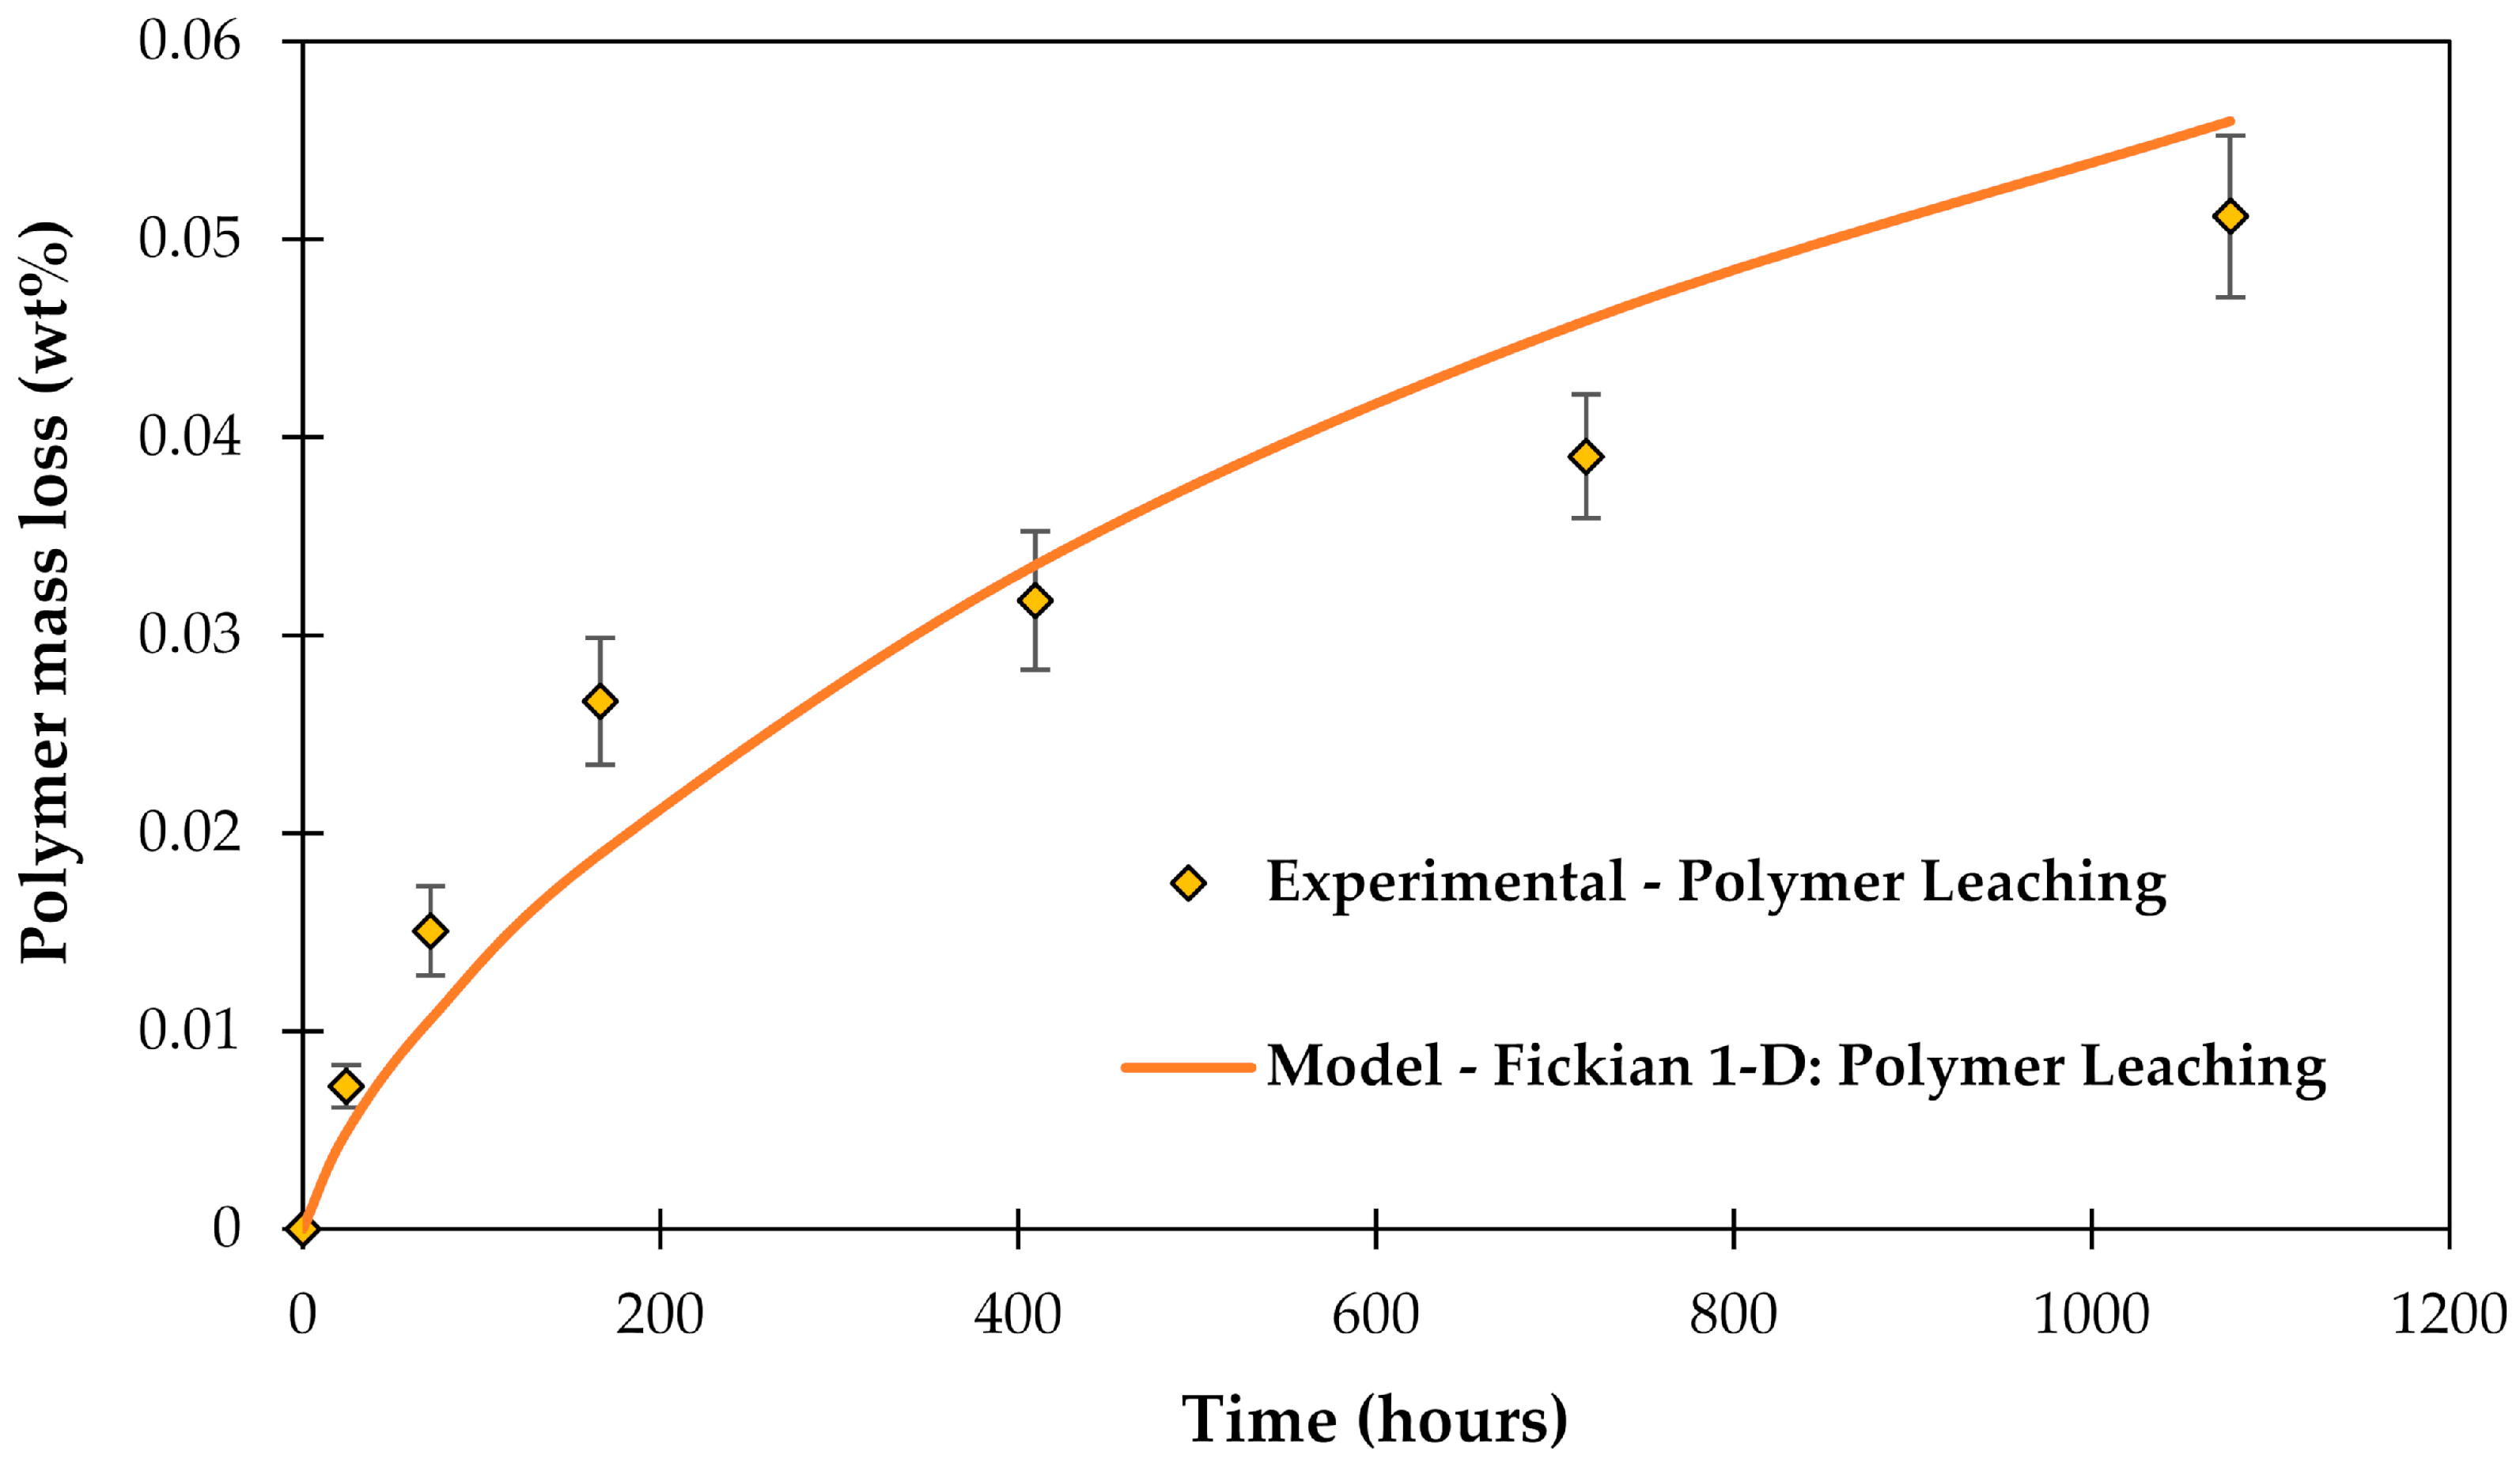
Leaching was determined experimentally using HR-ICP-MS up to about 1100 h in another work for the same epoxy material as used for making the composites in this study [46]. Krauklis and Echtermeyer [46] found that for the studied epoxy polymer there was no leaching of hardener, whilst the leaching occurred of epoxy compounds and impurities, such as epichlorohydrin and inorganic compounds. Based on Fourier transform–near infrared (FT-NIR) spectra (reported in [46]) the leached amount after about 1100 h of conditioning was estimated to be at 54.74 wt % of the initial leachable compounds present in the material. This indicates that more than a half of the small molecules were leached out after the relatively short time of 1100 h. The initial leachable compound content was found to be 0.092 wt % (about 1.5 mg) defined as the mass loss due to leaching divided by the initial mass of the polymer (about 1.6 g).
The diffusivity of leached compounds through the epoxy polymer was determined according to 1-D Fickian diffusion [44,61]:
The diffusivity was obtained by regression analysis of the data performing non-linear Generalized Reduced Gradient (GRG) algorithm, while minimizing the residual sum of squares. The leaching diffusivity Dleaching obtained in this study was 6.0 × 10⁻⁵ mm2/h.
The leached-out compounds were experimentally measured with High-resolution inductively coupled plasma mass spectrometry (HR-ICP-MS) (data from [46]). The modeled leaching behavior from the matrix polymer is shown in Figure 5.
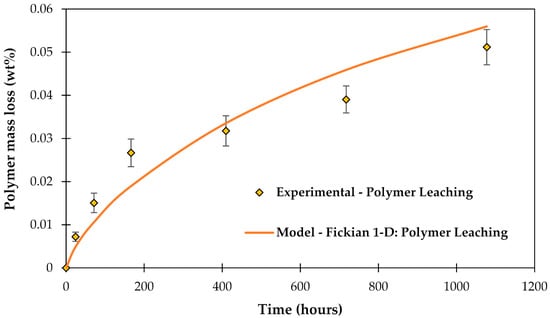
Figure 5.
Polymer leaching determined experimentally with HR-ICP-MS, after [46], and modeled using Fickian 1-D model, after [61].
3.5. Glass Dissolution
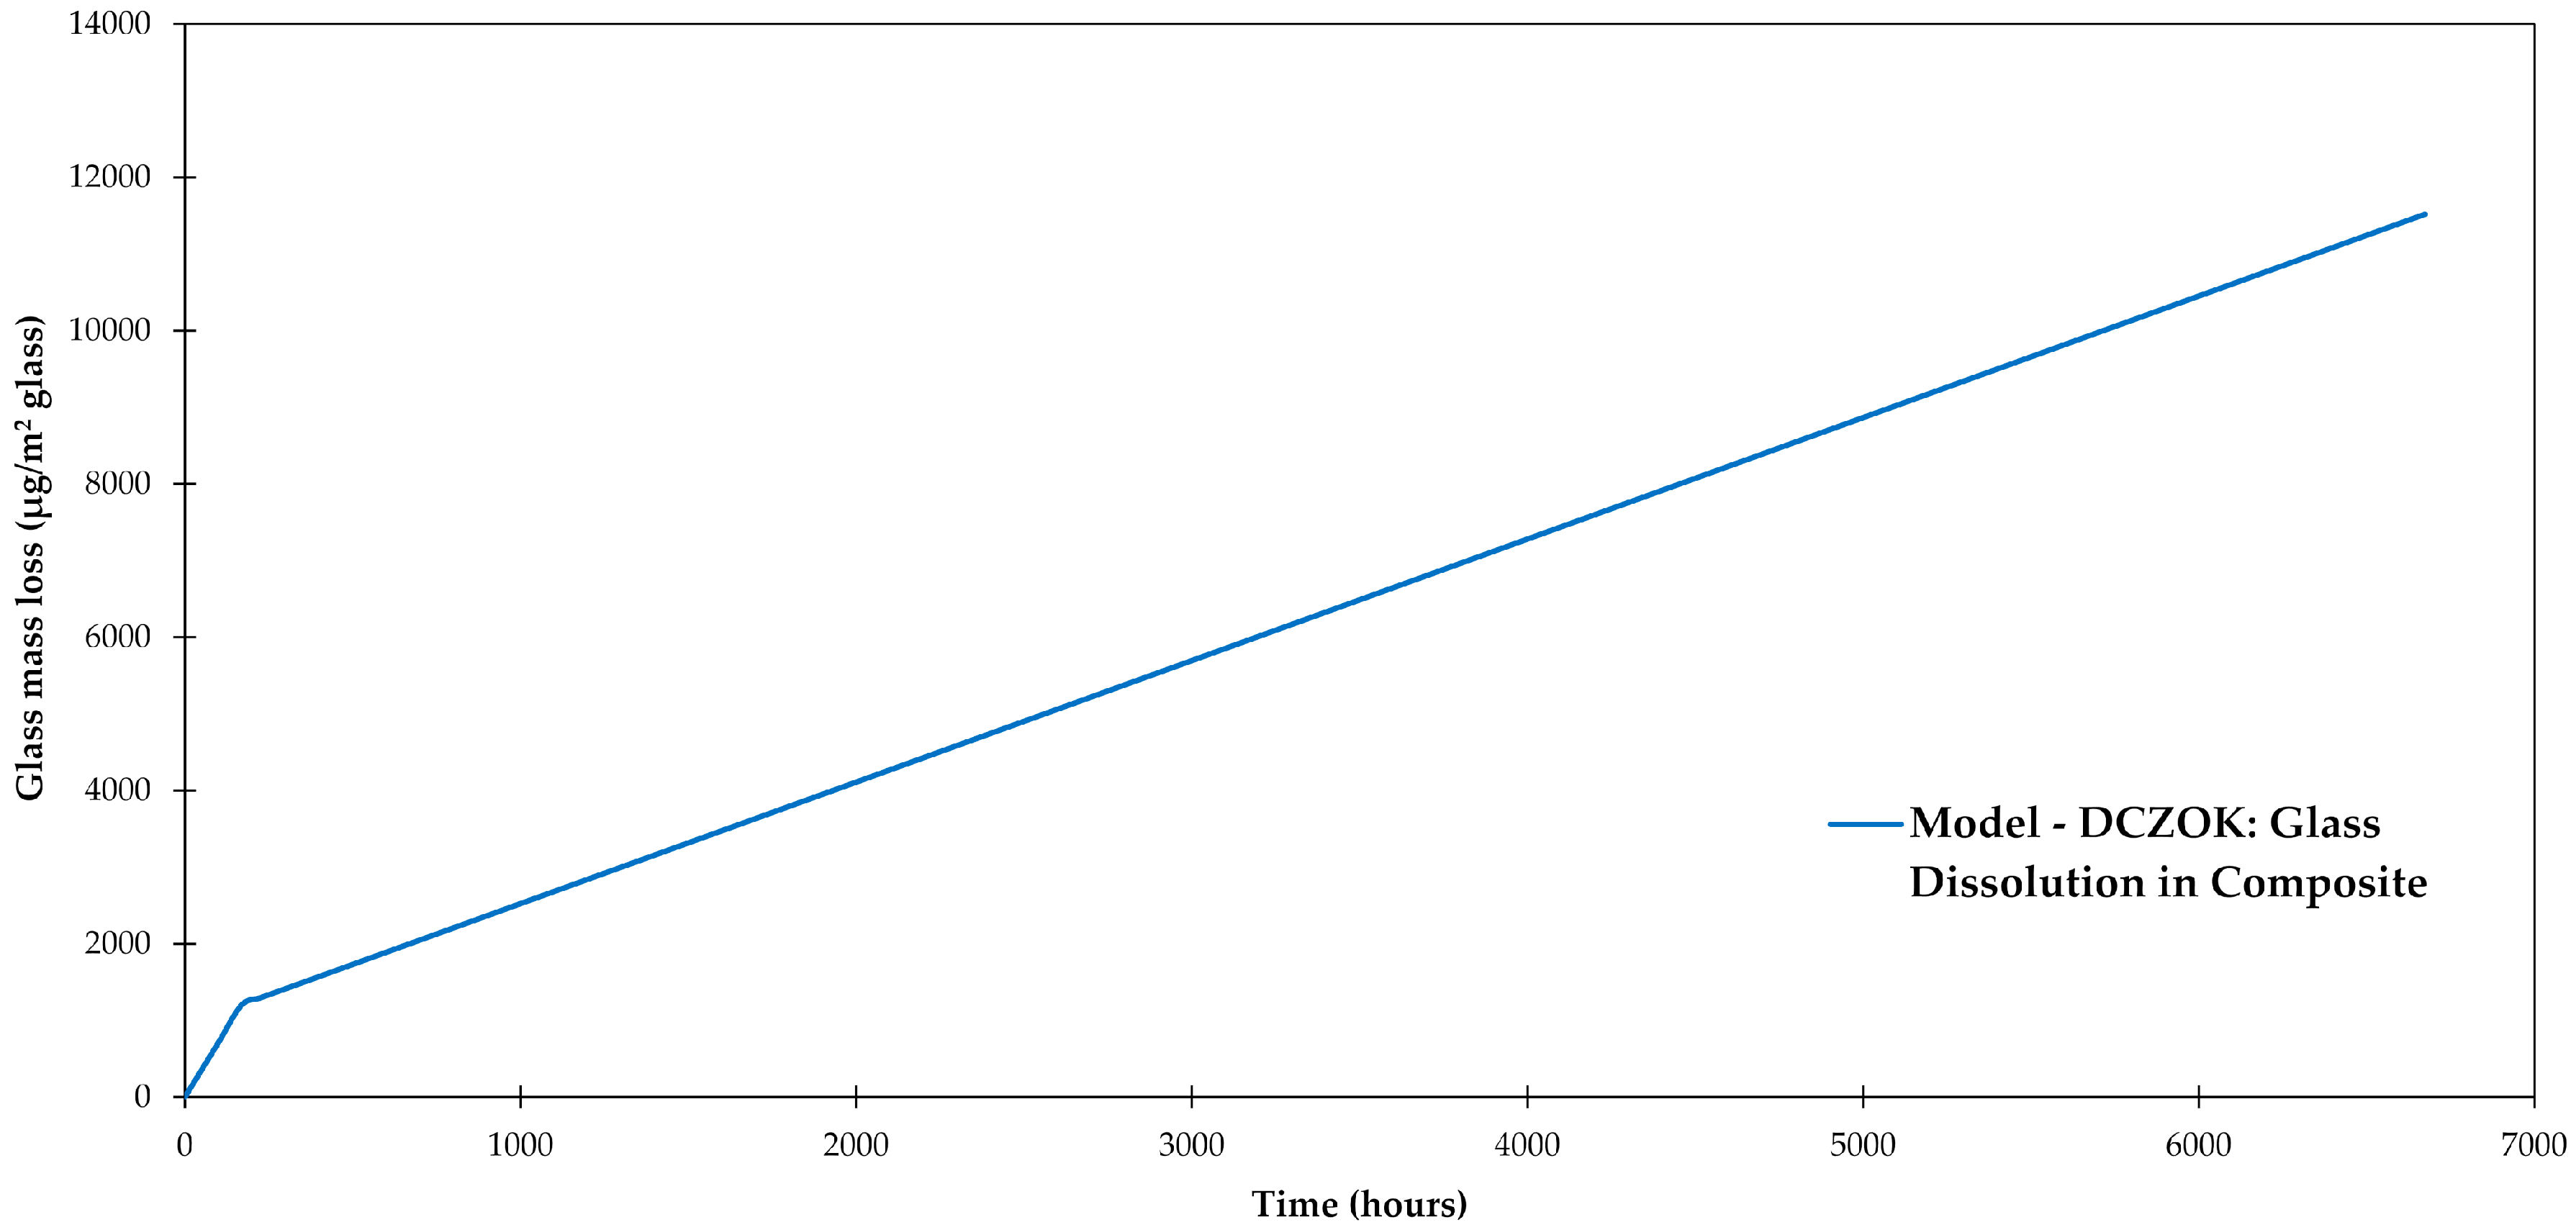
Glass fibers slowly degrade in water environments via dissolution reactions resulting in a mass loss [47,62,63]. The degradation of glass fibers follows two distinct kinetic regions: short-term non-steady-state (Phase I) and long-term steady-state degradation (Phase II), as described in the dissolving cylinder zero-order kinetic (DCZOK) model for prediction of long-term dissolution of glass from both fiber bundles [47]. During Phase I, the degradation is complex and involves such processes as ion exchange, gel formation and dissolution. When Phase II is reached, the dissolution becomes dominant and the degradation follows zero-order reaction kinetics. For the studied R-glass, the transition from Phase I into Phase II occurs in about a week (166 h) at 60 °C and pH 5.65 [28,47]. Elements that are released during degradation of R-glass are Na, K, Ca, Mg, Fe, Al, Si and Cl [47]. The glass mass loss is the cumulative mass loss of all these ions [47]. Si contribution to the total mass loss of the studied R-glass is the largest (56.1 wt %) and seems to govern the dissolution process [47].
The rate of the dissolution depends on the apparent glass dissolution rate constant () and the glass surface area exposed to water (S) [28,47]. The glass surface area is proportional to the fiber radius. As the dissolution continues, the radius decreases linearly with time resulting in the mass loss deceleration; the DCZOK model accounts for this effect [47]. Rate constants at various environmental conditions (pH, temperature and stress), as well as more details about the model can be found in other works [28,47,63].
For a thin composite with fibers parallel to the short side through-thickness direction, such as in this work, the dissolution of glass, compared to the free fiber bundles with sizing (not embedded in the composite), is slowed down by 36.84% [28]. The differential mass loss equation for thin composites can be written as [28]:
The includes the effects of diffusion and accumulation of the degradation products inside the composite, the protective effect of the sizing and the availability of water [28,47,63]. The time-dependent parameter is the fiber surface area S(t).
Considering the two distinct phases of the degradation, the full DCZOK model in the integral form is the following, after [47]:
where n is the number of fibres (6450824); l is the length of fibres (1.5 mm); r0 is the initial fiber radius (8.5 μm), and ρglass is the density of glass (2.54 g/cm3); and are the apparent dissolution rate constants (g/m2·s) for the short-term non-steady-state (Phase I) and long-term steady-state (Phase II) regions, respectively; (m) and (g) are the fiber radius and lost mass after time tst (s), when steady-state is reached (166 h [47,63]).
Using the composition of dissolving ions reported for the studied R-glass (Si contribution 56.1 wt %) [47], and the composite data after [28], and for the studied composite are 6.91 × 10⁻⁶ and 1.54 × 10⁻⁶ g/(m2·h), respectively. The dissolution rate constants are systematized in Table 3. The glass mass loss was modeled using the DCZOK Equation (9) as shown in Figure 6. The glass mass loss is normalized by the composite plate’s glass fiber surface area (about 0.5 m2).
Table 3.
Apparent glass dissolution rate constants.
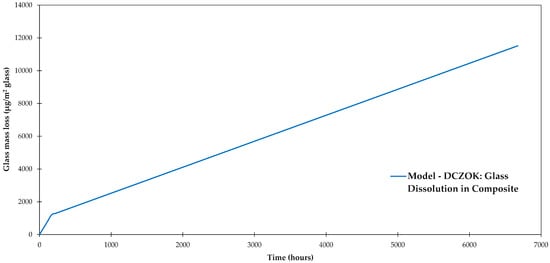
Figure 6.
Glass-fiber dissolution modeled using dissolving cylinder zero-order kinetics (DCZOK) for the studied composite, after [28,47,63].
These ions determined with HR-ICP-MS come from both glass material and the sizing-rich interphase. HR-ICP-MS can capture ions from interface and interphase (ionic products of the polysiloxane/siloxane hydrolysis), but ICP does not allow carbon detection due to CO2 in the plasma, thus the organics from sizing-rich interphase are not captured. In other words, the predicted mass loss due to dissolution includes ions coming from the interface and interphase, but does not include organic compounds from the interphase. This is what makes the difference between the HR-ICP-MS determined mass loss and the gravimetric mass loss of the composite.
3.6. Interphase Dissolution
The aging of the sizing-rich composite interphase is the least understood constituent. The small amount of the interphase sizing compared to the composite bulk material makes analysis difficult. The proprietary nature of the sizing’s composition allows only general evaluations. For typical sizing formulations, water interacting with the interphase may hydrate the Si–O–Si and Si–O–C bonds [5]. It was found that water molecules adsorbed in the epoxy matrix could migrate towards the sizing/glass fiber interface through the sizing, resulting in the dissolution/decomposition of the polysiloxane [30]. The reaction with water breaks strained Si–O–Si bonds and generates Si–OH sites [12]. Principle silane chemical bonding is reversible in the presence of water, thus the Si–O–Si bonds can be broken due to hydrolysis, as shown in Chemical Reaction (10) [12]:
In this work, the sizing-rich interphase loss is modeled assuming a simple zero-order kinetic model.
4. Results and Discussion
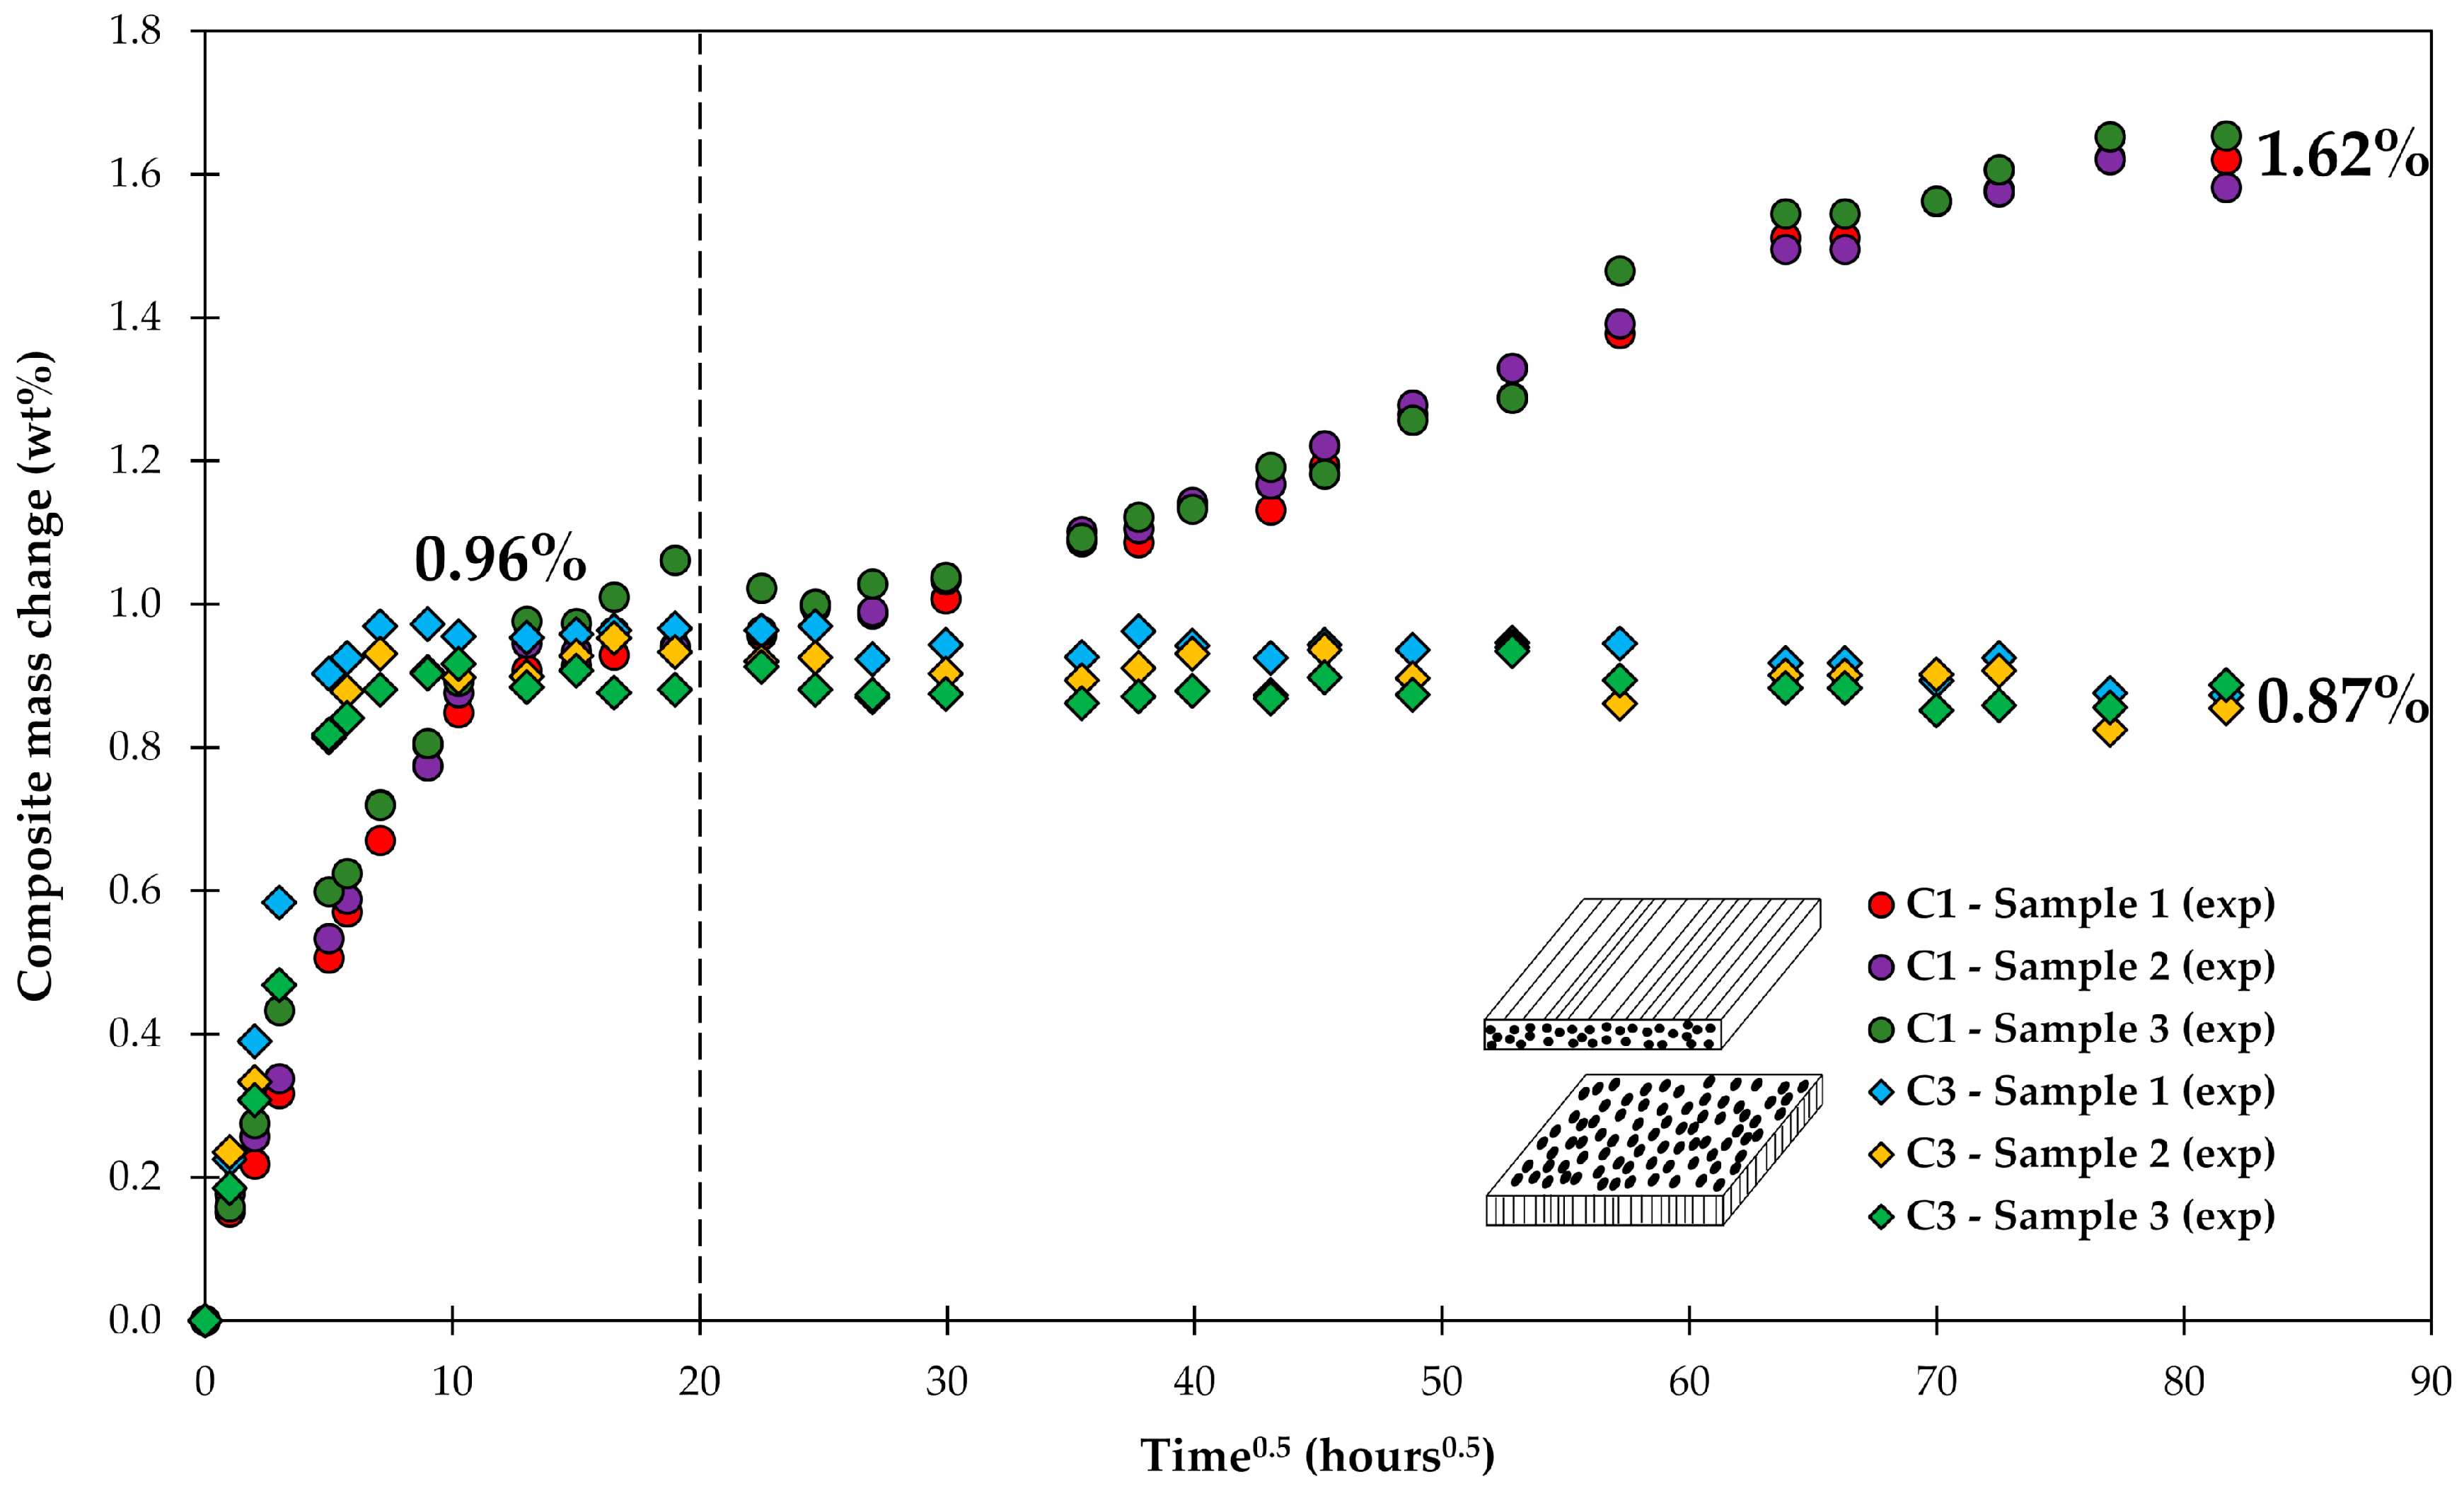
The increase of the composite’s mass with time within the first few hundred hours could be fairly well described by a standard diffusion approach, as shown in Figure 4. It was important to include the water uptake of the voids in the calculations. However, the diffusion approach would predict a constant mass over time once saturation has been reached (0.96 wt %). The data of C3 show a slight gradual drop in mass after saturation was reached, whereas the mass of C1 is clearly increasing, as shown in Figure 7.

Figure 7.
Long-term water uptake by composite laminates. Dashed line corresponds to a time when a test following standard practice ASTM D5229 would be stopped [44].
If the water uptake experiments are stopped as suggested by ASTM, then the long-term behavior is not captured. This observation is also consistent with the results of another study on long-term water uptake by composite plates [45]. The diverging behavior of water uptake by C1 and C3 composites can be observed starting only after about 20 h0.5 (about 2 weeks), only after the saturation M∞ (0.96 wt %) has been already achieved. The discussion on how the diverging behavior of C1 and C3 can be captured will follow.
4.1. Samples with Short Fibers C3
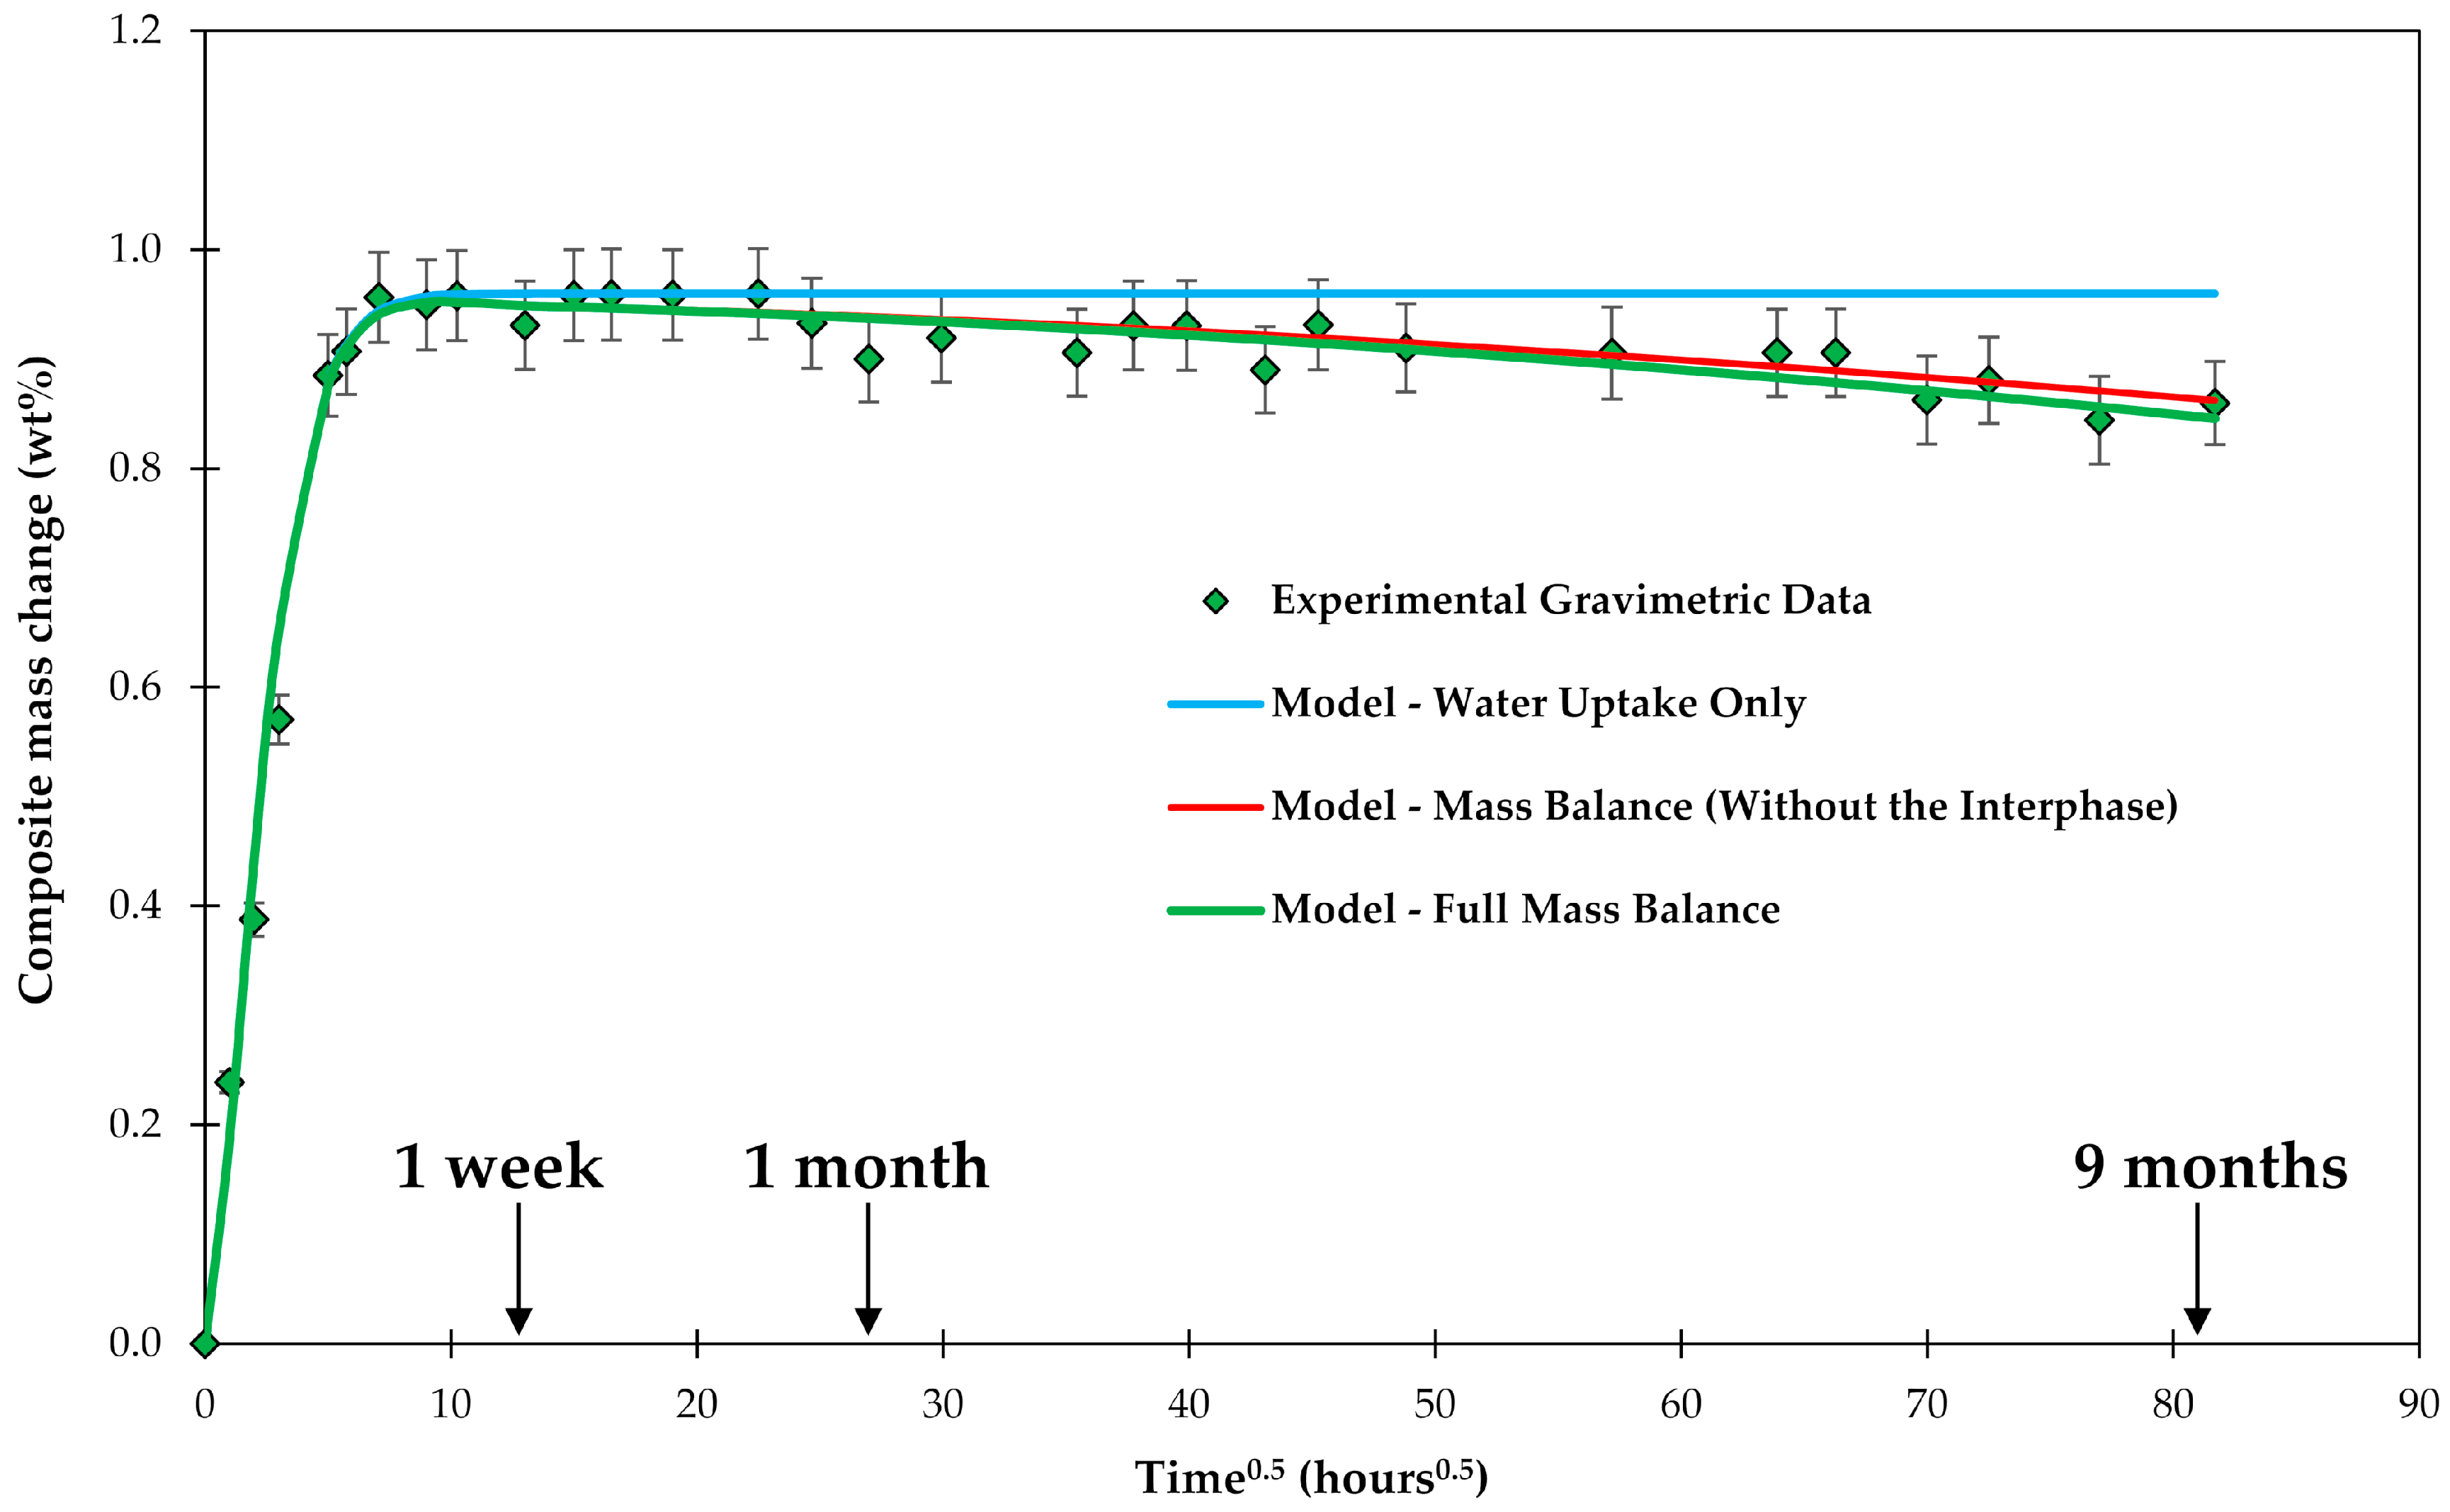
Firstly, the gravimetric behavior of C3 is addressed. As described above, a mass loss can be caused by leaching material out of the epoxy and by the glass fibers losing ions. If these effects are added to the mass vs. time curve a fairly good agreement with the experimental data is achieved, as shown in Figure 8. It could be argued that the agreement is sufficient within the experimental scatter. However, a closer look at the data can give some insight in the behavior of the sizing (interphase), although the evaluation is at the limit of what can be analyzed considering the scatter of the results.
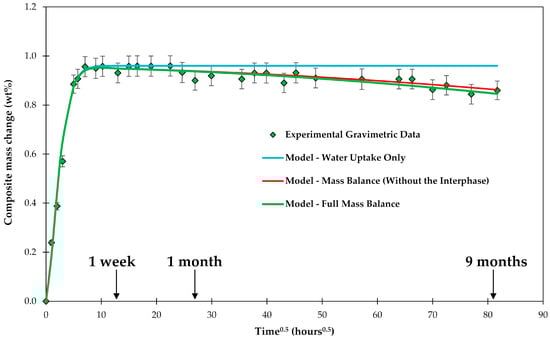
Figure 8.
Experimental composite C3 plate mass change during the conditioning in water, shown over a square root of time. Water uptake and mass balance are modeled.
Looking at Figure 8, a slightly better fit of the data can be obtained with a curve that has a higher mass loss with increasing time, i.e., is a bit steeper. This extra loss of material could be related to the disintegration of the interphase. The simplest approach is to model the mass loss of the interphase using the zero-order kinetics [64]:
where mi is the mass of the interphase, is the kinetic coefficient of the interphase dissolution and Si is the surface area of the interphase. The solution of this equation for cylindrical fibers is given in Equation (9). For small mass changes and short times, the equation can be approximated by its first linear term with the sizing having a constant surface area to be:
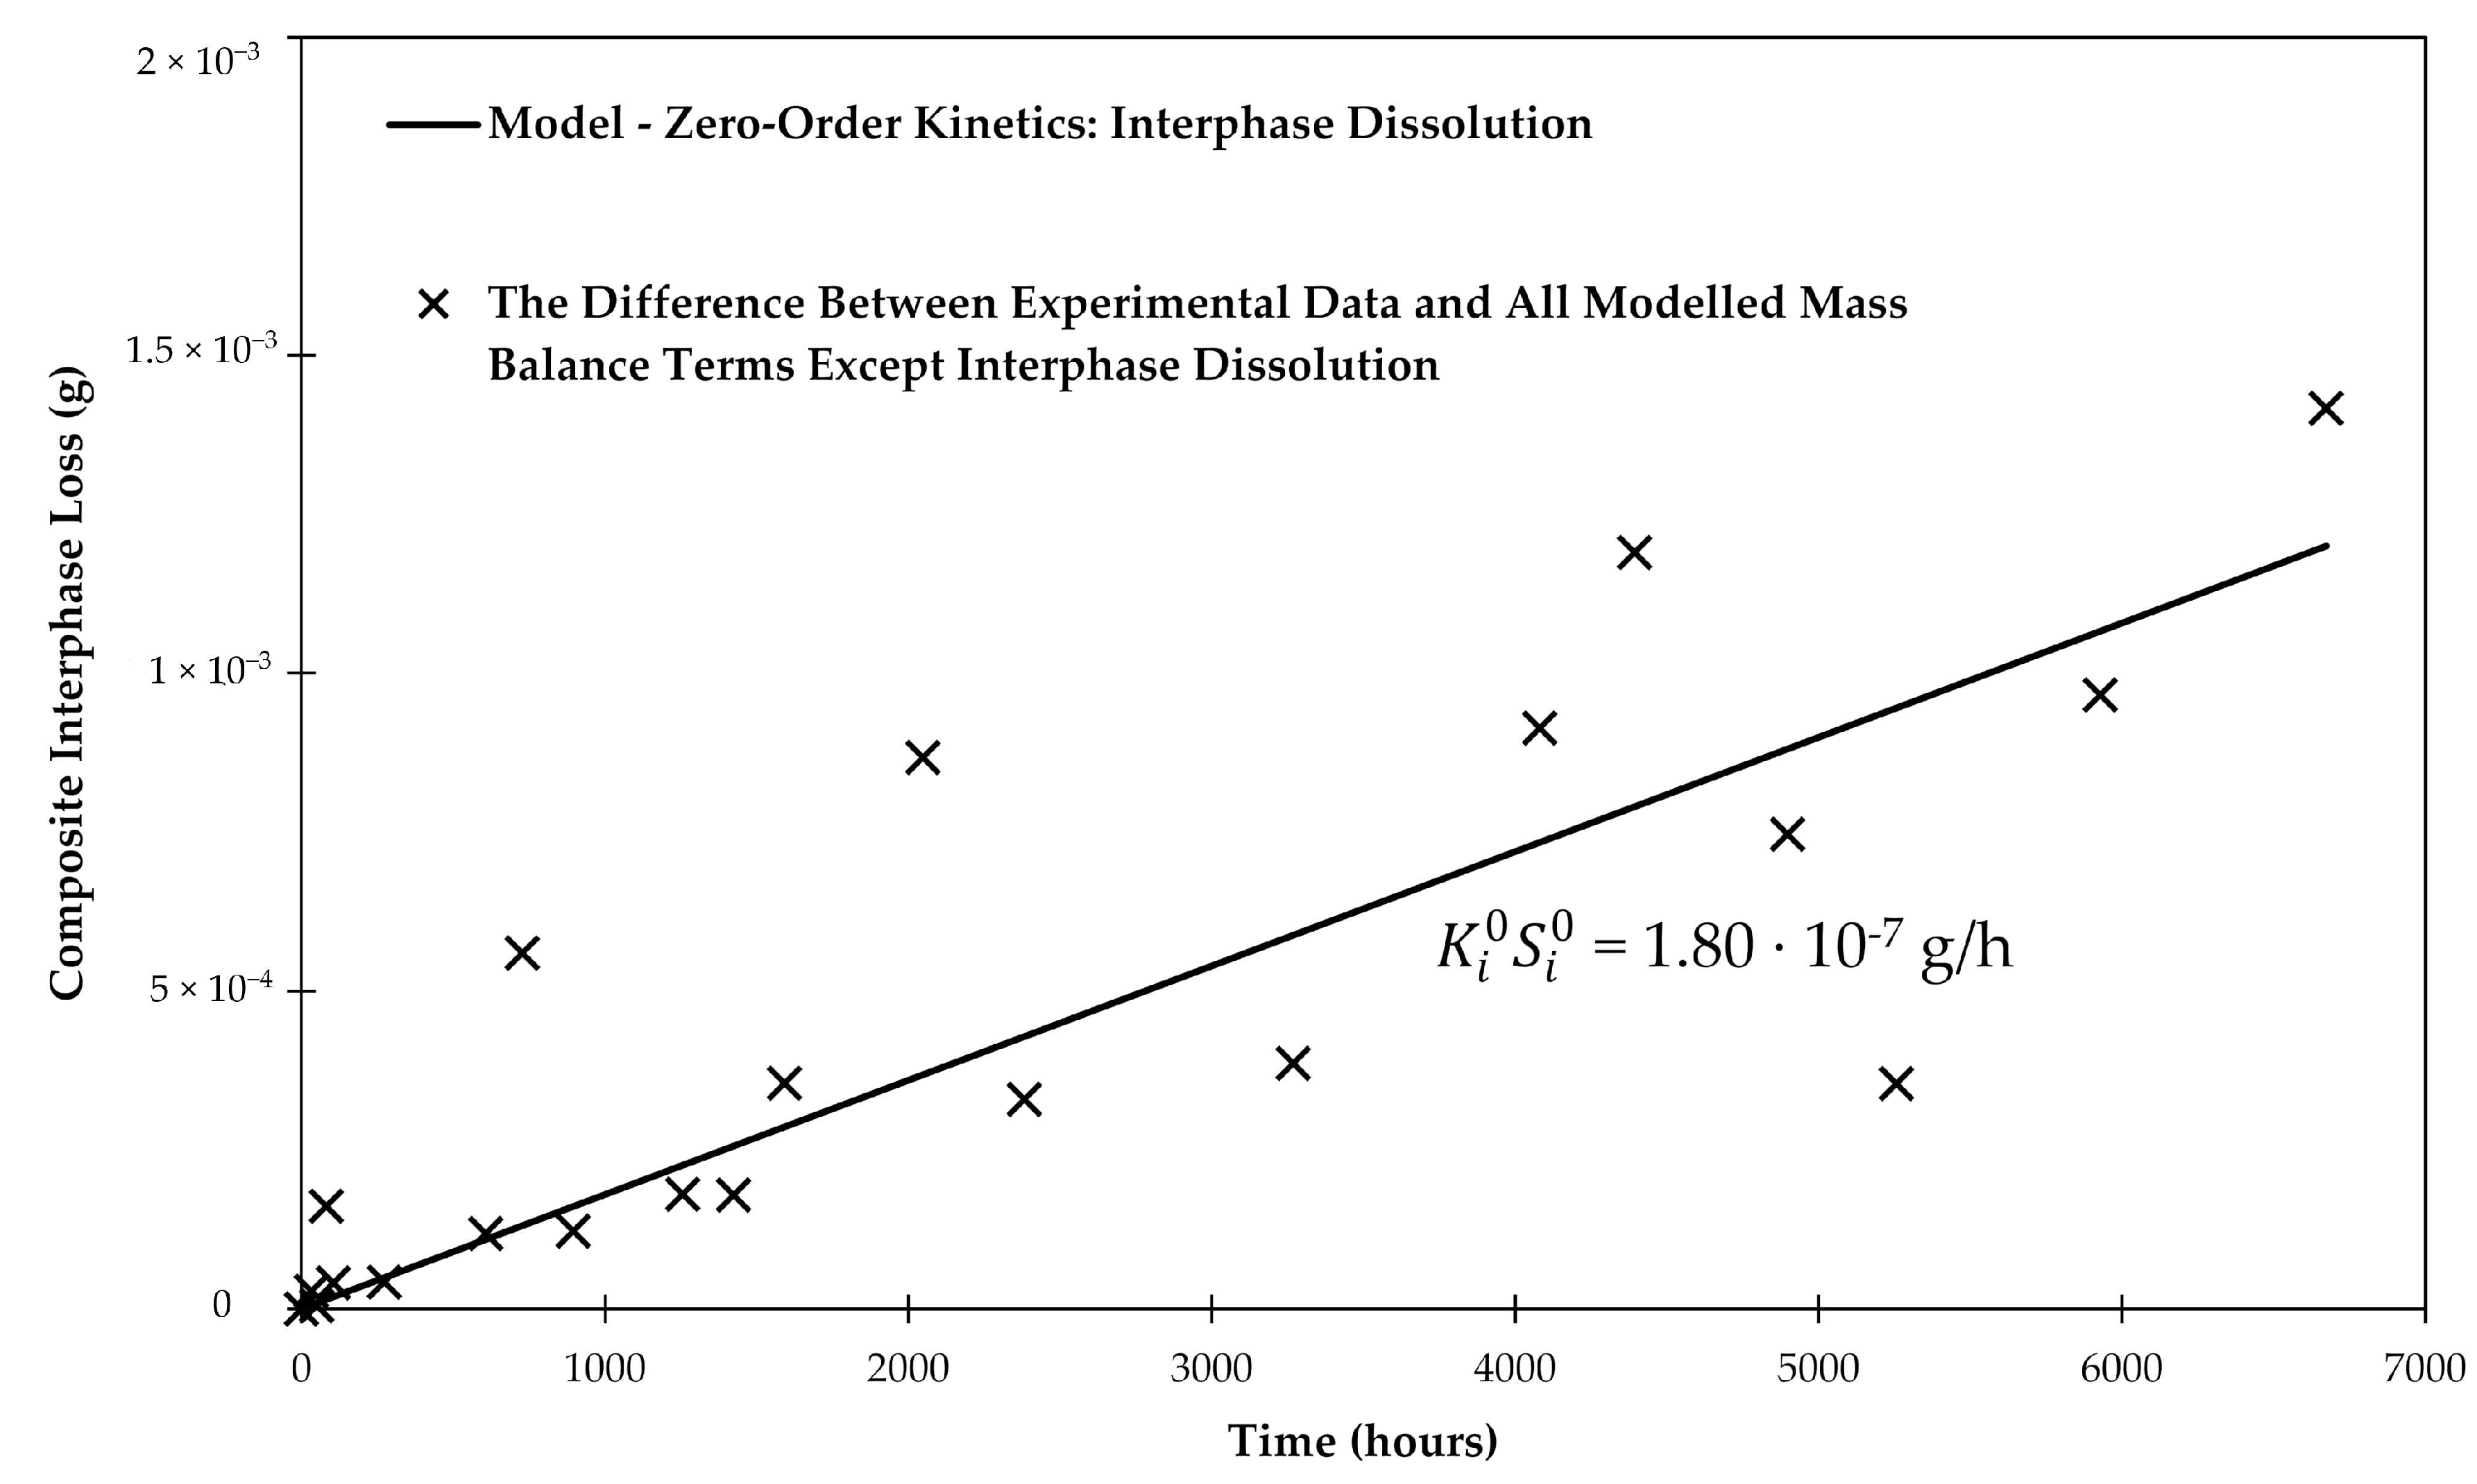
The initial mass of the sizing (35.7 mg) was determined by the burn-off test to be 0.64 wt % of the sized fibers. Fitting the data in Figure 8 allows finding , which basically describes the slightly steeper slope compared to the previous analysis based only on matrix and glass fiber dissolution. Using linear regression, as shown in Figure 9, The best fit for = 1.80 × 10⁻⁷ g/h.
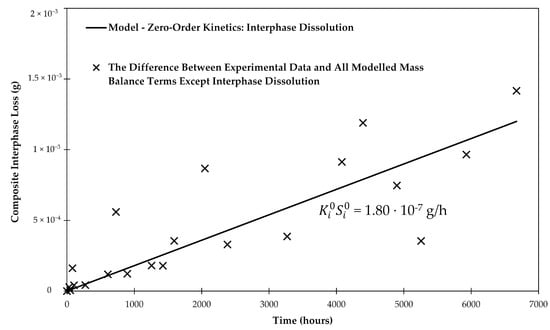
Figure 9.
Linear regression of the difference between the experimental data and the all modelled terms except the interphase. The regressed line provides insight about the rate of the composite interphase dissolution in water.
Since dissolution is a surface reaction, a surface area of the sizing-rich interphase has to be obtained in order to determine the kinetics of dissolution. Unfortunately, we do not know the exact surface area of the sizing. Using the BET method, it was found that unsized fibers have a surface area of 0.084 m2/g and sized fibers have a surface area of 0.180 m2/g, roughly twice the value of the unsized fibers. As discussed in the introduction, the sizing is rough which creates a larger surface [6,31,37], but it also covers only parts of the fiber [12,32,33,34,35,36,37]. A typical sizing coverage of 90% of the glass fiber surface is assumed, after [39]. Furthermore, the sizing is bonded to the glass fiber on one side and the epoxy matrix on the other side, which does not create free surfaces at all. Based on the currently available information, the only possibility is to calculate for a number of plausible scenarios for the surface area .
The thickness of the interphase is obtained from the volume of the interphase Vi taking geometry and known coverage (i.e., 0.9 or 1) into consideration. The volume of the interphase is known from LOI (0.64 wt %; 35.8 mg) and interphase density (1.1 g/cm3), Vi = 0.0325 cm3. The thickness of the interphase is then obtained as follows:
where Sglass is the total glass fiber surface area in a composite plate (about 0.5 m2). For 90% and 100% coverage, a mean interphase thickness is 72 and 65 nm, respectively.
Scenario 1. The minimum surface area would be just the cross-sectional area of the sizing exposed on the surface of the composite specimen. The fiber fraction was 59.5% and the area of one exposed surface of a C3 specimen was 50 mm × 50 mm. The surface area of fibers on both exposed surfaces is then 2975 mm2. The radius of an individual fiber was 8.5 μm. Based on the burn-off method (LOI 0.64 wt %) and assuming extreme 100% coverage, the average sizing thickness was 65 nm. The ratio of exposed sizing cross sectional area to fiber cross sectional area is then 0.0149 and the exposed sizing area is 44.3 mm2. In this scenario = 4.06 × 10⁻³ g/(m2·h). The sizing would be dissolved along the axis of the fibers while the exposed cross section would remain constant until the sizing is completely dissolved. Equation (12) would accurately describe dissolution in this scenario. For these 1.5 mm-thick samples, the time to dissolve the sizing would be 22.7 years.
Scenario 2. The other extreme would be to argue that the epoxy is quickly saturated with water (after about 100 and 81 h for C1 and C3, respectively), The water can then attack and dissolve the sizing. In that case, the exposed area of the sizing would be much bigger. The BET method measured a specific surface area of sized fibers to be 0.180 m2/g. Then, the total surface area of sized fibers (5.6 g fibers) in one plate is 1.01 m2. Since the sizing covers only parts of the fiber, not all of this surface is from the sizing. But to obtain an outer bound can be calculated for this maximum surface area (assuming coverage of 100%). In this case using Equation (12), = 1.78 × 10⁻⁷ g/(m2·h). The should be accurately determined by this equation for the relatively small area reduction during the measurement. However, the proper cylindrical Equation (9) taking the surface area reduction with time into account should be used to obtain the long-term dissolving of the sizing. The time to dissolve the sizing would be 30.5 years.
Scenario 3. Considering the descriptions of the literature about sizing, a typical sizing covers approximately 90% of the fiber [39]. In that case, the surface area of the sizing would be 0.91 m2. Using the same approach of a cylindrical sizing exposed to water in the epoxy as described for Scenario 2 above the for this case would be 1.98 × 10⁻⁷ g/(m2·h) and the time to dissolve the sizing would be 30.5 years.
The parameters of the three scenarios are systematized in Table 4.
Table 4.
Systematized scenarios of the interphase dissolution kinetics.
The mass loss due to long-term gravimetric behavior of composite C3 could be successfully modeled, because the C3 samples did not have a significant accumulation of the degradation products. The C3 plates have a short fiber length (1.5 mm). Once the matrix is saturated with water, the water can attack and degrade the interphase. Any reduction products can be quickly transported along the interphase to the surface of the sample and will be absorbed by the surrounding water.
4.2. Samples with Long Fibers C1
The C1 samples showed a mass increase with time, see Figure 7, an additional 0.66 wt % of water was taken up after 6673 h of conditioning. Since C1 and C3 samples were made from the same laminate, just cut in a different direction, the change in behavior must be related to the sample’s geometry. Compared to the C3 samples the C1 samples have much longer fibers and subsequently much longer fiber matrix interphases (1.5 mm vs. 50 mm).
The matrix of both sample types absorbs water in roughly the same period (see Table 2). The water will attack the interphase between fibers and matrix in the same way. But, it is believed that degradation products (of fibers and interphase) cannot easily move along the interphase and escape into the surrounding water at the composite’s surface. Instead, the weakening of the interphase causes the formation of flaws. The degradation products and water can accumulate in these flaws. Thus, the mass of the composite does not decrease with time as for samples C3, but the mass of C1 samples increases with time. Figure 10 shows schematically what such a flaw could look like. Figure 11A shows that such flaws are, indeed, observed in the samples.
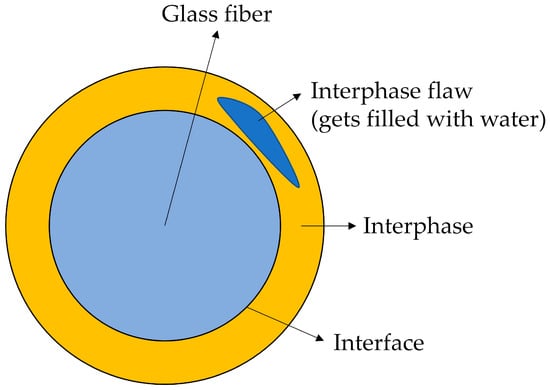
Figure 10.
Interphase flaw is formed and is filled with water.

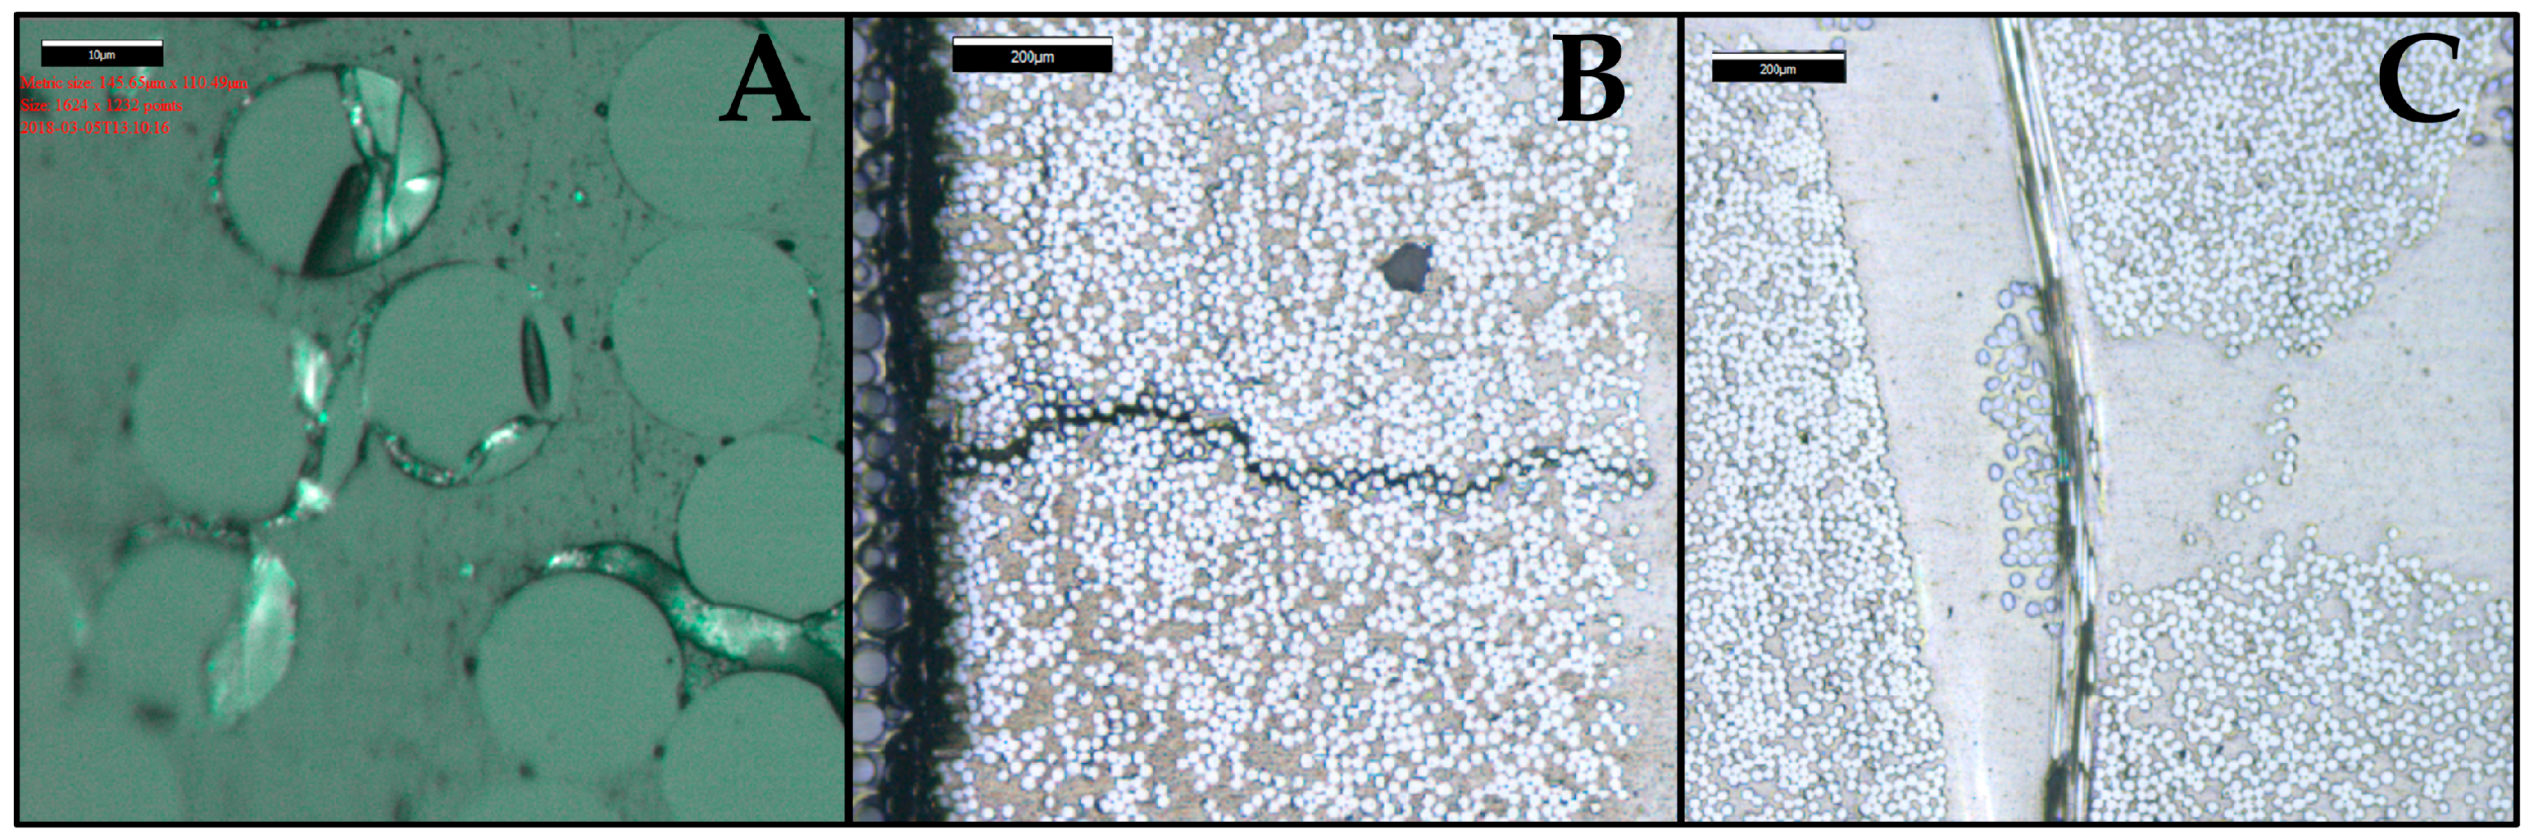
Figure 11.
Micrograph of a composite sample exposed to water for 6673 h at 60 °C. The micrograph indicates the (A) fiber/matrix debondings; (B) matrix transverse cracks; (C) splitting along the fibers.
Since the laminate absorbed another 0.66 wt % of water, it is possible to estimate the size of flaws needed to accommodate this amount of water. The initial mass of the C1 plate was about 7.36 g. Water in the interphase flaws should thus weigh 48.6 mg, taking up volume of 4.86 × 10⁻⁸ m3. Assuming for the moment that all fibers have evenly distributed flaws, the following calculations can be made. Dividing volume necessary to accommodate the extra water by the amount of fibers in a composite C1 plate (193525) and the length of a fiber (50 mm), the cross-sectional area of a water-filled interphase flaw around one fiber is found to be 5.02 × 10⁻¹² m2. The radius of the glass fiber is 8.5 μm, thus the cross-sectional area of the fiber is 2.27 × 10⁻¹⁰ m2. By combining cross-sectional areas of the interphase flaw and the fiber, and deducting the radius of the fiber, an average thickness of a water-filled interphase flaw of 93.5 nm is obtained.
In reality, not all interphase flaws are the same size and not all fiber/matrix interphases are damaged equally, as shown in Figure 11. The weakest links will fail first. Once cracks are formed, stresses are released and more complicated processes follow. However, it is interesting that the first fiber matrix debondings, as shown in Figure 11A, have dimensions similar to the calculated value of 93.5 nm. Fiber/matrix debondings shown in Figure 11A range from about a 100 nm to a few microns, as was observed experimentally using microscopy after 6673 h of conditioning. The thickness also matches debonding dimensions observed elsewhere for the same composite [65,66].
Three damage mechanisms were observed in the micrographs:
Fiber/matrix debonding appears to be the first failure mechanism, caused by hydrolysis of the interphase. This failure mechanism is described by the observations made for the C3 samples in Section 4.1 When these failure mechanisms accumulate, creating a weakened local region, they can easily combine into a longer “matrix crack” due to a release of curing, thermal and swelling stresses, resulting in a crack formation. The reason for the observed splitting along fibers is less clear. It could be related to the matrix cracks, but it could also be caused by the fibers used for stitching the reinforcing mat. All these flaws (cracks) create volume that can be filled with water and increases the mass of the composite.
Perreux, Choqueuse and Davies [45] investigated long-term water uptake by 2.7 mm-thick composite plates. The plate was made with an anhydride-based curing agent while this study looked at an epoxy laminate made with an amine-based curing agent. They observed that after ASTM saturation was achieved, there was still a significant continuous mass gain up to about 5 years of conditioning in water at 60 °C. After this point, an abrupt and continuous mass loss occurred for the following 5 years until the measurements were stopped. The data is schematically shown in Figure 12.
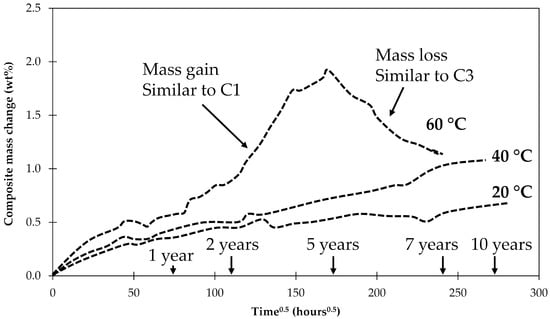
Figure 12.
Schematic representation of the long-term water uptake at 20, 40 and 60 °C observed by Perreux, Choqueuse and Davies for the 2.7 mm thick composite plates [45].
The results seem to be a combination of what was found for samples C1 and C3 investigated here. An explanation for the behavior observed by Perreux et al. [45] may be given by the findings of this work. Initially flaws form in the composite interphase that is filled with water, resulting in a mass gain as found in C1 samples. At one point, so many flaws have accumulated that an open interpenetrating network with access to the surface of the laminate has formed. This network allows the degradation products and previously absorbed water to diffuse out, creating a mass loss similar to samples C3 (since fiber lengths in C3 were so small the interpenetrating network was present from the beginning). Since the observed mass reduction happened gradually, this means that the network of flaws and cracks is gradually being connected to the sample’s surface. The mass drop was not observed for tests carried at lower temperatures. In that case all processes are slower and the samples only increased their mass, indicating the formation of flaws and cracks. But a network of the cracks reaching the surface was not created yet. It should be noted that the matrix of anhydride-based epoxies studied by Perreux et al. [45] is also prone to hydrolysis, so the hydrolysis in their samples may have affected the matrix and the fiber–matrix interphase.
4.3. General Aspects
For the composite laminates studied here, about 3.5 wt % of the interphase was dissolved in a year’s time. The expected total dissolution for the geometry of the C3 sample would occur between 22.7 and 30.5 years, according to the three scenarios at 60 °C. At lower temperatures, the processes would be significantly slower, because diffusivities and dissolution rates follow Arrhenius-type temperature dependence [63,67]. Activation energies of these individual processes differ. Thus, it is likely not a straightforward Arrhenius-type influence on the process rate as a whole (summary mass uptake or loss).
The degradation time (22.7 to 30.5 years) should be independent of sample geometry and should be applicable once the matrix has reached saturation. For thick composite laminates the fiber–matrix interphase may only degrade in the surface region, because the matrix in the inside may remain dry. Degradation may also be stopped or slowed down by an accumulation of reaction product, if the degradation reaction is reversible, such as reaction (a). The mass uptake data obtained here showed a slight slowdown of the reaction after 9 months, close to the point when experiments were stopped, see Figure 7. But it is unclear whether the data really flatten out. The test results from Perreux et al. [45] run over 10 years indicate that the degradation continues all the time.
Damage caused by the hydrolytic aging of the sizing-rich composite interphase very likely leads to a decrease in interfacial strength. For instance, Gagani et al. [68] and Rocha et al. [42] have reported the composite interphase-related deterioration of the mechanical properties due to aging in water. It is likely that the formation of the interphase flaws described in this work is the mechanistic origin of the interfacial strength deterioration of composites.
The authors think that studying the effect of seawater on the hydrolysis of the interphase would be useful, since the composite marine structures are most often used in the seawater environments. The dissolution in seawater conditions is expected to occur slower than in distilled water due to the presence of silica (dissolved from sand and other minerals). The reason for an expected aging rate slowdown in seawater is that the degradation products are already present in the surrounding environment, thus decreasing the driving force—a concentration gradient.
The length of glass fibers should not affect the molecular structure or morphology of the interphase per se. However, it should be added that what is affected by the fiber length is the path (or length) that the hydrolytic degradation products have to travel in order to escape the composite material and diffuse out into the surrounding water. It was shown in this work that water interaction with composites with very short interphase leads to mass loss, whereas for a typical composite an interpenetrating flaw network takes a relatively long time to form in order for degradation products to leave the composite. This leads to another aspect that needs to be studied in more detail: a diffusion of degradation products through the interphase. It is important to understand whether there is a diffusion-controlled aspect.
This paper covers hydrolysis of the composite interphase, but the same approach should be applicable for all other environmental agents and solvents (in general, solvolysis).
5. Conclusions
Glass fiber composites absorb water with time and the mass of the composites increase subsequently. When measuring diffusivity and saturation level of water according to ASTM D5229 [44] testing is stopped when the mass increase with time stops, i.e., it is reaching a plateau, in this case at about 200 h. However, continuing the tests exposing the laminates to water for longer, the mass of the composite increases again, measured up to 9 months. This additional water uptake was found to be due to the hydrolytic degradation of the sizing-rich fiber matrix interphase. Due to water-induced dissolution interphase flaws being formed which developed further into matrix cracks. The internal volume created by the flaws and cracks can be filled with water leading to the observed mass increase. The microscopically measured size of the flaws matches the order of magnitude of the volume required for obtaining the measured additional mass increase.
The hydrolytic degradation of the fiber matrix interphase could be investigated directly by cutting non-typical specimens from a thick composite laminate. The test specimens were 50 mm × 50 mm × 1.5 mm coupons where all the fibers were running parallel to the short edge. This created specimens with a short fiber–matrix interface length and the interphases being connected to the large sample’s surface. When these specimens were conditioned in water, their mass increased during the first 200 h as the typical specimens described above. Continuing the test for longer times leads, however, to a mass loss. For these specimens, the flaws created by the fiber matrix interphase hydrolysis were open towards the surface of the test specimen, since the interphase length (and fiber length) was so short, 1.5 mm. The reaction products of the hydrolysis could migrate into the surrounding water bath leading to a mass drop. This mass loss allowed the product of the dissolution rate constant and the surface area of the interphase to be determined. The small specimens tested here would degrade the entire interphase within 22 to 30 years at 60 °C. The calculation is based on a full mechanistic mass balance approach considering all the composite’s constituents: water uptake and leaching of the matrix, dissolution of the glass fibers, and dissolution of the composite interphase. These processes were modeled using a combination of Fickian diffusion and zero-order kinetics.
Based on long-term test data from the literature tested for close to 10 years, it seems that composites will initially absorb extra water in the flaws and cracks created by interphase hydrolysis. Eventually these cracks will create a network that is connected to the surface of the composite laminate. When this network is formed reaction products can leave the laminate and the mass will be reduced.
The possible strength degradation due to the flaws in the fiber matrix interface forming within 22 to 30 years (for the tested type of epoxy laminate) in saturated laminates should be taken into account in designs for long lifetimes.
Author Contributions
Conceptualization, A.E.K. and A.T.E.; Methodology, A.E.K.; Formal Analysis, A.E.K.; Investigation, A.E.K. and A.I.G.; Resources, A.E.K., A.I.G. and A.T.E.; Data Curation, A.E.K., A.I.G. and A.T.E.; Writing—Original Draft Preparation, A.E.K.; Writing—Review and Editing, A.E.K. and A.T.E.; Validation, A.E.K.; Visualization, A.E.K.; Supervision, A.T.E.; Project Administration, A.T.E.; Funding Acquisition, A.T.E.
Funding
This research was funded by The Research Council of Norway (Project 245606/E30 in the Petromaks 2 programme).
Acknowledgments
This work is part of the DNV GL led Joint Industry Project “Affordable Composites” with 19 industrial partners and the Norwegian University of Science and Technology (NTNU). The authors would like to express their thanks for the financial support from The Research Council of Norway (Project 245606/E30 in the Petromaks 2 programme). The authors are thankful to Erik Sæter, Valentina Stepanova, Susana Villa Gonzalez and Julie Asmussen. Andrey is especially thankful to Oksana V. Golubova.
Conflicts of Interest
The authors declare no conflict of interest.
Abbreviations
| ρf | Density of the glass fibers (g/m3) |
| ρm | Density of the matrix polymer (g/m3) |
| ρi | Density of the sizing-rich composite interphase (g/m3) |
| ρwater | Density of the water (g/m3) |
| h | Thickness of a material plate (m) |
| νf | Volume fraction of the fibers (m3/m3) |
| νm | Volume fraction of the matrix polymer (m3/m3) |
| νi | Volume fraction of the composite interphase (m3/m3) |
| νv | Volume fraction of the voids (m3/m3) |
| M(t) | Time-dependent water content of the composite (wt %) |
| M∞ | Saturation water content of the composite (wt %) |
| Mm(t) | Time-dependent water content of the matrix polymer (wt %) |
| Saturation water content of the matrix polymer (wt %) | |
| Saturation water content of the voids (wt %) | |
| D | Through-thickness water diffusivity of the material (mm2/h) |
| Mleaching(t) | Time-dependent content of leached compounds from the polymer (wt %) |
| Initial leachable compound content in the polymer (wt %) | |
| Dleaching | Through-thickness leachable compound diffusivity of the material (mm2/h) |
| r(t) | Time-dependent fiber radius (m) |
| r0 | Initial fiber radius (m) |
| Fiber radius when the steady-state dissolution is reached (m) | |
| K0 | Glass dissolution rate constant (g/(m2·s)) |
| Apparent glass dissolution rate constant (g/(m2·s)) | |
| Apparent glass dissolution rate constant (non-steady-state; Phase I) (g/(m2·s)) | |
| Apparent glass dissolution rate constant (steady-state; Phase II) (g/(m2·s)) | |
| tst | Time when long-term steady-state is reached (s) |
| n | Number of fibers (–) |
| l | Length of fibers and the interphase (m) |
| S(t) | Time-dependent glass fiber surface area (m2) |
| S0 | Initial glass fiber surface area (m2) |
| t | Time (s) |
| m; mdissolved | Glass mass loss due to dissolution (g) |
| Dissolved glass mass when the steady-state is reached (g) | |
| ξsizing | Protective effect of sizing against glass dissolution (–) |
| norder | Order of the water availability term (–) |
| Si(t) | Time-dependent surface area of the composite interphase (m2) |
| Si0 | Initial surface area of the composite interphase (m2) |
| Specific surface area of the composite interphase (m2) | |
| Zero-order rate constant of the composite interphase dissolution (g/(m2·s)) | |
| mi(t) | Time-dependent mass of the composite interphase (g) |
| mi0 | Initial mass of the composite interphase (g) |
| GF | Glass fiber |
| GFRP | Glass fiber-reinforced polymer; same as glass fiber-reinforced composite |
| DCZOK | Dissolving cylinder zero-order kinetic (model) |
| DGEBA | Bisphenol A diglycidyl ether |
| HDDGE | 1,6-Hexanediol diglycidyl ether |
| POPA | Poly(oxypropylene)diamine |
| IPDA | Isophorondiamine |
| R-glass | “Reinforcement” glass |
| FRP | Fiber-reinforced polymer, same as fiber-reinforced composite |
| HR-ICP-MS | High-resolution inductively coupled plasma mass spectrometry\ |
| VARTM | Vacuum-assisted resin transfer molding |
| BET | Brunauer–Emmett–Teller theory |
| LOI | Loss on ignition |
| γ-APS APTES | γ-aminopropyltriethoxysilane |
| PPO | Poly(propylene oxide) |
| PEO | Poly(ethylene oxide) |
| PDMS | Polydimethylsiloxane |
References
- Berg, J.; Jones, F.R. The role of sizing resins, coupling agents and their blends on the formation of the interphase in glass fiber composites. Compos. Part A 1998, 29, 1261–1272. [Google Scholar] [CrossRef]
- Feih, S.; Wei, J.; Kingshott, P.; Sørensen, B.F. The influence of fiber sizing on the strength and fracture toughness of glass fiber composites. Compos. Part A 2005, 36, 245–255. [Google Scholar] [CrossRef]
- Dai, Z.; Shi, F.; Zhang, B.; Li, M.; Zhang, Z. Effect of sizing on carbon fiber surface properties and fibers/epoxy interfacial adhesion. Appl. Surf. Sci. 2011, 257, 6980–6985. [Google Scholar] [CrossRef]
- Yuan, X.; Zhu, B.; Cai, X.; Liu, J.; Qiao, K.; Yu, J. Optimization of interfacial properties of carbon fiber/epoxy composites via a modified polyacrylate emulsion sizing. Appl. Surf. Sci. 2017, 401, 414–423. [Google Scholar] [CrossRef]
- DiBenedetto, A.T. Tailoring of interfaces in glass fiber reinforced polymer composites: A review. Mater. Sci. Eng. A 2001, 302, 74–82. [Google Scholar] [CrossRef]
- Plonka, R.; Mäder, E.; Gao, S.L.; Bellmann, C.; Dutschk, V.; Zhandarov, S. Adhesion of epoxy/glass fiber composites influenced by aging effects on sizings. Compos. Part A 2004, 35, 1207–1216. [Google Scholar] [CrossRef]
- Grabovac, I.; Whittaker, D. Application of bonded composites in the repair of ships structures—A 15-year service experience. Compos. Part A 2009, 40, 1381–1398. [Google Scholar] [CrossRef]
- McGeorge, D.; Echtermeyer, A.T.; Leong, K.H.; Melve, B.; Robinson, M.; Fischer, K.P. Repair of floating offshore units using bonded fibre composite materials. Compos. Part A 2009, 40, 1364–1380. [Google Scholar] [CrossRef]
- Gustafson, C.-G.; Echtermeyer, A. Long-term properties of carbon fibre composite tethers. Int. J. Fatigue 2006, 28, 1353–1362. [Google Scholar] [CrossRef]
- Salama, M.M.; Stjern, G.; Storhaug, T.; Spencer, B.; Echtermeyer, A. The first offshore field installation for a composite riser joint. OTC-14018-MS. In Proceedings of the Offshore Technology Conference, Houston, TX, USA, 6–9 May 2002. [Google Scholar] [CrossRef]
- Echtermeyer, A.T.; Gagani, A.I.; Krauklis, A.E.; Mazan, T. Multiscale modelling of environmental degradation—First steps. In Durability of Composites in a Marine Environment 2. Solid Mechanics and Its Applications; Davies, P., Rajapakse, Y.D.S., Eds.; Springer: Cham, Switzerland, 2018; Volume 245, pp. 135–149. ISBN 978-3-319-65145-3. [Google Scholar]
- Thomason, J.L. Glass Fiber Sizings: A Review of the Scientific Literature; James L Thomason: Middletown, DE, USA, 2012; ISBN 978-0-9573814-1-4. [Google Scholar]
- Weitsman, Y. Coupled damage and moisture-transport in fiber-reinforced, polymeric composites. Int. J. Solids Struct. 1987, 23, 1003–1025. [Google Scholar] [CrossRef]
- Weitsman, Y.J.; Elahi, M. Effects of fluids on the deformation, strength and durability of polymeric composites—An overview. Mech. Time-Depend. Mater. 2000, 4, 107–126. [Google Scholar] [CrossRef]
- Roy, S. Moisture-induced degradation. In Long-Term Durability of Polymeric Matrix Composites; Pochiraju, V.K., Tandon, P.G., Schoppner, A.G., Eds.; Springer: Boston, MA, USA, 2012; pp. 181–236. ISBN 978-1-4419-9307-6. [Google Scholar]
- Peters, L. Influence of glass fibre sizing and storage conditions on composite properties. In Durability of Composites in a Marine Environment 2. Solid Mechanics and Its Applications; Davies, P., Rajapakse, Y.D.S., Eds.; Springer: Cham, Switzerland, 2018; Volume 245, pp. 19–31. ISBN 978-3-319-65145-3. [Google Scholar]
- Culler, S.R.; Ishida, H.; Koenig, J.L. Hydrothermal Stability of γ-Aminopropyltriethoxysilane Coupling Agent on Ground Silicon Powder and E-Glass Fibers; Technical Report; Department of Macromolecular Science: Cleveland, OH, USA, 1983. [Google Scholar]
- Wang, D.; Jones, F.R.; Denison, P. TOF SIMS and XPS study of the interaction of hydrolysed γ-aminopropyltriethoxysilane with E-glass surfaces. J. Adhes. Sci. Technol. 1992, 6, 79–98. [Google Scholar] [CrossRef]
- Wang, D.; Jones, F.R.; Denison, P. Surface analytical study of the interaction between γ-amino propyl triethoxysilane and E-glass surface. Part I Time-of-flight secondary ion mass spectrometry. J. Mater. Sci. 1992, 27, 36–48. [Google Scholar] [CrossRef]
- Wang, D.; Jones, F.R. Surface analytical study of the interaction between γ-amino propyl triethoxysilane and E-glass surface. Part II X-ray photoelectron spectroscopy. J. Mater. Sci. 1993, 28, 2481–2488. [Google Scholar] [CrossRef]
- Wang, M.; Xu, X.; Ji, J.; Yang, Y.; Shen, J.; Ye, M. The hygrothermal aging process and mechanism of the novolac epoxy resin. Compos. Part B 2016, 107, 1–8. [Google Scholar] [CrossRef]
- Halpin, J.C. Effects of Environmental Factors on Composite Materials; Technical Report AFML-TR-67–423; Air Force Materials Laboratory: Dayton, OH, USA, 1969. [Google Scholar]
- ASTM D4963/D4963M-2011 Standard Test Method for Ignition Loss of Glass Strands and Fabrics; ASTM: West Conshohocken, PA, USA, 2011.
- Loewenstein, K.L. Glass Science and Technology (Book 6), The Manufacturing Technology of Continuous Glass Fibres; Elsevier: Amsterdam, The Netherlands, 1993; ISBN 978-0444893468. [Google Scholar]
- Thomason, J.L.; Adzima, L.J. Sizing up the interphase: An insider’s guide to the science of sizing. Compos. Part A 2001, 32, 313–321. [Google Scholar] [CrossRef]
- Plueddemann, E.P. Silane Coupling Agents, 2nd ed.; Plenum Press: New York, NY, USA, 1991; ISBN 978-0-306-43473-0. [Google Scholar]
- Emadipour, H.; Chiang, P.; Koenig, J.L. Interfacial strength studies of fibre-reinforced composites. Res. Mech. 1982, 5, 165–176. [Google Scholar]
- Krauklis, A.E.; Echtermeyer, A.T. Dissolving cylinder zero-order kinetic model for predicting hygrothermal aging of glass fibre bundles and fibre-reinforced composites. In Proceedings of the 4th International Glass Fibre Symposium, Aachen, Germany, 29–31 October 2018; pp. 66–72, ISBN 978-3-95886-249-4. [Google Scholar]
- Joliff, Y.; Belec, L.; Chailan, J.-F. Impact of the interphases on the durability of a composite in humid environment—A short review. In Proceedings of the 20th International Conference on Composite Structures ICCS20, Paris, France, 4–7 September 2017. [Google Scholar]
- Zhuang, R.-C.; Burghardt, T.; Mäder, E. Study on interfacial adhesion strength of single glass fiber/polypropylene model composites by altering the nature of the surface of sized glass fibers. Compos. Sci. Technol. 2010, 70, 1523–1529. [Google Scholar] [CrossRef]
- Wolff, V.; Perwuelz, A.; El Achari, A.; Caze, C.; Carlier, E. Determination of surface heterogeneity by contact angle measurements on glass fibres coated with different sizings. J. Mater. Sci. 1999, 34, 3821–3829. [Google Scholar] [CrossRef]
- Ishida, H.; Koenig, J.L. An investigation of the coupling agent/matrix interface of fiberglass reinforced plastics by fourier transform infrared spectroscopy. Polym. Phys. B 1979, 17, 615–626. [Google Scholar] [CrossRef]
- Watson, H.; Mikkola, P.J.; Matisons, J.G.; Rosenholm, J.B. Deposition characteristics of ureido silane ethanol solutions onto E-glass fibres. Colloids Surf. A 2000, 161, 183–192. [Google Scholar] [CrossRef]
- Feresenbet, E.; Raghavan, D.; Holmes, G.A. Influence of silane coupling agent composition on the surface characterization of fiber and on fiber-matrix interfacial shear strength. J. Adhes. 2003, 79, 643–665. [Google Scholar] [CrossRef]
- Fagerholm, H.M.; Lindsjö, C.; Rosenholm, J.B.; Rökman, K. Physical characterization of E-glass fibres treated with alkylphenylpoly(oxyethylene)alcohol. Colloids Surf. 1992, 69, 79–86. [Google Scholar] [CrossRef]
- Thomason, J.L.; Dwight, D.W. The use of XPS for characterization of glass fibre coatings. Compos. Part A 1999, 30, 1401–1413. [Google Scholar] [CrossRef]
- Turrión, S.G.; Olmos, D.; González-Benito, J. Complementary characterization by fluorescence and AFM of polyaminosiloxane glass fibers coatings. Polym. Test. 2005, 24, 301–308. [Google Scholar] [CrossRef]
- Mai, K.; Mäder, E.; Mühle, M. Interphase characterization in composites with new non-destructive methods. Compos. Part A 1998, 29, 1111–1119. [Google Scholar] [CrossRef]
- Thomason, J.L.; Dwight, D.W. XPS analysis of the coverage and composition of coatings on glass fibers. J. Adhes. Sci. Technol. 2000, 14, 745–764. [Google Scholar] [CrossRef]
- Wang, D.; Jones, F.R. TOF SIMS and XPS study of the interaction of silanized E-glass with epoxy resin. J. Mater. Sci. 1993, 28, 1396–1408. [Google Scholar] [CrossRef]
- Chiang, C.H.; Ishida, H.; Koenig, J.L. The structure of aminopropyltriethoxysilane on glass surfaces. J. Colloid Interface Sci. 1980, 74, 396–404. [Google Scholar] [CrossRef]
- Rocha, I.B.C.M.; Raijmaekers, S.; Nijssen, R.P.L.; van der Meer, F.P.; Sluys, L.J. Hygrothermal ageing behaviour of a glass/epoxy composite used in wind turbine blades. J. Compos. Struct. 2017, 174, 110–122. [Google Scholar] [CrossRef]
- Kim, J.K.; Sham, M.L.; Wu, J. Nanoscale characterization of interphase in silane treated glass fibre composites. Compos. Part A 2001, 32, 607–618. [Google Scholar] [CrossRef]
- ASTM D5229/D5229M-14 Standard Test Method for Moisture Absorption Properties and Equilibrium Conditioning of Polymer Matrix Composite Materials; ASTM International: West Conshohocken, PA, USA, 2014.
- Perreux, D.; Choqueuse, D.; Davies, P. Anomalies in moisture absorption of glass fibre reinforced epoxy tubes. Compos. Part A 2002, 33, 147–154. [Google Scholar] [CrossRef]
- Krauklis, A.E.; Echtermeyer, A.T. Mechanism of yellowing: carbonyl formation during hygrothermal aging in a common amine epoxy. Polymers 2018, 10, 1017. [Google Scholar] [CrossRef] [PubMed]
- Krauklis, A.E.; Echtermeyer, A.T. Long-term dissolution of glass fibers in water described by dissolving cylinder zero-order kinetic model: Mass loss and radius reduction. Open Chem. 2018, 16, 1189–1199. [Google Scholar] [CrossRef]
- 3B Fibreglass Technical Data Sheet; HiPer-Tex W2020 Rovings: Belgium, Brussel, 2012.
- Gagani, A.I.; Fan, Y.; Muliana, A.H.; Echtermeyer, A.T. Micromechanical modeling of anisotropic water diffusion in glass fiber epoxy reinforced composites. J. Compos. Mater. 2017, 52, 2321–2335. [Google Scholar] [CrossRef]
- Zinck, P.; Gerard, J.F. On the hybrid character of glass fibres surface networks. J. Mater. Sci. 2005, 40, 2759–2760. [Google Scholar] [CrossRef]
- ASTM D3171/D3171-15 Standard Test Methods for Constituent Content of Composite Materials; ASTM International: West Conshohocken, PA, USA, 2015.
- Brunauer, S.; Emmett, P.H.; Teller, E. Adsorption of gases in multimolecular layers. J. Am. Chem. Soc. 1938, 60, 309–319. [Google Scholar] [CrossRef]
- International Standard ISO 9277:2010(E) Determination of the Specific Surface Area of Solids by Gas Adsorption—BET Method; ISO: Berlin, Germany, 2010.
- Popineau, S.; Rondeau-Mouro, C.; Sulpice-Gaillet, C.; Shanahan, M.E.R. Free/bound water absorption in an epoxy adhesive. Polymer 2005, 46, 10733–10740. [Google Scholar] [CrossRef]
- Krauklis, A.E.; Gagani, A.I.; Echtermeyer, A.T. Hygrothermal aging of amine epoxy: reversible static and fatigue properties. Open Eng. 2018, 8, 447–454. [Google Scholar] [CrossRef]
- Krauklis, A.E.; Gagani, A.I.; Echtermeyer, A.T. Near-Infrared Spectroscopic Method For Monitoring Water Content In Epoxy Resins And Fiber-Reinforced Composites. Materials 2018, 11, 586. [Google Scholar] [CrossRef]
- Thomason, J.L. The interface region in glass-fibre-reinforced epoxy resin composites: 2. Water absorption, voids and the interface. Composites 1995, 26, 477–485. [Google Scholar] [CrossRef]
- Crank, J. The Mathematics of Diffusion, 2nd ed.; Clarendon Press: Oxford, UK, 1975; ISBN 978-0-19-853411-6. [Google Scholar]
- Maggana, C.; Pissis, P. Water sorption and diffusion studies in an epoxy resin system. J. Polym. Sci. Part B 1999, 37, 1165–1182. [Google Scholar] [CrossRef]
- Toscano, A.; Pitarresi, G.; Scafidi, M.; Di Filippo, M.; Spadaro, G.; Alessi, S. Water diffusion and swelling stresses in highly crosslinked epoxy matrices. Polym. Degrad. Stab. 2016, 133, 255–263. [Google Scholar] [CrossRef]
- Bruchet, A.; Elyasmino, N.; Decottignies, V.; Noyon, N. Leaching of bisphenol A and F from new and old epoxy coatings: Laboratory and field studies. Water Sci. Technol. 2014, 14, 383–389. [Google Scholar] [CrossRef]
- Schutte, C.L. Environmental durability of glass-fiber composites. Mater. Sci. Eng. R Rep. 1994, 13, 265–323. [Google Scholar] [CrossRef]
- Krauklis, A.E.; Gagani, A.I.; Vegere, K.; Kalnina, I.; Klavins, M.; Echtermeyer, A.T. Dissolution kinetics of R-glass fibres: Influence of water acidity, temperature and stress corrosion. Fibers 2019, 7, 22. [Google Scholar] [CrossRef]
- Khawam, A.; Flanagan, D.R. Solid-state kinetic models: basics and mathematical fundamentals. J. Phys. Chem. B 2006, 110, 17315–17328. [Google Scholar] [CrossRef] [PubMed]
- Gagani, A.I.; Mialon, E.P.V.; Echtermeyer, A.T. Immersed interlaminar fatigue of glass fiber epoxy composites using the I-beam method. Int. J. Fatigue 2019, 119, 302–310. [Google Scholar] [CrossRef]
- Rocha, I.B.C.M.; van der Meer, F.P.; Raijmaekers, S.; Lahuerta, F.; Nijssen, R.P.L.; Mikkelsen, L.P.; Sluys, L.J. A combined experimental/numerical investigation on hygrothermal aging of fiber-reinforced composites. Eur. J. Mech. Sol. 2019, 73, 407–419. [Google Scholar] [CrossRef]
- Bonniau, P.; Bunsell, A.R. Water absorption by glass fibre reinforced epoxy resin. In Composite Structures; Marshall, I.H., Ed.; Springer: Dordrecht, The Netherlands, 1981; pp. 92–105. ISBN 978-94-009-8122-5. [Google Scholar]
- Gagani, A.I.; Krauklis, A.E.; Sæter, E.; Vedvik, N.P.; Echtermeyer, A.T. A novel method for testing and determining ILSS for marine and offshore composites. Comp. Struct. 2019, 220, 431–440. [Google Scholar] [CrossRef]


© 2019 by the authors. Licensee MDPI, Basel, Switzerland. This article is an open access article distributed under the terms and conditions of the Creative Commons Attribution (CC BY) license (http://creativecommons.org/licenses/by/4.0/).