Article

Effect of Surface Pre-Treatments on the Formation and Degradation Behaviour of a Calcium Phosphate Coating on Pure Magnesium

1
School of Materials Science and Engineering, Harbin Institute of Technology, Harbin 150001, China
2
Institute of Vanadium and Titanium, Panzhihua University, PanZhiHua 617000, China
3
Magnesium Innovation Centre-MagIC, Institute of Materials Research, Helmholtz-Zentrum Geesthacht, 21502 Geesthacht, Germany
4
National Key Laboratory for Precision Hot Processing of Metals, Harbin Institute of Technology, Harbin 150001, China
*
Authors to whom correspondence should be addressed.
Coatings 2019, 9(4), 259; https://doi.org/10.3390/coatings9040259
Submission received: 1 April 2019 / Revised: 12 April 2019 / Accepted: 15 April 2019 / Published: 18 April 2019
(This article belongs to the Special Issue Bioactive Surfaces and Coatings for Bone Regeneration)

Abstract

:
Calcium phosphate (CaPh) coatings are considered promising surface treatments for Mg-based implants. Normally, the phase conversion process of CaPh compounds occurs during immersion in simulated body fluid (SBF) and allows the easy penetration of a corrosive medium. To solve the issue, pre-treatment is often performed, creating an effective barrier that further improves the corrosion resistance of the underlying Mg. In the present work three pre-treatments including hydrothermal treatment, anodization, and plasma electrolytic oxidation (PEO) were performed on pure Mg prior to CaPh deposition. Results indicated that the composition, morphology, and thickness of the CaPh coatings were strongly influenced by the pre-treatments. Dicalcium phosphate dihydrate (DCPD) was formed on PEO surface, whilst DCPD and hydroxyapatite (HA) were deposited on hydrothermally prepared and anodized surfaces. HA could be deposited on the studied samples during immersion in SBF. The electrochemical impedance spectrum indicated that CaPh coating combined with PEO pre-treatment had the highest corrosion resistance at 120 h due to the superior barrier properties conferred by the PEO layer.

1. Introduction

Mg and its alloys have gained increasing attention as biomaterials considering their superior biocompatibility, high specific strength and ideal Young’s modulus (41–45 GPa) [1,2,3]. They are capable of minimising the risk of the stress-shielding effect since they possess a much closer elastic modulus to bone tissue compared to other traditional implants [4,5]. Specifically, as bone-fixation devices and stents, Mg-based materials can obviate the need for a second surgery for device removal because of their degradation ability [6]. However, the fast degradation rate remains a critical issue that limits their applications in clinic [7,8,9]. To solve this issue, protective coatings have been widely utilized to enhance the corrosion performance of Mg and its alloys [10,11,12]. Considering the biocompatibility and the osteogenicity, calcium phosphate (CaPh) compounds are promising candidates for bioactive coatings on Mg-based implants [13,14,15].
CaPh compounds can efficiently improve the biocompatibility of Mg and its alloys on account of the similar composition to the inorganic component of bone [16,17,18]. Thus surface modifications and treatments, including chemical conversion [19], sol-gel [20], vapour deposition [21], plasma electrolytic oxidation [22], hydrothermal treatment [23] and cathodic electrodeposition [24,25], have been developed to deposit on the surface of Mg-based materials. However, the corrosion properties of a single CaPh coating prepared by these methods are still controversial for long-term implants considering the solubility and structural characteristics [26,27,28]. Moreover, defects, cracks and poor adhesion of the CaPh coatings are often inevitable, which allow the penetration of the corrosive medium (simulated body fluids) and, accordingly, corrosion of Mg substrates [29,30].
Reinforcing the corrosion performance by introduction of a pre-treatment layer prior to the deposition of CaPh layer on Mg-based materials has proven efficient in previous studies [31,32,33]. The pre-treatments can dramatically increase the corrosion resistance of the substrate and the full-coated samples, and can also provide long-term biodegradability for the implant [34,35,36]. For instance, Liu et al. [37] prepared a CaPh coating on a PEO-coated Mg substrate by the chemical conversion method. The results showed that the PEO layer significantly improved the corrosion resistance of the system, and revealed a self-healing ability in simulated body fluid. In addition, the pre-treatments are closely related with the precipitation process of the CaPh coating. Hiromoto et al. [38] reported that the precipitation of CaPh coating was influenced by the morphologies of an anodizing pre-treatment. The absence of local corrosion on the CaPh/anodizing-coated sample during a 40-h immersion in SBF indicated its higher corrosion resistance. Furthermore, the pre-treatments can be applied to improve the antibacterial activity and cytocompatibility together with the CaPh coating [39]. In a recent study [40], PEO/hydroxyapatite composite coatings were prepared on a Mg–Ca alloy via PEO coupled with electrophoretic deposition. Such a duplex coating with high corrosion resistance, antibacterial activity and cytocompatibility was suggested for orthopaedic surgical applications. For these reasons, surface pre-treatment of Mg and its alloys is an appropriate solution for the application of CaPh coatings. Nevertheless, although some studies have been reported, there are still open questions. Most of these studies focus on the corrosion resistance, degradable property and functionality of the CaPh coatings [34,41,42]. Research into the influence of pre-treatment layer on the formation mechanism of CaPh coating is scarce, and the corrosion behaviour of the hybrid CaPh/pre-treatment-coated samples in SBF still needs to be investigated.
In this study, three pre-treatments were carried out on the surface of pure Mg prior to cathodic electrodeposition (CED) of CaPh. The formation mechanism of the CaPh coating was studied, the phase evolution and corrosion behaviour of the CaPh-coated samples in simulated body fluid were investigated, and the influence of the pre-treatments on the morphology, composition and performance of the duplex coating was discussed.

2. Experimental

2.1. Materials and Pre-Treatments

Commercial pure magnesium stripes with dimensions of 20 × 20 × 3 mm3 were used as substrates in this study. The chemical composition of Mg was determined by Spark OES (Spark analyser M9, SPECTRO Ametek, Harmbug, Germany), as shown in Table 1. Prior to the pre-treatment, the specimens were abraded using SiC paper from 800 to 2500 grade, then washed in distilled water and dried in air.
Three pre-treatments were prepared on pure magnesium. The electrolyte composition and parameters of the pre-treatments are shown in Table 2.
Hydrothermal treatment was the first method. The Mg samples were placed in a climate chamber under conditions of 90 °C and 90% humidity. The samples were treated for a period of 24 h.
Anodization treatment was carried out with a constant current density of 0.1 A/cm2 for 60 min at 40 °C by a DC power supply. The specimen served as the anode and a graphite sheet was employed as the cathode. An aqueous electrolyte containing 10 g/L sodium carbonate (Na2CO3), 40 g/L sodium hydroxide (NaOH) and 50 ml/L ethanediol (C2H6O2) was used.
Finally, the PEO process was carried out with a pulsed DC power supply (ton:toff = 0.5 ms:4.5 ms and 100 Hz) under a constant voltage of 450 V for 10 min. A stainless-steel tube was used as the cathode, while the specimens were the anode. The electrolyte contained 20 g/L Na3PO4 and 1 g/L KOH; the temperature of the PEO electrolyte was controlled at 20 ± 1 °C using a cooling system. To achieve a uniform surface state, both AT and PEO treatments were performed under continuous agitation with a magnetic stirrer rotating at 150 r/min.

2.2. Deposition of the CaPh Coating

The CaPh coatings were deposited on the pre-treated samples by direct current (DC) cathodic electroassisted deposition method under 47 ± 0.5 °C. A two-electrode cell was used for the preparation; a graphite sheet was selected as the anode while the pre-treated samples were utilized as the cathode. A 600 mL aqueous electrolyte containing 19.7 g/L Ca(NO3)2 and 6.8 g/L KH2PO4 with a adjusted pH value of 4.6 was used as the deposition solution. CaPh is soluble at pH 4.6 and exists in a solution that is not soluble at higher pH during cathodic deposition. The deposition duration was 90 min. The current–time curves during the electroassisted deposition period were monitored by Sigma soft 6000 software.
The pre-treated samples are named HT (hydrothermal treatment), AT (anodization treatment) and PEO (plasma electrolytic oxidation), respectively, throughout the paper. The samples are referred to as HT-C, AT-C and PEO-C after CaPh coating, respectively.

2.3. Characterization

The top-view and cross-sectional morphologies of the pre-treated and CaPh-coated samples were characterized using a Tescan Vega 3 SB scanning electron microscope (SEM, LabWrench, Waukesha, WI, USA). The phase composition was measured by an X-ray diffraction (XRD with Cu Kα radiation, Bruker, Karlsruhe, Germany) with a scanning rate of 0.01 °/s and scanning range of 10°–50°. Grazing incidence XRD was used under 3° of incidence angle at 40 kV and 40 mA.

2.4. Electrochemical Tests

The electrochemical measurements were carried out with a Gamry Interface 3000 potentiostat (Gamry, Shanghai, China) in a simulated body fluid (SBF) at 37 ± 0.5 °C. The composition of SBF was 8.035 g/L NaCl, 0.355 g/L NaHCO3, 0.225 g/L KCl, 0.231 g/L K2HPO4·3H2O, 0.311 g/L MgCl·6H2O, 39 mL/L 1 mol/L HCl, 0.292 g/L CaCl2, 0.072 g/L Na2SO4 and 6.118 g/L Tris (trimethylolamine); the pH was adjusted to 7.4 using 1 mol/L HCl. A typical three-electrode system was used in this study with a saturated Ag/AgCl reference and a platinum counter electrode. The pre-treated samples served as the working electrodes, with an exposed area of 1 cm2. Potentiodynamic polarization curves were recorded from –150 mV relative to open circuit potential (OCP) to a terminal current density of 2 mA/cm2 with a scan rate of 0.5 mV/s after a 30-min stabilisation in SBF. Electrochemical impedance spectroscopy (EIS) measurements were carried out after OCP measurement at regular intervals; the scan amplitude ranged from 100 kHz to 10 mHz for five days by applying 10 mV RMS relative to OCP. The tests were performed under continuous agitation with a magnetic stirrer rotating at 150 r/min. EIS results were analysed by fitting the data with Zsimpwin software 3.20. Each test was carried out three times to ensure the reproducibility.

2.5. Immersion Test

Immersion tests were performed in SBF at 37 ± 0.5 °C with an immersion period of 120 h. The immersion tests were also done under the same stirring conditions described above. The SBF was refreshed every two days. The morphologies and phase compositions after 120 h immersion were then analysed.

3. Results and Discussion

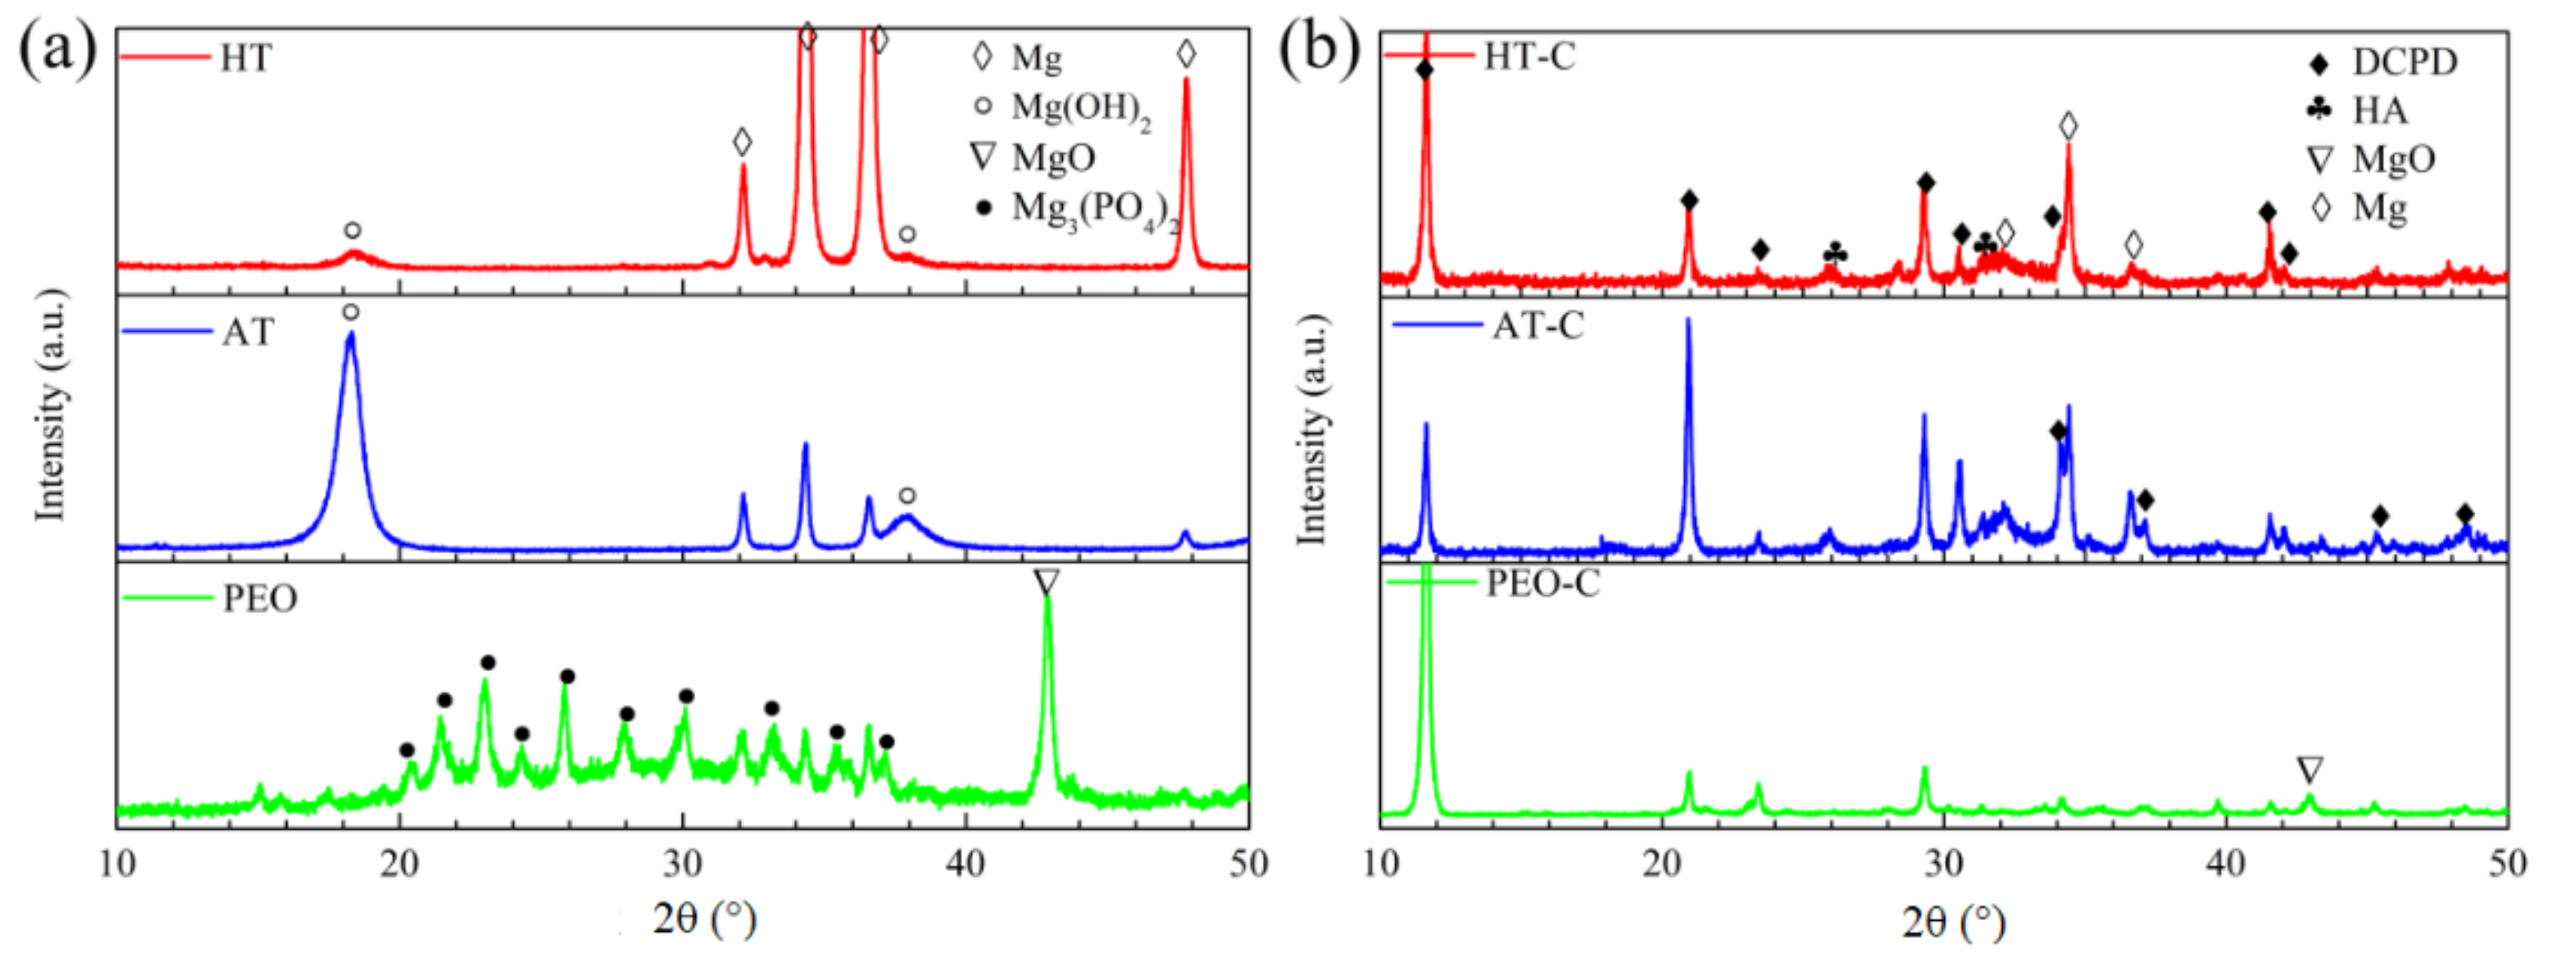
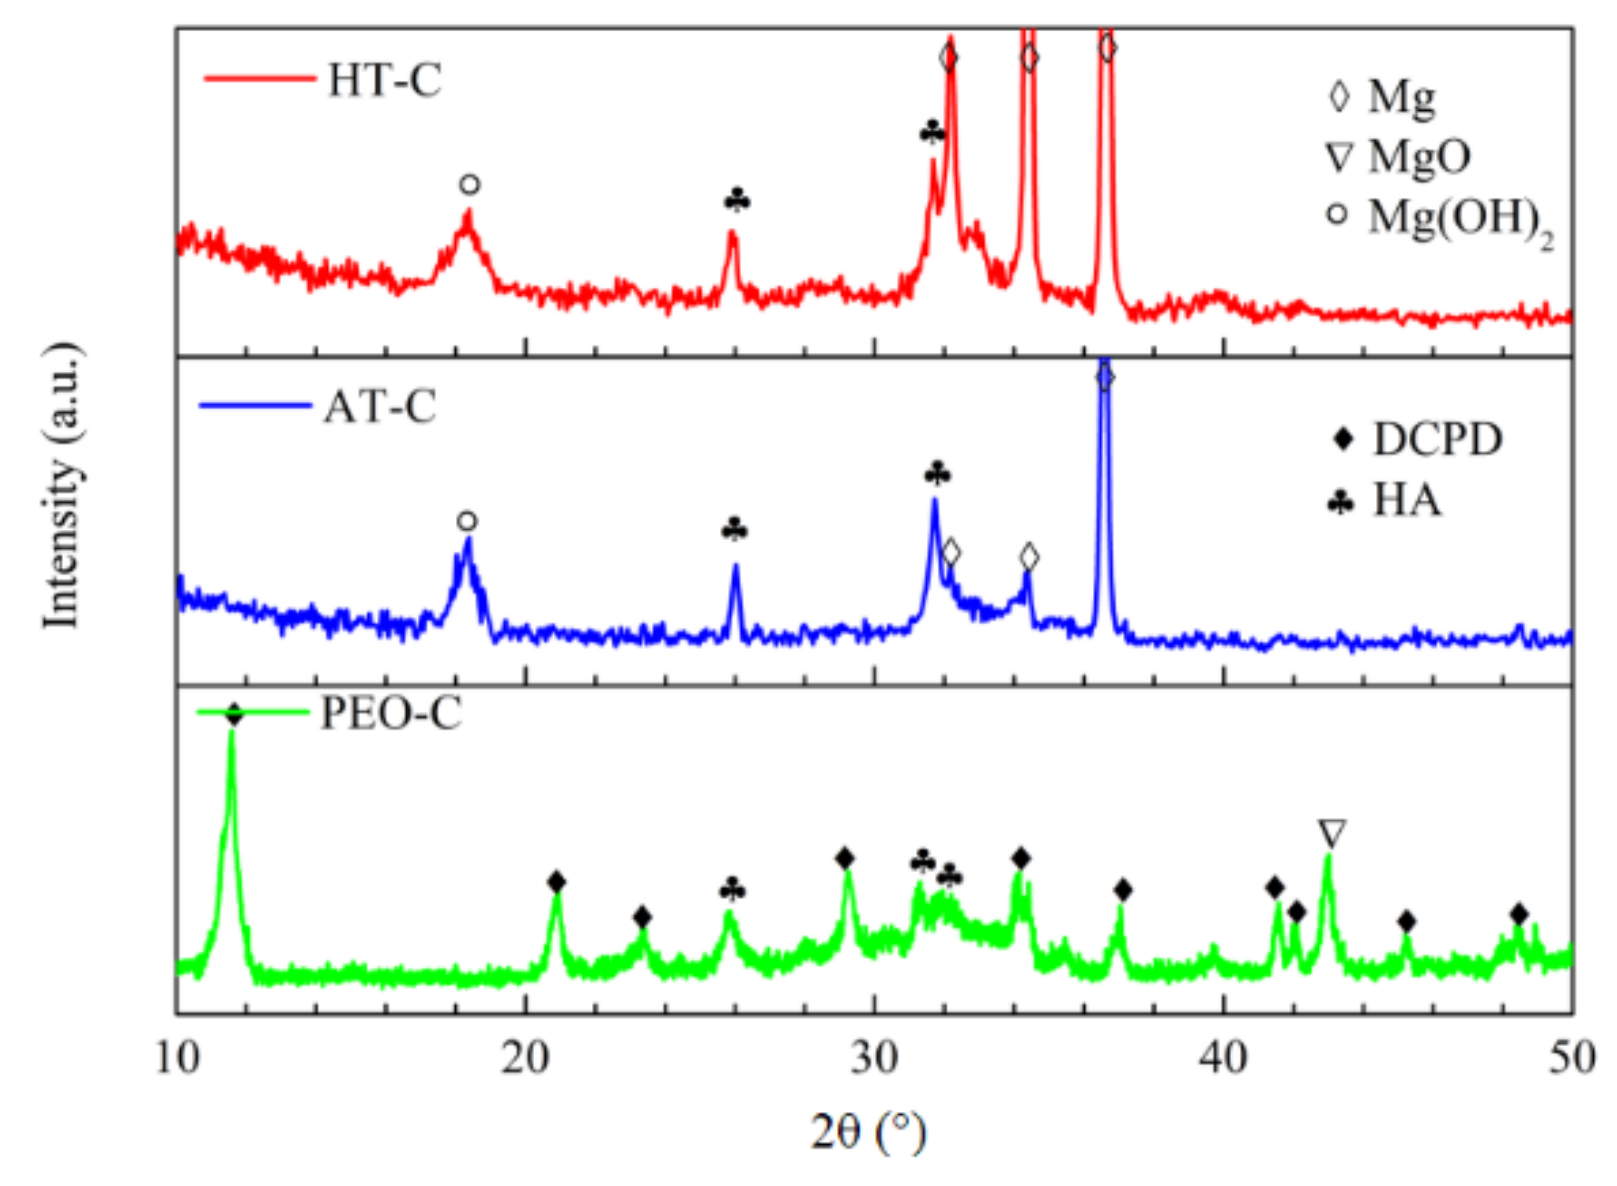
3.1. Phase Composition of the Pre-Treatments and CaPh-Coated Samples

The XRD patterns of the pre-treated samples are shown in Figure 1a. The diffraction peaks of Mg from the substrate can be found in all the cases. Mg(OH)2 was the main component of the HT and AT samples, while MgO and Mg3(PO4)2 were detected on the surface of the PEO sample. The lower temperature and moderate reaction on the surface of the HT and AT samples were responsible for the formation of Mg(OH)2. For PEO treatment, MgO always formed as a result of a series of complex interface reactions as well as electrical, mechanical and thermal theories [43]. In addition, the corresponding intensities of Mg(OH)2 on the surface of AT sample were significantly higher than those of the HT sample, suggesting that the HT pre-treated layer was probably thinner. The corresponding intensities of the Mg substrate were lower than those of the rest, suggesting that the PEO pre-treated layer was probably thicker.
Figure 1b displays the phase composition of the CaPh-coated samples. Apart from the diffraction peaks originated from the pre-treated substrates (Mg and MgO), the only DCPD peaks were detected on the PEO-C sample. DCPD and HA were deposited together on the surfaces of the HT-C and AT-C samples. Correspondingly, the intensities of the HA peaks were lower than that of DCPD, illustrating that the contents of HA were possibly lower than that of DCPD in these coatings. This indicated that the pre-treatment layers strongly influenced the phase composition of CaPh coatings.

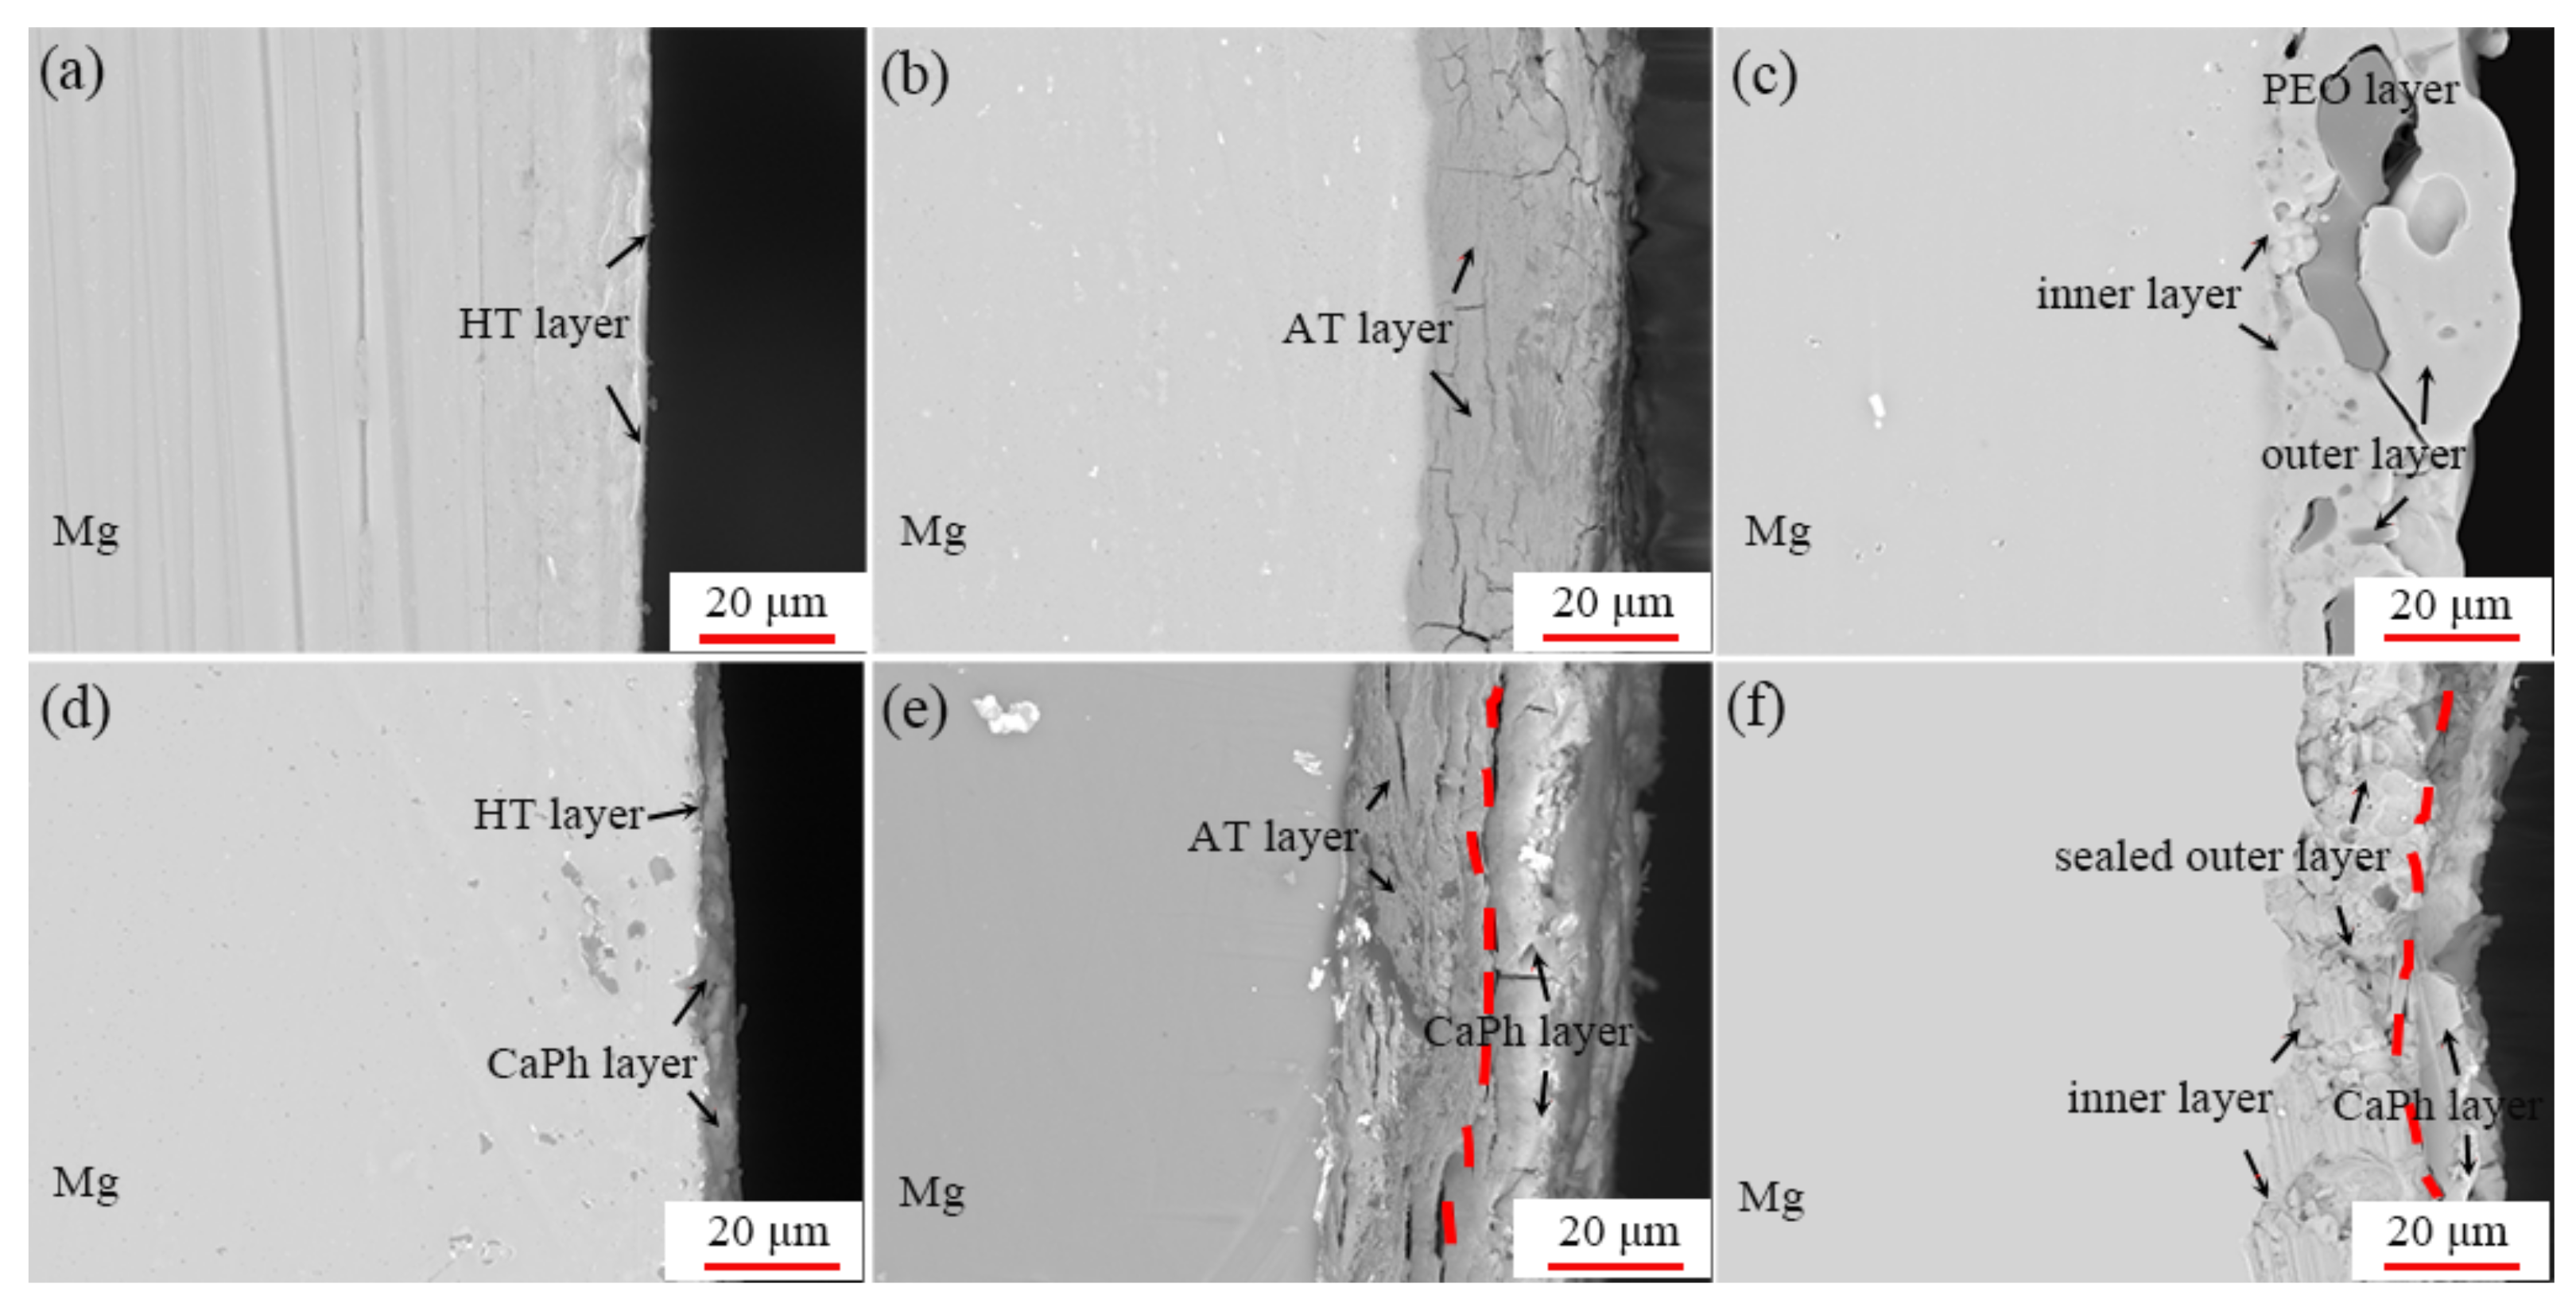
3.2. Morphologies of the Pre-Treatments and CaPh-Coated Samples

Diverse types of surface morphologies are observable on the pre-treated and CaPh-coated Mg surfaces, as shown in Figure 2. Paralleled scratches introduced during the grinding process remained on the surface of the HT sample, as seen in images depicted at lower and higher magnification (Figure 2a). This indicated that a thin pre-treated layer exists on the substrate surface. In addition, a uniform, interlacing feather-like structure appeared in the high-magnification morphology of the HT sample. This is a typical appearance of hydroxides on magnesium and its alloy surfaces that can be formed in a humid ambient environment [44]. Charged by a DC power supply, a cloudy surface morphology featuring an island-like structure was identified on AT-treated Mg (see Figure 2b). However, a completely different surface morphology was seen on the surface of PEO-treated Mg (Figure 2c), featuring discontinuous cracks and pores on the nano or micron scale. Such a surface resulted from the consecutive breakdown of the dielectric oxide layer by the discharge; the pores and cracks were introduced due to the quenching effect by the electrolyte [12]. As a result, a sintered and porous surface morphology was achieved during PEO treatment.
The surface morphologies of the pre-treated surfaces were modified by the CaPh coating, as shown in Figure 2d–f. Plate-like and flower-like microstructures could be identified for HT-C (Figure 2d) and AT-C (Figure 2e). However, a uniform, large plate-like structure (about 100 μm) appeared on the PEO-C surface (Figure 2f), suggesting a single CaPh phase was deposited. The size difference of the plate-like structures also indicated that the nucleation and growth conditions were different on the three pre-treated samples; our previous study also found that the CaPh phase tended to grow along a fixed direction on a PEO-treated Mg substrate [37].
The cross section morphologies of the pre-treated and CaPh-coated samples are shown in Figure 3. The thinnest pre-treatment layer was formed on the HT sample surface (about 1–3 µm). The average thicknesses of the AT and PEO layer were about 25 µm (Figure 3b) and 30 µm (Figure 3c), respectively. For the PEO coating, two layers could be clearly observed and assigned to the porous layer (outer layer) and compact layer (inner layer). After CaPh deposition, new coatings were formed on the pre-treated layers. For the HT-C sample, the average thickness of the CaPh coating was about 5 µm, which was thinner than that on the AT-C (10–12 µm) and PEO-C samples (10–15 µm). In addition, the porous structure could hardly be seen, implying that the porous layer of PEO was filled with the CaPh phase after deposition, as clearly seen in Figure 3f. This proved that the CaPh phase could nucleate at the open pores and seal the surface cracks of the PEO layer. Moreover, the thickness of AT and PEO layers decreased slightly (to about 20 µm and 18–25 µm, respectively) after CaPh deposition, indicating that the pre-treatment layers could be slightly dissolved in acidic electrolyte.

3.3. Formation Mechanism of the CaPh Coatings on the Pre-Treated Substrates

Figure 4 shows the current density–time curves of the pre-treated samples monitored during the electrodeposition process. The current density of HT sample rapidly increased from 5.2 to 8.5 mA/cm2 in the initial period (0 to 14 min), then gradually decreased to 7 mA/cm2 within 50 min of deposition and stayed almost constant in the following period. The curves of the AT and PEO samples exhibited a different trend. The current densities quickly decreased from 4.8 to 3.0 (AT sample) and from 3.6 to 2.3 mA/cm2 (PEO sample) in the first 20 min, finally approaching a constant value with values of 2.4 (AT sample) and 1.8 mA/cm2 (PEO sample), respectively. It should be noted that the constant values of the current densities were different for the CaPh-coated samples, suggesting a difference in the cathode resistance to the electrolyte of the hybrid coatings.
As seen in Figure 1 and Figure 2, the pre-treatment has a significant influence on the morphologies and phase composition of the CaPh coatings. Various pre-treatments are performed on the Mg substrate, which leads to differences in the chemical environment prior to the CaPh deposition. The thickness, morphologies and composition of the pre-treatment layers play vital roles in the formation of CaPh coatings.
As the start of the electrodeposition, abundant ions of Ca2+ and H2PO4 exist in the solution. For HT and AT samples, Mg(OH)2 could easily hydrolyse in an electrolyte with a pH value less than 10.5; the local increase of pH occurs partially to compensate for the acidity at the interface and releases OH (Equation (1)). H2PO4, combining with OH, formed HPO42− (Equation (2)). Meanwhile, H2PO4 could also convert to HPO42− under a DC applied voltage, according to Equation (3). DCPD is formed preferentially as a result of HPO42− combining with Ca2+, according to Equation (4). To prove the preferential deposition of DCPD, XRD patterns of the HT-C and AT-C samples under a short deposition period (10 min) are recorded, as shown in Figure 5. XRD patterns indicate that, besides the peaks originating from the Mg and pre-treatment layers, only DCPD diffraction peaks appear during a 10-min deposition.
Mg(OH)2 → Mg2+ + 2OH
H2PO4 +OH → HPO42− + H2O
2H2PO4 + 2e → 2HPO42− + H2
Ca2+ + HPO42− + 2H2O → CaHPO4·2H2O
As the deposition process goes on, the influent electrons would cause a reduction in H2O. More OH is released and hydrogen bubbles appear (Equation (5)), resulting in an increase in pH of the deposition solution. The elevated pH and influent electrons make HPO42− ions convert into PO43− ions (Equations (6) and (7)). As reported, HA tends to be formed in an alkaline environment [45]. HA is deposited on the surface of HT and AT samples according to Equation (8) following DCPD. The balance between DCPD and HA is most probably controlled by the local pH at the interface.
2H2O + 2e → H2 + 2OH
HPO42− + OH → PO43− + H2O
2HPO42− + 2e → 2PO43− + H2
10Ca2+ + 6PO43− + 2OH → Ca10(PO4)6(OH)2
For the PEO sample, the pre-treatment layer is mainly composed of MgO. Thus a lower amount of OH is produced since the hydrolysis of MgO is more difficult than Mg(OH)2 [46]. In this case, less H2PO4 is converted into HPO43− because the reaction of Equation (2) is slow, though Equation (3) occurs. Only DCPD is formed on the PEO surface by combining Ca2+ ions and HPO42− ions (Equation (4)). The reaction in Equation (8) is restrained because of the absence of enough OH and the difficult transformation of HPO42− ions to PO43− ions.
With the quick growth of CaPh phases, the surface resistance should increase and the current density should decrease at the same time. However, a different trend is observed (Figure 3). The thin Mg(OH)2 coating of HT sample dissolves quickly in acidic electrolyte, and the electrolyte in contact with the bare metal substrate surface causes an increase in current density. For the AT and PEO samples, the thicker pre-treatment layers prevent the free permeation of the electrolyte, and the current density decreases in the initial period, which is related to the formation of CaPh phases in defects sealing the pre-treatment layers. In the following deposition period, for all samples (after 15 min), the pre-treatment layers are completely covered with CaPh, and the further dissolution of pre-treatment layer is prevented. The nucleation and growth rate of CaPh coatings should slow down, and the current density decreases slightly.

3.4. Corrosion Behaviour of the Pre-Treatments and CaPh-Coated Samples

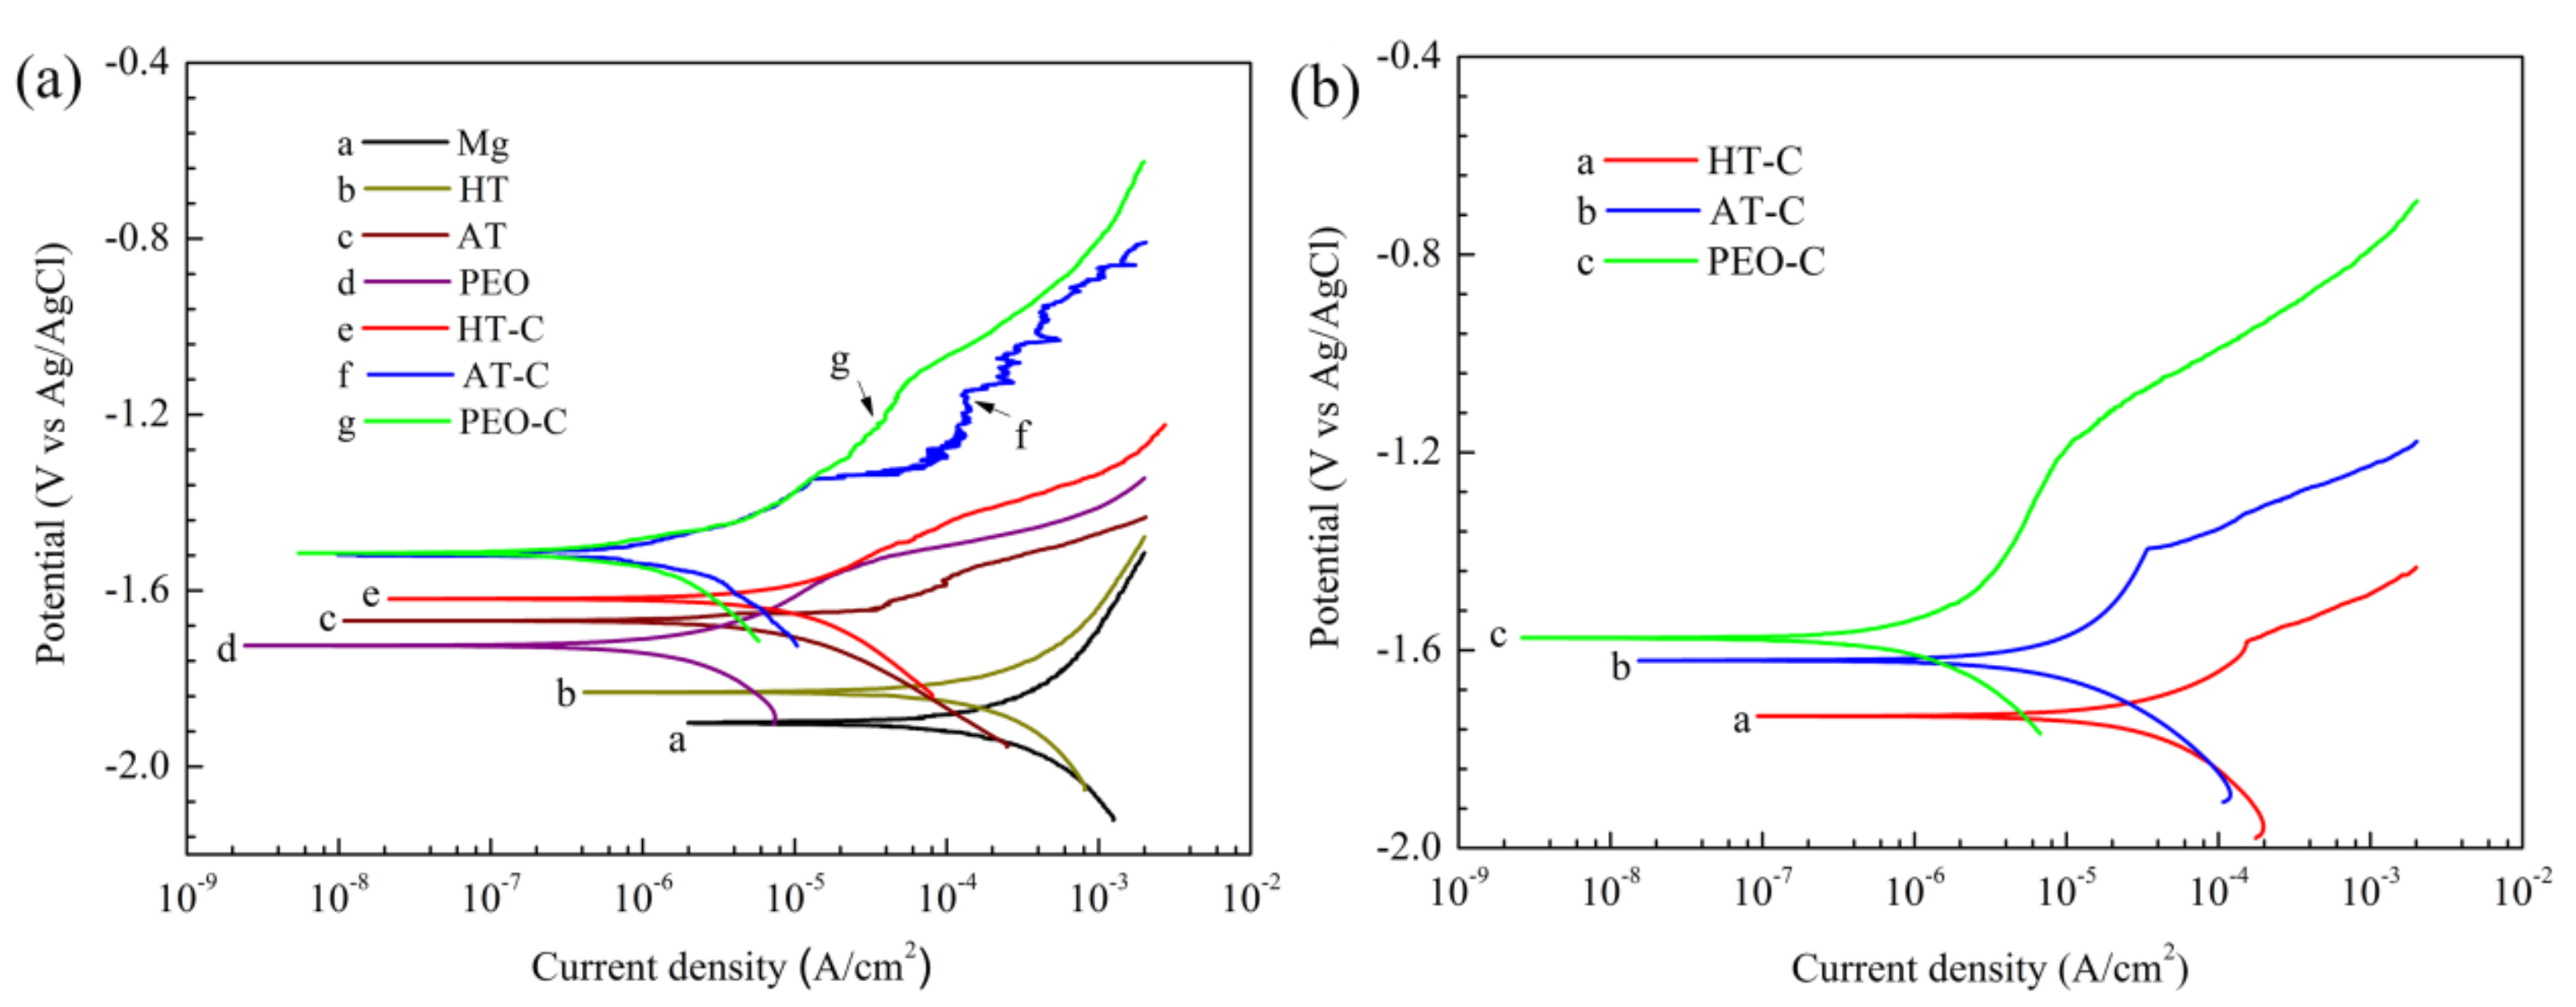
3.4.1. Potentiodynamic Polarization Curves

Potentiodynamic polarization curves of the samples with and without CaPh coatings are presented in Figure 6. The Mg substrate was also measured as a reference. The corresponding corrosion potential (Ecorr) and corrosion current density (icorr), determined by extrapolation of the polarization curves, are listed in Table 3. After pre-treatment, Ecorr shifted to positive values and icorr decreased compared to the Mg substrate, suggesting that the corrosion reactions on the surfaces were suppressed by the pre-treatment layers, as shown in Figure 6a. The HT sample exhibited the highest icorr value (9.85 × 10⁻⁵ A/cm2), indicating that the corrosion resistance of the HT treated sample was the lowest. The AT sample possessed higher icorr (4.95 × 10⁻⁶ A/cm2) than that of the PEO sample (1.25 × 10⁻⁶ A/cm2), though the thickness of the pre-treated layers was almost the same. The cracks and loose structure of the AT sample (Figure 3b) might be responsible for the poorer corrosion resistance.
More positive Ecorr and lower icorr values of the coated samples indicated that the corrosion resistance of the Mg substrate was further enhanced (see Figure 6a and Table 3). The HT-C sample also possessed the worst corrosion resistance compared to the rest of the coated samples due to the lowest Ecorr and the highest icorr. The AT-C and PEO-C samples showed similar Ecorr (−1.51 V) and icorr values (9.65 × 10⁻⁷ A/cm2 and 5.09 × 10⁻⁷ A/cm2); however, a more extended region with retarded dissolution existed in the anodic branch of PEO-C sample, indicating better corrosion resistance.
Figure 6b shows the potentiodynamic polarization curves of the CaPh-coated samples after a 120-h immersion. Comparing the as-deposited samples, the increasing icorr and decreasing Ecorr indicated a decrease in the corrosion resistance. The HT-C sample showed the most negative corrosion potential and the largest corrosion current density, with values of −1.734 V and 1.58 × 10⁻⁵ A/cm2, respectively. The corrosion performance of AT-C sample dropped significantly after a 120-h immersion since the icorr of the AT-C sample increased to 6.2 × 10⁻⁶ A/cm2, revealing poor resistance during long-term immersion. The PEO-C sample exhibited minimum corrosion current density of 6.92 × 10⁻⁷ A/cm2, which demonstrates the overall best corrosion resistance. Moreover, extended regions could be observed in the anodic branch of all the samples indicated the retarded anodic dissolution during the immersion.

3.4.2. OCP

OCP was measured as a function of immersion time during immersion in SBF, as shown in Figure 7. The OCP of the pre-treated samples are presented in Figure 7a. Various OCP values at 5 min indicated the different physical barriers of pre-treatment layers in the initial period. The OCP values of the HT sample increased over 6 h, while a declining trend was exhibited for the AT and PEO samples. For the HT sample, the thinnest pre-treated layer existed on its surface (Figure 3a). In this case, the corrosion of the Mg substrate should lead to OCP decreasing. However, the formation of corrosion products on the surface resulting from the quick corrosion of substrate would lead to OCP increasing. For the AT and PEO samples, the decrease of OCP values might be related to the infiltration of the SBF into the pre-treated layers due to cracks and pores on their surfaces (Figure 3b,c). The potential of all pre-treated samples fluctuated but had an increasing tendency during the following immersion period, and finally approached −1.690 V. After CaPh deposition, as shown in Figure 7b, the OCPs shifted to more positive values compared to the pre-treated samples. OCPs of HT-C and AT-C samples decreased first, and then increased continuously during the following immersion, approaching final values of −1.66 and −1.63 V, respectively. For the PEO-C sample, the OCP decreased slightly in the first 6 h and quite stable OCP values (around −1.60 V) were recorded from 6 to 120 h, indicating relatively stable properties during the immersion.

3.4.3. EIS Spectra of the Pre-Treated Samples

The EIS spectra of the pre-treated samples were consecutively recorded in SBF, as shown in Figure 8. Two well-defined time constants in medium-(101–103 Hz) and low-frequency (10−1–100 Hz) ranges were observable on the HT and AT samples (Figure 8a,b). Time constants at medium and low frequency were related to the pre-treatment layers and the electrochemical double layer at the exposed metal/electrolyte interface, respectively. The HT sample showed a low impedance modulus after 5 min of immersion. Subsequently, it decreased after 6 h, indicating that SBF penetrated into the pre-treated layer. Afterwards, the modulus increased gradually with the increase in immersion time. This is related to the blocking effect due to the formation of corrosion products on the surface. For the AT sample, a relatively high modulus value appeared in the whole frequency range after 5 min of immersion. This indicates that the AT layer has a relatively high barrier property. The impedance reduced quickly after 6 h and gradually increased later, because of the deposition of corrosion products.
However, for the PEO samples, the asymmetry of the mid-frequency phase angle peak suggests the appearance of another time constant at higher frequencies in the period before 24 h of immersion. Three time constants distributed at high, medium, and low frequency were observed in the plots, which reflected the electrochemical properties of the outer layer, inner layer and the double electric layer, as shown in Figure 8c. During the immersion process, the impedance modulus showed a relatively slight change for the whole frequency range. This indicates a positive stabilization effect of the PEO layer on the barrier properties of the oxide layer at the surface.
The physical models combined with equivalent circuits (EQC) for EIS of the pre-treatments are shown in Figure 9. In this work, we use the constant phase element (Q) instead of a capacitor in order to account for the dispersion effects. In the circuits, Rs represented the solution resistance, Qp and Rp represented the capacitance and resistance of the HT and AT layers, Qo, Ro, Qi and Ri stand for the capacitance and resistance of the outer and inner layer of PEO coating, respectively. Qdl and Rct represented the electric double layer capacitance and charge transfer resistance, respectively.

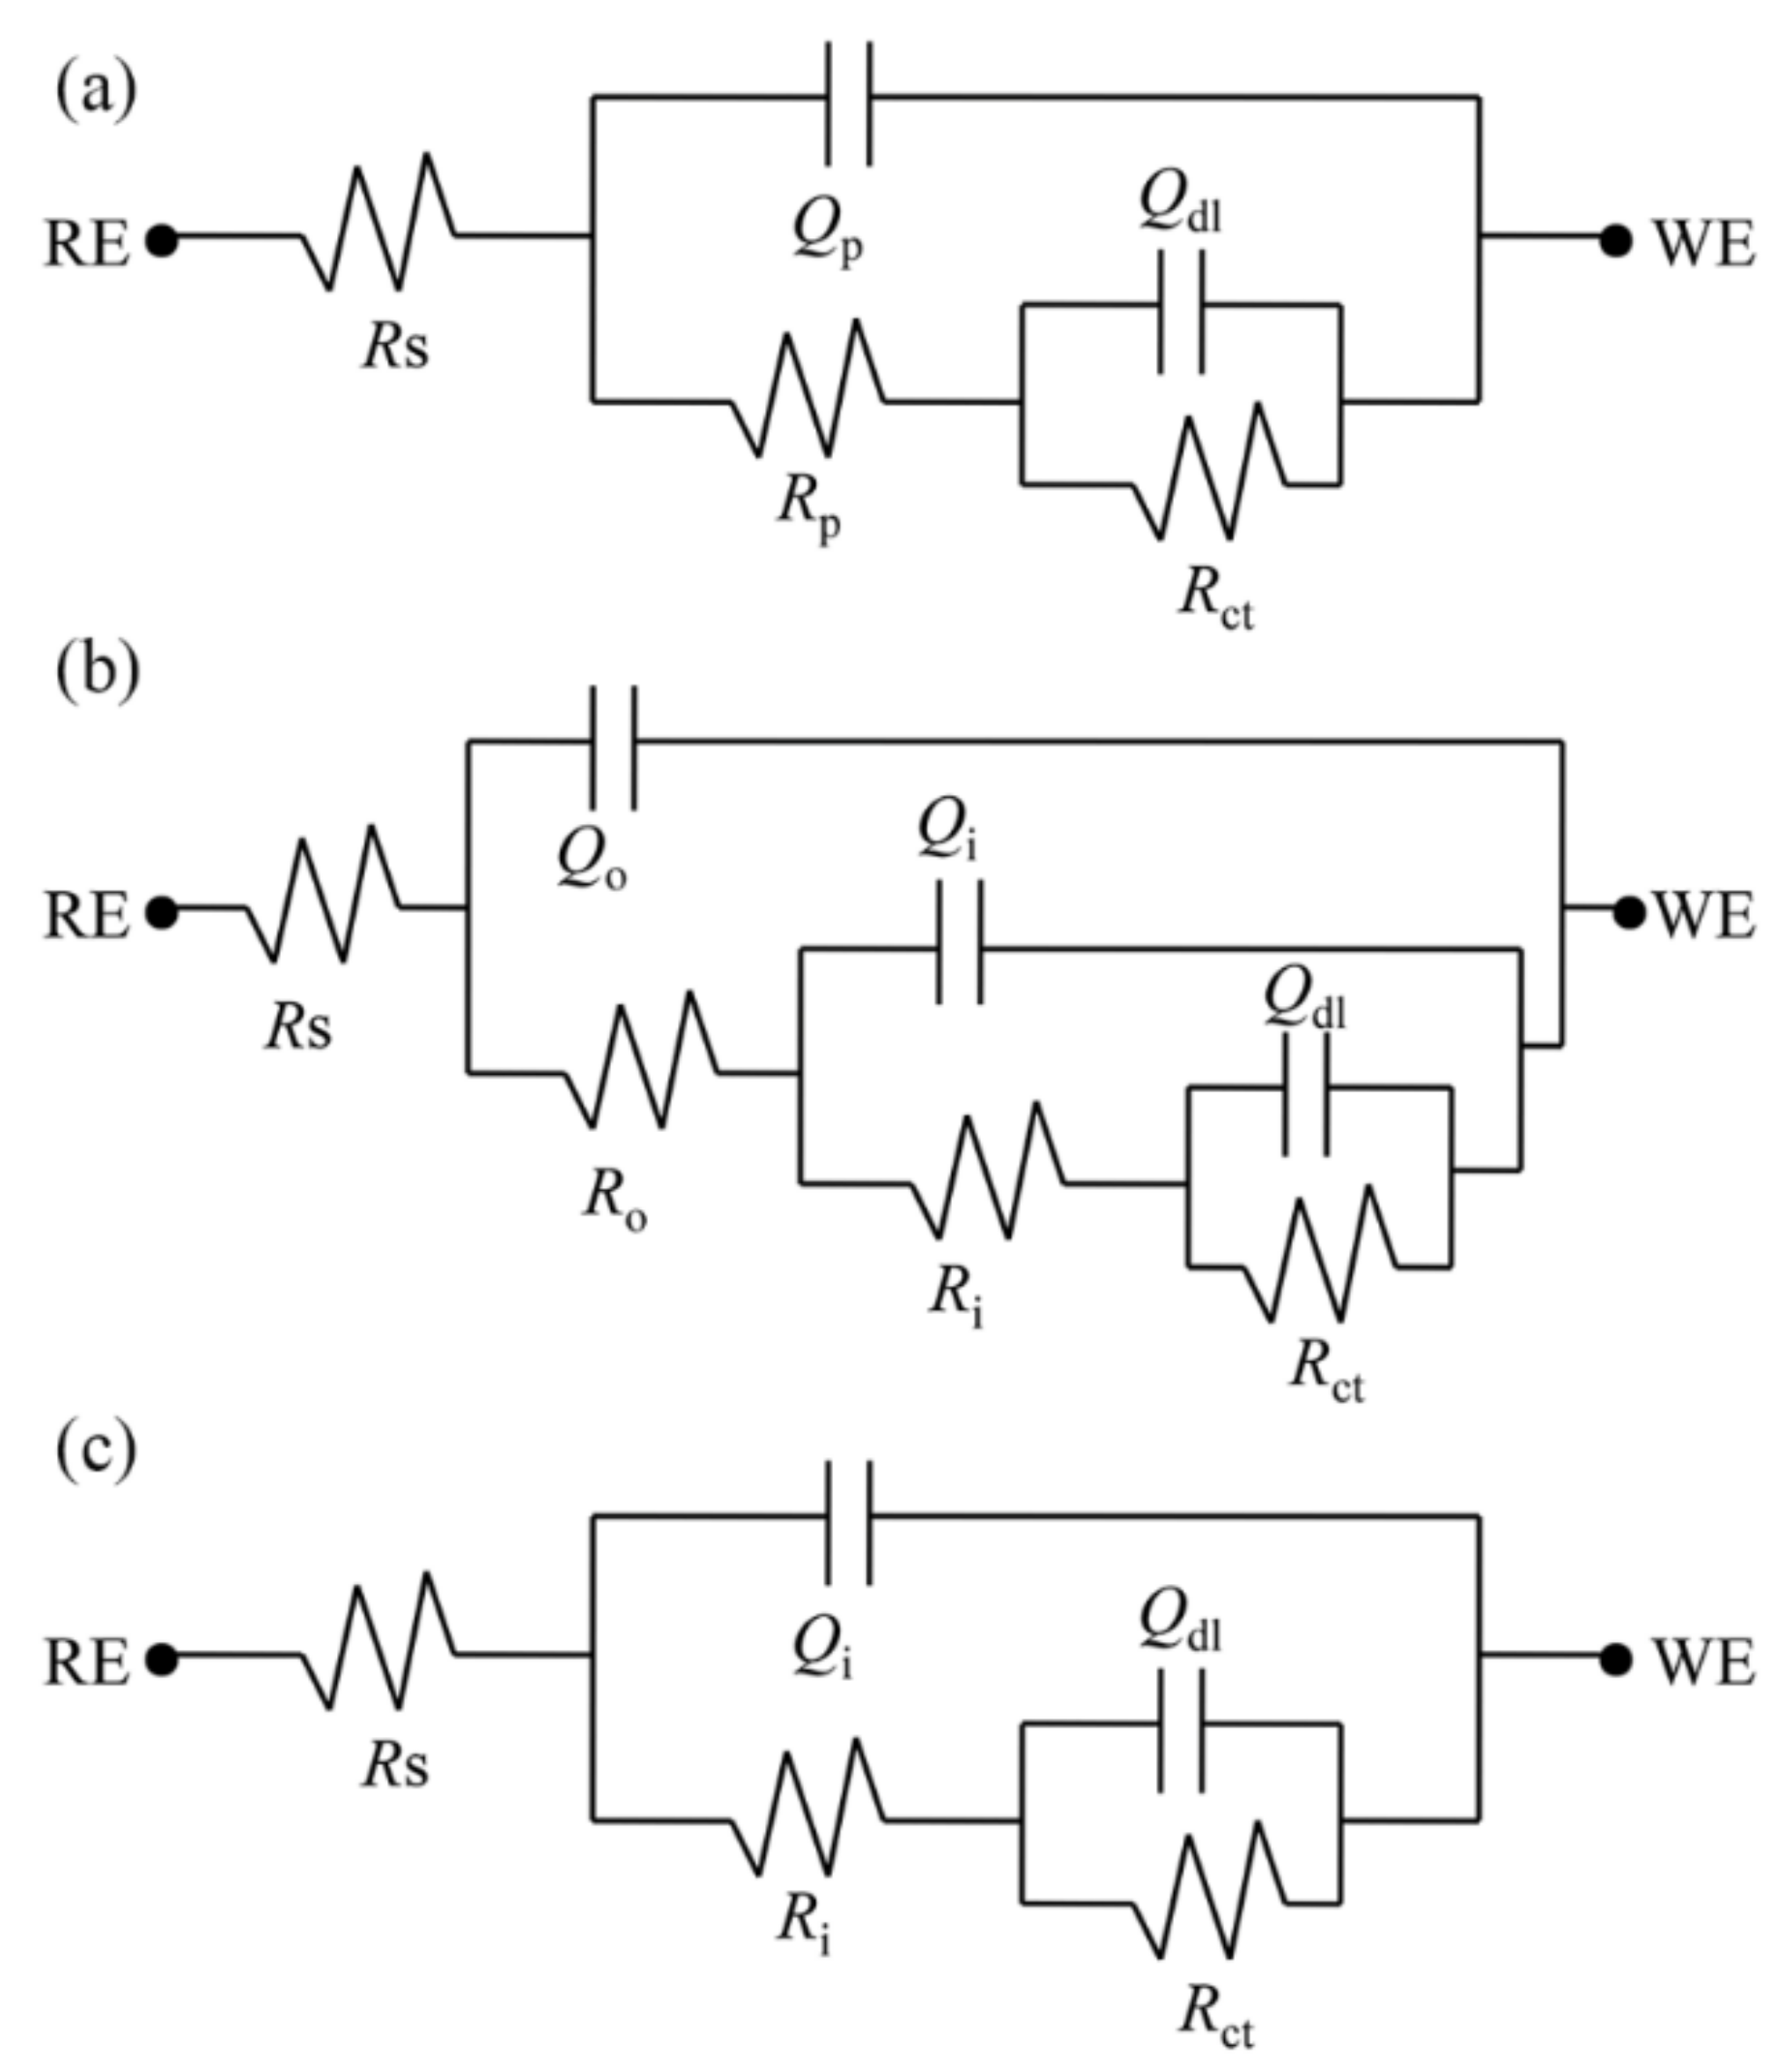
3.4.4. EIS Spectra of the CaPh-Coated Samples

With the additional CaPh coatings deposited on the pre-treated surfaces, the EIS spectra exhibited distinctly different evolution behaviour, as shown in Figure 10. The EIS plots of the HT-C and AT-C samples showed three time constants originating from high, medium and low frequency during the whole immersion period. Time constants in high and medium frequency could be assigned to the CaPh coatings and the pre-treatment layers, respectively. Another time constant representing the electrochemical double layer at the metal/electrolyte interface appeared in low frequency (10−1–100 Hz). For the PEO-C sample, the spectra displayed three time constants during the whole immersion period as well. The time constant at high frequency (103–105 Hz) can be assigned to the CaPh coating, the one at middle frequencies (101–102 Hz) originated from the sealed outer layer of PEO, and the relaxation process at low frequency (10−1–101 Hz) was related to the electrochemical activities at the electrolyte/inner layer of PEO.
The EQC model in Figure 11 was used to fit the EIS plots of the full coating systems. Figure 11a represents the HT-C and AT-C samples from 0 to 120 h, and the EQC of PEO-C from 0 to 120 h is shown in Figure 11b. Qc and Rc are the capacitance and resistance of the CaPh coating. Qcp and Rcp represent the capacitance and resistance of the pre-treatments. Qdl is the capacitance of the electrochemical double layer and Rct is the charge transfer resistance of the HT-C and AT-C samples. Qso, Rso, Qi and Ri stand for the capacitance and resistance of the CaPh sealed outer layer and the compact inner layer of PEO-C sample, respectively. The electrochemical processes at the interface should be manifested at low frequencies as a double-layer capacitance and charge transfer resistance. However, considering the relatively low values of Rct and high Qdl, their response is not visible in the respective spectra in the used frequency range. Therefore, the fitting of impedance data was performed using modified EQC (Figure 11b), which excluded the electrochemical response components.

3.4.5. Evolution of the EIS Fitting Parameters

Rp, Rc, Rcp and the sum of the resistances Rsum for each sample obtained from the EIS results are shown in Figure 12. Rp represented the barrier property of pre-treatments to the system. Herein, Rp values of PEO and PEO-C samples are the sum of Ro (or Rso) and Ri. The Rp and Rsum of the pre-treated samples are shown in Figure 12a,b, respectively. The Rp and Rsum values of HT and AT samples exhibited a similar trend, that is, decreasing for a short period (6 h) and increasing gradually in the following period (6–72 h). The penetration of the corrosive medium resulted in the decreasing Rp and Rsum values in the first 6 h and the deposition of corrosion products was responsible for the increasing trend. It can be noted that the highest Rp and Rsum values appeared in the PEO sample, indicating superior corrosion resistance.
With the presence of the CaPh coatings, the Rcp and Rsum values for all the pre-treated samples show an increase, as demonstrated in Figure 12d,e. For the PEO-C sample, the Rsum values increased by more than one order of magnitude, proving that the corrosion resistance of the systems was further improved. Furthermore, the highest Rc and Rcp values appeared in the PEO-C sample during the whole immersion process, indicating that it was the best combination of PEO and CaPh coatings (see Figure 12c). The Rc, Rp and Rsum values stayed almost stable after 24 h, indicating a better stability of the corrosion protection for the substrate. After 120 h of immersion, the Rc and Rcp of the HT-C and AT-C samples reached almost the same value. In addition, Rsum values of the HT-C and AT-C samples stayed the same after 24 h of immersion.

3.5. Immersion Tests

XRD patterns of all the coated samples in SBF after 120 h of immersion are depicted in Figure 13. For the HT-C and AT-C surfaces, the diffraction peaks of DCPD disappeared and distinct HA diffraction peaks appeared on the surfaces. The diffraction peaks of Mg(OH)2 that appeared on the HT-C and AT-C surfaces might have originated with the corrosion products. For PEO-C sample, DCPD peaks could still be detected after a 120-h immersion, and yet the corresponding intensities of DCPD peaks were low compared with Figure 1, while HA diffraction peaks were also observed. This means that the dissolution of DCPD improved the precipitation of HA.
The morphologies of the CaPh-coated samples after a 120-h immersion in SBF are shown in Figure 14. The large plate-like structure of DCPD (in Figure 2) disappeared, and new structures were found on the surfaces of each sample. Loose and porous morphologies with cracks appeared on the HT-C (Figure 14a) and AT-C (Figure 14b) surfaces, which might be related to the mineralization process of the CaPh phases in SBF. In addition, the entire dissolution of DCPD on the surfaces is responsible for the newly formed structures. A compact surface morphology could be found on the PEO-C sample, as shown in Figure 14c. The dense CaPh coating could provide long-term protection for the substrate.

3.6. Corrosion Behaviour of Pre-Treated and CaPh-Coated Samples in SBF

The top CaPh coatings offer the resistance of the initial immersion period [47]. However, as mentioned above, the corrosion resistance of a single CaPh coating is inadequate for long-term immersion in SBF due to the loose structure and the dissolution of CaPh compounds. The SBF penetrates into the coating and the barrier effect of the coating will be weakened. Pre-treatments can effectively improve the corrosion resistance of the Mg substrate. An appropriate pre-treatment on the surface of magnesium prior to the application of the CaPh coatings can also stabilize the magnesium substrate/CaPh coating interface. Our previous study mentions that surface pre-treatment prior to a hydrophobic calcium stearate coating affects the thickness and surface morphology but does not alter the phase composition of the coating [48]. However, in this study, we find that the pre-treatments not only influence the thickness and morphology of the CaPh coatings, but also the phase composition along with the adhesion between the CaPh coating and the magnesium substrate, thus playing an important role in the corrosion resistance of the coated samples.
Although the Rc values are low for all the coated samples, the Rcp values have been significantly improved by the presence of the CaPh coatings. The relatively low Rc values of the HT-C and AT-C samples indicate the poor combination of the CaPh coating and pre-treatment layer. For the HT sample, the Rcp presents the lowest value during the whole immersion process. Both the CaPh coating and the pre-treatment layer are penetrated easily by the medium due to the thickness of the surface (Figure 3d). Thus, the corrosion resistance of the sample is the lowest. As to the AT sample, the thicker CaPh coating and pre-treatment layer result in higher Rc and Rcp at the initial stage of the immersion process. However, the dissolution of DCPD leads to a quick decrease of Rc, and the coating does not provide much protection for the pre-treatment layer. In addition, the presence of cracks on the pre-treatment layer is responsible for the penetration of the SBF into substrate. The corrosion resistance of the AT-C sample is also low.
However, the PEO-C sample exhibits the highest resistance during the whole immersion process, showing the best corrosion protection properties. The highest Rc values indicate the best combination of PEO/CaPh coating. The thickest DCPD coating inhibits the penetration of the corrosive medium at first. With the increase in immersion time, DCPD would dissolve continuously. However, the sealed PEO layer exhibits excellent barrier properties and allows sufficient time for the precipitation of HA, so a dense CaPh coating is formed on the surface (Figure 14c). Meanwhile, the adhesion strength between the CaPh and PEO coatings is enhanced because of the interlocking effect since the porous structures of PEO layer provides more sites for the deposition of the CaPh coating [49,50]. However, Rc is still one order of magnitude lower than that of the Rcp value, so the main corrosion resistance of the PEO-C sample is provided by the pre-treatment layer. In a previous study, CaPh coating coupled with PEO treatment efficiently inhibited the local corrosion of Mg substrate, especially the pitting corrosion [51,52]. In this study, the CaPh phase nucleates at the open pores and defects of the outer PEO layer, as seen in Figure 3f. The sealed outer layer further reinforces the corrosion resistance of the system. Moreover, the inner (compact) layer of PEO efficiently inhibits the penetration of aggressive ions and the release of Mg, so the highest Rcp is presented. Owing to the overall factors, a PEO/CaPh hybrid coating exhibits the best corrosion resistance.

4. Conclusions

In this study, three pre-treatments were performed on a pure Mg surface prior to the deposition of a calcium phosphate (CaPh) coating, and the following conclusions could be drawn:
  • When a surface treatment is performed on pure magnesium, different surface treatment leads to different structures on the magnesium surface. After anodizing and hydrothermal treatment, Mg(OH)2 is formed on the magnesium surface, and MgO and Mg3(PO4)2 are the phase compositions of the PEO layer.
  • The surface pre-treatment of pure magnesium prior to the CaPh coating influences the thickness, morphologies and phase composition as well as the formation mechanism of CaPh coatings due to the different morphologies and composition of the pre-treated layers.
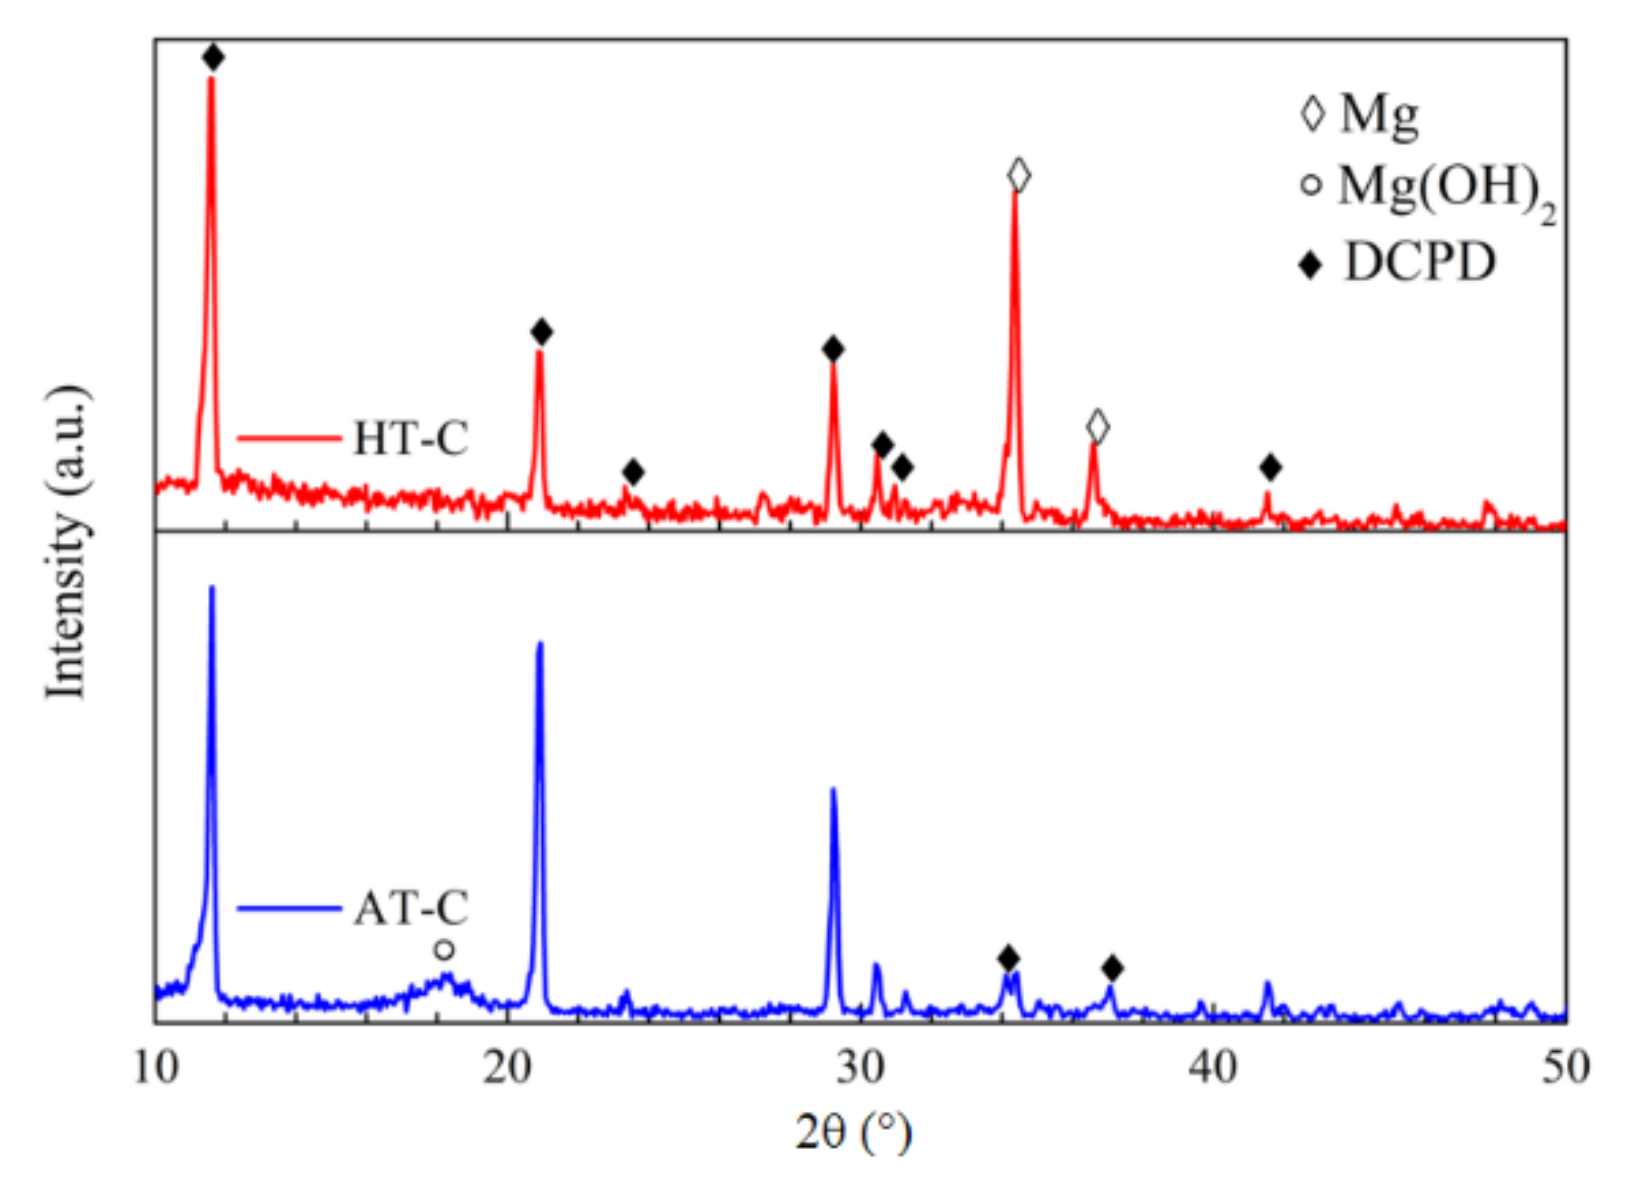
  • DCPD and HA are together deposited on the HT-C and AT-C samples, while only DCPD is detected on the PEO-C sample. During the SBF immersion, DCPD on the HT-C and AT-C samples disappears, whereas DCPD is present on the PEO-C sample all along. In any case, the coating surface can improve HA’s ability to precipitate in SBF. The pre-treatments play an important role in the corrosion resistance of the duplex coating systems. The best corrosion resistance is obtained for the PEO/CaPh combination because of the superior barrier properties of the PEO layer.

Author Contributions

Methodology, C.B.; Validation, C.B., J.H. (Jin Hu) and M.L.Z.; Formal Analysis, S.T.; Investigation, J.Y.; Data Curation, J.H. (Jinping Han); Writing–Original Draft Preparation, J.H. (Jinping Han); Writing–Review & Editing, J.H. (Jin Hu) and M.L.Z.; Visualization, J.H. (Jinping Han); Supervision, J.H. (Jin Hu) and M.L.Z.

Funding

This research received no external funding.

Acknowledgments

The technical support of Volker Heitmann and Ulrich Burmester during this work is gratefully acknowledged. Jiaping Han thanks China Scholarship Council (201606120117) for the award of fellowship and funding.

Conflicts of Interest

The authors declare no conflict of interest.

References

  1. Zheng, Y.F.; Gu, X.N.; Witte, F. Biodegradable metals. Mater. Sci. Eng. R Rep. 2014, 77, 1–34. [Google Scholar] [CrossRef]
  2. Sun, Y.; Zhang, B.; Wang, Y.; Geng, L.; Jiao, X. Preparation and characterization of a new biomedical Mg–Zn–Ca alloy. Mater. Des. 2012, 34, 58–64. [Google Scholar] [CrossRef]
  3. Wang, H.; Zhang, X.; Mani, M.; Jaganathan, S.; Huang, Y.; Wang, C. Microwave-assisted dip coating of aloe vera on metallocene polyethylene incorporated with Nano-Rods of hydroxyapaptite for bone tissue engineering. Coatings 2017, 7, 182. [Google Scholar] [CrossRef]
  4. Staiger, M.P.; Pietak, A.M.; Huadmai, J.; Dias, G. Magnesium and its alloys as orthopedic biomaterials: A review. Biomaterials 2006, 27, 1728–1734. [Google Scholar] [CrossRef] [PubMed]
  5. Song, M.-S.; Zeng, R.-C.; Ding, Y.-F.; Li, R.W.; Easton, M.; Cole, I.; Birbilis, N.; Chen, X.-B. Recent advances in biodegradation controls over mg alloys for bone fracture management: A review. J. Mater. Sci. Technol. 2019, 35, 535–544. [Google Scholar] [CrossRef]
  6. Ong, T.H.D.; Yu, N.; Meenashisundaram, G.K.; Schaller, B.; Gupta, M. Insight into cytotoxicity of Mg nanocomposites using MTT assay technique. Mater. Sci. Eng. C Mater. Biol. Appl. 2017, 78, 647–652. [Google Scholar] [CrossRef]
  7. Mueller, W.D.; Lucia Nascimento, M.; Lorenzo de Mele, M.F. Critical discussion of the results from different corrosion studies of Mg and Mg alloys for biomaterial applications. Acta Biomater. 2010, 6, 1749–1755. [Google Scholar] [CrossRef]
  8. Zhang, S.; Zhang, X.; Zhao, C.; Li, J.; Song, Y.; Xie, C.; Tao, H.; Zhang, Y.; He, Y.; Jiang, Y.; et al. Research on an Mg–Zn alloy as a degradable biomaterial. Acta Biomater. 2010, 6, 626–640. [Google Scholar] [CrossRef]
  9. Zhang, B.; Hou, Y.; Wang, X.; Wang, Y.; Geng, L. Mechanical properties, degradation performance and cytotoxicity of Mg–Zn–Ca biomedical alloys with different compositions. Mater. Sci. Eng. C 2011, 31, 1667–1673. [Google Scholar] [CrossRef]
  10. Lin, D.-J.; Hung, F.-Y.; Yeh, M.-L.; Lee, H.-P.; Lui, T.-S. Development of a novel micro-textured surface using duplex surface modification for biomedical Mg alloy applications. Mater. Lett. 2017, 206, 9–12. [Google Scholar] [CrossRef]
  11. Yazdimamaghani, M.; Razavi, M.; Vashaee, D.; Tayebi, L. Surface modification of biodegradable porous Mg bone scaffold using polycaprolactone/bioactive glass composite. Mater. Sci. Eng. C Mater. Biol. Appl. 2015, 49, 436–444. [Google Scholar] [CrossRef] [Green Version]
  12. Lu, X.; Blawert, C.; Tolnai, D.; Subroto, T.; Kainer, K.U.; Zhang, T.; Wang, F.; Zheludkevich, M.L. 3D reconstruction of plasma electrolytic oxidation coatings on Mg alloy via synchrotron radiation tomography. Corros. Sci. 2018, 139, 395–402. [Google Scholar] [CrossRef]
  13. Shadanbaz, S.; Dias, G.J. Calcium phosphate coatings on magnesium alloys for biomedical applications: A review. Acta Biomater. 2012, 8, 20–30. [Google Scholar] [CrossRef]
  14. Asri, R.I.M.; Harun, W.S.W.; Samykano, M.; Lah, N.A.C.; Ghani, S.A.C.; Tarlochan, F.; Raza, M.R. Corrosion and surface modification on biocompatible metals: A review. Mater. Sci. Eng. C Mater. Biol. Appl. 2017, 77, 1261–1274. [Google Scholar] [CrossRef] [Green Version]
  15. Prakash, C.; Singh, S.; Pabla, B.S.; Uddin, M.S. Synthesis, characterization, corrosion and bioactivity investigation of nano-HA coating deposited on biodegradable Mg–Zn–Mn alloy. Surf. Coat. Technol. 2018, 346, 9–18. [Google Scholar] [CrossRef]
  16. Singh, S.S.; Roy, A.; Lee, B.E.; Ohodnicki, J.; Loghmanian, A.; Banerjee, I.; Kumta, P.N. A study of strontium doped calcium phosphate coatings on AZ31. Mater. Sci. Eng. C Mater. Biol. Appl. 2014, 40, 357–365. [Google Scholar] [CrossRef]
  17. Waterman, J.; Pietak, A.; Birbilis, N.; Woodfield, T.; Dias, G.; Staiger, M.P. Corrosion resistance of biomimetic calcium phosphate coatings on magnesium due to varying pretreatment time. Mater. Sci. Eng. B 2011, 176, 1756–1760. [Google Scholar] [CrossRef]
  18. Cui, L.-Y.; Wei, G.-B.; Han, Z.-Z.; Zeng, R.-C.; Wang, L.; Zou, Y.-H.; Li, S.-Q.; Xu, D.-K.; Guan, S.-K. In vitro corrosion resistance and antibacterial performance of novel tin dioxide-doped calcium phosphate coating on degradable Mg–1Li–1Ca alloy. J. Mater. Sci. Technol. 2019, 35, 254–265. [Google Scholar] [CrossRef]
  19. Navarro da Rocha, D.; Cruz, L.R.d.O.; de Campos, J.B.; Marçal, R.L.S.B.; Mijares, D.Q.; Coelho, P.G.; Prado da Silva, M.H. Mg substituted apatite coating from alkali conversion of acidic calcium phosphate. Mater. Sci. Eng. C 2017, 70, 408–417. [Google Scholar] [CrossRef] [PubMed]
  20. Lamaka, S.V.; Montemor, M.F.; Galio, A.F.; Zheludkevich, M.L.; Trindade, C.; Dick, L.F.; Ferreira, M.G.S. Novel hybrid sol-gel coatings for corrosion protection of AZ31B magnesium alloy. Electrochim. Acta 2008, 53, 4773–4783. [Google Scholar] [CrossRef]
  21. Wu, G.; Zeng, X.; Yuan, G. Growth and corrosion of aluminum PVD-coating on AZ31 magnesium alloy. Mater. Lett. 2008, 62, 4325–4327. [Google Scholar] [CrossRef]
  22. Chang, L.; Tian, L.; Liu, W.; Duan, X. Formation of dicalcium phosphate dihydrate on magnesium alloy by micro-arc oxidation coupled with hydrothermal treatment. Corros. Sci. 2013, 72, 118–124. [Google Scholar] [CrossRef]
  23. Liu, G.; Wang, J.; Bian, K.; Zhu, P. Preparation and characterization of nanostructured dibasic calcium phosphate coating on magnesium alloy wire. Mater. Lett. 2017, 209, 323–326. [Google Scholar] [CrossRef]
  24. Wang, M.-J.; Chao, S.-C.; Yen, S.-K. Electrolytic calcium phosphate/zirconia composite coating on AZ91D magnesium alloy for enhancing corrosion resistance and bioactivity. Corros. Sci. 2016, 104, 47–60. [Google Scholar] [CrossRef]
  25. Fathyunes, L.; Khalil-Allafi, J. The effect of graphene oxide on surface features, biological performance and bio-stability of calcium phosphate coating applied by pulse electrochemical deposition. Appl. Surf. Sci. 2018, 437, 122–135. [Google Scholar] [CrossRef]
  26. Wu, P.-P.; Zhang, Z.-Z.; Xu, F.-J.; Deng, K.-K.; Nie, K.-B.; Gao, R. Effect of duty cycle on preparation and corrosion behavior of electrodeposited calcium phosphate coatings on AZ91. Appl. Surf. Sci. 2017, 426, 418–426. [Google Scholar] [CrossRef]
  27. Song, Y.; Shan, D.; Han, E.H. A novel biodegradable nicotinic acid/calcium phosphate composite coating on Mg–3Zn alloy. Mater. Sci. Eng. C Mater. Biol. Appl. 2013, 33, 78–84. [Google Scholar] [CrossRef] [PubMed]
  28. Zhang, C.; Zeng, R.; Liu, C.; Gao, J. Comparison of calcium phosphate coatings on Mg–Al and Mg–Ca alloys and their corrosion behavior in hank’s solution. Surf. Coat. Technol. 2010, 204, 3636–3640. [Google Scholar]
  29. Chen, X.B.; Birbilis, N.; Abbott, T.B. Effect of [Ca2+] and [PO43−] levels on the formation of calcium phosphate conversion coatings on die-cast magnesium alloy AZ91D. Corros. Sci. 2012, 55, 226–232. [Google Scholar] [CrossRef]
  30. Li, X.; Weng, Z.; Yuan, W.; Luo, X.; Wong, H.M.; Liu, X.; Wu, S.; Yeung, K.W.K.; Zheng, Y.; Chu, P.K. Corrosion resistance of dicalcium phosphate dihydrate/poly(lactic-co-glycolic acid) hybrid coating on AZ31 magnesium alloy. Corros. Sci. 2016, 102, 209–221. [Google Scholar] [CrossRef]
  31. Cui, W.; Beniash, E.; Gawalt, E.; Xu, Z.; Sfeir, C. Biomimetic coating of magnesium alloy for enhanced corrosion resistance and calcium phosphate deposition. Acta Biomater. 2013, 9, 8650–8659. [Google Scholar] [CrossRef] [PubMed]
  32. Gao, Y.; Yerokhin, A.; Matthews, A. Mechanical behaviour of cp-magnesium with duplex hydroxyapatite and PEO coatings. Mater. Sci. Eng. C Mater. Biol. Appl. 2015, 49, 190–200. [Google Scholar] [CrossRef]
  33. Liu, X.; He, D.; Zhou, Z.; Wang, G.; Wang, Z.; Wu, X.; Tan, Z. Characteristics of (002) oriented hydroxyapatite coatings deposited by atmospheric plasma spraying. Coatings 2018, 8, 258. [Google Scholar] [CrossRef]
  34. Zhao, Q.; Guo, X.; Dang, X.; Hao, J.; Lai, J.; Wang, K. Preparation and properties of composite MAO/ECD coatings on magnesium alloy. Colloids Surf. B Biointerfaces 2013, 102, 321–326. [Google Scholar] [CrossRef] [PubMed]
  35. Bakhsheshi-Rad, H.R.; Idris, M.H.; Abdul-Kadir, M.R. Synthesis and in vitro degradation evaluation of the nano-HA/MgF2 and DCPD/MgF2 composite coating on biodegradable Mg–Ca–Zn alloy. Surf. Coat. Technol. 2013, 222, 79–89. [Google Scholar] [CrossRef]
  36. Niu, B.; Shi, P.; Shanshan, E.; Wei, D.; Li, Q.; Chen, Y. Preparation and characterization of HA sol-gel coating on MAO coated AZ31 alloy. Surf. Coat. Technol. 2016, 286, 42–48. [Google Scholar] [CrossRef]
  37. Liu, G.; Tang, S.; Li, D.; Hu, J. Self-adjustment of calcium phosphate coating on micro-arc oxidized magnesium and its influence on the corrosion behaviour in simulated body fluids. Corros. Sci. 2014, 79, 206–214. [Google Scholar] [CrossRef]
  38. Hiromoto, S.; Shishido, T.; Yamamoto, A.; Maruyama, N.; Somekawa, H.; Mukai, T. Precipitation control of calcium phosphate on pure magnesium by anodization. Corros. Sci. 2008, 50, 2906–2913. [Google Scholar] [CrossRef]
  39. Tian, P.; Liu, X.; Ding, C. In vitro degradation behavior and cytocompatibility of biodegradable AZ31 alloy with PEO/HT composite coating. Colloids Surf. B Biointerfaces 2015, 128, 44–54. [Google Scholar] [CrossRef]
  40. Bakhsheshi-Rad, H.R.; Hamzah, E.; Ismail, A.F.; Aziz, M.; Daroonparvar, M.; Saebnoori, E.; Chami, A. In vitro degradation behavior, antibacterial activity and cytotoxicity of TiO2–MAO/ZnHA composite coating on Mg alloy for orthopedic implants. Surf. Coat. Technol. 2018, 334, 450–460. [Google Scholar] [CrossRef]
  41. Gao, Y.; Yerokhin, A.; Matthews, A. Deposition and evaluation of duplex hydroxyapatite and plasma electrolytic oxidation coatings on magnesium. Surf. Coat. Technol. 2015, 269, 170–182. [Google Scholar] [CrossRef]
  42. Shi, Y.; Qi, M.; Chen, Y.; Shi, P. MAO-DCPD composite coating on Mg alloy for degradable implant applications. Mater. Lett. 2011, 65, 2201–2204. [Google Scholar] [CrossRef]
  43. Friedemann, A.E.R.; Thiel, K.; Haßlinger, U.; Ritter, M.; Gesing, T.M.; Plagemann, P. Investigations into the structure of PEO-layers for understanding of layer formation. Appl. Surf. Sci. 2018, 443, 467–474. [Google Scholar] [CrossRef]
  44. Ng, W.F.; Wong, M.H.; Cheng, F.T. Stearic acid coating on magnesium for enhancing corrosion resistance in hanks’ solution. Surf. Coat. Technol. 2010, 204, 1823–1830. [Google Scholar] [CrossRef]
  45. Haghshenas, M. Mechanical characteristics of biodegradable magnesium matrix composites: A review. J. Magnes. Alloys 2017, 5, 189–201. [Google Scholar] [CrossRef]
  46. Khalajabadi, S.Z.; Abdul Kadir, M.R.; Izman, S.; Marvibaigi, M. The effect of mgo on the biodegradation, physical properties and biocompatibility of a Mg/HA/MgO nanocomposite manufactured by powder metallurgy method. J. Alloys Compd. 2016, 655, 266–280. [Google Scholar] [CrossRef]
  47. Husak, Y.; Solodovnyk, O.; Yanovska, A.; Kozik, Y.; Liubchak, I.; Ivchenko, V.; Mishchenko, O.; Zinchenko, Y.; Kuznetsov, V.; Pogorielov, M. Degradation and in vivo response of hydroxyapatite-coated Mg alloy. Coatings 2018, 8, 375. [Google Scholar] [CrossRef]
  48. Zhang, Y.; Blawert, C.; Tang, S.; Hu, J.; Mohedano, M.; Zheludkevich, M.L.; Kainer, K.U. Influence of surface pre-treatment on the deposition and corrosion properties of hydrophobic coatings on a magnesium alloy. Corros. Sci. 2016, 112, 483–494. [Google Scholar] [CrossRef]
  49. Chen, S.; Guan, S.; Li, W.; Wang, H.; Chen, J.; Wang, Y.; Wang, H. In vivo degradation and bone response of a composite coating on Mg–Zn–Ca alloy prepared by microarc oxidation and electrochemical deposition. J. Biomed. Mater. Res. Part B Appl. Biomater. 2012, 100, 533–543. [Google Scholar] [CrossRef]
  50. Zhao, L.; Cui, C.; Wang, Q.; Bu, S. Growth characteristics and corrosion resistance of micro-arc oxidation coating on pure magnesium for biomedical applications. Corros. Sci. 2010, 52, 2228–2234. [Google Scholar] [CrossRef]
  51. Tang, H.; Gao, Y. Preparation and characterization of hydroxyapatite containing coating on AZ31 magnesium alloy by micro-arc oxidation. J. Alloys Compd. 2016, 688, 699–708. [Google Scholar] [CrossRef]
  52. Anawati; Asoh, H.; Ono, S. Enhanced uniformity of apatite coating on a PEO film formed on AZ31 Mg alloy by an alkali pretreatment. Surf. Coat. Technol. 2015, 272, 182–189. [Google Scholar] [CrossRef]
Figure 1. X-ray diffraction patterns of the pre-treated and CaPh-coated substrates: (a) pretreated samples; (b) CaPh coated samples.
Coatings 09 00259 g001
Figure 2. Morphologies of the pre-treated and CaPh-coated substrates: (a) HT sample; (b) AT sample; (c) PEO sample; (d) HT-C sample; (e) AT-C sample; (f) PEO-C sample.
Coatings 09 00259 g002
Figure 3. Cross-sections of the pre-treated substrates and CaPh-coated samples: (a) HT sample; (b) AT sample; (c) PEO sample; (d) HT-C sample; (e) AT-C sample; (f) PEO-C sample.
Coatings 09 00259 g003
Figure 4. Current density–t curves recorded during the electrodeposition process of different pre-treated substrates in an aqueous mixed solution (0.0835 mol/L Ca(NO3)2 and 0.05 mol/L KH2PO4). A DC voltage of 3.5 V was applied, while different pre-treatments ((a) HT, (b) AT, (c) PEO) were used as cathode and a graphite plate was used as anode.
Coatings 09 00259 g004
Figure 5. X-ray diffraction patterns of HT and AT samples after 10 min of CaPh deposition.
Coatings 09 00259 g005
Figure 6. Potentiodynamic polarization curves of the pre-treated substrates and CaPh-coated samples in SBF at 37 ± 0.5 °C: (a) pre-treated and CaPh-coated samples; (b) CaPh-coated samples after a 120-h immersion in SBF.
Coatings 09 00259 g006
Figure 7. Open circuit potential—t curves of the pre-treated substrates and CaPh-coated samples in SBF at 37 ± 0.5 °C: (a) pre-treated substrates; (b) CaPh-coated samples.
Coatings 09 00259 g007
Figure 8. Bode plot of the pre-treated samples in SBF at 37 ± 0.5 °C: (a) HT sample; (b) AT sample; (c) PEO sample. Symbols represent experimental data and solid lines are fitted data.
Coatings 09 00259 g008
Figure 9. Equivalent circuit models of the pre-treated samples: (a) HT and AT samples; (b) 5 min to 24 h for PEO sample; (c) 48 to 72 h for PEO sample.
Coatings 09 00259 g009
Figure 10. Bode plot of the CaPh-coated samples in SBF at 37 ± 0.5 °C: (a) HT-C sample; (b) AT-C sample; (c) PEO-C sample. Symbols represent experimental data and solid lines are fitted data.
Coatings 09 00259 g010
Figure 11. Equivalent circuit models of the CaPh-coated samples: (a) 5 min to 120 h f for HT-C and AT-C samples; (b) 5 min to 120 h for PEO-C sample.
Coatings 09 00259 g011
Figure 12. Fitting results of the resistance for pre-treated and CaPh-coated samples. (a,b) represent for the Rp and Rsum of the pretreated samples, respectively; (ce) represent for the Rc, Rcp and Rsum of the CaPh coated samples.
Coatings 09 00259 g012
Figure 13. X-ray diffraction patterns of the CaPh-coated samples after 120 h immersion in SBF at 37 ± 0.5 °C.
Coatings 09 00259 g013
Figure 14. Morphologies of the CaPh-coated samples after 120 h immersion in SBF at 37 ± 0.5 °C. (a) HT-C; (b) AT-C; (c) PEO-C.
Coatings 09 00259 g014
Table 1. Chemical composition of Mg determined by spark OES.
ElementAlCuFeMnZnCaNiSiPMg
wt %0.001050.000280.00420.002250.0021<0.0001<0.00020.0019<0.0001Balance
Table 2. Details of the pre-treatments on pure Mg.
Pre-TreatmentsElectrolyteParameters
Hydrothermal (HT)Humidity 90%
90 °C
24 h
Anodizing (AT)NaOH 40 g
C2H6O2 50 mL
Na2CO3 10 g
Direct current
0.1 A
40 °C
60 min
Cathode:graphite
Plasma electrolytic oxidation (PEO)KOH 1 g
Na3PO4 20 g
450 V 20 °C
10 min
100 Hz
ton = 1 ms
toff = 9 ms
Cathode:steel
Table 3. Electrochemical data of the samples as fitted by extrapolation from potentiodynamic polarization curves.
SamplesEcorr (VKCl)icorr (A/cm2)
HT−1.82 ± 0.01(9.85 ± 0.56) × 10−5
AT−1.67 ± 0.02(4.95 ± 0.75) × 10−6
PEO−1.72 ± 0.02(1.25 ± 0.55) × 10−6
HT-C−1.62 ± 0.01(7.86 ± 0.51) × 10−6
AT-C−1.51 ± 0.02(9.65 ± 1.38) × 10−7
PEO-C−1.51 ± 0.01(5.09 ± 0.89) × 10−7
HT-C (120 h)−1.73 ± 0.03(1.58 ± 0.66) × 10−5
AT-C (120 h)−1.62 ± 0.03(6.20 ± 0.15) × 10−6
PEO-C (120 h)−1.57 ± 0.02(6.92 ± 0.10) × 10−7

