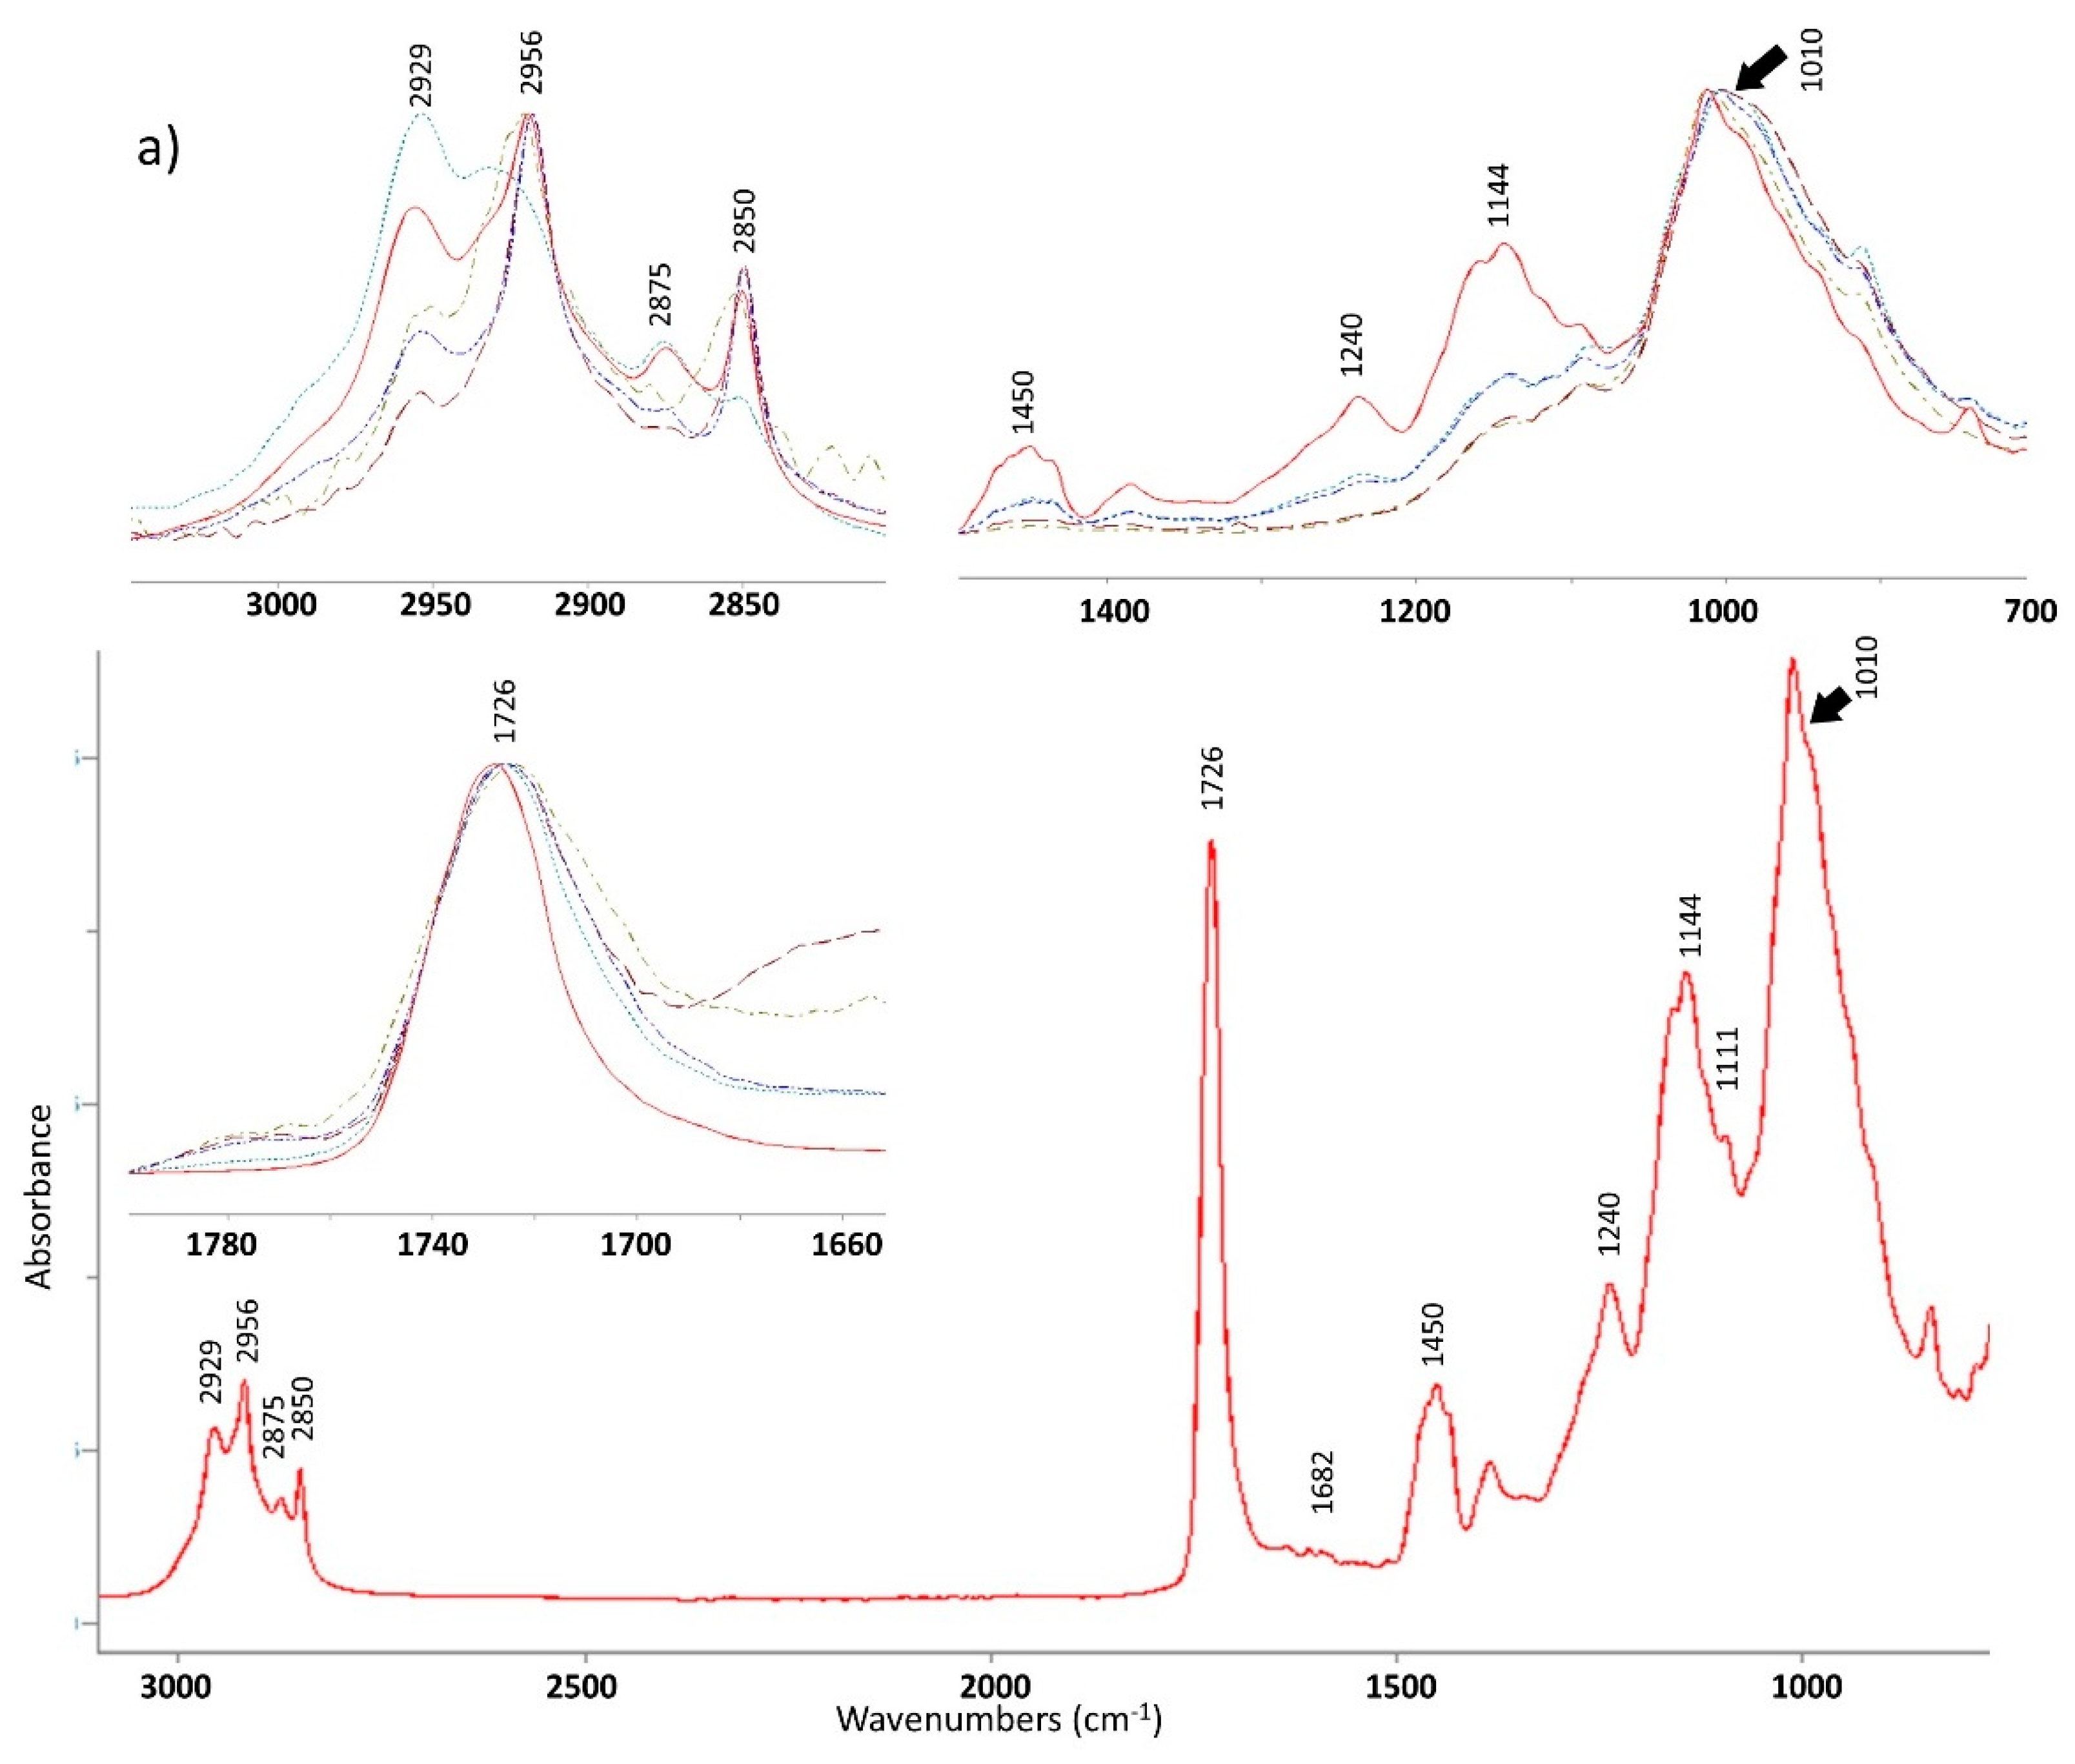
Article

Evaluation of the Impacts of Four Weathering Methods on Two Acrylic Paints: Showcasing Distinctions and Particularities

Wood and Forest Sciences Department, Université Laval, Pavillon Gene-H.-Kruger, 2425, rue de la terrasse, Québec, QC G1V 0A6, Canada
*
Author to whom correspondence should be addressed.
Coatings 2019, 9(2), 121; https://doi.org/10.3390/coatings9020121
Submission received: 14 November 2018 / Revised: 25 January 2019 / Accepted: 30 January 2019 / Published: 15 February 2019

Abstract

:
Two commercial waterborne wood acrylic paints were applied to wood samples and the weathering resistance of samples was tested using four different weathering methods: outdoor exposure in Arizona (USA), Florida (USA), and the province of Quebec (Canada), and accelerated weathering in a QUV (fluorescent) weatherometer. Degradation was characterised by colorimetric and FTIR analyses. FTIR confirmed the importance of paint composition in the resistance of samples to weathering. Polymer sensitivity to UV radiation was clearly evident. An interpretation of discoloration in terms of either the energy received by the samples or the length of exposure is presented. Strong differences existed between the four weathering methods. Particularities of each method are discussed and recommendations regarding their application for effective testing are proposed. Overall, in addition to accelerated weathering tests, we conclude that it is necessary to test paints in an end-use environment for accurate assessment of their likely performance. This study confirms the multifactorial aspect of the weathering process.

1. Introduction

Wood is a natural resource, abundant and renewable. As its ecological impact is lower than those of concrete or steel, the use of wood is favored as a way to mitigate global warming [1]. When exposed to the environment, however, wood is subjected to surface degradation. This phenomenon is called weathering and includes degradation factors such as photodegradation, biological degradation, erosion by water, wind-driven particles, heat, and atmospheric pollutants [2]. Among these factors, photodegradation is the most rapid and serious cause of surface degradation [3].
The most widespread strategy used to protect wood against weathering is the application of paints. Acrylic paints are commonly used to protect wood due to their good resistance to environmental degradation and low cost [4,5,6,7]. They are mostly used as emulsions to form aqueous dispersions. They contain very few to no volatile organic compounds. There is, however, a wide range of acrylic coatings available on the market and their properties can vary significantly. In fact, even if their main purpose is to protect wood against weathering, acrylic coatings are also susceptible to photodegradation [8,9,10]. Their resistance to degradation differs depending on their formulations. As an example, the nature of the pigments and dyes significantly impacts the UV (ultraviolet) resistance of the coating [11,12,13]. Their exposure to weathering eventually decreases the aesthetic and protective qualities of the coating. Hence, coated wood invariably requires the application of an additional layer of paint [14]. It is necessary to assess the resistance of every new formulation to weathering [15].
Several companies provide facilities and services to determine the durability of materials and coatings. The services of these are widely used by the scientific community to elucidate mechanisms of degradation of products [16,17,18]. Outdoor testing fields, such as those offered by Q-lab (USA) in Arizona, offer extreme weathering conditions e.g., high solar radiation and temperature. Such testing make it possible to more rapidly predict the long-term durability of products in comparison to testing in more temperate weathering sites, such as those located in oceanic or continental climates. However, conditions in outdoor exposure sites vary from year to year and this prevents a reliable repeatability between experiments. In contrast to outdoor testing, weathering chambers, such as the QUV (Q-lab) (USA), allow the user to control and tailor all the weathering parameters, hence assuring reliable repeatability. Still, the results obtained from weathering chambers have limitations since only a few weathering factors can be taken into account with such devices.
All of the above-mentioned approaches can be used to assess the resistance of a material against weathering and are regularly employed to test wood products. However, the different methods of accelerating weathering can lead test results that are not representative of those likely to be obtained from exposure in end use environments [19]. An alternative approach is therefore to expose the materials or products directly in the intended end use environment. In this case, no predictions can be made regarding its long-term durability. The multiplicity of weathering test methods available makes it difficult for manufacturers to decide which one is best suited to their needs. It is, therefore, useful to provide more information on these methods by comparing the results obtained using each of them.
Studies comparing weathering techniques can be found in the literature, but none of them offers recommendations regarding good practice for effective use of the different weathering methods. As an example, Nejad et al. (2011) were interested in finding factors responsible for coating degradation. They compared five different artificial weathering methods [20]. Another study quantified natural weathering in different places through the analysis of meteorological data [21]. Experimentation has also been performed to develop a tool to validate artificial weathering compared to natural weathering or to find an acceleration factor for the two methods [22,23]. Dawson et al. carried out an interesting comparative study of weathering methods. They were interested in the development of an international standard on the durability of materials. To do so, they presented results obtained from coatings exposed in New Zealand and Germany [24]. Creemers et al. have also worked on developing a climatic index reflecting severity of degradation in different climate by making comparison between nine outdoor exposure sites in Europe [25]. Finally, some papers are limited to only characterizing surface degradation of materials [26,27,28,29].
All the data and results from the above-mentioned studies cannot be used to determine specific features of different weathering methods. Therefore, the goal of this paper is to provide recommendations regarding good practice for effective use of different accelerated weathering methods. The results of this study will help users who wish to characterise the durability of products to choose the most suitable weathering method. To achieve this goal, coatings were exposed using natural and artificial accelerated weathering. Data collected were examined and coupled with existing knowledge related to the characteristics of each method. Recommendations on their use were then developed. Two acrylic coatings were degraded using four different weathering methods: three outdoor testing sites, Arizona (USA), Florida (USA) and Province of Quebec (Canada), as well as in an accelerated weathering chamber equipped with fluorescent lamps. In this study, the end-use environment is exposure in the Province of Quebec. To characterise degradation and provide information on the chemical and physical modifications of the coatings, two techniques were used. First, an infrared spectrometer with Fourier transform (FT-IR) was used to study the chemical modifications of the coatings after exposures [5,30]. Secondly, a colorimeter using CIEL*C*h color scale was used to analyse changes in colour of the coatings and the stability of the pigments and dyes after exposure [30,31]. Such analysis were performed due to the critical importance of color for end-users of coatings. Data collected from these experimentations have allowed specific features of the four weathering methods to be compared. Recommendations on their optimal use are then proposed.

2. Materials and Methods

2.1. Paints

Planned spruce wood was used in this experiment. Sample sizes were different for each weathering method as samples needed to be mounted on the specific racks in the different exposure fields. Samples were coated by two paints using a curtain applicator with a flow rate set up at 1.10 cm2/s. Two layers were applied. The paints, obtained from the industry, were opaque and differed in colour: Paint 1 (blue) and Paint 2 (red). The initial L*C*h* values are given in Table 1. Three replications for each length of exposure and weathering method were done.
The paints were formulated using the same acrylic binder, a co-emulsion of poly(butylacrylate/methyl methacrylate), p(BA/MMA). The different dyes and/or pigments added to these paints can be found in Table 2 according to data from the supplier. The names used are commercial names. The different product IDs enable the reader to find the different additives as summarised in Table 2.

2.2. Weathering Methods

Four weathering methods were used: Natural weathering using three different outdoor testing sites located in Quebec (Canada), Arizona (USA), and Florida (USA) and accelerated weathering in a QUV (fluorescent) weatherometer (Q-lab, Westlake, OH, USA). Control specimens were stored in the dark in a conditioning room at 20 °C and 40% of relative humidity for the duration of the exposure trials.

2.2.1. Exposure in Arizona

Samples were exposed for six months in a “Q-trac sunlight concentrator testing device” provided by Q-lab (USA). Parameters for this exposure method are presented in Table S1 of the Supplementary Materials. Cycle 1 of ASTM G90 (2010) standard test method “Standard Practice for Performing Accelerated Outdoor Weathering of Non-metallic Materials Using Concentrated Natural Sunlight” was used [32]. This device is equipped with 10 mirrors enabling the concentration and reflection of the total solar spectrum. Samples were sprayed with water three times a day for eight minutes. Six exposure periods were used, and data from the trial provided by Q-lab are summarised in Table S2 of the Supplementary Materials.

2.2.2. Exposure in Florida

Samples were exposed at 45° in devices provided by Q-lab (USA) for twelve months. Parameters for this exposure method are presented in Table S3 of the Supplementary Materials. The ASTM G7 (2013) standard test method “Standard Practice for Atmospheric Environmental Exposure Testing of Non-metallic Materials” was followed [33]. Two exposure periods were used, and data from the trial provided by Q-lab are summarised in Table S4 of the Supplementary Materials.

2.2.3. Exposure in Québec (End-Use Environment of the Study)

Table S5 of the Supplementary Materials presents the meteorological data for this exposure site. Samples were exposed at 90° for a total of 48 months. Irradiance values are provided by Meteomedia (Table S6 of the Supplementary Materials).

2.2.4. Accelerated Exposure in a QUV

Samples were exposed in a QUV accelerated weathering device from Q-Lab (USA) for nine months. Cycle 1 of ASTM G154 (2012) Standard test method “Standard Practice for operating Fluorescent Ultraviolet Lamp Apparatus for exposure of non-metallic Materials” was followed [34]. UV-A 340 lamps were used with irradiation at 0.89 W/m2/nm. These lamps simulate the UV portion of the solar spectrum. Samples were sprayed with water three times a day. Quantum of energy received by samples are presented in Table S7 of the Supplementary Materials.

2.3. Color Measurements

Color changes were analysed using a reflectance colorimeter from BYK-Gardner (Bavaria, Germany): the color guide 45°/0°. CIEL*C*h* color scale was used. The L* axis represents the lightness, C* axis represents the chromaticity of the color and the h* the hue angle. The overall color differences (ΔE) was calculated for each sample using Equation (1).
Δ E C M C * = ( Δ L * l S L ) 2 + ( Δ C * c S C ) 2 + ( Δ h * S H ) 2
The SL, SC, and SH are factors giving weight for L*, C*, and h*. This equation takes into consideration the various color sensitivities of the human visual system [35]. For this reason, this equation was preferred over the CIEL*a*b* equation. Two other factors l and c are constant and defined by the user. The use of the ratio 2:1 permitting twice the difference in lightness compared to chromaticity follows the general requirements from industry. This chromaticity scale was used to describe color modifications. Six measurements were performed on each sample at different locations following a pre-determined pattern. The average value was calculated and reported in this paper.

2.4. ATR-FTIR Spectroscopy Analysis

FTIR spectroscopy was performed using a spectrometer Spectrum 400 from Perkin Elmer (Waltham, MA, USA) equipped with an attenuated total reflection accessory (ATR). The resolution was set at 4 cm−1, 64 scans were recorded for each analysis and the scanning range was from 650 to 4000 cm−1.
Eight colorimetric analyses were performed on 6 pre-determined locations on each sample. Changes in specific functional groups were monitored quantitatively with the use of ratios between the absorbance of the most exposed and the unexposed sample. Two peaks were assessed: methyl contribution at 2956 cm−1 and carbonyl contribution at 1726 cm−1 [11]. Results are expressed as a percentage that represents relative amounts of remaining functional groups (Equation (2)). The information from these spectra were extracted with GRAMS software V9.2 from Thermo Scientific (Waltham, MA, USA).
Remaining   groups   ( % )   =   E x p o s e d   s a m p l e U n e x p o s e d   s a m p l e   ×   100

3. Results and Discussion

3.1. FTIR-ATR

In order to characterise the chemical modifications in the polymer structure, infrared spectroscopy was performed on samples before and after exposure as well as on the control specimens. There is no difference between the samples before exposure and the control specimens. Spectra of non-exposed and exposed samples are presented in Figure 1. Table 3 summarises the main contributions. The three main modifications are increases in absorption from 2800 to 3050 cm−1, from 1650 to 1800 cm−1 and from 900 to 1550 cm−1. The first region corresponds to the bands attributed to methyl and methylene contribution at 2956, 2919, 2875, and 2850 cm−1 corresponding to δas (CH3), δas (CH2), δs (CH3), and δs (CH2), respectively, with δas and δs for asymmetric and symmetric vibrational mode.
Photodegradation of acrylic paints produces low molecular weight molecules [5,6,11,36]. These are generated through Norrish type I or II reactions accompanied by chain scissions in the early steps of the degradation process. In this study, the long exposure times allowed the leaching of the small molecules formed. Consequently, decreases of some peaks can be noticed for both paints. For example, decreases observed for the peaks corresponding to both C–H bend δs (CH2) + δas (CH3) at 1450 cm−1 and the δs (CH3) at 1682 cm−1.
For both paints, the contribution at 1144 and 1111 cm−1 attributed to C–O stretching disappears. A noteworthy observation is the degradation of the polymeric side chain which is apparent from decrease of the absorption at 1240 cm−1 attributed to the asymmetric stretching vibration C–O–C bond.
A decrease of the fingerprint region between 900 and 1500 cm−1 (Figure 1) can be noticed for all the exposed samples. Chain scissions lead to the generation of products and leaching or evaporation if the products are small enough. In addition to organic compounds found in paints, it is possible to also find clays or minerals such as talc. They act as fillers and their use, makes it possible to reduce the quantity of solvent, improve paint adhesion or avoid surface defect during curing. Due to their inorganic nature, fillers are not prone to photodegradation. The Si–O–Si contribution from the talc is found in the infrared spectrum at 1010 cm−1 [37]. No modification of this peak occurred even after samples were exposed in Arizona. Therefore, the gradual degradation of the resin or other organic compounds led to apparently stronger contribution of this peak to the spectra.
After the exposures trials, differences in durability between Paint 1 and Paint 2 were apparent, particularly the contribution of the carbonyl peak at 1726 cm−1. Carbonyl compounds can be oxidized into new carbonyl groups like ketones at 1710 cm−1. This phenomenon can be observed by the broadening of this region in the spectrum for Paint 1 and was attributed by Chiantore et al. (2000) [5] as resulting from a reaction between the resin, oxygen molecules and radical species following β-scission reactions. These new compounds absorb IR in the same region as that of the initial carbonyl ester groups. Their generation counterbalances the initial decrease of the contribution at 1726 cm−1.
Concerning Paint 2, only a decrease of the peak at 1726 cm−1 is observed reflecting a loss of small molecules after chain scissions. Thus, either there is no compensation by formation of new compounds as seen for Paint 1 or the new compounds are volatized or leached during exposure. A specific component from Paint 1 formulation seems to make possible reactions with new carbonyls and the reaction products are retained within the polymer network.
Another difference is the specific decrease of the δas (CH2) contribution at 2919 cm−1 for the exposure of samples in the Province of Quebec. This is likely due to the fragmentation of the chain and the generation of unsaturated products. Results from the quantitative analysis of peaks at 2956 and 1726 cm−1 are presented in Table 4.
Overall, these results show greater polymer degradation for Paint 1 compared to Paint 2. In addition, for the two paints, greater degradation occurs after samples are exposure in the QUV device. This device is equipped with fluorescent lamps emitting UV rays. From the Planck constant, it can be said that the shorter the wavelength is and the higher the photon energy will be. Consequently, this explains the stronger degradation of the paint. Photons from the visible light are less energetic and contribute less to paint degradation. This confirms the sensitivity of the polymer to UV radiation.
For Paint 1, the values obtained for the ratio at 1726 cm−1 suggests the generation of new carbonyl compounds as explained above. After exposure in Arizona and in the QUV, percentages of remaining functional groups are still high compared with the two other exposure methods (Florida and Quebec). As indicated in Tables S4 and S6 of the Supplementary Materials, strong precipitation was present in Florida and Quebec. New carbonyl compounds are more likely to be leached from the coating compared to samples exposed in Arizona or in the QUV. Both Arizona and QUV exposure led to the same values for the both FTIR ratios. However, differences in the aesthetics of the two coatings between these two methods are strongly different and are described below. This observation confirms the necessity to consider degradation factors other than photodegradation during wood weathering trials.

3.2. Colorimetric Analysis

Colorimetric analyses did not show differences between non exposed samples and control specimens. 
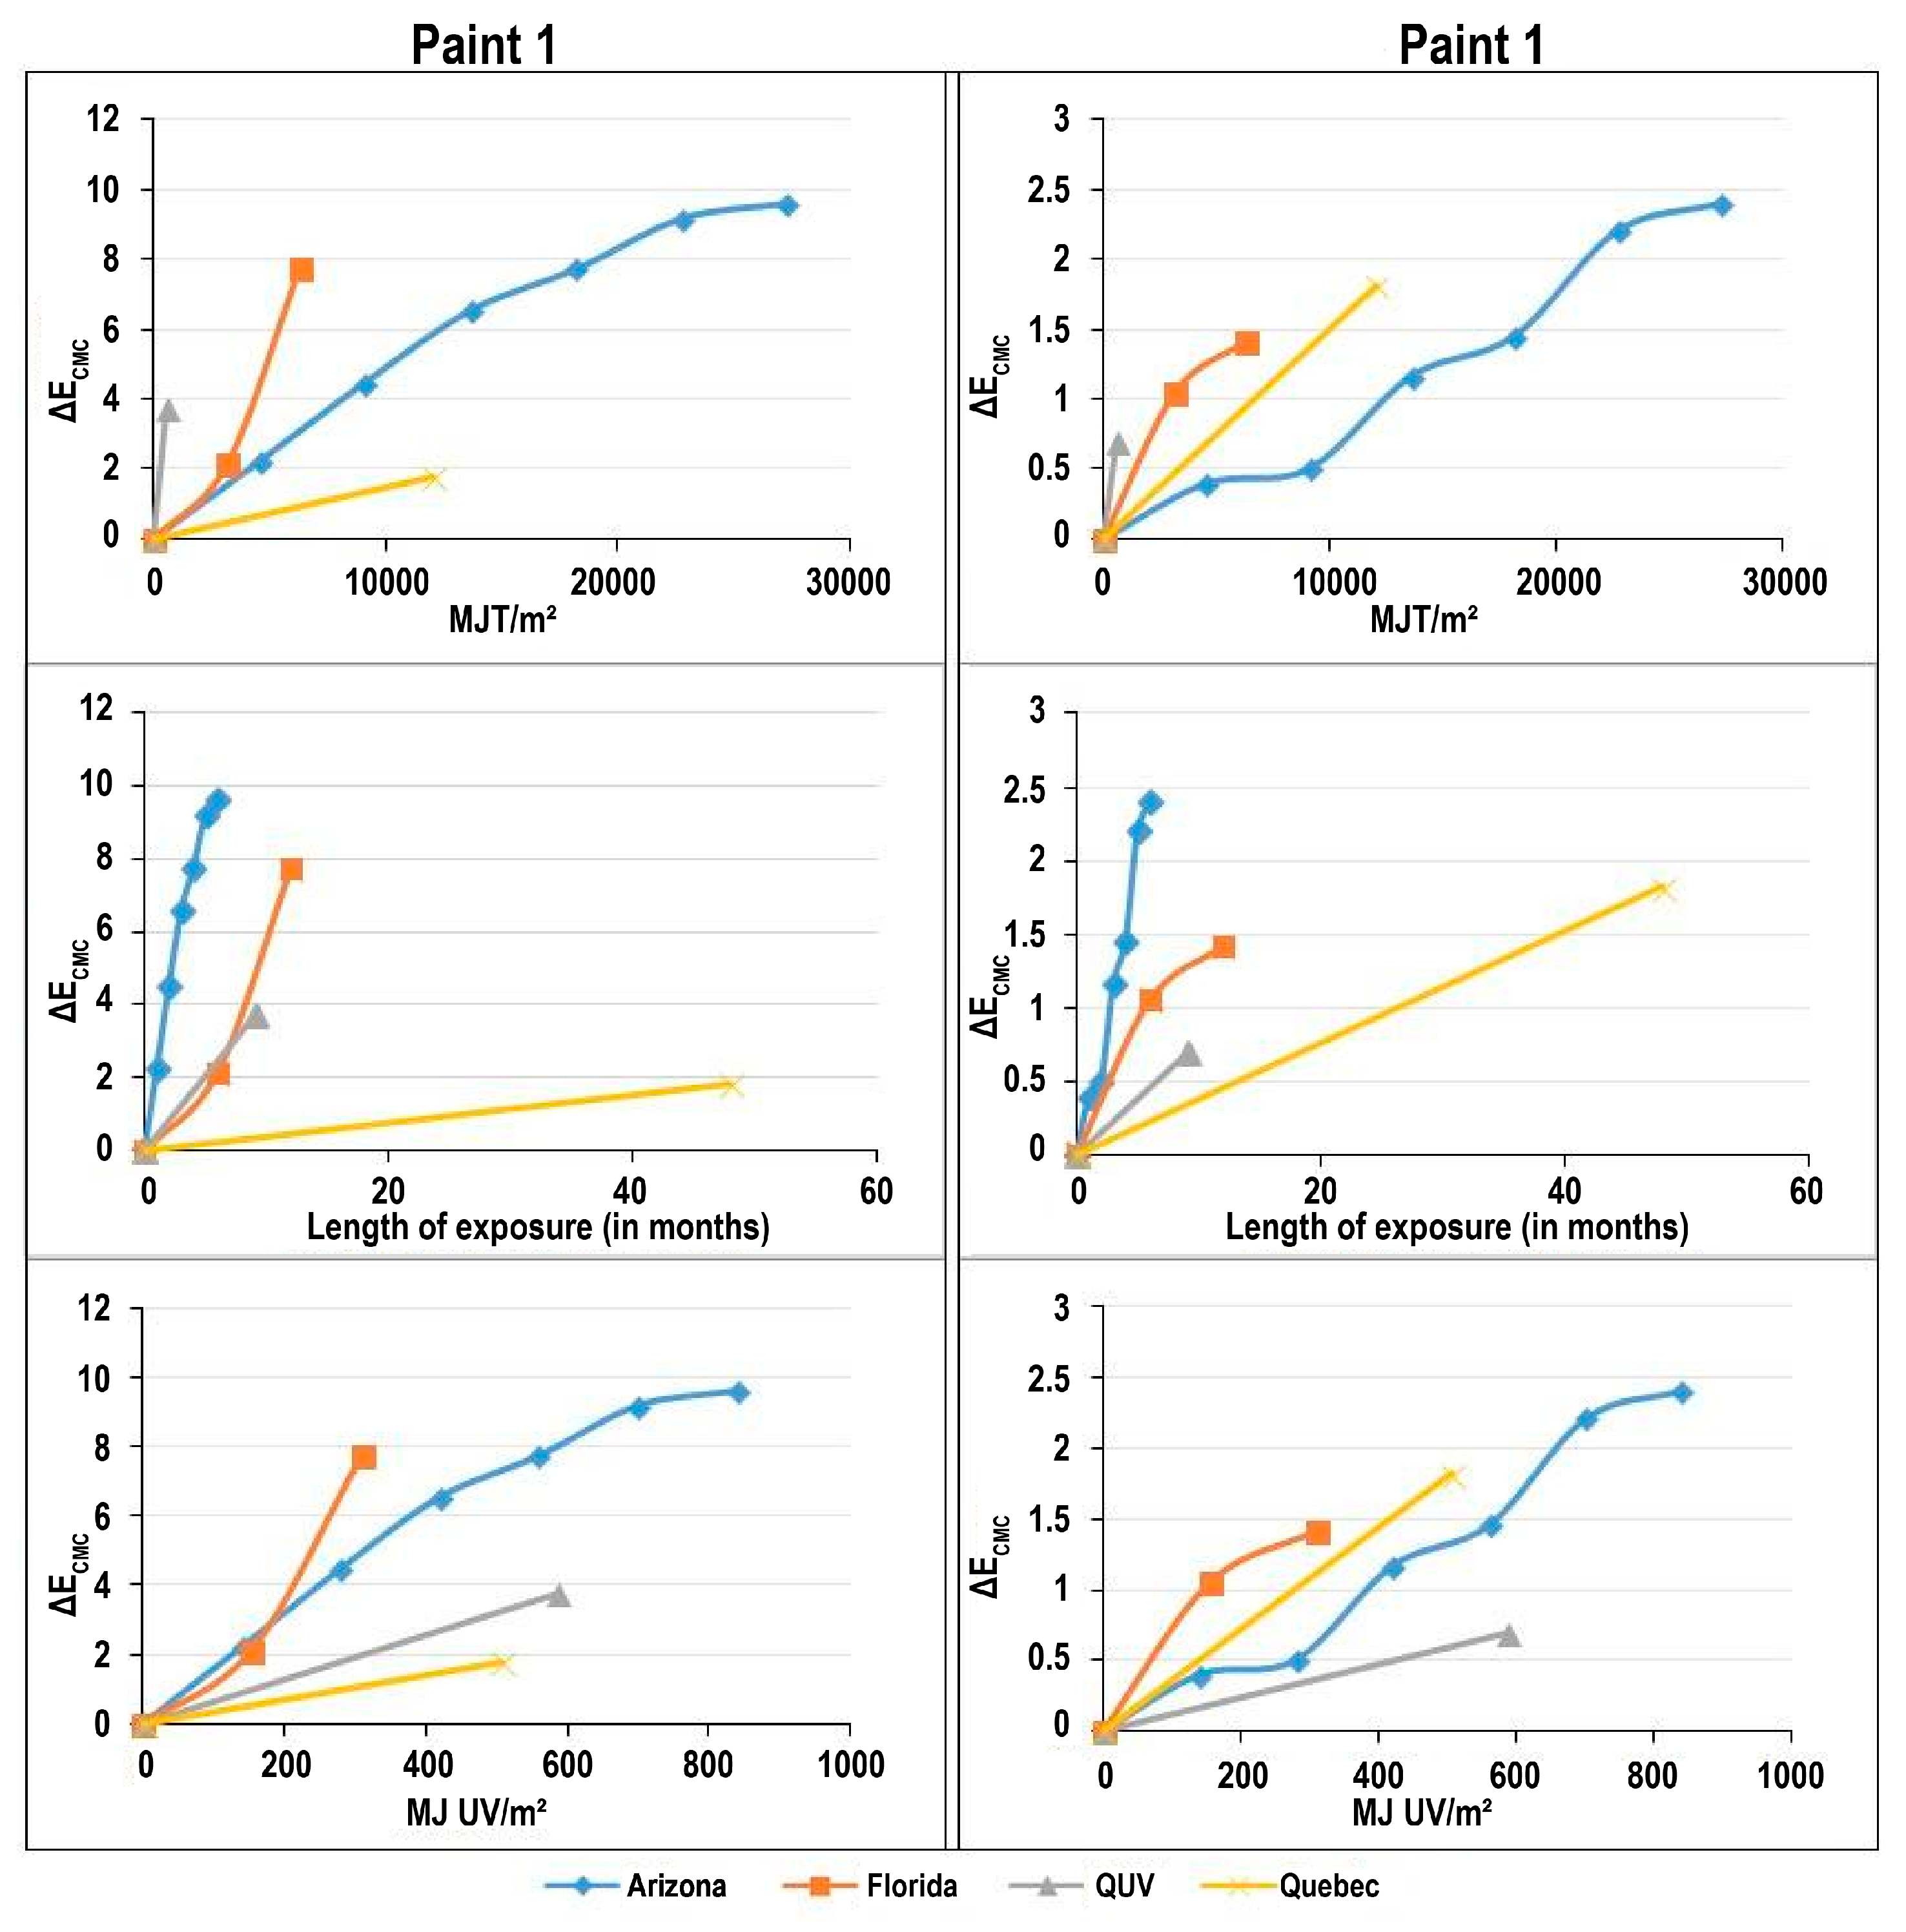
Table 5 summarises the ΔECMC values. The higher the ΔECMC is, the higher the overall color modification of coatings. Paint 2 presents is more color stabile than Paint 1 except at the Quebec site. This discrepancy will be discussed in the next section. For both paints, the most pronounced changes occurred at the Arizona site with discoloration values for Paint 1 and Paint 2 of 9.62 and 2.41, respectively.
Previous studies attempted to establish a correlation between different weathering methods through the study of degradation after different exposure periods [21,38,39]. During outdoor exposure, severity of degradation depends of geographic area, weather, and timing of the exposure trial. During indoor accelerated weathering exposure, degradation depends of the setup of the device. For the same length of exposure, in terms of the parameters implemented, the degradation will be different. Since photodegradation is the main factor causing surface degradation, modifications due to exposures can be compared using the energy received by the samples, either in MJ T/m2 or MJ UV/m2, respectively, megajoule total/m2 and megajoule/m2.
Figure 2 shows the color modification values in terms of three kinds of abscissa: MJ UV/m2, MJ T/m2 and the length of exposure in days. The global shape of the curves can be visually compared to find either similarities or differences between the exposure methods/sites. Looking at the strong differences between the different curves, it appears that each exposure has a different impact on the paint and, each paint responds differently. This finding suggests that degradation cannot be compared simply in terms of the UV or quantity of energy samples receive or the length of time they are exposed to the weather. Colorimetric analysis captures modifications to the coatings due to weathering and particular features of each weathering method are apparent.
First of all, since the most degrading method varies when results are expressed in terms of length of exposure and the quantum of energy received, which suggests that there are factors other than photodegradation that modify colour of paints.
Table 6 presents the method causing the most pronounced degradation in terms of color change. When expressing colour changes in terms of the total energy received by the samples, the QUV exposure is the most degrading method for both paints. Total energy corresponds here to the summation of the different regions of the electromagnetic spectrum, such as the UV, visible and infrared radiation. This device employed fluorescent lamps producing UV radiation, the most degrading part of the light spectrum.
Consequently, 1 MJ in a QUV is more degrading than 1 MJ from outdoor exposures. Damage will be stronger due to the higher energy of UVs. This observation confirms the photosensitivity of the paints to UV radiation, as well as the efficiency of the accelerated method.
When expressing colour changes in terms of length of exposure, Arizona exposure caused the most severe degradation of both paints. The exposure trial in Arizona used mirrors to amplify light from the sun. Water spray was used as indicated in the ASTM G90 (2010) to provide water for chemical reactions. Moreover, data in Table S3 of the Supplementary Materials show abundance of sunshine with high temperature at the Arizona site. These conditions are more severe than those encountered during normal end uses: one day exposure in Arizona is more degrading than one day in a QUV or in Florida or the Province of Quebec. This observation confirms the accelerated aspect of Arizona exposure against the other methods studied.
When expressing colour changes in terms of quantity of MJ UV/m2 received by samples, Florida exposure was the most severe for both paints. Since Florida exposure encountered all the main weathering factors such as wind, fungi, erosion and high humidity, it is the closest to an exposure in the end use environment. Yet, taking into account only the quantity of MJ UV/m2 received by samples limits the interpretation since it does not consider all the above weathering factors and their impacts on samples. This confirms the importance of including the multifactorial aspect of weathering when interpreting colour changes.
Exposure of samples in Quebec did not lead to strong degradation. When the length of exposure is considered, exposure in Quebec causes the least degradation. This observation confirms the acceleration of weathering that can be achieved by exposing samples in Arizona and in Florida, as well as in the QUV.
Values of ΔECMC obtained from measurements on samples exposed in Quebec are almost the same for both paints, in contrast to other results from other trials where the discoloration of Paint 1 was higher than that of Paint 2. This interaction points to the need to expose samples in different climates. In addition, the length of exposures in the Province of Quebec and the others exposures were not the same and this could lead to distortion in the interpretation of results.
Table 2 indicates that red oxide is present in the formulation of the Paint 2. This compound, has strong capacity to absorb in the UV region [40,41]. Techniques of accelerated weathering are almost all based on the use of higher intensity UV radiation to accelerate the rate of degradation. In this case, Paint 2 has better resistance against accelerated weathering likely due to the presence of the red pigment in its formulation.

3.3. Overview and Recommendations

Table 7 summarises the parameters as well as the main results obtained from the characterisation of the degradation for each exposure method/trial. The interpretation of these results makes it possible to develop good practice for use of the different weathering methods. These recommendations are relevant for products designed to be used in environmental conditions similar to an oceanic or continental climate. This information will help manufacturers choose the most reliable method according to their needs. It is important to note that degradation occurring in outdoor exposures depends on variables such as geographic area, pollution, weather, years and even days of study, to name only a few. Making comparison between experiments executed in different outdoor sites can be problematic since the variables influence the rates of degradation. This is why, degradation assessments should be performed using the quanta of energy received by samples in addition to length of exposure.
Among the four exposure methods we employed, Arizona exposure resulted in the most rapid degradation. After exposure in such extreme conditions (e.g., high temperature and irradiance), coating failure may not necessarily be due to a poor paint technology. It can also be the result of the unrealistic conditions that samples are exposed to compared to the conditions in expected in service environment. On the other hand, successful performance would indicate that the paint has high resistance to photodegradation. Arizona exposure should be used to test the limits of paint durability against UV radiation rather than to study its performance in service in most environments.
Florida exposure promote fungal growth. Since wood is composed of organic matter it is susceptible to fungal degradation even when it is coated. In oceanic or continental climate where the risk of fungal growth is present, it is important to take this factor into account [42]. In addition, most of the degradation attributed to weathering in such climates are encountered in Florida although the exposure parameters and the results presented in Table 7 indicate that degradation is accelerated. However, the rate of acceleration in Florida is not as high as that for Arizona exposure. Florida exposure should be used in order to test paint resistance against synergic degradation between photodegradation and degradation resulting from moisture and fungal growth.
Controlled accelerated exposure, such as the one provided by a QUV device, are convenient due to the possibility of tailoring the degradation parameters. Additionally, the use of fluorescent lamps that generate UV results in accelerated degradation of the paint polymer (acrylic polymer in this paper). This is confirmed here by the values obtained from both colorimetric and infrared analysis. Unlike the other exposure methods, polymer degradation is higher than the discoloration in the QUV device. QUV exposure should be used in order to test the stability of the paint polymer rather than loss of aesthetics of coatings.
Finally, in this experiment, exposure in the Province of Quebec was used to test the paints in the end use environment. Table 7 shows that even after 48 months of exposure, the quantum of energy received was still below those recorded for the short exposure periods in Arizona and Florida. These results demonstrate the need to use accelerated exposures to provide an indication of the long-term durability of paints in their end use environment. However, even though the amount of energy received was lower, color changes recorded in Province of Quebec are higher than those observed in Arizona when results are expressed using the quantum of energy total received by the samples (Figure 2). Accelerated exposure methods focus essentially on the role of light as degradation factor. This result emphasises the importance of degradation factors others than light and water in the weathering process. As an example, snow which was only present in Quebec may have influenced color changes. In addition, accelerated exposure provide severe weathering conditions often more severe than those found in the end use environment and thus might lead to degradation that would never occur in service. In the Province of Quebec, panels were exposed at 90° while in others natural weathering sites samples were exposed at 45°. As a consequence, the light energy and the kinetic effect of rain were weaker. Also, exposure at 45° allows the accumulation of by-products or impurities that can protect the coating surface.

4. Conclusions

Two commercial waterborne wood acrylic paints were applied to wood samples and the weathering resistance of samples was tested using four different weathering methods: outdoor exposure in Arizona (USA), Florida (USA), and the province of Quebec (Canada), and accelerated weathering in a QUV (fluorescent) weatherometer. Exposure of coated wood samples in Arizona using a sun-tracking system resulted in the most rapid coating degradation. We conclude that such an exposure system should be used to test the resistance limits of a paint formulation to UV radiation. Florida provided sufficient humidity to promote fungal growth and could be used to test the resistance of paints against surface fungi in synergy with UV. Numerous weathering factors are also encountered in Florida that realistically challenge paints against all of the degradation factors likely to be encountered in-service. Exposure in QUV results in rapid polymer degradation, but coated samples are exposed to only a few weathering factors. This particularity can reduce the discoloration of paint. In order to obtain the performance of products in service, paints should always be put in an environment that most closely resembles their end use environment: energy received, rainfall, humidity. Critical parameters are the energy received by samples, quantity of rainfall, humidity, temperature and its amplitude. The more the exposure test method deviates from in-service exposure parameters, the less accurate the durability prediction. In general, results provided by accelerated weathering should always be carefully interpreted in order to avoid misleading conclusions. They only provide an indication of likely paint performance.

Supplementary Materials

The following are available online at https://www.mdpi.com/2079-6412/9/2/121/s1, Table S1: Meteorological characteristics of an exposure in Arizona, Table S2: Quantum energy received by samples after exposure in Arizona, Table S3: Meteorological characteristics of an exposure in Florida, Table S4: Quantum energy received by samples after exposure in Florida, Table S5: Meteorological characteristics of an exposure in Quebec, Table S6: Quantum energy received by samples after exposure in Quebec, Table S7: Quantum energy received by samples after exposure in a QUV.

Author Contributions

Conceptualization, A.C.; Methodology, A.C.; Validation, A.C., P.B. and V.L.; Formal Analysis, A.C.; Investigation, A.C.; Data Curation, A.C.; Writing-Original Draft Preparation, A.C.; Writing-Review & Editing, A.C., P.B. and V.L.; Visualization, A.C.; Supervision, P.B. and V.L.; Funding Acquisition, P.B.

Funding

This research received no external funding.

Acknowledgments

The authors are grateful to Natural Sciences and Engineering Research Council of Canada for the financial support through its IRC No. 461745 and CRD No. 445200 programs, as well as the industrial partners of the NSERC industrial chair on eco-responsible wood construction (CIRCERB).

Conflicts of Interest

The authors declare no conflict of interest.

References

  1. Freedonia, G. Wood & Competitive Decking; Market Research No. 2718; The Freedonia Group: Cleveland, OH, USA, 2011. [Google Scholar]
  2. Williams, R.S. Weathering of wood. In Handbook of Wood Chemistry and Wood Composites; Rowell, R.M., Ed.; CRC Press: Boca Raton, FL, USA, 2005; Volume 1, pp. 139–185. [Google Scholar]
  3. Davis, A.; Sims, D. Weathering of Polymers; Springer Science & Business Media: Berlin, Germany, 1983. [Google Scholar]
  4. Weiss, K.D. Paint and coatings: A mature industry in transition. Prog. Polym. Sci. 1997, 22, 203–245. [Google Scholar] [CrossRef]
  5. Chiantore, O.; Trossarelli, L.; Lazzari, M. Photooxidative degradation of acrylic and methacrylic polymers. Polymer 2000, 41, 1657–1668. [Google Scholar] [CrossRef]
  6. Chiantore, O.; Lazzari, M. Photo-oxidative stability of paraloid acrylic protective polymers. Polymer 2001, 42, 17–27. [Google Scholar] [CrossRef]
  7. Prane, J.W. Introduction to Polymers and Resins; Federation of Societies for Coatings Technology: Harrisburg, PA, USA, 1986. [Google Scholar]
  8. Shultz, A.R. Degradation of polymethyl methacrylate by ultraviolet light. J. Phys. Chem. 1961, 65, 967–972. [Google Scholar] [CrossRef]
  9. Fox, R.B.; Isaacs, L.G.; Stokes, S. Photolytic degradation of poly (methyl methacrylate). J. Polym. Sci. Part A Gen. Pap. 1963, 1, 1079–1086. [Google Scholar] [CrossRef]
  10. Torikai, A.; Ohno, M.; Fueki, K. Photodegradation of poly (methyl methacrylate) by monochromatic light: Quantum yield, effect of wavelengths, and light intensity. J. Appl. Polym. Sci. 1990, 41, 1023–1032. [Google Scholar] [CrossRef]
  11. Pintus, V.; Wei, S.; Schreiner, M. Accelerated UV ageing studies of acrylic, alkyd, and polyvinyl acetate paints: Influence of inorganic pigments. Microchem. J. 2016, 124, 949–961. [Google Scholar] [CrossRef]
  12. Allen, N.S. 18th Annual meeting of the UK polymer degradation discussion group photofading and light stability of dyed and pigmented polymers. Polym. Degrad. Stab. 1994, 44, 357–374. [Google Scholar] [CrossRef]
  13. Yang, T.C.; Noguchi, T.; Isshiki, M.; Wu, J.H. Effect of titanium dioxide on chemical and molecular changes in PVC sidings during QUV accelerated weathering. Polym. Degrad. Stab. 2014, 104, 33–39. [Google Scholar] [CrossRef]
  14. Evans, P.; Haase, J.; Seman, A.; Kiguchi, M. The search for durable exterior clear coatings for wood. Coatings 2015, 5, 830–864. [Google Scholar] [CrossRef]
  15. Johnson, B.W.; McIntyre, R. Analysis of test methods for UV durability predictions of polymer coatings. Prog. Org. Coat. 1996, 27, 95–106. [Google Scholar] [CrossRef]
  16. Melchiorre Di Crescenzo, M.; Zendri, E.; Sánchez-Pons, M.; Fuster-López, L.; Yusá-Marco, D.J. The use of waterborne paints in contemporary murals: Comparing the stability of vinyl, acrylic and styrene-acrylic formulations to outdoor weathering conditions. Polym. Degrad. Stab. 2014, 107, 285–293. [Google Scholar] [CrossRef]
  17. Nguyen, T.V.; Nguyen Tri, P.; Nguyen, T.D.; El Aidani, R.; Trinh, V.T.; Decker, C. Accelerated degradation of water borne acrylic nanocomposites used in outdoor protective coatings. Polym. Degrad. Stab. 2016, 128, 65–76. [Google Scholar] [CrossRef]
  18. Nikolic, M.; Nguyen, H.D.; Daugaard, A.E.; Löf, D.; Mortensen, K.; Barsberg, S.; Sanadi, A.R. Influence of surface modified nano silica on alkyd binder before and after accelerated weathering. Polym. Degrad. Stab. 2016, 126, 134–143. [Google Scholar] [CrossRef] [Green Version]
  19. Crewdson, M.L.; Ketola, W.D. Best practices in weathering. Eur. Coat. J. 2009, 4. [Google Scholar]
  20. Nejad, M.; Cooper, P. Exterior wood coatings. Part-2: Modeling correlation between coating properties and their weathering performance. J. Coat. Technol. Res. 2011, 8, 459–467. [Google Scholar] [CrossRef]
  21. Deflorian, F.; Rossi, S.; Fedrizzi, L.; Zanella, C. Comparison of organic coating accelerated tests and natural weathering considering meteorological data. Prog. Org. Coat. 2007, 59, 244–250. [Google Scholar] [CrossRef]
  22. Podgorski, L. Analysis of the wood coating ageing and prediction of the durability through calorimetric investigations. In Proceedings of the Wood and Coating Systems for Wood-Cost E18, The Hague, The Netherlands, 27 October 2004. [Google Scholar]
  23. Larché, J.F.; Bussière, P.O.; Gardette, J.L. Characterisation of accelerated ageing devices for prediction of the service life of acrylic-melamine/urethane thermosets. Polym. Degrad. Stab. 2011, 96, 1530–1536. [Google Scholar] [CrossRef]
  24. Dawson, B.S.W.; Göttgens, A. Natural weathering performance of exterior wood coatings on pinus sylvestris and pinus radiata in Germany and New Zealand. J. Coat. Technol. Res. 2005, 2, 539. [Google Scholar] [CrossRef]
  25. Creemers, J.; de Meijer, M.; Zimmermann, T.; Sell, J. Influence of climatic factors on the weathering of coated wood. Eur. J. Wood Wood Prod. 2002, 60, 411–420. [Google Scholar] [CrossRef]
  26. Grüll, G.; Tscherne, F.; Spitaler, I.; Forsthuber, B. Comparison of wood coating durability in natural weathering and artificial weathering using fluorescent UV-lamps and water. Eur. J. Wood Prod. 2014, 72, 367–376. [Google Scholar] [CrossRef]
  27. Merlatti, C.; Perrin, F.X.; Aragon, E.; Margaillan, A. Natural and artificial weathering characteristics of stabilized acrylic–urethane paints. Polym. Degrad. Stab. 2008, 93, 896–903. [Google Scholar] [CrossRef]
  28. Perrin, F.X.; Irigoyen, M.; Aragon, E.; Vernet, J.L. Evaluation of accelerated weathering tests for three paint systems: A comparative study of their aging behaviour. Polym. Degrad. Stab. 2001, 72, 115–124. [Google Scholar] [CrossRef]
  29. Sell, J.; Feist, W.C. US and European finishes for weather-exposed wood-a comparison. For. Prod. J. 1986, 36, 37–41. [Google Scholar]
  30. Kaczmarek, H.; Kamińska, A.; van Herk, A. Photooxidative degradation of poly(alkyl methacrylate)s. Eur. Polym. J. 2000, 36, 767–777. [Google Scholar] [CrossRef]
  31. Melo, M.J.; Bracci, S.; Camaiti, M.; Chiantore, O.; Piacenti, F. Photodegradation of acrylic resins used in the conservation of stone. Polym. Degrad. Stab. 1999, 66, 23–30. [Google Scholar] [CrossRef]
  32. ASTM G90 Standard Practice for Performing Accelerated Outdoor Weathering of Non-Metallic Materials Using Concentrated Natural Sunlight; ASTM: West Conshohocken, PA, USA, 2010.
  33. ASTM G7 Standard Practice for Atmospheric Environmental Exposure Testing of Non-Metallic Materials; ASTM: West Conshohocken, PA, USA, 2013.
  34. ASTM G154 Standard Practice for Operating Fluorescent Ultraviolet Lamp Apparatus for Exposure of Non-Metallic Materials; ASTM: West Conshohocken, PA, USA, 2016.
  35. Habekost, M. Which color differencing equation should be used? Int. Circ. Graph. Educ. Res. 2013, 6, 20–33. [Google Scholar]
  36. Pintus, V.; Wei, S.; Schreiner, M. UV ageing studies: Evaluation of lightfastness declarations of commercial acrylic paints. Anal. Bioanal. Chem. 2012, 402, 1567–1584. [Google Scholar] [CrossRef] [PubMed]
  37. Castillo, L.A.; Barbosa, S.E.; Maiza, P.; Capiati, N.J. Surface modifications of talcs. Effects of inorganic and organic acid treatments. J. Mater. Sci. 2011, 46, 2578–2586. [Google Scholar] [CrossRef]
  38. Deflorian, F.; Rossi, S.; Fedel, M. Organic coatings degradation: Comparison between natural and artificial weathering. Corros. Sci. 2008, 50, 2360–2366. [Google Scholar] [CrossRef]
  39. Yang, X.F.; Vang, C.; Tallman, D.E.; Bierwagen, G.P.; Croll, S.G.; Rohlik, S. Weathering degradation of a polyurethane coating. Polym. Degrad. Stab. 2001, 74, 341–351. [Google Scholar] [CrossRef]
  40. Truffault, L.; Choquenet, B.; Konstantinov, K.; Devers, T.; Couteau, C.; Coiffard, L.J. Synthesis of nano-hematite for possible use in sunscreens. Nanosci. Nanotechnol. 2010, 10, 1–8. [Google Scholar] [CrossRef]
  41. Piccirillo, C.; Rocha, C.; Tobaldi, D.M.; Pullar, R.C.; Labrincha, J.A.; Ferreira, M.O.; Castro, P.M.L.; Pintado, M.M.E. A hydroxyapatite-Fe2O3 based material of natural origin as an active sunscreen filter. J. Mater. Chem. B 2014, 2, 5999–6009. [Google Scholar] [CrossRef]
  42. Scheffer, T.C. A climate index for estimating potential for decay in wood structures above ground. For. Prod. J. 1971, 21, 25–31. [Google Scholar]
Figure 1. FTIR-ATR spectra of (a) Paint 1 and (b) Paint 2. Control (solid line), QUV (dash line), Quebec (short dash line), Arizona (dash-pointed line), and Florida (dash double pointed line).
Coatings 09 00121 g001aCoatings 09 00121 g001b
Figure 2. ΔECMC parameters for Paint 1 (left) and Paint 2 (right).
Coatings 09 00121 g002
Table 1. Initial L*C*h* of Paint 1 and Paint 2.
SampleL*C*h
Paint 1 (blue)29.0111.35265.40
Paint 2 (red)37.2039.0230.37
Table 2. Paint composition in dyes and pigments.
NameDye/Pigment
123456
Paint 1 (Blue)E Phthalo blue1949 VKX titanium whiteB Black
Paint 2 (Red)E Phthalo blue1949 VKX titanium whiteRH redF red oxide
Product ID: 076000193100019490001900000199200019480001935
Table 3. Identification of most important peaks in FTIR-ATR spectrum of acrylic paint [11,28].
Wavenumber (cm−1)Assignation
2956Vas (CH3)
2919Vas (CH2)
2875Vs (CH3)
2850Vs (CH2)
1726C–O stretching (carbonyl)
1710C=O (ketone)
1682Vs (CH3)
1450C–H bend δs (CH2) + δas (CH3)
1240C–H bending in CH–Cl and ν(C–O–C) of ester
1144C–O stretching
1111C–O stretching
Table 4. Results from quantitative analyses made from ratios between most exposed samples and unexposed samples.
ExposurePercentage of Remaining Functional Groups
Paint 1Paint 2
Wavenumbers (cm−1)
2956172629561726
Arizona7243326
Florida28156348
Province of Quebec28184540
QUV7202915
Table 5. Maximum variation of the ΔECMC parameter for each paint and exposure site.
ExposurePaint 1Paint 2
Arizona9.622.41
Florida7.761.41
QUV3.740.69
Québec1.801.82
Table 6. The most degrading methods in terms of the abscissa used.
AbscissaThe Most Degrading Method
Paint 1Paint 2
MJ Total/m2QUVQUV
Length of exposureArizonaArizona
MJ UV/m2FloridaFlorida
Table 7. Summary of the main results and parameters for each exposure.
ParametersExposure
ArizonaFloridaQuebecQUV
Coordinates33°23′ N, 112°35′ W25°27′ N, 80°20′ W46°58′ N, 69°47′ WNot applicable
Elevation (meters)32222
Length of exposure (months)612489
Energy received MJ UV/m2334280180588
Energy received MJ/m2800465884280588
Average temperature (min/max) in °C13/3021/28−0.8/9.250/60
Rainfall (millimetres)1861420923 (+316 of snow)4 h condensation every 8 h
Average relative humidity (%)357069.9
Ratio at 2956 cm−1 (% of remaining functional groups)Paint 1728287
Paint 233634529
Ratio at 1726 cm−1 (% of remaining functional groups)Paint 124151820
Paint 226484015
Maximum variation of ΔECMCPaint 19.627.763.741.80
Paint 22.411.410.691.82
Abscissa when the exposure is considered as most degrading methodPaint 1/ Paint 2Length of exposureMJ UV/m2NoneMJ Total/m2

