Extreme High-Speed Laser Material Deposition (EHLA) of AISI 4340 Steel

 ,
,
Abstract
:
1. Introduction
2. Experimental Method
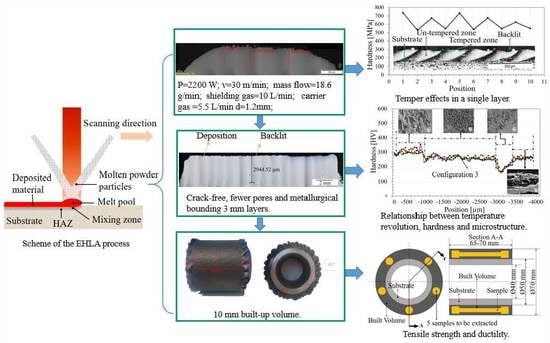
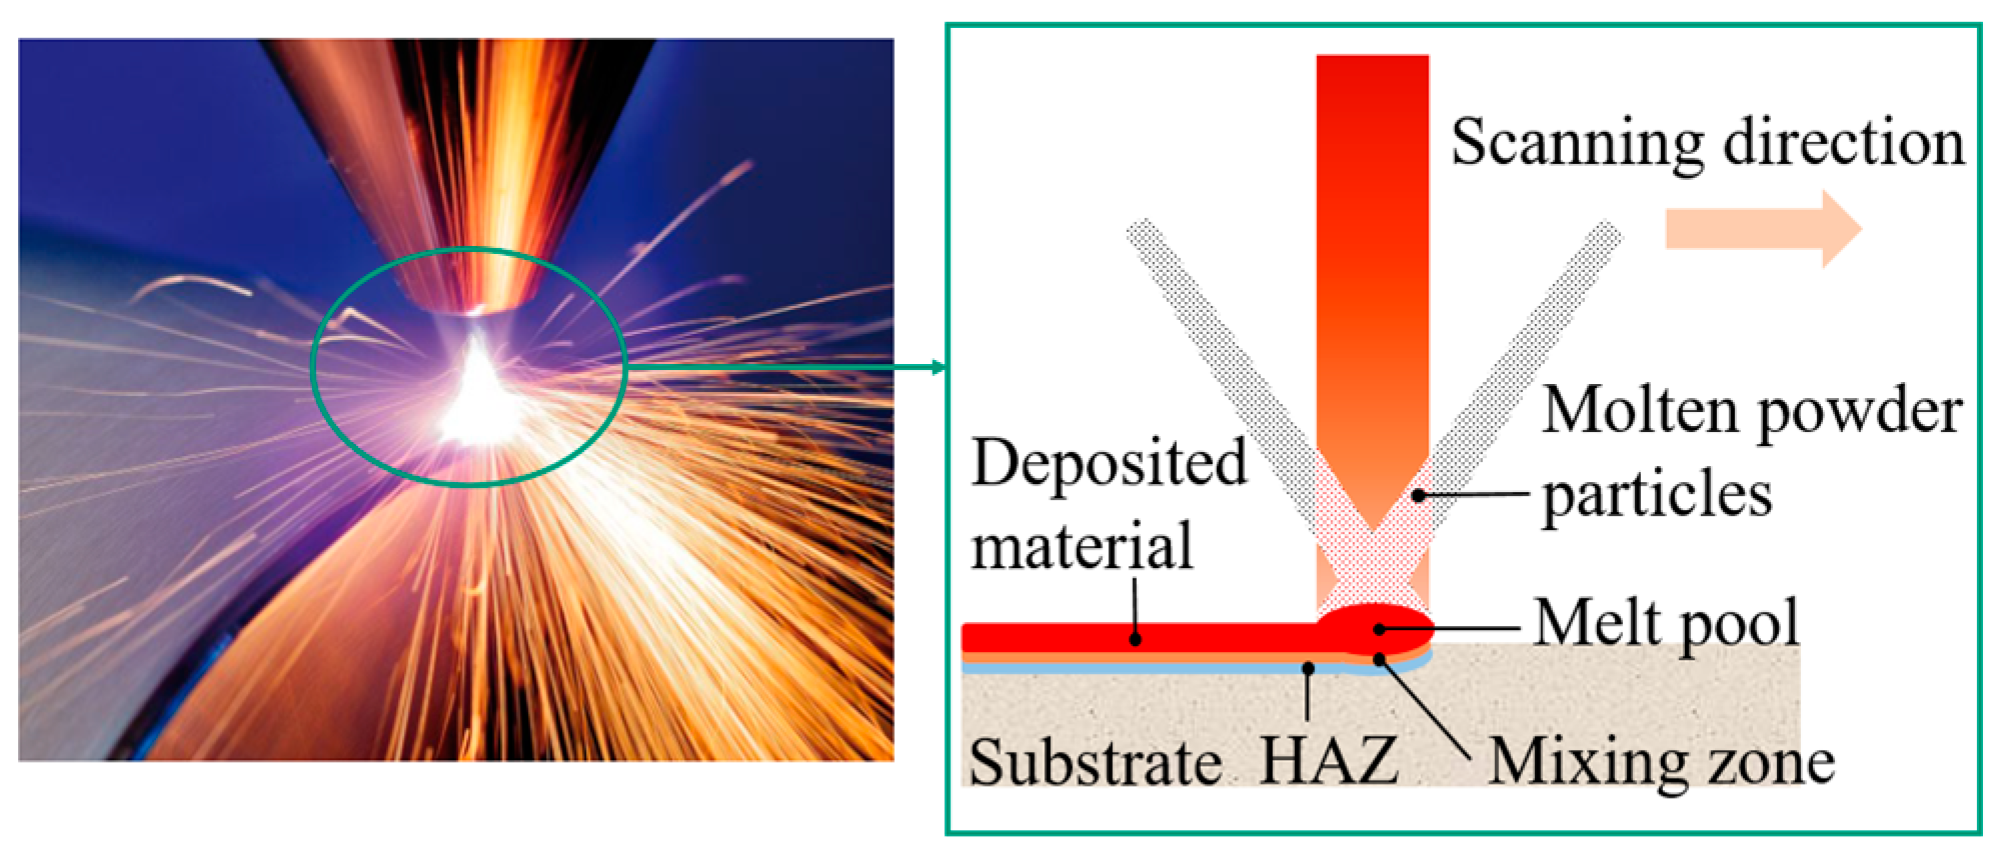
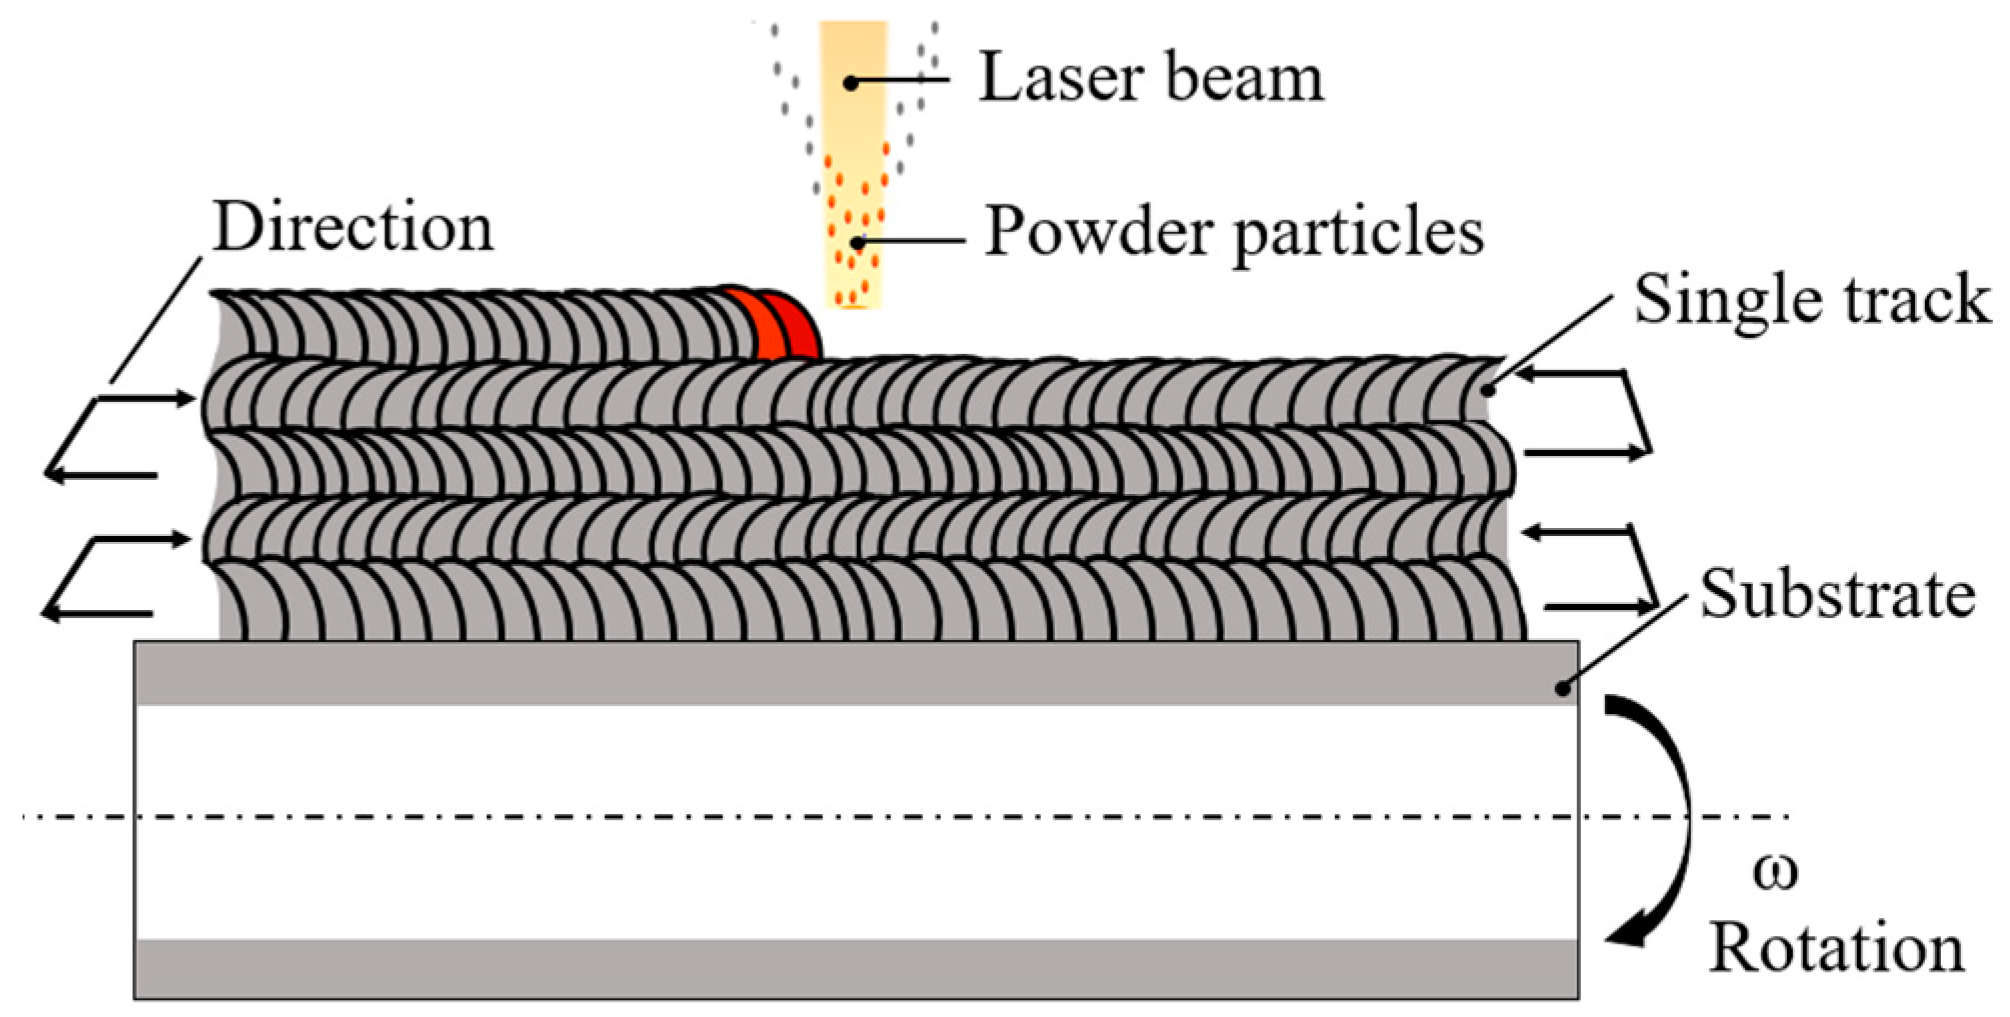
2.1. Experimental Process Development
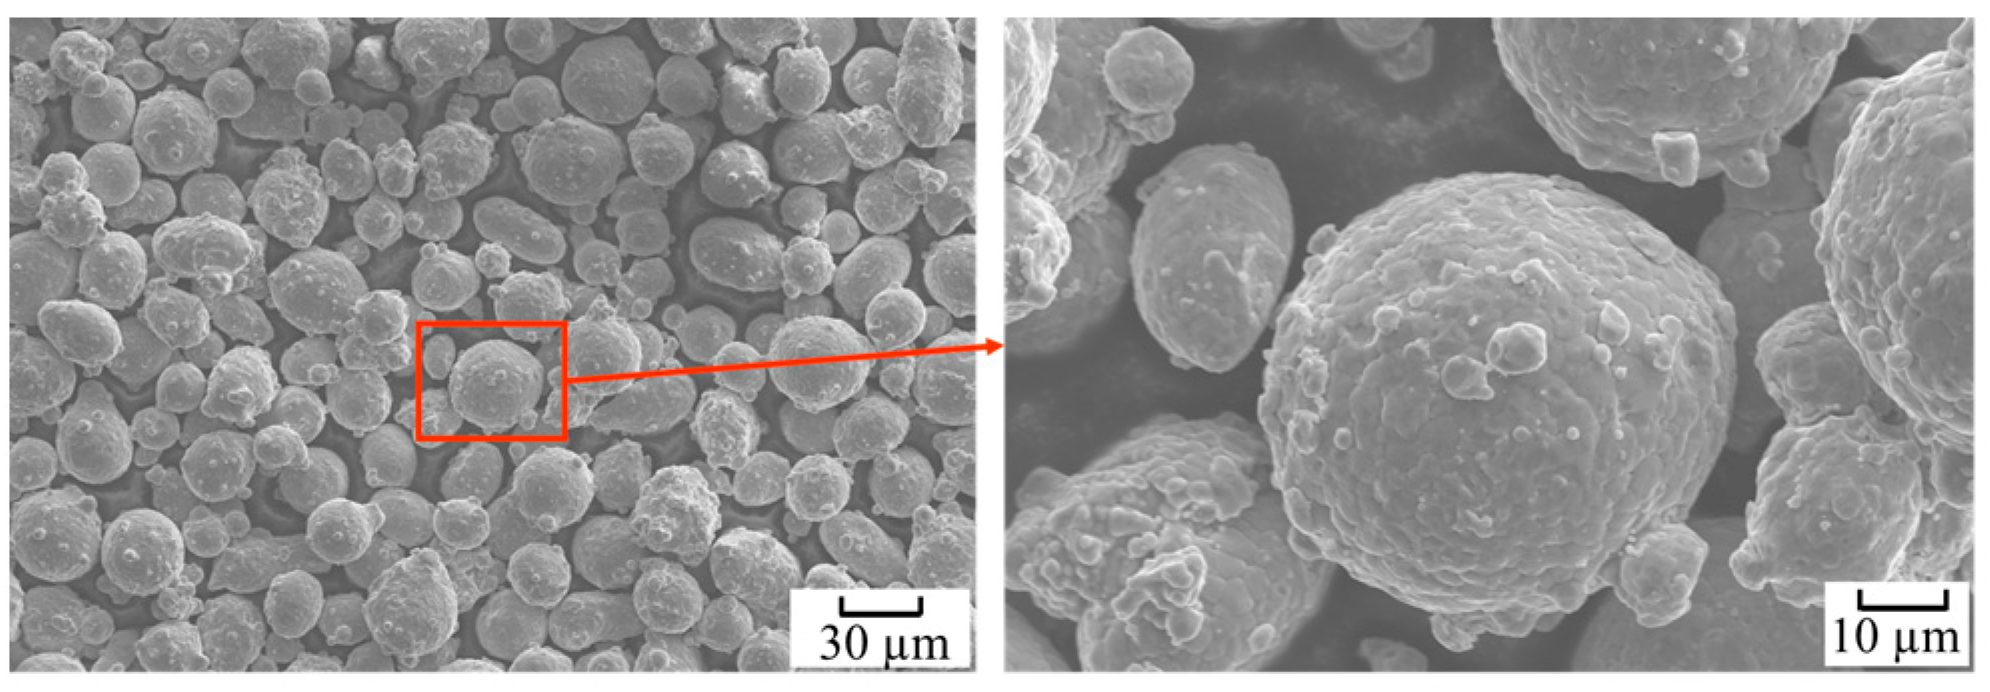
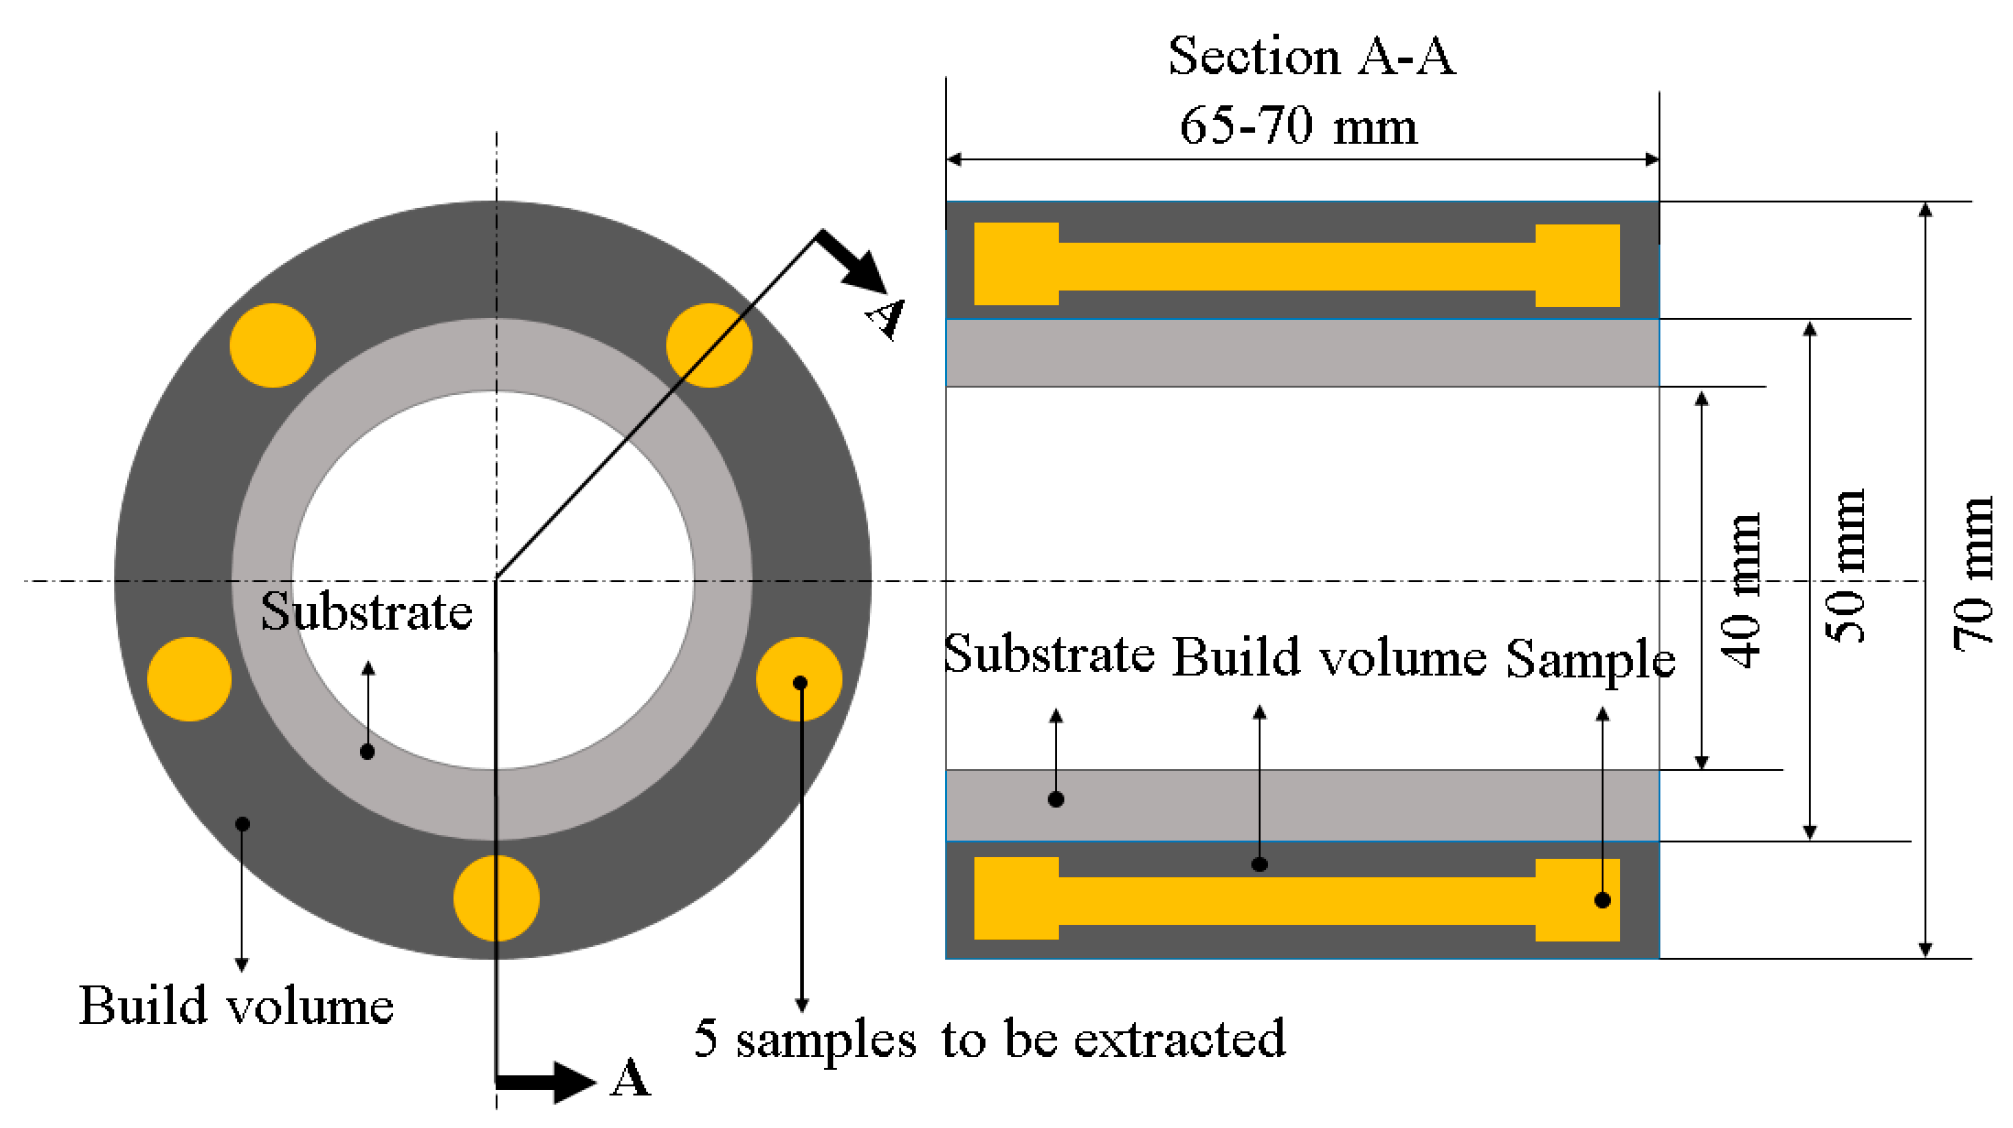
2.2. Substrate and Filler Materials
2.3. Metallurgical Quality Characterization
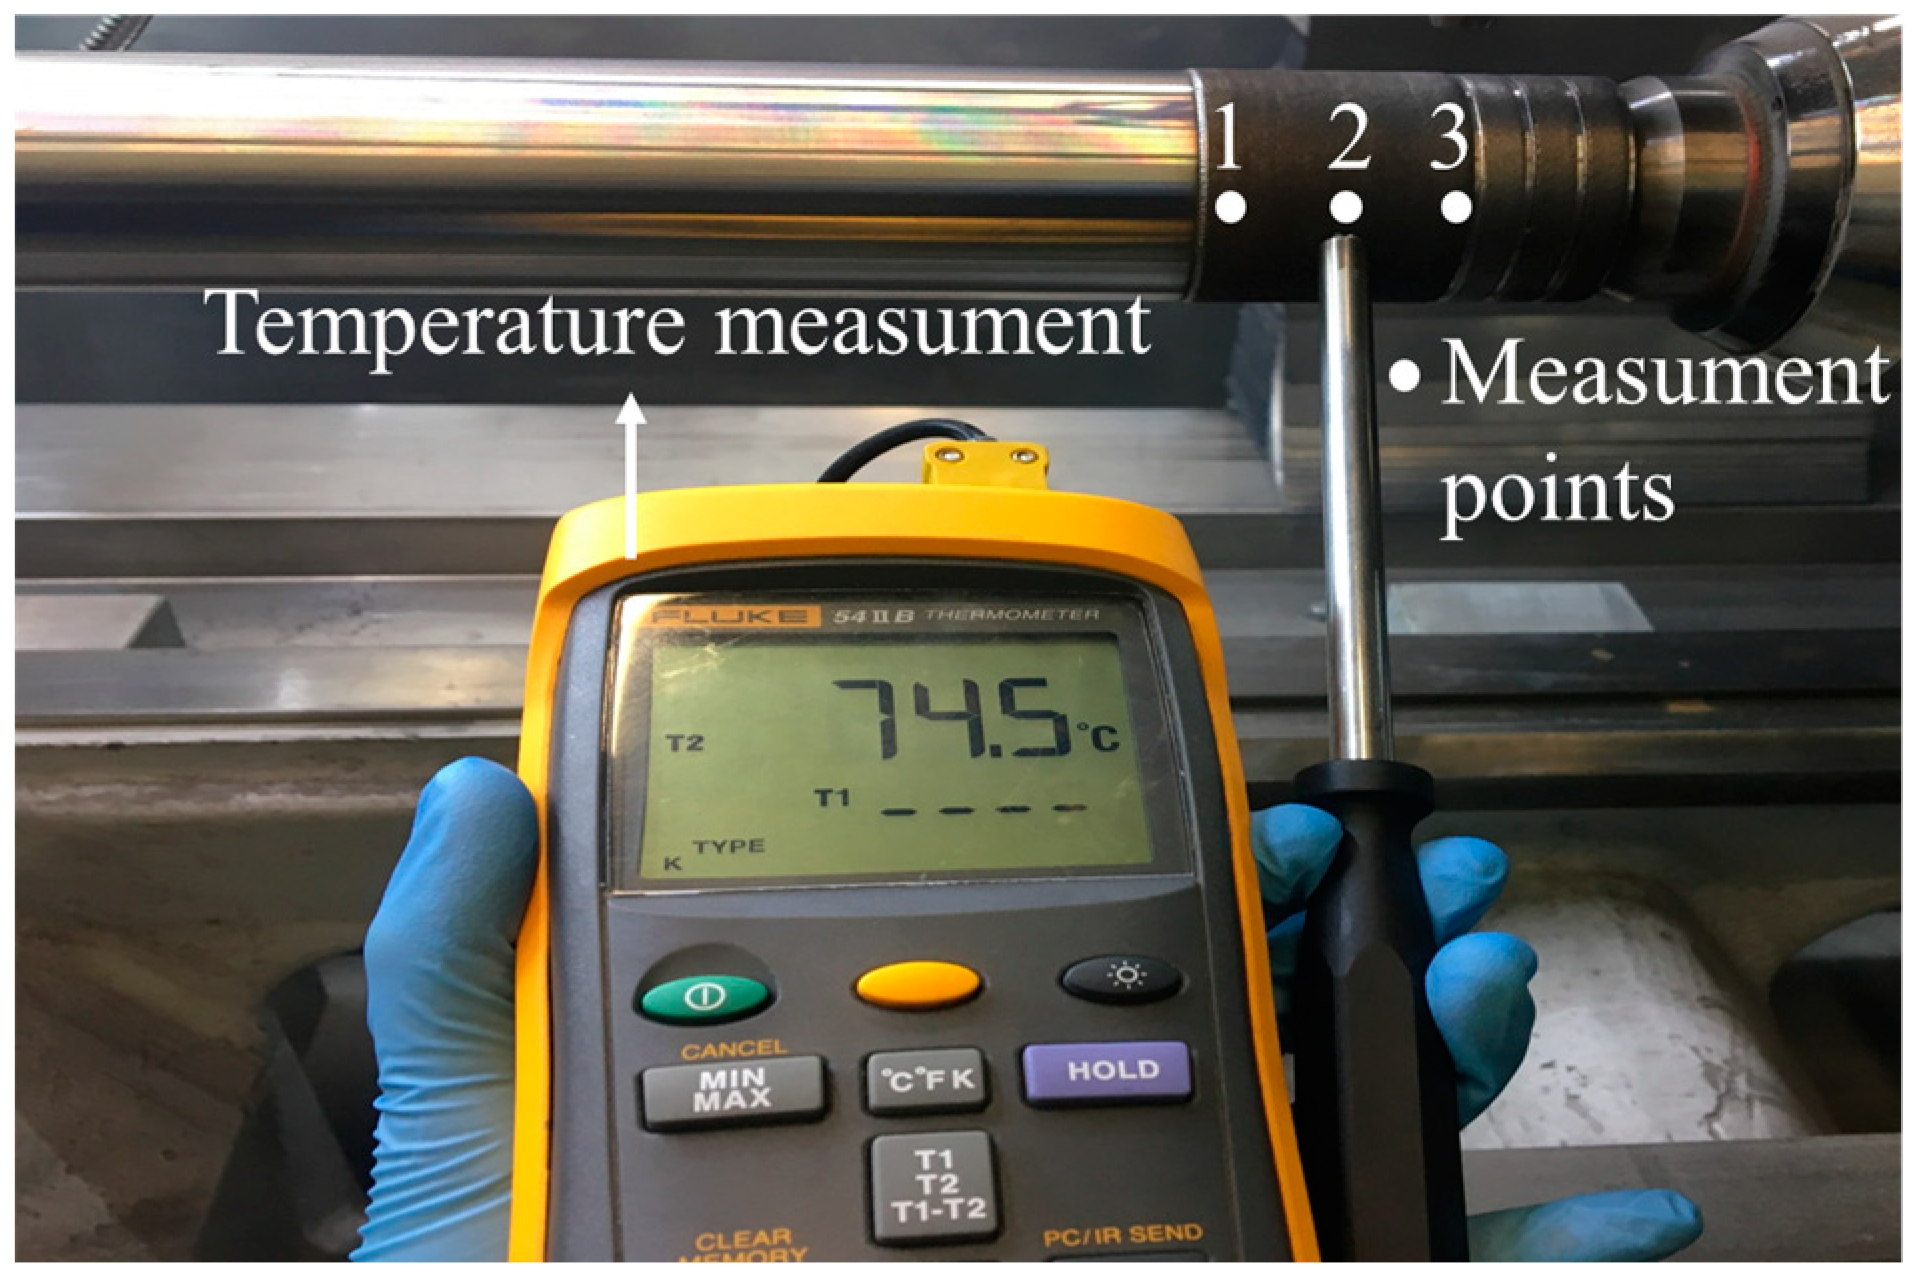
2.4. Interpass Temperature Measurement of Volumes Built-Up by Three Strategies
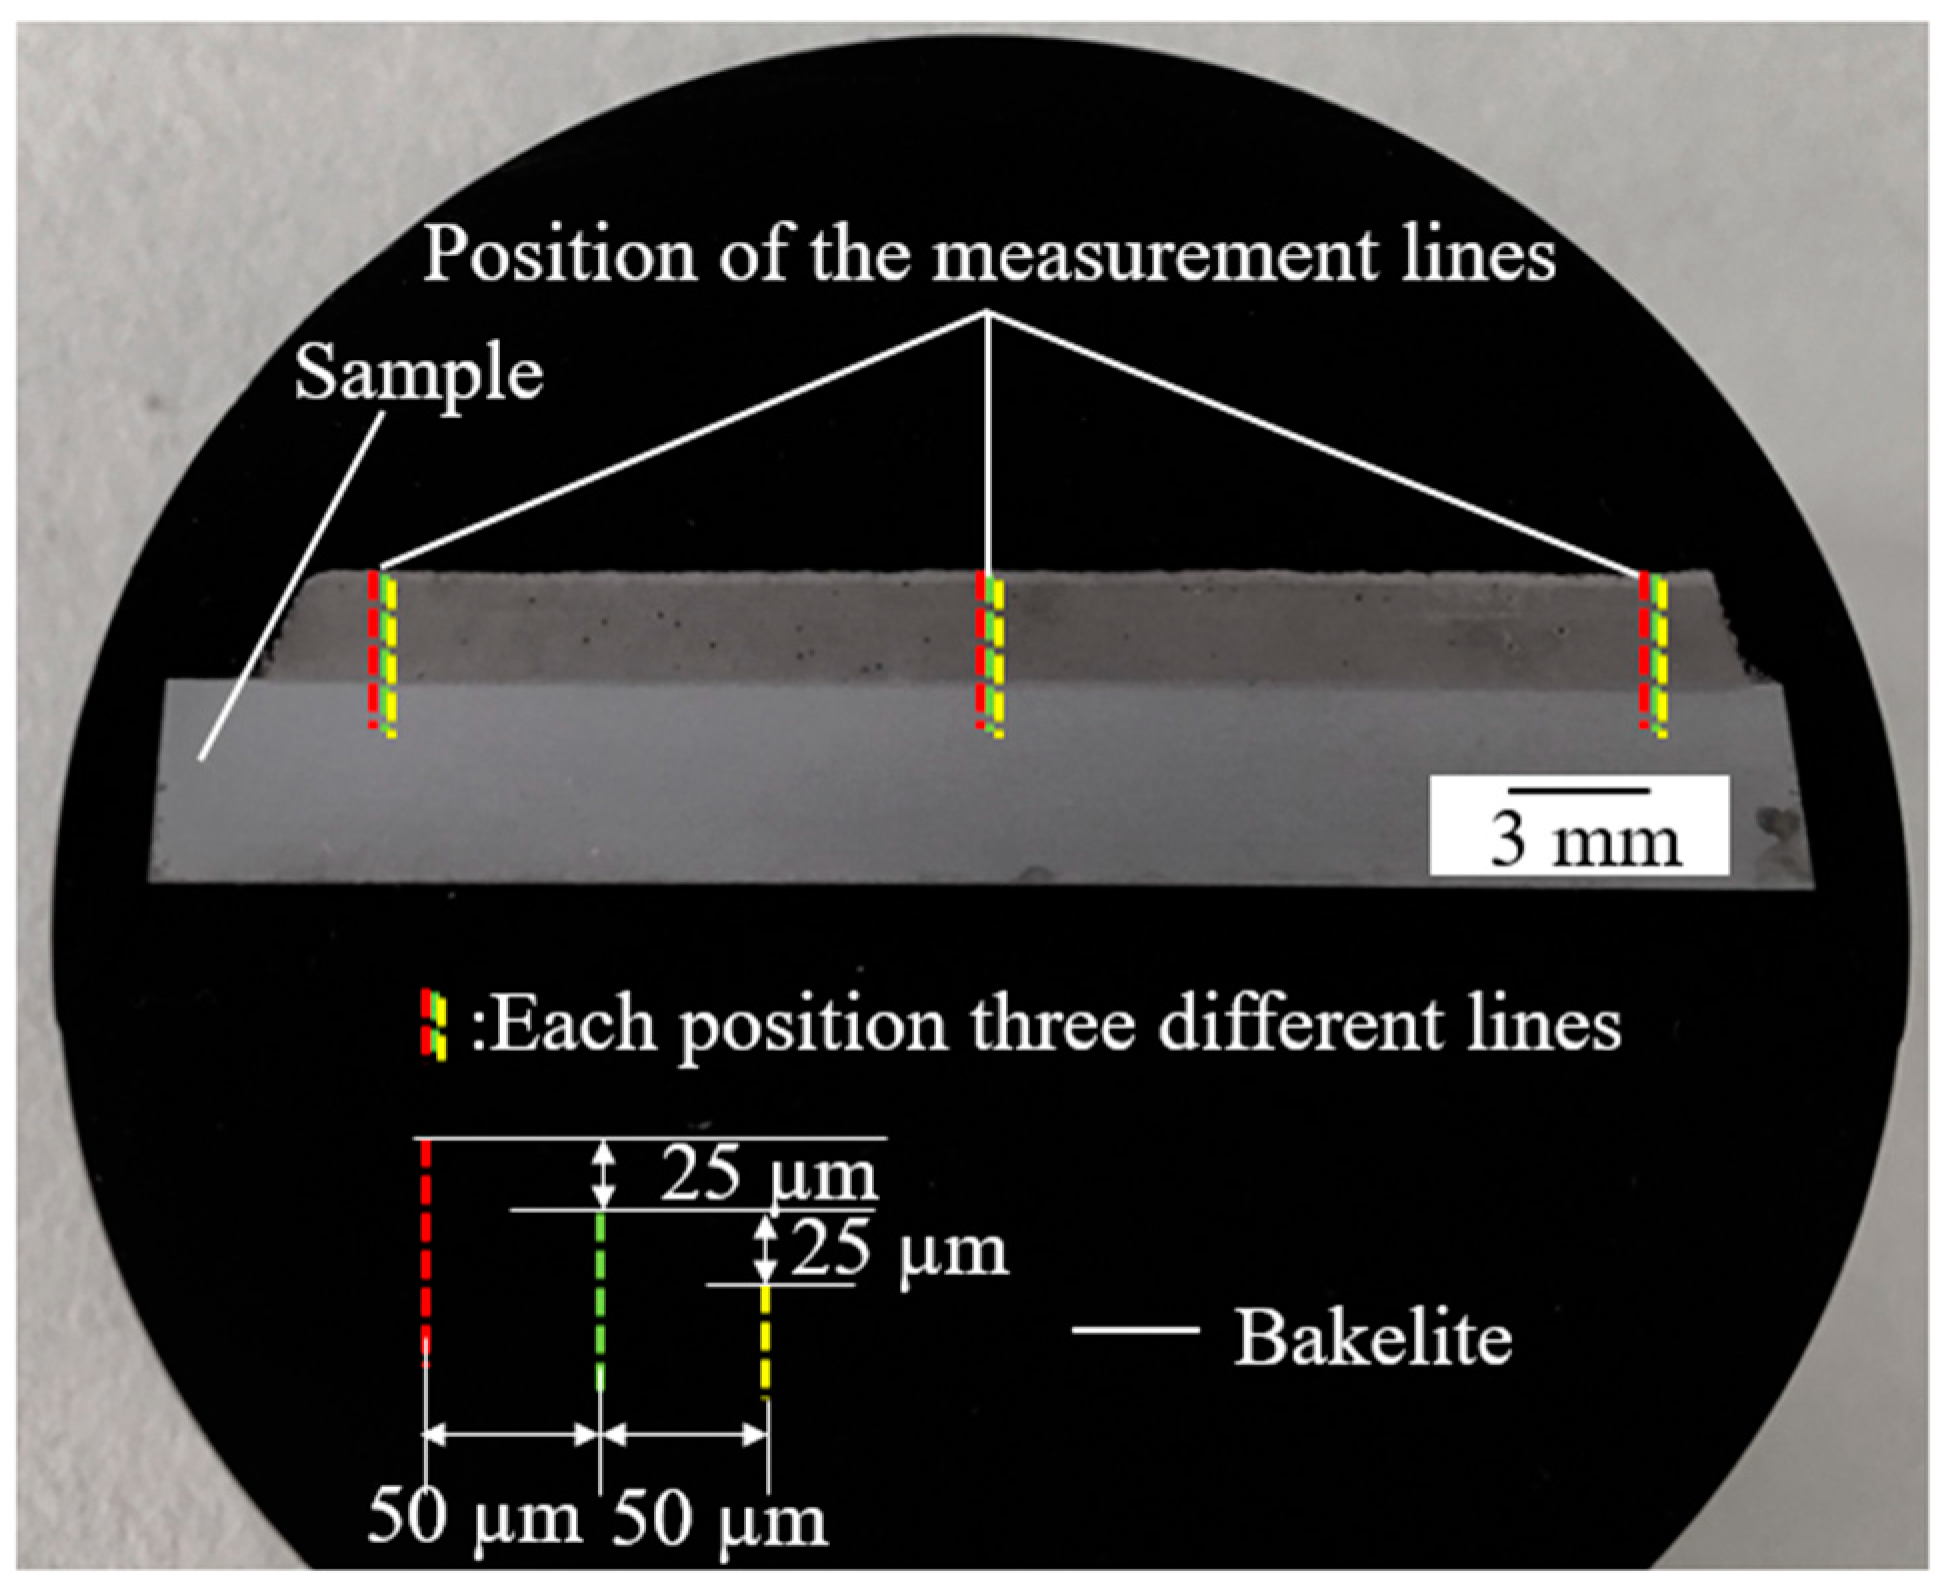
2.5. Hardness Measurement of Single Layer and Volumes Built-Up by Three Strategies
2.6. Tensile Test
3. Experimental Results
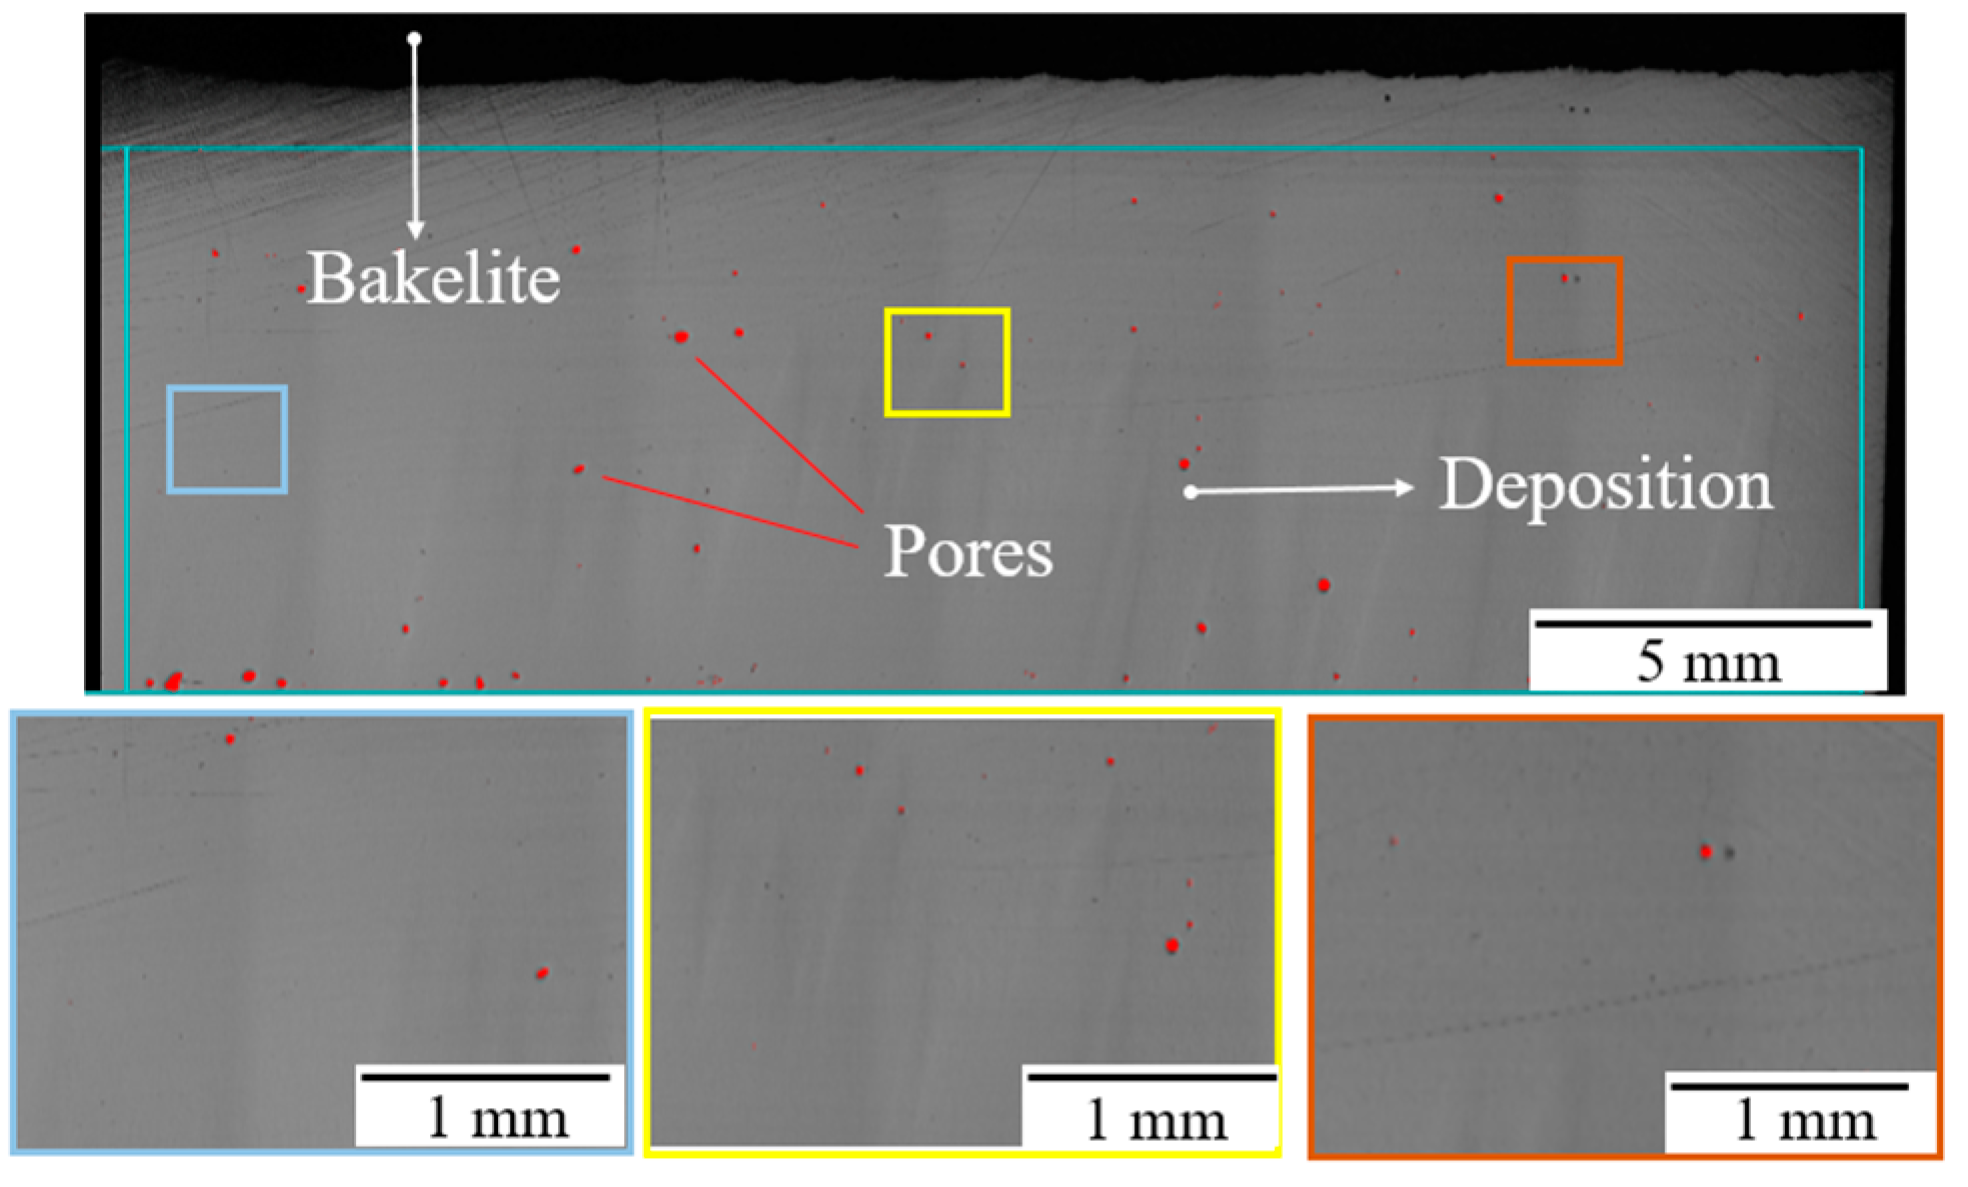
3.1. Porosity
3.2. Cracks
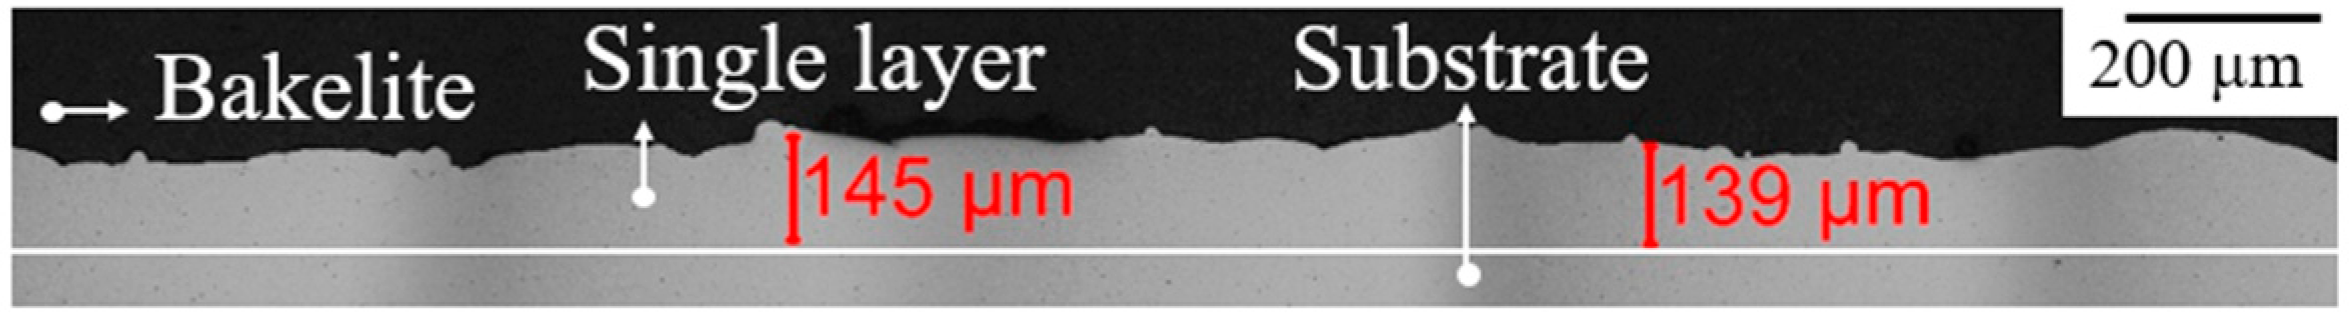
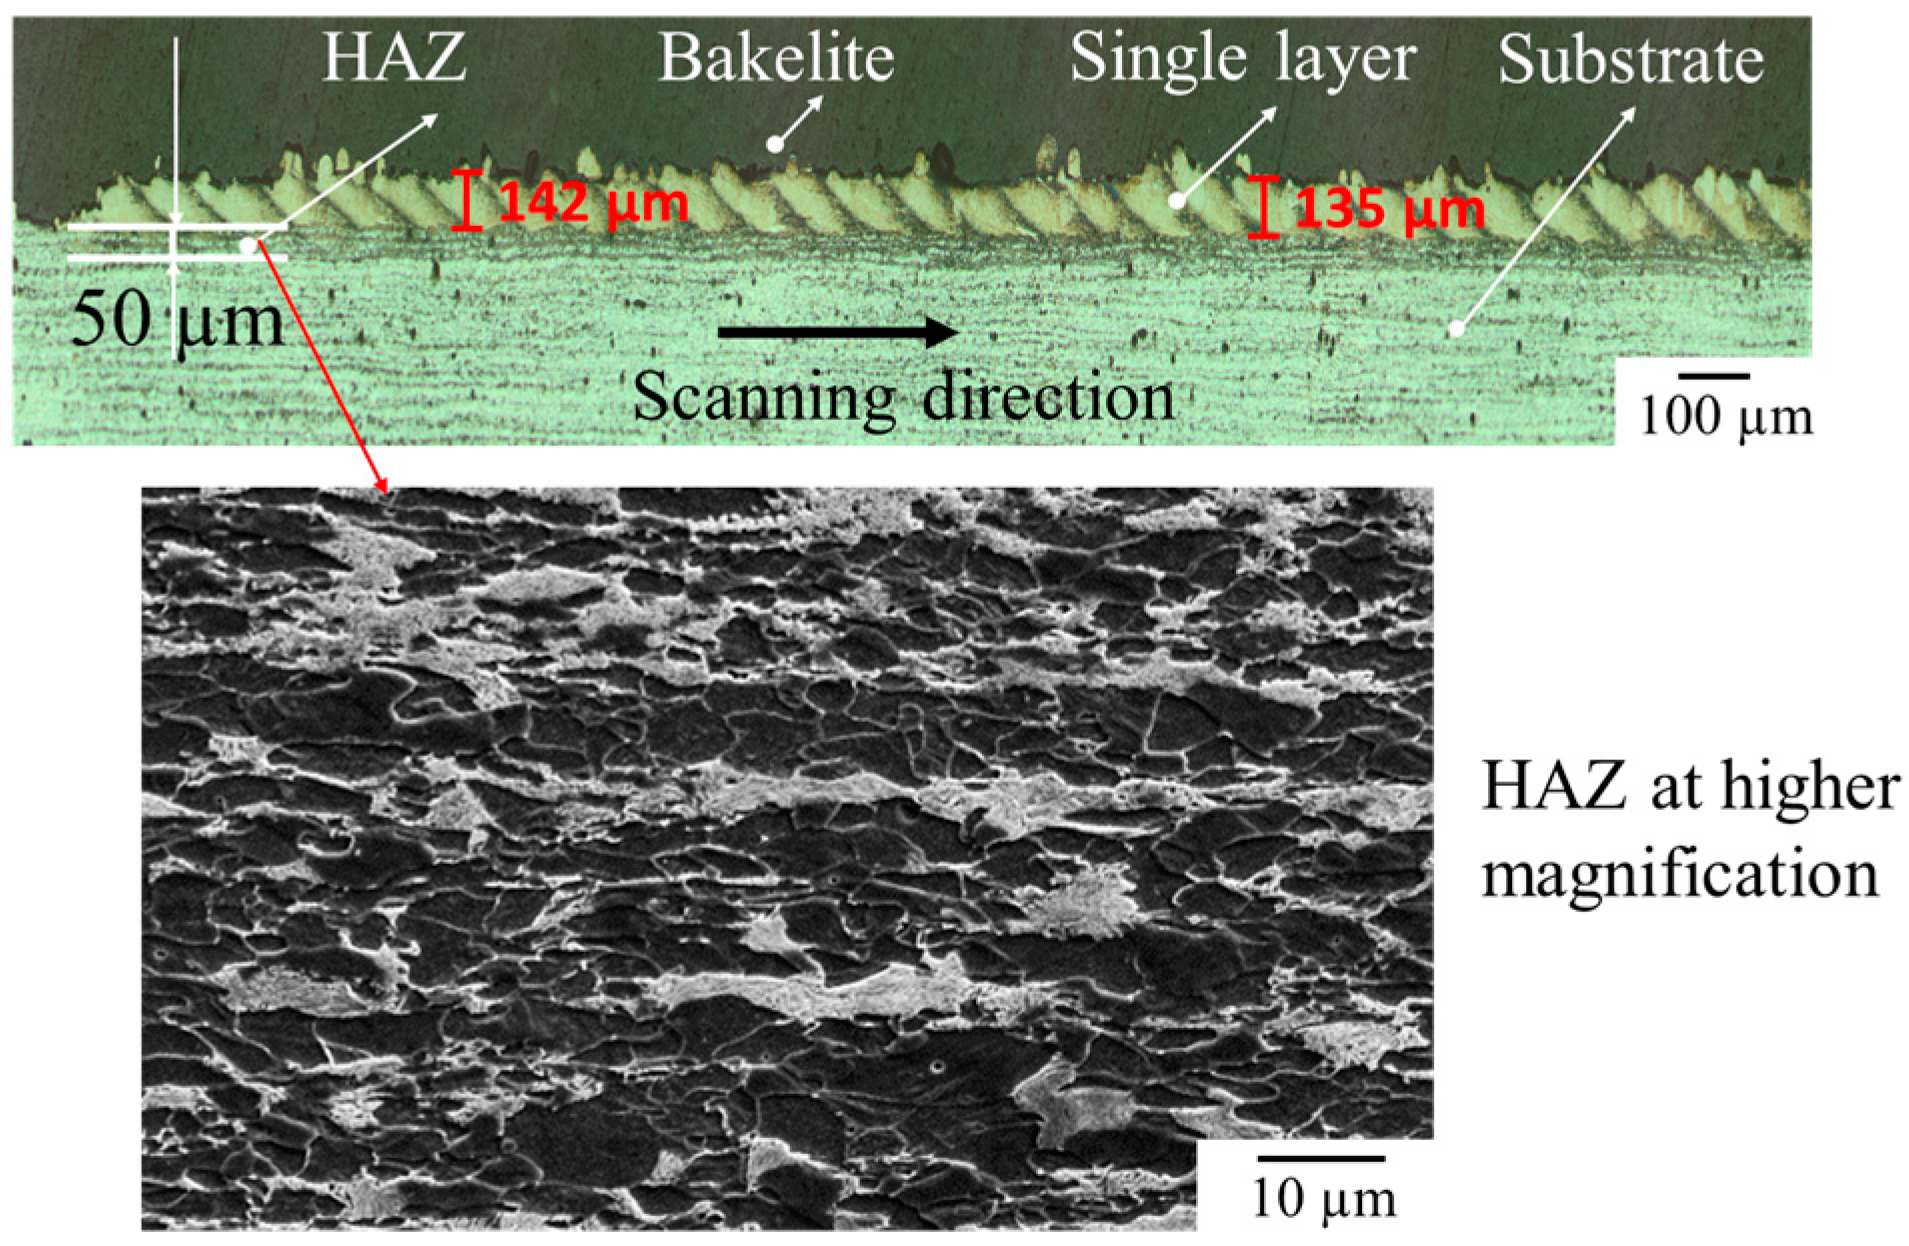
3.3. Dilution and Bonding
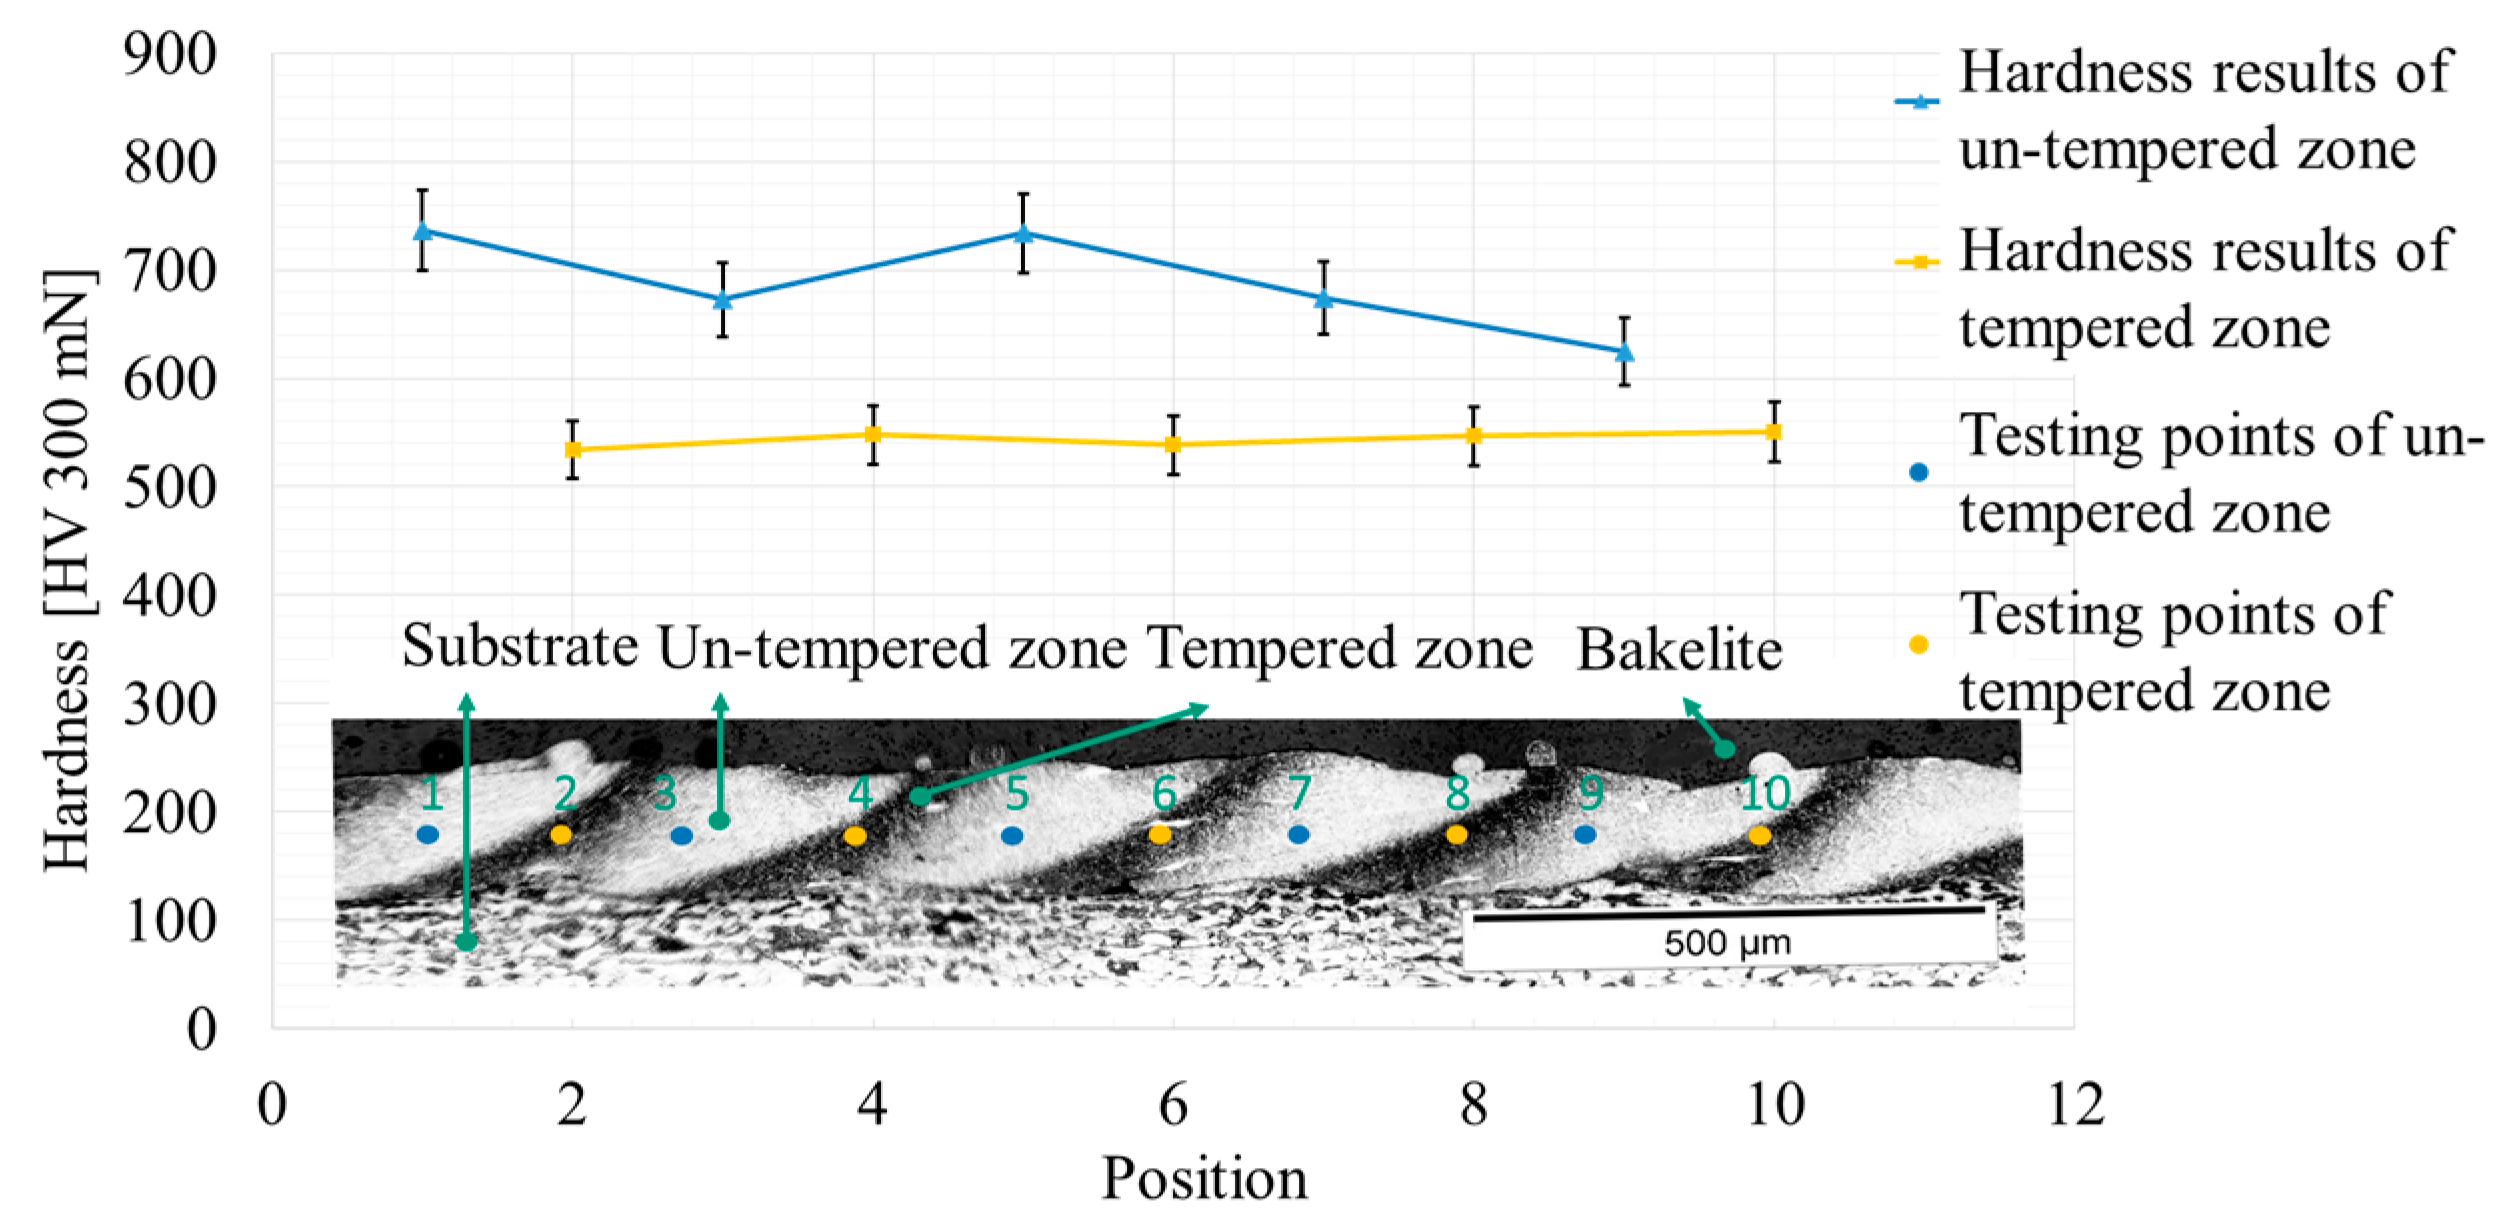
3.4. Microhardness
4. Build-Up Strategy Research of EHLA
4.1. Metallurgical Quality of Deposited Samples
4.1.1. Cracks
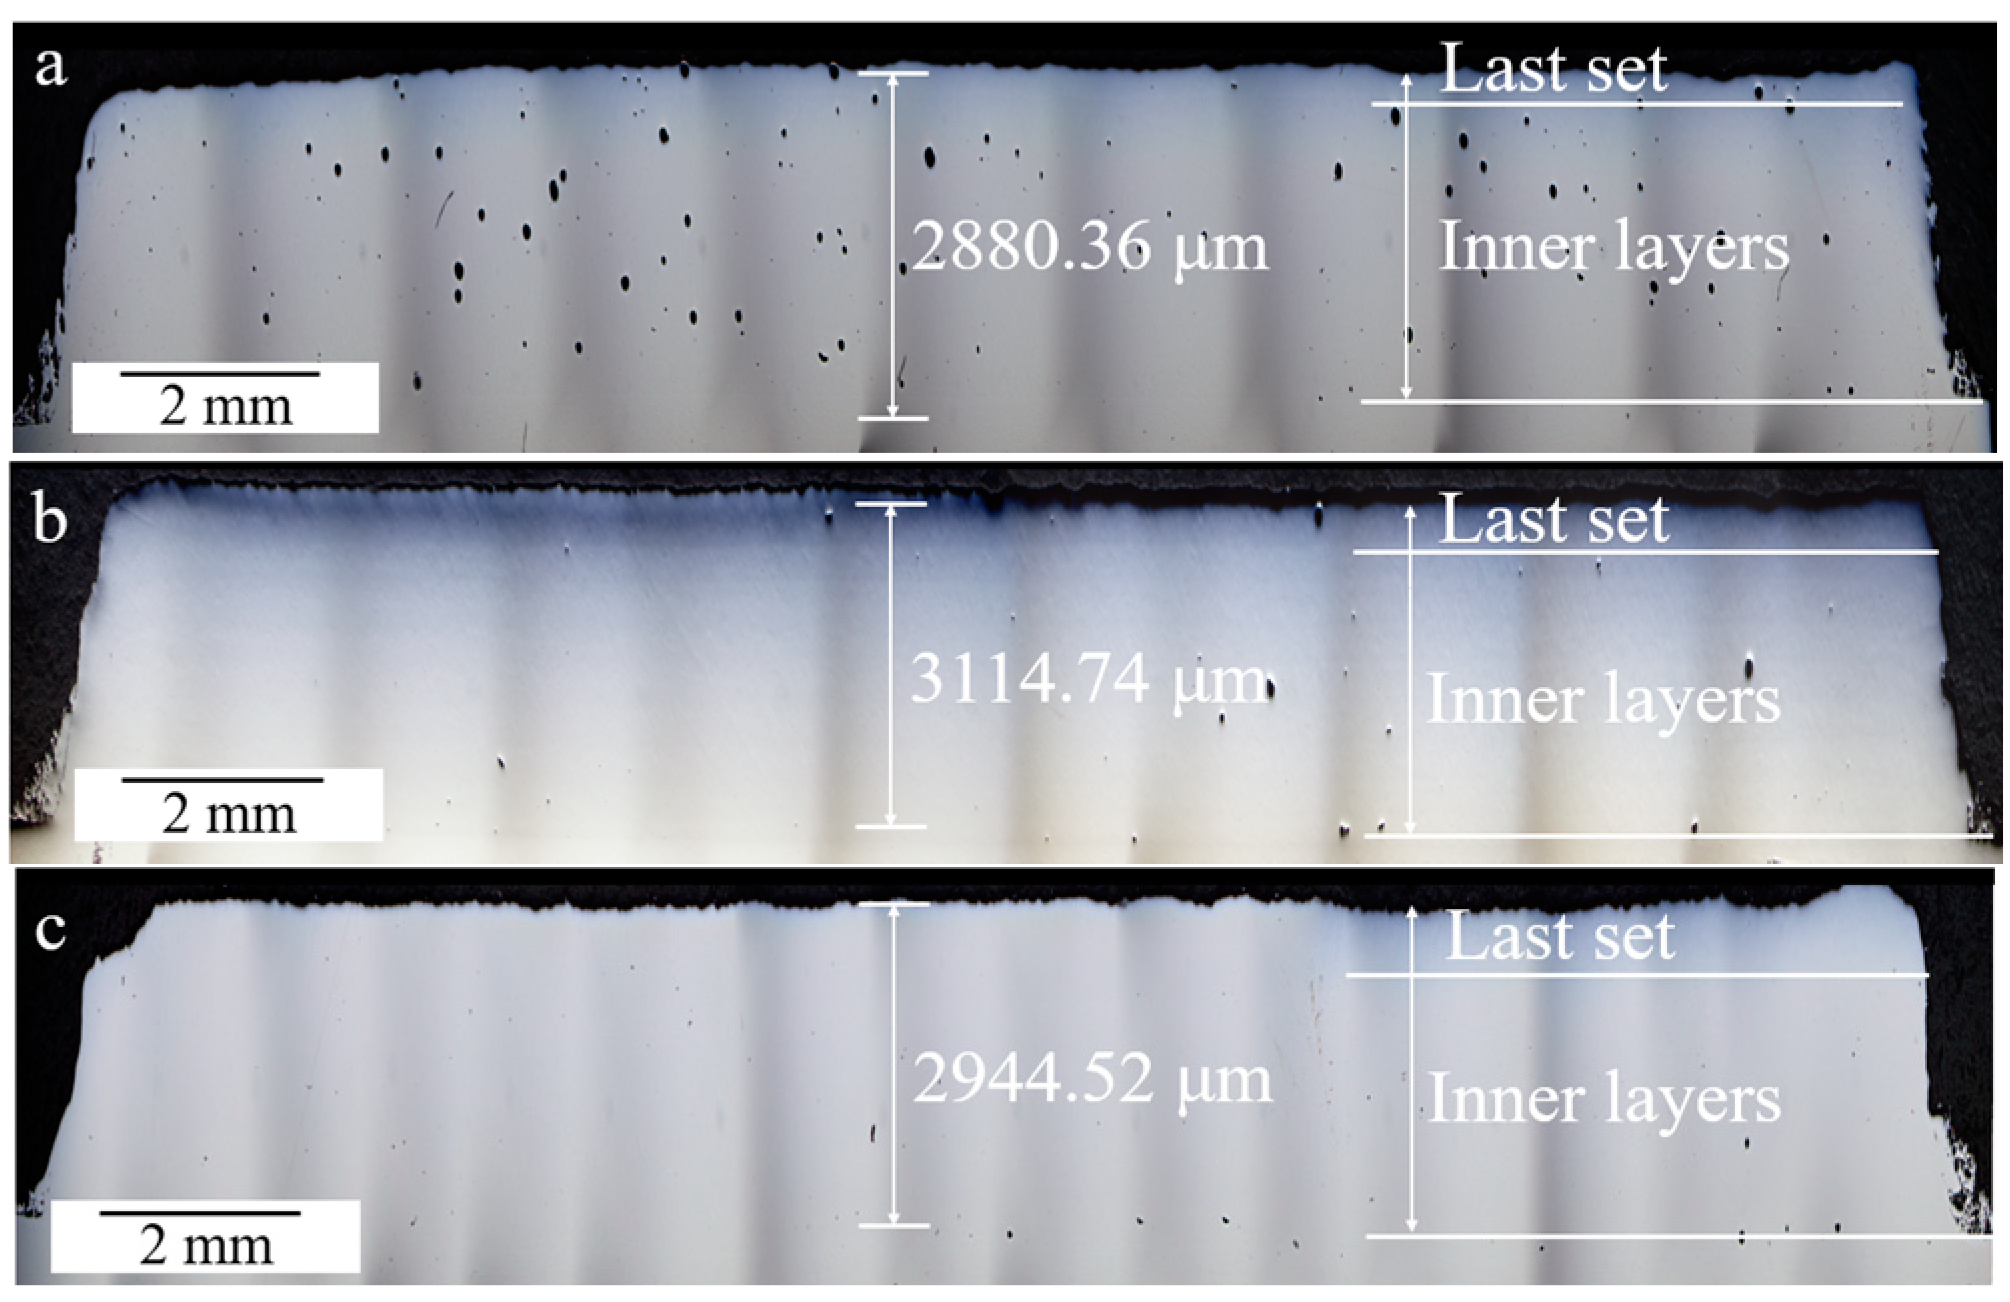
4.1.2. Porosity
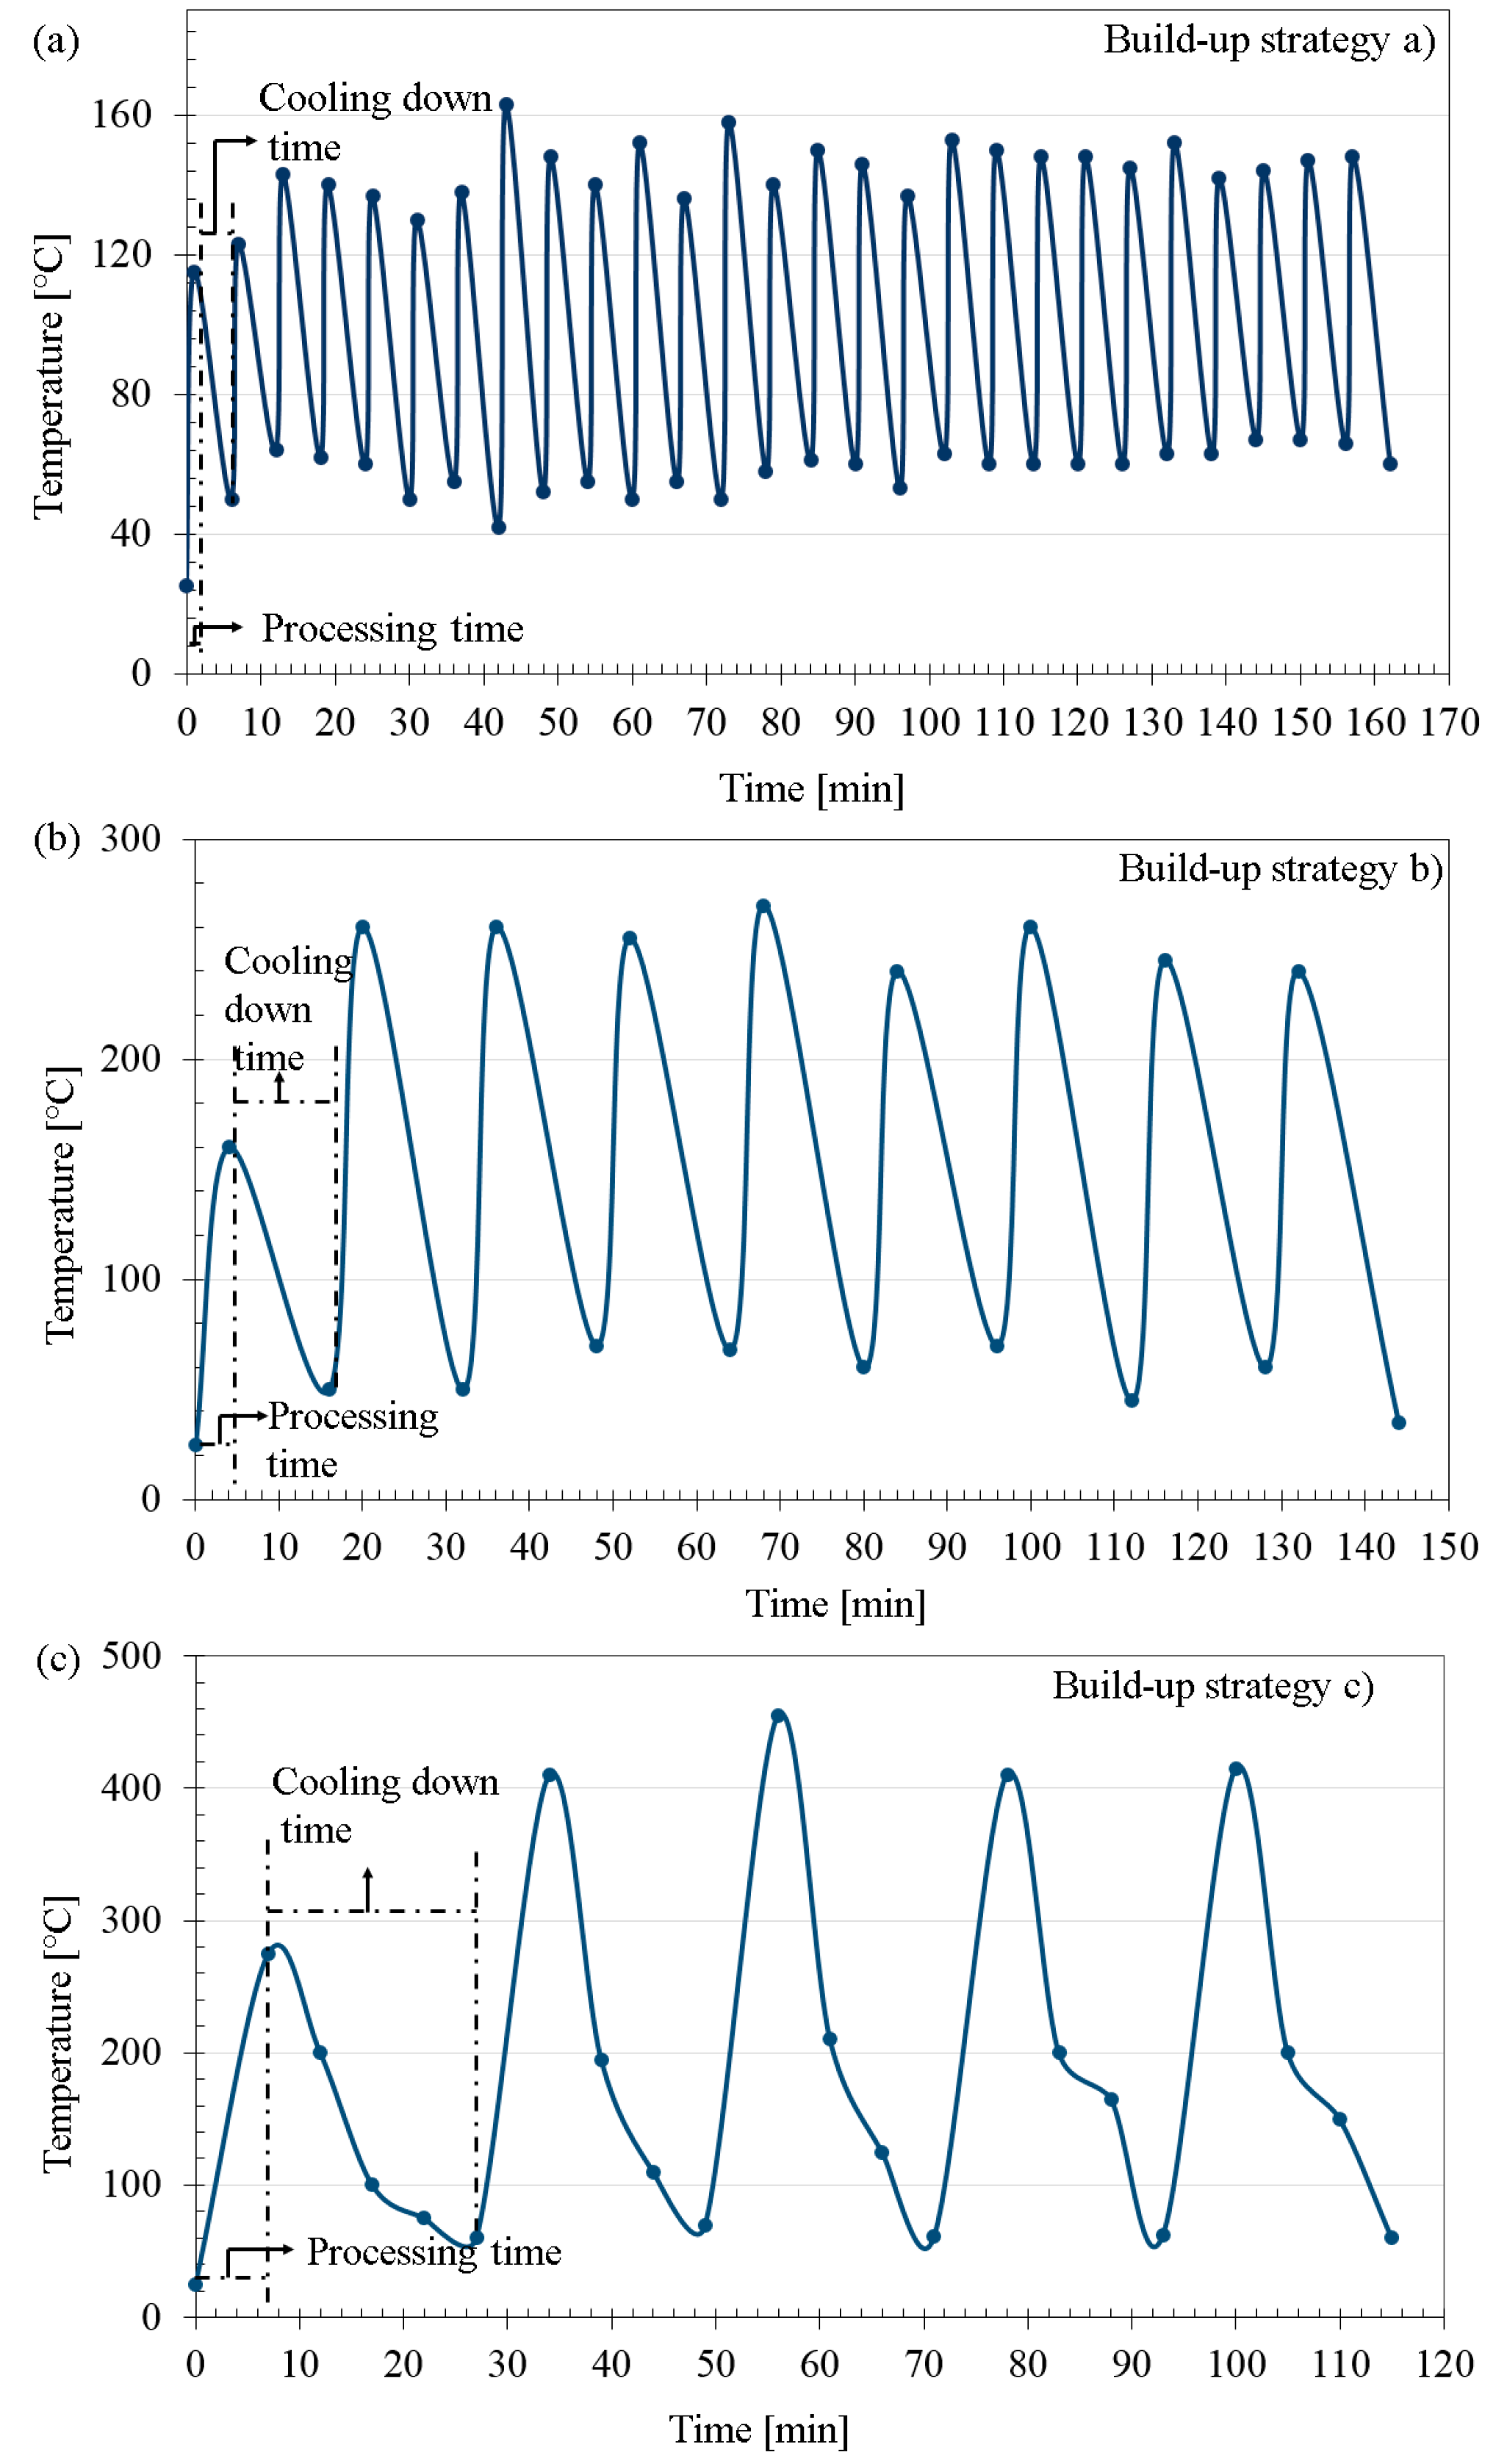
4.2. Interpass Temperature of Volumes Built-Up by Three Strategies
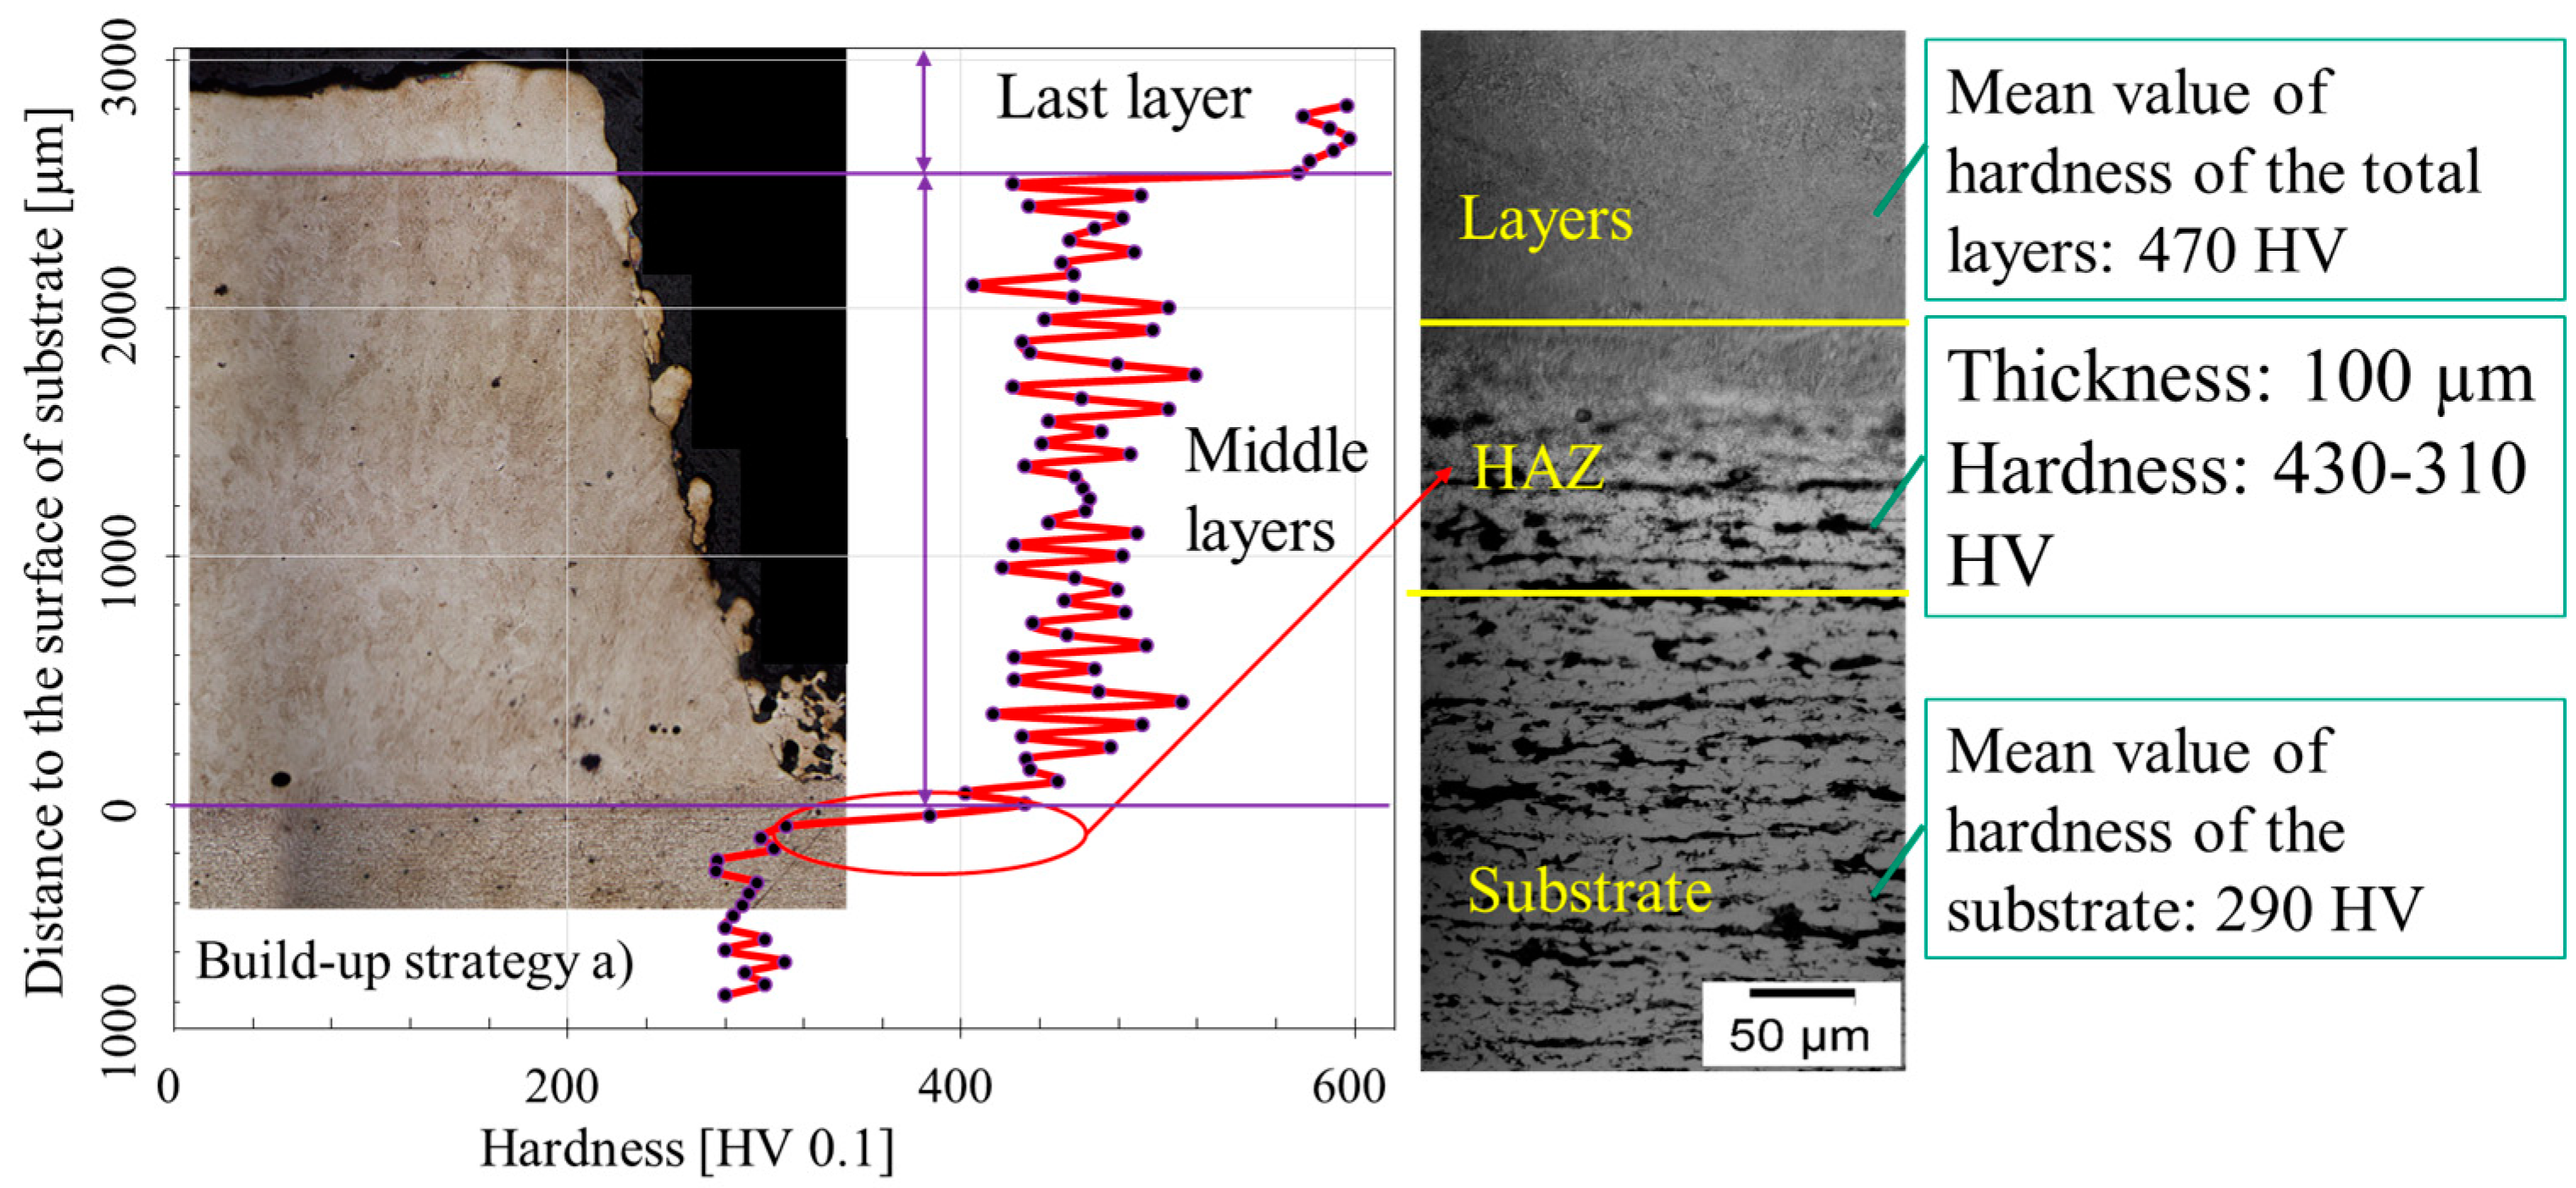
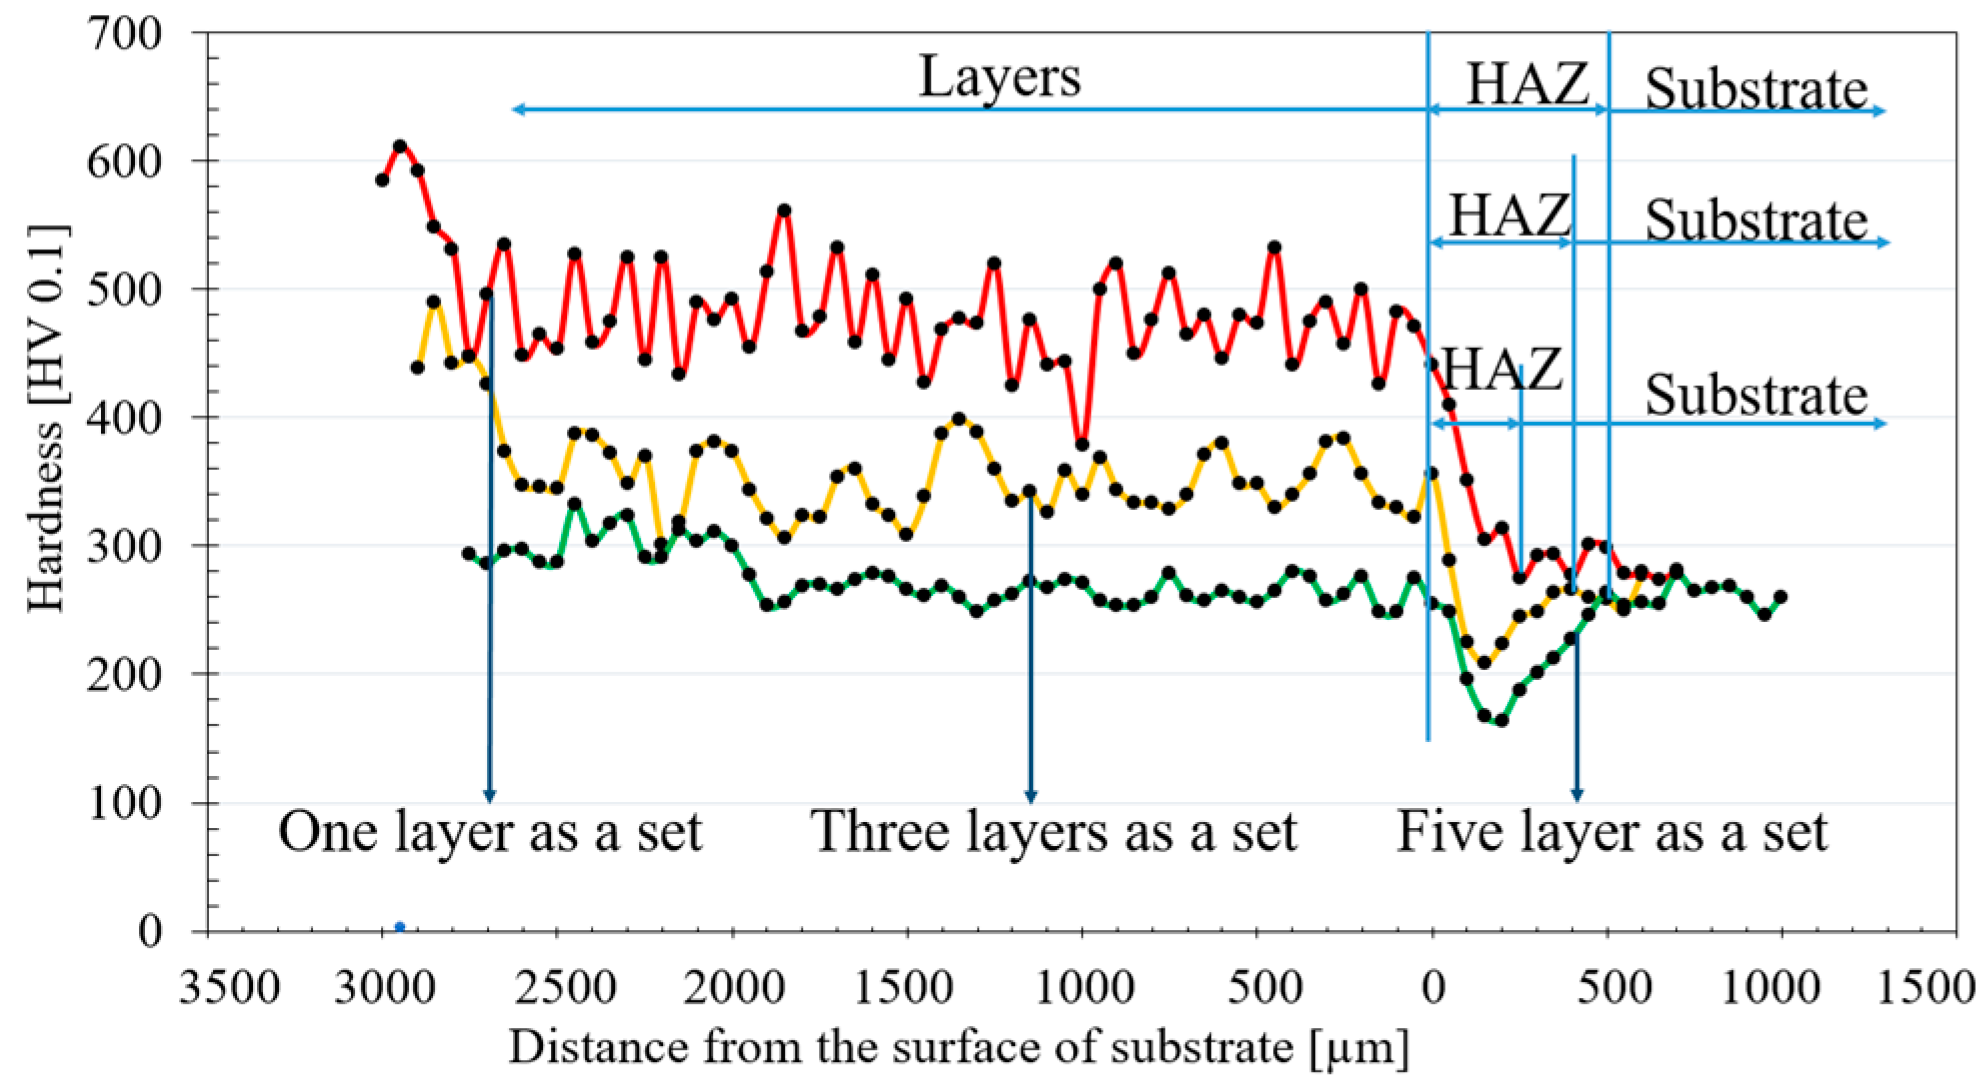
4.3. Hardness Distribution of Volumes Built-Up by Three Strategies
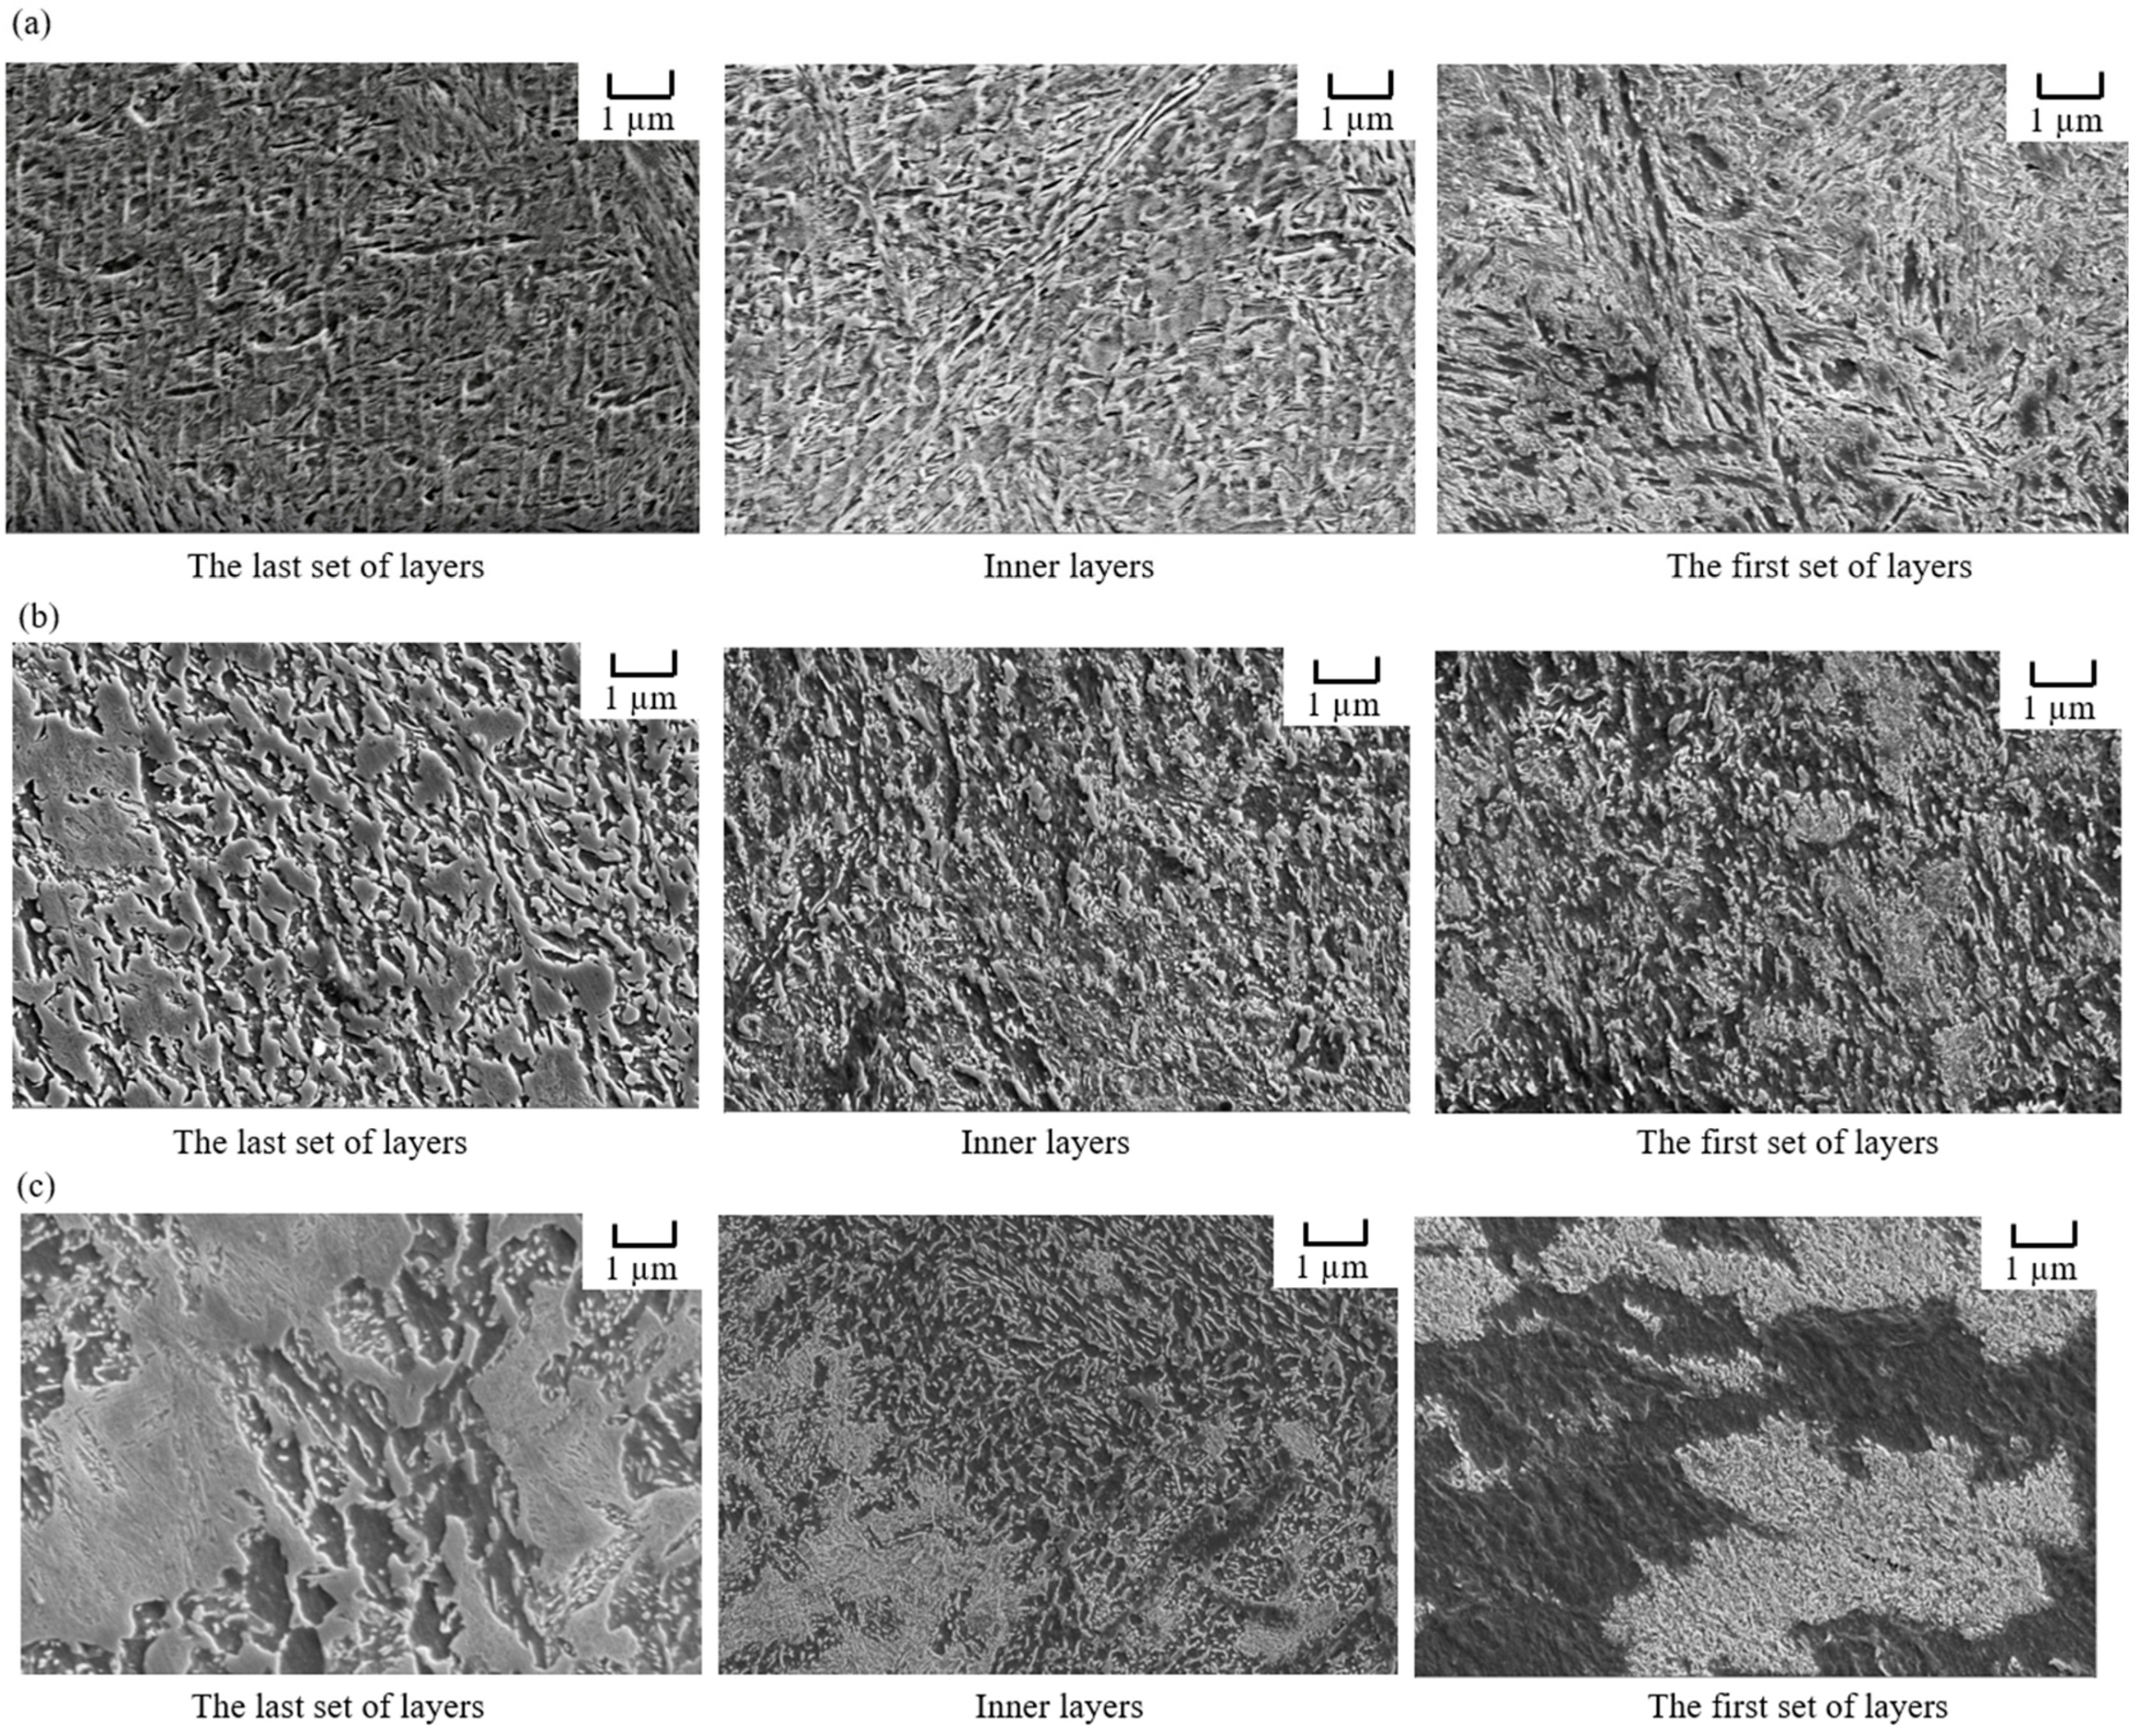
4.4. Microstructure of Volumes Built-Up by Three Strategies
4.5. Simplified Thermo-Metallurgical Scheme for AISI 4340
5. Tensile Strength for Samples Built-Up by EHLA
6. Conclusions
- EHLA process was utilized to produce deposits out of the AISI 4340 material onto an E355 substrate. The quality examination by optical microscope showed that the deposited layers were crack free, had a porosity level between 0.15% and 3.45%, and sound metallurgical bonding. The HAZ for a single layer is approximately 50 µm.
- The microstructure analysis indicates that a high cooling rate and high temperature gradient lead to the formation of martensite. Increasing the number of deposited layers in each set leads to a coarser microstructure. Knowledge of how different build-up strategies influence temperature evolution and microstructure can be used to control the hardness of the build-up volume in order to meet the requirements of a specific application.
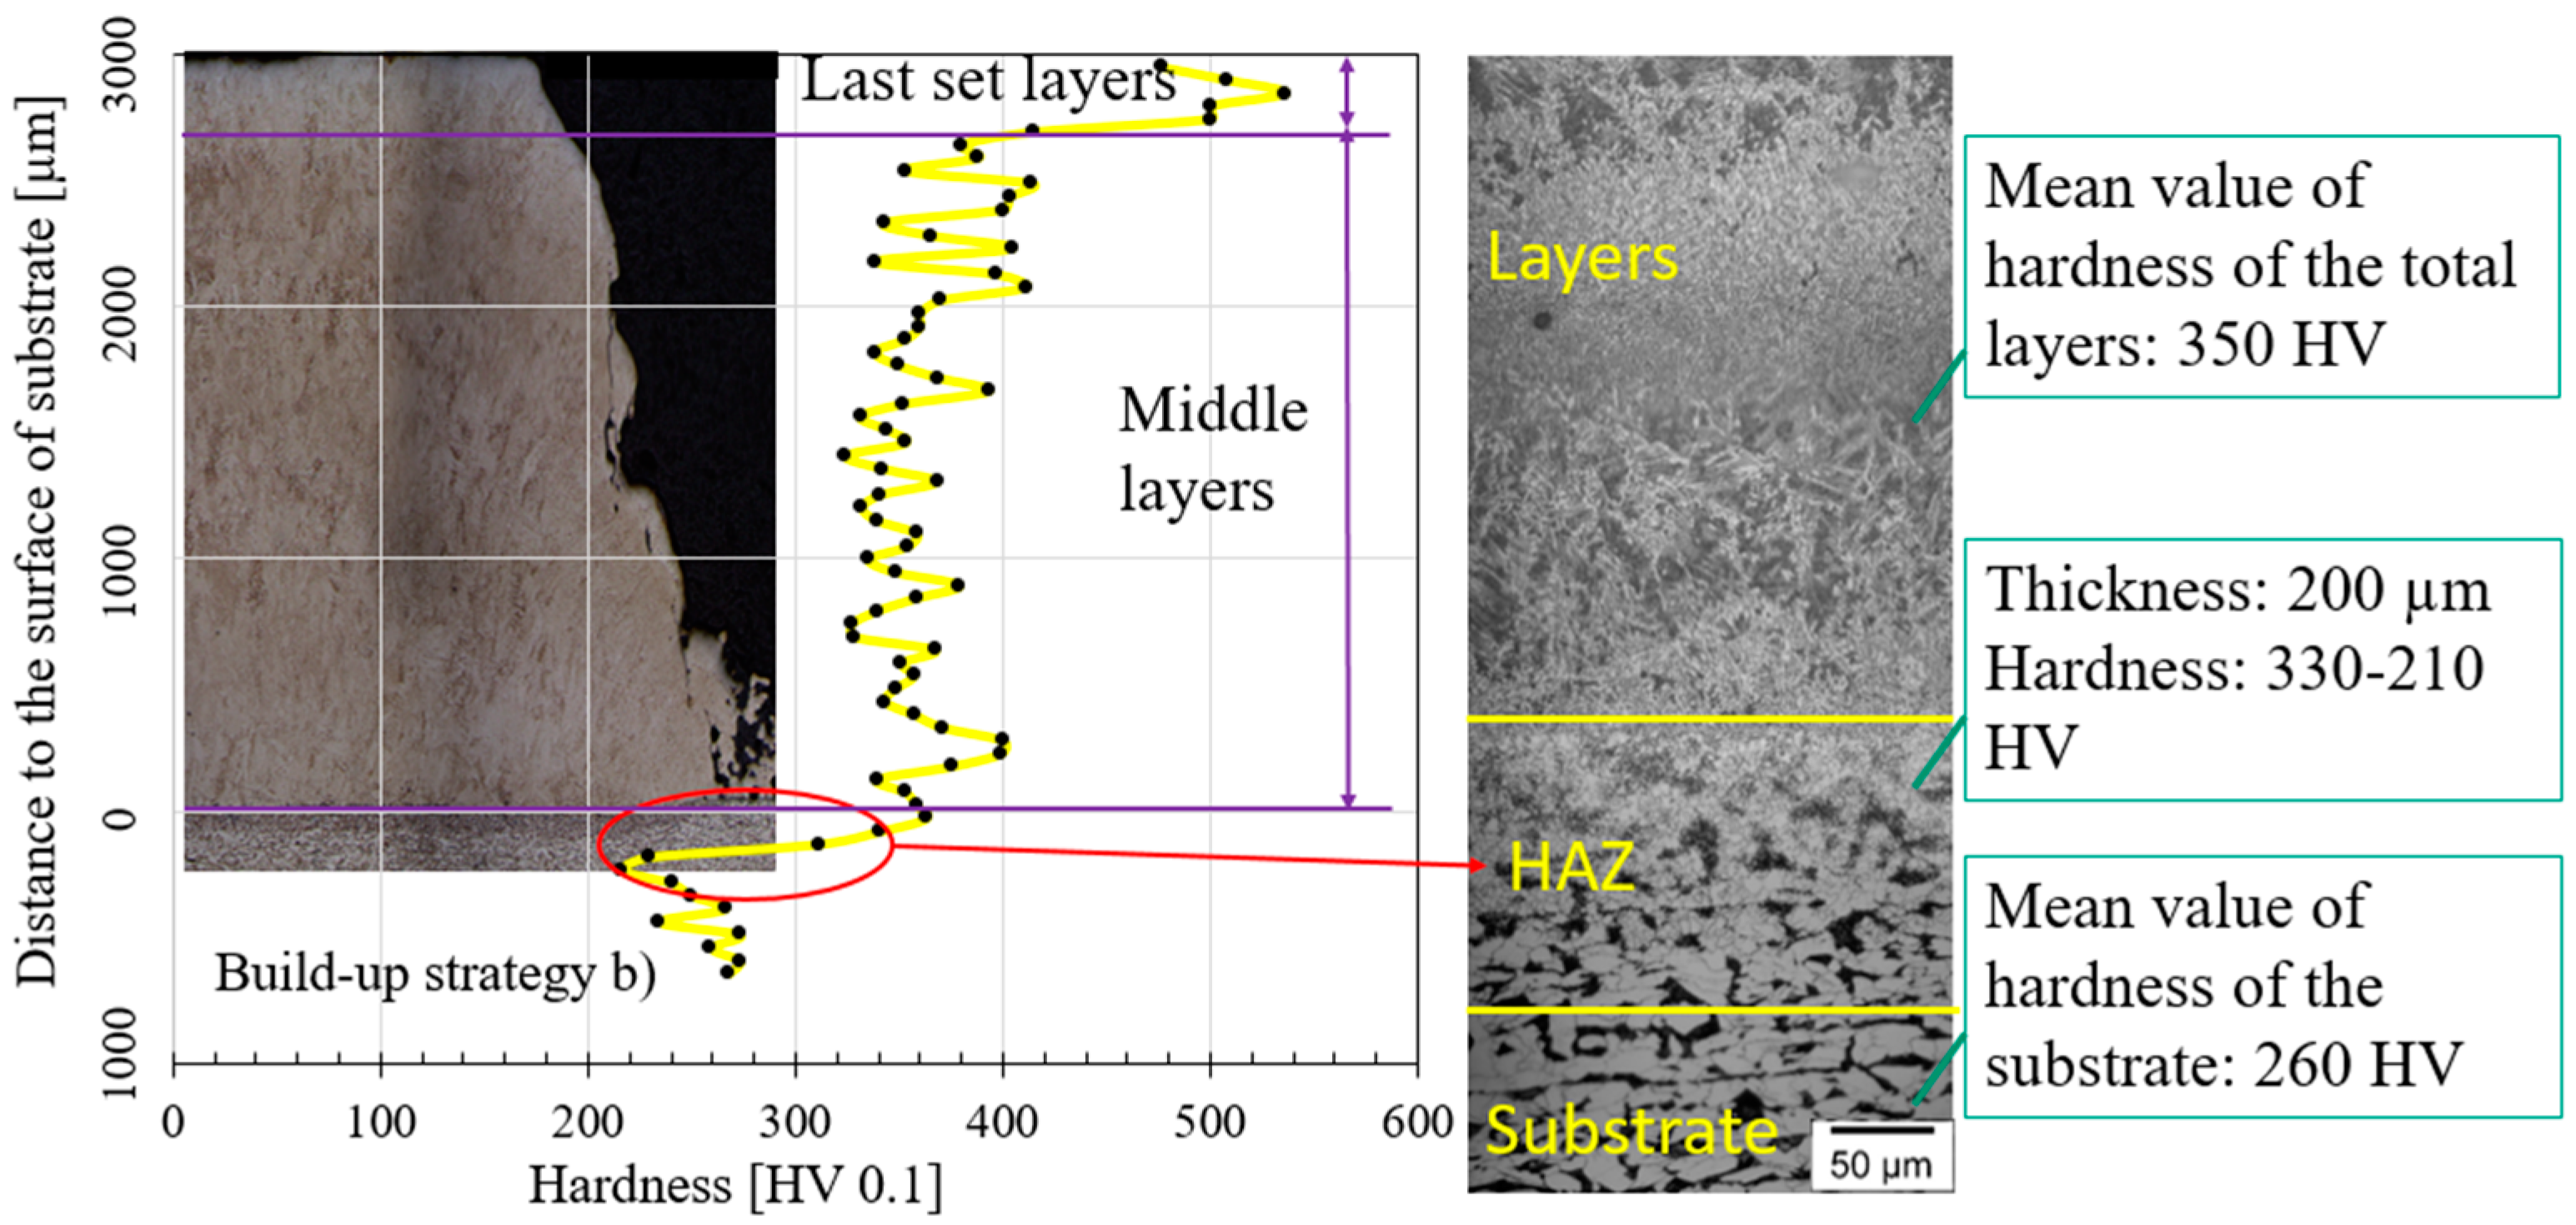
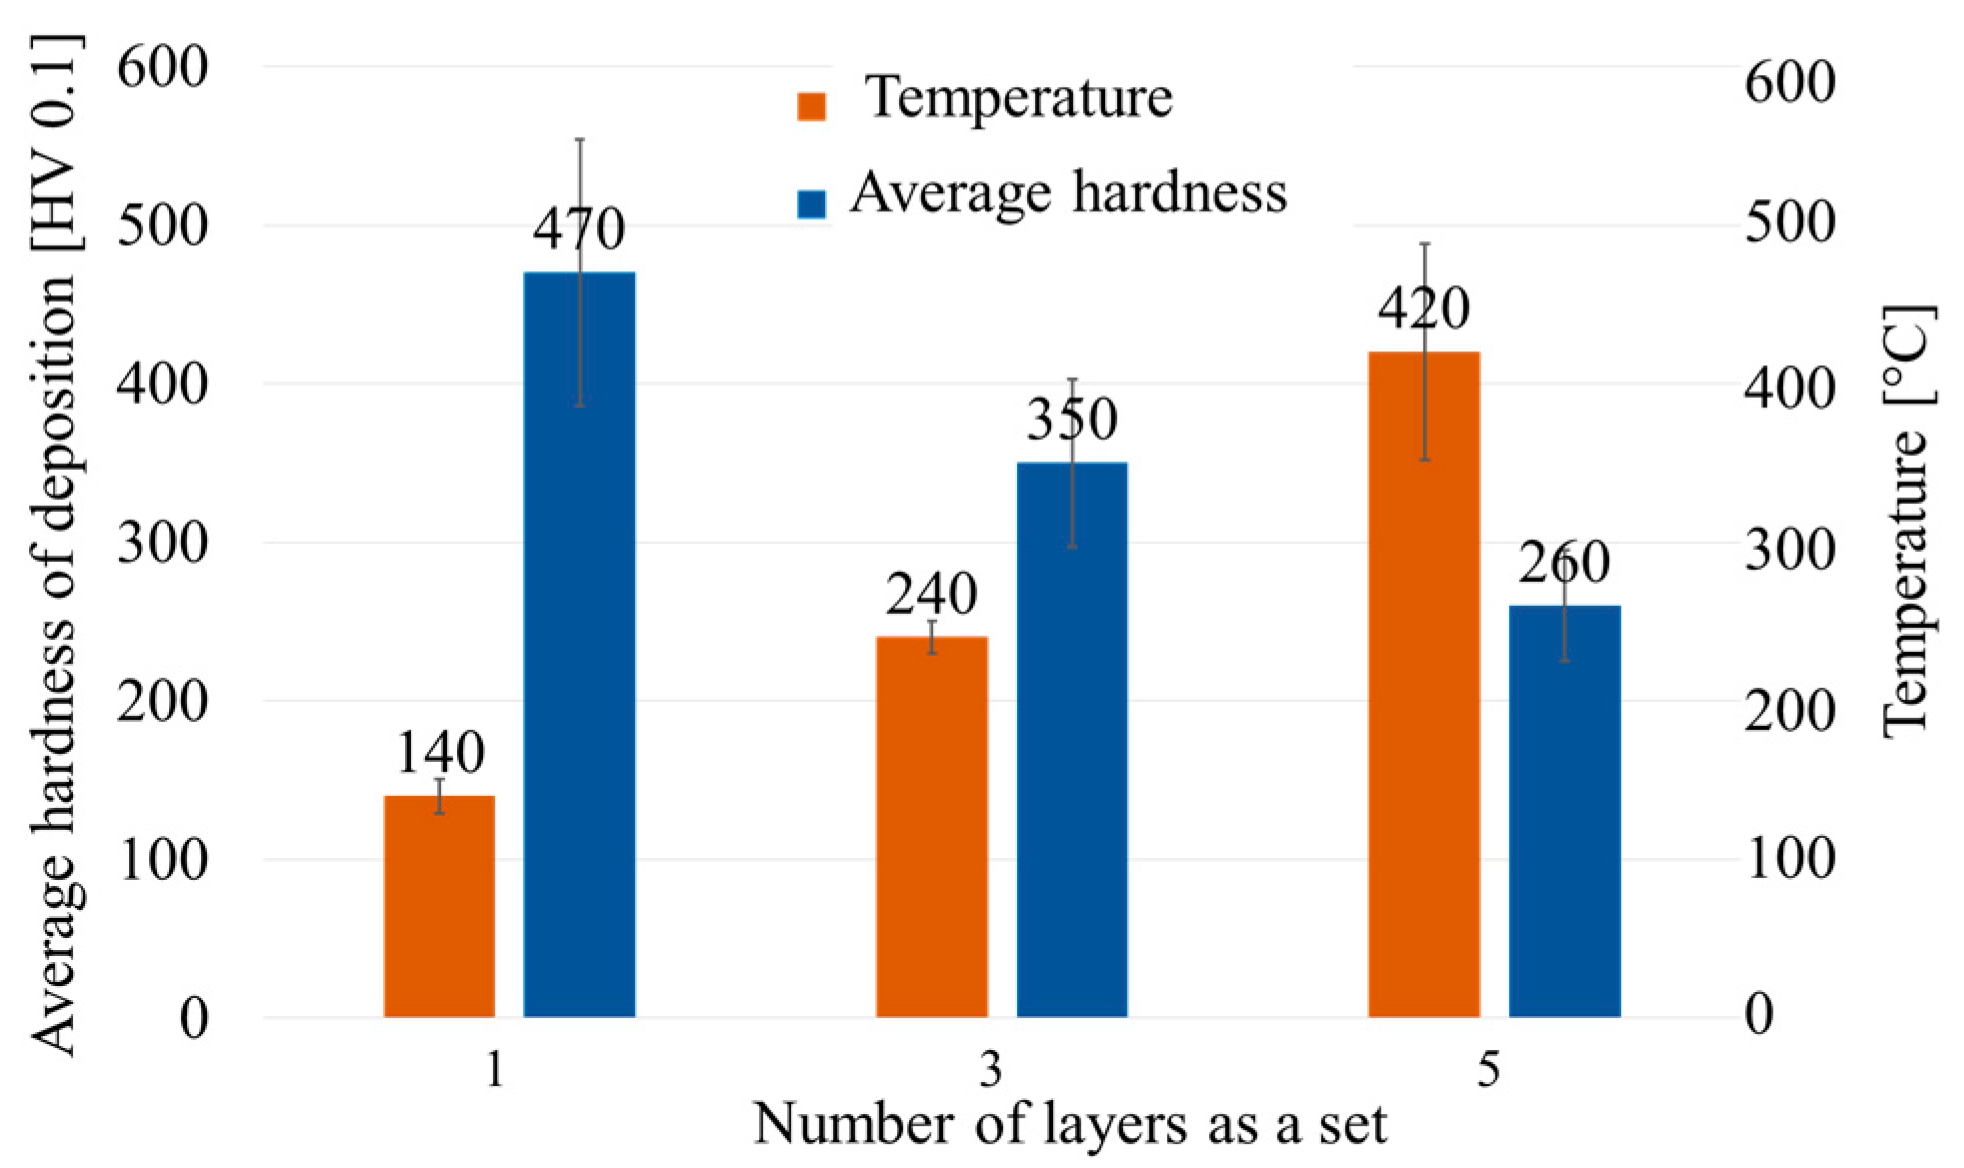
- The hardness measurement shows that hardness is reduced when the number of layers in a set increases between each cooling period. The build-up strategy with cooling time after each layer produces the highest hardness, having a value between 450 and 550 HV 0.1, while the build-up of five layers as a set produces a hardness range of 250 to 350 HV 0.1. The thickness of the heat affected zone is approximately 150 µm for build-up strategy a, 200 µm for build-up strategy b, and 400 µm for build-up strategy c.
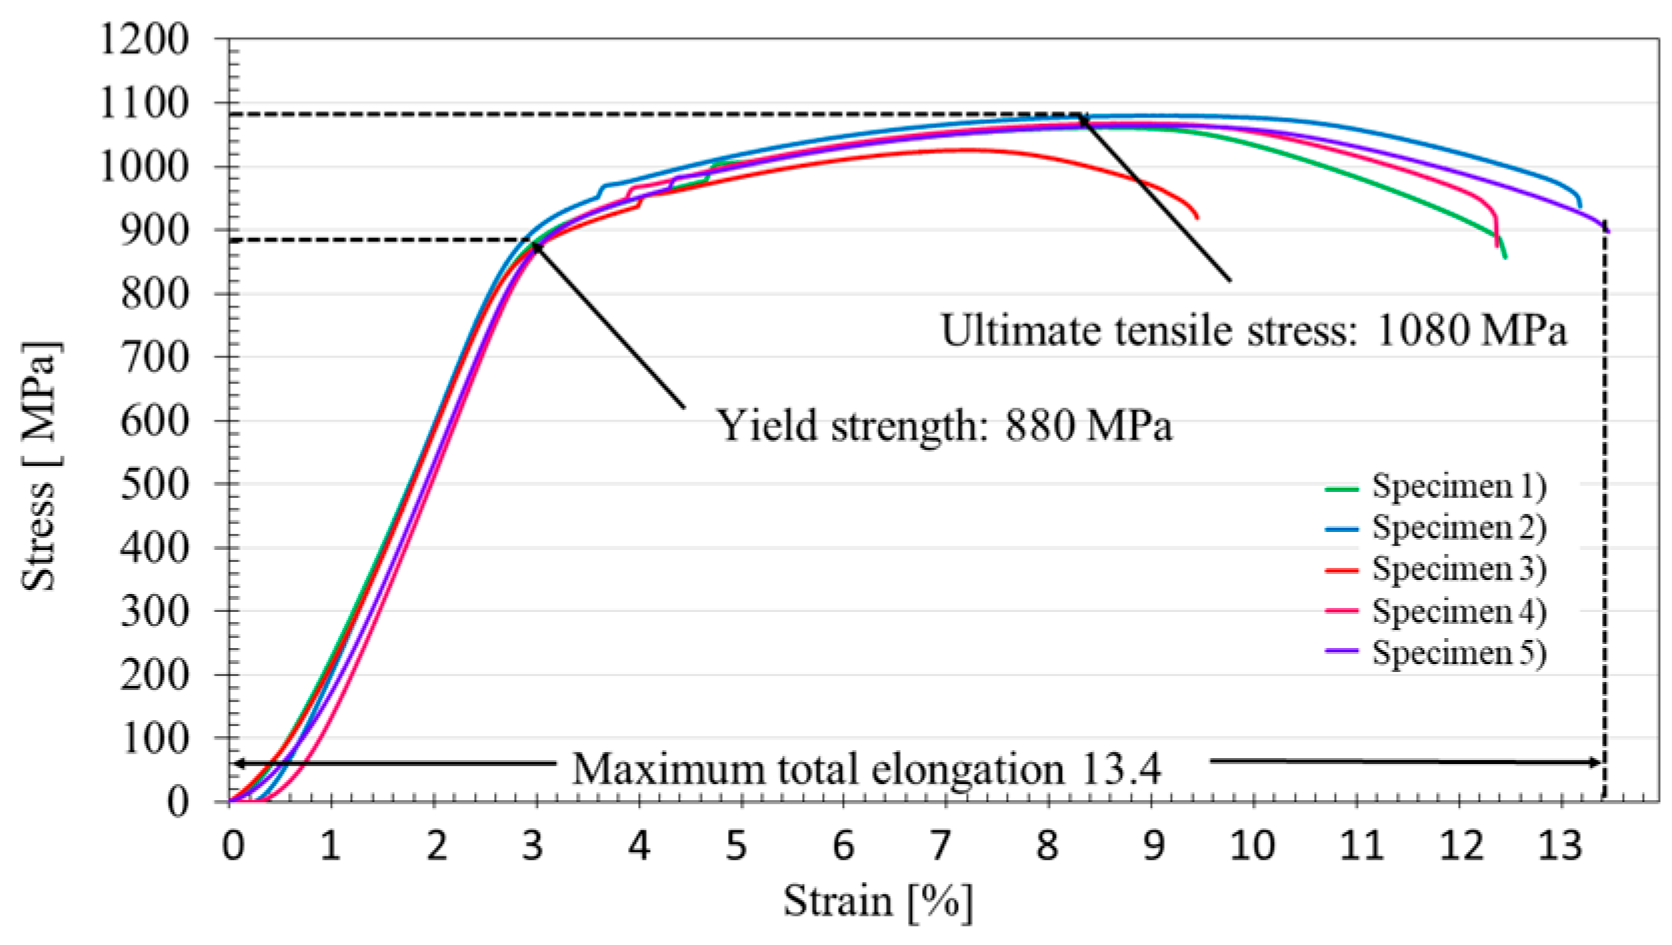
- Tensile specimens of build-up volumes show that the yield strength and tensile strength of AISI 4340 samples manufactured by EHLA present superior properties than the forged material. This research gives a simplified thermo-metallurgical scheme for applying the EHLA process to deposit AISI 4340 volumes.
- EHLA process is sufficient to deposit AISI 4340 material onto an E355 substrate with good metallurgical quality. Build-up strategy c with smallest porosity and highest productivity provides a potential way for the build-up of AISI 4340 material.
Author Contributions
Funding
Conflicts of Interest
References
- Torres, M.A.S.; Voorwald, H.J.C. An evaluation of shot peening, residual stress and stress relaxation on the fatigue life of AISI 4340 steel. Int. J. Fatigue 2002, 24, 877–886. [Google Scholar] [CrossRef]
- Pape, J.A.; Neu, R.W. A comparative study of the fretting fatigue behavior of 4340 steel and PH 13-8 Mo stainless steel. Int. J. Fatigue 2007, 29, 2219–2229. [Google Scholar] [CrossRef]
- Lee, W.-S.; Su, T.T. Mechanical properties and microstructural features of AISI 4340 high-strength alloy steel under quenched and tempered conditions. J. Mater. Process. Technol. 1999, 87, 198–206. [Google Scholar] [CrossRef]
- Maiti, S.K.; Kishore, G.K.; Mourad, A.H.-I. Bilinear CTOD/CTOA scheme for characterisation of large range mode I and mixed mode stable crack growth through AISI 4340 steel. Nucl. Eng. Des. 2008, 238, 3175–3185. [Google Scholar] [CrossRef]
- Voorwald, H.J.C.; Padilha, R.; Costa, M.Y.P.; Pigatin, W.L.; Cioffi, M.O.H. Effect of electroless nickel interlayer on the fatigue strength of chromium electroplated AISI 4340 steel. Int. J. Fatigue 2007, 29, 695–704. [Google Scholar] [CrossRef]
- Bonora, R.G.; Voorwald, H.J.C.; Cioffi, M.O.H.; Junior, G.S.; Santos, L.F.V. Fatigue in AISI 4340 steel thermal spray coating by HVOF for aeronautic application. Procedia Eng. 2010, 2, 1617–1623. [Google Scholar] [CrossRef]
- Wu, Z.; Huang, C.; Liu, F.; Xia, C.; Ke, L. Microstructure and mechanical properties of 34crnimo6 steel repaired by friction stir processing. Materials 2019, 12, 279. [Google Scholar] [CrossRef] [PubMed]
- Nowotny, S.; Scharek, S.; Beyer, E.; Richter, K.-H. Laser beam build-up welding: Precision in repair, surface cladding, and direct 3D metal deposition. J. Therm. Spray Technol. 2007, 16, 344–348. [Google Scholar] [CrossRef]
- Sexton, L.; Lavin, S.; Byrne, G.; Kennedy, A. Laser cladding of aerospace materials. J. Mater. Process. Technol. 2002, 122, 63–68. [Google Scholar] [CrossRef]
- Paydas, H.; Mertens, A.; Carrus, R.; Lecomte-Beckers, J.; Tchuindjang, J.T. Laser cladding as repair technology for Ti–6Al–4V alloy: Influence of building strategy on microstructure and hardness. Mater. Des. 2015, 85, 497–510. [Google Scholar] [CrossRef]
- Sun, S.D.; Liu, Q.; Brandt, M.; Luzin, V.; Cottam, R.; Janardhana, M.; Clark, G. Effect of laser clad repair on the fatigue behaviour of ultra-high strength AISI 4340 steel. Mater. Sci. Eng. A 2014, 606, 46–57. [Google Scholar] [CrossRef]
- Chew, Y.; Pang, J.H.L.; Bi, G.; Song, B. Effects of laser cladding on fatigue performance of AISI 4340 steel in the as-clad and machine treated conditions. J. Mater. Process. Technol. 2017, 243, 246–257. [Google Scholar] [CrossRef]
- Sun, G.; Zhou, R.; Lu, J.; Mazumder, J. Evaluation of defect density, microstructure, residual stress, elastic modulus, hardness and strength of laser-deposited AISI 4340 steel. Acta Mater. 2015, 84, 172–189. [Google Scholar] [CrossRef]
- Digital Photonic Production along the Lines of Industry 4.0. Available online: https://www.spiedigitallibrary.org/conference-proceedings-of-spie/10519/1051907/Digital-photonic-production-along-the-lines-of-industry-40/10.1117/12.2292316.short (accessed on 20 November 2019).
- Schopphoven, T.; Gasser, A.; Backes, G. EHLA: Extreme High-Speed Laser Material Deposition: Economical and effective protection against corrosion and wear. Laser Tech. J. 2017, 14, 26–29. [Google Scholar] [CrossRef]
- Matthiesen, G. Additive manufacturing processes in fluid power–properties and opportunities demonstrated at a flow-optimized fitting. In Proceedings of the 2018 International Conference on Hydraulics and Pneumatics – HERVEX, Băile Govora, Romania, 7–9 November 2018; pp. 12–23. [Google Scholar]
- Liu, Q.; Janardhana, M.; Hinton, B.; Brandt, M.; Sharp, K. Laser cladding as a potential repair technology for damaged aircraft components. Int. J. Struct. Integr. 2011, 2, 314–331. [Google Scholar] [CrossRef]
- ISO 6892-1: 2016: Metallic Materials—Tensile Testing—Part 1: Method of Test at Room Temperature; ISO: Geneva, Switzerland, 2016.
- ISO 6892-1: 2009: Metallic Materials—Tensile Testing—Part 1: Method of Test at Room Temperature; ISO: Geneva, Switzerland, 2009.
- Dodds, S.; Jones, A.H.; Cater, S. Tribological enhancement of AISI 420 martensitic stainless steel through friction-stir processing. Wear 2013, 302, 863–877. [Google Scholar] [CrossRef]
- Materkowski, J.P.; Krauss, G. Tempered martensite embrittlement in SAE 4340 steel. Metall. Trans. A 1979, 10, 643–1651. [Google Scholar] [CrossRef]
- McDaniels, R.L.; White, S.A.; Liaw, K.; Chen, L.; McCay, M.H.; Liaw, P.K. Effects of a laser surface processing induced heat-affected zone on the fatigue behavior of AISI 4340 steel. Mater. Sci. Eng. A 2008, 485, 500–507. [Google Scholar] [CrossRef]
- Costa, L.; Vilar, R.; Reti, T.; Deus, A.M. Rapid tooling by laser powder deposition: Process simulation using finite element analysis. Acta Mater. 2005, 53, 3987–3999. [Google Scholar] [CrossRef]
- Capello, E.; Colombo, D.; Previtali, B. Repairing of sintered tools using laser cladding by wire. J. Mater. Process. Technol. 2005, 164, 990–1000. [Google Scholar] [CrossRef]


| Laser Power [W] | Scanning Speed [m/min] | Carrier Gas Flow Ar [L/min] | Offset between Two Adjacent Tracks [mm/360°] | Shielding Gas Flow Ar [L/min] | Powder Mass Flow [g/min] | Diameter of Laser Beam [mm] | Laser Power Density [W/cm2] | Wave Length [nm] |
|---|---|---|---|---|---|---|---|---|
| 2200 | 30 | 5.5 | 0.35 | 10 | 18.6 | 1.2 | 1.95 × 10⁵ | 900–1100 |
| Fe | C | Nb | Al | Si | Mn | S | P |
|---|---|---|---|---|---|---|---|
| Bal. | 0.175 | 0.012 | 0.028 | 0.18 | 1.33 | 0.004 | 0.013 |
| Fe | C | Cr | Ni | Mo | Si | Mn | S | P |
|---|---|---|---|---|---|---|---|---|
| Bal. | 0.38–0.43 | 0.7–0.9 | 1.65–2.00 | 0.2–0.3 | 0.15–0.35 | 0.6–0.8 | 0.03 | 0.03 |
© 2019 by the authors. Licensee MDPI, Basel, Switzerland. This article is an open access article distributed under the terms and conditions of the Creative Commons Attribution (CC BY) license (http://creativecommons.org/licenses/by/4.0/).
Share and Cite
Li, T.; Zhang, L.; Bultel, G.G.P.; Schopphoven, T.; Gasser, A.; Schleifenbaum, J.H.; Poprawe, R. Extreme High-Speed Laser Material Deposition (EHLA) of AISI 4340 Steel. Coatings 2019, 9, 778. https://doi.org/10.3390/coatings9120778
Li T, Zhang L, Bultel GGP, Schopphoven T, Gasser A, Schleifenbaum JH, Poprawe R. Extreme High-Speed Laser Material Deposition (EHLA) of AISI 4340 Steel. Coatings. 2019; 9(12):778. https://doi.org/10.3390/coatings9120778
Chicago/Turabian StyleLi, Tianci, Lele Zhang, Gregor Gilles Pierre Bultel, Thomas Schopphoven, Andres Gasser, Johannes Henrich Schleifenbaum, and Reinhart Poprawe. 2019. "Extreme High-Speed Laser Material Deposition (EHLA) of AISI 4340 Steel" Coatings 9, no. 12: 778. https://doi.org/10.3390/coatings9120778
APA StyleLi, T., Zhang, L., Bultel, G. G. P., Schopphoven, T., Gasser, A., Schleifenbaum, J. H., & Poprawe, R. (2019). Extreme High-Speed Laser Material Deposition (EHLA) of AISI 4340 Steel. Coatings, 9(12), 778. https://doi.org/10.3390/coatings9120778