Communication

Application of Confocal Raman Microscopy for the Analysis of the Distribution of Wood Preservative Coatings

Department of Wood Improvement, Forestry and Forest Products Research Institute, Forest Research and Management Organization, Matsunosato 1, Tsukuba, Ibaraki 305-8687, Japan
*
Author to whom correspondence should be addressed.
Coatings 2019, 9(10), 621; https://doi.org/10.3390/coatings9100621
Submission received: 30 August 2019 / Revised: 20 September 2019 / Accepted: 27 September 2019 / Published: 27 September 2019
(This article belongs to the Special Issue Recent Developments and Trends in Wood Coatings)

Abstract

:
The distribution of wood preservative coatings in wood surface layer was assessed at the cellular level using confocal Raman microscopy. Raman images were created based on the fingerprint Raman bands of the different wood polymers and coating components (resin and pigment). The wood cell walls and the distribution of the resin and pigment were clearly visualized at the same time. It was concluded that confocal Raman microscopy is suitable for the evaluation of the microdistribution of wood coatings, providing valuable information for the improvement of wood coating technology.

1. Introduction

Wood products in outdoor conditions need to be protected from the effects of weathering and fungal decay [1,2]. The use of protective coatings on wood surfaces is an effective and simple way to improve their durability and performance. However, for long-term applications in outdoor environments, coating film defects, such as cracking and peeling, are unavoidable. Therefore, periodic maintenance is required, and many studies aiming to improve the service life of wood coatings have been performed [3,4,5,6].
It is now known that weathering performance of wood coating systems is usually affected by the wood species, grain orientation, thickness of latewood bands, and moisture content [7,8]. In addition, the durability of wood surfaces may be improved when the light-shielding degree of the coating [9] and its absorption into the wood [10] are high. Furthermore, the microscopic distribution of the coating components that penetrate the wood may also be an important factor in the wood performance [11].
The penetration behavior of coating systems on the subsurface layers of wood tissues and the interaction at the wood/coating interface has been examined using a variety of microscopic techniques, such as fluorescence microscopy [12,13,14,15], scanning electron microscopy [14,16,17,18,19], confocal laser scanning microscopy [20,21], autoradiography [18], and X-ray tomography [22,23].
In recent years, there has been an increase in the use of wood preservative semitransparent coatings that keep the inherent grain and texture of the wood for outdoor applications in Japan. This type of coatings is generally composed of a resin, a pigment, and a small number of functional agents, but the microscopic techniques mentioned above do not allow to simultaneously visualize the distribution of these coating components.
Confocal Raman microscopy is a powerful tool for evaluating the microdistribution of chemical components in organic and inorganic materials with a high spatial resolution and without pretreatment [24]. This technique allows for the simultaneous observation of the distribution of different chemical components. Therefore, there are no changes in the conditions of the sample that may arise from using different measurement equipment for a single sample; furthermore, it is possible to perform the examination at the same field of view. Confocal Raman microscopy has been only recently used in the field of wood science for the topochemical analyses of native [25,26], degraded [27,28,29], and modified wood cell walls [30,31]. In this work, we applied a confocal micro-Raman system to evaluate the distribution of different components from wood preservative coatings at the cellular scale.

2. Materials and Methods

2.1. Samples Preparation

Wood specimens were obtained from the heartwood of air-dried Japanese cedar (Cryptomeria japonica D. Don). These samples were cut into 140 mm × 70 mm × 10 mm panels (longitudinal × radial × tangential). The radial surface of each panel was smoothed with a wood planer and then brush-coated with an alkyd-based solvent-borne wood preservative semitransparent coating. After drying for 2 weeks at ambient temperature, the coated panels were cut into small blocks (approximately 5 mm × 5 mm × 5 mm). Then, the blocks were dipped in water for transverse microtome sectioning through the wood-coating interface to obtain 15-µm-thick slices. The thin sections were preserved between a glass slide and a coverslip using a drop of water.

2.2. Confocal Raman Microscopy Measurements

The thin sections were analyzed using a confocal micro-Raman system (LabRAM ARAMIS, Horiba Jobin Yvon, Longjumeau, France) equipped with a microscope (BX41, Olympus, Tokyo, Japan), a 100× oil immersion objective (UPLSAPO, NA = 1.40, Olympus), and a helium-neon laser (λ = 633 nm, Melles Griot, Rochester, NY, USA). The theoretical (diffraction-limited) lateral resolution on the sample was approximately 0.28 µm (0.61 λ/NA), where λ is the wavelength of the laser and NA is the numerical aperture of the objective lens. The incident laser power on the sample was approximately 11 mW. Raman scattered light was detected by a charge-coupled device (CCD) camera placed behind a 300 lines/mm grating. The confocal aperture diameter was 300 µm in all experiments. The Raman spectra were recorded from 10 cycles in every point of analysis; each cycle consisting of a 0.5 s integration time for one spot. Ten spectra were obtained and averaged, then the averaged spectra from 10 different locations were again averaged. For Raman mapping, measurements were conducted with a 0.5 µm step, and the spectra were obtained by averaging 4 cycles, each with a 0.4 s integration time.
The LabSpec5 software (Horiba Jobin Yvon) was used for data acquisition and analysis. To remove the fluorescence background, raw spectral data were baseline-corrected. To reduce spectral noise, smoothing was performed using the Savizky–Golay algorithm.

3. Results and Discussion

Figure 1 shows the cross-sectional light micrograph of the near-surface region of coated wood and the Raman spectra acquired from three different morphological regions. Several bands at the low-frequency range, from 200 to 600 cm−1, were found in the colored surface layer (Figure 1a). These are typical of pigments with ferric hydroxide [32,33]. Additional small bands at the range from 900 to 1800 cm−1 were also observed in the coating-filled cell lumen (Figure 1c) and can be assigned to the alkyd resin [34]. The spectrum of the middle layer of the secondary cell wall (S2), which is distributed near the surface (Figure 1b), showed no additional bands than those attributed to cell wall polymers, such as cellulose, hemicelluloses, and lignin [35]. This suggests that the coating components evaluated are hardly able to penetrate the cell wall.
To visualize the distribution of the resin and pigment, fingerprint bands of both components and of the cell wall were selected from the spectra in Figure 1 so that they did not overlap. Bands in Raman mapping were assigned according to the literature (Table 1). The ferric hydroxide pigment has an intense band at 386 cm−1 due to Fe−O−Fe/−OH symmetric stretching [32,33], but it overlapped with the cellulose signal at 379 cm−1 [35]. Therefore, a second intense band at 295 cm−1 due to Fe−OH symmetric bending [32,33] was selected for pigment mapping. The alkyd resin and cell wall images were respectively constructed based on a clear carbonyl stretching band at 1726 cm−1 [34] and the coniferyl aldehyde signal at 1139 cm−1 [35]. The band around 1726 cm−1 is also assigned to the carbonyl stretching in xylan [36], but this band can be hardly detected in softwood cell walls [37].
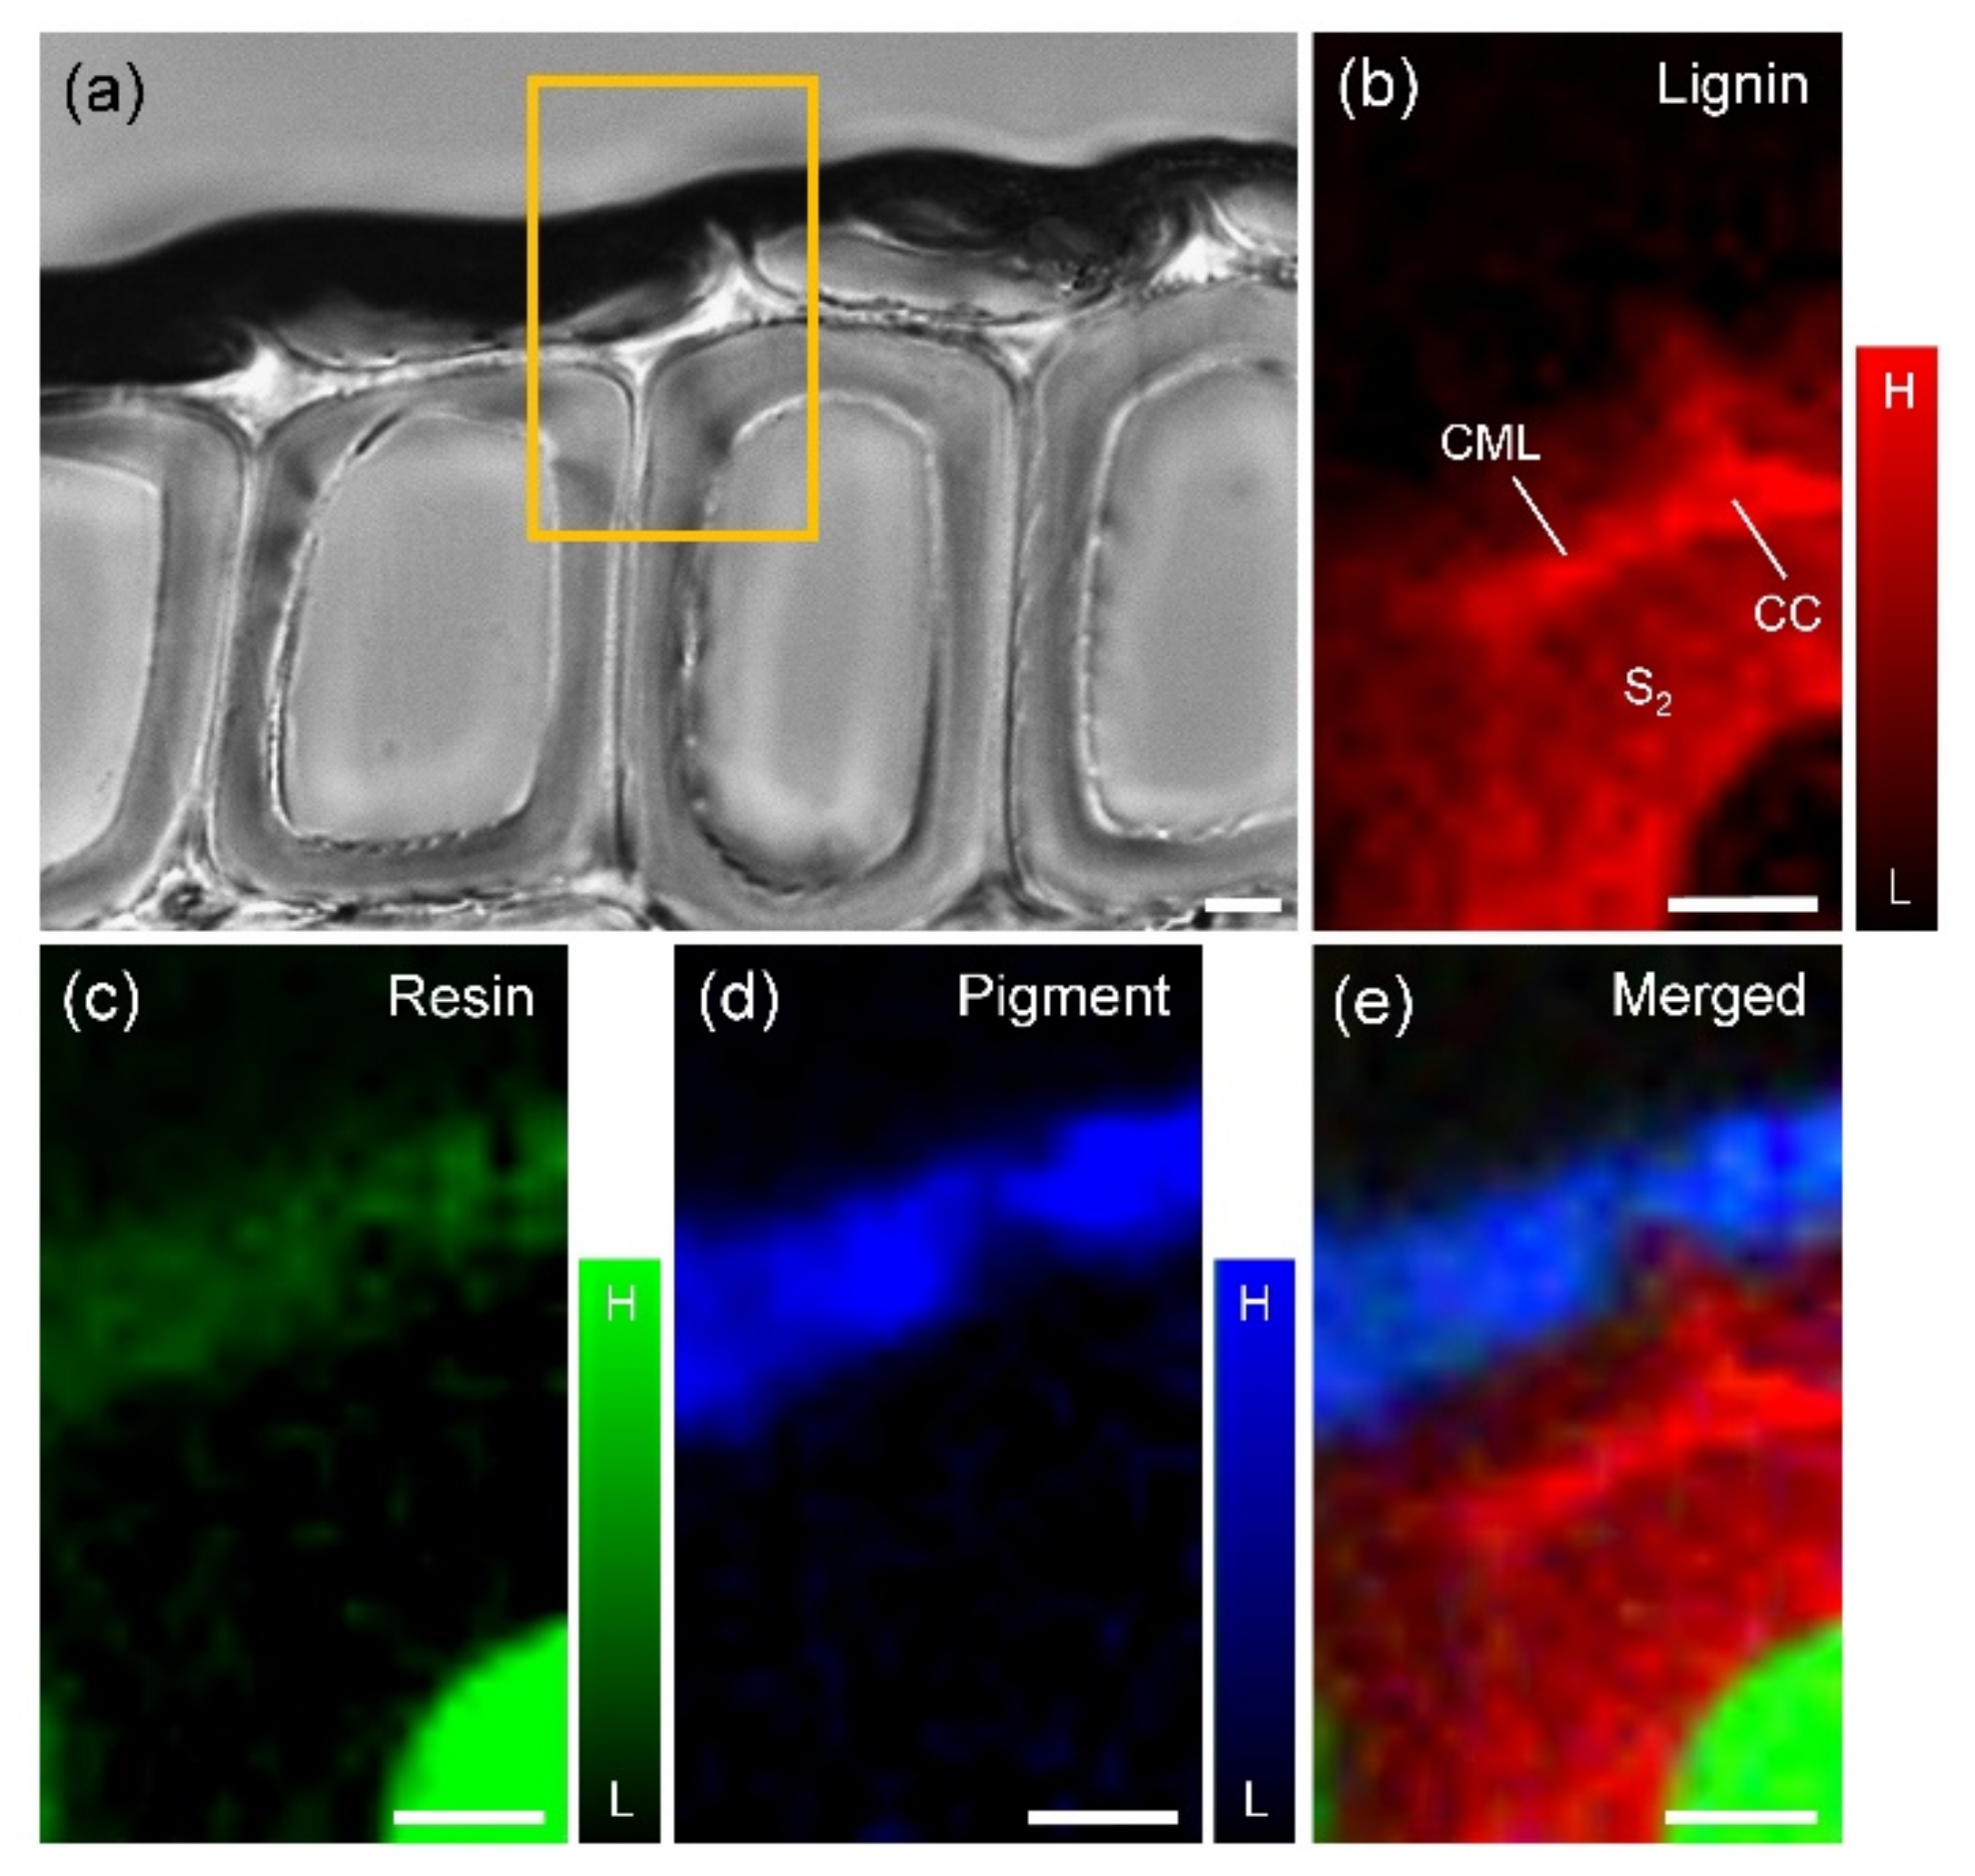
Figure 2 presents the Raman mapping around the coated wood surface. The area selected for mapping is enclosed in the orange rectangle in Figure 2a. The distribution of lignin (Figure 2b) indicates that the compound middle lamella (CML) and cell corner (CC) are highly lignified whereas S2 has low lignin content. The distribution of alkyd resin is shown in Figure 2c. The cell lumen was filled with a large amount of resin, while the colored surface layer had a small amount of resin. However, no resin signal was detected throughout the cell wall region. Figure 2d shows the distribution of pigment, which was only detected the outermost surface layer. In this layer, the distribution of pigment and resin was similar. The resin in the surface layer works as an adhesive to fix the pigment.
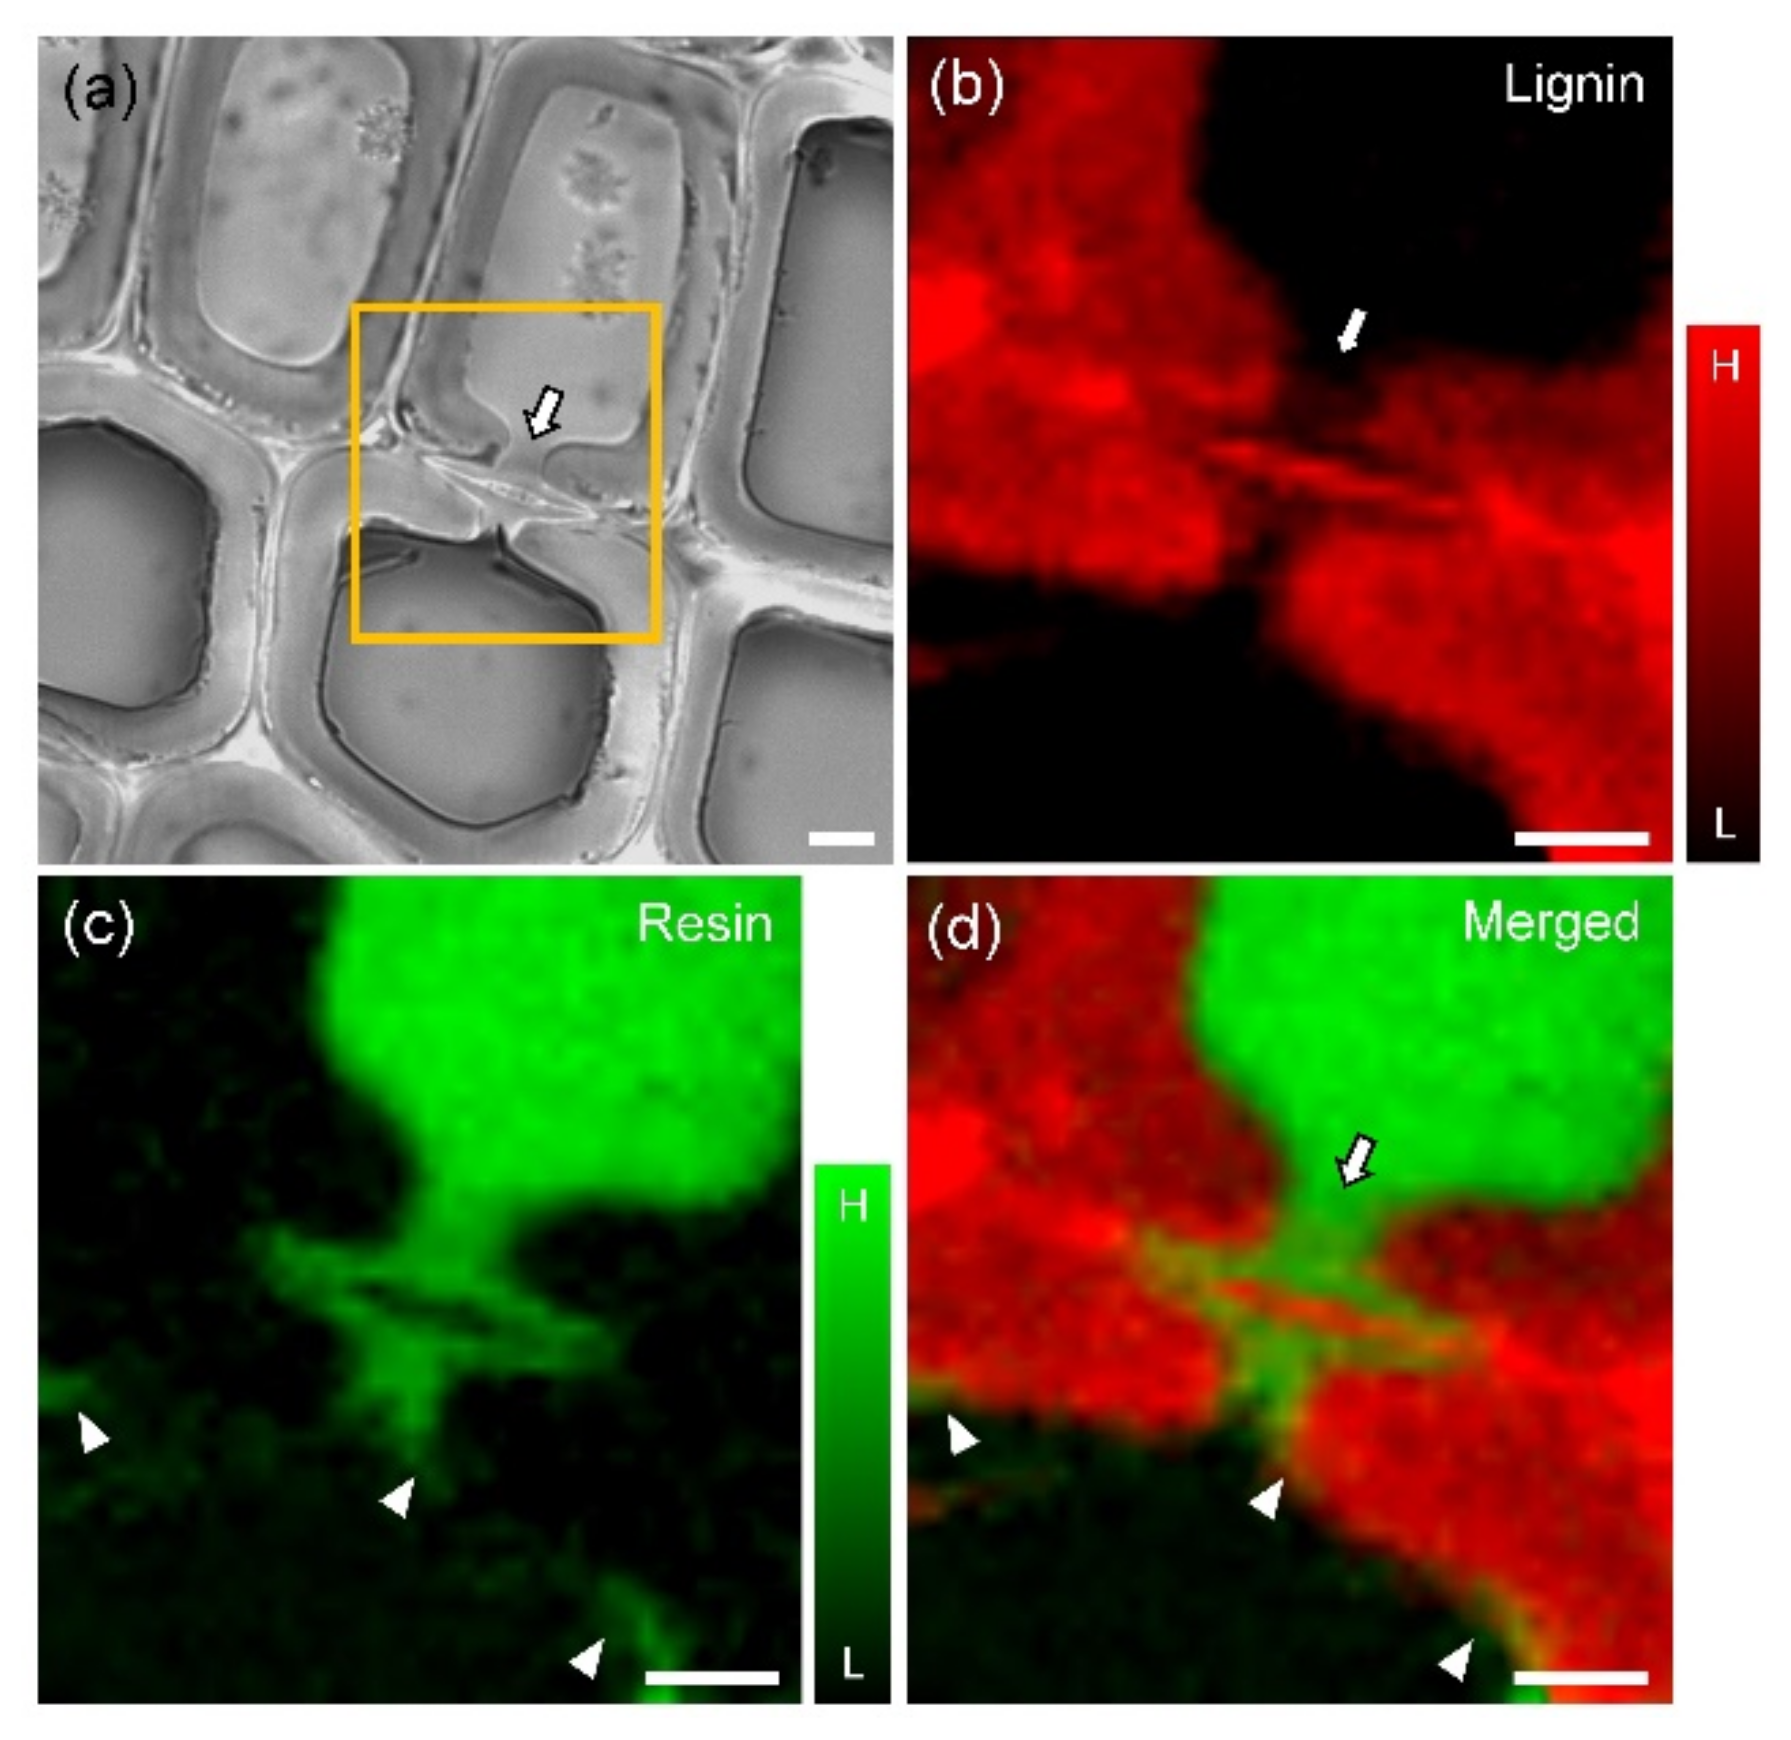
Figure 3 shows the Raman images obtained from the boundary region, which is divided by a bordered pit (indicated by arrows) between the resin-filled and unfilled cell walls. The bordered pit can be clearly visualized in the lignin mapping image (Figure 3b). The penetration of the alkyd resin was observed in Figure 3c,d: it penetrated from the resin-filled cell side to the unfilled one through the bordered pit. In addition, the resin was widely spread in a thin layer along the internal surface of the unfilled cell lumen (indicated by arrowheads). It was not possible to observe the thin resin layer with light microscopy (Figure 3a).
Williams et al. have referred to the effect of wood species on the performance of wood coating systems [7]. Since the wood properties, including tissue morphology and chemical composition, differ in different wood species [38], the permeability of coating components may differ according to wood species. Therefore, further studies will be necessary to address this issue.

4. Conclusions

This work demonstrates that confocal Raman microscopy is a valuable tool in the study of wood preservative coatings. The greatest advantage of this technique is that it allows to simultaneously observe the different components of wood coatings at the cellular level. The microdistribution of resin, pigment, and wood polymer could be visualized in the same field of view. Such measurement had never been achieved. In our future work, we plan to investigate the microstructural and topochemical changes in the coating film and cell walls of coated wood during weathering exposure using confocal Raman microscopy. These knowledges will serve to clarify the mechanism of weathering degradation of coated wood and, moreover, will contribute to further develop the wood-coating technology.

Author Contributions

Conceptualization, T.K.; methodology, T.K., A.I., and Y.K.; investigation, T.K., A.I, M.M., M.K., and Y.K.; writing—original draft preparation, T.K.; writing—review and editing, T.K., A.I., M.M., M.K., and Y.K.; funding acquisition, T.K.

Funding

This work was supported by the Japan Society for the Promotion of Science (JSPS) KAKENHI (grant number 17K15299).

Acknowledgments

The authors wish to thank the Kyoto Integrated Science & Technology Bio-Analysis Center (KIST-BIC) for its assistance with the Raman microscopic analysis.

Conflicts of Interest

The authors declare no conflict of interest.

References

  1. Williams, R.S. Weathering of wood. In Handbook of Wood Chemistry and Wood Composites; Rowell, R.M., Ed.; CRC Press: Boca Raton, FL, USA, 2005; pp. 139–185. [Google Scholar]
  2. Evans, P.; Chowdhury, M.J.; Mathews, B.; Schmalzl, K.; Ayer, S.; Kiguchi, M.; Kataoka, Y. Weathering and surface protection of wood. In Handbook of Environmental Degradation of Materials; Kutz, M., Ed.; William Andrew Publishing: Norwich, UK, 2005; pp. 277–297. [Google Scholar]
  3. Blanchard, V.; Blanchet, P. Color stability for wood products during use: Effects of inorganic nanoparticles. BioResources 2011, 6, 1219–1229. [Google Scholar]
  4. Isaji, S.; Kojima, Y. Application of copper monoethanolamine solutions as primers for semitransparent exterior wood stains. Eur. J. Wood Prod 2017, 75, 305–314. [Google Scholar]
  5. Mishra, P.K.; Giagli, K.; Tsalagkas, D.; Mishra, H.; Talegaonkar, S.; Gryc, V.; Wimmer, R. Changing face of wood science in modern era: Contribution of nanotechnology. Recent Pat. Nanotechnol. 2018, 12, 13–21. [Google Scholar] [CrossRef] [PubMed]
  6. Vardanyan, V.; Galstian, T.; Riedl, B. Effect of addition of cellulose nanocrystals to wood coatings on color changes and surface roughness due to accelerated weathering. J. Coat. Technol. Res. 2015, 12, 247–258. [Google Scholar] [CrossRef]
  7. Williams, R.S.; Jourdain, C.; Daisey, G.I.; Springate, R.W. Wood properties affecting finish service life. J. Coat. Technol. 2000, 72, 35–42. [Google Scholar] [CrossRef]
  8. Williams, R.S. Finishing of wood. In Wood Handbook: Wood as an Engineering Material; General Technical Report FPL-GTR-190; Ross, R.J., Ed.; USDA Forest Service: Madison, WI, USA, 2010; pp. 16.1–16.39. [Google Scholar]
  9. Feist, W.C. Role of pigment concentration in the weathering of semitransparent stains. Forest Prod. J. 1988, 38, 41–44. [Google Scholar]
  10. Richter, K.; Feist, W.C.; Knaebe, M.T. The effect of surface roughness on the performance of finishes. Part 1. Roughness characterization and stain performance. Forest Prod. J. 1994, 45, 91–97. [Google Scholar]
  11. Singh, A.P.; Park, B.D.; Nuryawan, A.; Kazayawoko, M. Advances in probing wood-coating interface by microscopy: A review. J. Surf. Eng. Mater. Adv. Technol. 2013, 3, 49–54. [Google Scholar] [CrossRef]
  12. Schneider, M.H.; Cote, W.A. Studies of wood and coating interactions using fluorescence microscopy and pyrolysis gas-liquid chromatography. J. Paint Technol. 1967, 39, 465–471. [Google Scholar]
  13. Cote, W.A.; Robison, R.G. A comparative study of wood-wood coating interaction using incident fluorescence and transmitted fluorescence microscopy. J. Paint Technol. 1968, 40, 427–432. [Google Scholar]
  14. De Meijer, M.; Thurich, K.; Militz, H. Comparative study on penetration characteristics of modern wood coatings. Wood Sci. Technol. 1998, 32, 347–365. [Google Scholar] [CrossRef]
  15. Rijckaert, V.; Stevens, M.; Van Acker, J.; de Meijer, M.; Militz, H. Quantitative assessment of the penetration of water-borne and solvent-borne wood coatings in Scots pine sapwood. Holz Roh Werkst. 2001, 59, 278–287. [Google Scholar] [CrossRef]
  16. Schneider, M.H. Coating penetration into wood substance studied with electron microscopy using replica techniques. J. Coat. Technol. 1970, 42, 457–460. [Google Scholar]
  17. Schneider, M.H. Microscopic distribution of linseed oil after application to wood surface. J. Coat. Technol. 1980, 52, 64–67. [Google Scholar]
  18. Nussbaum, R.M. Penetration of water-borne alkyd emulsion and solvent-borne alkyds into wood. Holz Roh Werkst. 1994, 52, 389–393. [Google Scholar] [CrossRef]
  19. Singh, A.P.; Ratz, A.; Dawson, B.S.W. A novel method for high-resolution imaging of coating distribution within a rough-textured plywood surface. J. Coat. Technol. Res. 2007, 4, 207–210. [Google Scholar] [CrossRef]
  20. Van den Bulcke, J.; Rijckaert, V.; Van Acker, J.; Stevens, M. Quantitative measurement of the penetration of water-borne coatings in wood with confocal lasermicroscopy and image analysis. Holz Roh Werkst. 2003, 61, 303–310. [Google Scholar] [CrossRef]
  21. Singh, A.P.; Dawson, B.S.W. Confocal microscope―A valuable tool for examining wood-coating interface. J. Coat. Technol. Res. 2004, 1, 235–237. [Google Scholar] [CrossRef]
  22. Van den Bulcke, J.; Boone, M.; Van Acker, J.; Van Hoorebeke, L. High-Resolution X-ray imaging and analysis of coatings on and in wood. J. Coat. Technol. Res. 2010, 7, 271–277. [Google Scholar] [CrossRef]
  23. Bessières, J.; Maurin, V.; George, B.; Molina, S.; Masson, E.; Merlin, A. Wood-coating layer studies by X-ray imaging. Wood Sci. Technol. 2013, 47, 853–867. [Google Scholar] [CrossRef]
  24. Smith, E.; Dent, G. Modern Raman Spectroscopy: A Practical Approach; John Wiley & Sons Ltd.: Chichester, UK, 2005. [Google Scholar]
  25. Agarwal, U.P. Raman imaging to investigate ultrastructure and composition of plant cell walls: Distribution of lignin and cellulose in black spruce wood (Picea mariana). Planta 2006, 224, 1141–1153. [Google Scholar] [CrossRef]
  26. Gierlinger, N.; Schwanninger, M. Chemical imaging of poplar wood cell walls by confocal Raman microscopy. Plant Physiol. 2006, 140, 1246–1254. [Google Scholar] [CrossRef] [PubMed]
  27. Kanbayashi, T.; Kataoka, Y.; Ishikawa, A.; Matsunaga, M.; Kobayashi, M.; Kiguchi, M. Depth profiling of photodegraded wood surfaces by confocal Raman microscopy. J. Wood Sci. 2018, 64, 169–172. [Google Scholar] [CrossRef] [Green Version]
  28. Kanbayashi, T.; Kataoka, Y.; Ishikawa, A.; Matsunaga, M.; Kobayashi, M.; Kiguchi, M. Confocal Raman microscopy reveals changes in chemical composition of wood surfaces exposed to artificial weathering. J. Photochem. Photobiol. B Biol. 2018, 187, 136–140. [Google Scholar] [CrossRef] [PubMed]
  29. Belt, T.; Altgen, M.; Mäkelä, M.; Hänninen, T.; Rautkari, L. Cellular level chemical changes in Scots pine heartwood during incipient brown rot decay. Sci. Rep. 2019, 9, 5188. [Google Scholar] [CrossRef] [PubMed]
  30. Keplinger, T.; Cabane, E.; Chanana, M.; Hass, P.; Merk, V.; Gierlinger, N.; Burgert, I. A versatile strategy for grafting polymers to wood cell walls. Acta Biomater. 2015, 11, 256–263. [Google Scholar] [CrossRef]
  31. Ermeydan, M.A. Modification of spruce wood by UV-crosslinked PEG hydrogels inside wood cell walls. React. Funct. Polym. 2018, 131, 100–106. [Google Scholar] [CrossRef]
  32. Legodi, M.A.; de Waal, D. The preparation of magnetite, goethite, hematite and maghemite of pigment quality from mill scale iron waste. Dyes Pigment. 2007, 74, 161–168. [Google Scholar] [CrossRef]
  33. Zięba-Palus, J.; Michalska, A.; Wesełucha-Birczyńska, A. Characterisation of paint samples by infrared and Raman spectroscopy for criminalistics purposes. J. Mol. Struct. 2011, 993, 134–141. [Google Scholar] [CrossRef]
  34. Ellis, G.; Claybourn, M.; Richards, S.E. The application of Fourier transform Raman spectroscopy to the study of paint systems. Spectrochim. Acta A Mol. Biomol. Spectrosc. 1990, 46, 227–241. [Google Scholar] [CrossRef]
  35. Agarwal, U.P. An overview of Raman spectroscopy as applied to lignocellulosic materials. In Advances in Lignocellulosics Characterization; Argyropoulos, D.S., Ed.; TAPPI Press: Atlanta, GA, USA, 1999; pp. 201–225. [Google Scholar]
  36. Himmelsbach, D.S.; Khahili, S.; Akin, D.E. Near-infrared–Fourier-transform–Raman microspectroscopic imaging of flax stems. Vib. Spectrosc. 1999, 19, 361–367. [Google Scholar] [CrossRef]
  37. Agarwal, U.P.; Ralph, S.A. FT-Raman spectroscopy of wood: Identifying contributions of lignin and carbohydrate polymers in the spectrum of black spruce (Picea mariana). Appl. Spectrosc. 1997, 51, 1648–1655. [Google Scholar] [CrossRef]
  38. Fengel, D.; Wegener, G. Wood: Chemistry, Ultrastructure, Reactions; Walter de Gruyter & Co.: Berlin, Germany, 1989. [Google Scholar]
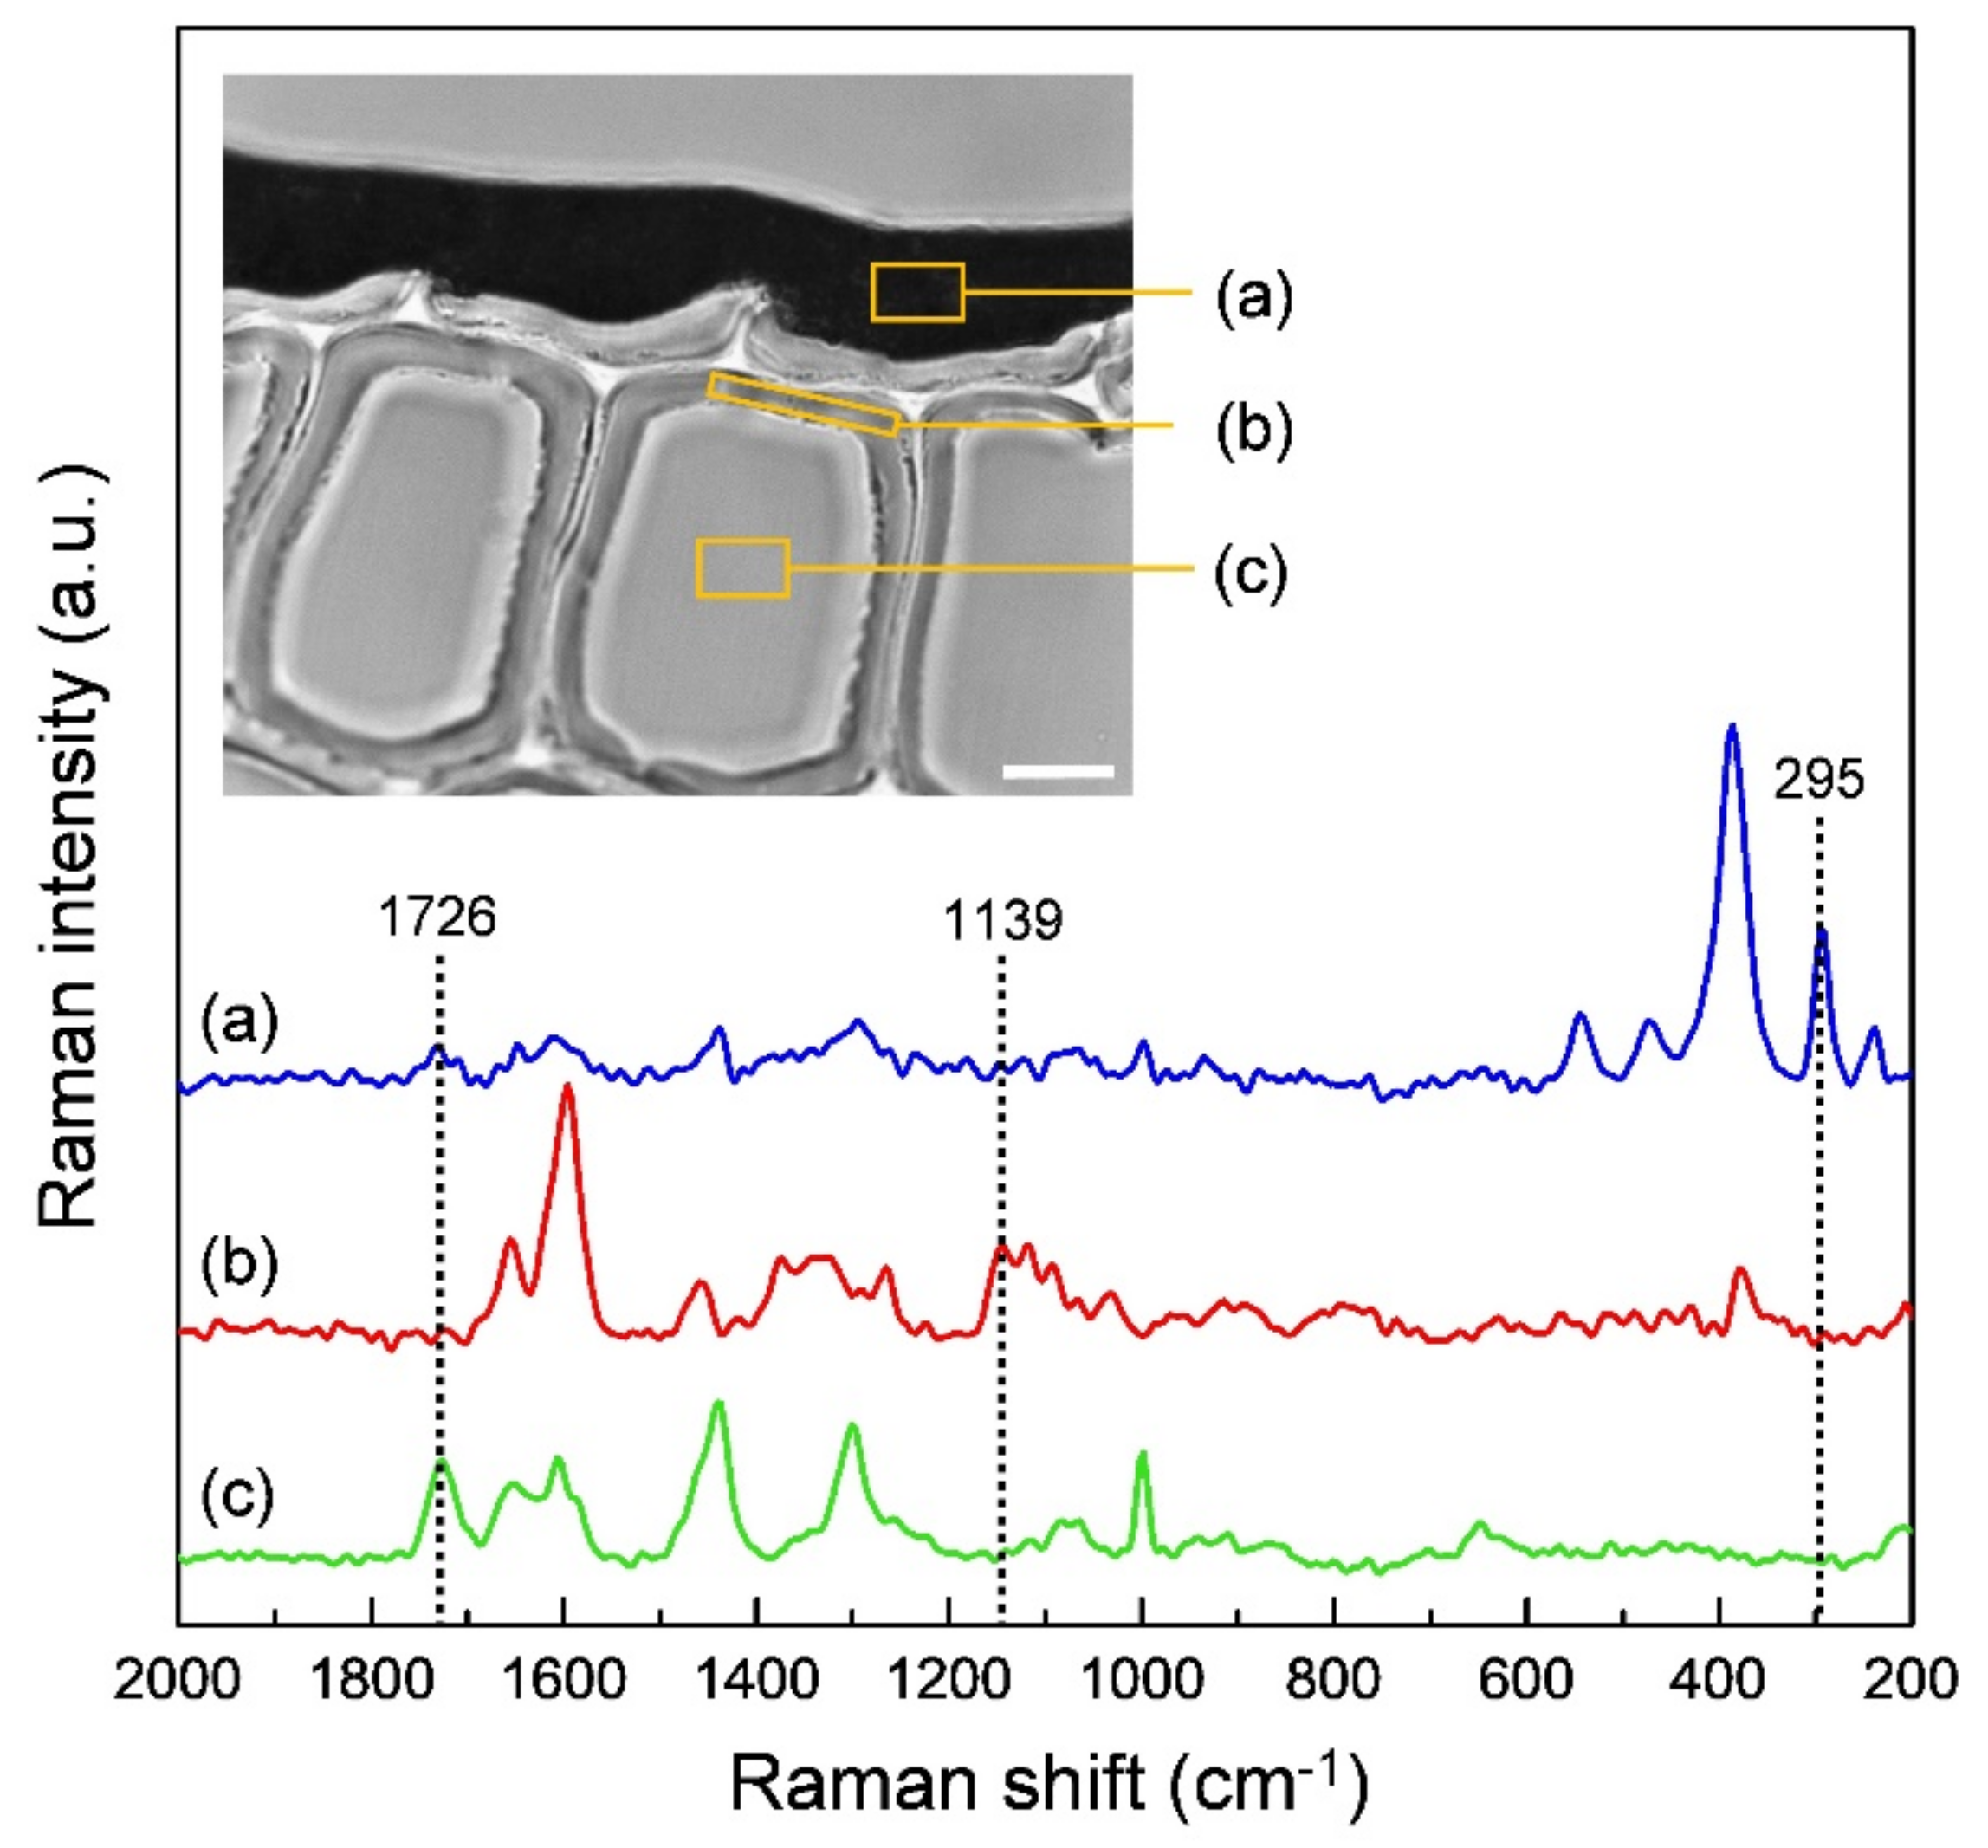
Figure 1. Cross-sectional view of coated wood surface and average Raman spectra obtained from the colored surface layer (a), S2 (b), and coating-filled lumen (c). Scale bar: 10 µm.
Coatings 09 00621 g001
Figure 2. Raman mapping on the cross-section of coated wood surface. Bright-field image shows the area selected for mapping (orange rectangle) (a). Raman images were calculated by integrating the Raman bands from 1132 to 1139 cm−1 (b, lignin), from 1721 to 1734 cm−1 (c, alkyd resin), and from 281 to 309 cm−1 (d, pigment). Merged image is an overlay of the distribution of lignin, alkyd resin, and pigment (e). S2: middle layer of secondary cell wall, CML: compound middle lamella, CC: cell corner. Scale bars: 5 µm.
Coatings 09 00621 g002
Figure 3. Raman mapping on the cross-section of coated wood subsurface layer at approximately 50–100 µm deep. Bright-field image shows the area selected for mapping (orange rectangle) (a). Raman images were calculated by integrating the Raman bands from 1132 to 1139 cm−1 (b, lignin) and from 1721 to 1734 cm−1 (c, alkyd resin). Merged image is an overlay of the distribution of lignin and alkyd resin (d). Arrow: bordered pit, arrowhead: alkyd resin deposited on the internal surface of the cell lumen. Scale bars: 5 µm.
Coatings 09 00621 g003
Table 1. Summary of the Raman bands for preservative coatings and wood components used for Raman mapping.
Raman Band (cm−1)ComponentBand Assignment *
1726Alkyd resinC = O stretch
1139LigninA mode of coniferyl aldehyde
295Ferric hydroxideFe–OH symmetric bend
* Assignments are based on previous works [32,33,34,35].