Article

Development of Anti-Aging and Anticorrosive Nanoceria Dispersed Alkyd Coating for Decorative and Industrial Purposes

Department of Chemistry, Istanbul Technical University, Istanbul 34467, Turkey
*
Author to whom correspondence should be addressed.
Coatings 2019, 9(10), 610; https://doi.org/10.3390/coatings9100610
Submission received: 30 August 2019 / Revised: 16 September 2019 / Accepted: 22 September 2019 / Published: 25 September 2019
(This article belongs to the Section Corrosion, Wear and Erosion)

Abstract

:
This study focuses on nano cerium oxide particles as alternative additives in solvent-based alkyd coatings in order to improve anticorrosive and anti-aging properties. The paint samples were formulated with cerium oxide micro and nanoparticles, and the coating quality characteristics were compared with coating formulated with commercial anticorrosive and UV-aging agents. Formulations were prepared with 3 wt % commercial anticorrosive agent as reference material (RP), 3 wt % cerium oxide microparticles (CER1), 3 wt % and 1% cerium oxide nanoparticles (CER2 and CER3), respectively. The basket milling technique with zirconium balls was used for the preparations of coatings and characterizations were performed by Fourier transform infrared spectroscopy (FTIR), thermogravimetric analysis (TGA), and contact angle measurements. Improvement in the anticorrosive properties was proven with electrochemical impedance spectroscopy (EIS) and accelerated salt spray tests based on ISO 4628 Evaluation of Degradation of Coatings. Furthermore, physical and mechanical tests were run according to standard test methods for coatings and reported. Results showed that cerium oxide particles provide anticorrosive, UV defender, and self-cleaning effects, besides excellent physical resistance to alkyd coatings. The impact of cerium oxide nanoparticles was found to be stronger than those of the microparticles.

Graphical Abstract

1. Introduction

Coatings or paints have been present in human life since ancient times. Currently, the global paints and coatings market is expected to grow by the compound annual growth rate (CAGR) of 5.75% during 2016–2021 and to reach a value of USD 178.8 billion by 2021 [1]. Especially in developing countries, the tendency to renovate commercial and residential buildings is triggering the development of new generation paints which have improved properties against corrosion, dampness, and bacterial effects.
Recently, Ulaeto et al. reviewed the significant advances in corrosion sensing, self-cleaning, anti-fouling, and self-healing polymeric coating systems [2]. According to this review, the presence of nano-sized additives greatly improves coating performance. Anticorrosive coatings will especially progress in tandem with nanotechnology.
Alkyds are the dominant resin in a very broad range of commercial coatings. Except for phthalic anhydride, the other raw materials used in the synthesis of the alkyds are from biologically renewable sources [3]. The new developments in alkyd emulsions and high solids alkyds promise the production of more environmentally friendly coatings, as summarized by Hofland [3].
Some studies have shown that nanoparticles introduced into alkyd resin improve its coating features. Alkyd resin/TiO2 nanocomposites exhibited better adhesion to metal than pure alkyd resin [4]. Alkyd-clay nanocomposites improved the anticorrosion and mechanical performance of coatings [5]. The specimens coated with alkyd resin containing mixed nano-metal oxides (TiO2 center Fe2O3/ZnO/NiO) exhibited higher corrosion protection efficiencies [6]. MgO nanoparticles dispersed in alkyd coatings possessed self-cleaning behavior, and degraded methyl violet dye when exposed to sunlight [7].
Recently cerium oxide nanoparticles have been receiving great attention in a wide range of applications. The main technological applications of cerium-based oxide coatings are reviewed by Castano et al. [8]. They are very good in catalysis and corrosion prevention. Beyond that, cerium oxide nanoparticles have emerged as versatile nanomaterials for biological applications such as bioanalysis, biomedicine, drug delivery, and bio-scaffolding [9]. To the best of our knowledge, only one study has reported the use of nano-cerium oxide as an additive for the development of anticorrosive properties in alkyd coating. The anticorrosive properties of an alkyd coating loaded with polyaniline and cerium oxide nanoparticles were presented in that paper [10]. Apart from alkyd coatings, enhanced corrosion protection efficiency has been reported from the incorporation of nanoceria into the primer layer of waterborne acrylic paint [11]. The addition of nano-cerium oxide together with carbon nanotubes into polyurethane coatings improved the corrosion resistance of the coating [12].
In this study, a commercial coating formulation was prepared by mixing alkyd resin and various additives such as a dispersion agent, a rheology agent, a wetting agent, an inner coat drier, a middle coat drier, an anti-skinning agent, an anticorrosive agent, titanium dioxide, and solvent. Then the commercial anticorrosive agent was removed from the formulation, and micro and nano-cerium oxides were added instead. Comprehensive tests in compliance with coating quality parameters were applied to the obtained coating to see the effect of the micro- and nano-cerium oxide addition to not only anticorrosive properties but to a large scale of coating properties. The results open a new commercial window in the field of usage of cerium oxide particles in the coating/paint industry for multifunctional purposes instead of many expensive and trademarked coating additives.

2. Materials and Methods

2.1. Materials

Cerium oxide microparticles and nanoparticles were purchased from Sigma Aldrich (St Louis, MO, USA). The microparticles have 1.95 µm particle sizes and 99.9% purity (catalog number: 211,575). Nano cerium oxide particles have 16 nm particle size (catalog number: 544,841). Other ingredients used in the preparation of the coating formulations were provided with the generous contribution of the Polisan Kansai Paint Industry. The ingredients used to prepare the alkyd formulations were commercially available as follows. Alkyd resin (Polyalkyd TS52S70, Polisan Kansai Paint, Kocaeli, Turkey), dispersion agent (Dysperbyk 107, BYK, Wesel, Germany), rheology agent (Viscogel ED, Laviosa, Livorno, Italy), pigment titanium dioxide, TiO2 (Ti-Pure R706, Chemours, DE, USA), wetting agent (BYK-307, BYK, Wesel Germany), inner coat drier zirconium octoate (EgeDry ZirkonOkt 12%, Ege Kimya, Sakarya, Turkey), middle coat drier calcium octoate (EgeDry KalsiyumOkt 4%, Ege Kimya, Sakarya, Turkey), anti-skinning agent (Methyl ethyl ketoxime, Ube Industries, Tokyo, Japan), plasticizer (Disobutyl phthalate, Plastifay Kimya Endustri, Kocaeli, Turkey), commercial anticorrosive agent (Asconium 112, Ascotec, Saint-Etienne, France), and toluene (Arkem Chemicals, Istanbul, Turkey), respectively.

2.2. Preparation of CeO2-Alkyd Based Coating

Four types of paint formulations were designed with 3 wt % commercial anticorrosive agent as reference paint (RP), 3 wt % cerium oxide microparticles (CER1), 3 wt % and 1% cerium oxide nanoparticles (CER2 and CER3), respectively. Alkyd coatings were prepared with high-speed disperser equipment at 3500 rpm for 30 min using a milling system Dispermat AE-6 that reduced the size of the particles to less than 40 µm. The base mills were ground with glass beads of 2 mm diameter to obtain fine of grinding lower than 15 µm. Coating formulations were prepared as given in Table 1. Commercial raw materials and cerium oxides micro and nano particles were used for the preparation of coatings. Different size of cerium oxide particles with different ratios was added to coatings to compare the effects of particle size. Viscosities of coatings were adjusted to approximately 140 KU by thinning with toluene, applied with paint gun and dried on air for one week for curing. Substrates, with the applied coatings, were polished with zirconium balls and cleaned with acetone before applications.

2.3. Characterization of Alkyd Coatings

Coatings were centrifuged and the organic structures of binders were recorded by Fourier transform infrared spectroscopy (Shimadzu FTIR, with universal ATR attachment with a diamond/ZnSe crystal) in the 450–4000 cm−1 wavenumber range. Binder structures were analyzed from dry films of the supernatant.
Thermal degradation of alkyd-based coatings was carried out by thermogravimetric analyzer Mettler Toledo TGA 2. Samples were heated from 25 to 800 °C at a heating rate of 10 °C/min under nitrogen atmosphere. The results were plotted as both percentage of weight loss and the first derivative of weight loss as a function of temperature.
Coatings which have hydrophobic characters show more resistance to corrosion in an aqueous environment. Hydrophobic surfaces repel water and their rough structures trap a large amount of air that is called air valleys. Metal surface penetration of corrosive ions is prevented by these air valleys [13]. Likewise, there are two explanations of the self-cleaning behavior of paints, namely, hydrophobic and hydrophilic mechanisms. On the hydrophobic types of paint, water drops slide down, carrying the contaminants and leaving clear coated areas. Hydrophilic coatings, however, are combined with a photo-catalyst which starts the degradation of dirt under UV–vis light. These types of paints present the direct interactions of water, dirt, and catalyst on the surfaces [7]. Hence, the wettability characteristics of prepared coatings were examined by tensiometer to determine the behavior of formulated coatings. Metal panels are painted with approximately 100 ± 2.8 micron dry film thickness and the measurements are done by Kruss contact angle analyzer using the sessile drop method at different contact times (0, 60, and 120 s) with water.

2.4. Physical Properties of CeO2-Alkyd Based Coatings

To see the physical effects of adding cerium oxide micro and nanoparticles to alkyd-based coating, some quality parameters such as grinding value, viscosity, density, hiding power, gloss, and drying time were measured and compared to a reference coating which did not contain cerium oxide particles. The color of coated surfaces was analyzed according to CIE L, a, b Color space system with a X-Rite SP64 spectrophotometer (X-Rite, Grand Rapids, MI, USA). This method is a comparison of three coordinates that are L, a, and b; and other precise color information such as hue, lightness, and saturation. L represents lightness; a and b represent chromaticity directions, +a goes to the red and −a goes to the green, +b goes to the yellow and −b goes to the blue direction [14].
Total color difference is given with ΔE:
Δ E = ( Δ L ) 2 + ( Δ a ) 2 + ( Δ b ) 2

2.5. Mechanical Behaviors of CeO2-Alkyd Based Coatings

2.5.1. Cross-Cut (Adherence) Test

Adhesion is the resistance of a paint film to removal from the surface on which it is coated [15]. To determine this ability, the cross-cut test method was applied according to ASTM D3359 [16]. Paints were coated to a cold rolled steel surface having 125 ± 2.1 μm dry film thicknesses. An area free of blemishes and minor surface imperfections was defined and orthogonal cuts were made with a sharp blade as described in the standard method. The surface was brushed to remove flakes and tape was attached on the grid area. The tape was removed and the rate of adhesion was determined according to the scale which is given in standard method ASTM D3359.

2.5.2. Hardness

Hardness of coatings can be defined as the resistance to scratching by hard objects. To determine hardness by gouging, paints were coated on a glass panel and dried for a week under 23 ± 2 °C and 45 ± 5% RH. A sharpened lead point was held at 90° angle horizontal to the coated surface and then it was pushed away from the operator while using downward pressure. This move was repeated until the coating surface showed cuts, scratched film, or a crumpled edge. Then the lead point is stopped by itself. The cycle number gives the degree of hardness. Increasing number of oscillations corresponds to better film properties. The degree of the hardness and frictions gives an indication about visco-elastic characteristics of the film. It can be affected by chain flexibility and the crosslinking degree of the paint system [17].

2.5.3. Impact Resistance

Paints were coated on thin steel panels. After they were cured, a device which consists of a vertical guide tube with 1.2 m height, a metal cylinder weight, and an indenter was used for the impact resistance test. Graduations are marked in kg/meter along the guide tube. Panels were inserted at 50 mm below the tube and standard weight was dropped from marked distances. The distance of weight was regularly increased and for each kg/meter level, the damage by the strike was observed on the coating and panel. The first distance which damage occurred on was noted in terms of kg level.

2.6. Self Cleaning Property of CeO2-Alkyd Based Coatings

To evaluate the self-cleaning behavior of the coating, coatings were applied to 5 × 10 cm acetate films with a brush. Coated films were cured for one week on air and dipped to the methylene blue (MB) solution for 30 s. Then they were kept under UV light for 5 h. Color L, a, b values of the films before and after face with pollutant were measured and ΔE values were given according to Equation (1) to prove the minimum color changes. The mechanism of self-cleaning depends on the adsorption of pollutant molecules (MB) to the coated film and photodegradation of those molecules by cerium oxide particles under UV light.

2.7. UV Aging of CeO2-Alkyd Based Coating

To see the effect of CeO2 to UV-aging, an Atlas Fluorescent UV-Condensation cabinet was used in accordance with ISO 4892-3 [18]. UV-B lamps (290 to 315 nm) were used in the QUV which typically cause faster degradation than UV-A lamps. Coating applied aluminum panels were left in the cabinet for 168 h for exposure to fluorescent UV radiation, heat, and water simulating weathering effects. Panels were conditioned at 50% relative humidity and 25 °C for 48 h before color measurements.

2.8. Anticorrosive Properties of CeO2-Alkyd Based Coating (Salt Sprey Chamber Test and EIS Tests)

Anticorrosive characteristics of the coatings which contain cerium oxide were studied by salt spray chamber test and electrochemical impedance spectroscopy (EIS).
Salt spray chamber tests were performed using steel panels (15 × 25 cm2) as metallic substratum. Two crosswise cuts of 0.1 mm wide were made on all coated panels and they were left in the chamber for 672 h according to ASTM B117 [19]. Tests were run by two cycles with exposure of the specimens to the salt fog of 5% NaCl solution (25 min) and with raising the temperature to 35 °C without salt mist exposure (20 min). The degree of blistering and delamination values was determined according to ISO 4628 [20].
Electrochemical techniques have become a fundamental tool for the evaluation of anticorrosion properties. Electrochemical impedance spectroscopy measurements were performed in VersaStat Potentiostat Galvanostat with amplitude of 10 mV and frequencies ranging from 100 kHz to 10 MHz. Coated mild steel panels with 80 ± 1.9 micron thickness were used as working electrode, a saturated AgCl electrode was used as reference electrode, and a platinum wire used as an auxiliary electrode. 3.5% NaCl solution was used as the electrolyte. Before the acquisition of any impedance spectra, the OCP of the coated steel measured.

3. Results and Discussion

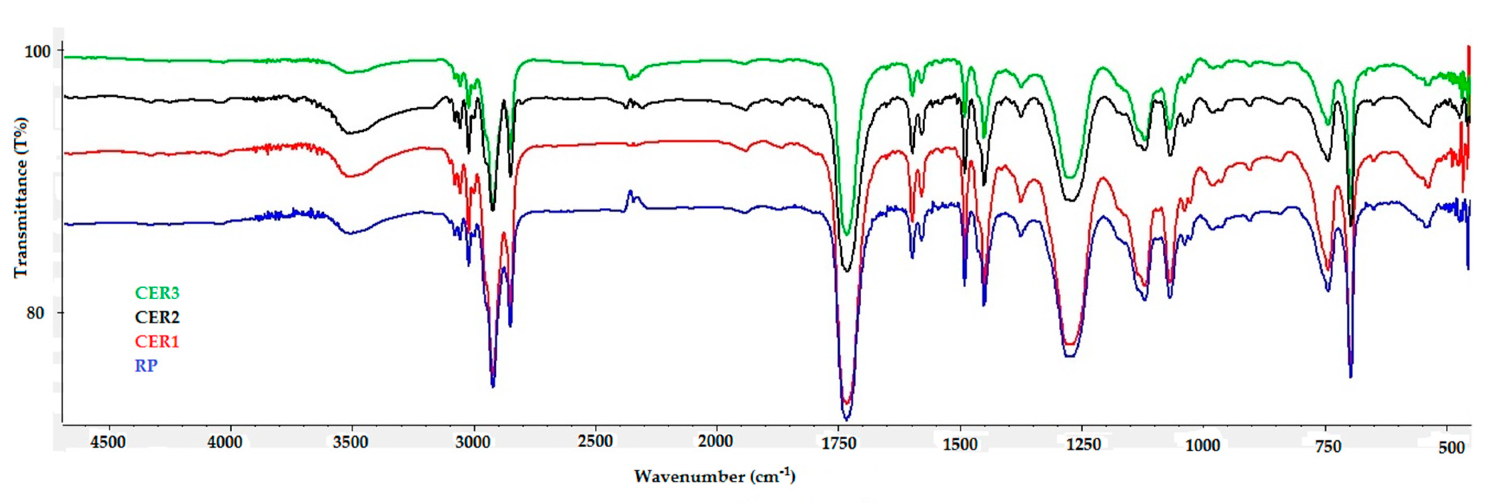
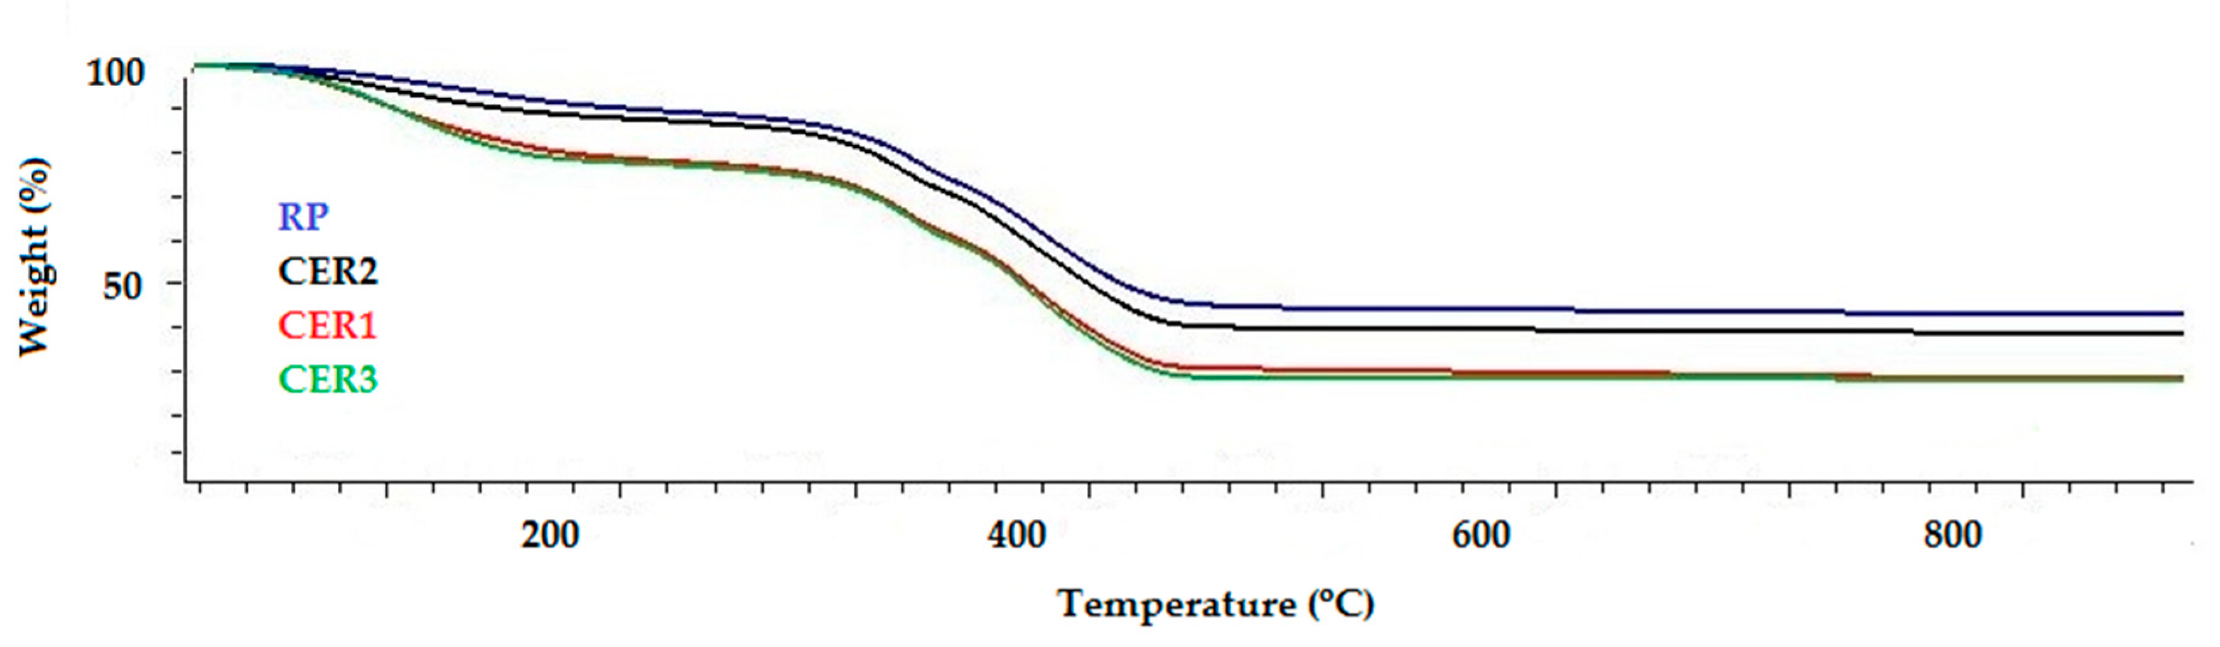
3.1. Characterization of Alkyd Coatings

Pigments, extenders or fillers, and other additives can be complicated for spectral interpretation so that, in order to identify characteristic FTIR-ATR spectrum of paints, dried resin films were used. Because of all paints that were studied have similar compositions and were formulated with alkyd resin, their spectra are expected to be similar as can be observed in Figure 1. The broad rounded peak at 3524 cm−1 belongs to hydroxyl groups associated with hydrogen bonds. Alkyd resins show typical main aliphatic –C–H bands at 2854 and 2925 cm−1 and aromatic =CH peaks at 3025 cm−1, corresponding to the stretching and bending mode of C–H groups of ortho-substituted benzene. A characteristic band at 1735 cm−1 is observed due to C=O stretching of ester. Peaks in the 1600, 1581, 1122, and 1070 cm−1 state aromatic rings in the polyester backbone, aromatic stretching, fingerprint of C=O streching of ester and strong unsaturated ring, respectively. The peak at 745 cm−1 is due to 1,2-disubstituted phenyl (PA). Other peaks at 1278 and 698 cm−1 state that C–O–C stretching vibration of ester and methylene rocking vibration exist. Normally Ce–O vibrations give weak band in the low wavenumber region around 600–500 cm−1 but unfortunately, when IR spectrum of fillers is taken, the Ce–O vibrations are overlapped by the signals of the titanium dioxide used.
Thermal analysis of the coatings with alkyd resins was studied and plotted in Figure 2. The thermal stability characteristics of the coatings evaluated through thermogravimetric analysis are very similar. The weight loss from room temperature (25 °C) to the onset decomposition temperature at 250 °C corresponds to the removal of humidity and some volatiles present in the paints. Results indicate that all of the coatings were found to have high thermal stability above 240 °C with the onset of decomposition recorded at 260.97, 248.85, 252.89, and 247.5 °C for RP, CER1, CER2, and CER3, respectively. From these temperatures, decompositions of alkyd resins begin and occur with two dominant steps. The first decomposition starts at 250 °C due to fatty acid aliphatic chain degradation. The second weight loss takes place between 370 and 500 °C and is related to the degradation of the aromatics and ester groups of alkyd. The increase in ash residual value at higher temperature clearly signifies the improvement in thermal stability of alkyd. The high residual percentage (42%) after 500 °C is due to the number of inorganic contents of raw material and additives used in the coating formulations.
The contact angles which are given in Figure 3 range from 78.7 to 83.1, which means that all the surfaces show hydrophilic behavior. This explains the mechanism behind the self-cleaning effect on the adsorption of organic pollutants and photocatalytic degradation. On the other hand, these results, unfortunately, indicate that there is no hydrophobic surface advantage to anticorrosion for all coatings.

3.2. Physical Properties of CeO2-Alkyd Based Coating

Physical properties of coatings were tested and presented in Table 2, according to the corresponding ASTM methods [21,22,23,24,25,26,27,28]. In order to see whether an adverse impact occurs by adding cerium oxide nano and microparticles to the coating as a new raw material, reference coating quality control characteristics were taken as initial parameters. It can be clearly seen that results are nearly similar and adding cerium oxide to coating formula does not cause adverse effects except for color. Paint which was prepared with 3% nanoceria has higher yellowness, lower whiteness than other coatings, which means that cerium oxide particles act as a pigment in dispersion. The drying time of coatings is actually related to the oil content of alkyd resins so that there are no major differences between the drying times of coatings.

3.3. Mechanical Behaviors of CeO2-Alkyd Based Coating

The crosscut (pull-off) test was applied with coatings to determine the adherence influence of cerium oxide particles. Table 3 shows the results which are defined as described in the ASTM 3359 [16]. 100% adhesion was reached for CER2 and CER3, i.e., 5B. 1% nano cerium oxide and 3% nano cerium oxide addition showed an equivalent effect. The worst adhesion was seen for CER1 which was prepared with 3% cerium oxide microparticles.
Hardness of the films improved by adding cerium oxide particles, compared to the reference coating (Table 3). Results are given according to the test method DIN EN ISO 1522 [29]. The best effect was achieved by the addition of nano cerium, and 1% nano cerium oxide and 3% nano cerium oxide addition showed an equivalent effect. Although there is no clear explanation for improvement of hardness by adding cerium oxide, it is presumably related to particle distributions between polymer chains in the structure. In addition to that, particles can block chain mobility, hence the coatings showed better impact resistance with test method ASTM D2794 [30]. Coating films with cerium oxide particles did not show any cracks, fractures, or ruptures until the 50 kg impact.

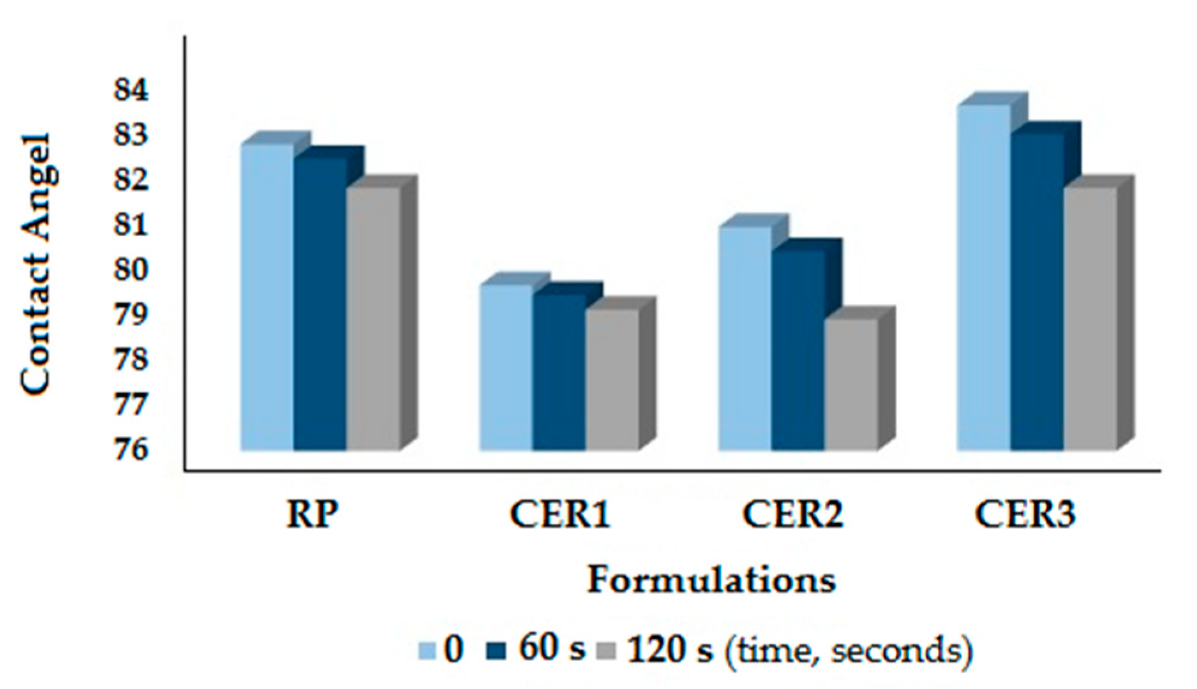
3.4. Self-Cleaning Behavior

Photo degradation of organic pollutants by CeO2 in paint was studied under UV light. Photo degradation is really important for decreasing the pollutants in our ecosystem and gaining a long lifetime to applied paint and coated surfaces. In the mechanism of self-cleaning, dirt or pollutants are adsorbed on the coating and then degraded to harmless forms by active materials. Because adsorption increases with increasing surface area, nanomaterials are more efficient for self-cleaning effects.
In our work, paints were coated on acetate substrate and left to dry for 1 week. Colors of dried coated substrates were measured as L, a, b and they were immersed in MB solution. As we know that our coatings have hydrophilic surfaces, adsorption is observed efficiently after immersing coated films into the solution and seeing that their color has changed. MB adsorbed substrates were air dried and exposed to UV light in UV lamp cabinet with bandwidth of UVA range from 315 to 400 nm and UVB range from 280 to 315 nm. At the initial stage of process, the surface of coatings were blue. During the degradation of MB molecules into CO2, H2O, etc., the color of substrates started to fade out. The final color of coated films was measured and compared with colors of applied coatings at the beginning, and the self-cleaning effect was determined by minimum total color difference from the beginning coating color. As it can be seen in Table 4, the reference coating has the highest color change while paints with CeO2 particles almost succeed in recovering their color. In brief, due to the nano-size nature of the CeO2 used in coatings CER2 and CER3, photocatalytic degradation of pollutants was seen to be much higher due to the higher surface area of the particles.

3.5. Effect of UV-Aging

The tendency of alkyd or oil-based coatings going yellow is one of the long-standing concerns of the paint industry. Color changes of that kind of coating vary according to film age and other influences such as the exposure of UV light and humidity. Differences in color are due to the presence of chromophores which are formed during the drying of films and bleached out under exposure to UV light. Turning yellow is a more significant issue for white colored coatings.
The effect of cerium oxide particles to the aging behavior of alkyd-based coatings was simulated with a UV cabinet test for 168 h with UVB broadband lamps (290 to 315 nm). Changes in color as ΔE and yellow index values (YI) before and after UV exposure were studied. Table 5 shows the results.
The highest ΔE was observed for the commercial reference coating. The presence of cerium oxide particles in coatings significantly reduced the change of color as a result of UV-aging. Moreover, the filtering of UV-aging effects was much higher for nano cerium oxide particles involved coatings. It was also observed that ΔE decreases by the increasing amount of nanoceria as seen by the color changes of CER2 and CER3.

3.6. Anticorrosive Properties of CeO2-Alkyd Based Coating

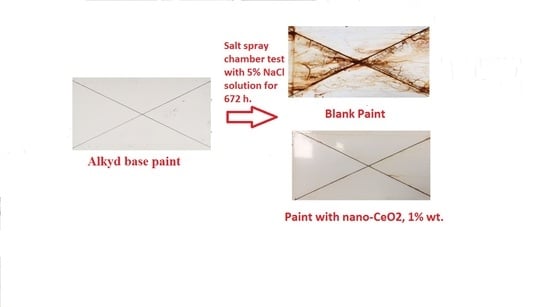
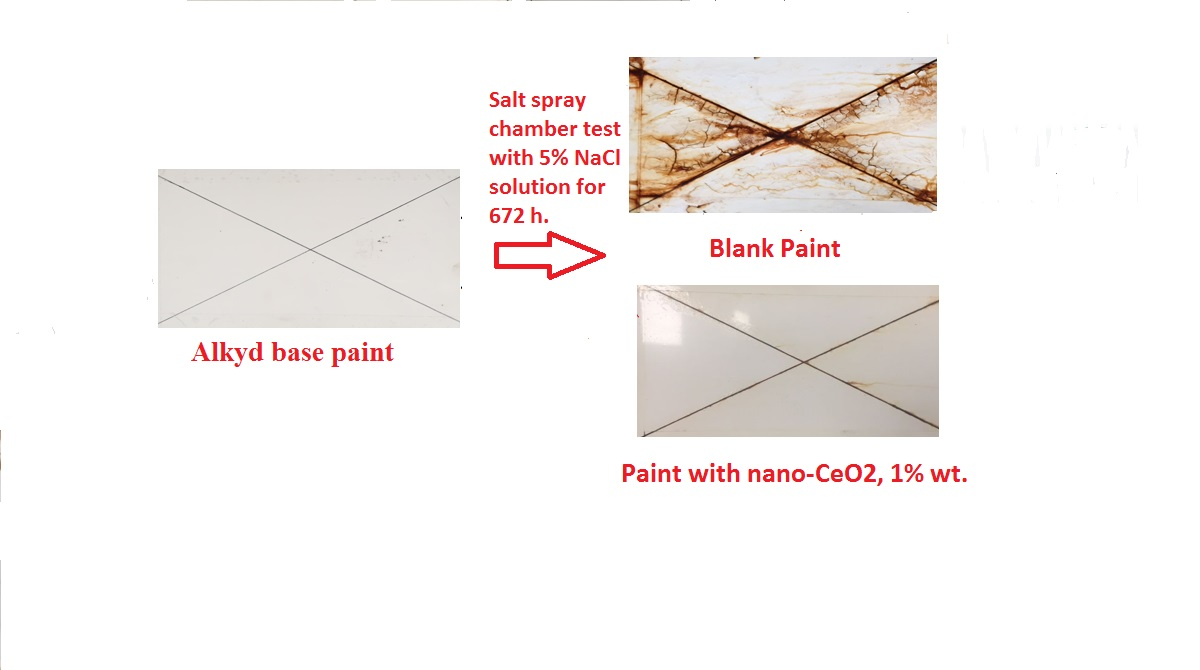
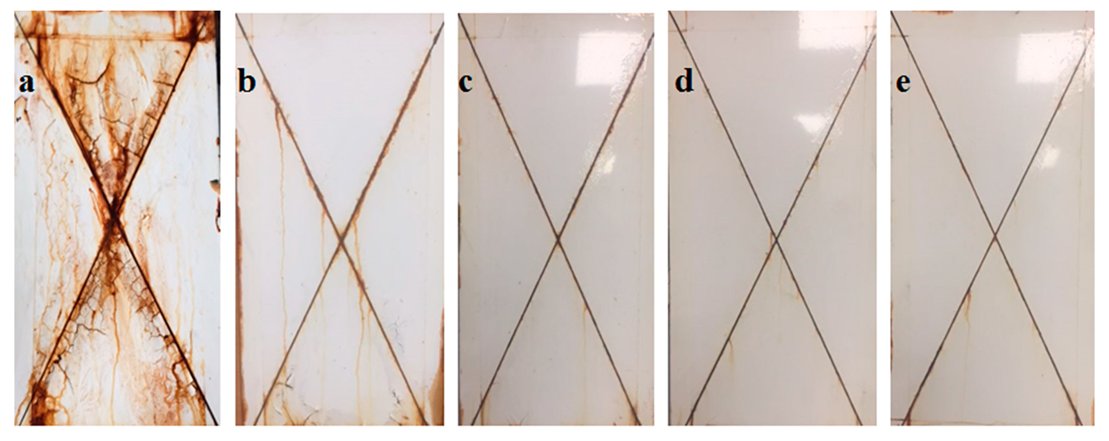
3.6.1. Salt Spray Test

Salt spray tests in a saline fog for RP, CER1, CER2, and CER3 coated and scratched substrates were performed to investigate the barrier properties of coatings. To obtain more reliable and obviously clear visual compared results, a coating without any anticorrosive agent and cerium oxide particles (blank coating) was prepared and also included into the salt spray chamber test. Samples were analyzed every week and photographed. At the end of the first week, there were no significant differences between the five coatings despite the harsh salt-mist corrosion propagation. Severe and prominent corrosion at the cross-shaped cut part was observed after 672 h immersion time for the blank coating, while RP showed moderate corrosion and CER1 only showed slight corrosion. There were no obvious blister and coating delamination around the scratch for CER2 and CER3 (Figure 4a–e). All types of coatings were applied onto mild steel panels without another primer coating. Thus delamination on the blank coating and RP are directly linked to the corrosion protective behavior of the coating.
The degree of blistering, delamination, rusting, and cracking were evaluated according to test methods [20,31,32,33,34] and results are given in Table 6. Values in the table are the average of two observation sets. The S1 size of blisters is not visible with uncorrected vision but only with ×10 magnification. Hence, significant blisters were not observed in nano cerium oxide added samples. For blank coating, electrolyte migrated through the cut under the coating, creating large and numerous blisters, explaining poor corrosion protective property. RP showed some blisters, cracks, and regional loss of adhesion between coating and steel. For RP and CER1, damage was seen at different points of panels, not only around the scratch lines, unlike CER2 and CER3. Cracking on the different areas of metal substrates are linked to the defects under the coating layer.
CER2 and CER3 showed a very slight amount of blisters (also smaller size) and lower delaminated areas, only around cross-cuts. These results have been attributed to the fact that the presence of nano cerium oxide in the coating delays the extent of delamination. Although CER2 has more nanoceria in its formulation, nearly similar salt spray test results of CER2 and CER3 can be explained as a consequence of the required amount of nanoceria being achieved with CER3. According to these outcomes, 1% (w/w) of nanoceria in coating formulation is enough for avoiding corrosion.

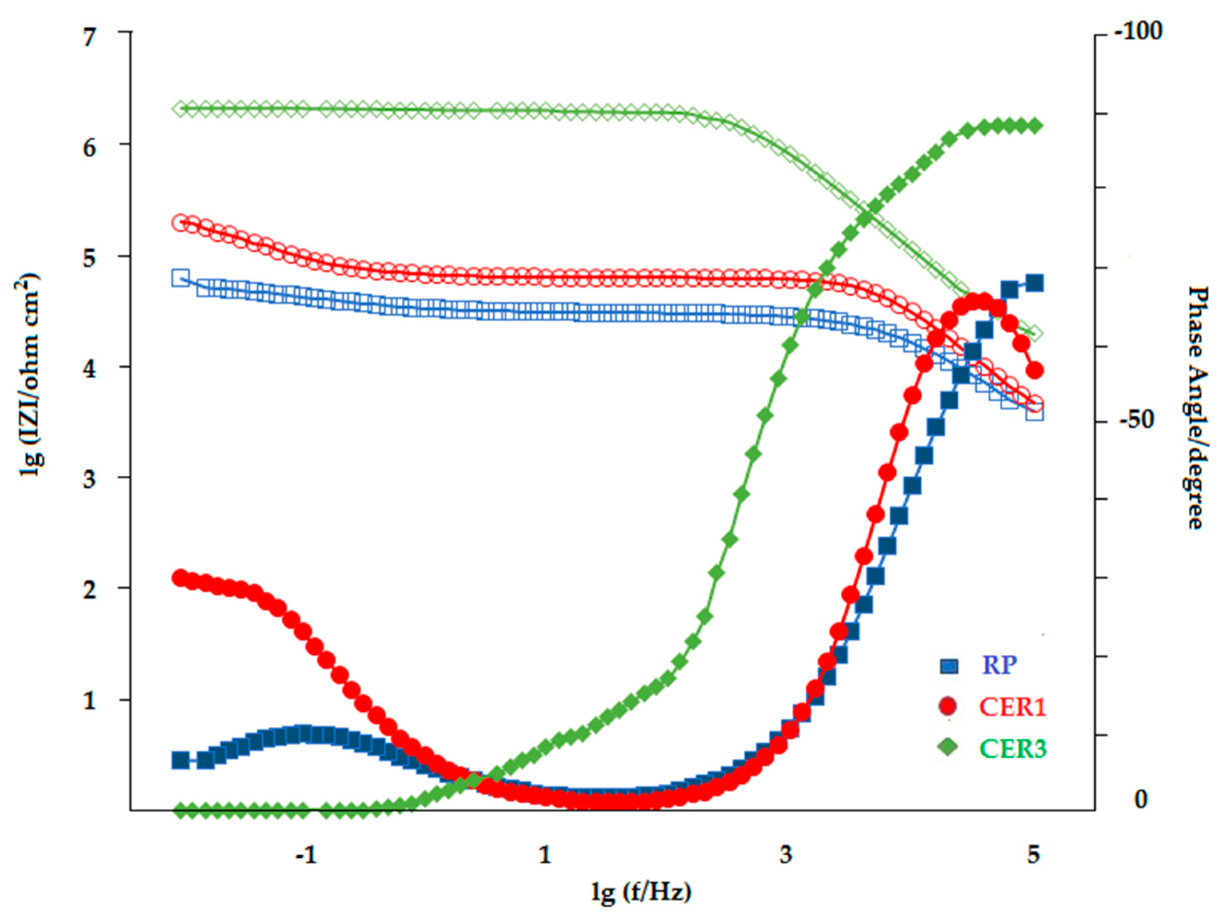
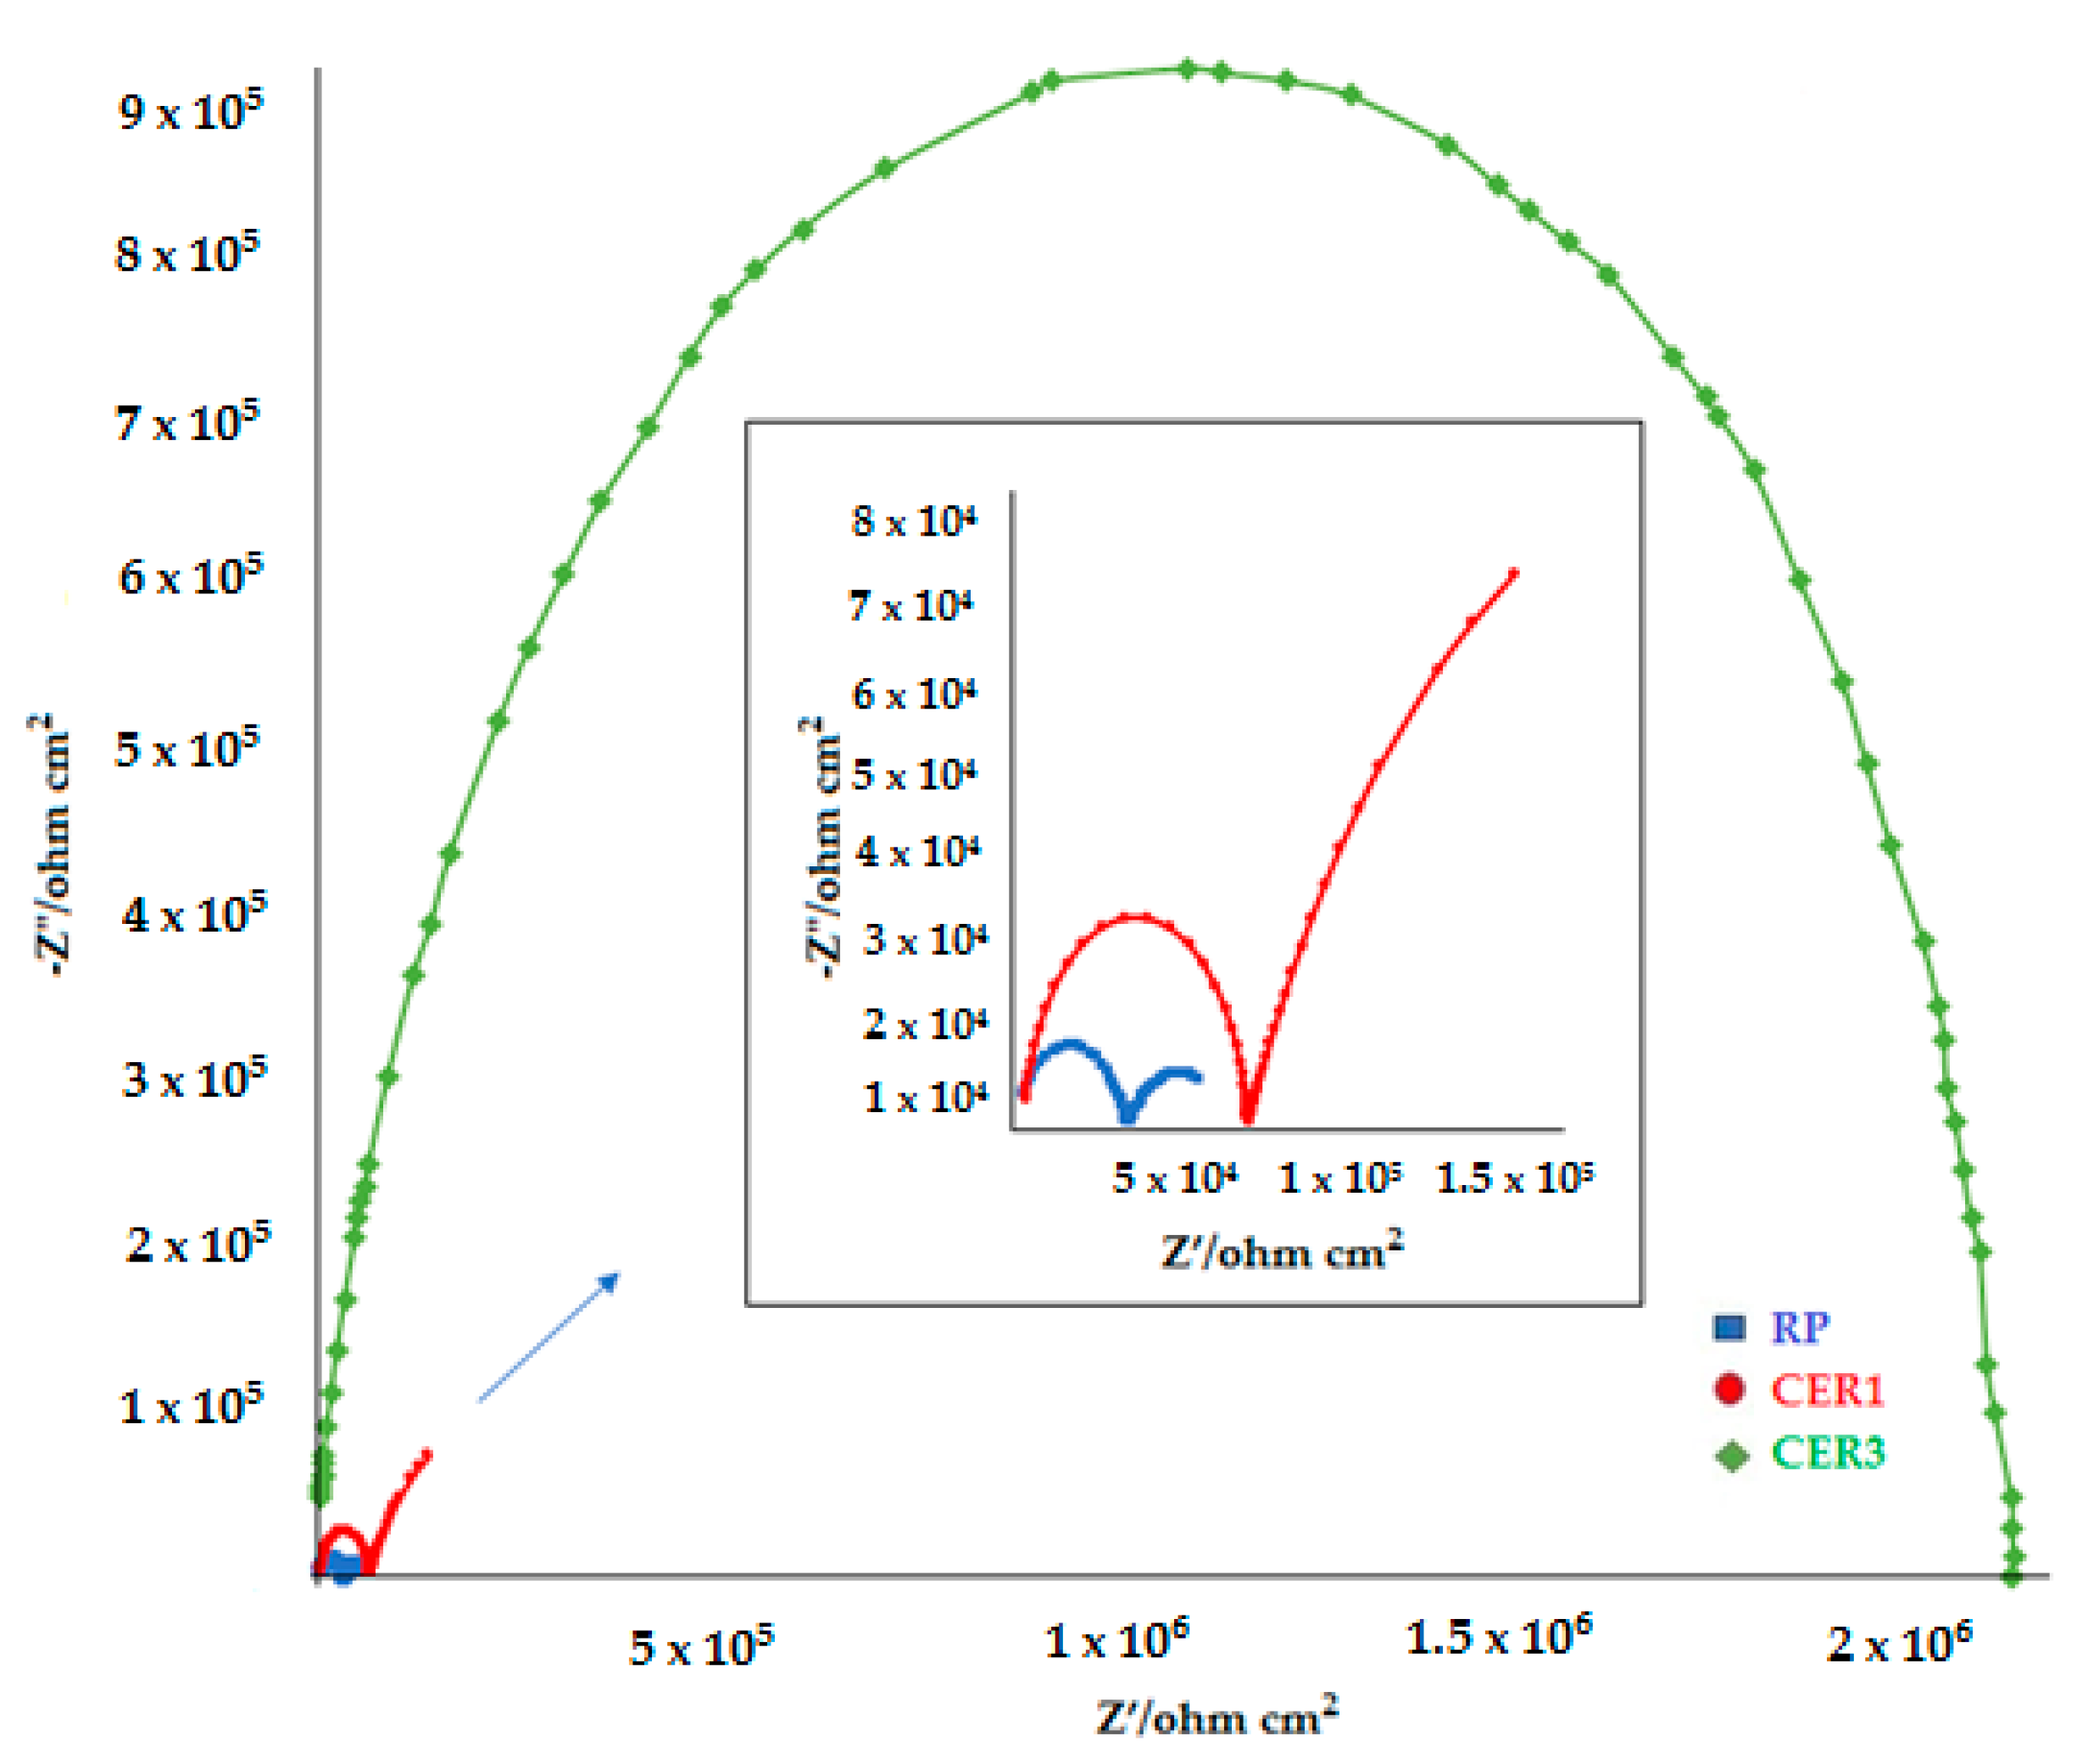
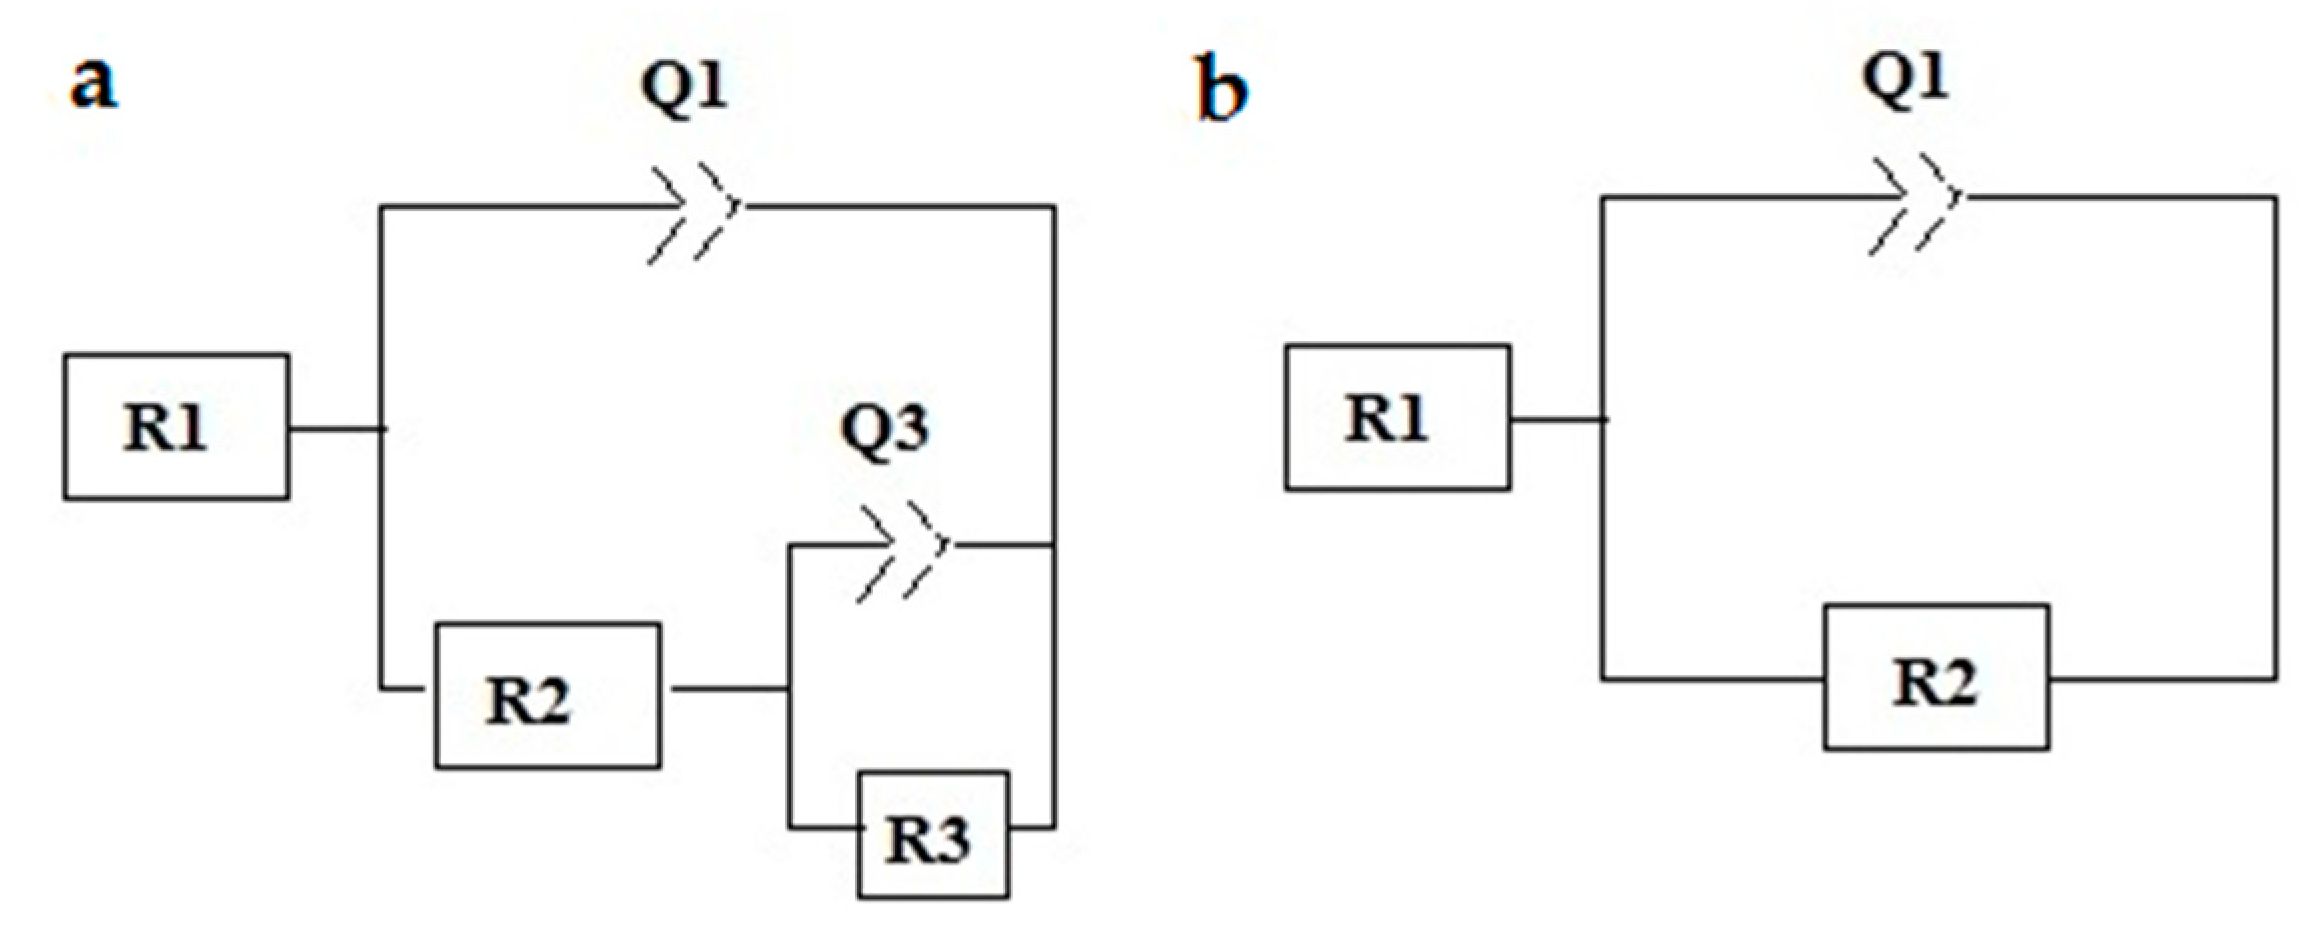
3.6.2. EIS Evaluation

For the deep investigation of the anticorrosive effectiveness of nano cerium oxide particles, electrochemical impedance spectroscopy results of CER3, which showed better anticorrosive behavior with its lesser nanoparticle content, was investigated. The EIS result for CER3 was compared with the EIS results of RP and CER1. EIS graphics of coated panels after immersion in 3.5% NaCl solution for 4 days were given in Figure 5 and Figure 6. The EIS data were also fitted by using EC Lab Fitting Software. Different circuit models were studied for fitting the EIS data in order to obtain the most appropriate equivalent circuit. The fitting data are listed in Table 7 and the indicating equivalent circuits are given in Figure 7a for CER3 and Figure 7b for RP and CER1.
High impedance value and one time constant in the bode plots indicate the good barrier effect to water. One time constant can be defined as the corrosion species having contact with the coating but not being able to penetrate to the metal surface [35].
After 4 days of immersion time in salt water, there is a one time constant at around 104 Hz on the graph (Figure 5) of the phase angle versus frequency for CER3, which corresponds to the equivalent circuit model in Figure 7a. The other phase angle graphs belonging to RP and CER1 have two time constants, one of them is related to the penetration of the salt water to the steel panel (Figure 5).
An ideal capacitor has a 90° phase angle and when the phase angle is not 90°, it becomes a constant phase element (CPE) [36]. In the bode diagrams of phase angles (Figure 5), at high frequencies, RP and CER1 have lower phase angles (near to 68° and 56°, respectively) which can be corresponded to a resistive response, while CER3 has a higher phase angle (almost 90°) with capacitor behavior.
The magnitude of the impedance modulus at low frequencies is another parameter for assessment of the anticorrosive behaviors of organic coatings representing impedance of coating and faradaic processes between the coating layer and steel [37]. According to impedance values in the low-frequency region, CER1 has higher impedance value than RP and CER3 has higher impedance value than CER1 (Figure 5, Table 7) at 0.01 Hz. Hence protection properties and barrier effects are CER3 > CER1 > RP along with remarkable stability.
From the impedance and phase angle values of bode diagrams, we can say that the amount of 1% of nano cerium oxide is better than the 3% of micro cerium oxide particles. Beside that, cerium oxide with microparticle size shows more powerful anticorrosive activity than the commercial anticorrosive agent.
In the equivalent circuits, R1 stands for the electrolyte resistance, R2 for the coating (pore) resistance, and Q1 for the constant phase element (CPE) of the coating (coating capacitance), attributed to the coating capacitance, R3 for the charge transfer resistance, and Q3 for the CPE related to the double layer capacitance of the steel surface. The higher values of R2 are related to slower reactions rates occurring on the working electrode [37]. R2 and Q1 are related to interactions between the coating surface and the electrolyte and coating resistance against the flow of ions through the damaged areas of coating [38]. Higher R2 represents a higher anticorrosive barrier [39]. As it can be seen in Table 7, R2 of CER3 is higher than RP and CER1, so the result is that nanoceria has the most powerful protection against corrosion. Besides, microparticles of cerium oxide showed a more efficient result than the commercial anticorrosive agent among the R2 results. It is clearly seen that values of R2 of CER3 and CER1 are higher than RP. Q1 is used to define the basic insulator properties of coatings and increases with uptaking of water through the coating [38]. The Q1 values are 3.77 × 10⁻¹⁰, 7.6 × 10⁻¹⁰, and 6.34 × 10⁻⁹ for CER3, CER1, and RP, respectively, confirming the better corrosion resistance of CER3 and CER1.
CPE acts as a capacitor when n is 1 and as a resistor when n is 0. If n is 0.5, it means that water diffusion process begins [36]. According to n values, it can be said that they behave similarly to a capacitor and surface is homogeneous and regular when the n value goes to 1 [40].
In Nyquist graphs (Figure 6), RP and CER1 showed the presence of the second semicircle at low frequencies which indicated the loss of anticorrosive behavior of the coating. The semicircles at low frequencies for RP and CER1 and their n values near to 0.5 means that the diffusional processes in the electrode have begun and inhomogeneity of the surface has occurred. Impedance modulus is high for CER3 and shows one time constant and high polarization resistance (R2) due to the good barrier properties. However CER1 has a higher impedance modulus than RP, it has two time constants for the overall impedance. One time constant at high frequency represents the coating surface properties and delay in the electrolyte penetration while the second one at low frequency represents the interfacial properties between the coating and the metal surface which means that salt solution can go through the damage and pinholes on the coating film [36]. In brief, although the coating resistance of the paint with micro cerium oxide is good, the corrosion resistance of the paint improves considerably with the addition of nano cerium oxide.
Considering the outcome of the experimental measurements, it was found that the cerium oxide microparticles increases the anticorrosive resistance of commercial coating, and a lesser amount of nano cerium oxide particles gives better anticorrosive effects than microparticles of cerium oxide. Concisely, the results imply that the decreasing particle size of cerium oxide enhances corrosion resistance.

4. Conclusions

The result of this work showed that adding cerium oxide micro and nanoparticles to coating formulations provides anticorrosive, anti-aging, and self-cleaning effects. Coated metal panels had successful corrosion results after salt spray tests for 672 h. Electrochemical impedance graphics showed similar results to salt spray tests. Paints which had less amounts of nano cerium oxide gave the same anticorrosive effect to coatings with more amounts of micro cerium oxide added. Alkyd coatings generally tend to turn yellowish during exposure of UV light. Cerium oxide particles provided exceptional excellent resistance to UV-aging. Besides the anticorrosive advantages of cerium oxide particles in coating formulations, their effects on the physical parameters of coatings were also examined and reported in this article. Nano cerium oxide particles showed a significant impact in the adhesion, hardness, and impact resistance of coatings. These studies suggest that nano cerium oxide can be used as a multi-purpose additive in solvent-based decorative and industrial coatings.

Author Contributions

Conceptualization, F.B.E.; Investigation F.B.E. and E.K.; Experiments and Data Collection E.K.; Writing-original draft preparation E.K.; Writing-review and editing F.B.E.

Funding

This research received no external funding.

Acknowledgments

This research was completed at Istanbul Technical University, Capillary Electrophoresis and Biopolymer Applications Research Laboratory. The authors sincerely thank Polisan Kansai Paint Industry R&D Center for the supply of materials and providing the necessary facilities for paint tests. We also thank Professor Fevzi Cakmak Cebeci at the Sabancı University and his team for their help in electrochemical impedance spectroscopy measurements.

Conflicts of Interest

The authors declare no conflict of interest.

References

  1. New Research and Developments in Global Paints and Coatings Industry: Market Research Report to 2022. Available online: https://www.reuters.com/brandfeatures/venture-capital/article?id=4426 (accessed on 24 September 2019).
  2. Ulaeto, S.B.; Rajan, R.; Pancrecious, J.K.; Rajan, T.P.D.; Pai, B.C. Developments in smart anticorrosive coatings with multifunctional characteristics. Prog. Org. Coat. 2017, 111, 294–314. [Google Scholar] [CrossRef]
  3. Hofland, A. Alkyd resins: From down and out to alive and kicking. Prog. Org. Coat. 2012, 73, 274–282. [Google Scholar] [CrossRef]
  4. Radoman, T.S.; Dzunuzovic, J.V.; Spasojevic, P.M.; Marinovic Cincovic, M.T.; Jeremic, K.B.; Popovic, I.G.; Dzunuzovic, E.S. Preparation and properties of short oil alkyd resin/TiO2 nanocomposites based on surface modified TiO2 nanoparticles. Polym. Compos. 2018, 39, 1488–1499. [Google Scholar] [CrossRef]
  5. Dhirde, P.G.; Chada, V.G.R.; Mallik, B.P.; Moitra, N. Alkyd-clay nanocomposites for improved anticorrosion and mechanical performance of coating. Polym. Compos. 2018, 39, 2922–2931. [Google Scholar] [CrossRef]
  6. Benitha, V.S.; Jeyasubramanian, K.; Hikku, G.S. Investigation of anti-corrosion ability of nano mixed metal oxide pigment dispersed alkyd coating and its optimization for A36 steel. J. Alloy Compd. 2017, 721, 563–576. [Google Scholar] [CrossRef]
  7. Hikku, G.S.; Jeyasubramanien, K.; Kumar, S.V. Nanoporous MgO as self-cleaning and anti-bacterial pigment for alkyd based coating. J. Ind. Eng. Chem. 2017, 52, 168–178. [Google Scholar] [CrossRef]
  8. Castano, C.E.; O’Keefe, M.J.; Fahrenholtz, W.G. Cerium-based oxide coatings. Curr. Opin. Solid State Mater. Sci. 2015, 19, 69–76. [Google Scholar] [CrossRef]
  9. Xu, C.; Qu, X.G. Cerium oxide nanoparticle: A remarkably versatile rare earth nanomaterial for biological applications. NPG Asia Mater. 2014, 6, e90. [Google Scholar] [CrossRef]
  10. Ecco, L.G.; Fedel, M.; Ahniyaz, A.; Deflorian, F. Influence of polyaniline and cerium oxide nanoparticles on the corrosion protection properties of alkyd coating. Prog. Org. Coat. 2014, 77, 2031–2038. [Google Scholar] [CrossRef]
  11. Ecco, L.G.; Fedel, M.; Deflorian, F.; Becker, J.; Iversen, B.B.; Mamakhel, A. Waterborne acrylic paint system based on nanoceria for corrosion protection of steel. Prog. Org. Coat. 2016, 96, 19–25. [Google Scholar] [CrossRef]
  12. Kumar, A.M.; Rahman, M.M.; Gasem, Z.M. A promising nanocomposite from CNTs and nanoceria: Nanostructured fillers in polyurethane coatings for surface protection. RSC Adv. 2015, 5, 63537–63544. [Google Scholar] [CrossRef]
  13. Xu, W.; Song, J.; Sun, J.; Lu, Y.; Yu, Z. Rapid fabrication of large-area, corrosion-resistant superhydrophobic Mg alloy surfaces. ACS Appl. Mater. Interfaces 2011, 3, 4404–4414. [Google Scholar] [CrossRef] [PubMed]
  14. Ecco, L.G.; Rossi, S.; Fedel, M.; Deflorian, F. Color variation of electrophoretic styrene-acrylic paints under field and accelerated ultraviolet exposure. Mater. Des. 2017, 116, 554–564. [Google Scholar] [CrossRef]
  15. Nelson, G.L. Adhesion in Paint and Coating Testing Manual, 14th ed.; Koleske, J.V., Ed.; ASTM: Philadelphia, PA, USA, 1995. [Google Scholar]
  16. ASTM D3359-17 Standard Test Methods for Rating Adhesion by Tape Test; ASTM International: West Conshohocken, Montgomery County, PA, USA, 2017.
  17. Çağlar, D.İ.; Emre, B.; Oktay, B.; Kahraman, M.V. Preparation and evaluation of linseed oil based alkyd paints. Prog. Org. Coat. 2014, 77, 81–86. [Google Scholar] [CrossRef]
  18. ISO 4892-3 Plastics; Methods of Exposure to Laboratory Light Sources Part 3: Fluorescent UV Lamps; ISO: Geneva, Switzerland, 2016.
  19. ASTM B117 Standard Practice for Operating Salt Spray (Fog) Apparatus; ASTM International: West Conshohocken, PA, USA, 2018.
  20. ISO 4628-1 Paints and Varnishes; Evaluation of Degradation of Coatings, Designation of Quantity and Size of Defects, and of Intensity of Uniform Changes in Appearance Part 1: General Introduction and Designation System; ISO: Geneva, Switzerland, 2016.
  21. ASTM D1210-05 Standard Test Method for Fineness of Dispersion of Pigment-Vehicle Systems by Hegman-Type Gage; ASTM International: West Conshohocken, PA, USA, 2014.
  22. ASTM D562-10 Standard Test Method for Consistency of Paints Measuring Krebs Unit (KU) Viscosity Using a Stormer-Type Viscometer; ASTM International: West Conshohocken, PA, USA, 2018.
  23. ASTM D1475-13 Standard Test Method for Density of Liquid Coatings, Inks, and Related Products; ASTM International: West Conshohocken, PA, USA, 2013.
  24. ISO 6504-3 Paints and Varnishes; Determination of Hiding Power Part 3: Determination of Contrast Ratio of Light-Coloured Paints at a Fixed Spreading Rate; ISO: Geneva, Switzerland, 2006.
  25. ASTM D523-14 Standard Test Method for Specular Gloss; ASTM International: West Conshohocken, PA, USA, 2018.
  26. ASTM D5895-13 Standard Test Methods for Evaluating Drying or Curing During Film Formation of Organic Coatings Using Mechanical Recorders; ASTM International: West Conshohocken, PA, USA, 2013.
  27. ASTM E1347-06 Standard Test Method for Color and Color-Difference Measurement by Tristimulus Colorimetry; ASTM International: West Conshohocken, PA, USA, 2015.
  28. ASTM D2244-16 Standard Practice for Calculation of Color Tolerances and Color Differences from Instrumentally Measured Color Coordinates; ASTM International: West Conshohocken, PA, USA, 2016.
  29. DIN EN ISO 1522 Paints and Varnishes—Pendulum Damping Test; ISO: Geneva, Switzerland, 2007.
  30. ASTM D 2794-93 Standard Test Method for Resistance of Organic Coatings to the Effects of Rapid Deformation (Impact); ASTM International: West Conshohocken, PA, USA, 2019.
  31. ISO 4628-2 Paints and Varnishes; Evaluation of Degradation of Coatings, Designation of Quantity and Size of Defects, and of Intensity of Uniform Changes in Appearance Part 2: Assessment of Degree of Blistering; ISO: Geneva, Switzerland, 2016.
  32. ISO 4628-3 Paints and Varnishes; Evaluation of Degradation of Coatings, Designation of Quantity and Size of Defects, and of Intensity of Uniform Changes in Appearance Part 3: Assessment of Degree of Rusting; ISO: Geneva, Switzerland, 2016.
  33. ISO 4628-4 Paints and Varnishes; Evaluation of Degradation of Coatings, Designation of Quantity and Size of Defects, and of Intensity of Uniform Changes in Appearance Part 4: Assessment of Degree of Cracking; ISO: Geneva, Switzerland, 2016.
  34. ISO 4628-8 Paints and Varnishes; Evaluation of Degradation of Coatings, Designation of Quantity and Size of Defects, and of Intensity of Uniform Changes in Appearance Part 8: Assessment of Degree of Delamination and Corrosion around a Scribe or other Artificial Defect; ISO: Geneva, Switzerland, 2012.
  35. Ramezanzadeh, B.; Niroumandrad, S.; Ahmadi, A.; Mahdavian, M. Enhancement of barrier and corrosion protection performance of anepoxy coating through wet transfer of amino functionalized grapheneoxide. Corros. Sci. 2016, 103, 283–304. [Google Scholar] [CrossRef]
  36. Marti, M.; Fabregat, G.; Azambuja, D.S.; Aleman, C.; Armelin, E. Evaluation of an environmentally friendly anticorrosive pigment for alkyd primer. Prog. Org. Coat. 2012, 73, 321–329. [Google Scholar] [CrossRef]
  37. Amirudin, A.; Thierry, D. Application of electrochemical impedance spectroscopy to study the degradation of polymer-coated metals. Prog. Org. Coat. 1995, 26, 1–28. [Google Scholar] [CrossRef]
  38. Kumar, A.M.; Khan, A.; Suleiman, R.; Qamar, M.; Saravanan, S.; Dafalla, H. Bifunctional CuO/TiO2 nanocomposite as nanofiller for improved corrosion resistance and antibacterial protection. Prog. Org. Coat. 2018, 114, 9–18. [Google Scholar] [CrossRef]
  39. Shi, S.; Zhang, Z.; Yu, L. Hydrophobic polyaniline/modified SiO2 coatings for anticorrosion protection. Synth. Met. 2017, 233, 94–100. [Google Scholar] [CrossRef]
  40. Benedetti, A.V.; Sumodjo, P.T.A.; Nobe, K.; Cabot, P.L.; Proud, W.G. Electrochemical studies of Copper, Copper-Aluminium and Copper-Aluminium-Silver alloys: Impedance results in 0.5 M NaCl. Electrochim. Acta 1995, 40, 2657–2668. [Google Scholar] [CrossRef]
Figure 1. Fourier transform infrared spectroscopy (FTIR) spectra of resins of prepared coatings.
Coatings 09 00610 g001
Figure 2. Thermogravimetric curve of the coatings with scan rate of 10 °C/min, from 25 to 800 °C.
Coatings 09 00610 g002
Figure 3. Contact angle values of coatings with water at different contact time.
Coatings 09 00610 g003
Figure 4. Salt spray test panels of the blank coating (a); reference material (RP) (b); 3 wt % cerium oxide microparticles (CER1) (c); 3 wt % cerium oxide nanoparticles (CER2) (d); 1 wt % cerium oxide nanoparticles (CER3) (e), after 672 h corrosion cycles under 5% NaCl solution.
Coatings 09 00610 g004
Figure 5. Bode plots of RP, CER1 and CER3 after immersion in 3.5% NaCl solution for 4 days (● Bode-phase plots, ◦ Bode-magnitude plots).
Coatings 09 00610 g005
Figure 6. Nyquist diagrams of RP, CER1 and CER3 after immersion in 3.5% NaCl solution for 4 days.
Coatings 09 00610 g006
Figure 7. Equivalent electric circuits used to simulate the EIS results for the and CER3 (a) RP and CER1 (b).
Coatings 09 00610 g007
Table 1. Coating formulations.
IngredientsRP
(wt %)
CER1
(wt %)
CER2
(wt %)
CER3
(wt %)
Alkyd61.661.661.661.6
Dispersion agent0.80.80.80.8
Rheology agent0.120.120.120.12
Solvent7.787.787.789.78
TiO224242424
Wetting agent0.20.20.20.2
Inner coat drier0.50.50.50.5
Middle coat drier0.50.50.50.5
Anti-skinning agent0.50.50.50.5
Plasticizer1111
Commercial anticorrosive agent3
CeO2-5 micron3
CeO2-25 nm31
100100100100
Table 2. Physical properties of coatings according to standard test methods.
CharacteristicsUnitMethodRPCER1CER2CER3
Grinding valueµmASTM D121015 ± 110 ± 115 ± 112 ± 1
Viscosity (25 °C)KUASTM D562116 ± 2128 ± 2132 ± 1134 ± 2
Density (25 °C)g/mLASTM D14751.22 ± 0.021.27 ± 0.031.25 ± 0.011.24 ± 0.01
Hiding power%ISO 6504-399.2 ± 0.199.3 ± 0.199.3 ± 0.199.5 ± 0.1
Gloss20°ASTM D52384.0 ± 0.290.3 ± 0.395.9 ± 0.489.5 ± 0.3
60°93.8 ± 0.396.8 ± 0.298.9 ± 0.596.9 ± 0.4
80°97.4 ± 0.5100.8 ± 0.698.7 ± 0.499.6 ± 0.4
Drying timehourASTM D5895/A10999
ColorLASTM E1347 ASTM D224496.9397.1297.0197.09
a−0.92−0.98−1.36−1.1
b1.401.883.222.29
Yellowness indexYI1.442.173.742.79
Whiteness indexWI86.4884.2479.8781.89
Table 3. Mechanical properties of coatings according to international standard test methods.
Test MethodsRPCER1CER2CER3
Adherence/ASTM 33594B3B5B5B
Hardness (Cycle)/DIN EN ISO 152224394545
Impact Resistance (weight, kg)/ASTM D279430505050
Table 4. Total color difference, ΔE, values as a result of self-cleaning behavior of coatings according to the recovery of their original colors.
Color DifferenceRPCER1CER2CER3
ΔE5.47 ± 0.083.88 ± 0.100.80 ± 0.192.51 ± 0.17
Table 5. UV-aging levels of coatings according to total color difference, ΔE, and yellowness index, Y1 values.
Color DifferencesRPCER1CER2CER3
ΔE9.25 ± 0.23.40 ± 0.112.66 ± 0.122.93 ± 0.05
YI before UV1.442.173.742.79
YI after UV10.448.725.547.01
Table 6. Salt spray test results according to ISO 4628 (blistering, rusting, cracking, and delamination degrees) after 672 h corrosion cycles under 5% NaCl solution.
Test ParameterReference Test MethodBlank CoatingRPCER1CER2CER3
Blistering (size)ISO 4628-253211
Blistering (density)ISO 4628-253211
Degree of rustingISO 4628-3Ri5Ri4Ri4Ri2Ri3
Cracking (size)ISO 4628-442201
Cracking rate (quantity)ISO 4628-443211
Delamination (mm)ISO 4628-82113.59.566.5
Degree of delaminationISO 4628-8severemoderateslightvery slightvery slight
Table 7. Data of EIS results from the equivalent circuits which were obtained from EC Lab Fitting Software for RP, CER1, and CER3 after immersion in 3.5% NaCl solution for 4 days.
SampleQ1 (Q2), F cm−2n1R2, Ω cm2Q3, F cm−2n2R3, Ω cm2|Z| at 0.01 Hz (Ω cm2, log10)
RP6.34 × 10−90.7931,1006.30 × 10−50.6228,1024.8
CER17.6 × 10−100.9561,2992.84 × 10−50.71295,3805.3
CER33.77 × 10−100.912,142,0006.32

