Article

Effect of Particle In-Flight Behavior on the Microstructure and Fracture Toughness of YSZ TBCs Prepared by Plasma Spraying

1
Mechanical and Electrical Engineering Institute, Zhengzhou University of Light Industry, Zhengzhou 450000, China
2
Henan Key Laboratory of Intelligent Manufacturing of Mechanical Equipment, Zhengzhou 450000, China
*
Author to whom correspondence should be addressed.
Coatings 2018, 8(9), 309; https://doi.org/10.3390/coatings8090309
Submission received: 29 July 2018 / Revised: 20 August 2018 / Accepted: 30 August 2018 / Published: 4 September 2018
(This article belongs to the Special Issue Advanced Ceramic Coatings and Interfaces)

Abstract

:
The present study aims to elaborate particle in-flight behavior during plasma spraying and its significance in determining the microstructure and mechanical properties of plasma sprayed yttria partially stabilized zirconia (YSZ) thermal barrier coatings (TBCs). The as-sprayed YSZ coatings were characterized in terms of defects (such as pores, unmelted particles and cracks) and fracture toughness. The results showed that, due to the higher temperature and velocity of in-flight particles in a supersonic atmospheric plasma spraying (SAPS) compared to that of atmospheric plasma spraying (APS), denser coatings were formed leading to a better fracture toughness. The percentage of defects of the microstructure was similar to the temperature and velocity of particles in-flight during plasma spraying. Furthermore, the structural defects had a strong effect on its mechanical behavior. The total defect percentage and fracture toughness in SAPS-TBCs spanned 6.9 ± 0.17%–13.26 ± 0.22% and 2.52 ± 0.06 MPa m1/2–1.78 ± 0.19 MPa m1/2; and 11.11 ± 0.36%–17.15 ± 0.67% and 2.13 ± 0.08 MPa m1/2–1.4 ± 0.12 MPa m1/2 in APS-TBCs.

1. Introduction

The thermal spraying process (TSP) aims to deposit some special metallic or nonmetallic materials onto the surfaces of pretreated matrices. Before deposition, these materials must be heated into molten or semi-molten states using heat sources like plasma arc or combustion flames. Due to the flexibility and high economic benefits of the TSP process, it is used to fabricate coatings with good performance in heat resistance, wear resistance and corrosion resistance; in many industries [1,2,3,4]. The plasma spraying, as one important part in TSPs, is a highly complex process, which mainly consists of the production of plasma, the transformation of heat and momentum between plasma and powder particles, and the flattening, splatting and stacking of molten or semi-molten particles after impacting the matrix [3,4,5]. The complex variables and parameters at the different links of the plasma spraying process mainly contain the structural parameters of spray torch, the production process parameters of the plasma, the size and morphology of the powder, the powder feeding conditions, the in-flight behavior of powder particles in the plasma jet, and the matrix conditions when depositing coatings [5,6,7,8,9,10,11]. They have a direct influence on the melting state and movement behavior of the particles before impacting the matrix and then affect the microstructure of deposited coatings, which further influences the thermodynamic properties (adhesion strength, hardness, Young’s modulus, fracture toughness, and thermal conductivity) and service properties (thermal cycle life, oxidation resistance properties, and heat insulation effects) of coatings [4,5,6,7,8,9,10,11]. The researchers have taken efforts to obtain demanding coatings with reliable properties through operating and controlling the spraying processes accurately, but they still face a lot of challenges because of the complexity of the plasma spraying process [7,8,9,10,11,12,13,14]. These challenges restrict the further development of plasma spraying technology, especially for the fabrication of high-property thermal barrier coatings (TBCs). It is well known that the spraying process parameters have an obvious influence on the microstructure and properties of deposited coatings. Therefore, to obtain the high-property TBCs, and improve their competitiveness when compared with other alternative materials, the composition and microstructure of coatings have to be controlled accurately. Only by this, the TBCs could take advantage of all aspects to protect the hot-section components of metals and improve the service life and efficiency of aero gas turbine engines [12,13,14,15] and then the aero-engine could work under more demanding service environments.
So far, in practical production, parameters including current, voltage or plasma gas flow rate are adjusted, depending on empirical data, to control the energy density and stability of the plasma jet. In addition, based on the metallographic examination and physical-chemical properties of the coating samples, contrast experiments are performed to optimize and verify the coating quality [16,17,18]. Apparently, these methods can hardly ensure the precise control of the structure and properties of coatings and the quality stability of batches. This is mainly related to the mutual coupling among parameters in the coating deposition process, the change of the coating fabrication environment, and the burning loss of injectors and electrodes during the working processes of the spray torch. The above factors affect the properties of the plasma jet, the heating and accelerating process of flying particles in a jet, and then influence the microstructure and stability of the coatings. In addition, this is the main reason why in the practical fabrication and utilization processing of coatings, the properties of coatings fabricated under the same process parameters have significant differences [19,20,21]. Furthermore, this kind of experimental method has many disadvantages including large amounts of work, long experimental periods, and low efficiency. For modern high-property TBCs, such methods cannot meet the demands for precise control of the fabrication process and coating quality.
In recent years, with the continuous progress in science and technology, especially after different kinds of online monitoring instruments for the flying states of jet particles (velocity, temperature, and size distribution) and judging tools for jet properties (enthalpy) appear [21,22,23,24,25], domestic and foreign researchers have conducted lots of pre-explorations to precisely control the microstructures and properties of coatings. It is generally recognized that under the condition that the matrix temperature has reasonable control, the flying velocity and temperature of particles before impacting the matrix are the main factors that influence the microstructure and final properties of the coatings. In view of this, the in-flight behavior of particles could be detected using online detection devices, and the particle flying velocity and temperature could be chosen as the medium to investigate the influence rule of the in-flight behavior of particles on the coating composition and microstructure. Additionally, the feedback regulation process parameters of particle flying characteristics, coating composition and microstructure, could be built; which makes it possible for the coating’s microstructure and properties to be controlled accurately. This could provide the theoretical basis and experimental basis for the precise control of a coating’s structure and the quality stability of batches of high-property TBCs. In this study, the temperature and velocity monitoring system, Spray Watch 2i, was used to constantly monitor the in-flight behavior of plasma particles in two kinds of plasma generators. The multi-parameter problem could be translated into a two-parameter problem and these two parameters were temperature and velocity. The quantitative relationship between particle in-flight behavior (temperature and velocity) and coating microstructure could also be built. Finally, methods for the precise control of the microstructure of TBCs, fabricated by plasma spraying technology were built.

2. Experimental Materials and Methods

In this experiment, micron-YSZ powders prepared by the spray-drying process were taken as the raw materials. The morphology and size distributions of these powders are shown in Figure 1. The coatings were deposited by two kinds of spraying devices, atmospheric plasma spray (APS, Sluzer Metco 9M, Winterthur, Switzerland) and supersonic atmospheric plasma spray (SAPS, The Academy of Armored Forces Engineering, Beijing, China). The core of these two devices was a spray torch Sluzer Metco 9M and a SAPS internal feedstock mode spray torch, respectively. The main process parameters for the two spraying patterns are shown in Table 1.
During each spraying process, the surface temperature and in-flight velocity of particles in the jet before impacting the matrix (the temperature of the matrix was kept at 150 °C by cooling it with compressed air), were examined by the online monitoring system Spray Watch 2i (Osier, Tampere, Finland). The results are shown in Table 2. When monitoring the particles, the focal lengths of the APS and the SAPS spraying systems were fixed at 220 and 185 mm, respectively. This aimed to allow the area of the explorer view of the monitoring page to account for around two-thirds of that of the total explorer view pages. Compared with the APS system, the SAPS system had a finer jet. To improve accuracy, the temperature and velocity were measured five times during each spraying process, and the average values of these two kinds of parameters were chosen as the final values. The matrix temperature was measured using an infrared thermometer (Raytek, Santa cruz, CA, USA), and it was kept at 150–200 °C using a forced draught cooling system.
The fracture toughness of coatings was measured using a micro-hardness tester (MicroMET 3 micro-hardness tester, Buehler Ltd., Lake Bluff, IL, USA). The Vickers indentation test was performed on the polished cross-section of the coating, which was measured at least 20 times in random different areas with a load of 5 N and 10 s holding time, keeping at least five times greater than the diagonal length of indentation between consecutive indentations. The fracture toughness of as-sprayed coatings was determined by Equation (1):
K IC = k total [ P a L   ]
where the coefficient, ktotal, equated to kp multiplied by 2 (kp is an empirical constant of fracture toughness in the Palmqvist model, kp = 0.0319); P is the indentation load, which was 2.94 N in this study; L is the total surface crack length, including all the cracks around the indent; a is the average Vickers indentation half diagonal size, where
  a = 2 a 1 + 2 a 2   4
L = n l y n  

3. Result and Discussion

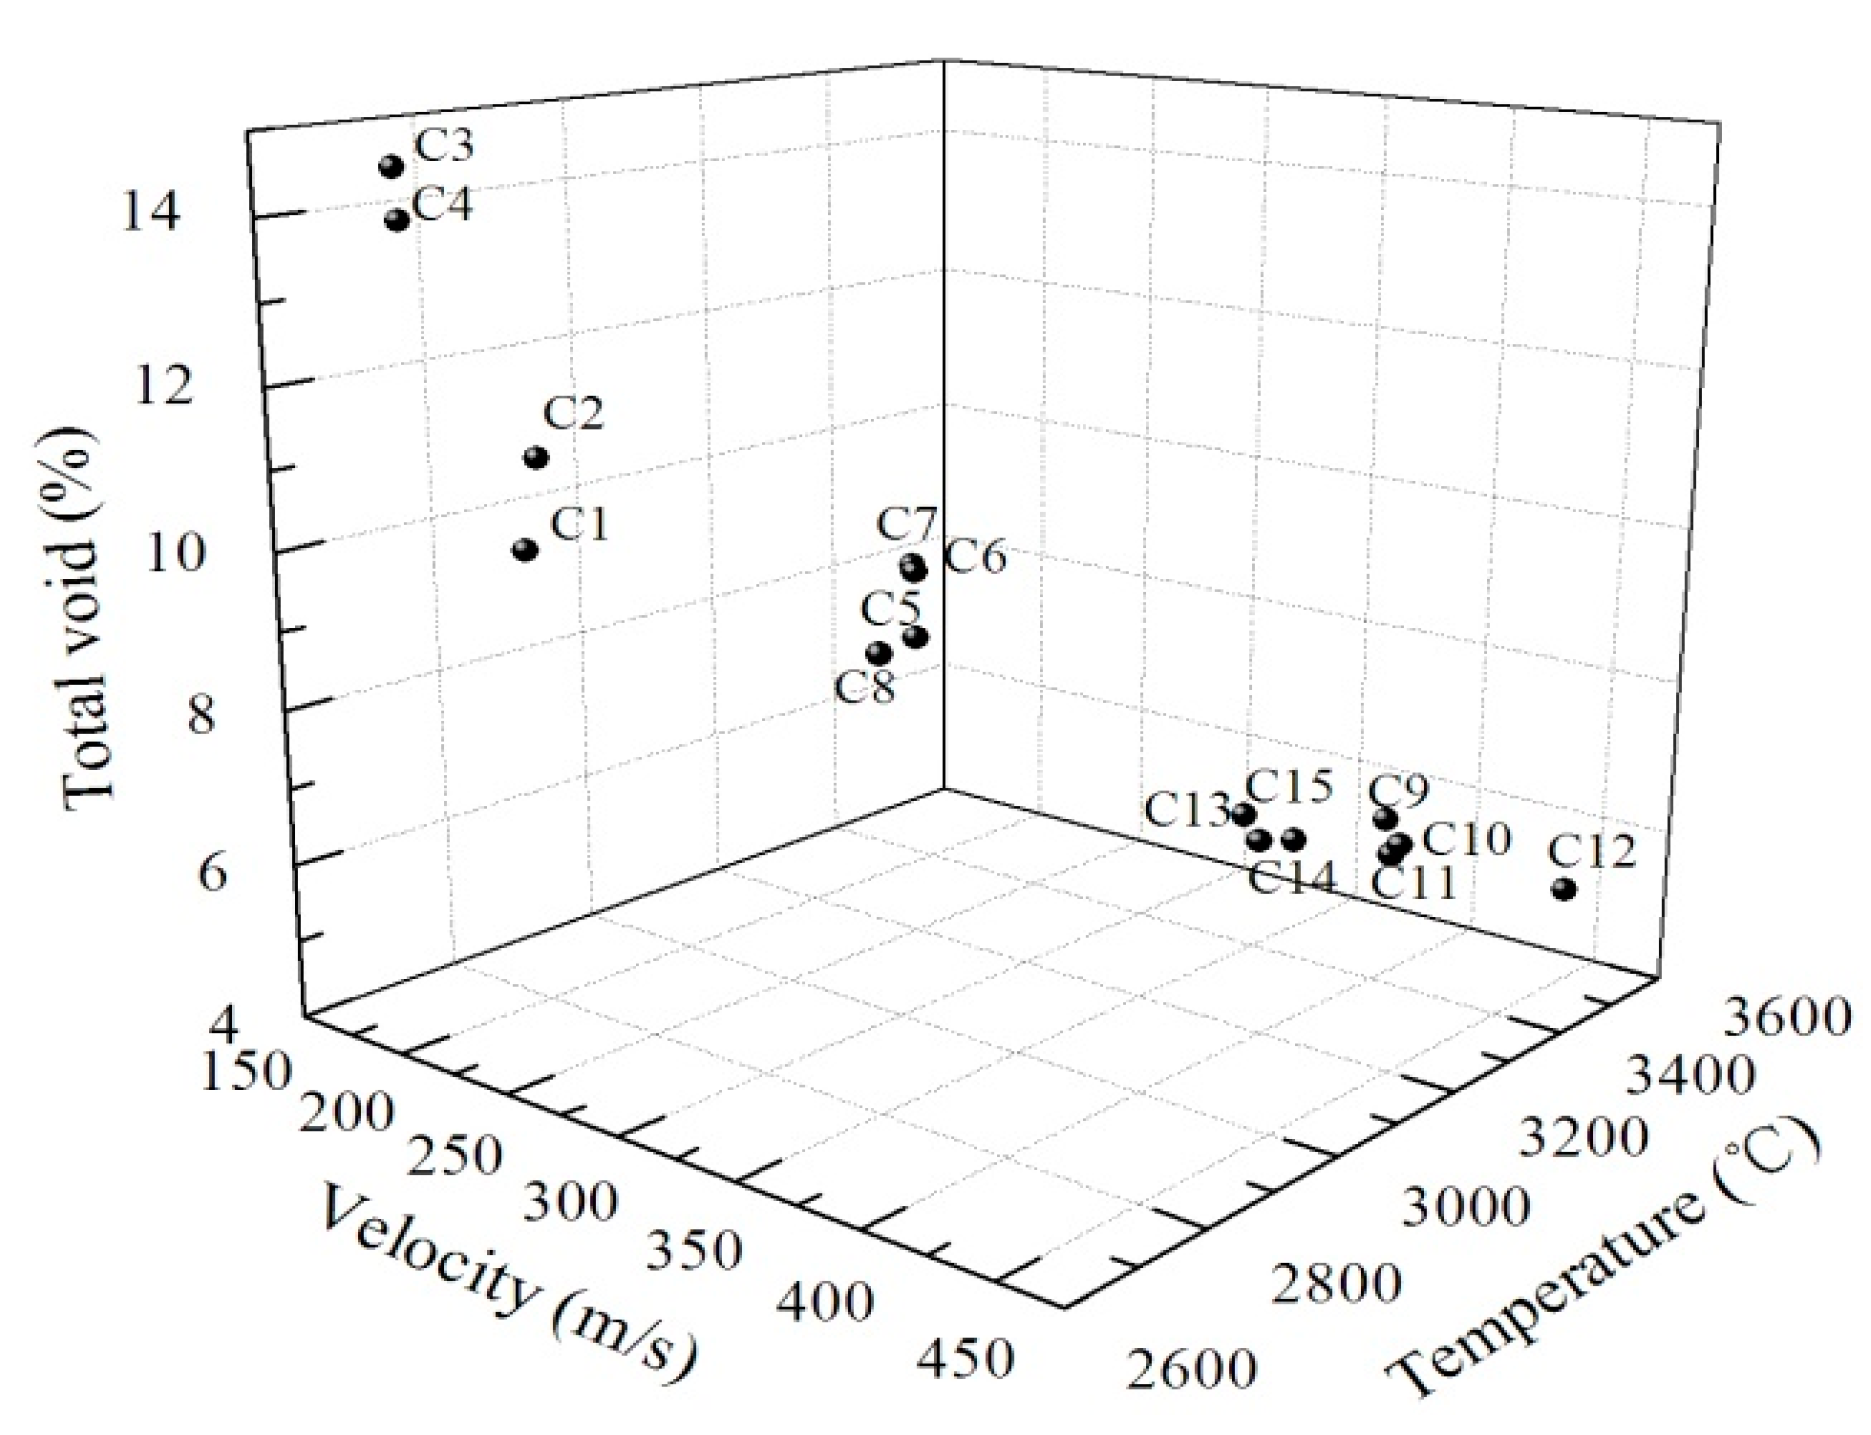
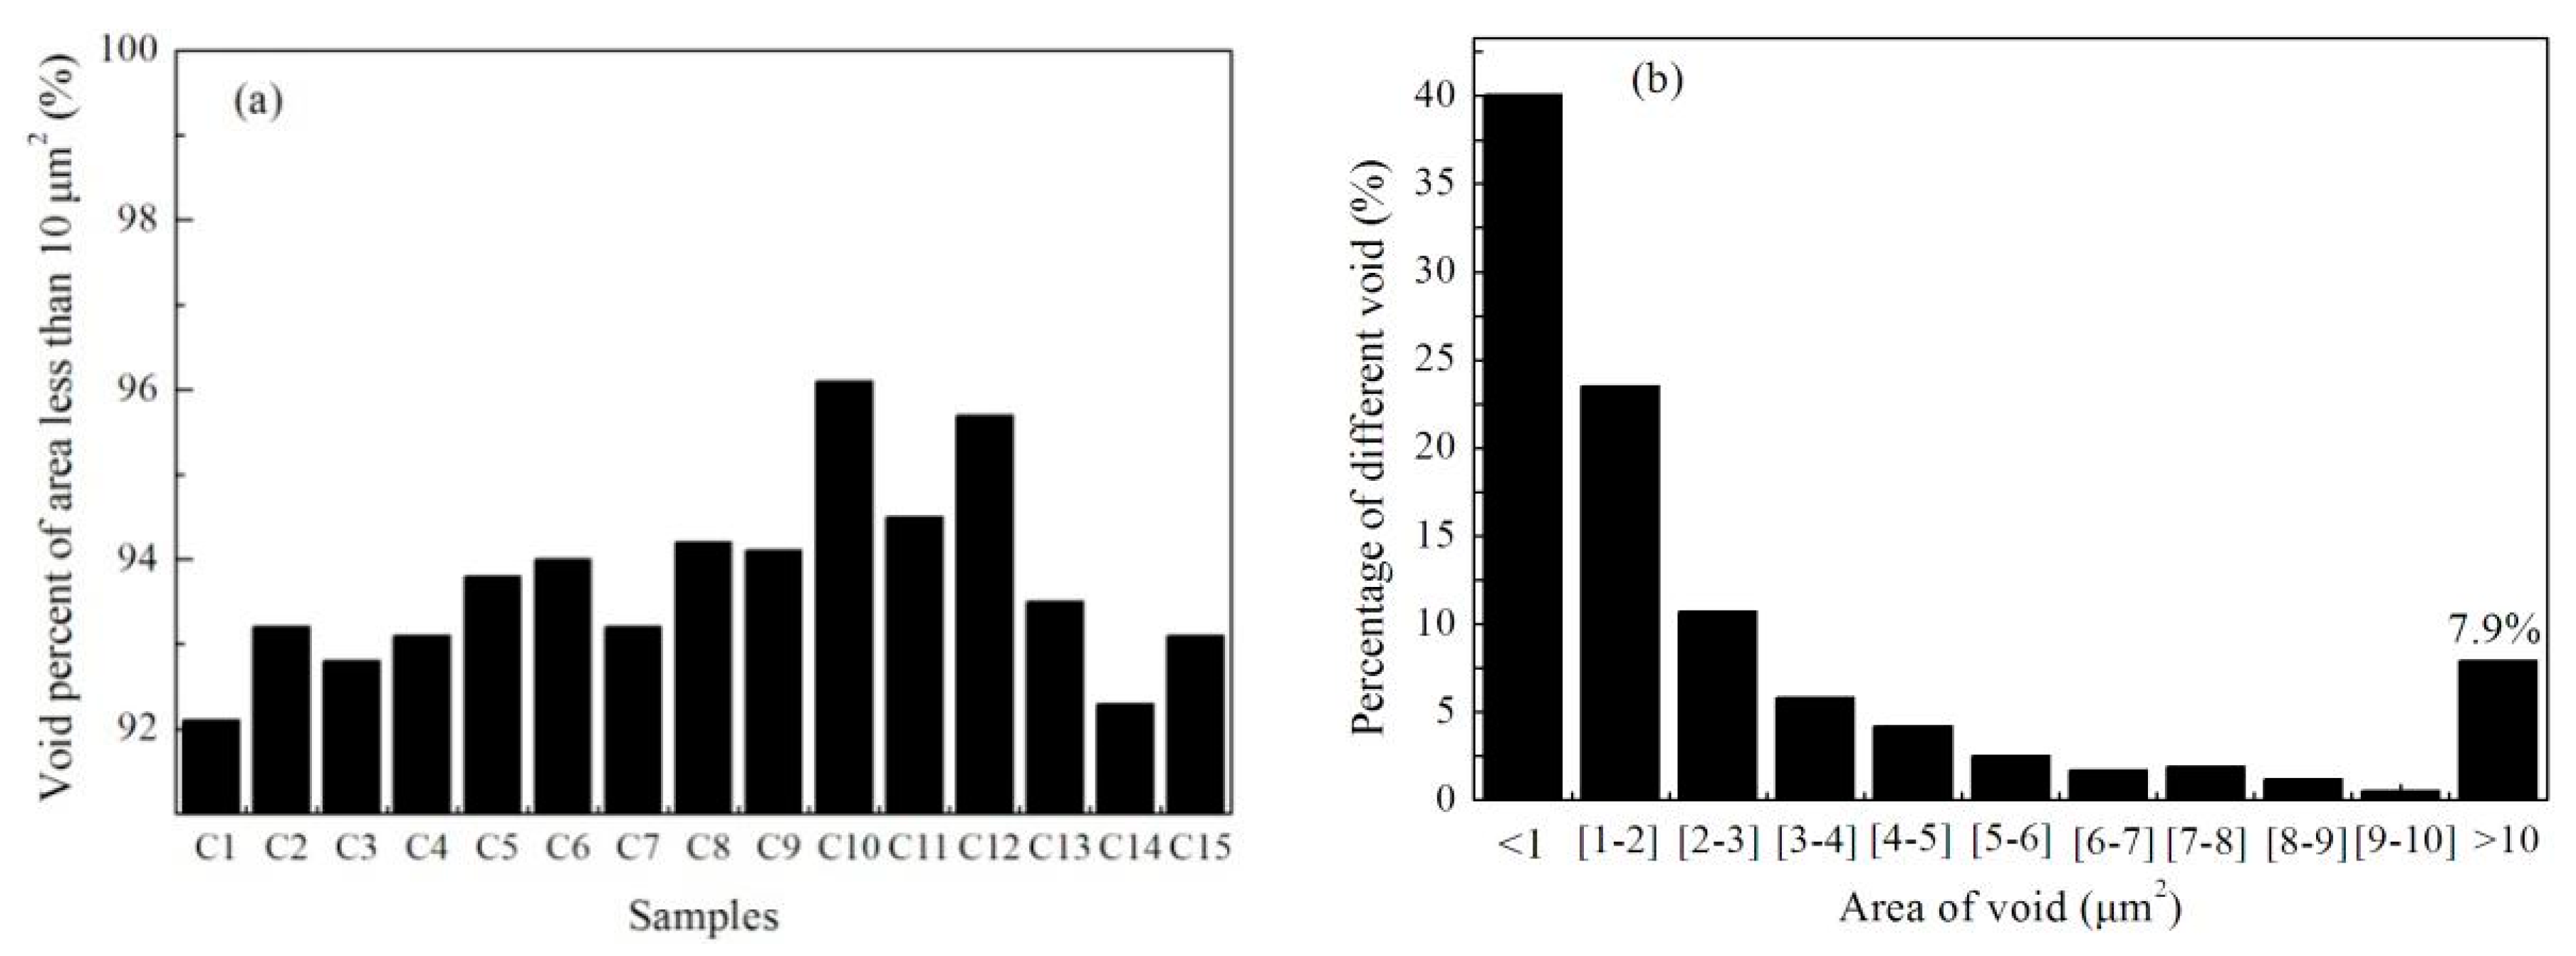
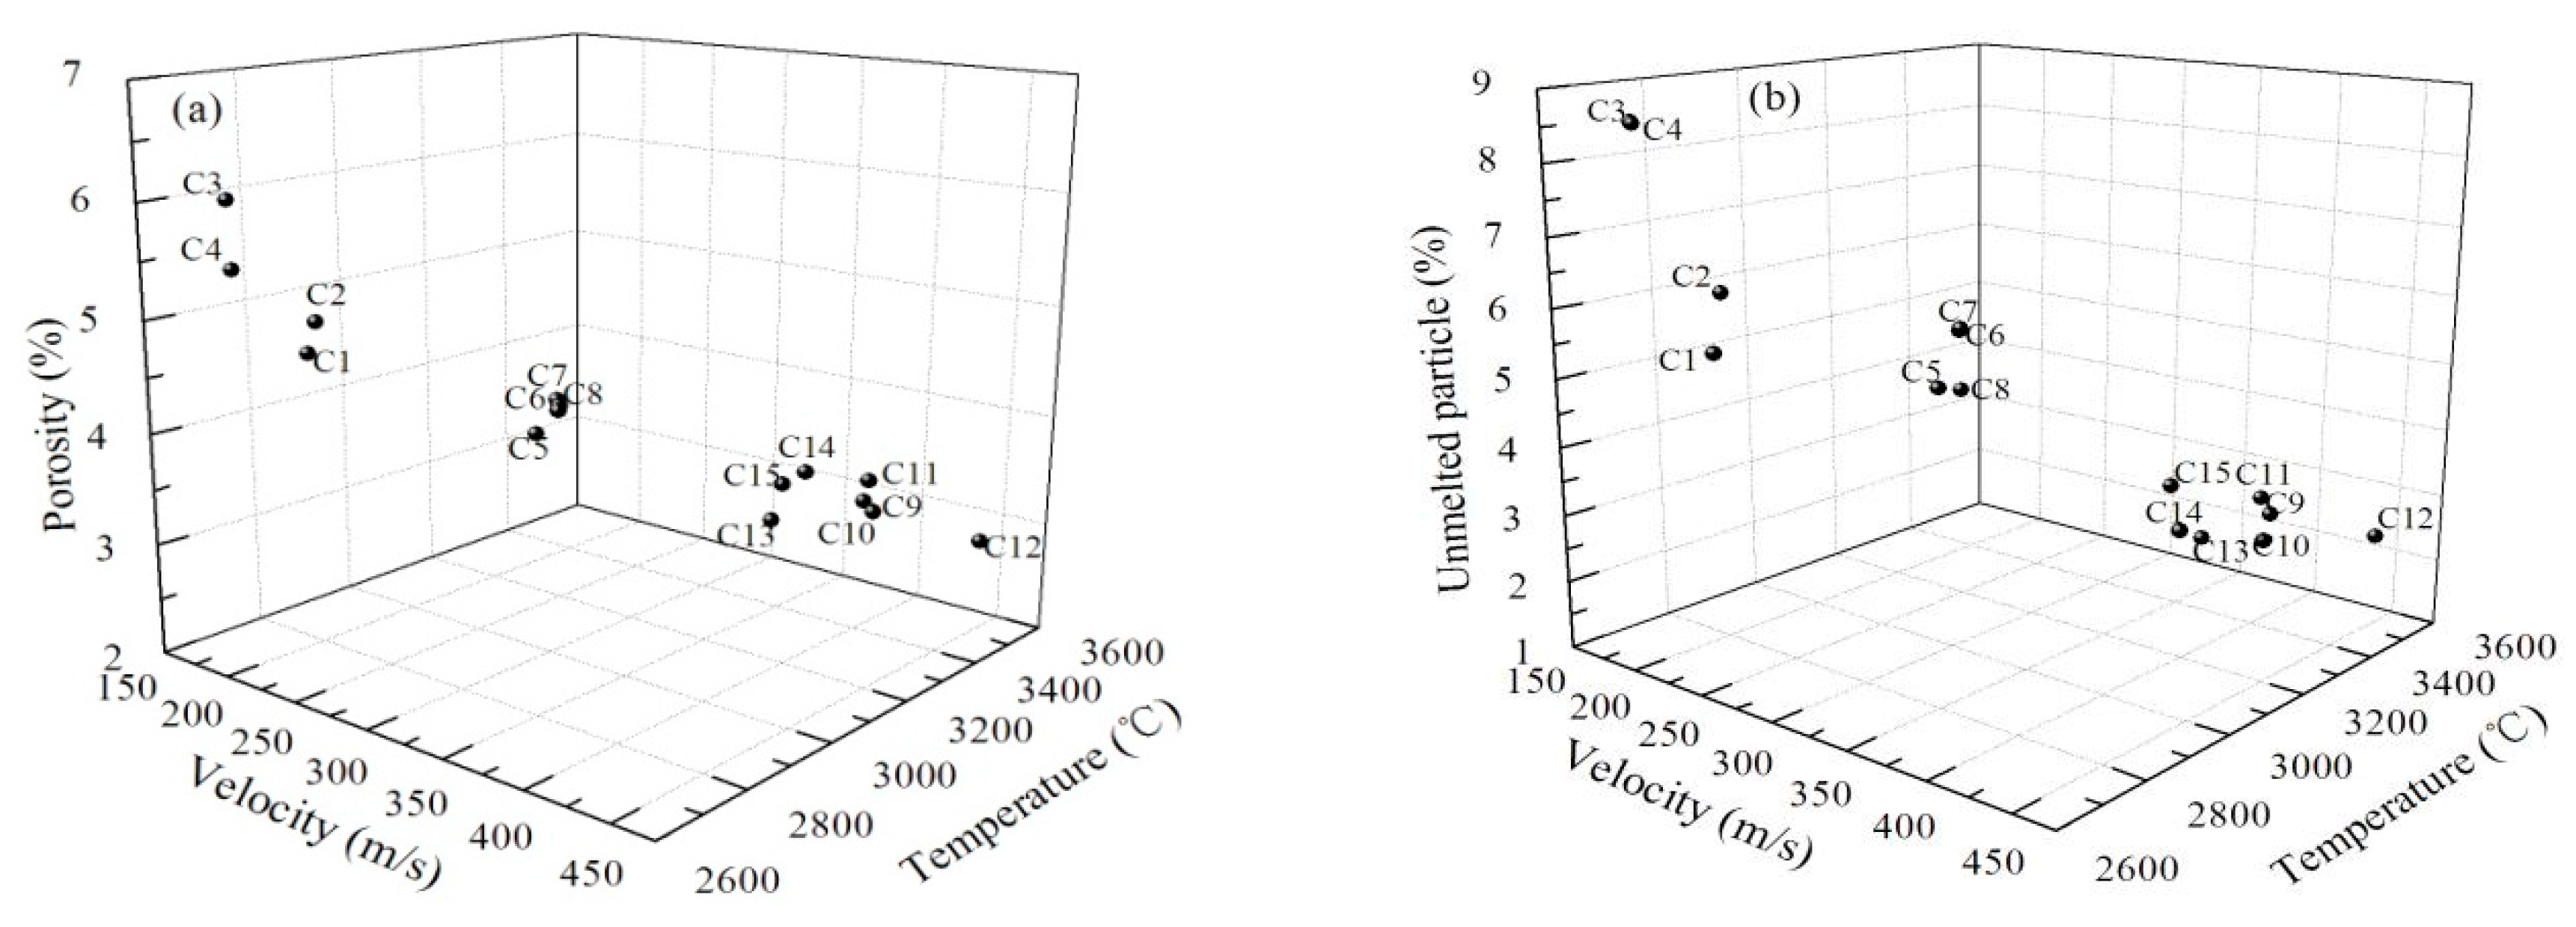
3.1. Influence of Flying Particle Characteristics on the Microstructure of Deposited Coatings

The influence rule of the temperature and velocity of flying particles on the total voids of coatings is shown in Figure 2. It can be seen that the higher the temperature or velocity of the particles, the lower the percentage of total void area in the total coating area. When the temperature was between 2689 and 2693 °C, and the velocity was between 180 and 185 m/s, the total voids accounted for 14% ± 0.5%. When the temperature was between 2843 and 2853 °C and the velocity was between 225 and 231 m/s, the total voids accounted for 7% ± 1%. When the temperature was between 3242 and 3524 °C, and the velocity was between 380 and 450 m/s, the total voids accounted for 5% ± 1%.
The above results could be explained as follows. On one hand, the higher the temperature of the particles, the larger the melting degree of the coatings, which makes the proportion of unmelted particles lower. On the other hand, the larger the velocity of the particles, the larger the momentum of the particles when impacting the matrix. Meanwhile, the droplets on the surface of the matrix would spread better, which means that the coatings have a better flattening condition. The smaller the distance between two adjacent layered structures, the lower the percentage of small porosities. The combination of these two factors, described above, finally led to a comparatively lower total void. Besides this, when both the particle temperature and velocity tend to one certain set of values, the proportion of total voids in one coating would also tend to a certain value. This inferred that the spraying process has a good repeatability, which means that the coating quality could remain stable.
In coatings, there are three ways to form the voids. Some air in coatings, which was involved in the spraying process, formed regular voids. Irregular voids often appeared between two layered structure, which formed as a result of the particles stacking particles. In addition, some particles which unmelted particles could form voids. Compared to the third kind of void, the size of the former two kinds of voids was smaller. Thus, these two kinds of voids could also be called pores. The analyzed results relating to the voids of the above fifteen coatings showed that the percentage of voids, which were smaller than 10 μm2 in area was for more than 90%. These data are presented in Figure 3a. Furthermore, the analyzed results show that the percentage of the voids is large when the area of the voids is small in total voids; as shown in Figure 3b. Besides this, it can be seen from the morphology analysis, that the formation of voids of more than 10 μm2 in area resulted from the unmelted particles. Therefore, in this study, it was assumed that the voids with less than 10 μm2 in area were pores and that the voids of more than 10 μm2 in area were unmelted particles. In this case, the influence of the temperature and the velocity of particles, before impacting the matrix on the coating porosity ratio and the percentage of unmelted particles, could be analyzed.
Figure 4a,b show the influence rule of the temperature and velocity of particles, before impacting the matrix of the coating porosity ratio and the percentage of unmelted particles. It can be seen that as the temperature and velocity increased, both the coating porosity ratio and the percentage of unmelted particles tended to decrease. When the temperature was between 2689 and 2693 °C, and the velocity was between 180 and 185 m/s, the coating porosity ratio and the percentage of unmelted particles were 5.5% ± 0.5% and 8.5% ± 0.5%, respectively. When the temperature was between 2843 and 2853 °C, and the velocity was between 180 and 185 m/s, the coating porosity ratio and the percentage of unmelted particles were 4.5% ± 0.2% and 5.5% ± 0.5%, respectively. When the temperature was between 3213 and 3280 °C, and the velocity was between 225 and 231 m/s, the coating porosity ratio and the percentage of unmelted particles were 3.5% ± 0.5% and 3.5% ± 0.5%, respectively. When the temperature was between 3242 and 3524 °C, and the velocity was between 380 and 450 m/s, the coating porosity ratio and the percentage of unmelted particles were 2.5% ± 0.2% and 2.5% ± 0.5%, respectively. This is because the area of pores and unmelted particles of coating with high-temperature and high-speed particles is much smaller than that of coatings with low-temperature and low-speed particles, although all of the percentage of the coating voids only exhibited small difference. (more than 90%). Additionally, for each of the fifteen kinds of coatings, the coating porosity ratio was less than the percentage of unmelted particles. This was mainly related to the area of coating voids and unmelted particles. Although the number of voids in coatings was much bigger than that of the unmelted particles, the area of large unmelted particles was much higher than that of the voids.
Combined with the influence rule of the particle temperature and velocity on the microcrack density and length in coatings, the distribution rule of microcrack length with different angles in typical coatings, within different ranges of temperature and velocity, could be analyzed; as shown in Figure 5. Apparently, it can be seen that in all of the six kinds of coatings, the microcracks that were less than 5 μm in length had the largest percentage in the total cracks and these microcracks had various orientations. The percentage of cracks that were 5 to 10 μm in length took the second place. The macrocracks that were more than 15 μm in length accounted for the lowest percentage. In addition, compared with the APS coatings, the SAPS coatings had the largest crack density and also the length of the longest crack in the latter coatings was larger.
The microstructure morphologies of the coatings under different temperatures and velocities are shown in Figure 6. It can be seen intuitively that the higher the temperature and velocity, the smaller the area of the unmelted particles. Accordingly, the lower the porosity ratio, the larger the crack density, which was in agreement with the statistic results in Figure 5. Among the particles in the jet of the SAPS system, the phenomenon of deformation breakage could be found easily. After stacking the broken and flattened particles, lots of microcracks were found. This was mainly because, in the jet of the SAPS system, the resistance from fluid fluid acted on the particles (drag force from other particles) was larger than the cohesive force of the melted particles (surface tension). However, in the APS system, the melted particles did not break as usual due to the drag force of the particles from other particles being small.

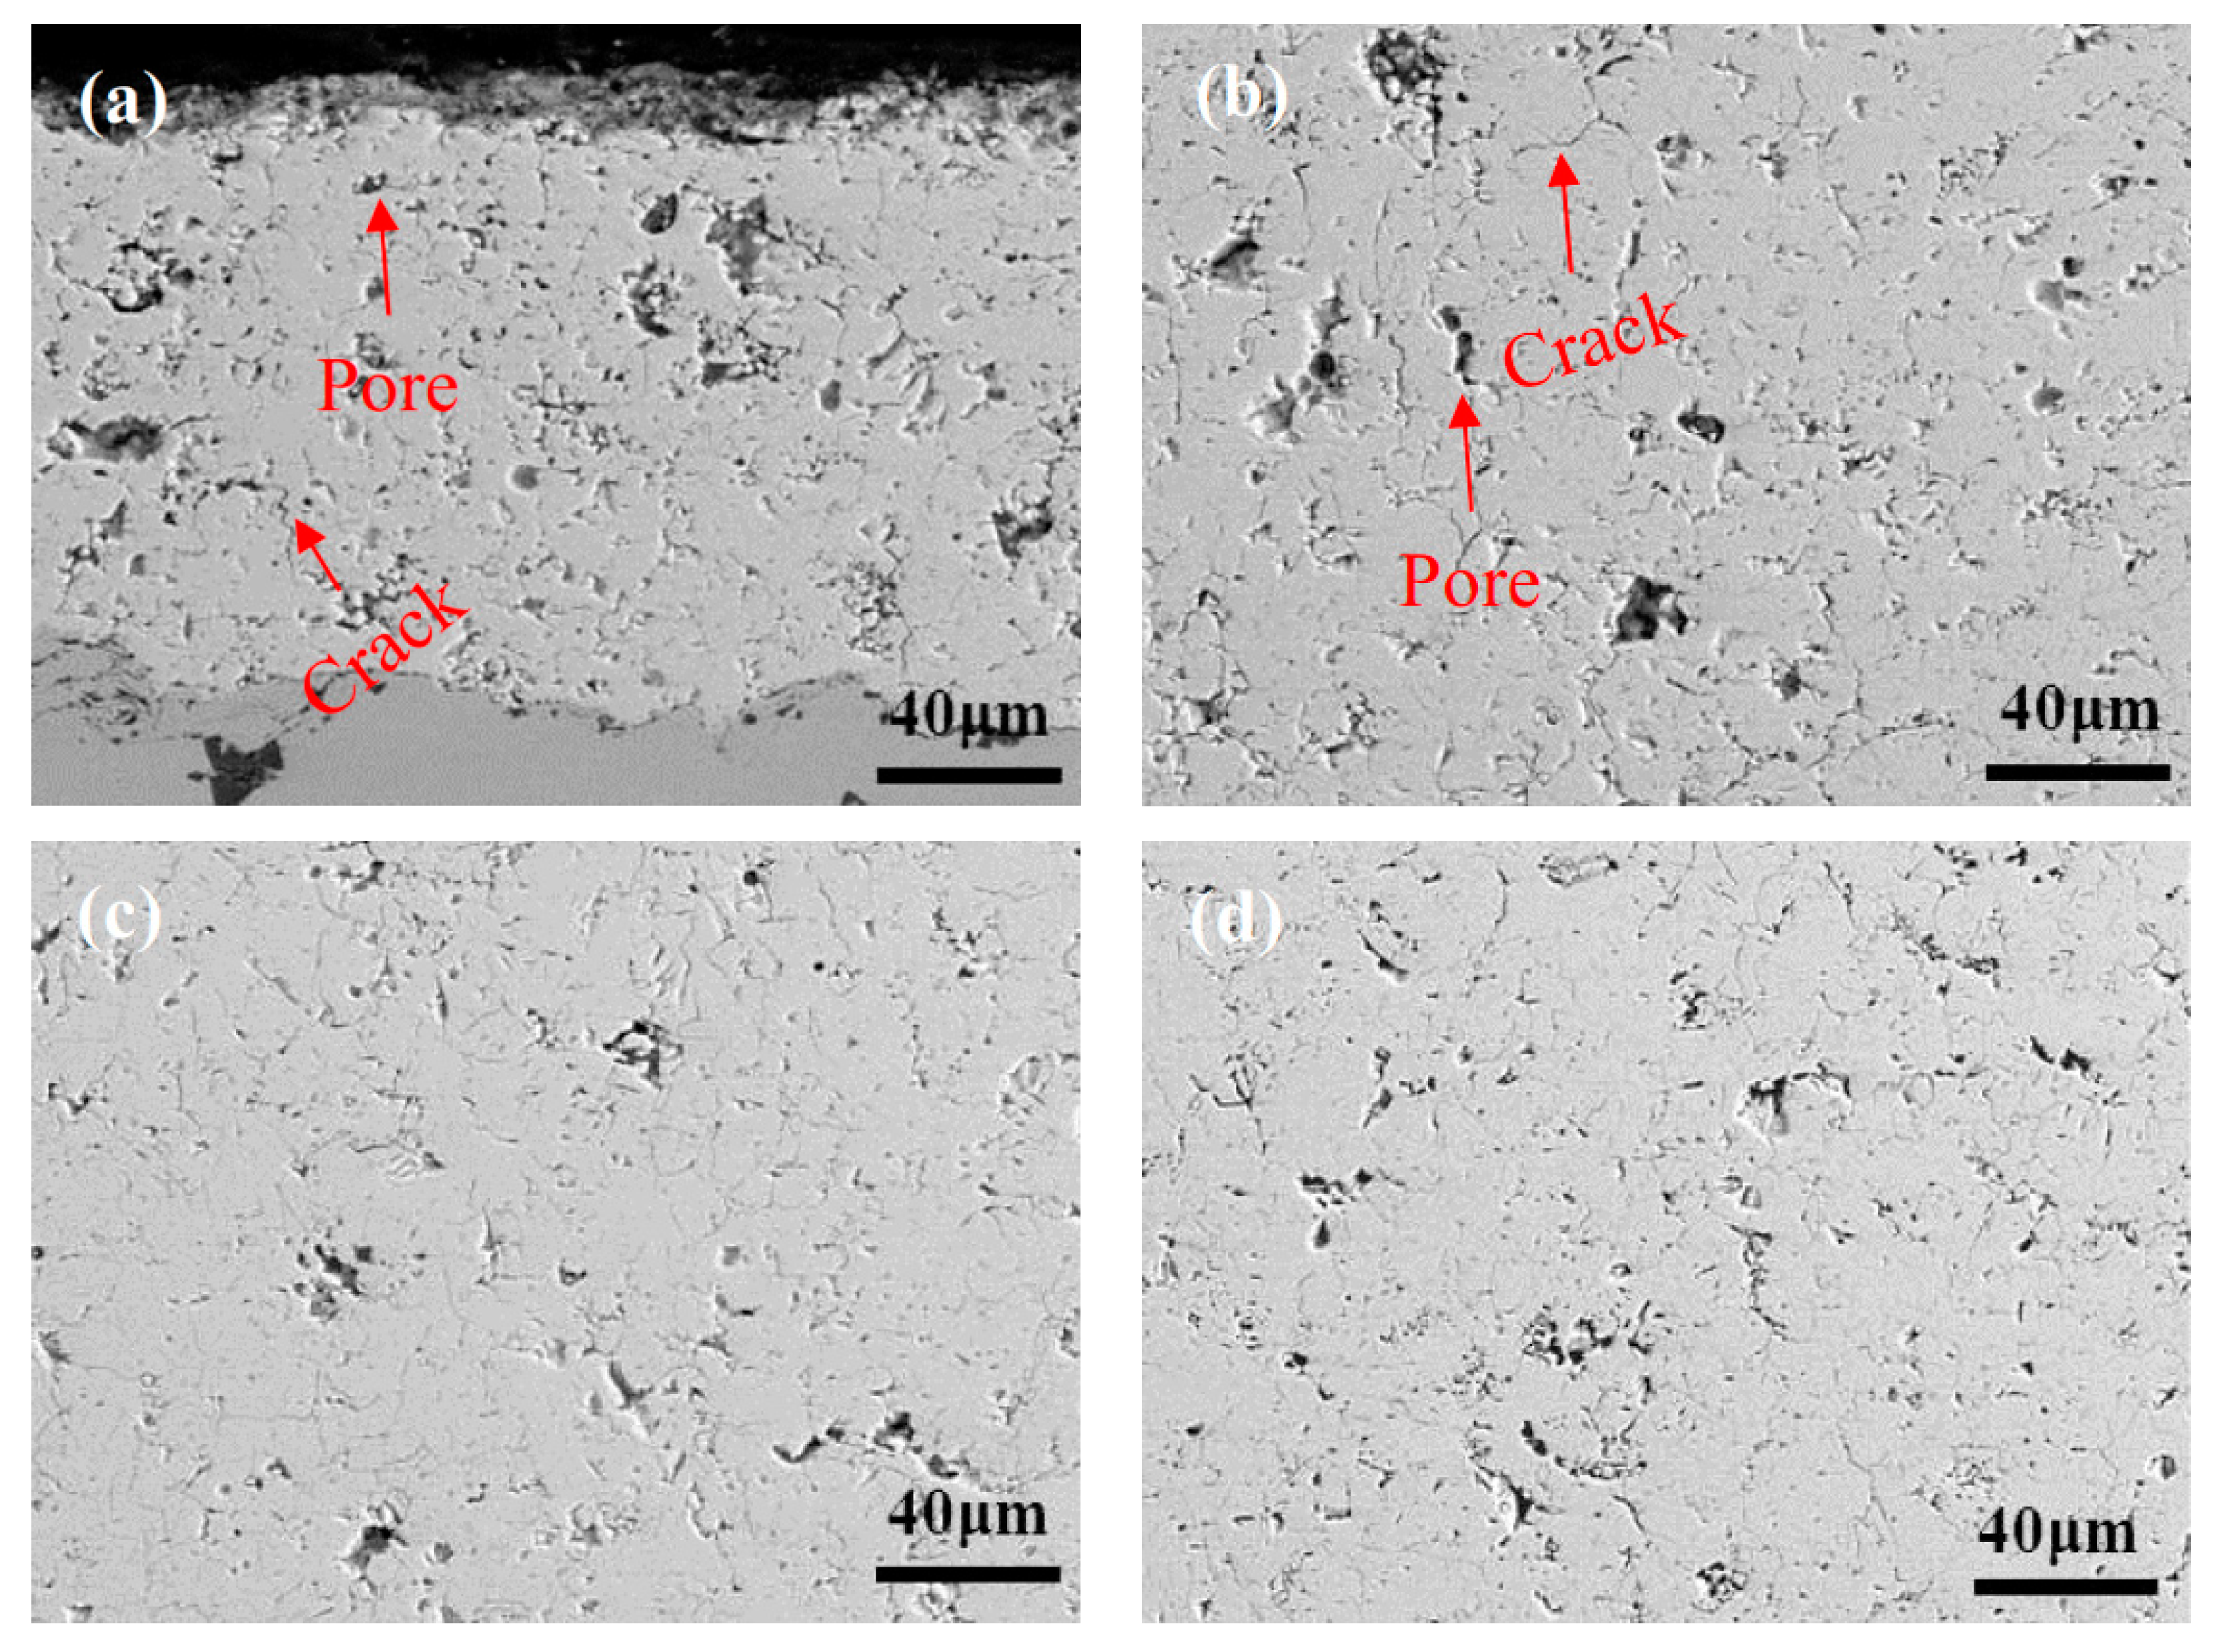
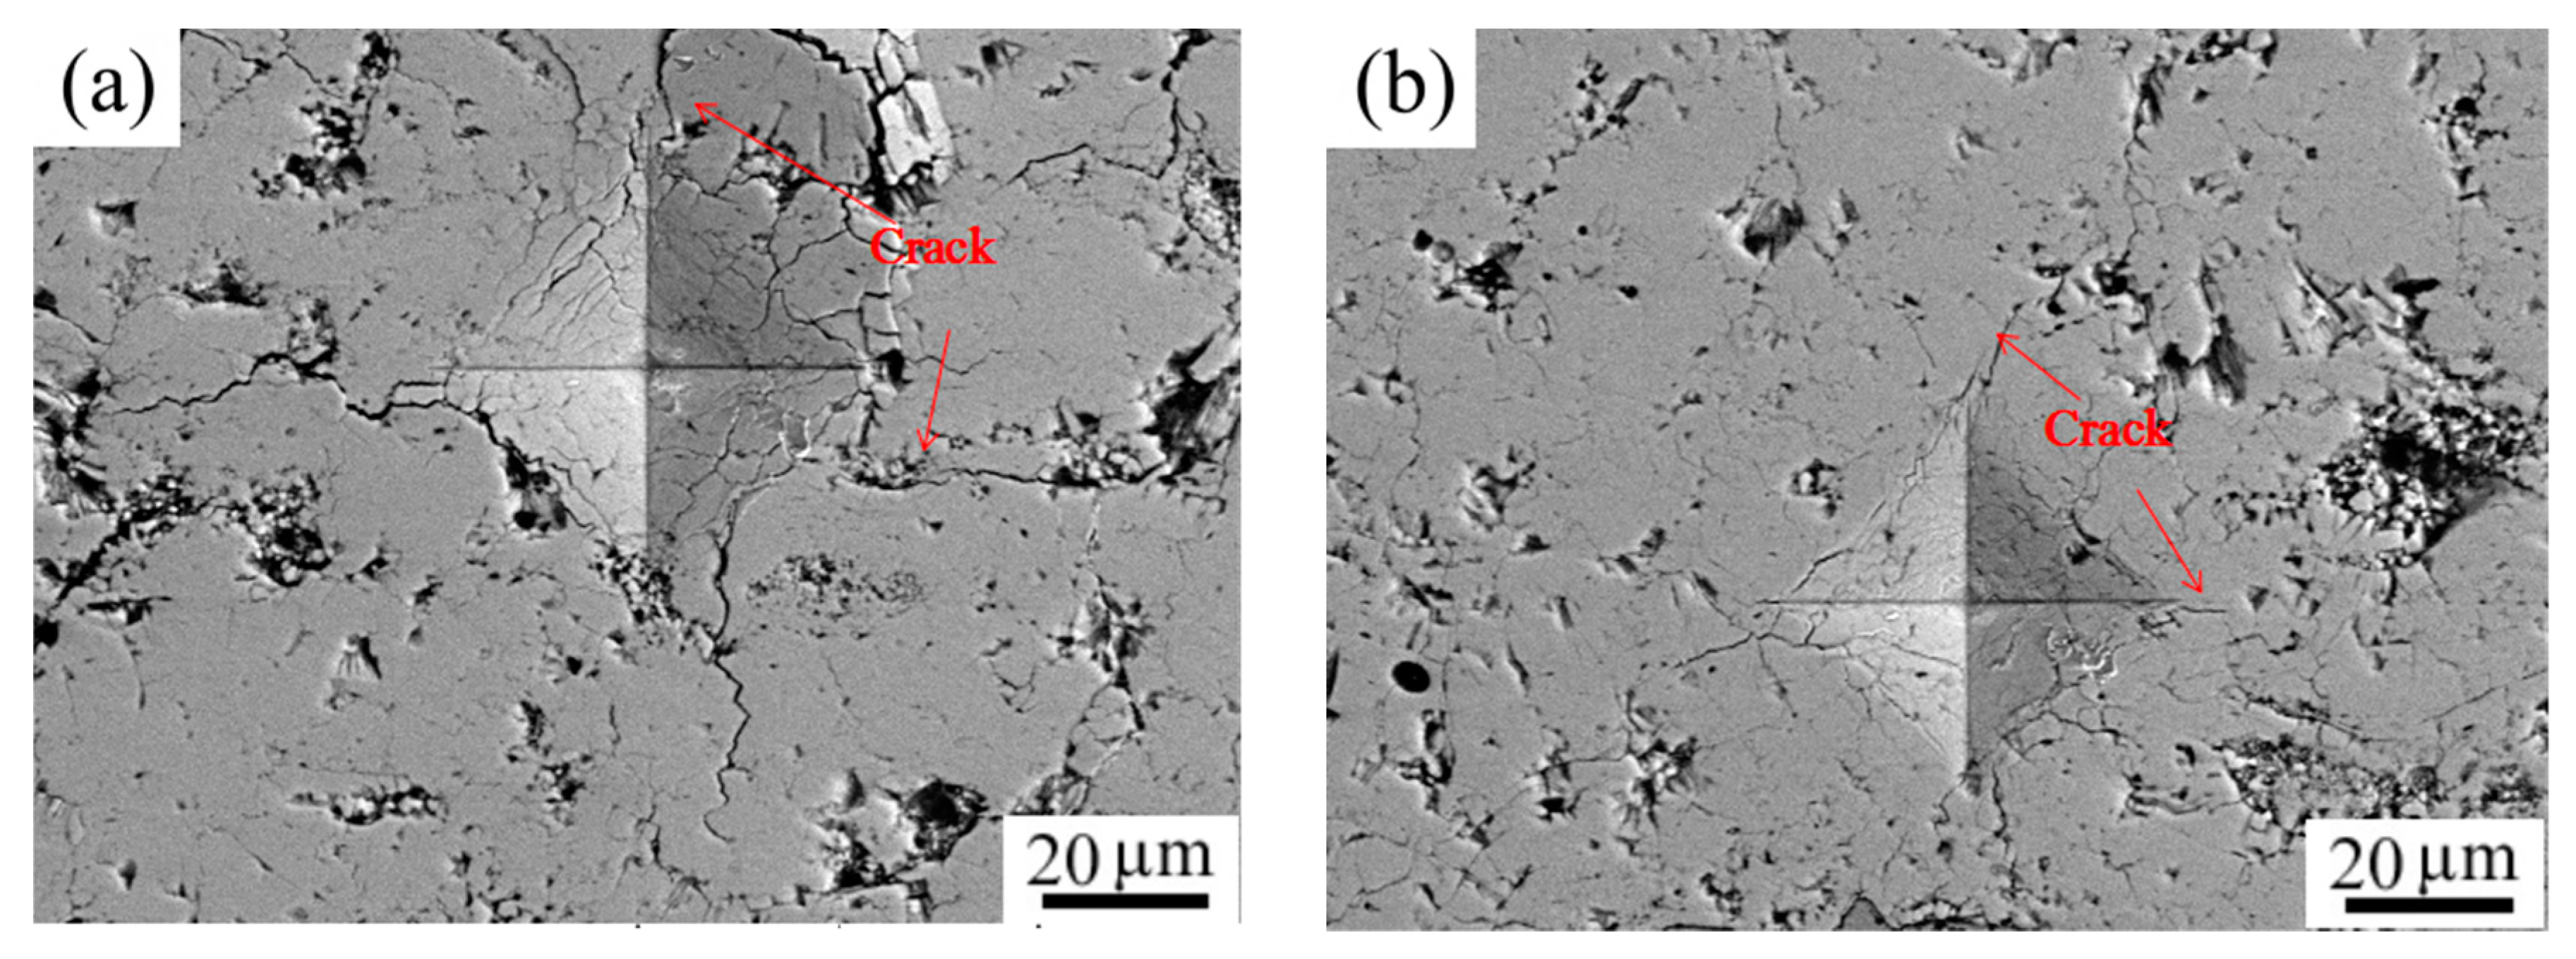
3.2. Influence of Microstructure on the Fracture Toughness of Deposited Coatings

In this Vickers indentation test, performed on polished cross-sections, the load was 5 N. In order to determine the mean crack length, the indentations were examined by SEM. The coating gradually experienced elastic and a little plastic deformation, before finally fracturing. Typical Vickers indentations and cracks of the polished cross-section of as-sprayed coatings are shown in Figure 7. Once the stress intensity factor, K1, in representative coatings reached its fracture toughness, KIC, a pair of radical cracks usually began nucleation near the corner angles of the Vickers indentation and then presented as a semi-ellipse shape along the indentation direction. Figure 8a,b depict the relationship between the total defects and fracture toughness or the crack percentage and fracture toughness respectively. It is revealed that the fracture toughness improved as the total defect decreased. In addition, the KIC values in SAPS were higher than that of APS as a whole (by Figure 8a). Similar to the relationship between crack percentage and elastic modulus, although with approximate total defects, the KIC values of C13, C14, and C15 (SAPS) with a higher crack percentage was larger than that of C3 and C4 (APS). During the sintering and cooling of spraying, ZrO2 coatings formed microcracks in the dispersion distribution on the top layer. Then, microcracks formed in the process zone of the main crack tip, and the main crack was extending, resulting from stress-induced phase transformation. These small microcracks led to main crack bifurcation, or change in direction, which increased the effective surface energy in the extension process of the main crack. In addition, this also played a role in the dispersion of the crack tip energy, inhibited by the rapid extension of the main crack and improved the toughness of the coating.
To sum up, the structural defects of SAPS-TBCs were decreased through increasing the in-flight particle velocity and temperature. According to Vardelle [27], when the particle velocity and temperature are increased, the flattening degree increases with a linear trend. As particles have a large flatness, the area of binding between flat particles increases and the defect content reduces due to incomplete inter-splat contact reduction. As a result, the SAPS-coatings had lower total defects, greater elastic modulus, higher bonding strength, and higher fracture toughness compared with that of the APS-coatings.

4. Conclusions

In this study, YSZ was chosen as the raw material and the coatings were deposited by two spraying processes—APS and SAPS. Using the temperature and velocity monitoring system, Spray Watch 2i, the multi-parameter problem was translated to a two-parameter problem related to particle temperature and velocity. A quantitative relationship between particle in-flight behavior (temperature and velocity) and coating microstructure was built. The main conclusions are as follows:
  • The temperature and velocity of in-flight particles of the SAPS-TBCs were higher than that of the APS-TBCs, resulting in the SAPS-TBCs having a denser microstructure with less structural defects and superior fracture toughness.
  • The correlation among the in-flight particle behavior, microstructure, and mechanical properties were established in SAPS-TBCs and APS-TBCs. It was found that with a higher temperature and velocity of particles in-flight, the structural defects decreased and furthermore the mechanical properties were enhanced (and vice versa).
  • The experimental results indicated that a relative high crack percentage, in a reasonable and proper content, may lower improved fracture toughness.

Author Contributions

Data Curation, Y.X.; Writing-Review & Editing, Y.X. and K.L.; Formal Analysis, E.R. and M.H.; Supervision, K.L.

Funding

This work was supported by the National Basic Research Program (NBRP, No. 2013CB035701), National Natural Science Foundation of China (NSFC, No. 51505434).

Acknowledgments

Great acknowledgement to Yu Bai and Lei Zhao, who provided much help.

Conflicts of Interest

The authors declare no conflicts of interest.

References

  1. Bobzin, K.; Öte, M.; Linke, T.F.; Sommer, J.; Liao, X. Influence of process parameter on grit blasting as a pretreatment process for thermal spraying. J. Therm. Spray Technol. 2015, 25, 3–11. [Google Scholar] [CrossRef]
  2. Berger, L.M. Hardmetals as thermal spray coatings. Powder Metall. 2013, 50, 205–214. [Google Scholar] [CrossRef]
  3. Hardwicke, C.U.; Lau, Y.-C. Advances in thermal spray coatings for gas turbines and energy generation: A review. J. Therm. Spray Technol. 2013, 22, 564–576. [Google Scholar] [CrossRef]
  4. Zhu, L.; Huang, W.; Cheng, H.; Cao, X. Thermal shock resistance of stabilized zirconia/metal coat on polymer matrix composites by thermal spraying process. J. Therm. Spray Technol. 2014, 23, 1312–1322. [Google Scholar] [CrossRef]
  5. Chen, Y.; Tessarini, S.; Sampath, S. Integrated study of APS YSZ coatings with different spray angle. J. Therm. Spray Technol. 2013, 22, 110–115. [Google Scholar] [CrossRef]
  6. Wang, L.; Wang, Y.; Sun, X.G.; He, J.Q.; Pan, Z.Y.; Wang, C.H. Thermal shock behavior of 8YSZ and double-ceramic-layer La2Zr2O7/8YSZ thermal barrier coatings fabricated by atmospheric plasma spraying. Ceram. Int. 2012, 38, 3595–3606. [Google Scholar] [CrossRef]
  7. Lamuta, C.; Girolamo, G.D.; Pagnotta, L. Microstructural, mechanical and tribological properties of nanostructured YSZ coatings produced with different APS process parameters. Ceram. Int. 2015, 41, 8904–8914. [Google Scholar] [CrossRef]
  8. Kromer, R.; Costil, S.; Cormier, J.; Berthe, L.; Peyre, P.; Courapied, D. Laser patterning pretreatment before thermal spraying: A technique to adapt and control the surface topography to thermomechanical loading and materials. J. Therm. Spray Technol. 2016, 25, 401–410. [Google Scholar] [CrossRef]
  9. Chandra, S.; Fauchais, P. Formation of solid splats during thermal spray deposition. J. Therm. Spray Technol. 2009, 18, 148–180. [Google Scholar] [CrossRef]
  10. Sobhanverdi, R.; Akbari, A. Porosity and microstructural features of plasma sprayed yttria stabilized zirconia thermal barrier coatings. Ceram. Int. 2015, 41, 14517–14528. [Google Scholar] [CrossRef]
  11. Karthikeyan, S.; Balasubramanian, V.; Rajendran, R. Developing empirical relationships to estimate porosity and Young’s modulus of plasma sprayed YSZ coatings. Appl. Surf. Sci. 2014, 296, 31–46. [Google Scholar] [CrossRef]
  12. Padture, N.P.; Gell, M.; Jordan, E.H. Thermal barrier coatings for gas-turbine engine applications. Science 2002, 296, 280–284. [Google Scholar] [CrossRef] [PubMed]
  13. Chen, L.B. Yttria-stabilized zirconia thermal barrier coatings: A review. Surf. Rev. Lett. 2006, 13, 535–544. [Google Scholar] [CrossRef]
  14. Carpio, P.; Rayón, E.; Salvador, M.D.; Lusvarghi, L.; Sánchez, E. Mechanical properties of double-layer and graded composite coatings of YSZ obtained by atmospheric plasma spraying. J. Therm. Spray Technol. 2016, 25, 778–787. [Google Scholar] [CrossRef] [Green Version]
  15. Manero, A.; Sofronsky, S.; Knipe, K.; Meid, C.; Wischek, J.; Okasinski, J.; Almer, J.; Karlsson, A.M.; Raghavan, S.; Bartsch, M. Monitoring local strain in a thermal barrier coating system under thermal mechanical gas turbine operating conditions. JOM 2015, 67, 1528–1539. [Google Scholar] [CrossRef]
  16. Ramachandran, C.S.; Balasubramanian, V.; Ananthapadmanabhan, P.V. Multiobjective optimization of atmospheric plasma spray process parameters to deposit yttria-stabilized zirconia coatings using response surface methodology. J. Therm. Spray Technol. 2011, 20, 590–607. [Google Scholar] [CrossRef]
  17. Bakan, E.; Mack, D.E.; Mauer, G.; Vaßen, R. Gadolinium zirconate/YSZ thermal barrier coatings: Plasma spraying, microstructure, and thermal cycling behavior. J. Am. Ceram. Soc. 2015, 97, 4045–4051. [Google Scholar] [CrossRef]
  18. Frommherz, M.; Scholz, A.; Oechsner, M.; Bakan, E.; Vaßen, R. Gadolinium zirconate/YSZ thermal barrier coatings: Mixed-mode interfacial fracture toughness and sintering behavior. Surf. Coat. Technol. 2016, 286, 119–128. [Google Scholar] [CrossRef]
  19. Dwivedi, G.; Wentz, T.; Sampath, S.; Nakamura, T. Assessing process and coating reliability through monitoring of process and design relevant coating properties. J. Therm. Spray Technol. 2010, 19, 695–712. [Google Scholar] [CrossRef]
  20. Oksa, M.; Metsäjoki, J. Optimizing NiCr and FeCr HVOF coating structures for high temperature corrosion protection applications. J. Therm. Spray Technol. 2015, 24, 436–453. [Google Scholar] [CrossRef]
  21. Fauchais, P.; Vardelle, M. Sensors in spray processes. J. Therm. Spar Technol. 2010, 19, 668–694. [Google Scholar] [CrossRef]
  22. Breede, A.; Kahali Moghaddam, M.; Brauner, C.; Lang, W.; Herrmann, A.S. Online process monitoring and control by dielectric sensors for a composite main spar. Mater. Sci. Forum 2015, 825–826, 936–943. [Google Scholar] [CrossRef]
  23. Cho, J.Y.; Zhang, S.H.; Cho, T.Y.; Yoon, J.H.; Joo, Y.K.; Hur, S.K. The processing optimization and property evaluations of HVOF Co-base alloy T800 coating. J. Mater. Sci. 2009, 44, 6348–6355. [Google Scholar] [CrossRef]
  24. Bakan, E.; Mack, D.E.; Mauer, G.; Mücke, R.; Vaßen, R. Porosity-property relationships of plasma-sprayed Gd2Zr2O7/YSZ thermal barrier coatings. J. Am. Ceram. Soc. 2015, 98, 2647–2654. [Google Scholar] [CrossRef]
  25. Oksa, M.; Turunen, E.; Suhonen, T.; Varis, T.; Hannula, S.P. Optimization and characterization of high velocity oxy-fuel sprayed coatings: Techniques, materials, and applications. Coatings 2011, 1, 17–52. [Google Scholar] [CrossRef]
  26. Liu, K.; Ma, J.; Bai, Y. Particle in-flight behavior and its determining the microstructure and mechanical properties of zirconia based thermal barrier coatings. In Proceedings of the 4th Annual International Conference on Material Engineering and Application (ICMEA 2017), Wuhan, China, 15–17 December 2017. [Google Scholar]
  27. Vardelle, M.; Vardelle, A.; Leger, A.C.; Fauchais, P.; Gobin, D. Influence of particle parameters at impact on splat formation and solidification in plasma spraying process. J. Therm. Spray Technol. 1994, 4, 50–58. [Google Scholar] [CrossRef]
Figure 1. Morphology, grain size and size distribution of YSZ powders: (a) External morphology; (b) Internal morphology; (c) Size of the crushed particles; and (d) Size distribution.
Coatings 08 00309 g001
Figure 2. The relationship between the temperature and velocity of flying particles and the total voids of the coatings.
Coatings 08 00309 g002
Figure 3. Analysis of voids in fifteen kinds of deposited coatings: (a) The percentage of voids with less than 10 μm2 of area; (b) The percentage of different voids in C1 coatings.
Coatings 08 00309 g003
Figure 4. The influence of the temperature and velocity of particles on the porosity ratio and the percentage of unmelted particles: (a) Porosity ratio; (b) Percentage of unmelted particles.
Coatings 08 00309 g004
Figure 5. The length distribution of cracks under different angles in typical coatings: (a) APS coatings; (b) SAPS coatings.
Coatings 08 00309 g005
Figure 6. Microstructure morphologies of typical coatings. The particle temperature and velocity increase gradually from “a” to “f”: (a) C3; (b) C2; (c) C8; (d) C13; (e) C10; and (f) C12.
Coatings 08 00309 g006aCoatings 08 00309 g006b
Figure 7. The morphology of the Vickers indentation and cracks on the polished cross-section of as-sprayed coatings: (a) C3 and (b) C11.
Coatings 08 00309 g007
Figure 8. The fracture toughness of SAPS- and APS-TBCs with (a) defect percentage and (b) crack percentage.
Coatings 08 00309 g008
Table 1. Spraying process parameters for the fifteen kinds of coatings [26].
Coating TypeProcess TypeCurrent (A)Primary Gas Ar (slpm)Secondary Gas H2 (slpm)Voltage (V)Spray Distance D (mm)Powder Feeding Rate (g·min−1)
C1APS45442.327.074.57040
C2APS60544.725.075.67040
C3APS65147.012.572.67040
C4APS64851.715.073.87040
C5APS66037.611.873.010040
C6APS75340.012.974.610040
C7APS81435.312.974.010040
C8APS80835.313.273.910040
C9SAPS50465.019.51189035
C10SAPS47275.021.01249035
C11SAPS48770.021.01239035
C12SAPS54665.522.513111035
C13SAPS35660.315.01259035
C14SAPS36665.015.41319035
C15SAPS31265.216.71339035
Table 2. Surface temperature and in-flight velocity of the fifteen kinds of coating particles [26].
Coating TypeTemperature (°C)Velocity (m/s)
C12843 ± 4180 ± 2
C22854 ± 4183 ± 1
C32689 ± 3182 ± 2
C42692 ± 1183 ± 1
C53213 ± 2229 ± 1
C63280 ± 4226 ± 4
C73264 ± 5230 ± 1
C83264 ± 2231 ± 3
C93414 ± 1401 ± 2
C103419 ± 2406 ± 1
C113420 ± 3402 ± 4
C123524 ± 5451 ± 2
C133245 ± 4381 ± 1
C143242 ± 2388 ± 2
C153251 ± 2400 ± 4

