Article

Hemin-Modified SnO2/Metglas Electrodes for the Simultaneous Electrochemical and Magnetoelastic Sensing of H2O2

1
Department of Chemical Engineering, University of Patras, Patras 26504, Greece
2
Department of Materials Science, University of Patras, Patras 26504, Greece
3
Institute of Nanoscience and Nanotechnology, National Center of Scientific Research, Athens 15310, Greece
*
Author to whom correspondence should be addressed.
Coatings 2018, 8(8), 284; https://doi.org/10.3390/coatings8080284
Submission received: 2 July 2018 / Revised: 2 August 2018 / Accepted: 11 August 2018 / Published: 16 August 2018
(This article belongs to the Special Issue Mesoporous Metal Oxide Films)

Abstract

:
In this work, we present a simple and efficient method for the preparation of hemin-modified SnO2 films on Metglas ribbon substrates for the development of a sensitive magneto-electrochemical sensor for the determination of H2O2. The SnO2 films were prepared at low temperatures, using a simple hydrothermal method, compatible with the Metglas surface. The SnO2 film layer was fully characterized by X-ray Diffraction (XRD), Scanning Electron Microscopy (SEM), photoluminescence (PL) and Fourier Transform-Infrared spectroscopy (FT-IR). The properties of the films enable a high hemin loading to be achieved in a stable and functional way. The Hemin/SnO2-Metglas system was simultaneously used as a working electrode (WE) for cyclic voltammetry (CV) measurements and as a magnetoelastic sensor excited by external coils, which drive it to resonance and interrogate it. The CV scans reveal direct reduction and oxidation of the immobilized hemin, as well as good electrocatalytic response for the reduction of H2O2. In addition, the magnetoelastic resonance (MR) technique allows the detection of any mass change during the electroreduction of H2O2 by the immobilized hemin on the Metglas surface. The experimental results revealed a mass increase on the sensor during the redox reaction, which was calculated to be 767 ng/μM. This behavior was not detected during the control experiment, where only the NaH2PO4 solution was present. The following results also showed a sensitive electrochemical sensor response linearly proportional to the concentration of H2O2 in the range 1 × 10⁻⁶–72 × 10−6 M, with a correlation coefficient of 0.987 and detection limit of 1.6 × 10⁻⁷ M. Moreover, the Hemin/SnO2-Metglas displayed a rapid response (30 s) to H2O2 and exhibits good stability, reproducibility and selectivity.

1. Introduction

Hydrogen peroxide (H2O2) is one of the most important intermediate products of several enzyme-catalyzed oxidation reactions, and an essential substance, analyte or mediator in pharmaceutical, food, clinical and environmental analyses [1,2,3,4,5]. This has raised extensive interest over the years for establishing protocols for H2O2 sensing depending on its application.
Numerous analytical methods have been used for the monitoring of H2O2 including fluorescence, spectrometry, chemiluminescence, colorimetric techniques and liquid chromatography [6,7,8,9,10,11]. However, most of these techniques are too expensive (equipment and reagents), time-consuming, suffer from interferences and often require complex sample pre-treatment and competent operators to perform the analysis and therefore are not applicable for in situ analysis. Therefore, despite the numerous methods for H2O2 detection available, it is still of interest to develop a simple and direct method, that would be reliable, free from interferences and of lower cost. In this sense, electroanalytical methods have been used for the sensitive and selective determination of H2O2 [12,13,14].
Electrochemical sensors (voltammetric or amperometric) are among the most popular sensor devices. They usually monitor the change in current at an applied bias, induced by a redox reaction [15]. Furthermore, based on the properties of the material/substrate used, chemiresistive, capacitive and optical devices have been developed particularly for the sensing of hazardous and toxic gases [16,17,18]. The signal/outcome in electrochemical sensors depends on the rate of mass transfer to the electrode surface. The aim is to minimize the diffusion path of the detectable analyte and therefore the enzyme should have close contact with the substrate (electrode) used as the transducer. Although in some cases it might be possible to achieve direct electron transfer between the immobilized enzyme and electrode, normally, redox centers of enzymes are located deep in the insulated protein matrix, which makes a direct electron transfer unfeasible. The application of such enzymes in biosensors will require complicated immobilization procedures in order to orient the enzyme molecules in the most efficient way on the surface of the electrode and/or the additional use of redox mediators. In addition, the enzyme molecules tend to aggregate and become inactivated after immobilization and some of them present high cost in their preparation and storage and offer insufficient long-term stability [19,20,21,22]. To overcome these obstacles, non-enzymatic H2O2 electrochemical sensors have been proposed in recent years replacing immobilized enzymes with various nanocomposites with peroxidase-like activity. These include noble metal nanocomposites [19,20,23,24,25], metal oxide nanostructures [22,26,27,28] and metalloporphyrins [28,29,30,31,32].
Hemin (iron protoporphyrin IX chloride) is a well-known natural metalloporphyrin and is the active center of the heme-protein family, which includes hemoglobin, myoglobin and peroxidase. It has a porphyrin ring with an electroactive center of Fe3+ and, as a result, a couple of quasi-reversible or reversible redox peaks are usually well-defined in cyclic voltammograms (CVs) obtained in aqueous solution, such as phosphate buffer of wide pH range or in some non-aqueous ones such as hexafluorophosphate ionic liquids. Therefore, hemin has been extensively used to study the redox activity of heme-proteins. In addition, it exhibits remarkable good electrocatalysis towards some small molecules, such as O2 [33], NO [34], NO2 [35], H2O2 [28,29,30,31,32], trichloroacetic acid [36], organohalides [37], phenols [38] and artemisinin [39], many of them are related to biological processes. The hemin-Fe acts as the electroactive mediate in the electrocatalysis process.
Hemin exhibits peroxidase-like activity similar to the enzyme [40] and is found to be superior to noble metal catalysts and nanomaterial enzyme mimics, which often exhibit low stability, high cost and poor reproducibility [41,42]. However, the fact that hemin tends to aggregate (inactive dimmers formation) in aqueous media due to its low solubility hinders its direct use as a redox catalyst. Therefore, various methods and electrodes have been used to overcome these issues and develop stable and sensitive hemin-modified electrodes. Hemin has been successfully adsorbed on many carbon materials, incorporated in carbon paste, entrapped in polymeric matrices, immobilized using dendrimers or cationic surfactants, mixing with metal oxide nanoparticles and incorporated or drop casted on various nanocomposite materials.
Our group recently presented [32] a simple and efficient method for the preparation of hemin-modified mesoporous SnO2 films on low cost flexible, conducting ITO-PET substrates for the electrochemical sensing of H2O2. SnO2 films can be prepared at low temperatures using a simple hydrothermal method, allowing not only high hemin loading in a stable and functional way, but also the direct reduction and oxidation of the immobilized hemin. In another recent work of ours [43], a nanostructured ZnO layer was synthesized onto a Metglas magnetoelastic ribbon to immobilize hemoglobin (Hb) on it and study the Hb’s electrocatalytic behavior towards H2O2. Hb oxidation by H2O2 was monitored simultaneously by two different techniques: Cyclic Voltammetry (CV) and Magnetoelastic Resonance (MR). The Metglas/ZnO/Hb system was simultaneously used as a working electrode for the CV scans and as a magnetoelastic sensor excited by external coils, which drive it to resonance and interrogate it.
Metal oxides are typically wide-bandgap semiconductors and are, therefore, effectively insulating for applied potentials lying within their band gap. The conductivity of nanocrystalline TiO2 and ZnO electrodes has been shown to be enhanced by a high density of sub-band gap states; nevertheless, such electrodes are still essentially insulators for potentials more positive than −0.3 and −0.15 V, respectively [44]. Consequently, electrochemical studies of heme proteins immobilized on such electrodes have been limited to electrochemical reduction of such proteins, with the dynamics of this reduction having been largely limited by the limited conductivity of the metal oxide film. Previous reports have indicated that mesoporous SnO2 films are more conductive than either ZnO or TiO2 films. This metal oxide exhibits a band gap (330 nm) and an isoelectric point (IEP~5) similar to those of TiO2. Although flat (not porous) indium- or fluorine-doped SnO2 films have been used as transparent electrodes for protein immobilization [45], the protein loading on such flat electrodes is; however, limited to a monolayer coverage at least 2 orders of magnitude lower than the monolayer coverage that we demonstrate here as possible on mesoporous electrodes.
In this work, we propose to prepare thin mesoporous SnO2 films on the Metglas ribbon and use it for the immobilization of hemin and examine its sensitivity towards the electrocatalytic reduction of H2O2. SnO2 films are particularly attractive for immobilization of molecules, exhibit a high surface area, non-toxicity, chemical stability and unique electronic and catalytic behavior [32]. They are similar to the ZnO films we used in the past [43], but more conductive and allowing redox reactions to take place at more moderate potentials at their conduction band edge. In addition, their preparation involves very few steps using a simple, low-cost, low-temperature hydrothermal method, which is much simpler than the sol-gel method involving an autoclave reactor that we used for the preparation of ZnO films in the past. Table 1 displays structural and electrochemical properties of mesoporous films of different metal oxides modified with hemin or heme proteins for studying their electrochemical behavior and/or used for the development of biosensors. Although, structurally, most of these films are similar (size of nanoparticles and thickness) and exhibit a high surface area, multistep, lengthy and not always reproducible procedures involving high-temperature sintering are necessary for their preparation. In addition, as they are semiconductors, during the electrochemical measurements they exhibit an insulating region, mostly at positive biases, that hinders the reduction or oxidation of the adsorbed molecules or limits their electrocatalytic efficiency. They exhibit limited conductivity at low negative potentials and a relatively slow electron transport. According to our studies and those of other groups we have come to the conclusion that the SnO2 films could be prepared by a simple, fast, low-cost and low-temperature hydrothermal route, exhibiting a high surface area for the immobilization of molecules and biomolecules. In addition, and compared with the other metal oxides, they exhibit a very limited insulating region only at high positive biases and could be successfully used for the development of electrocatalytic sensors.
In addition, hemin is a much smaller molecule than the Hb we used in the past and is not surrounded by a shell of amino acids which that only a part of it to come into direct contact with the surface of the electrode [43]. Therefore, electron transfer between hemin and electrode is expected to be faster and more direct. From our previous studies, we found that the SnO2 films provide a suitable microenvironment to prevent hemin aggregation and dimerization, therefore maintaining its activity after immobilization [32]. Hemin, dissolved in organic solvent, was drop-coated with a pipette on the SnO2-Metglas substrates.
Based on the physicochemical properties of our proposed Hemin/SnO2-Metglas sensor, CV and MR will be used simultaneously in order to study the chemical behavior of immobilized hemin with H2O2. While the experimental technique of CV can provide information on the electrochemical behavior of a reaction, the MR of magnetoelastic materials can quantify those reactions due to the high sensitivity to external parameters such as mass load [46,47]. As magnetoelasticity, we define the property of some ferromagnetic materials to convert efficiently the magnetic energy into elastic energy. According to Hernado et al. [48] the parameter associated with the energy transfer between the elastic and magnetic subsystems is known as the magnetoelastic coupling coefficient k (0 < k < 1). By far the best-known materials with high magnetoelastic coupling coefficients are metallic glasses [49], which are mainly amorphous alloys of magnetic materials in the shape of ribbons. A free-standing ribbon of metallic glass can be easily induced to vibrate mechanically to one of its resonance modes, to an external AC magnetic field, due to its ferromagnetic nature and magnetoelastic property. Those mechanical vibrations depend upon factors such as the stiffness and the mass of the ribbon, and any change on them will affect the dynamic behavior of the ribbon. Specifically, the appearance of extra mass on a magnetoelastic ribbon will affect its vibration behavior, by reducing its resonance frequencies, and thus it will leave a trace of the mass on the ribbon. Exploiting this behavior, information about the interaction of H2O2 with the immobilized hemin can be obtained.
The resulting Hemin/SnO2-Metglas electrodes exhibit highly efficient electrocatalytic reduction of H2O2, with good stability and sensitivity and to our knowledge, this is only the second time that the two methods, CV and MR have been used simultaneously for biodetection and the development of a H2O2 sensor.

2. Materials and Methods

2.1. Materials

A commercial ribbon of Metglas 2826MB (Fe40Ni38Mo4B18) was purchased from Hitachi Metals Europe GmbH (Düsseldorf, Germany). Tin (IV) Oxide Nanopowder, <100 nm average particle size (BET), t-Butanol anhydrous, ≥99.5%, bovine hemin (≥90%), absolute ethanol, analytical grade acetone and sodium dihydrogen orthophosphate (NaH2PO4) were all purchased from Sigma-Aldrich Chemie GmbH (Taufkirchen, Germany). Dimethyl sulfoxide (DMSO) was obtained from Fisher Scientific GmbH (Schwerte, Germany) and was of HPLC grade. H2O2 (30% w/v solution) was purchased from Lach-Ner (Neratovice, Czech Republic) and was diluted. All aqueous solutions were prepared with deionized water.

2.2. Preparation of Hemin/SnO2–Metglas Electrodes

Tin oxide powder was homogeneously dispersed in a mixture of t-Butanol and acetonitrile 95:5 (v/v) at a concentration of 40 g·L−1 as previously described by our group [32]. The suspension was then sonicated in a JENCONS-PLS sonicator (Jencons, Bedford, UK), while the mixture solution was immersed in an ice bath to regulate its temperature. After sonication, the solution was semi-opaque and the particles evenly distributed.
A commercial ribbon of Metglas 2826MB (Fe40Ni38Mo4B18) was used as the substrate for the deposition of the SnO2 films. The ribbon was cleaned thoroughly in acetone for 15 min under sonication and then cut in strips of 2 cm in length. The Metglas strips were then placed in a petri dish with their rough side facing upwards. Adhesive Tape of known thickness was then applied on the surface of the Metglas to define the film layer thickness accordingly, imitating a doctor-blade technique. Masking each Metglas substrate with 3M Scotch Magic tape (3M, Berkshire, UK) type 810, thickness 62.5 μm) controlled the thickness and width of the solution spread area. Afterwards, 20 μL of the above-mentioned SnO2 solution was deposited on to the Metglas surface and left to air-dry at 37 °C for 20 min until all the solvent was totally evaporated giving as a result a thin SnO2 film layer. One layer of tape was employed for each SnO2 film deposition, which provided a film thickness of ~7 μm and size of 1 × 1 cm2. The thickness of the films was measured by SEM and the use of a standard profilometer. It appears that t-Butanol reduces the surface tension of the liquid paste to improve its adhesion on the Metglas surface.
Afterwards, a solution of 10 μM hemin in DMSO was prepared and 10 μL was drop-coated with a pipette on the thin SnO2 film. The use of this concentration of hemin was selected based on a recent study of ours [32] involving the immobilization of hemin on semitransparent SnO2/ITO-PET films. Using UV-Vis absorption spectroscopy (Shimadzu Europa UV-1800, Duisburg, Germany) we confirmed that the immobilized hemin exhibited its characteristic peaks and therefore remained intact. By using higher concentrations of hemin, aggregation of hemin molecules occurred on the surface of the films, affecting its electrocatalytic behavior towards H2O2. The films were then left to air-dry at room temperature for 30 min, until there were no signs of moisture on their surface. Once the hemin was adsorbed, it remained strongly bound to the films. Prior to all measurements, films were rinsed with NaH2PO4 to remove possible non-adsorbed hemin.

2.3. Characterization of the Hemin/SnO2-Metglas Film Electrodes

The morphology and thickness of the SnO2-Metglas film electrodes were determined by field emission scanning electron microscopy (FE-SEM), using a FEI Inspect Microscope (Thermo Fisher Scientific, Ferentino, Italy) operating at a voltage of 25 kV. The specimens (films) were prepared by Au sputtering to increase the conductivity of the samples. Energy dispersive spectroscopy (EDS, Thermo Fisher Scientific, Ferentino, Italy) was also used for the elemental analysis of the SnO2-Metglas film electrodes. As a further proof of the quality of the SnO2 films obtained, their photoluminescence (PL) spectra were recorded using a Hitachi F2500 Fluorescence Spectrophotometer (Hitachi, Tokyo, Japan) from 350 to 550 nm at an excitation wavelength of 300 nm.
The crystal structure of the SnO2 films on the Metglas substrate was studied using X-ray diffraction (XRD). The XRD pattern of the SnO2 film on Metglas was measured using a Bruker D8 advance X-ray diffractometer (Bruker AXS GmbH, Karlsruhe, Germany) with Cu Kα-radiation from 20° to 80° at a scanning speed of 0.015 °/s. The X-ray tube voltage and current were set at 45 kV and 40 mA, respectively. The diffraction patterns were indexed by comparison with the Joint Committee on Powder Diffraction Standards (JCPDS) file 41-1445 of SnO2 cassiterite [51].
Fourier transform infrared (FTIR) spectroscopic analysis of the SnO2 films with or without adsorbed hemin was carried out with a Digilab Excalibur FTS 3000MX spectrometer (BioRad Laboratories GmbH, München, Germany).

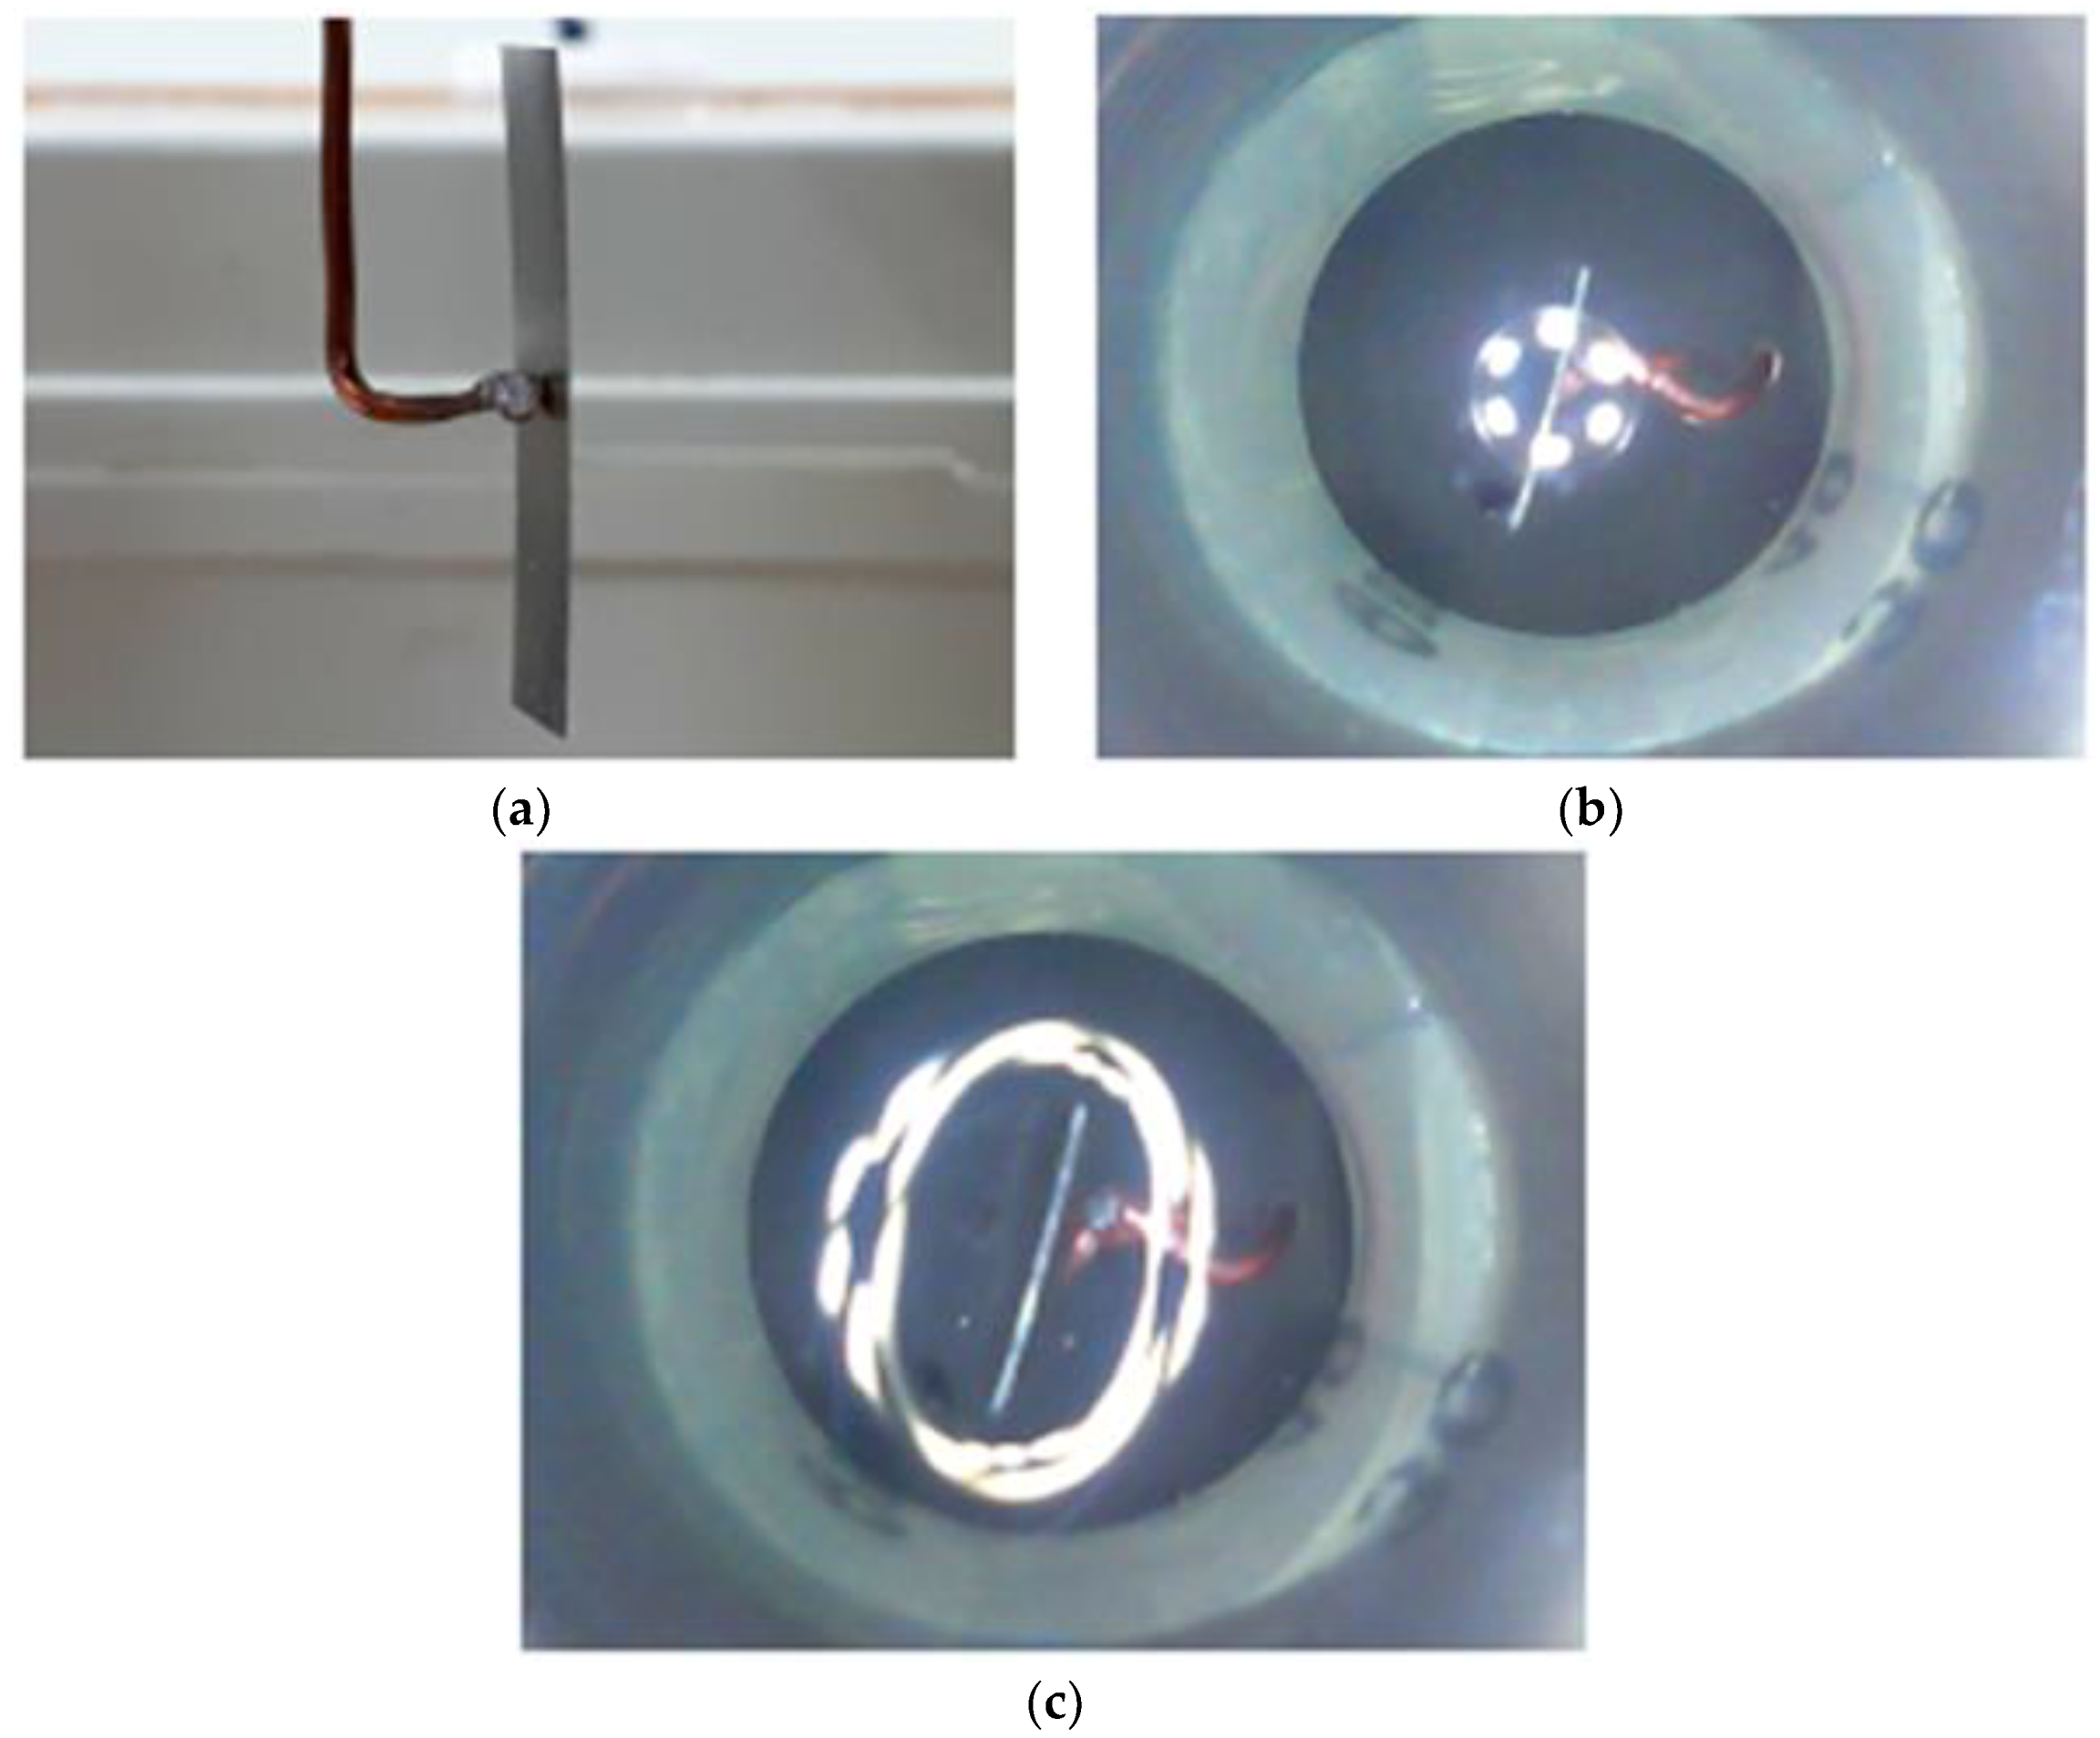
2.4. Experimental Setup for MR and CV Measurements

Shown in Figure 1 is the experimental setup that was used for simultaneous MR and CV detection of the interaction of immobilized hemin with H2O2. To begin, a homemade coil (N = 30 turns, R = 1.1 Ω, L = 15.2 µH), which is connected to a microcontroller frequency generator (Sentech, Pittsburgh, PA, USA) (Figure 1b), is wrapped around a 29.5 mm diameter syringe and hung firmly in a structure made out of wood, as shown in Figure 1b. The frequency generator drives an alternative current (AC) through the coil, producing an alternative magnetic field, which in turn induces elastic waves on the magnetoelastic sensor inside the coil. When the frequency of the vibration matches the first longitudinal natural frequency of the sensor, resonance occurs. By using software written in Visual Basic, the resonance frequency value of the sensor is recorded. The piston of the syringe is used to secure the working electrode (WE) (our sensor) of the setup and is allowed to move vertically during the experiment, in order to control the immersion position of the sensor. For the CV measurements, a platinum wire 30 mm in length, which was welded onto an extension copper wire, is set up at the side of the syringe to work as the counter electrode (CE) (Figure 1b). As reference electrode (RE), Ag/AgCl/KClsat was used, positioned in a holder that was made in order to be able to remove it from the setup and store it after each experiment (Figure 1b).
All three electrodes were immersed into NaH2PO4 solution (pH = 7) inside a glass container (Figure 1a), the quantity of which is controlled by an injection tube shown in Figure 1b. A stand made of polystyrene (PS) (Figure 1a) is used to hold the glass container, inside of which a wire camera was wedged (Figure 1a), observing the immersion process of the WE and providing information on whether or not the sensor touched the surface of the solution. Figure 2a shows the WE of the setup with the magnetoelastic sensor being held magnetically on a copper wire with the use of a tiny piece of neodymium magnet welded carefully to the copper wire. In this way, the conductivity of the WE is increased, reducing any noisy effects during CV. Figure 2b,c shows the state before and after the immersion of the WE inside the solution. The six bright spots in the middle of Figure 2b are the reflection of the camera lights at the surface of the solution. The characteristic ellipse of Figure 2c indicates the immersed state of the electrode. It is important to know the exact moment the electrode touches the surface of the solution, because this way, the immersion depth of the electrode can be controlled using the scale on the syringe.

2.5. Experimental Preparation and Procedure

The experimental preparation was carried out in two main stages. The first stage concerns the connection of the device, described above, to the other devices used in the experimental procedure. For the MR measurements, a home-made microcontroller frequency generator was connected to a PC through a RS232 serial port, and the acquisition data process was carried out by software written in Visual Basics programming. The wire camera was also connected to the PC and controlled by its software. An Autolab PGStat 101 potentiostat (Metrohm Autolab, Utrecht, The Netherlands) was used for the CV measurements. The second stage includes the preparation and insertion of the Hemin/SnO2-Metglas sensor into the experimental setup. As mentioned above, when the frequency of the vibrated sensor matches with its first longitudinal natural frequency, resonance occurs. The first longitudinal vibration of a beam-like structure with both ends free has its node at the middle and the maximum deformation at the free ends. Figure 3 shows the graphical illustrations of the resonance peaks of a 30 mm bare Metglas ribbon with the copper wire when holding it at different positions (Figure 2a). The first peak (Figure 3a) corresponds to the position at the middle of the sensor, while the other three peaks (Figure 3b–d) correspond to a position 1, 2 and 3 mm from the middle, respectively. As we move the holding point away from the middle, where the node is located, the amplitude of the resonance peak drops rapidly. This happens because the node is a stationary position, and any changes on it do not affect the vibrating behavior of the sensor. On the other hand, changes in the deforming positions affect the behavior of the transmitting elastic waves, which in our situation is the damping effect on the wave due to the physical contact between the sensor and the copper wire. It is crucial to have the amplitude of the resonance peaks as high as possible, before the immersion of the sensor inside the solution, because after the immersion, the damping effect is strong, and in order to not completely lose the peak at the noise level, preparations must be made. For the CV measurements, all applied biases are reported against the Ag/AgCl reference electrode.
The electrolyte, an aqueous solution of 10 mM NaH2PO4 (pH = 7) was deoxygenated with argon prior to any electrochemical measurements. All experiments were carried out at room temperature.
Upon completion of the preparation and insertion of the Hemin/SnO2-Metglas sensor into the setup, the experimental measurement procedure was carried out. Initially, by moving the syringe piston along the coil and carrying out some MR measurement in the air, the sensor position with the highest resonance peak amplitude was noted using the syringe scale. Next, the immersion process took place in three steps in order to conduct measurements with both CV and MR techniques. In the first step, the piston was moved till the point that the sensor touched the surface of the solution (Figure 2c), using the guidance of the wire camera. In the second step, the piston was moved 4 mm down, using the scale on the syringe, so as to immerse the whole surface of the immobilized hemin into the solution, and a CV measurement was taken. The last step was to return the sensor to its initial position and run a MR measurement. Figure 4 shows the resonance peaks before and after the immersion of a bare Metglas ribbon (Figure 4a,b) and of a Hemin/SnO2-Metglas sensor (Figure 4c,d). In the case of the latter, the decrease on the amplitude and the frequency seems to be higher than that of the bare Metglas, thus indicating the presence of Hemin/SnO2 layers.

3. Results and Discussion

3.1. X-ray Diffraction

The crystal structure and phase purity of the SnO2-Metglas film electrode were investigated by the X-ray diffraction technique. Figure 5 shows the main diffraction peaks for Metglas with or without a film of SnO2 on its surface. The Metglas strip is an amorphous material and therefore its XRD pattern gives a noisy and broad signal with a wide peak from 40° to 50°. The XRD data of the SnO2 film on Metglas revealed peaks at 26.55°, 33.82°, 37.75° and 51.76°, corresponding to the indices of (101), (110), (200) and (211), are characteristic of the cassiterite type of tetragonal rutile nanocrystals and are consistent with the reported values of the relevant JCPDS card No.: 41-1445 [51]. However, it should be noted that the intensity of the peaks is quite low, which makes us affirm that we have a quite thin film of SnO2 deposited onto the Metglas strip. Further discussion about the thickness of the deposited film will be given from the SEM images of the SnO2-Metglas and particularly the cross sectional one which will be used to measure the thickness of the SnO2 film. Consistent with SEM observation and previous work of ours in the literature [28] the immobilization of hemin did not change the crystal structure of SnO2.

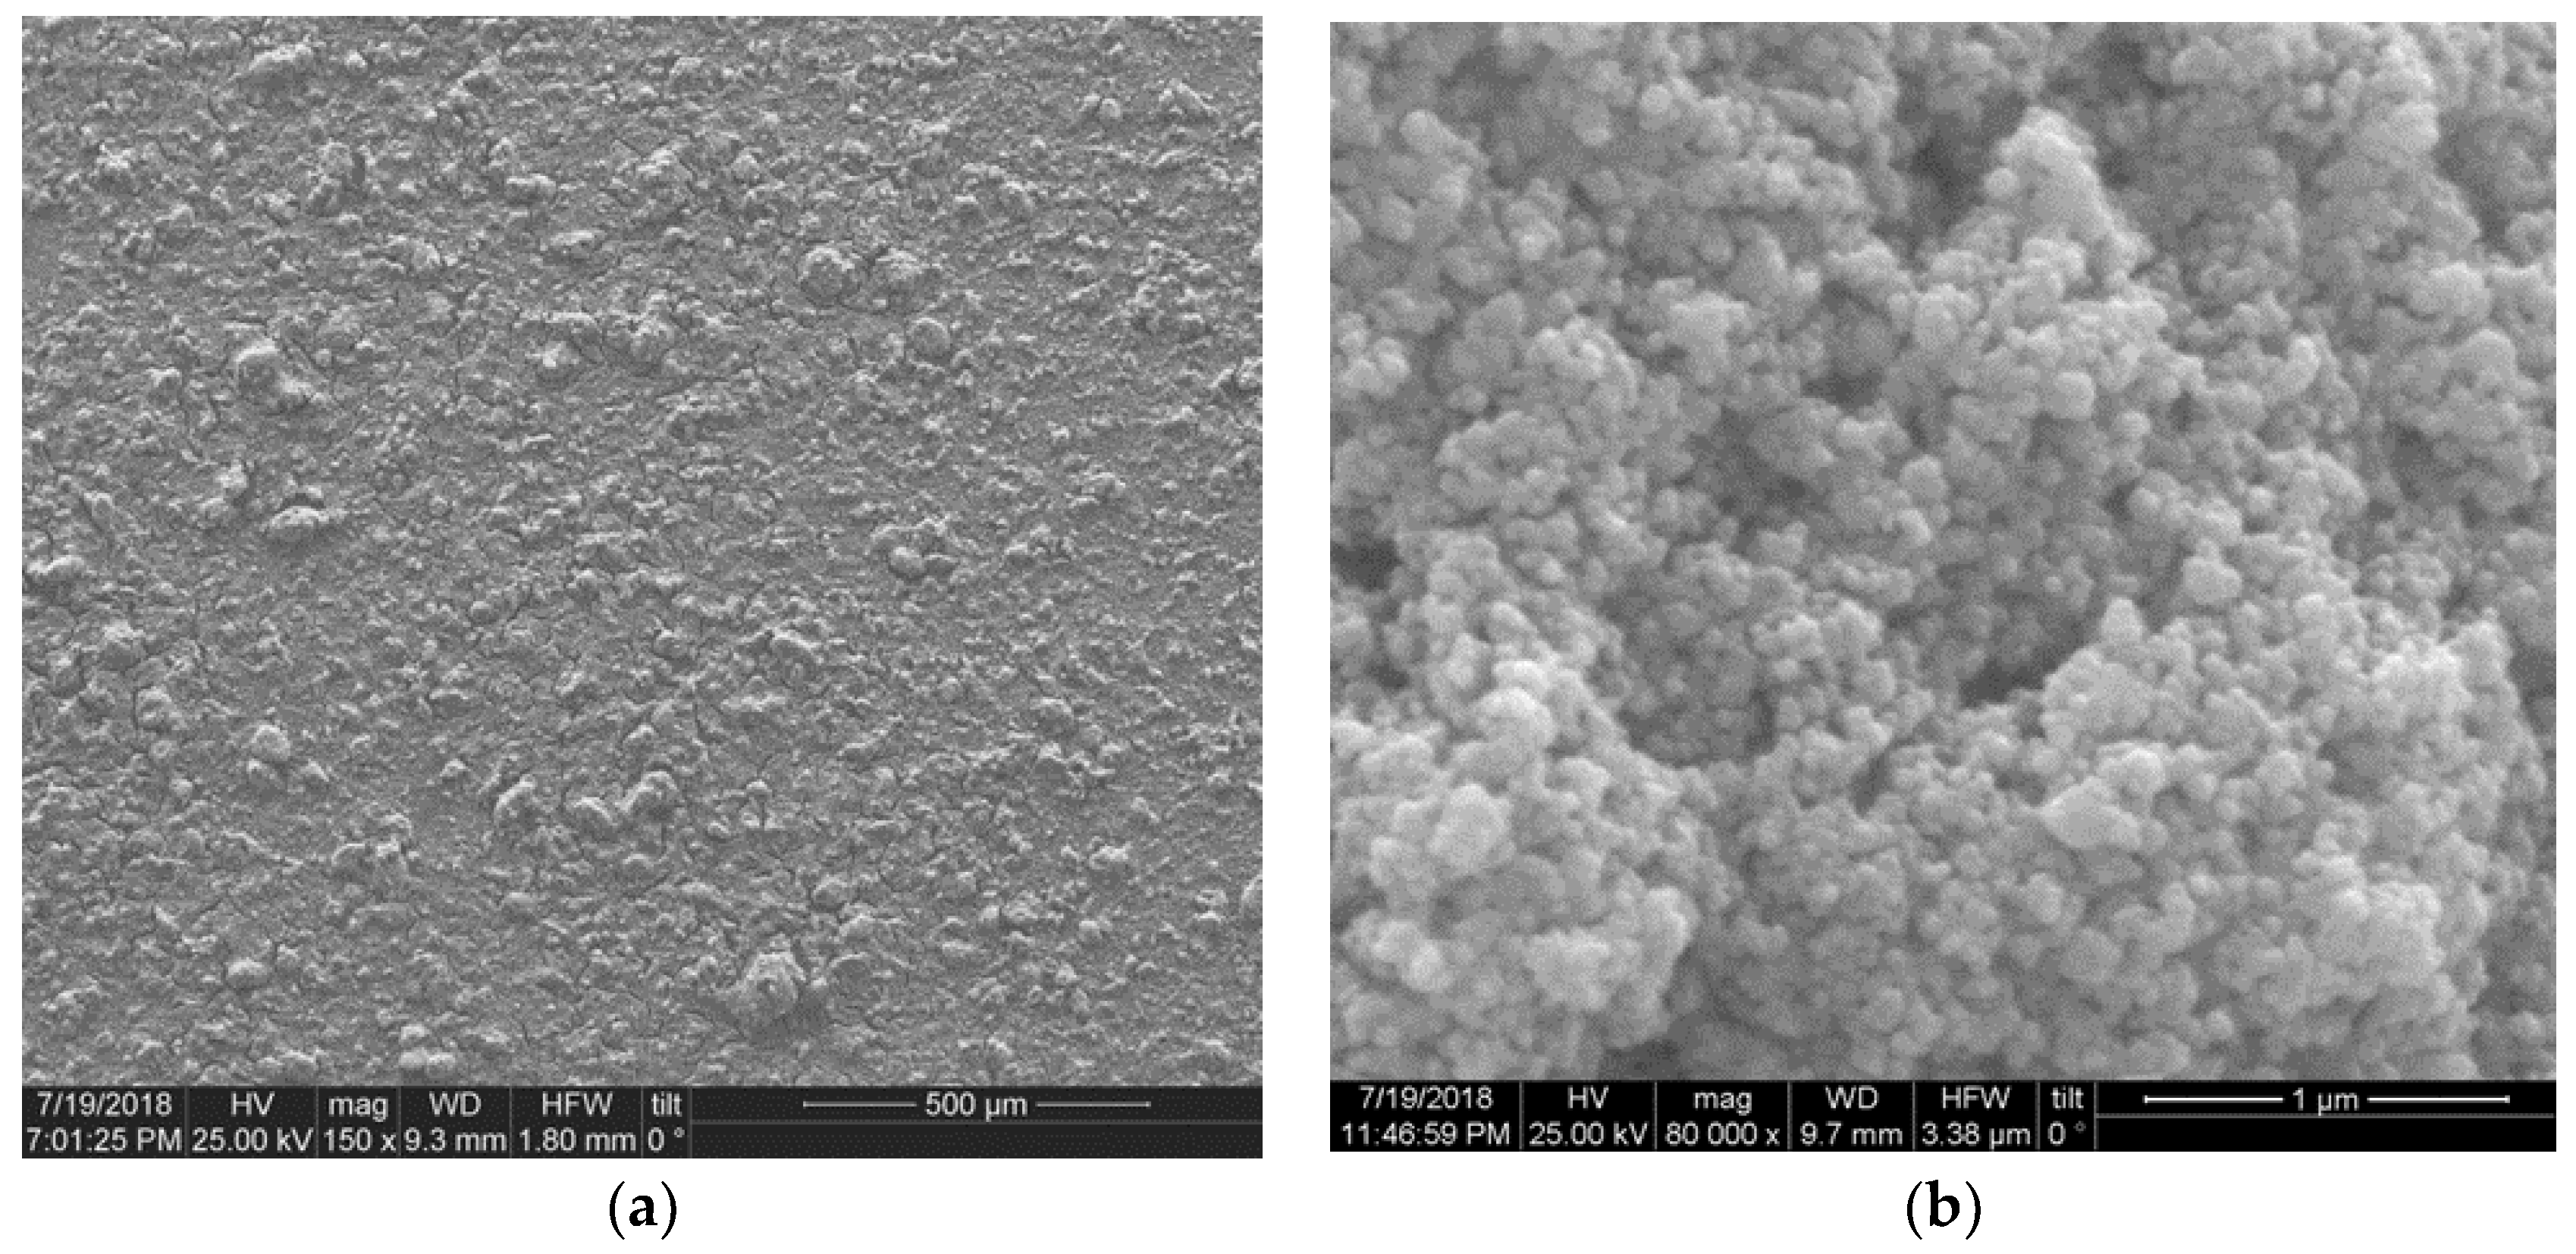
3.2. FE-SEM Imaging of Surface Topography

The surface morphology and thickness of the SnO2-Metglas film electrode was analyzed by FE-SEM. The top view FE-SEM images presented in Figure 6a,b showed that the SnO2 film comprises a rigid, porous network of SnO2 nanoparticles of average size 20–70 nm that are evenly distributed, creating a mesoporous surface. These results confirm a sponge like structure of the film with pore sizes sufficiently large for hemin molecules to be able to diffuse throughout the porous mesostructure. Therefore, it could provide many active sites for catalytic reactions. It was also observed (image not shown) that the immobilization of hemin does not change or destroy the characteristic SnO2 particles, neither the mesoporous structure of the film. According to Figure 6c the thickness of the SnO2 films is around ~11 μm as set by the adhesive tape used. Figure 6d displays the EDS for a SnO2-Metglas film electrode, carried out during the FE-SEM analysis, which conforms to the characteristic peaks of Sn and O. The observed Ni and Fe peaks are attributed to the Metglas substrate. The inset of Figure 6d displays the elemental compositions in estimated weight percentages. The quantification of the EDS spectrum was carried out using the standardless ZAF correction method.

3.3. Photoluminescence Properties

Figure 7 depicts the photoluminescence spectrum of a SnO2 film deposited on the Metglas substrate at an excitation wavelength of 300 nm. It exhibited four emission bands in UV and visible regions centered around 378, 395, 437 and 470 nm. The 378 band is assigned to the recombination of donor-acceptor pairs [52]. Violet emission i.e., 395 and 437 nm are ascribed to the surface dangling bonds or oxygen vacancies and Sn interstitials [53]. Their exact origin is not yet clear. The origin of blue luminescence at 470 nm is structural defects or impurities formed during the deposition of thin films. It is important to note that the broad nature of the PL emission band clearly indicates that the luminescence should have originated from the multiple sources rather than a single source, because the PL band contains multiple PL peaks.

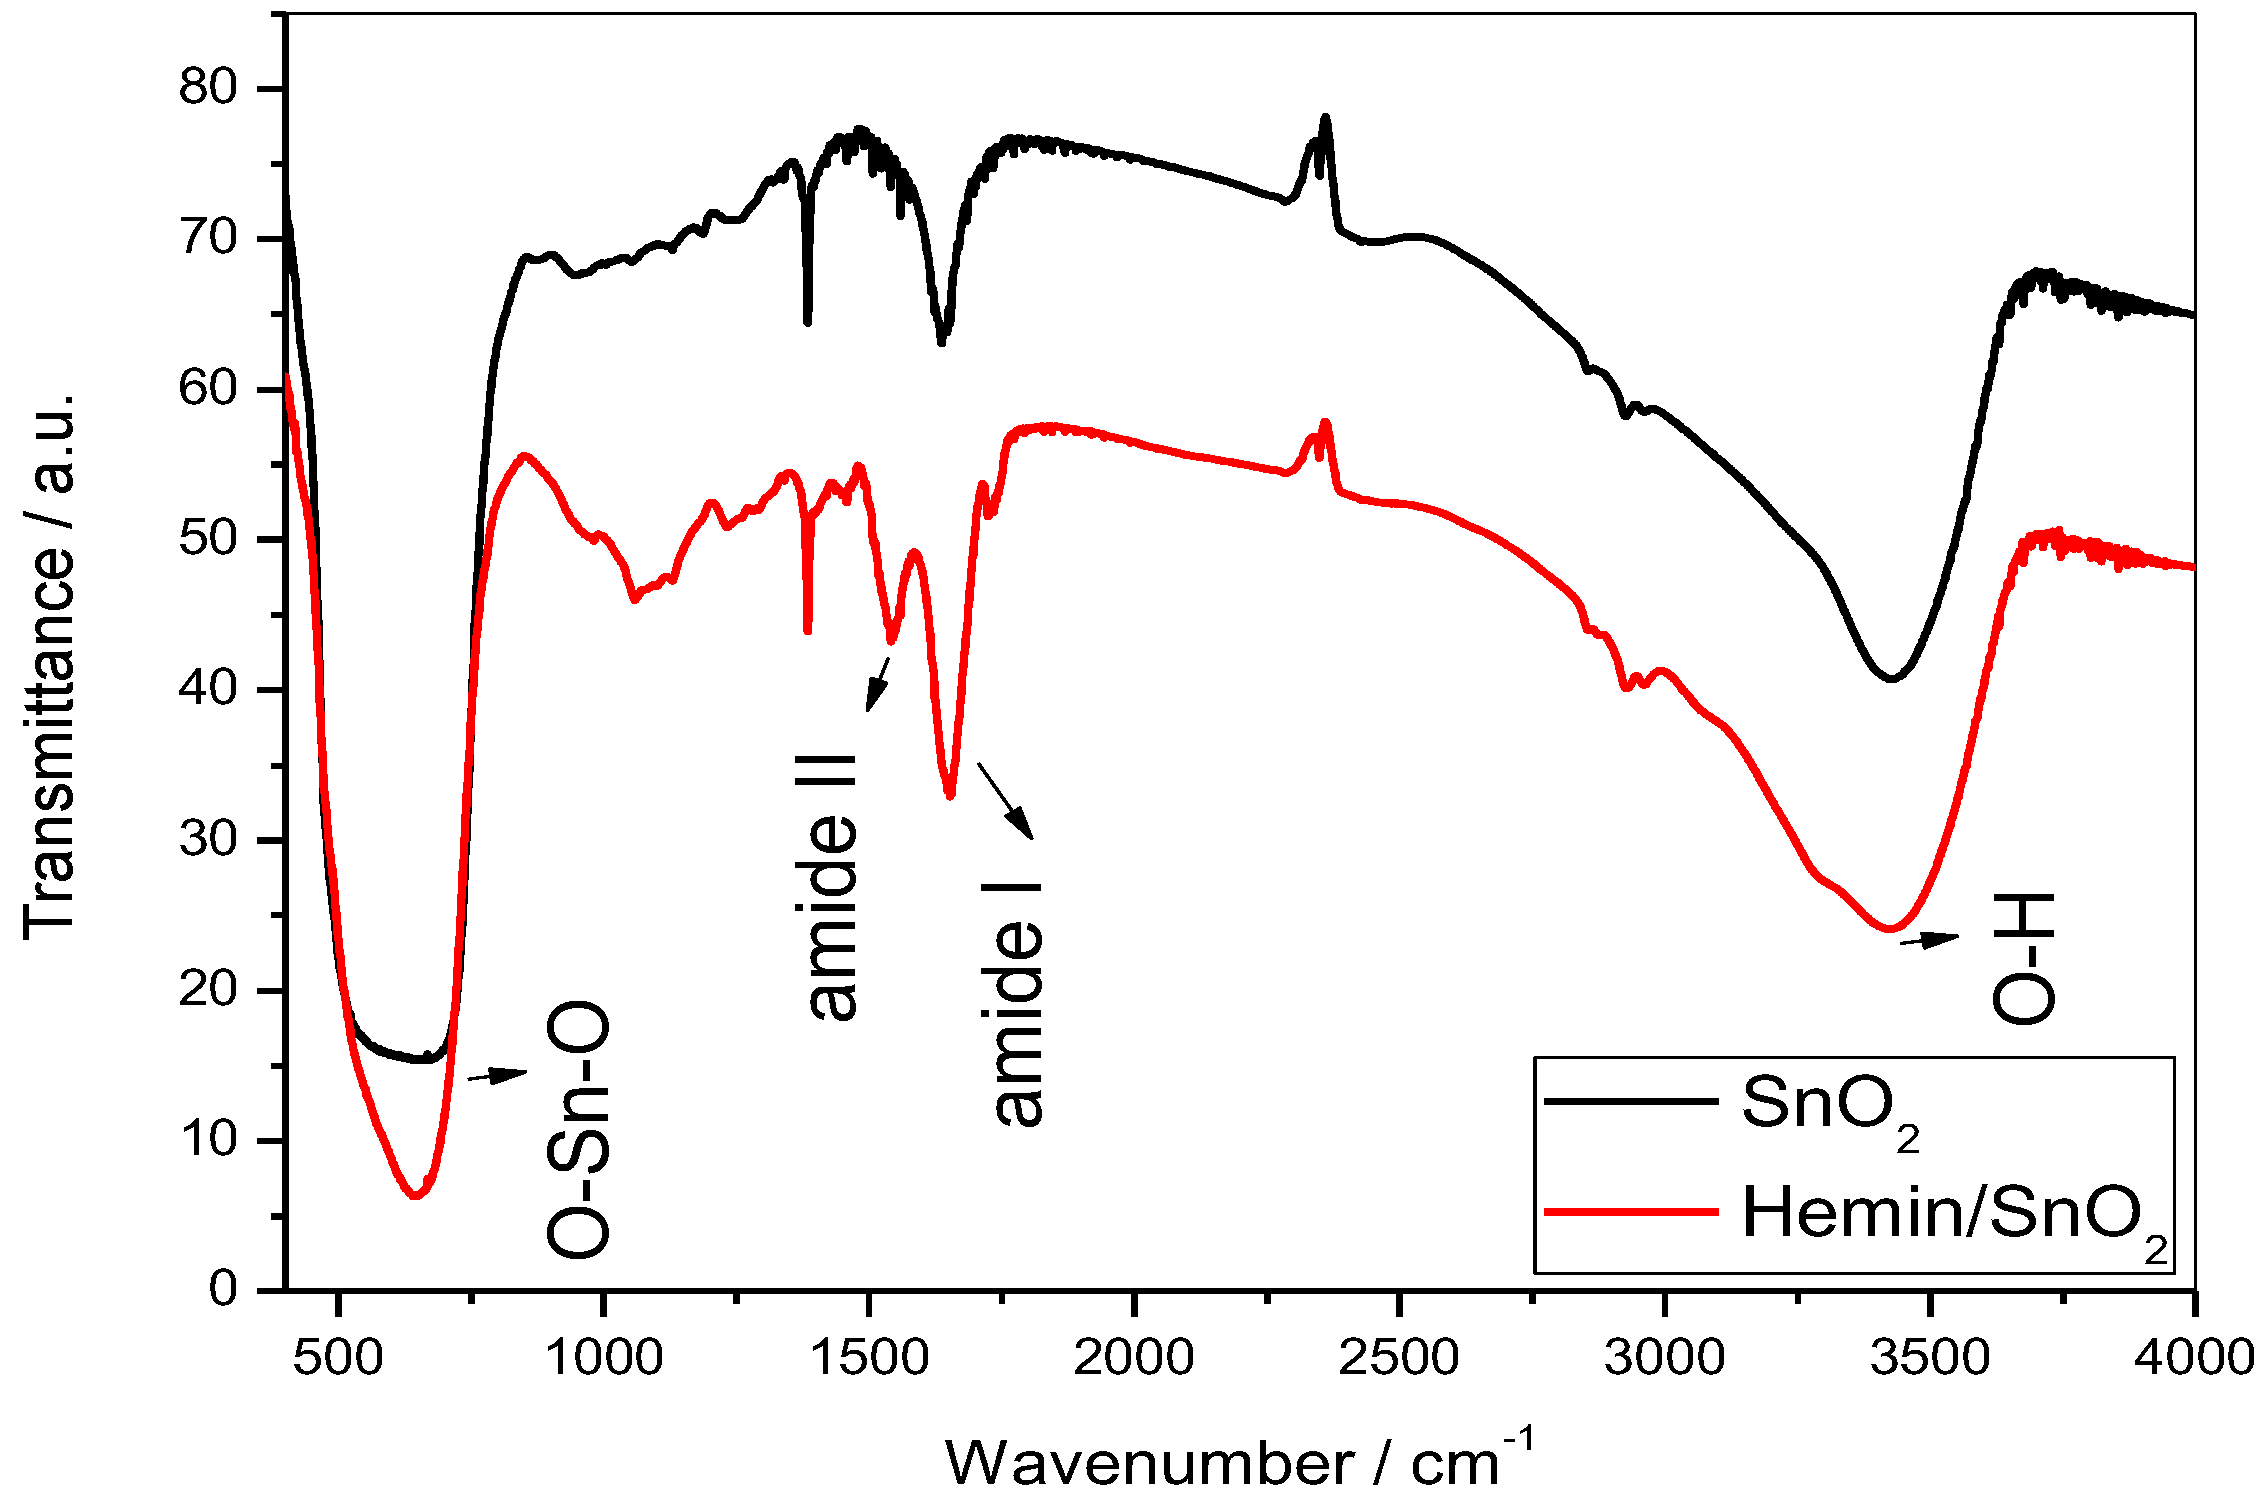
3.4. Fourier Transform Infrared Analysis

Figure 8 compares the FTIR spectra of SnO2 and Hemin/SnO2 films recorded in KBr matrices. Blank KBr pellet was taken as the background. Both spectra displayed bands at 3427 and 1638 cm−1 due to O–H bonds of adsorbed water and a band located at around 612 cm−1, which is assigned to the Eu mode of SnO2 (anti-symmetric O–Sn–O stretching) [28,54].
In comparison, the FTIR spectrum of Hemin/SnO2 displayed the representative peaks of hemin besides the absorption bands of SnO2. The FTIR spectrum of Hemin/SnO2 displays new absorption bands at 1000 to 1300 cm−1 assigned to C–O stretching vibration in the aromatic ring of the hemin molecule. The small bands at 1410 and 1464 cm−1 were due to the contribution of the C–H bending vibration and the band at 2924 cm−1 was assigned to the C–H stretching vibration of methyl [55]. The obvious absorption peaks at 1562 and 1651 cm−1 must be assigned to amide band II and amide band I, respectively. Therefore, the immobilization of hemin on the SnO2 mesopores was successfully confirmed by FTIR spectroscopic analysis.

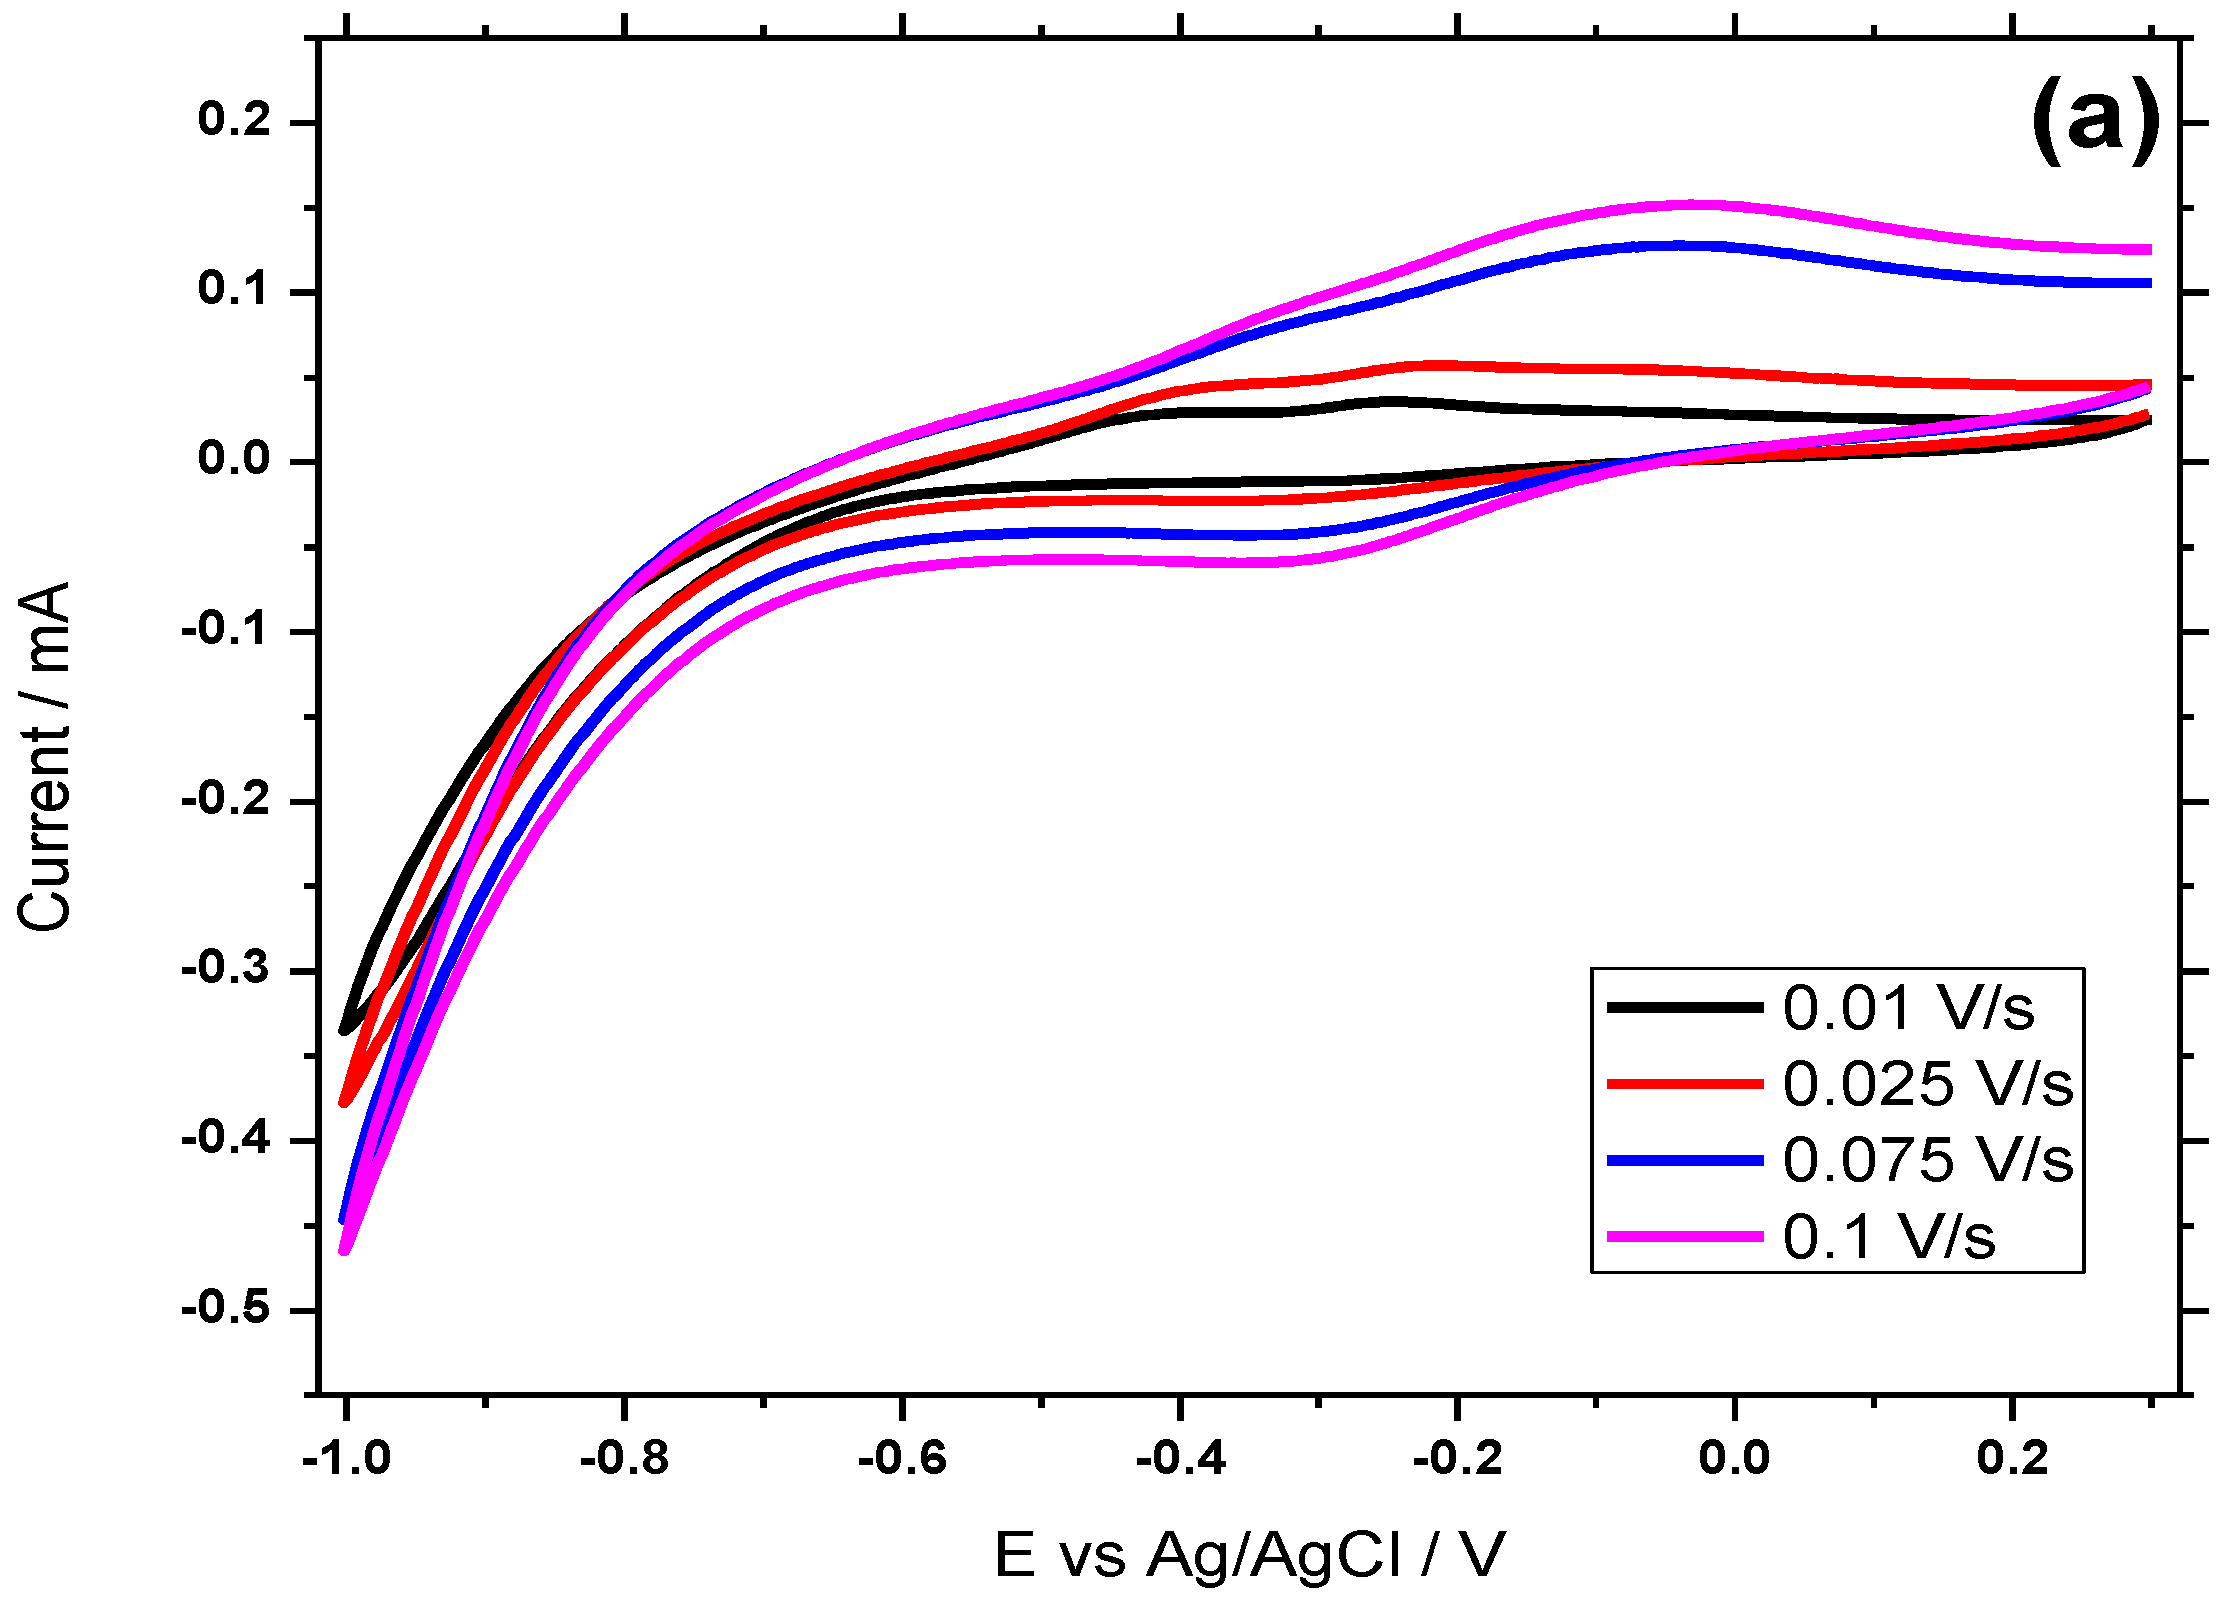
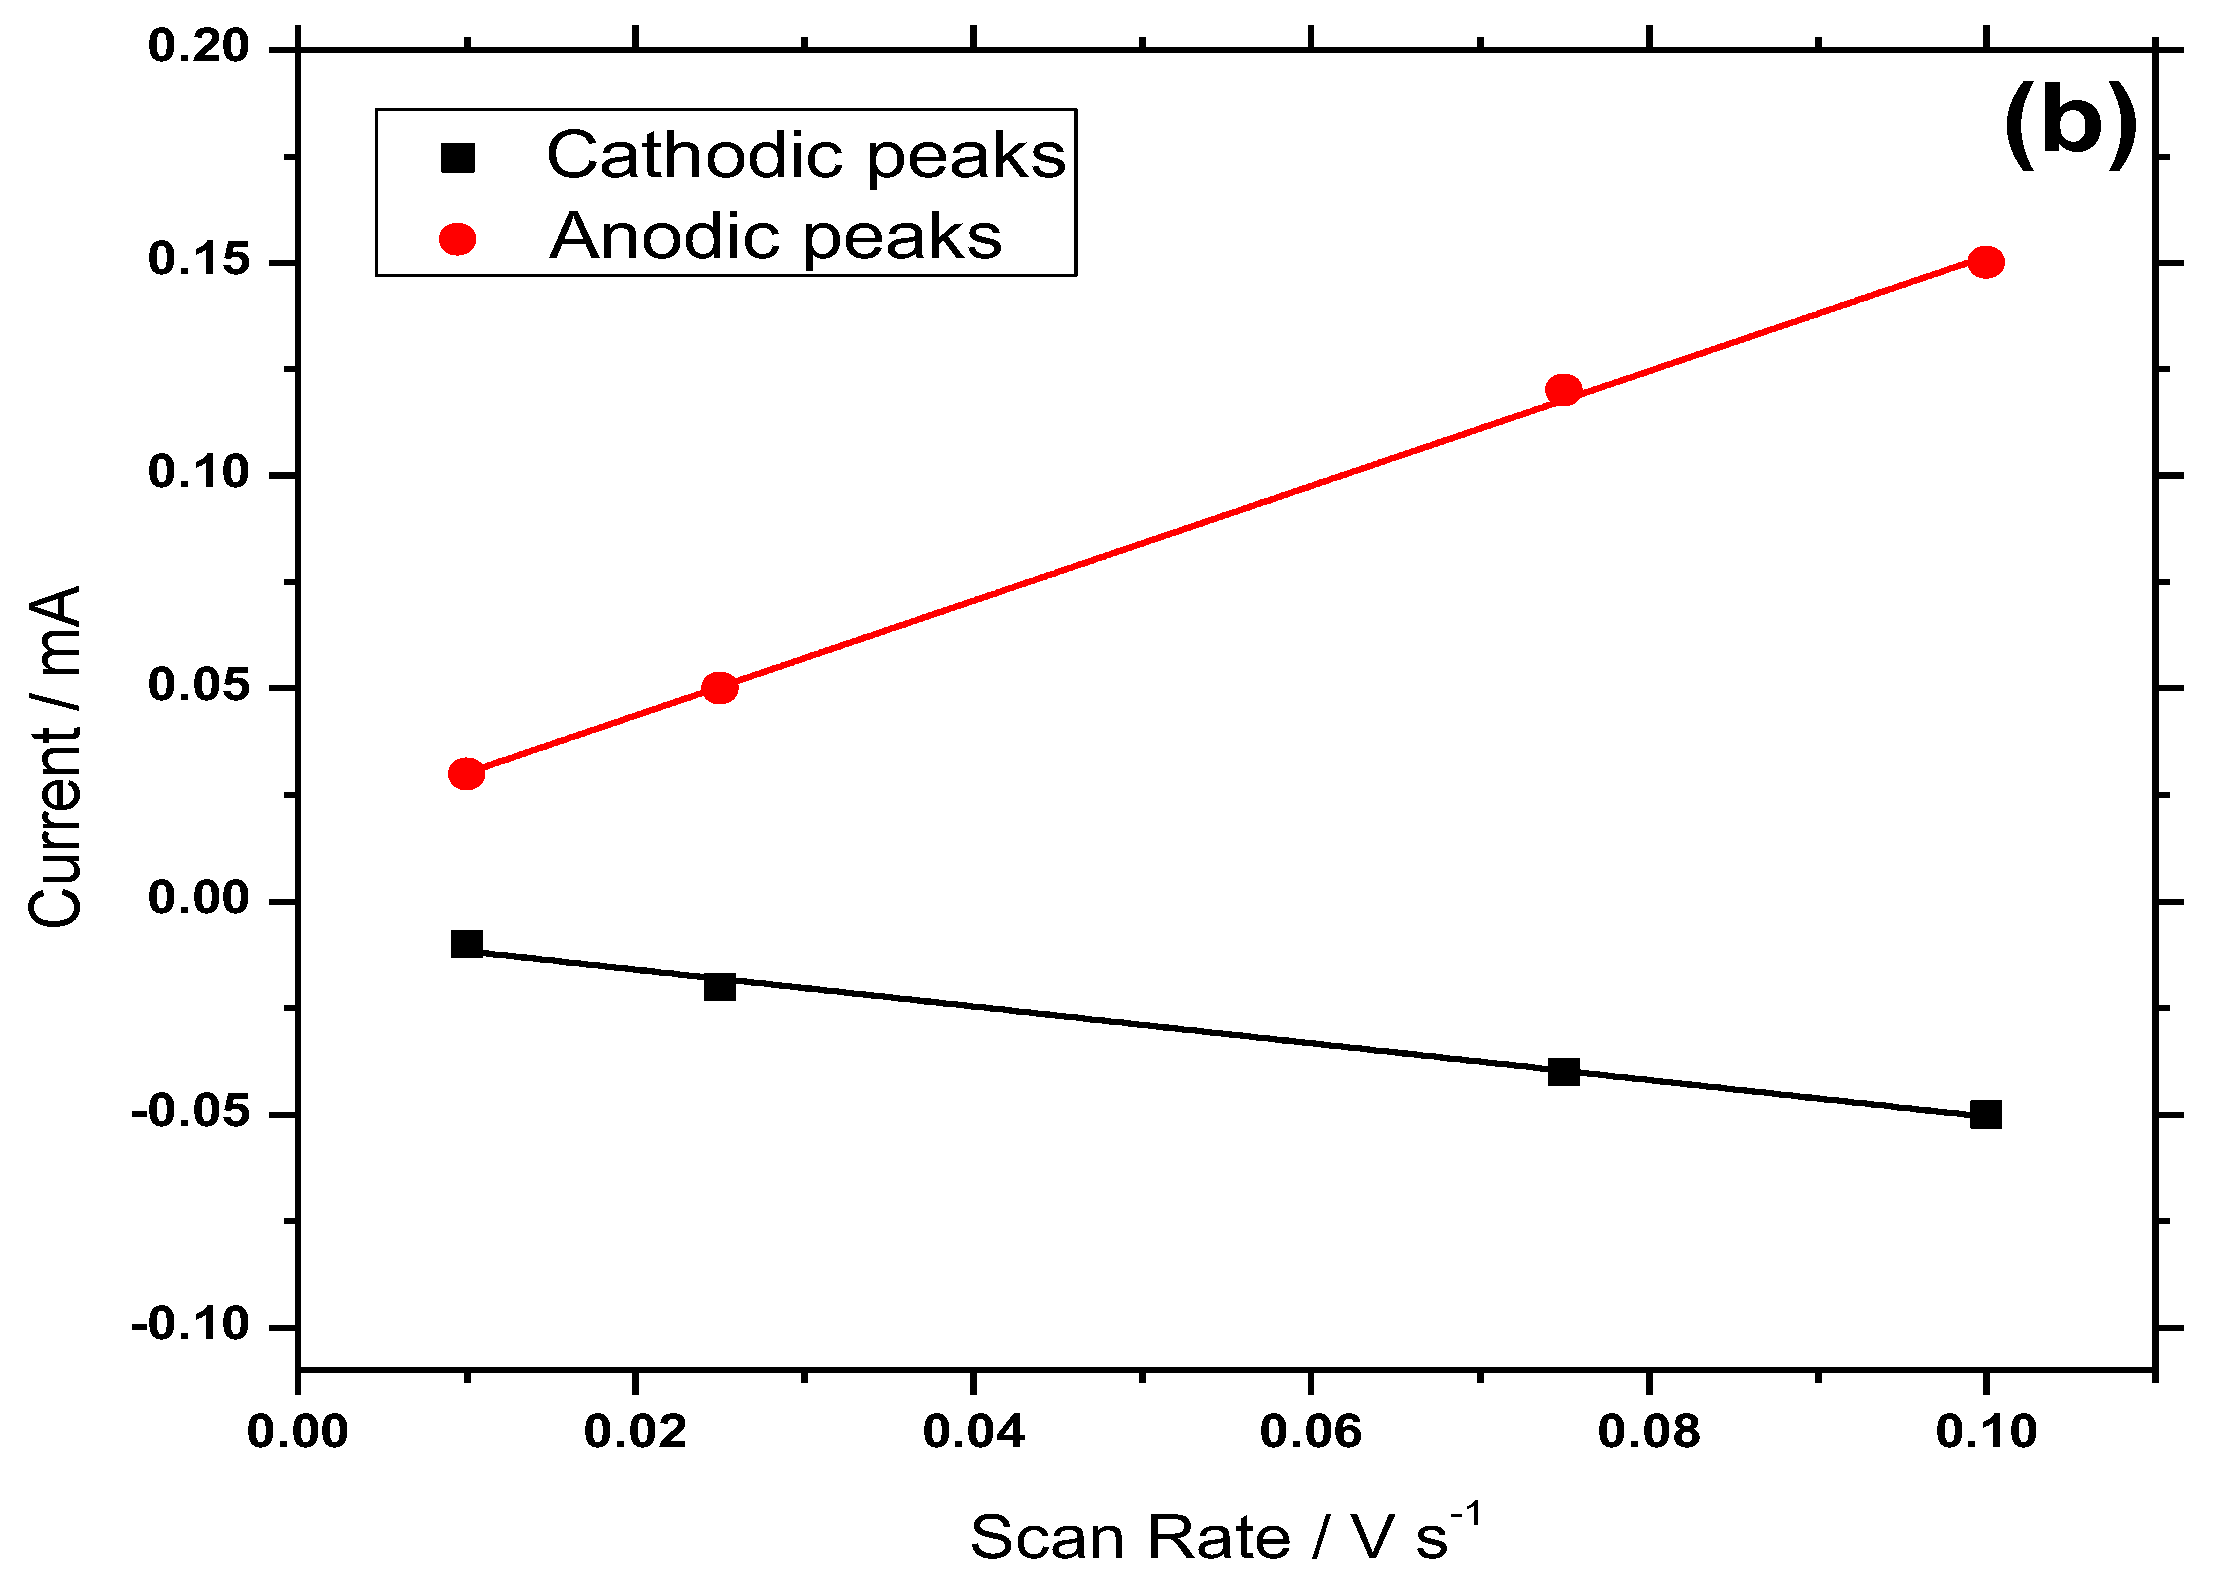
3.5. Electrochemical Behavior of Hemin/SnO2-Metglas and SnO2-Metglas Electrodes

Figure 9 shows the CVs of Metglas, SnO2-Metglas and hemin-modified SnO2-Metglas in deaerated hemin free 10 mM NaH2PO4 (pH = 7) at a scan rate of 0.1 V s−1. In Figure 9a, the CV of the bare Metglas exhibits one broad cathodic peak at −0.4 V and one anodic peak at 0 V. The voltage range is taken from −1 to 0.4 V and in this range the Metglas electrode is effectively working without any breakdown. These peaks could possibly be due to the high content of iron in Metglas which is an amorphous metallic material and thus the iron atoms can occur in both Fe2+ and Fe3+ states, depending on their local neighborhood in the amorphous atomic framework. These peaks could be a sum of contribution of various oxidation processes of iron to form divalent or trivalent species [56].
The SnO2-Metglas electrode in Figure 9b shows the characteristic charging/discharging currents assigned to electron injection into sub-band gap/conduction band states of the SnO2 film as observed previously on different substrates such as fluorine doped tin oxide, FTO glass and indium tin oxide-poly (ethylene terephthalate), ITO-PET [32,50]. The charging of the SnO2-Metglas electrode starts at +0.1 V, which is very close to the values reported for SnO2 on other substrates [32,50]. However, the charging starts at a much more positive bias compared with the ZnO film on the same Metglas ribbon we used in a recent study [43], where the charging starts at −0.16 V. In addition, the preparation method of the SnO2 films compared to the ZnO films used in the past is simpler, faster, of lower cost, using a low temperature route and not a sintering process.
In addition, Figure 9c shows the CV of a Metglas-SnO2 film after the immobilization of hemin on its surface. This time a couple of strong redox peaks are observed at −0.31 (cathodic) and −0.06 V (anodic). These redox peak currents resulted from the mono-electron transfer process to the immobilized hemin for the conversion from Fe3+ to Fe2+. The midpoint potential is estimated form the values of the anodic and cathodic peak potentials, −0.185 V, close to those obtained with hemin on TiO2 or various carbon electrodes [28,33]. In addition, this value shows a shift to more positive potentials compared with the −0.26 V midpoint potential obtained for hemin on similar SnO2 films on ITO-PET substrate [32].
It is clear that the mesoporous structure of the SnO2 film not only allows the effective immobilization of hemin on its surface but also promotes the electron transfer process between hemin and electrode at mild applied biases comparable to or even lower than those applied on other electrodes.
Furthermore, the effect of the potential scan rate applied to the Hemin/SnO2-Metglas electrode is investigated and presented in Figure 10a,b. The cathodic and anodic peak currents corresponding to the immobilized hemin vary linearly with the scan rates from 0.1 to 0.01 V s−1 (Figure 10b) indicative of a surface-confined electrochemical process. Reduction peaks occur at around −0.31 V and reoxidation at −0.05 V. As the scan rate is steadily increased, the current increases and is significantly bigger if we compare the 0.1 V s−1 to the 0.01 V s−1.
The Fe3+/Fe2+ redox chemistry of heme is termed quasi-reversible as the peak-to-peak potential separation (ΔEp) > 60 mV. The ΔEp is 80 mV at a scan rate of 0.025 V s−1 similar to other hemin-modified electrodes reported in the past [28,32,33]. This implies a relatively fast direct electron transfer between the redox active center of hemin and the SnO2-Metglas electrode. The kinetics of the electron transfer for the Hemin/SnO2-Metglas electrode were analyzed using the model of Laviron [57].
A graph of the dependence of peak separation on the logarithm of the scan rate yields a straight line with a slope equal to a charge-transfer coefficient α of 0.88. For a peak separation 0.302 mV and for a scan rate of 0.1 V s−1, a ks value was estimated to be 0.48 s−1. This value is in the range of ks for typical surface-controlled quasi-reversible electron transfer. For lower scan rates (less than 0.1 V s−1), the peak separation is decreased, getting closer to the 0 mV expected for an ideal surface controlled reversible electrochemical process. This behavior was achieved without the addition of any promoters or mediators in the electrolyte solution. It is, therefore, obvious that the mesoporous structure of the SnO2 film promotes the rapid electron transfer between hemin and the underlying Metglas surface.

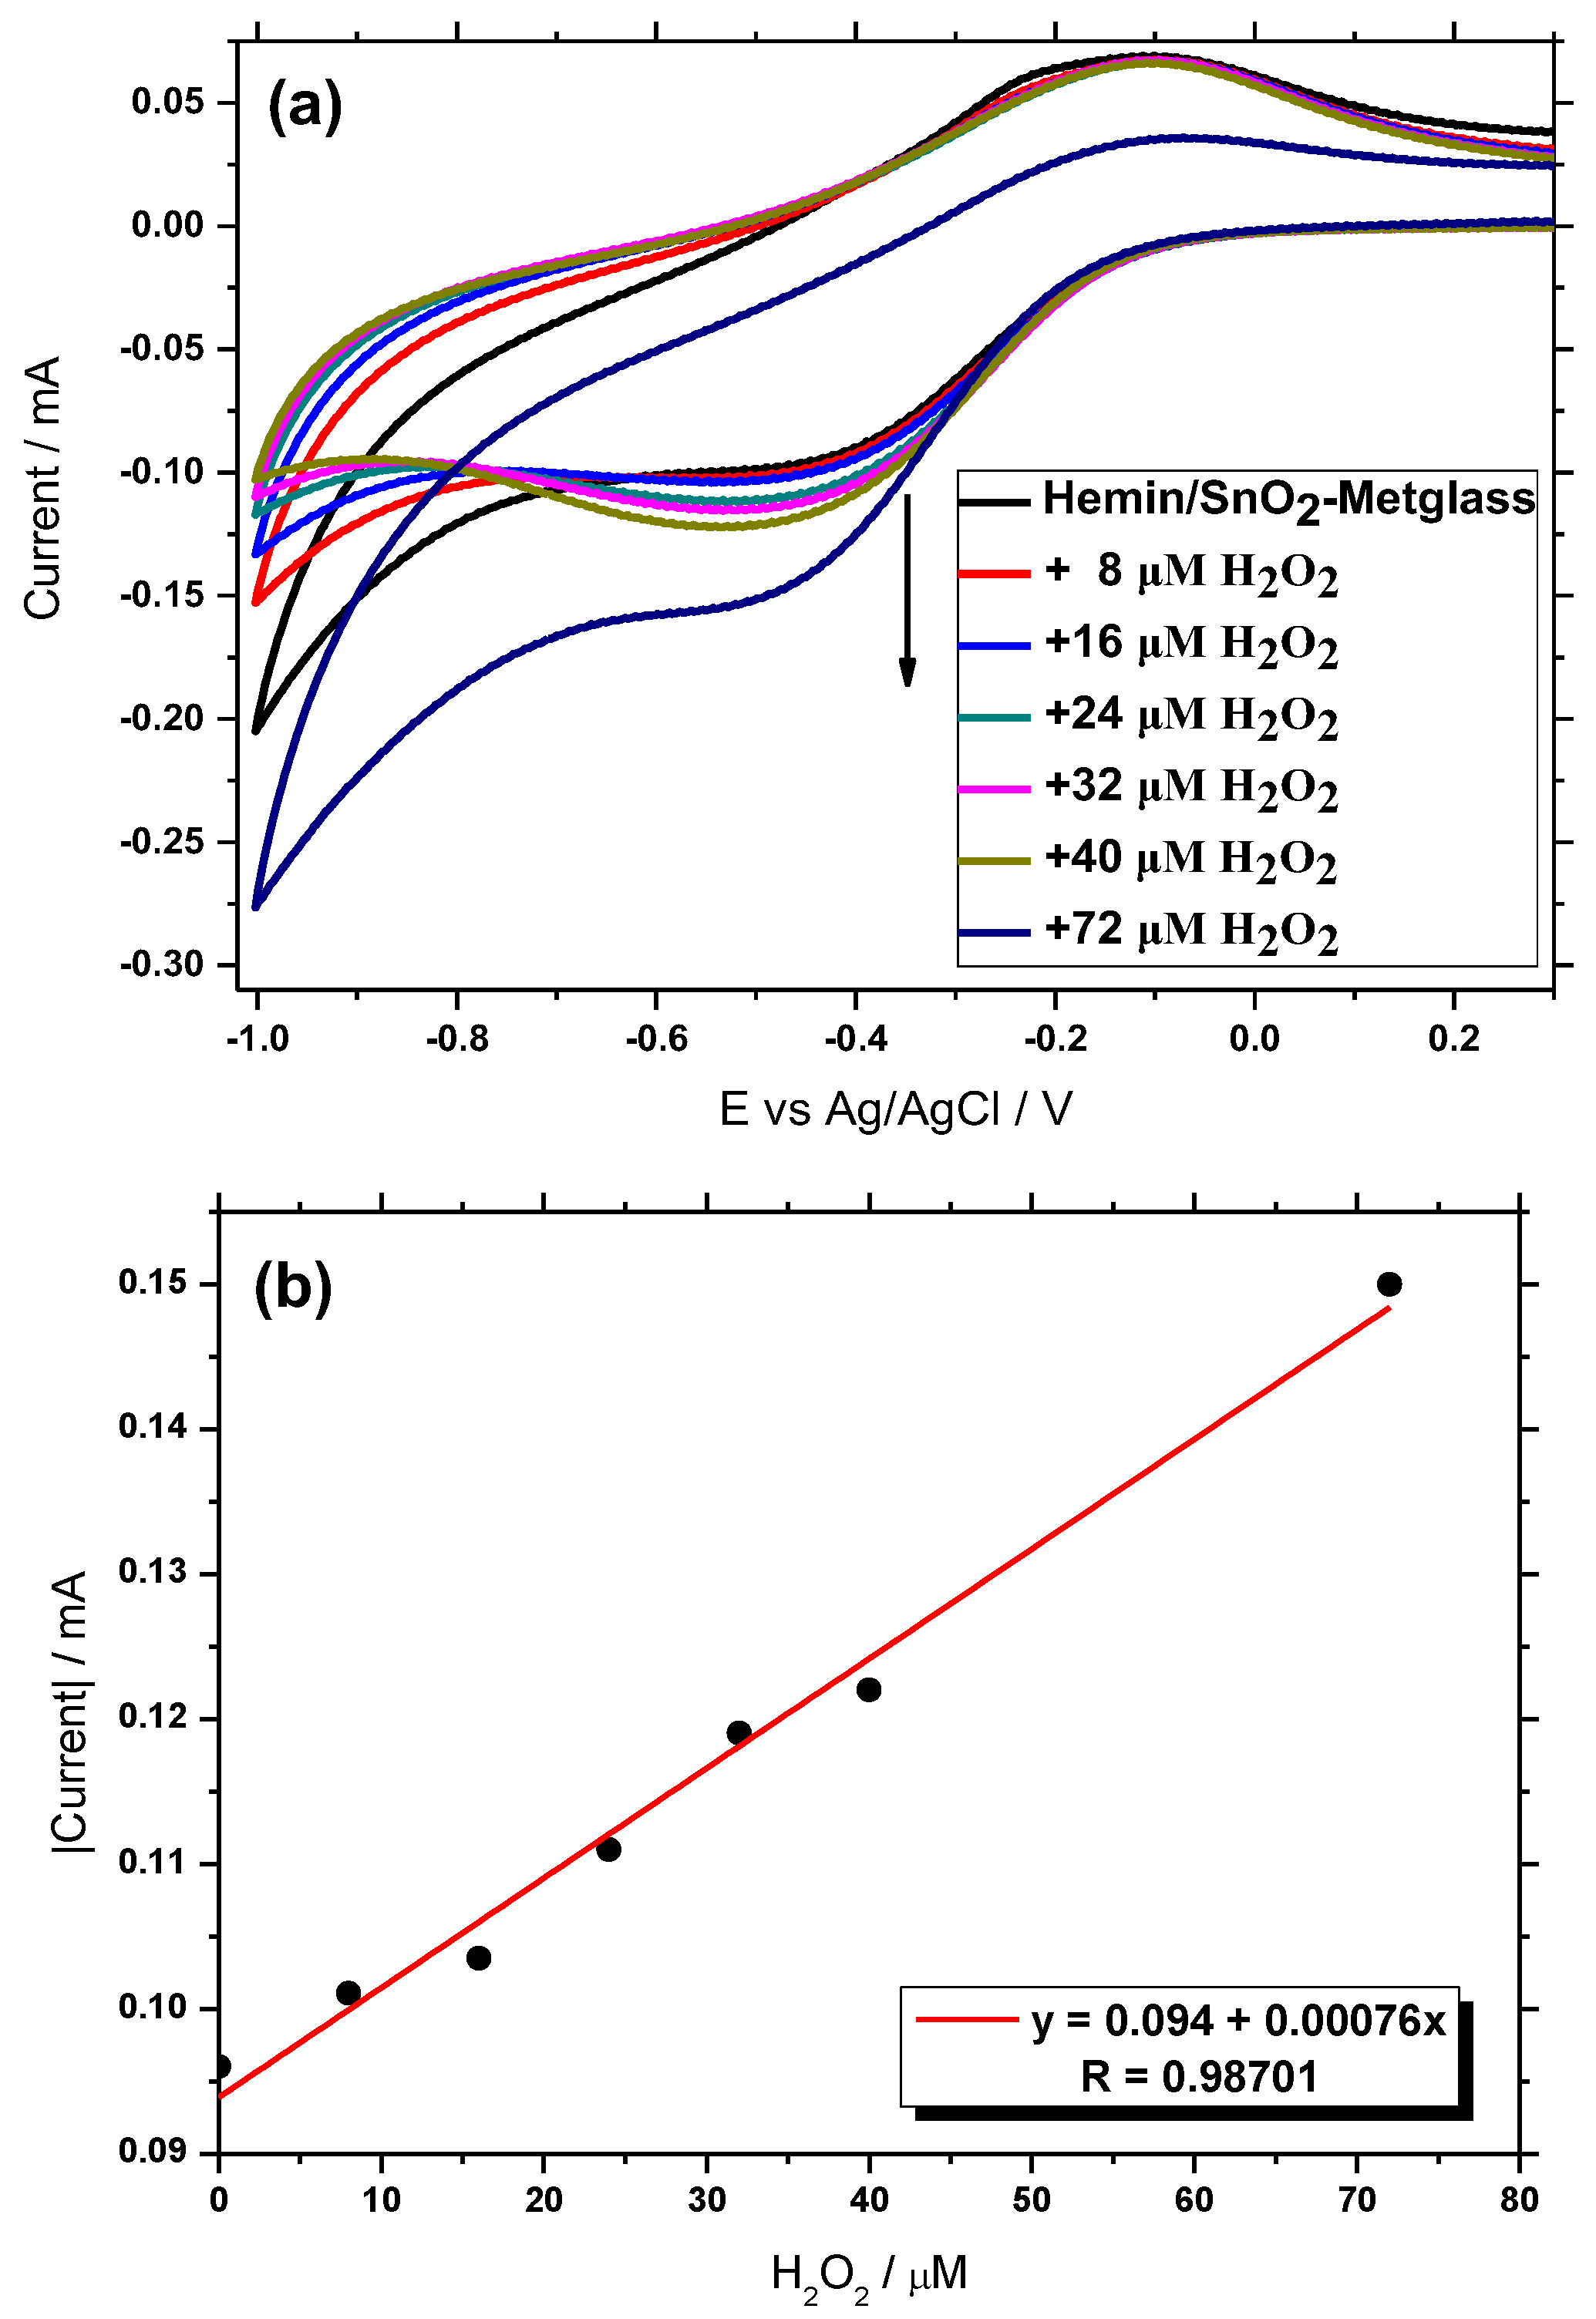
3.6. Electrocatalytic Behavior of H2O2 at the Hemin/SnO2-Metglas Electrode

The suggested simplified mechanism of the electrochemical catalytic reduction of H2O2 on the immobilized hemin can be expressed as the following:
Hemin (Fe3+) + H+ + e → Heme (Fe2+)
Heme (Fe2+) + H2O2 + 2H+ + e → Hemin (Fe3+) + 2H2O
Figure 11a displays the electrocatalytic activity of the immobilized hemin toward H2O2 reduction. CV was employed over a range from +0.2 to −1 V. As the increasing concentrations of H2O2 (8–72 μM) were added successively, every 30 s, in the electrochemical cell where our Hemin/SnO2-Metglas electrode was immersed in NaH2PO4 (pH = 7) buffer, the cathodic peak current at −0.49 V increased progressively, indicating the occurrence of the typical electrocatalytic reduction process of H2O2. Simultaneously, the oxidation peak currents decreased accordingly, exhibiting a good electrocatalytic behavior. The reduction potential of H2O2 on our electrodes is around the values reported in the literature [32,43]. Figure 11b shows the proportional, linear (R = 0.987) steady increase of the electrocatalytic cathodic current upon increasing additions of H2O2 in the NaH2PO4 buffer. This plot shows that the CV method is sensitive enough to detect electrochemical changes that occur between the immobilized hemin and H2O2.
Control CVs of hemin free SnO2-Metglas electrodes exhibited negligible dependence upon H2O2 concentration. For comparison, the peak current at the cathodic peak at −0.49 V of the Hemin/SnO2-Metglass electrode is plotted in Figure 12 as solid squares, together with the corresponding signal (solid triangles) which is obtained when H2O2 is added in the electrolyte solution. The control experiment produced a flat response with a small error of 0.01 mA, and it is obvious that the changes brought up with the reduction of H2O2 by the immobilized hemin produced a big enough sensing signal of about 0.15 mA in variation, much larger than the above error, confirming the good sensitivity of the CV method.

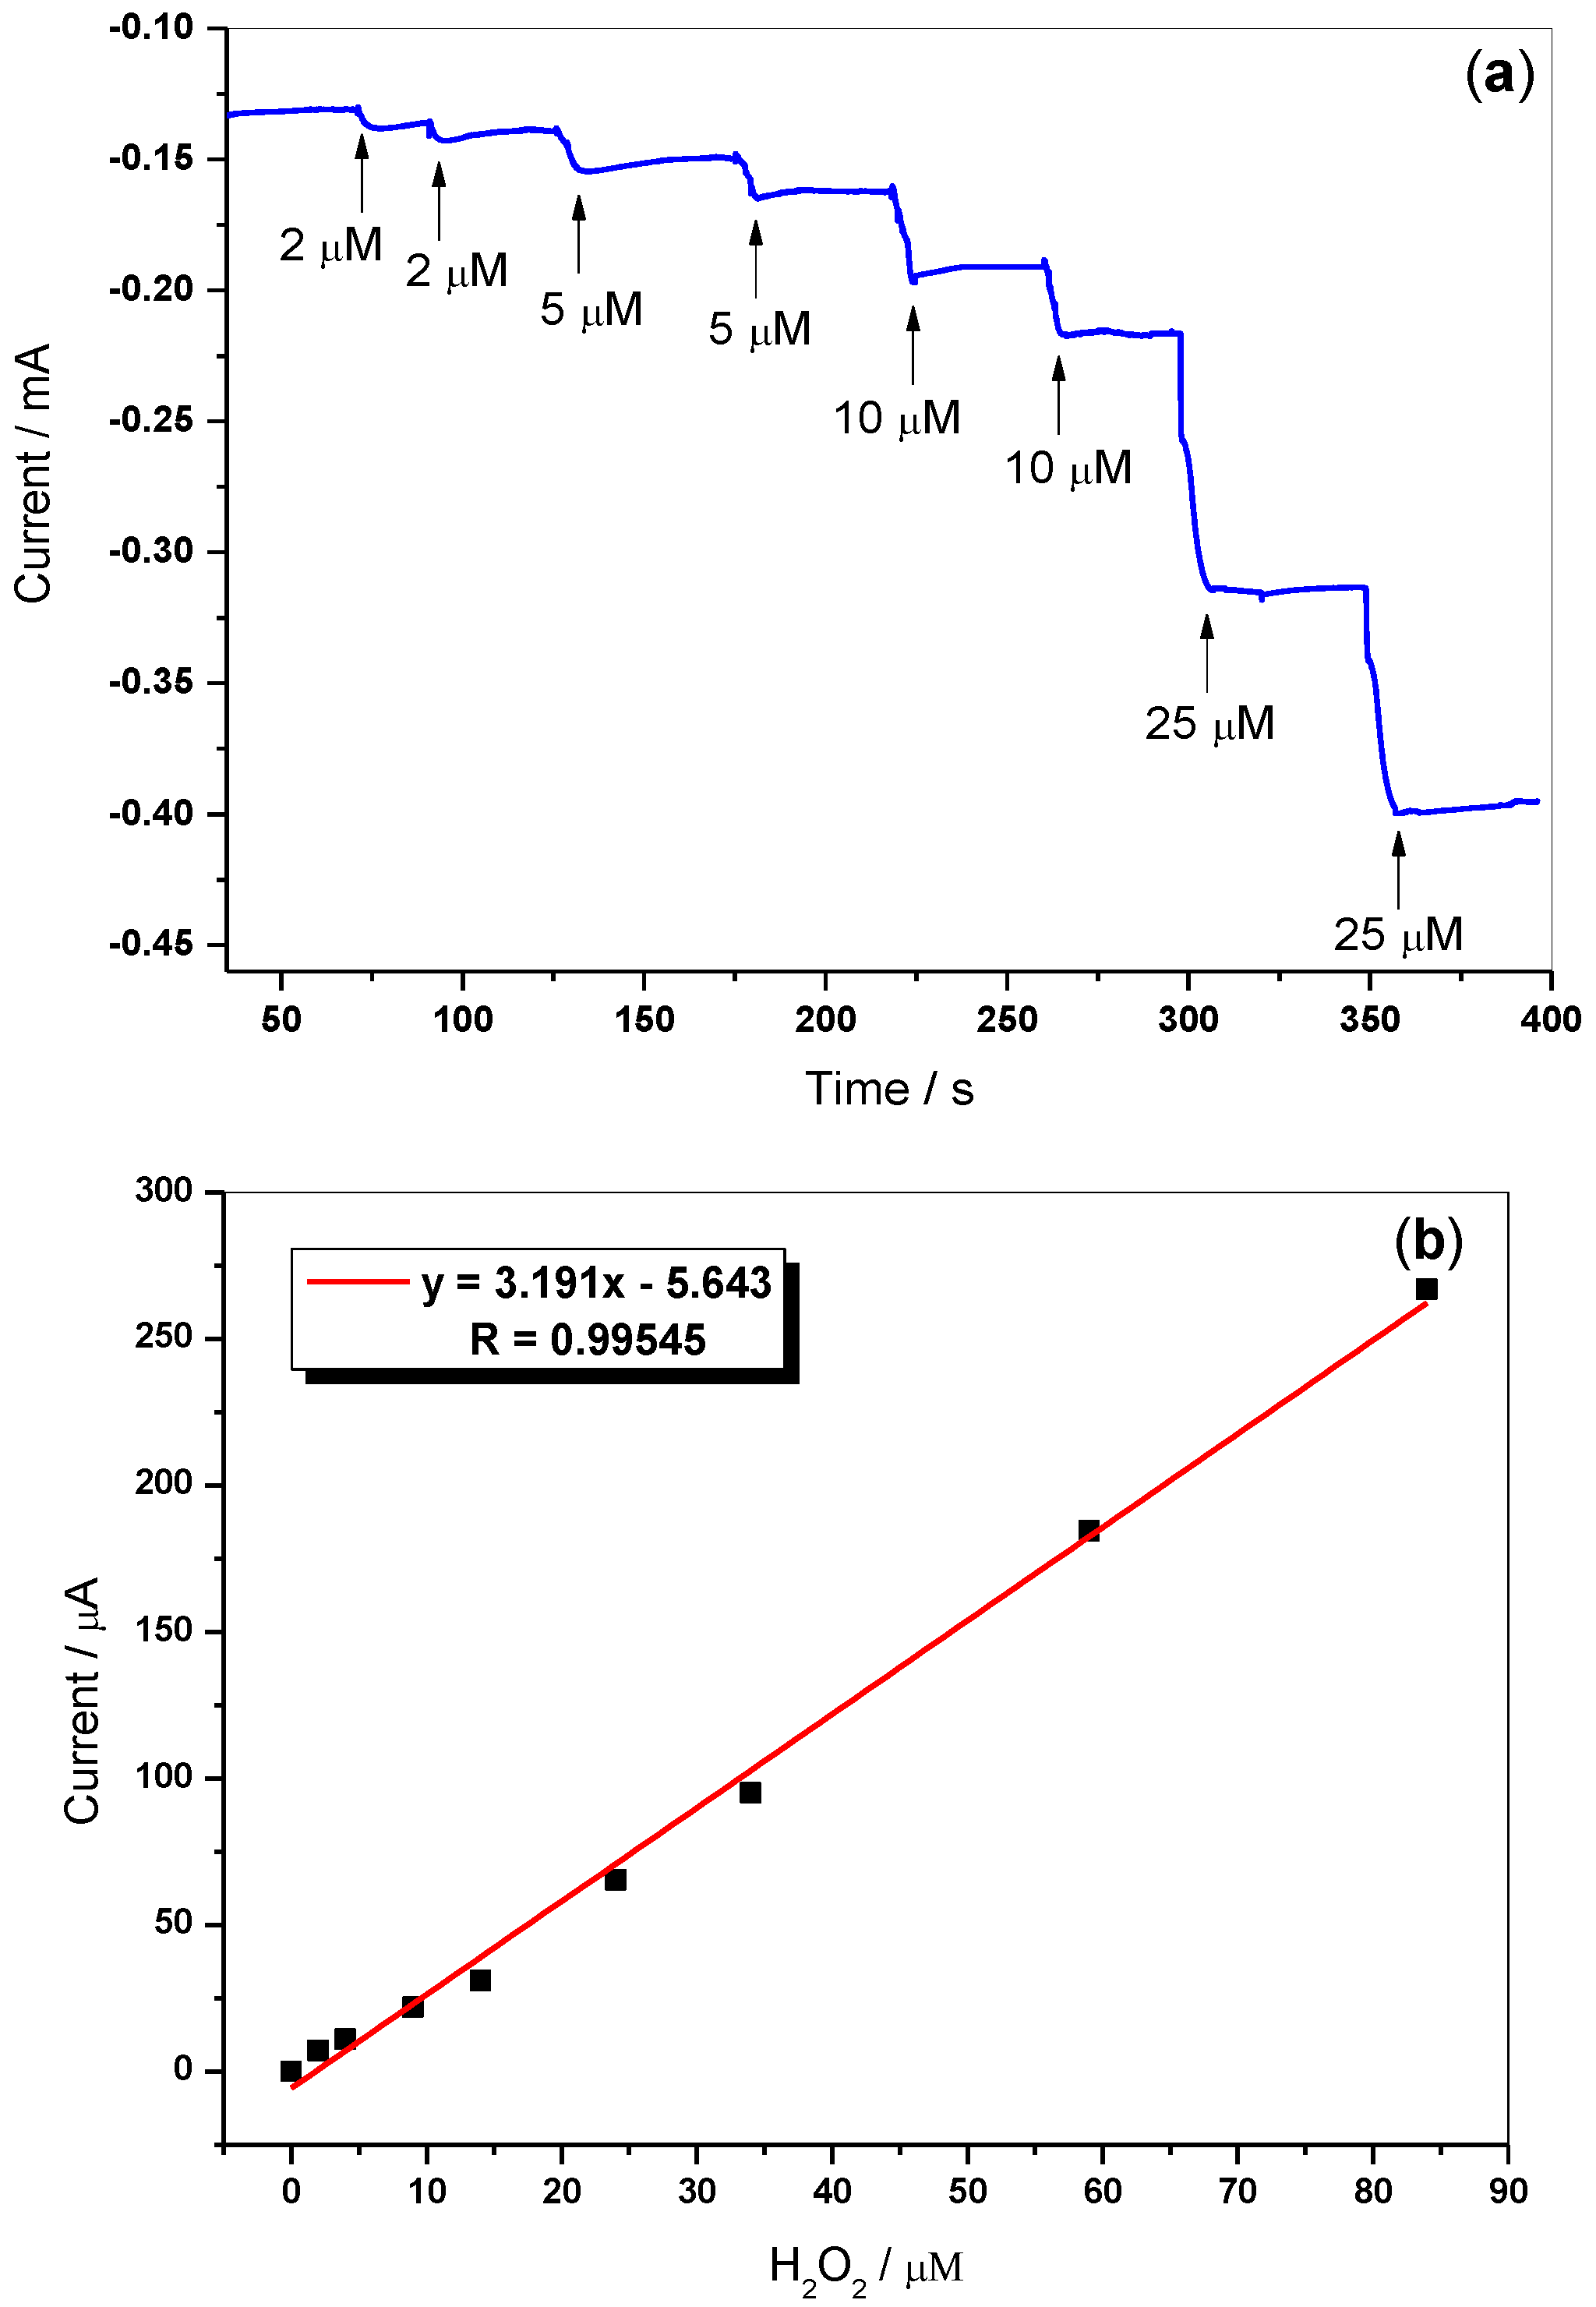
3.7. Amperometric Sensing of H2O2

Based on the electrocatalytic results above, a biosensor for the quantitative determination of H2O2 is proposed. To improve the sensitivity, the performance of the Hemin/SnO2-Metglas film electrode towards the determination of H2O2 was evaluated by amperometry. Figure 13a shows a typical current-time curve of a Hemin/SnO2-Metglas film electrode for the successive additions of H2O2 in a stirred cell with NaH2PO4 buffer and an applied potential at −0.4 V. The sensor gives continuous real-time current responses to changing H2O2 concentrations. The reduction peak potential for H2O2 displayed in Figure 11a (CV measurements) is around −0.5 V. However, the applied potential for amperometric sensing of H2O2 should be more positive in order to decrease the background current and minimize the response/effect of common interferents. From our study of the influence of the applied potential on the amperometric response to H2O2 we concluded that a −0.3 V produced a very low response and the signal was enhanced at −0.4 V. When the applied potential was further negatively shifted up to −0.6 V, the background current increased but the current response toward H2O2 decreased. Therefore, −0.4 V was selected as the applied potential for our chronoamperometric sensor.
Figure 13a shows that after the addition of H2O2 significant increases in the cathodic current are observed. The response reaches the steady-state value within 10–15 s which is a relatively fast response. Figure 13b corresponds to the calibration plot of the prepared biosensor. The currents had a linear dependence on the concentration of H2O2 in the range of 2–90 μM with a correlation coefficient 0.995 and the detection limit was examined to be 1.6 × 10⁻⁷ M.
The analytical performance of our Hemin/SnO2-Metglass electrode towards H2O2 is compared with other hemin-modified electrodes which were used in the past for the development of amperometric and/or voltammetric sensors and the results are summarized in Table 2. It is obvious that the sensitivity (linear range) of our sensor compares well with the other electrodes that have been used for the development of H2O2 sensors. It is also notable that the detection limit (LOD) of our electrode is superior in some cases as compared to the previously reported electrode materials. These very good results obtained for our sensor are due to the high active area of the SnO2 film on the Metglas substrate, the high hemin loading achieved in a stable and functional way, and the fact that fast and direct electron transfer is achieved between the immobilized hemin and the SnO2-Metglas electrode without the use of any mediators or promoters. However, the aim was not to produce the most sensitive electrochemical sensor for H2O2, but rather one which will compare well with other electrodes and would be more sensitive that the Hb/ZnO-Metglas sensor we developed in the past. A much lower LOD for H2O2 was obtained for this sensor compared with the Hb/ZnO-Metglas electrodes.
Furthermore, the selectivity of this sensor for interferents that may be present in real samples has been tested by our group in a recent study [32]. Our sensor is free of interferences like uric acid (2%) and exhibits a slight interference (7%–8%) of response currents to 100 μM ascorbic acid relative to 100 μM H2O2. The reproducibility of our electrodes was also tested. Their preparation method for the SnO2 films is very simple, involves very few steps and a low-temperature route; therefore, they can be easily scaled-up on the metallic ribbon substrate. Six separate films prepared under the same conditions produced very similar results for the electrochemical reduction of hemin and its electrocatalytic performance towards H2O2 with a relative standard deviation of around 4%–5%. After preparation the electrodes could be stored for up to two weeks at 5 °C and could be used repeatedly maintaining at least 90% of their electrocatalytic activity.

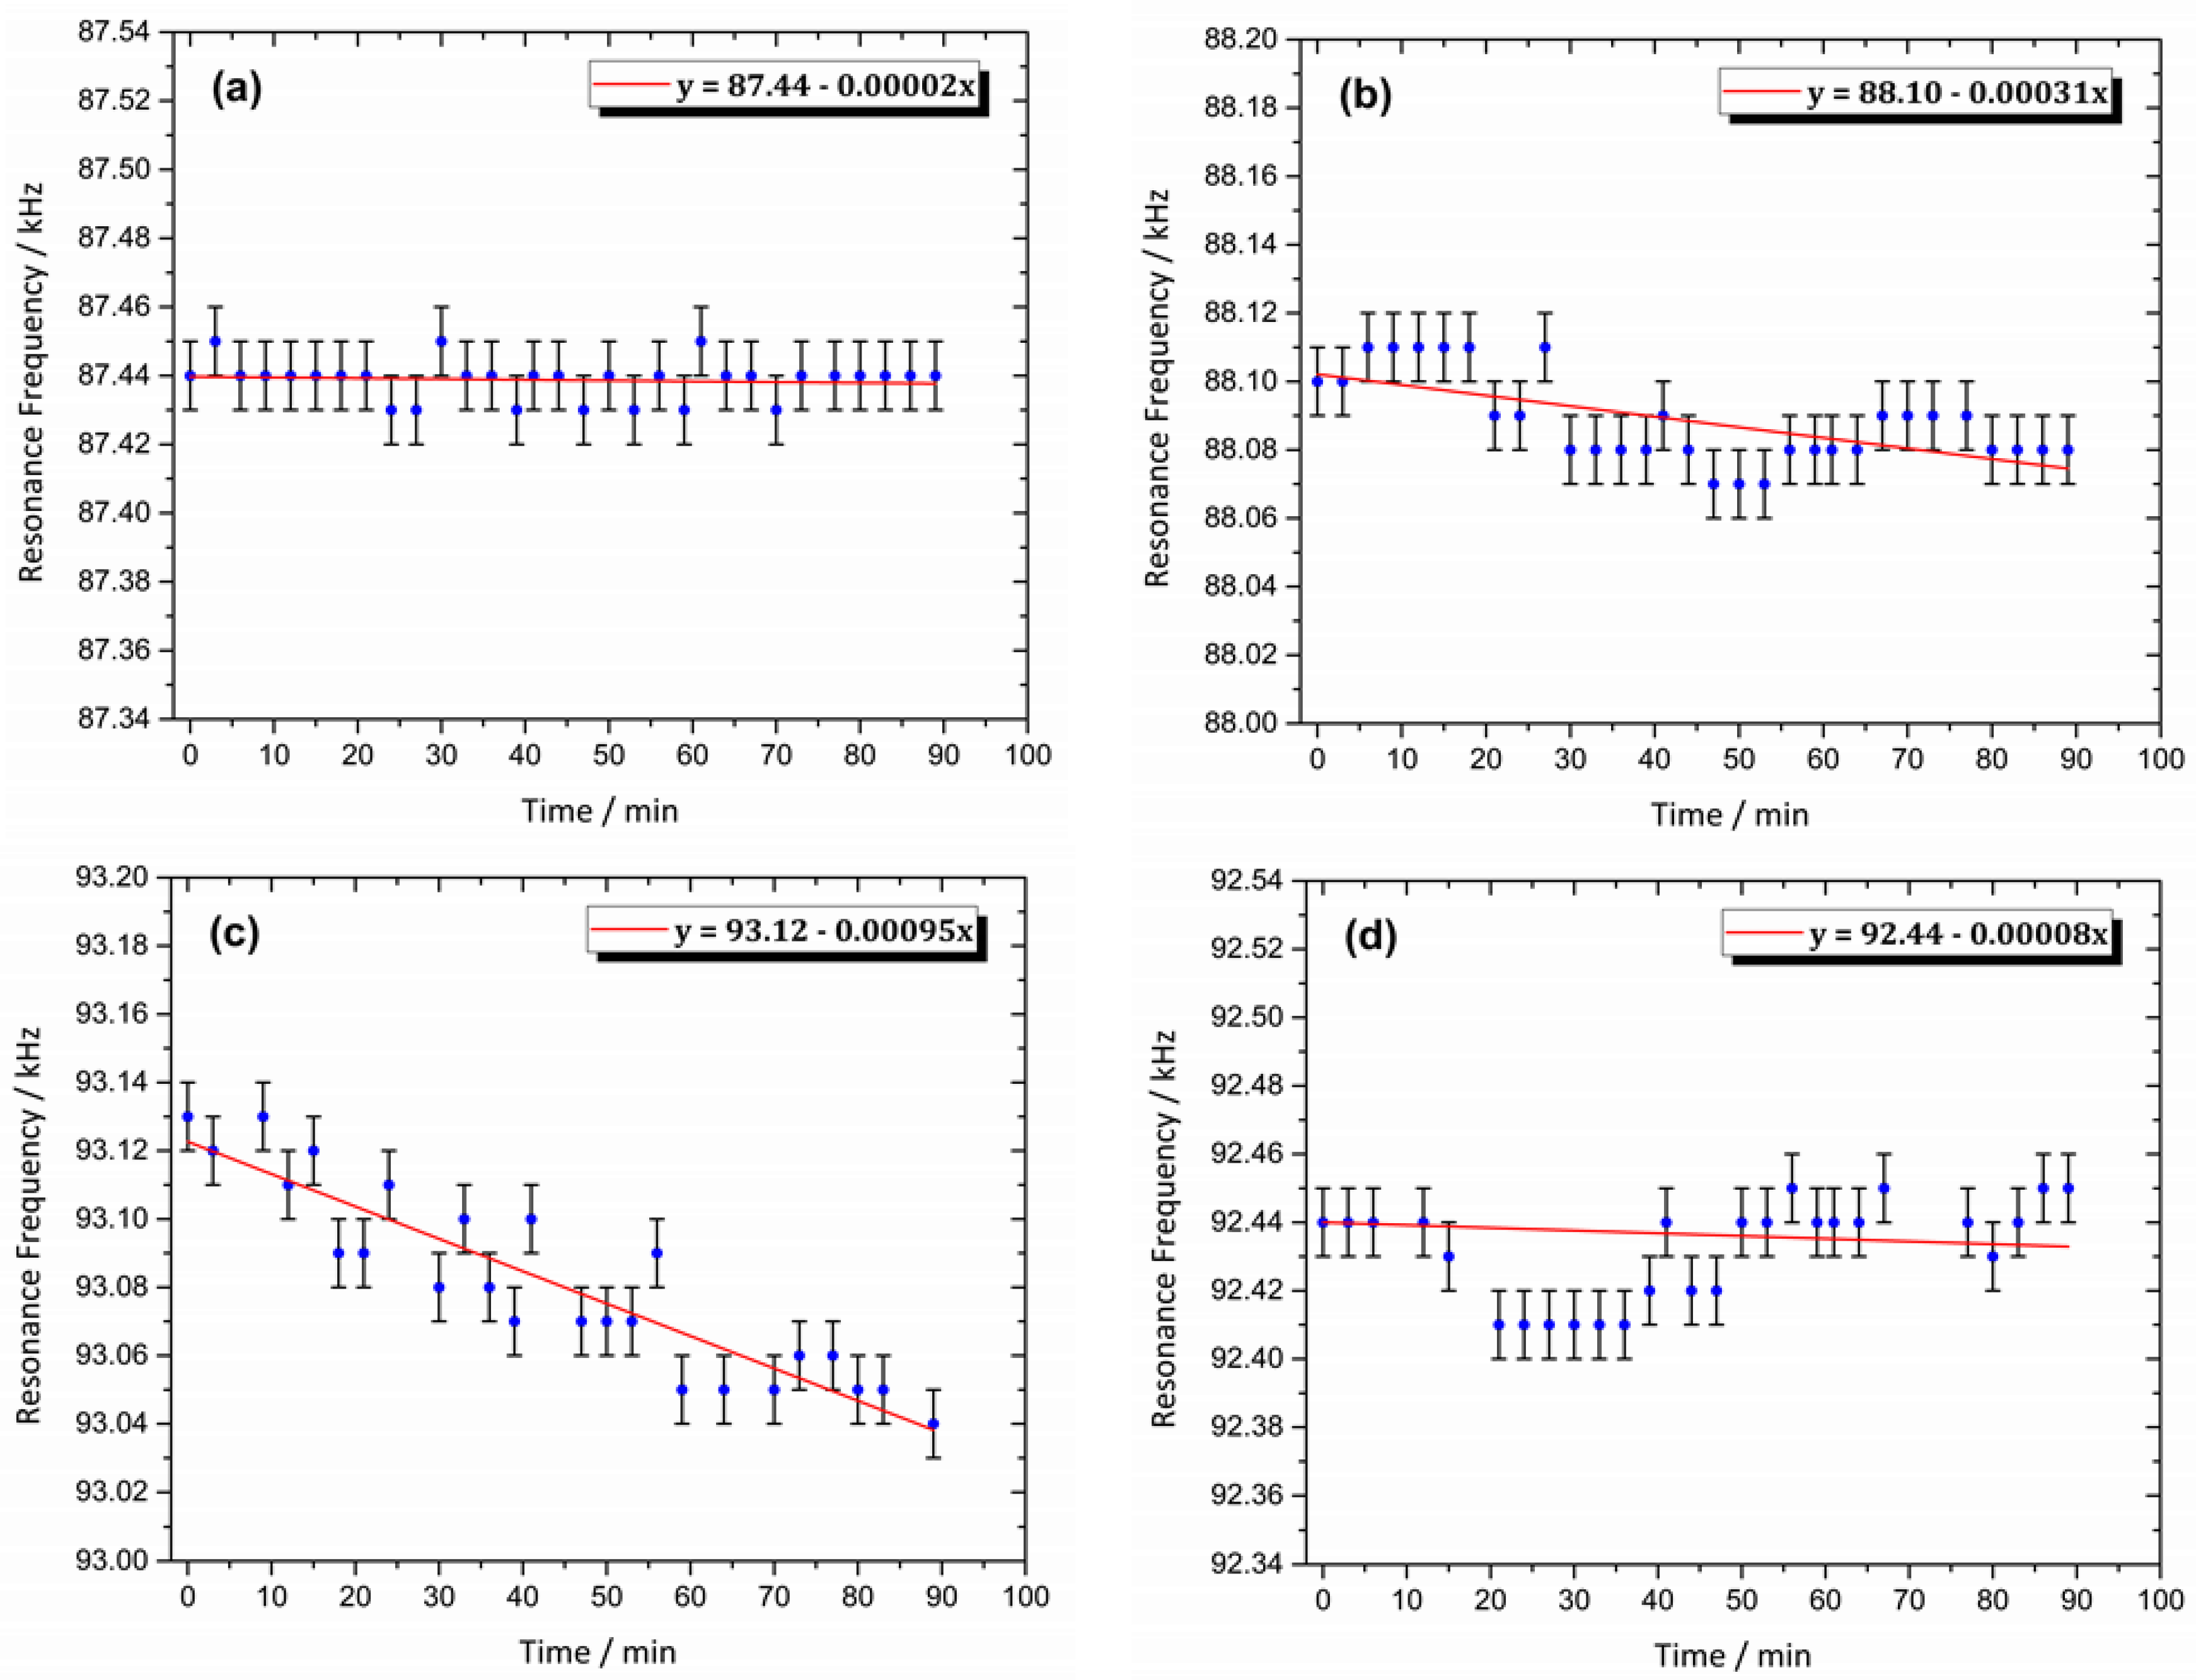
3.8. Magnetic Resonance Behavior of the Sensor

The MR measurements, as described in the section on the experimental procedure, were performed on four Metglas ribbons, of which one was bare Metglas, one was SnO2-Metglas and the last two were Hemin/SnO2-metglas ribbons. Figure 14 shows the resonance behavior of the ribbons versus time, with Figure 14a–c, corresponding to bare Metglas, SnO2-Metglas and Hemin/SnO2-Metglas in the presence of 72 μM H2O2 in the solution, respectively. Figure 14d, on the other hand, shows a Hemin/SnO2-Metglas without H2O2 present in the solution. For each ribbon, a total number of 30 measurements were performed, each one every 3 min. A change of 0.09 ± 0.01 kHz was observed for the Hemin/SnO2-Metglas ribbon with H2O2 (Figure 14c), indicating the mass increase on the sensor. For the particular Metglas ribbon used (length = 2.5 cm), calibration with known small mass loads gives a calibration factor of −1.63 kHz·mg−1. Using this factor, the maximum H2O2 concentration of 72 μM and the resonance frequency change, a corresponding mass increase of 767 ng/μΜ was calculated on the sensor. On the other hand, for the Hemin/SnO2-Metglas ribbon without H2O2 in the solution (Figure 14d), almost no changes occurred on the resonance frequencies, showing thus the effect of H2O2 on the sensor. The control diagrams of Figure 14a,b for bare Metglas and SnO2-Metglas showed no significant resonance changes in the presence of H2O2, as the interaction element, hemin, is not immobilized on their surfaces. However, Figure 14b shows a slight resonance change. This happens due to the porous structure of the SnO2 film, which can encapsulate some H2O2 molecules present in the solution and therefore increase slightly the mass on the sensor.

4. Conclusions

In this work, we reported a simple, low-temperature method for preparing Hemin/SnO2 films on a magnetic ribbon substrate for the detection of H2O2. Two detection methods, CV and MR were used successfully for the simultaneous sensing of H2O2. High hemin loading in a stable and functional way, using a simple coating method, was achieved. Direct and fast electron transfer between the immobilized hemin and the SnO2-Metglas electrode was observed without the use of any mediators or promoters. A much lower LOD for H2O2 was obtained compared with the Hemin/ZnO-Metglas electrodes we had used in the past. Experimental MR results showed a sensible change of the resonance frequency of the Hemin/SnO2-Metglas sensor in the presence of H2O2, confirming thus the mass change on the sensor. Specifically, a calculated mass increase of about 767 ng/μM was achieved after the addition of H2O2, much higher than the 152 ng/μM obtained for the Hemin/ZnO-Metglas electrodes in the past. It should also be noted that no interference occurred when both techniques were applied on the same Hemin/SnO2-Metglas electrode. This approach should be extendable to many other analytes of interest in clinical control, environmental, food and industrial analysis that have been detected so far using mostly sensitive electrochemical techniques. MR could be applied for the sensing of these analytes simultaneously, confirming the sensitivity of the electrochemical methods and developing novel magnetoelastic sensors.

Author Contributions

E.T. and G.S. conceived and designed the experiments; P.N., G.S., A.G.-L., E.S. and I.M.B. performed the experiments; E.T., G.S. and P.N. analyzed the data; E.T. and G.S. contributed reagents/materials/analysis tools; E.T., G.S. and P.N. wrote the paper.

Funding

This research received no external funding.

Conflicts of Interest

The authors declare no conflict of interest.

References

  1. Woo, Y.A.; Lim, H.R.; Kim, H.J.; Chung, H. Determination of hydrogen peroxide concentration in antiseptic solutions using portable near-infrared system. J. Pharm. Biomed. Anal. 2003, 33, 1049–1057. [Google Scholar] [CrossRef]
  2. Wang, T.Y.; Zhu, H.C.; Zhuo, J.Q.; Zhu, Z.W.; Papakonstantinou, P.; Lubarsky, G.; Lin, J.; Li, M.X. Biosensor Based on Ultrasmall MoS2 Nanoparticles for Electrochemical Detection of H2O2 Released by Cells at the Nanomolar Level. Anal. Chem. 2013, 85, 10289–10295. [Google Scholar] [CrossRef] [PubMed]
  3. Bai, J.; Jiang, X. A Facile One-Pot Synthesis of Copper Sulfide-Decorated Reduced Graphene Oxide Composites for Enhanced Detecting of H2O2 in Biological Environments. Anal. Chem. 2013, 85, 8095–8101. [Google Scholar] [CrossRef] [PubMed]
  4. Silva, R.A.B.; Montes, R.H.O.; Richter, E.M.; Munoz, R.A.A. Rapid and selective determination of hydrogen peroxide residues in milk by batch injection analysis with amperometric detection. Food Chem. 2012, 133, 200–204. [Google Scholar] [CrossRef]
  5. Seders, L.A.; Shea, C.A.; Lemmon, M.D.; Maurice, P.A.; Talley, J.W. LakeNet: An Integrated Sensor Network for Environmental Sensing in Lakes. Environ. Eng. Sci. 2007, 24, 183–191. [Google Scholar] [CrossRef]
  6. Takahashi, A.; Hashimoto, K.; Kumazawa, S.; Nakayama, T. Determination of hydrogen peroxide by high-performance liquid chromatography with a cation-exchange resin gel column and electrochemical detector. Anal. Sci. 1999, 15, 481–483. [Google Scholar] [CrossRef]
  7. Matsubara, C.; Kawamoto, N.; Takamura, K. Oxo [5, 10, 15, 20-tetra(4-pyridyl) porphyrinato] titanium (IV): An ultra-high sensitivity spectrophotometric reagent for hydrogen peroxide. Analyst 1992, 117, 1781–1784. [Google Scholar] [CrossRef]
  8. Zscharnack, K.; Kreisig, T.; Prasse, A.A.; Zuchner, T. A luminescence-based probe for sensitive detection of hydrogen peroxide in seconds. Anal. Chim. Acta 2014, 834, 51–57. [Google Scholar] [CrossRef] [PubMed]
  9. Xu, C.; Ren, J.; Feng, L.; Qu, X. H2O2 triggered sol–gel transition used for visual detection of glucose. Chem. Commun. 2012, 48, 3739–3741. [Google Scholar] [CrossRef] [PubMed]
  10. Sun, J.; Li, C.; Qi, Y.; Guo, S.; Liang, X. Optimizing Colorimetric Assay Based on V2O5 Nanozymes for Sensitive Detection of H2O2 and Glucose. Sensors 2016, 16, 584. [Google Scholar] [CrossRef] [PubMed]
  11. Kim, J.H.; Patra, C.R.; Arkalgud, J.R.; Boghossian, A.A.; Zhang, J.H.; Han, J.; Reuel, N.F.; Ahn, J.H.; Mukhopadhyay, D.; Strano, M.S. Single-Molecule Detection of H2O2 Mediating Angiogenic Redox Signaling on Fluorescent Single-Walled Carbon Nanotube Array. ACS Nano 2011, 5, 7848–7857. [Google Scholar] [CrossRef] [PubMed]
  12. Shamsipur, M.; Pashabadi, A.; Molaabasi, F. A novel electrochemical hydrogen peroxide biosensor based on hemoglobin capped gold nanoclusters-chitosan composite. RSC Adv. 2015, 5, 61725–61734. [Google Scholar] [CrossRef]
  13. Xu, Y.; Hu, C.; Hu, S. A hydrogen peroxide biosensor based on direct electrochemistry of hemoglobin in Hb-Ag sol films. Sens. Actuators B 2008, 130, 816–822. [Google Scholar] [CrossRef]
  14. Duan, G.; Li, Y.; Wen, Y.; Ma, X.; Wang, Y.; Ji, J.; Wu, P.; Zhang, Z.; Yang, H. Direct electrochemistry and electrocatalysis of Hemoglobin/ZnO-Chitosan/nano-Au modified glassy carbon electrode. Electroanalysis 2008, 20, 2454–2459. [Google Scholar] [CrossRef]
  15. Zhu, C.; Yang, G.; Li, H.; Du, D.; Lin, Y. Electrochemical sensors and biosensors based on nanomaterials and nanostructures. Anal. Chem. 2015, 85, 230–249. [Google Scholar] [CrossRef] [PubMed]
  16. Liu, X.; Ma, T.; Pinna, N.; Zhang, J. Two-dimensional nanostructured materials for gas sensing. Adv. Funct. Mater. 2017, 1702168. [Google Scholar] [CrossRef]
  17. Zhang, J.; Liu, X.; Neri, G.; Pinna, N. Nanostructured material for room-temperature gas sensors. Adv. Mater. 2016, 28, 795–831. [Google Scholar] [CrossRef] [PubMed]
  18. Joshi, N.; Hayasaaka, T.; Liu, Y.; Liu, H.; Oliveira Jr, O.N.; Lin, L. A review on chemiresistive room temperature gas sensors based on metal oxide nanostructures, graphene and 2D transition metal dichalcogenides. Microchim. Acta 2018, 185, 213–228. [Google Scholar] [CrossRef] [PubMed]
  19. Zhang, Y.Y.; Bai, X.Y.; Wang, X.M.; Shiu, K.K.; Zhu, Y.L.; Jiang, H. Highly Sensitive Graphene-Pt Nanocomposites Amperometric Biosensor and Its Application in Living Cell H2O2 Detection. Anal. Chem. 2014, 86, 9459–9465. [Google Scholar] [CrossRef] [PubMed]
  20. Xue, S.; Jing, P.; Xu, W. Hemin on graphene nanosheets functionalized with flower-like MnO2 and hollow AuPd for the electrochemical sensing lead ion based on the specific DNAzyme. Biosens. Bioelectron. 2016, 86, 958–965. [Google Scholar] [CrossRef] [PubMed]
  21. Wang, L.; Yang, H.; He, J.; Zhang, Y.; Yu, J.; Song, Y. Cu-Hemin Metal Organic Frameworks Chitosan Reduced Graphene Oxide Nanocomposites with Peroxidase-Like Bioactivity for Electrochemical Sensing. Electrochim. Acta 2016, 213, 691–697. [Google Scholar] [CrossRef]
  22. Yang, X.; Xiao, F.B.; Lin, H.W.; Wu, F.; Chen, D.Z.; Wu, Z.Y. A novel H2O2 biosensor based on Fe3O4–Au magnetic nanoparticles coated horseradish peroxidase and graphene sheets–Nafion film modified screen-printed carbon electrode. Electrochim. Acta 2013, 109, 750–755. [Google Scholar]
  23. Lv, X.C.; Weng, J. Ternary Composite of Hemin, Gold Nanoparticles and Graphene for Highly Efficient Decomposition of Hydrogen Peroxide. Sci. Rep. 2013, 3, 3285. [Google Scholar] [CrossRef] [PubMed]
  24. Wang, J.; Chen, X.; Liao, K.; Wang, G.; Han, M. Pd nanoparticle-modified electrodes for nonenzymatic hydrogen peroxide detection. Nanoscale Res. Lett. 2015, 10, 311. [Google Scholar] [CrossRef] [PubMed]
  25. Chang, G.H.; Luo, Y.L.; Lu, W.B.; Qin, X.Y.; Sun, X.P. Carbon nanoparticles-induced formation of polyaniline nanofibers and their subsequent decoration with Ag nanoparticles for nonenzymatic H2O2 detection. Russ. J. Electrochem. 2014, 50, 95–99. [Google Scholar] [CrossRef]
  26. Gu, T.T.; Wu, X.M.; Dong, Y.M.; Wang, G.L. Novel photoelectrochemical hydrogen peroxide sensor based on hemin sensitized nanoporous NiO based photocathode. J. Electoanal. Chem. 2015, 759, 27–31. [Google Scholar] [CrossRef]
  27. Huang, J.F.; Zhu, Y.H.; Zhong, H.; Yang, X.; Li, C.Z. Dispersed CuO nanoparticles on a silicon nanowire for improved performance of nanoenzymatic H2O2 detection. ACS Appl. Mater. Inter. 2014, 6, 7055–7062. [Google Scholar] [CrossRef] [PubMed]
  28. Zhu, Y.; Yan, K.; Xu, Z.; Zhang, J. Hemin Modified TiO2 Nanoparticles with Enhanced Photoelectrocatalytic Activity for Electrochemical and Photoelectrochemical Sensing. J. Electrochem. Soc. 2016, 163, B526–B532. [Google Scholar] [CrossRef]
  29. Huan, Y.F.; Fei, Q.; Shan, H.Y.; Wang, B.J.; Xu, H.; Feng, G.D. A novel water-soluble sulfonated porphyrin fluorescence sensor for sensitive assays of H2O2 and glucose. Analyst 2015, 140, 1655–1661. [Google Scholar] [CrossRef] [PubMed]
  30. Wu, H.; Wei, T.; Li, X.; Yang, J.; Zhang, J.; Fan, S.; Zhang, H. Synergistic-Effect-Controlled Tetraoctylammonium Bromide/Multi-Walled Carbon Nanotube@Hemin Hybrid Material for Construction of Electrochemical Sensor. J. Electrochem. Soc. 2017, 164, B147–B151. [Google Scholar] [CrossRef]
  31. Cao, Y.; Si, W.; Hao, Q.; Li, Z.; Lei, W.; Xia, X.; Li, J.; Wang, F.; Liu, Y. One–pot fabrication of Hemin-N-C composite with enhanced electrocatalysis and application of H2O2 sensing. Electrochim. Acta 2018, 261, 206–213. [Google Scholar] [CrossRef]
  32. Panagiotopoulos, A.; Gkouma, A.; Vassi, A.; Johnson, C.J.; Cass, A.E.G.; Topoglidis, E. Hemin modified SnO2 films on ITO-PET with enhanced activity for electrochemical sensing. Electroanalysis 2018. in Press. [Google Scholar] [CrossRef]
  33. Wang, Y.; Hosono, T.; Hasebe, Y. Hemin-adsorbed carbon felt for sensitive and rapid flow-amperometric detection of dissolved oxygen. Microchim. Acta 2013, 180, 1295–1302. [Google Scholar] [CrossRef]
  34. Santos, R.M.; Rodrigues, M.S.; Laranjinha, J.; Barbosa, R.M. Biomimetic sensor based on hemin/carbon nanotubes/chitosan modified microelectrode for nitric oxide measurement in the brain. Biosens. Bioelectron. 2013, 44, 152–159. [Google Scholar] [CrossRef] [PubMed] [Green Version]
  35. Pavithra, L.; Devasena, T.; Pandian, K.; Gopinath, S.C.B. Amperometric determination of nitrite using natural fibers as template for titanium dioxide nanotubes with immobilized hemin as electron transfer mediator. Microchim. Acta 2018, 185, 194. [Google Scholar]
  36. Garcia de la Rosa, A.; Castro-Quezada, E.; Gutierrez-Granados, S.; Bedioui, F.; Alatorre-Ordaz, A. Stable hemin embedded in Nafion films for the catalytic reduction of trichloroacetic acid under hydrodynamic conditions. Electrochem. Commun. 2005, 7, 853–856. [Google Scholar]
  37. Obare, S.O.; Ito, T.; Balfour, M.H.; Meyer, G.J. Ferrous hemin oxidation by organic halides at nanocrystalline TiO2 interfaces. Nano Lett. 2003, 3, 1151–1153. [Google Scholar] [CrossRef]
  38. Zhang, T.; Wang, L.; Gao, C.; Zhao, C.; Wang, Y.; Wang, J. Hemin immobilized into metal-organic frameworks as electrochemical biosensor for 2,4,6-trichlorophenol. Nanotechnology 2018, 29, 074003. [Google Scholar] [CrossRef] [PubMed]
  39. Reys, J.R.M.; Lima, P.R.; Cioletti, A.G.; Ribeiro, A.S.; Abreu, F.C.D.; Goulart, M.O.F.; Kubota, L.T. An amperometric sensor based on hemin adsorbed on silica gel modified with titanium oxide for electrocatalytic reduction and quantification of artemisinin. Talanta 2008, 77, 909–914. [Google Scholar] [CrossRef]
  40. Guo, Y.; Li, J.; Dong, S.J. Hemin functionalized graphene nanosheets-based dual biosensor platforms for hydrogen peroxide and glucose. Sens. Actuators B 2011, 160, 295–300. [Google Scholar] [CrossRef]
  41. Tao, Y.; Ju, E.G.; Ren, J.S.; Qu, X.G. Polypyrrole nanoparticles as promising enzyme mimics for sensitive hydrogen peroxide detection. Chem. Commun. 2014, 50, 3030–3032. [Google Scholar] [CrossRef] [PubMed]
  42. Wang, J.J.; Han, D.X.; Wang, X.H.; Qi, B.; Zhao, M.S. Polyoxometalates as peroxidase mimetics and their applications in H2O2 and glucose detection. Biosens. Bioelectron. 2012, 36, 18–21. [Google Scholar] [CrossRef] [PubMed]
  43. Sagasti, A.; Bouropoulos, N.; Kouzoudis, D.; Panagiotopoulos, A.; Topoglidis, E.; Gutierrez, J. Nanostructured ZnO in a Metglas/ZnO/Hemoglobin modified electrode to detect the oxidation of Hemoglobin simultaneously by cyclic voltammetry and magnetoelastic resonance. Materials 2017, 10, 849. [Google Scholar] [CrossRef] [PubMed]
  44. Topoglidis, E.; Cass, A.E.G.; O’Regan, B.; Durrant, J.R. Immobilization and bioelectrochemistry of proteins on nanoporous TiO2 and ZnO films. J. Electroanal. Chem. 2001, 517, 20–27. [Google Scholar] [CrossRef]
  45. Willit, J.L.; Bowden, E.F. Adsorption and redox thermodynamics of strongly adsorbed cytochrome c on tin oxide electrodes. J. Phys. Chem. 1990, 94, 8241–8246. [Google Scholar] [CrossRef]
  46. Zhang, K.; Zhang, L.; Chai, Y. Mass load distribution dependence of mass sensitivity of magnetoelastic sensors under different resonance modes. Sensors 2015, 15, 20267–20278. [Google Scholar] [CrossRef] [PubMed]
  47. Li, S.; Cheng, Z.Y. Nonuniform mass detection using magnetostrictive biosensors operating under multiple harmonic resonance modes. J. Appl. Phys. 2010, 107, 114514. [Google Scholar] [CrossRef]
  48. Hernando, A.; Vazquez, M.; Barandiaran, J. Metallic glasses and sensing applications. J. Phys. E Sci. Instrum. 1988, 21, 1129. [Google Scholar] [CrossRef]
  49. Modzelewski, C.; Savage, H.; Kabacoff, L.; Clark, A. Magnetomechanical coupling and permeability in transversely annealed Metglas 2605 alloys. IEEE Trans. Magn. 1981, 17, 2837–2839. [Google Scholar] [CrossRef]
  50. Topoglidis, E.; Astuti, Y.; Duriaux, F.; Gratzel, M.; Durrant, J.R. Direct Electrochemistry and Nitric Oxide Interaction of Heme Proteins Adsorbed on Nanocrystalline Tin Oxide Electrodes. Langmuir 2003, 19, 6894–6900. [Google Scholar] [CrossRef]
  51. Joint Committee on Powder Diffraction Standards (JCPDS) Card No. 41-1445 for SnO2; International Center for Diffraction Data: Newtown Township, PA, USA.
  52. Sivashankaran, N.S.L.; Vijayam, S.N.A.; PuthenKadathil, V.T.; Kunjkunju, J. Magnetic properties of Mn-doped SnO2 thin films prepared by the Sol–Gel dip coating method for dilute magnetic semiconductors. J. Am. Ceram. Soc. 2014, 97, 3184–3191. [Google Scholar] [CrossRef]
  53. Shikha, B.; Pandya, D.K.; Kashyap, S.C. Photoluminescence and Defects in Ultrathin SnO2 Films. AIP Conf. Proc. 2013, 1512, 1042–1043. [Google Scholar] [CrossRef]
  54. Seema, H.; Kemp, K.C.; Chandra, V.; Kin, K.S. Graphene–SnO2 composites for highly efficient photocatalytic degradation of methylene blue under sunlight. Nanotechnology 2012, 23, 355705. [Google Scholar] [CrossRef] [PubMed]
  55. Jahn, M.R.; Shukoor, I.; Tremel, W.; Wolfrum, U.; Kolb, U.; Naworth, T.; Langguth, P. Hemin-coupled iron (III)-hydroxide nanoparticles show increased uptake in Caco-2 cells. J. Pharm. Pharmacol. 2011, 63, 1522–1530. [Google Scholar] [CrossRef] [PubMed]
  56. Altube, A.; Pierna, A.R. Thermal and electrochemical properties of cobalt containing Finemet type alloys. Electrochem. Acta 2004, 49, 303–311. [Google Scholar] [CrossRef]
  57. Laviron, E.J. General expression of the linear potential sweep voltammogram in the case of diffusionless electrochemical systems. Electroanal. Chem. 1979, 101, 19–28. [Google Scholar] [CrossRef]
  58. Song, H.; Ni, Y.; Kokot, S. A novel electrochemical biosensor based on the hemin-graphene nano-sheets and gold nano-particles hybrid film for the analysis of hydrogen peroxide. Anal. Chim. Acta 2013, 788, 24–31. [Google Scholar] [CrossRef] [PubMed]
  59. Deac, A.R.; Morar, C.; Turdean, G.L.; Darabentu, M.; Gal, E.; Bende, A.; Muresan, L.M. Glassy carbon electrode modified with hemin and new melamine compounds for H2O2 amperometric detection. J. Solid State Electrochem. 2016, 20, 3071–3081. [Google Scholar] [CrossRef]
Figure 1. Experimental setup: (a) Front view; (b) side view.
Coatings 08 00284 g001
Figure 2. (a) The WE of the setup; (b) WE before and (c) after its immersion into the solution.
Coatings 08 00284 g002
Figure 3. Resonance peaks at different holding positions of the Metglas film: (a) Middle; (b) 1 mm from the middle; (c) 2 mm from the middle; (d) 3 mm from the middle.
Coatings 08 00284 g003
Figure 4. Resonance peaks before and after the immersion of the sensor into the solution for two different samples: (a) Bare Metglas ribbon before the immersion; (b) Bare Metglas ribbon after the immersion; (c) Hemin/SnO2-Metglas sensor before the immersion; (d) Hemin/SnO2-Metglas sensor after the immersion.
Coatings 08 00284 g004
Figure 5. XRD patterns: (a) JCPDS card#41-1445 SnO2 cassiterite; (b) Metglas; (c) SnO2/Metglas.
Coatings 08 00284 g005
Figure 6. FE-SEM images: (a,b) Top view; (c) cross section of a SnO2-Metglas film electrode; (d) EDS elemental microanalysis of a SnO2-Metglas film electrode. Scales are indicated on the photographs.
Coatings 08 00284 g006aCoatings 08 00284 g006b
Figure 7. PL spectrum recorded using an excitation wavelength at 300 nm over the SnO2 film deposited on the Metglas 2826MB strip.
Coatings 08 00284 g007
Figure 8. FTIR spectra of SnO2 (black) and Hemin-SnO2 (red).
Coatings 08 00284 g008
Figure 9. CVs of (a) Metglas, (b) SnO2-Metglas, (c) Hemin/SnO2-Metglas in argon-saturated 10 mM NaH2PO4 (pH = 7) at scan rate: 0.1 V s−1.
Coatings 08 00284 g009
Figure 10. (a) CVs of Hemin/SnO2-Metglas films in 10 mM NaH2PO4 buffer (pH = 7) at different scan rates, and (b) plot of redox peak currents vs. the scan rates.
Coatings 08 00284 g010aCoatings 08 00284 g010b
Figure 11. (a) CVs of Hemin/SnO2-Metglas in the absence and presence of increasing concentrations (8–72 μM) of H2O2 in 10 mM NaH2PO4 (pH = 7), scan rate: 0.1 V s−1, and (b) plot of the cathodic peak current vs. H2O2 concentration obtained from the CV data shown in (a).
Coatings 08 00284 g011
Figure 12. Comparison of the control cathodic peak currents (squares) obtained from the CVs of a Hemin/SnO2-Metglas electrode in 10 mM NaH2PO4 solution and the corresponding sensing current (triangles) when H2O2 is added in the solution.
Coatings 08 00284 g012
Figure 13. (a) The typical amperometric responses of a Hemin/SnO2-Metglas film on successive additions of different amounts of H2O2 into stirring NaH2PO4 (10 mM, pH = 7) saturated with Argon at the applied potential of −0.4 V. (b) The calibration curve of the current vs. the H2O2 concentration.
Coatings 08 00284 g013
Figure 14. Magnetic resonance measurements of (a) Bare Metglas ribbon with H2O2, (b) SnO2-Metglas sensor with H2O2, (c) Hemin/SnO2-Metglas sensor with H2O2, (d) Hemin/SnO2-Metglas sensor without H2O2.
Coatings 08 00284 g014
Table 1. Characteristics and properties of metal oxide films used as electrodes.
ElectrodePreparationParticle Size (nm)Thickness (μm)Insulating RegionRef.
Hemin/SnO2-ITO/PETLow temperature Hydrothermal method20–704At +0.2 V and more positive biases[32]
Hemin-ZnO-MetglasHydrothermal method/sintering11–321none[43]
Hemin/TiO2-FTO 1Hydrolysis/sol-gel/sintering10–152At −0.3 V and more positive biases[37]
Hemin/TiO2-GCE 2 electrodeFlame synthesis technique10–5010none[28]
Cyt-c 3/SnO2/FTO
Hb 4/SnO2/FTO
Sol-gel/sintering15–204At +0.2 V and more positive biases[50]
Cyt-c/TiO2/FTO
Cyt-c/ZnO/FTO
Sol-gel/sintering10–204At −0.15 V and more positive biases[44]
Hemin/SnO2-MetglasLow temperature Hydrothermal method20–7011noneThis work
1 Fluorine doped tin oxide; 2 Glassy carbon electrode; 3 Cytochrome c; 4 Hemoglobin.
Table 2. Comparison of the analytical performance with different electrode materials for the electrocatalytic determination of H2O2.
ElectrodeMethodLinear Range (M)LOD (M)Ref.
Hemin/SnO2-ITO/PETCV1.5 × 10−6–90 × 10−61.5 × 10−6[32]
Hb/ZnO-MetglasCV & MR25 × 10−6–350 × 10−625 × 10−6–50 × 10−6[43]
Hemin-graphene nano-sheets (H-GNs)/gold nano-particles (AuNPs)CV & Amperometry0.3 × 10−6–1.8 × 10−30.11 × 10−6[58]
Hemin-TiO2 modified electrodeCV & Amperometry3.0 × 107–4.7 × 1047.2 × 108[28]
Hemin-GCECV0–170 × 10−631.6 × 10⁻⁶[59]
ITO/NiO/HeminCV0.5 × 10−6–500 × 10−610−7[26]
Hemin/SnO2-MetglasCV & MR2 × 10−6–90 × 10−61.6 × 10−7This work

