Abstract
Cellulose nanocrystals (CNC) and starch nanoparticles (SNP) have remarkable physical and mechanical characteristics. These properties particularly facilitate their application as high-performance components of bio-based packaging films as alternatives to fossil-based counterparts. This study demonstrates a time-efficient and resource-saving extraction process of CNC and SNP by sulfuric acid hydrolysis and neutralization. The yields of the hydrolyzed products were 41.4% (CNC) and 32.2% (SNP) after hydrolysis times of 3 h and 120 h, respectively. The nanoparticle dispersions were wet-coated onto poly(lactic acid) (PLA) and paper substrates and were incorporated into starch films. No purification or functionalization of the nanoparticles was performed prior to their application. Techno-functional properties such as the permeability of oxygen and water vapor were determined. The oxygen permeability of 5–9 cm3 (STP) 100 µm m−2 d−1 bar−1 at 50% relative humidity and 23 °C on PLA makes the coatings suitable as oxygen barriers. The method used for the extraction of CNC and SNP contributes to the economic production of these nanomaterials. Further improvements, e.g., lower ion concentration and narrower particle size distribution, to achieve reproducible techno-functional properties are tangible.
1. Introduction
Films and coatings made of cellulose nanocrystals (CNC) and starch nanoparticles (SNP) have considerable potential for application in sustainable and bio-based packaging materials [1,2,3,4,5,6,7,8,9,10]. Their techno-functional properties can supplement the limited gas barrier properties and the mechanical properties of renewable biopolymers such as poly(lactic acid) (PLA), paper and starch [11,12,13,14,15]. PLA is synthesized from fermented carbohydrates [16,17]. It is used in the packaging industry due to its thermal properties manifesting in good processing characteristics, its chemical and UV resistance, and its biodegradability [18,19,20]. However, the oxygen and water vapor permeability of PLA necessitates barrier enhancement for oxygen and water vapor sensitive packaging goods [21,22,23]. Pant et al. [24] reported an oxygen permeability of PLA of 153 (STP) 100 µm m−2 d−1 at 23 °C and 50% relative humidity and a water vapor transmission rate of 58 g (STP) 100 µm m−2 d−1 at 23 °C at a gradient in relative humidity of 85→0%. Similarly, the application of fiber-based packaging materials, such as paper, is restricted due to high sensitivity to moisture accompanied by poor barrier properties [25,26]. Starch can be converted into a continuous polymeric phase and is therefore processable using extrusion technology developed to produce fossil-based polymer packaging. The use of starch is nevertheless just as well limited due to its hydrophilic nature leading to moisture sensitivity that is compromising the dimensional stability and mechanical properties [27]. The techno-functional properties of these three materials can be enhanced by the introduction of CNC and SNP in the form of coatings or fillers in nanocomposites. Both CNC and SNP facilitate tailored physical and mechanical properties enabling the manufacturing of bio-based packaging materials to substitute or complement conventional, fossil-based polymers. Due to their presumably low environmental, health, and safety risks, packaging applications for fast moving consumer goods are conceivable [28].
However, the large-scale production of CNC and SNP is presently unattractive. Sulfuric acid hydrolysis is the commonly used method to extract CNC and SNP from suitable biopolymeric feed stocks [29,30]. Separating the hydrolyzed product from the acidic reaction solution is laborious and comprises a high consumption of resources and high material costs; usually applied strategies involve dilution with a large amount of water and quenching, sedimentation, and eventually centrifugation in combination with ultrafiltration or dialysis for purification [30]. In contrast, Müller et al. [31] suggested an efficient approach based on the neutralization of the acid. Flocculation of the nanoparticles is induced in the presence of cations at high ionic strengths. The salt concentration is subsequently reduced by centrifugation until the ion concentration level for peptization is reached. Hereby, a high yield of hydrolyzed product is achievable at an overall low net process time and low consumption of resources and materials.
Manufacturing limitations due to the nanoparticles’ intrinsic physical properties further impede their application in coatings on substrates and as a filler in nanocomposites. These difficulties arise from the limited interfacial adhesion of the hydrophilic nanoparticles and the hydrophobic polymers, moisture absorption, and agglomeration issues. Several studies addressed the application of CNC and SNP in biopolymeric packaging materials [2,6,7,8,9,10,27,30,32,33,34,35]. Techno-functional properties such as gas permeability, mechanical properties, and thermal stability were adjusted by modifying the nanoparticles’ surface chemistry. If further functionalization of the nanoparticles is desired, the use of non-green chemicals and additional time is required [36].
The aim of the present study was (i) to demonstrate a time-efficient and resource-saving post-processing method to produce CNC and SNP. The qualification of the nanomaterials as (ii) barrier coatings on flat substrates and (iii) as filler in nanocomposites was evaluated. The study tested several hypotheses (h). We tested whether (h1) stable dispersions of CNC and SNP are producible by the presented method and (h2) the nanoparticles lower the gas permeability of PLA and paper substrates and (h3) improve the water vapor permeability and the mechanical properties of solution-cast starch films. Good spreadability of the nanoparticles on the substrate materials and their miscibility in hydrophilic starch films are the necessary preconditions to achieve improved techno-functional properties.
2. Materials and Methods
2.1. Materials
2.1.1. Materials for Nanoparticle Processing
Cotton linters (water content 4 wt %) were purchased from Buch-Kunst-Papier (St. Ingbert Rentrisch, Germany). Corn starch (water content 15 wt %), sodium azide (99%), and sodium hydroxide (99%) were purchased from Carl Roth (Karlsruhe, Germany). Sulfuric acid (95%) was obtained from VWR (Ismaning, Germany). All chemicals were used as received. Ultrapure (type 1) water with a resistivity of 18.2 MΩ cm (Milli-Q Direct 8 system, Merck Chemicals, Schwalbach, Germany) was used for all experiments.
2.1.2. Substrate Materials
Poly(lactic acid) films (2002D, NatureWorks LLC, Minnetonka, MN, USA) with a thickness of 25 µm were provided by Fraunhofer IVV (Freising, Germany). Material properties of 2002D were determined by other groups: Murphy et al. [37] report a melting temperature Tm of 154 °C and a glass transition temperature Tg of 55 °C as well as a D-lactide content of 4% and a molecular weight MW of 194,000 g mol−1. Ge et al. [38] report values of Tm of 168.2 °C, Tg of 58.6 °C, a D-lactide content of 4%, a L-lactide content of 96% and a MW of 121,400 g mol−1. Mihai et al. [39] report semi-crystallinity of 2002D.
Paper sheets (Metalkote Evolution, Ahlstrom-Munksjö Group, Stockholm, Sweden) with a grammage of 65 g m−2 were also provided by Fraunhofer IVV (Freising, Germany). Untreated (bare) substrates were tested as reference materials.
2.1.3. Cast Films
Corn starch (water content 15 wt %) and glycerol (water content 14 wt %) were purchased from Carl Roth (Karlsruhe, Germany). Pure starch-glycerol films without nanofillers were tested as reference material.
2.1.4. Karl Fischer Titration
Formamide (99.5 wt %), iodine solution (Roti®hydroquant C5; 5 mg H2O mL−1, free of pyridine), methanol (Roti®hydroquant D; dry), and a water standard (Roti®hydroquant; 10 mg H2O g−1) were purchased from Carl Roth (Karlsruhe, Germany).
2.1.5. Pinhole Testing
Pinholes were determined with peanut oil containing Sudan Red III (Merck, Darmstadt, Germany) in a concentration of 1 part per thousand.
2.2. Nanoparticle Preparation
CNC were prepared by sulfuric acid hydrolysis and subsequent basic neutralization. The procedure was derived from the method described by Müller et al. [31]. 2 mol of sulfuric acid (64 wt %) was added to cut cotton linters in a mass ratio of 15:1 and transferred to a heated water bath at 50 °C. The raw cellulose was hydrolyzed for 3 h under vigorous stirring. Following hydrolysis, the reaction solution was diluted to 54 wt % H2SO4 to decrease the viscosity and then decanted to 3 mol of sodium hydroxide (7 mol kg−1) in a cooled water bath. After homogenization for 15 min, the CNC were separated from the reaction solution by consecutive centrifugation steps until a pH of ~2 was reached. Excess ions were removed from the hydrolyzed product by decantation of the supernatant after each washing step and successive redispersion with H2O. Eventually, the dispersion was ultrasonicated (8 kJ g−1 CNC) with a homogenizer (Sonoplus HD 3400 with the sonotrode VS 70 T, Bandelin, Berlin, Germany) and stored at 6 °C until further use.
The hydrolysis conditions to produce SNP was derived from the method demonstrated by Angellier et al. [40]. 1 mol of sulfuric acid (18 wt %) was added to corn starch in a mass ratio of 7:1 and then hydrolyzed for 120 h at 40 °C. Subsequently, the reaction mixture was decanted to 1.5 mol of sodium hydroxide (5 mol kg−1) for neutralization. Similar to the extraction of CNC, SNP were separated from the salt solution by consecutive precipitation and redispersion until the pH stabilized at ~2.7. After ultrasonication, 0.01 g sodium azide L−1 was added as an antimicrobial agent before storing the product at 6 °C.
2.3. Coating of PLA and Paper
The coating strategy of the nanoparticle dispersions onto polymer substrates was empirically developed for CNC dispersions. Qualitative parameters were considered regarding the application of a nanoparticle dispersion onto a flat substrate and the subsequent drying process. PLA was corona-treated (Corona Station, Softal, Hamburg, Germany) at 400 W and 5 m min−1 to increase the surface energy with the aim to achieve good spreadability of the aqueous coatings on the substrate surface [41]. For paper this pretreatment was not necessary. The effect of viscosity of the coating medium was investigated for CNC dispersions with concentrations of 3 ≤ c ≤ 8 wt %. It was found that with increasing concentration and hence increasing viscosity, contraction of the wet film could be fully avoided. The dynamic viscosity of a dispersion with 6 wt % of CNC was >2000 Pa s at a shear rate of 0.01 s−1 and decreased exponentially to 0.05 Pa s at 1000 s−1.
The concentration of the nanoparticle dispersions was adjusted in a rotary evaporator (Rotavapor R-100, Büchi, Flawil, Switzerland) at 40 °C and 70 mbar to ~63 g kg−1 and ~73 g kg−1 of hydrolyzed product for cellulose and starch, respectively. The dispersions were applied onto the substrates with a semi-automatic coating unit (CUF5, Sumet Systems, Denklingen, Germany).
The interplay of blade velocities v of 5 ≤ v ≤ 60 mm s−1 and wet film thicknesses d of 10 ≤ d ≤ 100 µm was tested. At v = 10 mm s−1 and d ≈ 51 µm under a normal load of 40 N, the coatings showed no macroscopic cracks or delamination on both PLA and paper. The same parameters led to conformable coatings using SNP dispersions on both substrates.
Drying was tested for temperatures of 40 ≤ T ≤ 60 °C for PLA and 40 ≤ T ≤ 120 °C for paper. The drying time was 1 ≤ t ≤ 10 min. Drying at high temperatures and within narrow time spans led to contraction of the coating medium and eventually delamination of the coating layer on PLA. Furthermore, high temperature for extended time spans bears the risk of denaturation of plastic substrates and desulfation of the nanoparticles [42]. Eventually, a temperature of 40 °C for 10 min was chosen for PLA. Paper was dried at 70 °C for 3 min to avoid wrinkling [43]. To avoid possible pinholes in the coating layer on the paper substrate due to its surface roughness it was coated and dried two times with the same parameters.
2.4. Cast Film Preparation
The starch-glycerol and nanocomposite films were prepared by solution casting according to the method of Alves et al. [33]. Precursor solutions of the nanocomposite films with the total mass mtotal had a water content caq of 97 wt %. Five different nanoparticle concentrations 0 ≤ cNP ≤ 9 wt % were added as well as glycerol as plasticizer with a concentration cgly of 30 wt %, both relative to the weighed portion of starch mstarch. The weighed portions of chemicals were calculated according to Equation (1), considering the mass of water added , corrected for the water content of the other components.
Starch was added to preheated water with a temperature of 70 °C in a water bath and stirred for 1 h to allow plastification. Glycerol and nanoparticles were then added and stirring was continued for 20 min to allow plasticization and mixing of the composite. A dry film thickness of 50 µm was targeted. Before casting in polystyrene Petri dishes (Greiner Bio-One, distributed by VWR, Ismaning, Germany), the filmogenic solutions were homogenized in an ultrasonic bath for 3 min. Excess water was evaporated from the dishes overnight in a climatic chamber (ICH 110, Memmert, Schwabach, Germany) at 40 °C and a relative humidity (r.h.) of 47%. The films were then peeled off from the Petri dish and turned upside down for double-sided drying overnight.
2.5. Instrument Measurements
If applicable, all measurements were performed at least in triplicate and are presented with the 95% confidence interval of the mean. The uncertainty of quantities depending on multiple variables is given by the propagation of error. For the determination of the oxygen permeability, the mean value of two measurements is given with the minimum and the maximum value.
2.5.1. Particle Size and Viscosity
The hydrodynamic apparent particle size of the nanoparticle dispersions was measured by dynamic light scattering (DLS) using a Zetasizer Nano ZSP (Malvern Instruments, Worcestershire, UK). Aliquots were filtered with syringe filters with a hydrophilic PES membrane and a pore size of 1 µm (Chromafil PES, Macherey-Nagel, Düren, Germany). The harmonic intensity averaged particle diameter (z-average) and the polydispersity index (PdI) from the cumulants analysis were obtained for 0.025 wt % nanoparticle dispersions after equilibration for 30 min at 25 °C.
The volume-weighed particle size of residual microparticles was measured using a HELOS/KR laser diffraction particle size analyzer with a QUIXEL wet dispersion system (Sympatec, Clausthal-Zellerfeld, Germany) at 23 °C and an optical concentration of 10%. The balanced mean size x1,3 and the span were evaluated according to Equations (2) and (3) as
Here, xmin and xmax are the smallest and the largest particle size, x is the class midpoint and q3(x) is the volume-weighted particle size distribution. x10, x50 and x90 are the particle sizes corresponding to 10%, 50% and 90% of the cumulative undersize distribution, respectively.
The viscosity of the concentrated CNC dispersion was determined using a Physica MCR 501 rheometer (Anton Paar, Graz, Austria) at 25 °C with a cone-plate geometry. Shear flow curves were measured in the range from 0.01 to 1000 s−1.
2.5.2. Dry Mass, Ion Chromatography and Yield
The mass of nanoparticles mnp in the product was determined gravimetrically in combination with ion chromatography and calculated according to Equation (4):
About 2 g of wet product mwet were freeze-dried (2–4 LSCplus, Christ, Osterode am Harz, Germany) and the dried product was weighed again to obtain mdry. Ion chromatography (820 IC Separation Center, Metrohm, Herisau, Switzerland) was performed on aliquots with a mass mIC of about 0.1 g, diluted in H2O with a volume VIC of 50 mL. The mass concentration γIC,i of cations (Metrosep C 4—150/4.0 column) and anions (Metrosep A Supp 4—250/4.0 column) was obtained. The yield Y is the quotient of the initially provided mass of the feed stock mraw and mnp.
2.5.3. Optical Properties of Dispersions, Coatings, and Cast Films
Optical microscopy was performed on a polarized light microscope (BX51-P, Olympus, Hamburg, Germany) equipped with a camera (XC50, Olympus, Hamburg, Germany) for the qualitative analysis of the coatings and the cast films.
Scanning electron microscopy (SEM) was carried out on a JEOL JSM-IT100 (Akishima, Japan) with a secondary electron detector and an acceleration voltage of 3–5 kV. The nanoparticle dispersions were freeze-dried beforehand and mounted on conductive carbon tape.
The optical absorbance A of dispersions and transparent films was measured using a Specord 50 Plus Spectrophotometer (Analytik Jena, Jena, Germany). The absorbance at a wavelength λ is proportional to the extinction coefficient ε(λ), the concentration c and the optical path length d, according to the Beer-Lambert law (Equation (5)).
2.5.4. Physical Properties
Water Content
The water content of the raw materials was determined by volumetric Karl Fischer titration (TitroLine KF, Xylem Analytics, Weilheim, Germany). The iodine titrant was determined with the water standard. Methanol and formamide were used as solvent in a ratio of 1.5:1. About 0.3 g of the sample was added to the solvent. The titration was started when the sample was completely dissolved. The solvent was exchanged after each measurement. The water content of the raw materials was considered regarding the calculation of the mass ratios for the preparation of nanoparticles and cast films.
Surface Tension
The surface tension of untreated and corona-treated PLA was evaluated with test ink pens (Arcotest, Mönsheim, Germany). The pens are filled with an ink of defined surface tension. The ink is applied with the pens to the substrate surface. If the line of ink does not separate into drops after at least 2 s, the surface energy of the substrate is the same or higher than the surface tension of the fluid. Then, the pen with a higher surface tension is applied until a separation of the line of fluid into drops is observed.
Pinhole Testing
The grease resistance of the coated films was measured using an internal method from Fraunhofer IVV [44]. A test area of 25 cm2 of the film surface was covered with a fleece—for constant and sufficient covering—and saturated with a solution of colored peanut oil. No further weight was applied. After 24 h at 23 °C and 50% r.h., the fleece and oil residues were removed, and the stained area was characterized by digital image evaluation. At least four specimens were characterized. No pinholes are present, when no fatty spots on the back of the sample are detected.
Thickness
The film thickness was measured mechanically (Precision Thickness Gauge FT3, Rhopoint Instruments, East Sussex, UK) on 5 evenly distributed measuring points. The coating thickness dlaminate was calculated from the thickness of a coated film and the same substrate without a coating dsubstrate.
Oxygen and Water Vapor Permeability
Prior to the measurements, all samples were stored at 23 °C and 50% r.h. All tests were conducted at the Fraunhofer IVV, where these methods are accredited.
The reciprocal gas permeability of coated substrates Qlaminate is the sum of the reciprocals of the gas permeability of the substrate Qsubstrate and the coating Qcoating (Equation (6)). The oxygen permeability (OP) of the coating OPcoating is calculated from the oxygen transmission rate (OTR) of the coating OTRcoating and the respective coating thickness dcoating. The OTR was measured according to DIN 53380-3 [45] with an automatic high barrier oxygen transmission rate system (OX-TRAN 2/21, MOCON, Minneapolis, MN, USA). A humidity of 50% r.h. and a temperature of 23 °C was applied. With reference to the standard conditions (STP, 273 K; 1013 hPa), OPcoating is given in cm3 (STP) µm m−2 d−1 bar−1 according to Equation (7) [46]. The normalization to a thickness of 100 µm as OP Q100 in cm3 (STP) 100 µm m−2 d−1 bar−1 is reasonable.
The water vapor transmission rate WVTR of coated polymer substrates and cast films was measured gravimetrically using the cup method described in the DIN 53122-1 [47]. Films with an exposed area A of 50.3 cm2 for coated polymer films and 44.2 cm2 for cast films with a thickness d were used. The bottom of the cup was filled with anhydrous silica gel. The initial weight of the sealed measuring cells was determined, and they were transferred to a desiccator containing a saturated KOH solution to maintain a humidity of 85% r.h. at 23 °C. The samples were weighed 5 times within a timeframe t of 144 h until the weight gain Δm over a time increment Δt was constant. Transmission rates of the coated films are calculated according to Equation (8). The transmission rate of the pure coating is determined by Equation (6). Films of different thicknesses can be compared via the water vapor permeability WVP in g (STP) µm m−2 d−1 as calculated by Equation (9) and after further normalization to a thickness of 100 µm (g (STP) 100 µm m−2 d−1).
Mechanical Testing
Uniaxial tensile tests were carried out on a zwickiLine Z2.5 (Zwick, Ulm, Germany) testing machine as described in the DIN EN ISO 527-3 [48]. The samples were cut in dimensions of 100 mm × 20 mm. After a preload of 0.1 N, a constant extension rate of 25 mm min−1 was applied. The ultimate tensile strength σUTS and the elongation at break εf were read from the stress-strain curve σ vs. ε. Young’s modulus E was evaluated according to Hooke’s law from the linear-elastic relationship in the initial region of the stress-strain curve (Equation (10)):
2.6. Experiment Plan
All tests carried out for nanoparticle dispersions, coatings and cast films are summarized in Table 1.

Table 1.
Overview of all measurement methods applied on nanoparticle dispersions, coatings and cast films.
3. Results
3.1. Properties of Dispersions
3.1.1. Product Concentration and Ion Content
The yield was measured gravimetrically. The gross yield of nanoparticles was corrected for the ion mass, determined by ion chromatography. Sulfuric acid hydrolysis followed by basic neutralization and successive centrifugation led to a gross yield of 41.4 ± 0.8 wt % of CNC from cotton linters. A gross yield of 32.2 ± 0.7 wt % of SNP was achieved from corn starch.
Redundant H2O and excess ions were mostly removed during precipitation and redispersion. The relative nanoparticle concentrations in the hydrolyzed products were 53.6 ± 1.0 g kg−1 of product and 125.2 ± 2.6 g kg−1 of product for cellulose and starch, respectively. The concentration of Na+ of 4.3 ± 0.1 mmol g−1 of CNC and 1.0 ± 0.3 mmol g−1 of SNP, and the concentration of SO42− of 2.3 ± 0.1 mmol g−1 of CNC and 0.6 ± 0.0 mmol g−1 of SNP, respectively, indicate an excess of free sulfate ions in both hydrolyzed products. This finding is confirmed by the acidic pH of 2.07 and 2.71 after centrifugation for CNC and SNP, respectively. No other ions were detected, pointing at the purity of the raw materials. Thereby, more than 99.8% of the ionic residuals were removed during the washing step.
3.1.2. Particle Size
Both cellulose and starch feed stocks had a bimodal particle size distribution with a volume-weighted mean equivalent diameter of 50.1 ± 0.4 µm and 7.7 ± 0.0 µm, respectively, while the spans were 5.16 ± 0.1 µm and 1.1 ± 0.0 µm. After the sulfuric acid treatment, microscale hydrolyzed residues or agglomerates due to high salt concentrations with a diameter of 7.4 ± 0.1 µm and 4.3 ± 0.0 µm for cellulose and starch, respectively, were still present. The spans corresponding to the mean diameters were 2.7 ± 0.1 µm and 1.9 ± 0.0 µm, respectively.
The apparent mean size of the nanoparticles was 113.4 ± 0.6 nm for cellulose and 248.7 ± 15.7 nm for starch. Accordingly, the polydispersity indices were 0.225 ± 0.007 and 0.369 ± 0.015. Thus, both nanoscale and microscale particles coexist in the hydrolyzed product [49]. An overview of the dispersion properties and the nanoparticle sizes of CNC and SNP is given in Table 2.
Table 2.
Properties of nanoparticle dispersions as prepared from cotton linters and corn starch.
3.1.3. Microscopy
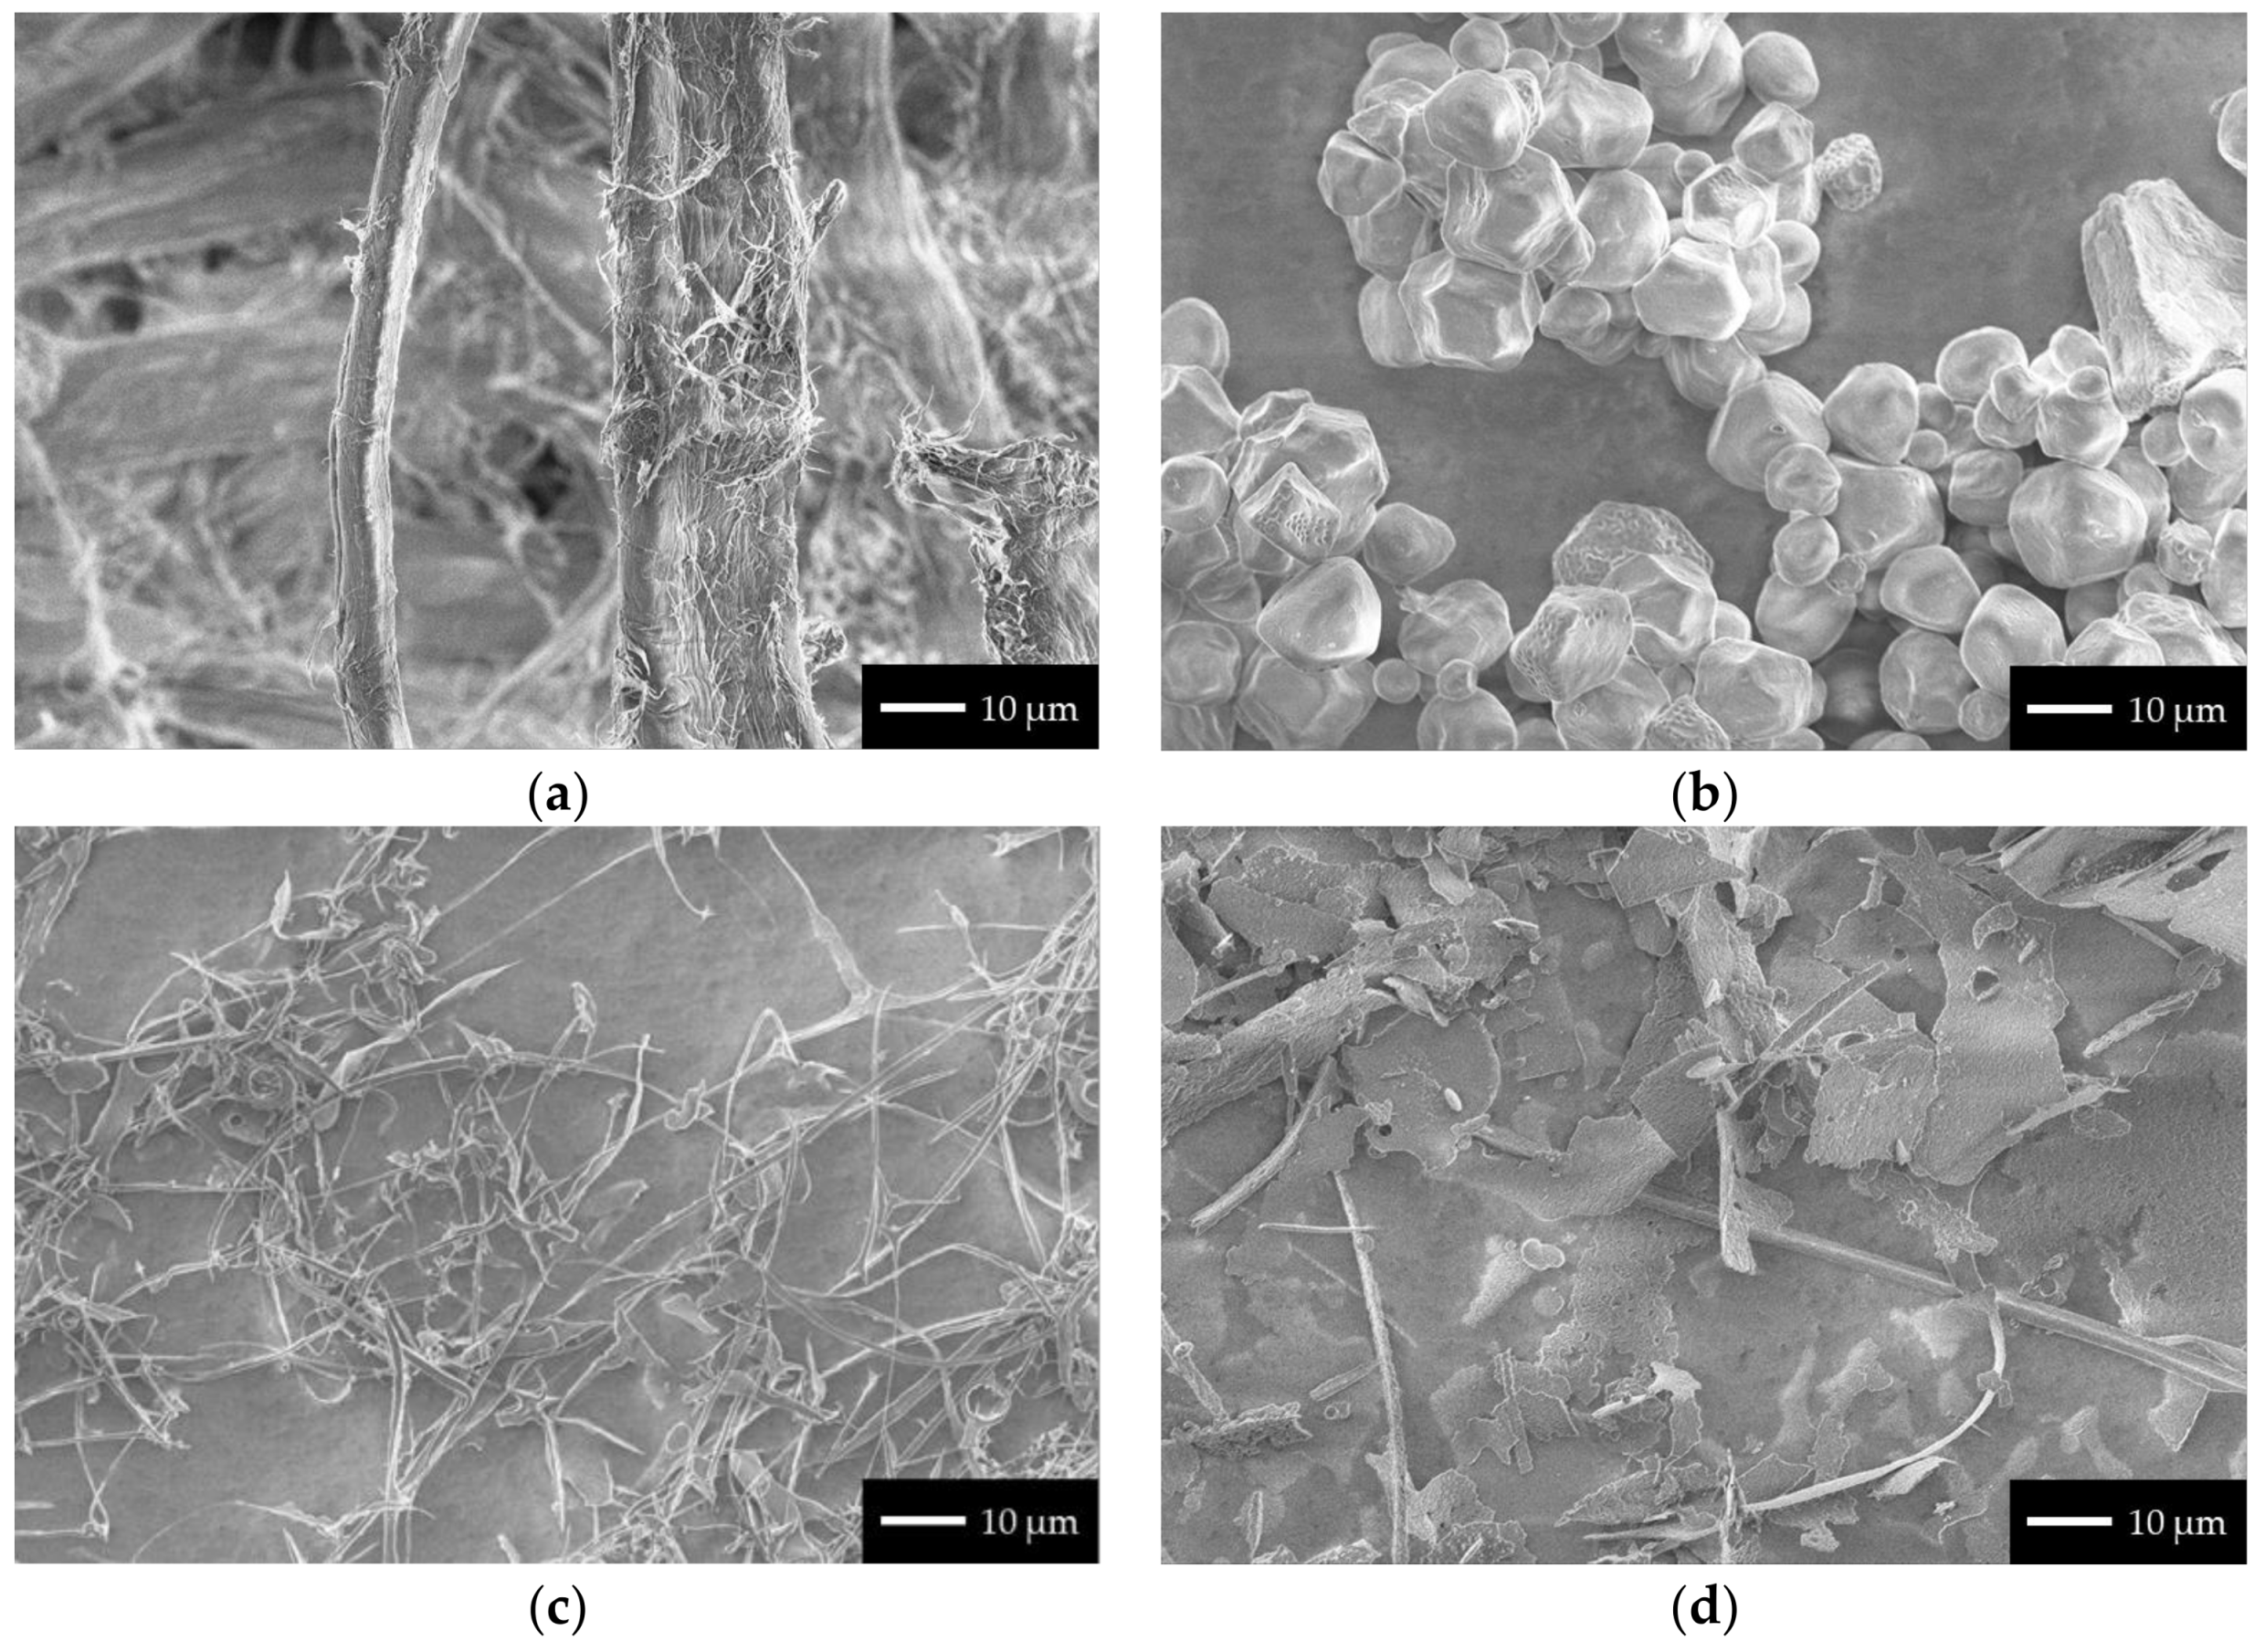
Macro- and microscopically, no phase separation was detected in the concentrated nanoparticle dispersions after 16 weeks at 23 °C. The morphology of the raw materials is shown in Figure 1a,b. Cotton linters have a fibrillar structure, whereas corn starch has a granular shape. Sulfuric acid primarily degrades amorphous regions of the polysaccharides. Upon freeze-drying, agglomeration of nanoparticles promoted by the presence of residual salt occurs (Figure 1c,d). Additionally, microscale hydrolyzed residues with a high aspect ratio can be found in both products.

Figure 1.
SEM images of (a) cotton linters, and (b) corn starch and the freeze-dried hydrolyzed products from (c) cotton linters, and (d) corn starch after hydrolysis and neutralization.
3.2. Properties of Nanoparticle Coatings
3.2.1. Surface Tension
Bare and untreated PLA had a surface tension of <34 mN m−1, which is slightly below reported values (36–38 mN m−1 [50]). Corona-treating the substrate elevated the surface tension to 42 mN m−1.
3.2.2. Dry Coating Thickness and Nanoparticle Loading
PLA and paper had thicknesses of 26.8 ± 0.1 µm and 62.5 ± 2.9 µm, respectively. Considering the concentration and the density of both the nanoparticles of 1.5 g cm−3 and Na2SO4 of 2.7 g cm−3, the thickness of a single coated layer for a wet film thickness of 51 µm was estimated to be 2.5 µm for CNC and 2.7 µm for SNP. The actual coating thicknesses on PLA were 2.6 ± 0.8 µm for CNC and 5.9 ± 0.9 µm for SNP. Paper substrates were double-coated with both CNC and SNP, resulting in thicknesses of 9.5 ± 0.4 µm and 12.0 ± 1.0 µm, respectively.
The nanoparticle loading was calculated from the ratio of the mass of nanoparticles in the product mnp and the dry mass mdry and was 75.6 ± 1.7 wt % in the CNC coating and 92.2 ± 2.6 wt % in the SNP coating.
3.2.3. Surface and Optical Properties
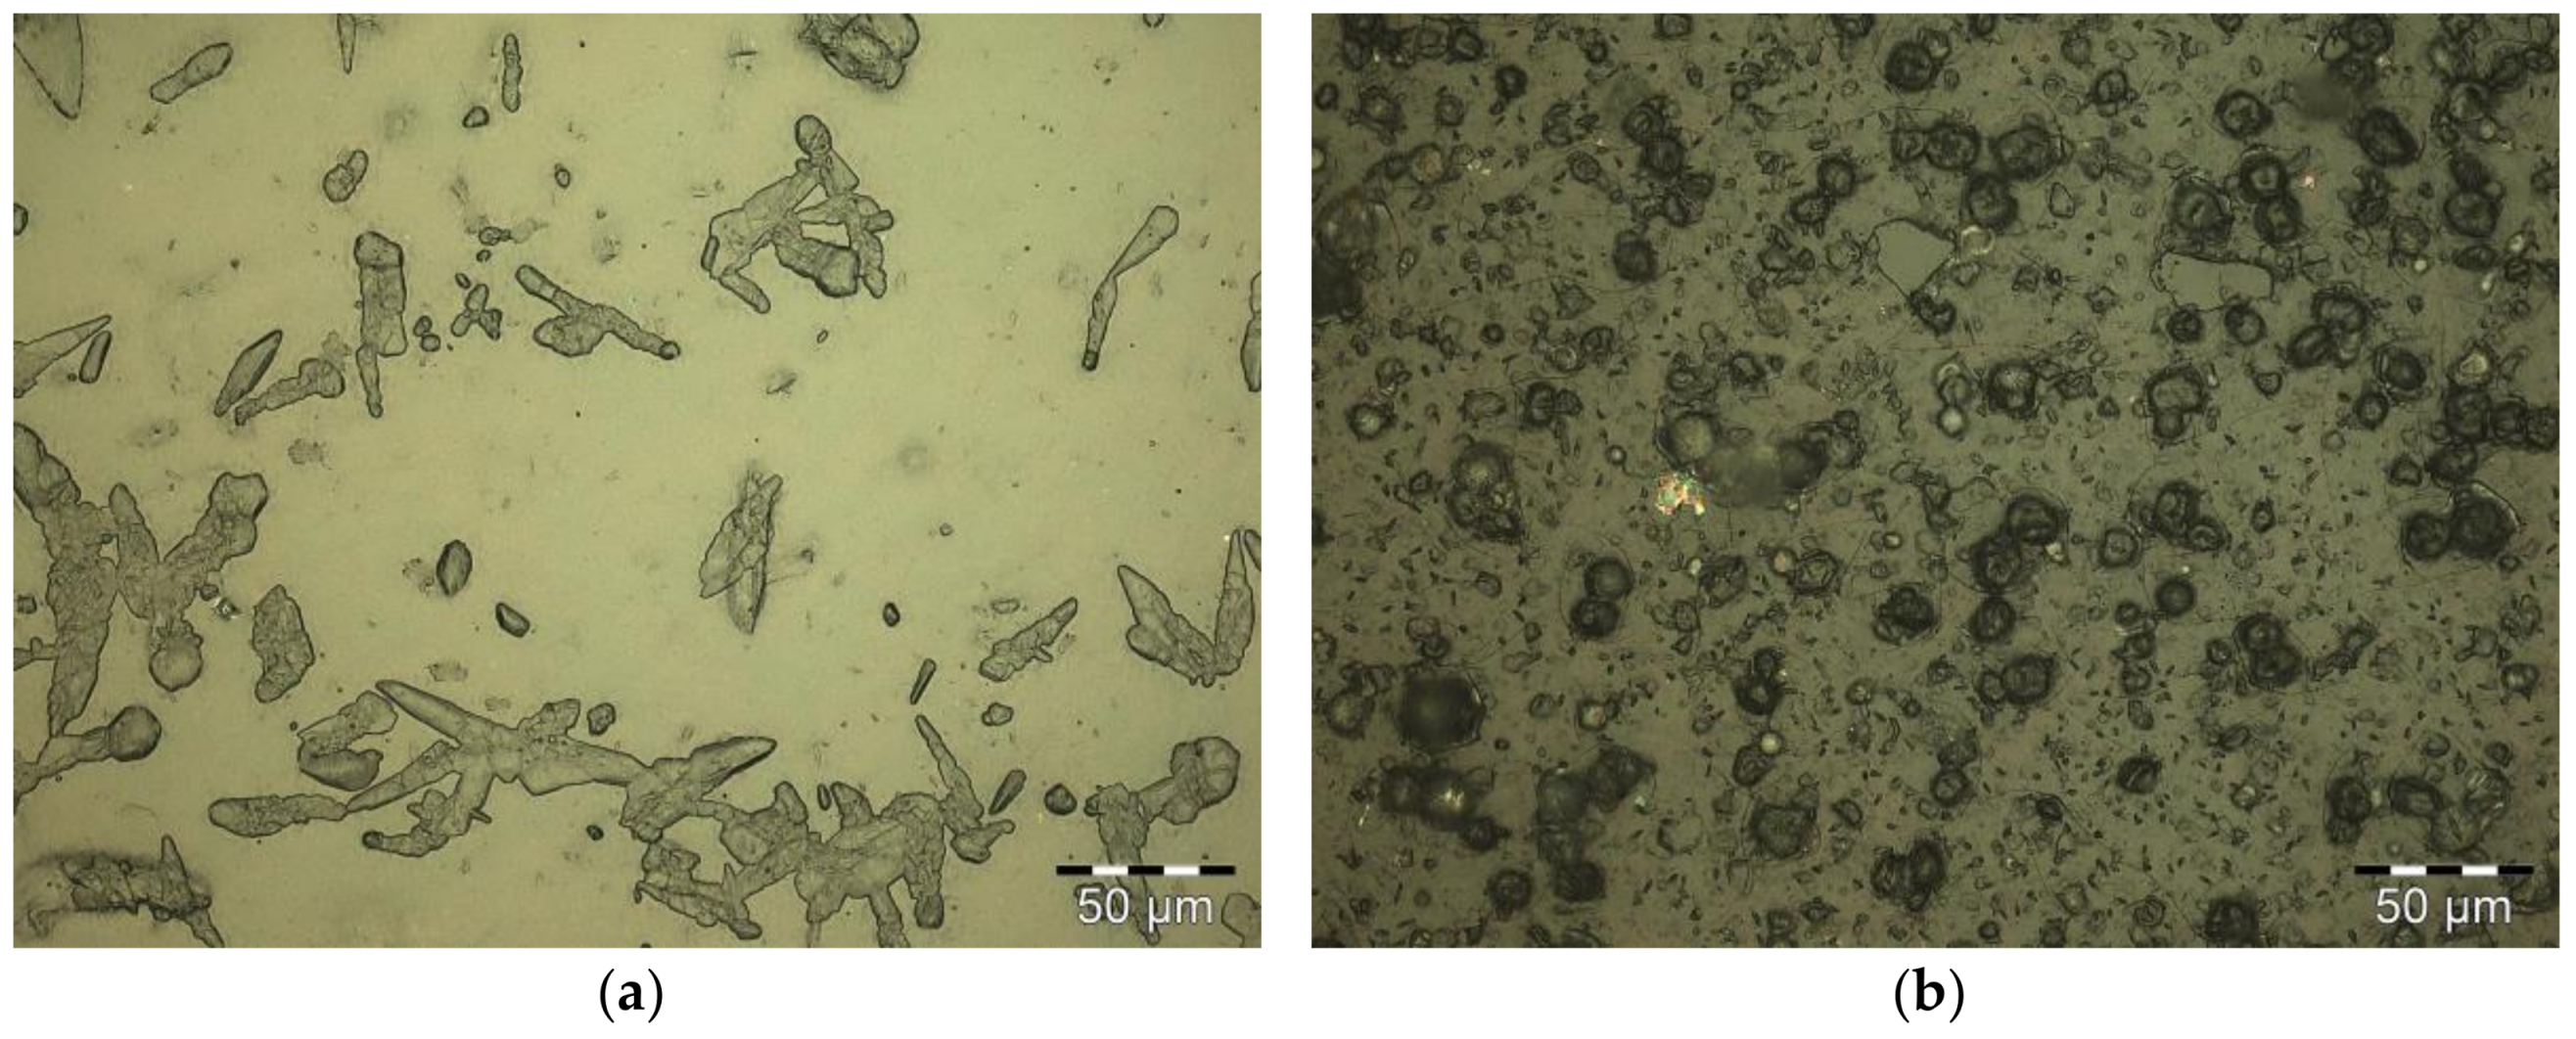
Coating PLA with CNC did not yield a uniform film (Figure 2a). Hydrolyzed residues and agglomerates were randomly distributed over the substrate surface. Hydrolyzed residues and agglomerates were found for SNP coatings as well, accompanied by fine fissures in the coating layer (Figure 2b).

Figure 2.
PLA coated with (a) CNC and (b) SNP in reflected bright-field microscopy.
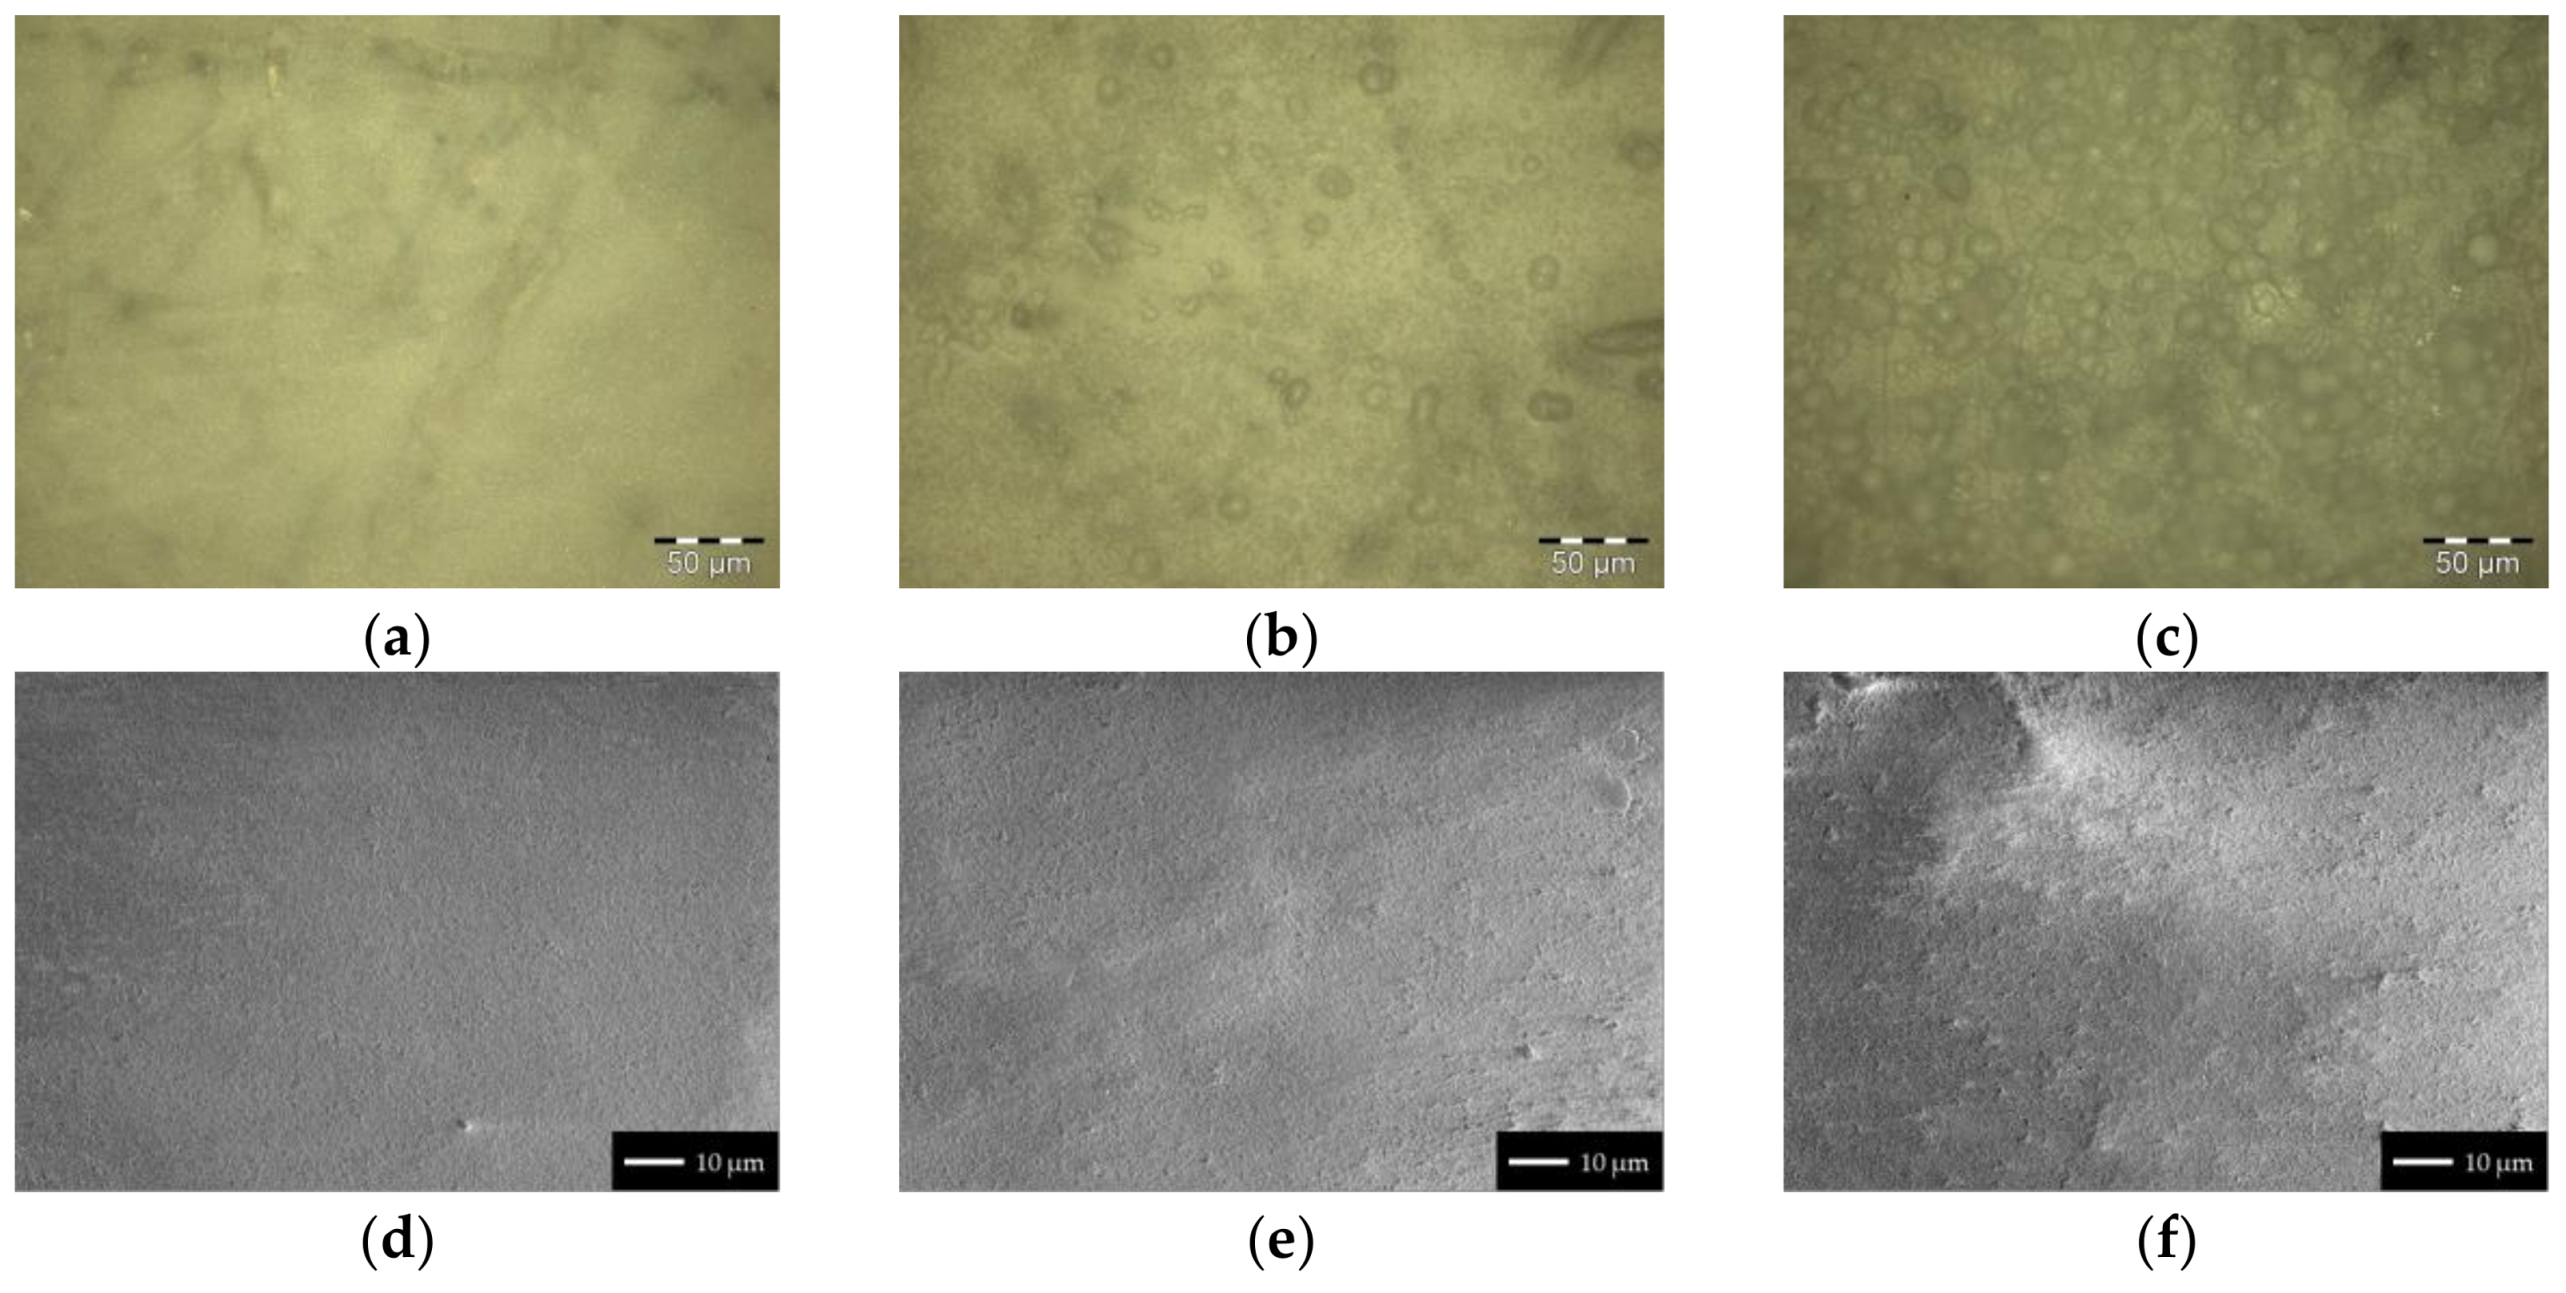
The top side of the paper substrate was microscopically uniform (Figure 3a). The subjacent fibrous structure was visible via reflected light microscopy. While the top side appeared microscopically dense, the back side of the paper substrate showed pores with diameters in the micrometer range. Coating paper with CNC (Figure 3b) and SNP (Figure 3c) involved the deposition of hydrolyzed residues and agglomerates onto the surface, similar to the coatings on PLA. SEM imaging of the coated paper substrate shows the irregular surface topography caused by these residues (Figure 3e,f). Double-coating paper with SNP caused a more distinct topography.

Figure 3.
Paper (a,d) coated with CNC (b,e) or SNP (c,f) via reflected bright-field microscopy (a–c) and by secondary electron imaging via SEM (d–f).
The light transmittance of bare PLA of 91.4% ± 1.3% at a wavelength of 550 nm was reduced by the application of nanoparticle coatings. The CNC coating reduced the absolute light transmittance by 10.3% ± 1.6%, whereas SNP reduced the absolute light transmittance by 34.2% ± 1.7%.
3.2.4. Barrier Properties
Coating PLA with a single layer of CNC decreased the OP from 514.6 ± 3.8 cm3 (STP) m−2 d−1 bar−1 to 129.7 ± 8.7 cm3 (STP) m−2 d−1 bar−1 at 50% r.h. (74.8%) (Figure 4a). A decrease to an OP of 110.1 ± 14.2 cm3 (STP) m−2 d−1 bar−1 (78.6%) was observed for a single coating layer of SNP. Considering the coating thickness, the OP Q100 of 4.7 ± 0.4 cm3 (STP) 100 µm m−2 d−1 bar−1 and 8.5 ± 1.4 cm3 (STP) 100 µm m−2 d−1 bar−1 for CNC and SNP resulted, emphasizing the noticeable barrier performance of CNC against oxygen compared to SNP (Figure 4b).
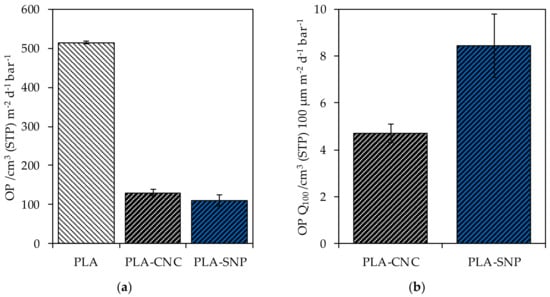
Figure 4.
(a) The measured OTR of bare PLA and PLA substrate coated with CNC and SNP; (b) the normalized OTR to a layer thickness of 100 µm (OTR Q100).
The nanoparticle coatings did not improve the water vapor barrier of coated PLA. The WVP Q100 of bare PLA substrate of 76.1 ± 3.1 g (STP) 100 µm m−2 d−1 remained almost constant for a coating with CNC (80.3 ± 4.6 g (STP) 100 µm m−2 d−1; 85→0% r.h.) and SNP (81.4 ± 1.8 g (STP) 100 µm m−2 d−1; 85→0% r.h.). The slight increase is explicable by water adsorption due to the hygroscopic character of both the coatings and the substrate in combination with the gravimetric measurement method.
Paper substrates double-coated with either CNC or SNP did not pass the pinhole test and were therefore excluded from the determination of barrier properties.
3.3. Properties of Cast Films
CNC and SNP were incorporated in hydrophilic starch matrices at different concentrations cfiller by solution casting. The target thickness was 50 µm. All experiments were repeated at least five times.
3.3.1. Microscopy and Optical Properties
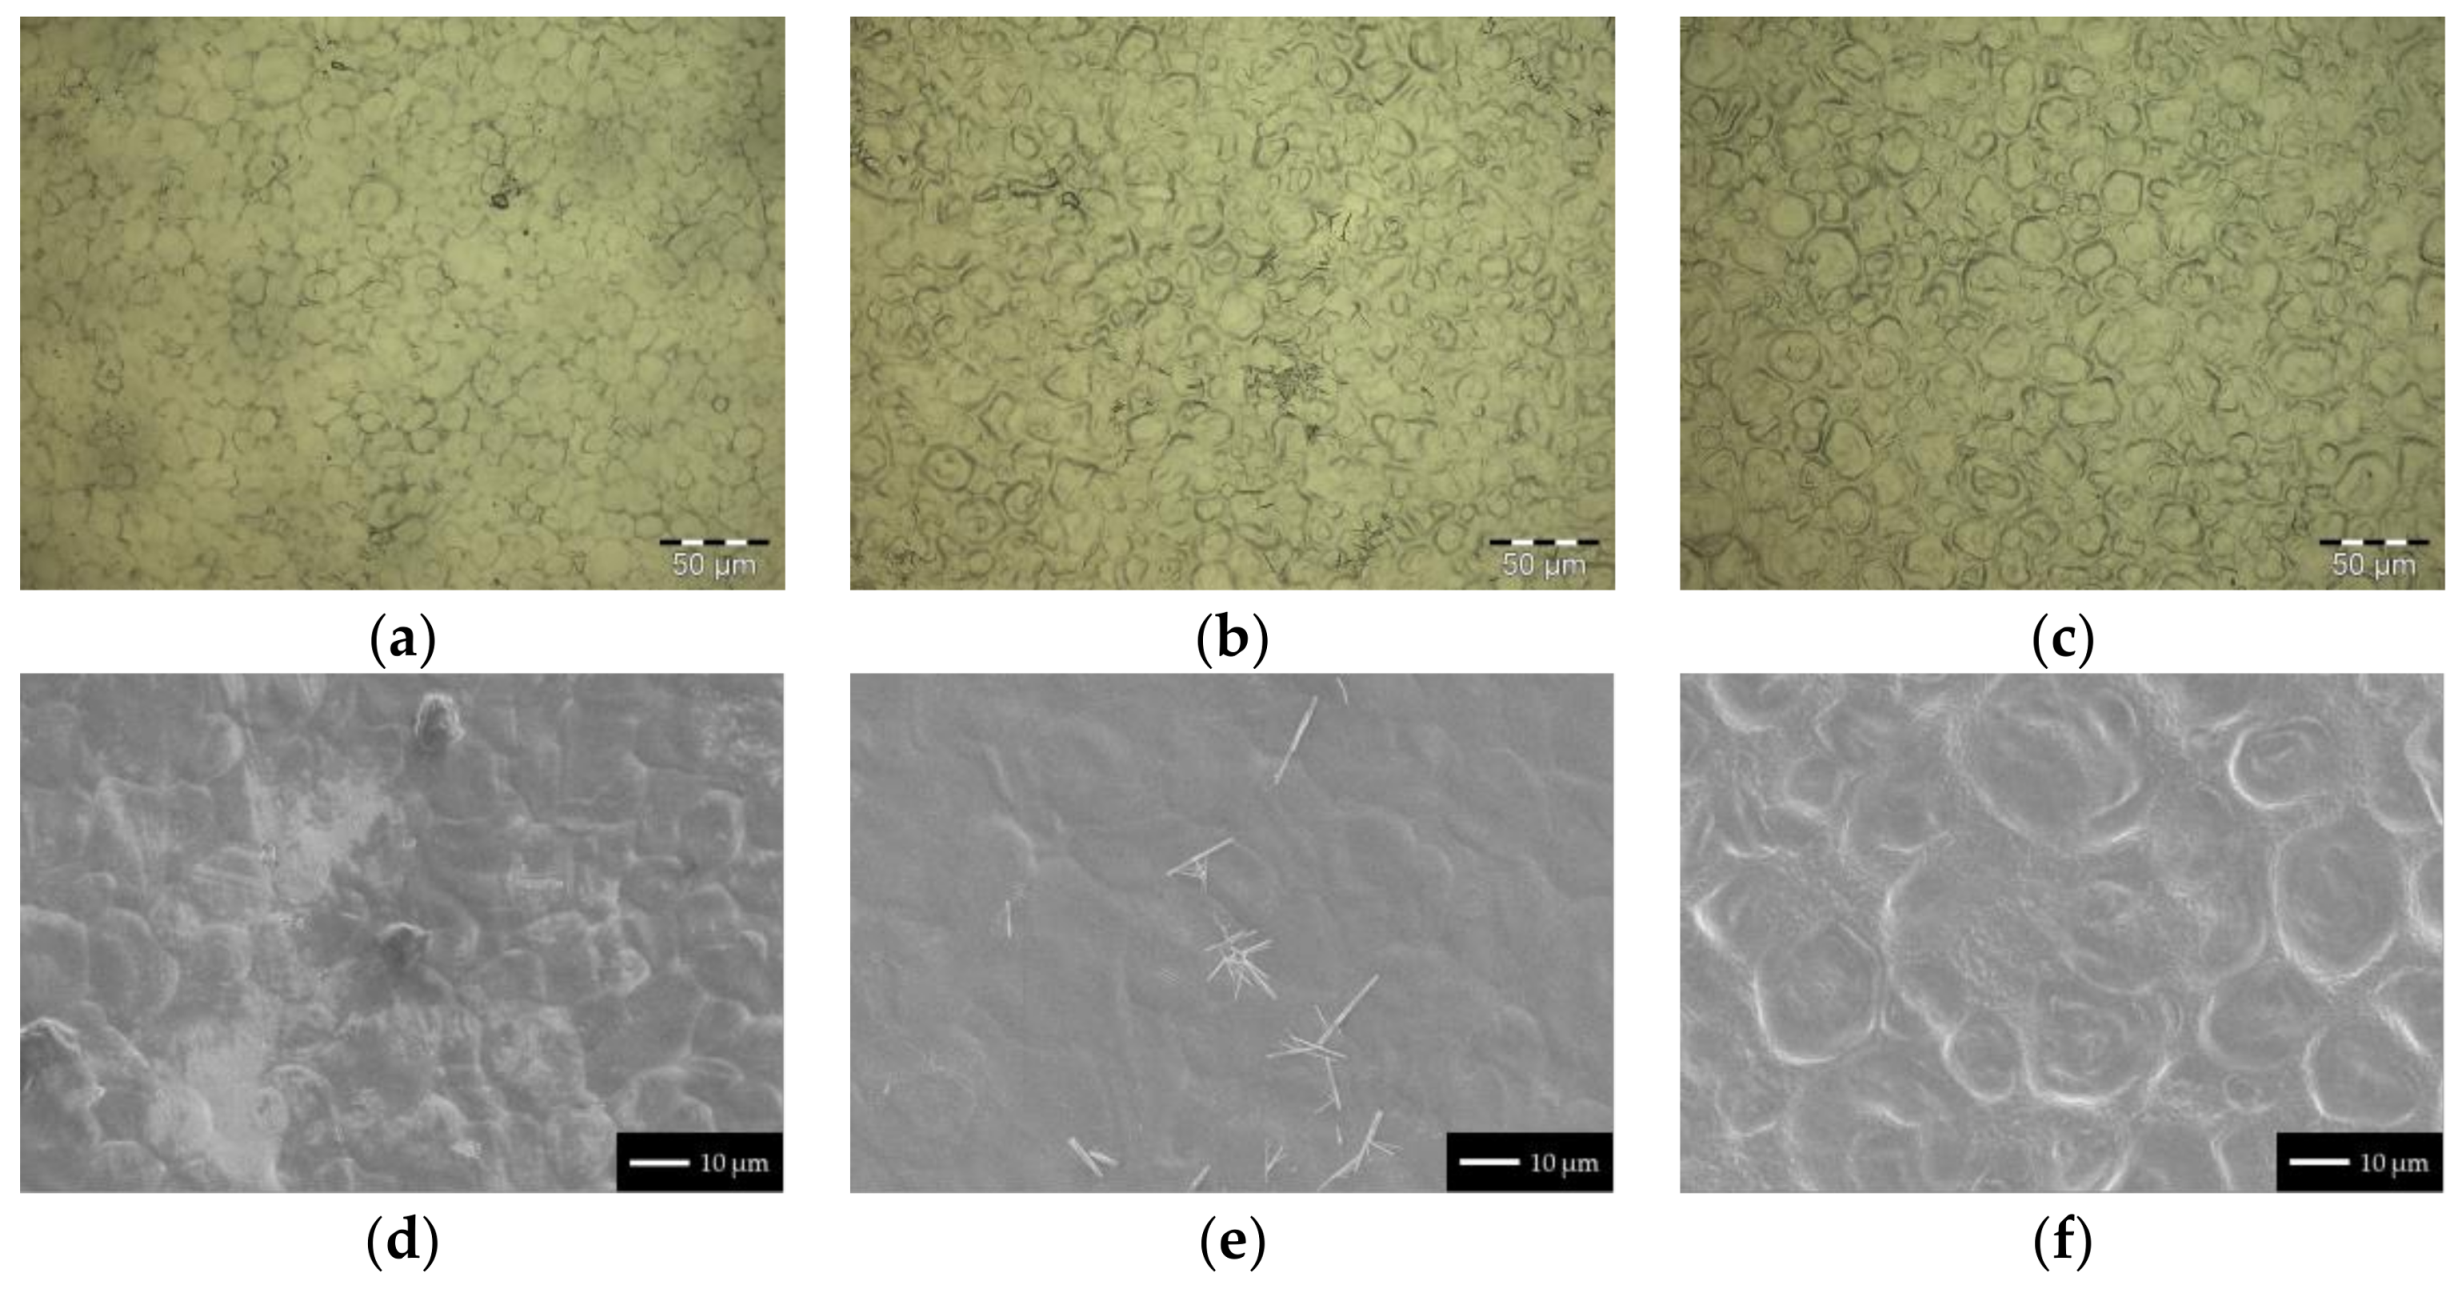
Plastification at 70 °C for 1 h did not completely degrade the granular structure of corn starch. Swelling induced an increase of the grain size in the pure starch-glycerol film and ghost remnants were recognizable [51] (Figure 5a). Accordingly, the film surface displays the topography of the shells of the native starch granules (Figure 5d). Adding CNC (Figure 5b,e) or SNP (Figure 5c,f) in concentrations of 0 ≤ c ≤ 9 wt % did not alter the microstructure of the film. Agglomerates or microscale residues from the hydrolyzed cellulose product were visible in both reflected bright-field microscopy and via SEM imaging. The visible accumulation suggests their segregation from the starch matrix during drying. Due to the similar appearance of the SNP and the starch matrix, no hydrolyzed starch residues were recognizable in these nanocomposites.
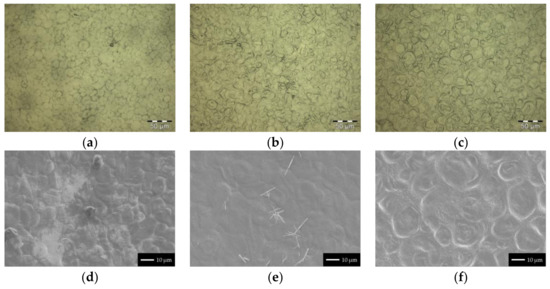
Figure 5.
Pure starch-glycerol film (a,d), starch-CNC nanocomposite (b,e), and starch-SNP nanocomposite (c,f). The shown nanocomposites had a filler content of 3 wt %. (a–c) Reflected bright-field microscopy and (d–f) secondary electron imaging (SEM).
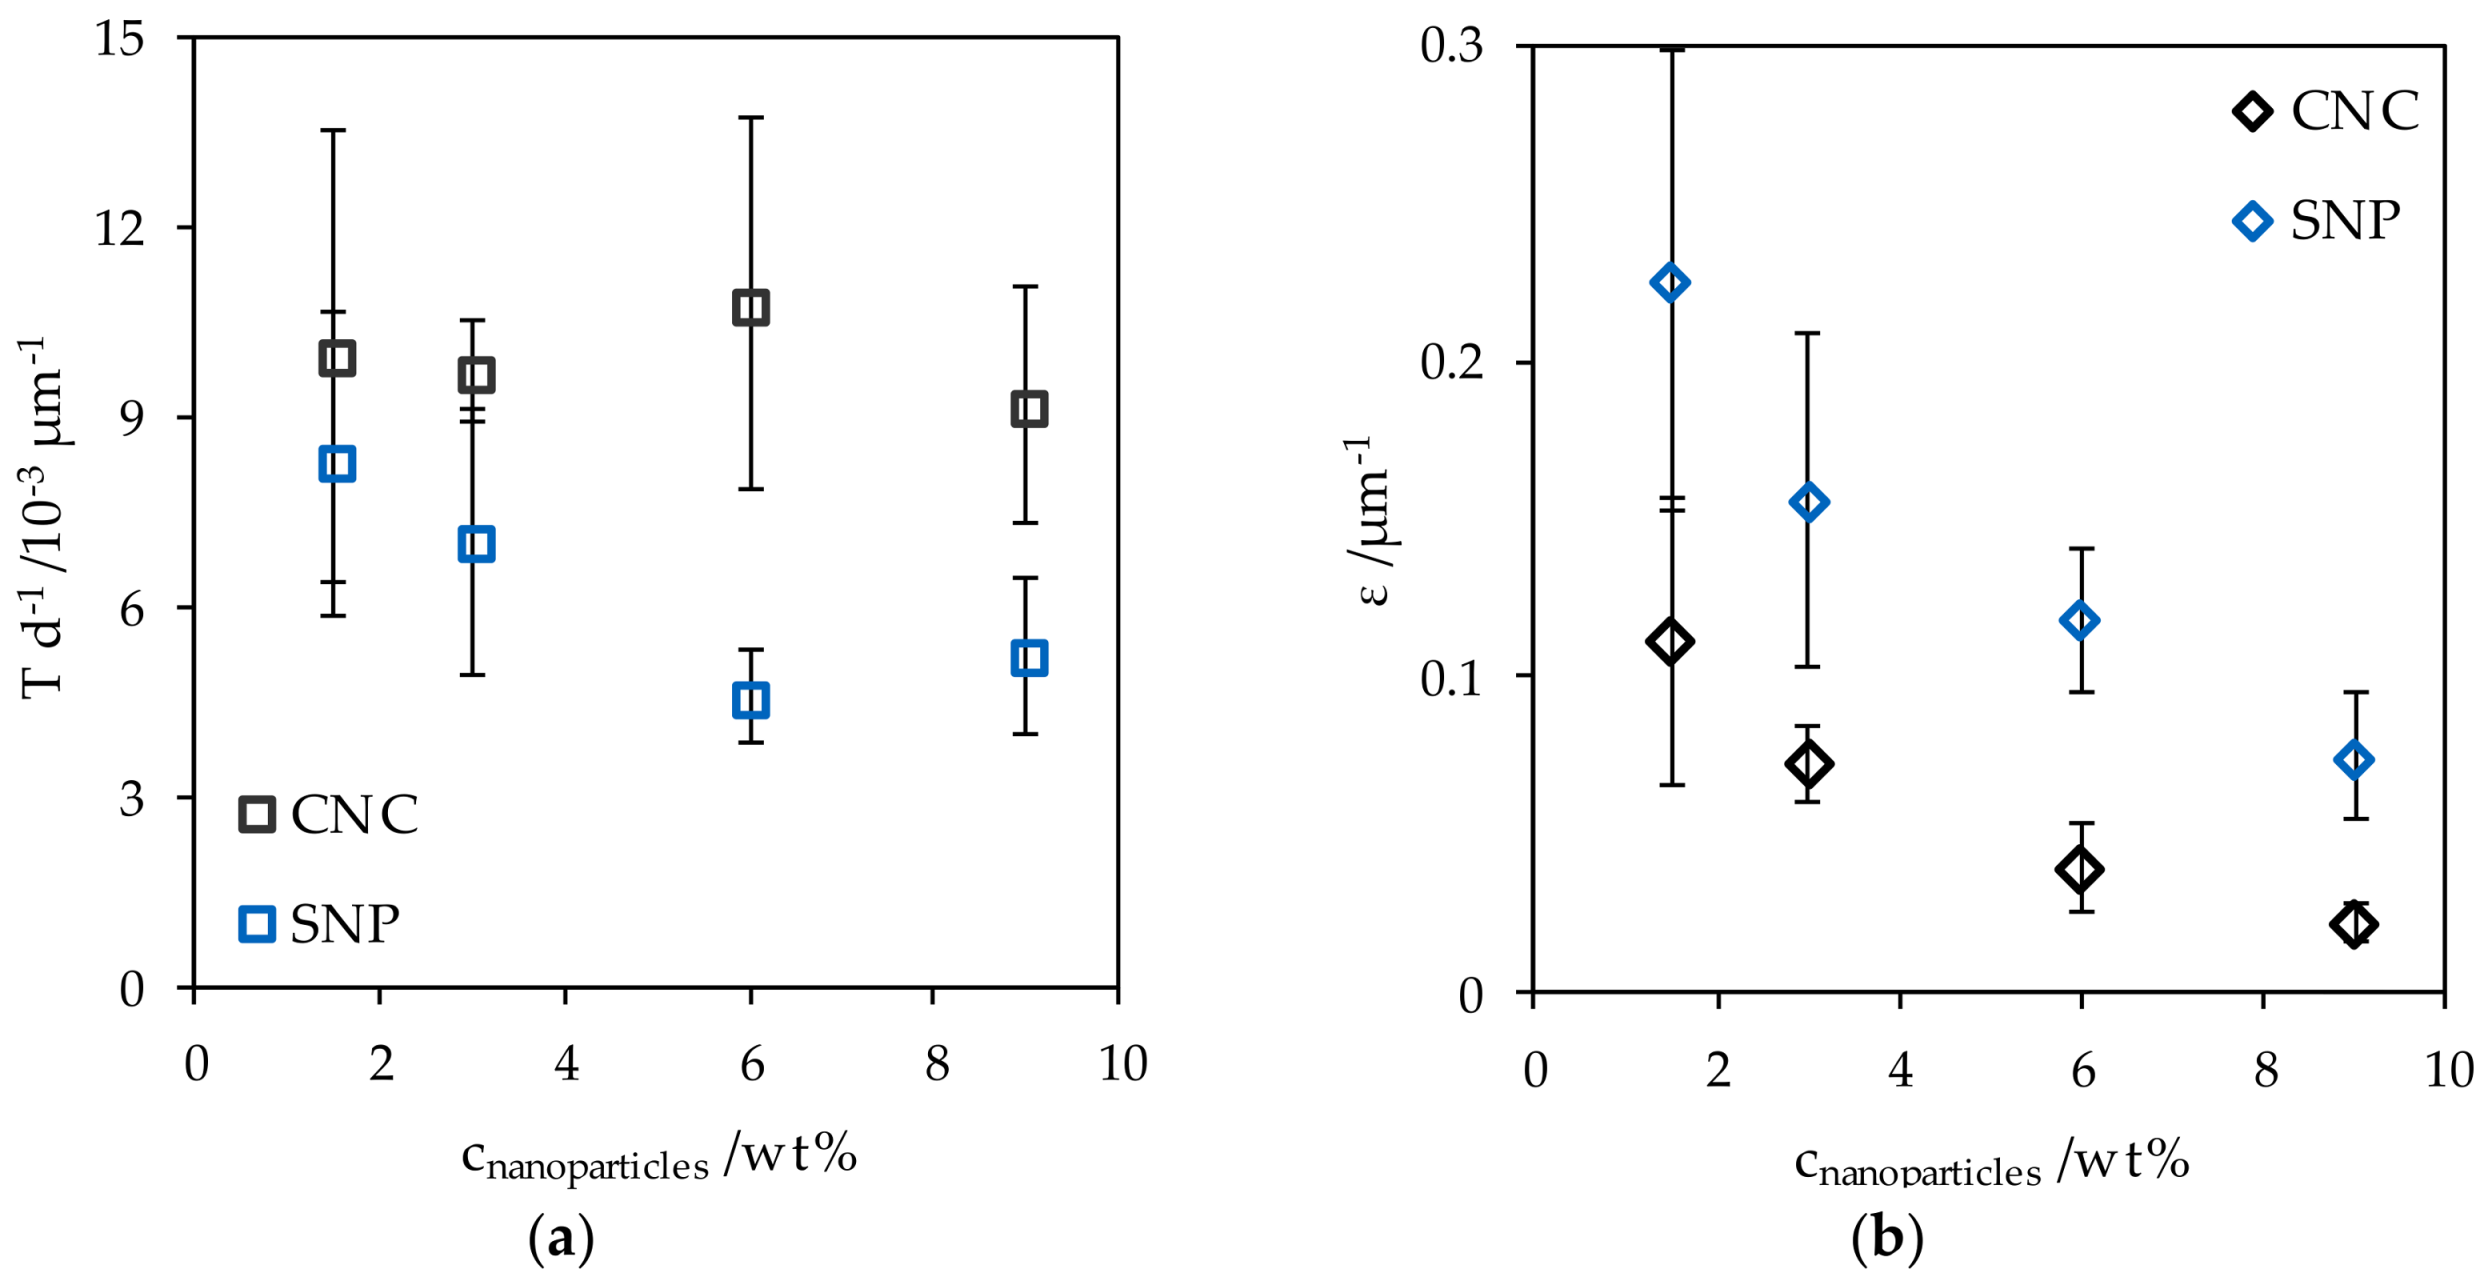
The light transmittance of a starch-glycerol film Tstarch with a thickness d of 50 µm was 83.5 ± 2.1% (13.38 × 10⁻³ ± 2.3 × 10⁻³ µm−1) at 550 nm. For better comparability, the light transmittance T was normalized with respect to d. The addition of CNC and SNP reduced the light transmittance with increasing nanoparticle concentration cnanoparticles (Figure 6a). This effect was more pronounced for the addition of SNP. Accordingly, the extinction coefficient ε decreased with increasing filler content and was overall higher for SNP nanocomposites (Figure 6b). The high uncertainties prevalent at low cnanoparticles arose from the strong relative weighting of variable film thicknesses.
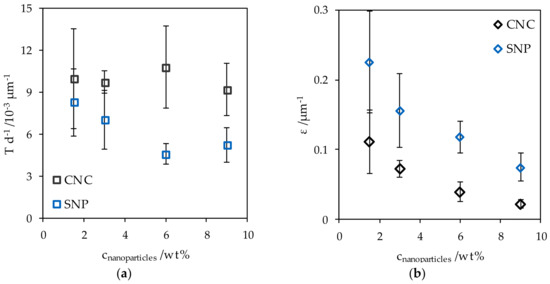
Figure 6.
(a) The normalized transmittance of CNC and SNP nanocomposites and (b) the extinction coefficient at different nanoparticle concentrations.
3.3.2. Barrier Properties
A slight improvement of the WVP Q100 of cast starch-glycerol films was achieved by adding CNC or SNP (Table 3). However, all measured values lie within the 95% confidence interval of the WVP Q100 of 47.3 ± 20.6 g (STP) 100 µm m−2 d−1 (85→0% r.h.) of the pure starch-glycerol film.
Table 3.
Normalized water vapor permeability of starch nanocomposites with different amounts of CNC or SNP.
3.3.3. Mechanical Properties
The ultimate tensile strength σUTS of the starch-glycerol films was 4.1 ± 2.1 MPa, Young’s modulus E was 0.7 ± 0.4 MPa and the fracture strain εf was 23.7% ± 13.9%. The mechanical properties were changed by adding CNC and SNP, however, all measured values of nanocomposites lie within the 95% confidence interval of the values of starch-glycerol films (Figure 7). Although all samples were prepared with high diligence, the notch sensitivity of the organic composites caused the high uncertainties of the measured mechanical properties.
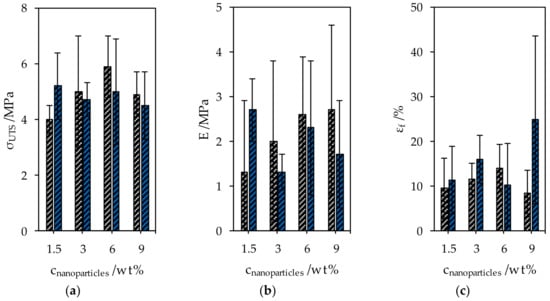
Figure 7.
Mechanical properties of CNC and SNP nanocomposites. (a) The ultimate tensile strength, (b) Young’s modulus, and (c) the elongation at break.
4. Discussion
4.1. Nanoparticle Dispersions
The extraction of nanoparticles from cotton linters and corn starch was performed by sulfuric acid hydrolysis followed by neutralization with sodium hydroxide. To reduce the amount of hydrolyzed cellulose residues in the CNC product, a comparably long hydrolysis time of 3 h was chosen. The achieved gross yield was still >40 wt %. Exemplarily, other studies addressing the extraction of CNC from cotton linters reported gross yields of 52.7 wt % after 45 min at 45 °C (64 wt % H2SO4, 1:17.5 g mL−1) [52] and 54.4 wt % after 5 min at 45 °C (60 wt % H2SO4, 1:20 g mL−1) [53]. Similar short hydrolysis times in combination with the here presented extraction method could facilitate a distinctly higher gross yield. To evaluate the degree of conversion of the raw cellulose to CNC and soluble residues, X-ray diffraction measurements could complement the process evaluation by giving information about the product crystallinity. Analogously, the gross yield of SNP from corn starch of 32.2 ± 0.7 wt % is comparably high (15% after 120 h at 40 °C and 25 wt % H2SO4 [54]).
The desired high ionic strength during washing enables flocculation of the nanoparticles. Therefore, a separation from the reaction solution is possible. The precipitation-redispersion mechanism enabled the removal of more than 99.8% of the ionic residues. Consequently, the nanoparticle dispersions showed no macroscopic phase separation over several weeks at 23 °C. Nevertheless, the presence of ions in the dispersions is expected to promote the formation of agglomerates [55,56] effecting larger apparent particle sizes. The actual particle size could be detected by atomic force microscopy and transmission electron microscopy.
A scale-up scenario regarding process time and the consumption of chemicals (Table 4) is derived from the applied process parameters and compared to a scaling approach documented by Reiner et al. [57]. Both approaches are normalized to a CNC product mass of 1 kg based on the respective yield. The rate-determining step of our approach is the hydrolysis time of 3 h. Further steps, comprising neutralization, washing, and homogenization, require only 1 h with the used equipment. Thus, the net process time is 4 h per batch. Reiner et al. used kraft pulp as feed stock and stopped the hydrolysis after 1.5 h by dilution and subsequent neutralization with NaOH. The unit operation times are given as 8 h for hydrolysis and neutralization, 24–48 h for gravity settling and initial purification and 24 h for filtration. The CNC produced by the overall faster process presented in this work has a higher residual ion content, but a markedly lower overall water consumption (75%) and facilitates a more compact reactor volume.
Table 4.
Comparison of the masses of chemicals required to extract 1 kg of CNC from raw cellulose, based on the neutralization of sulfuric acid.
Analogously, 1 kg of SNP is produced from 3.1 kg corn starch converted with 26.3 kg H2SO4 (18 wt %). Neutralization and washing require 81.2 kg H2O. Complete neutralization is achieved by adding 16.9 kg NaOH. Due to the protracted hydrolysis, the net process time is 121 h per batch.
4.2. Nanoparticle Coatings
PLA needed to be corona-treated prior to the application of aqueous nanoparticle dispersions onto the hydrophobic substrate by blade-coating of the coating medium without contraction. High nanoparticle concentrations and therefore increased viscosities further facilitated good spreadability of the nanoparticle dispersions on the substrates. In particular, the presence of ions induced the gel-like character of the CNC dispersion [58]. The dry coating thicknesses of both CNC and SNP coatings exceeded the targeted values on PLA. It was assumed that in both cases, non-dense layers formed on the substrate surface due to agglomeration and the presence of microparticles. Furthermore, the hydration of the salt residues as well as water absorption of the hygroscopic nanoparticles must be factored in. Same applies for the coatings on paper. The intrinsically less smooth surface of paper was assumed to additionally contribute to the deviating dry coating thicknesses. For both CNC and SNP coatings, hydrolyzed residues as well as agglomerates accumulated on the coated substrates and thereby reduced the optical transmittance of the films.
The observed effect of lower oxygen permeation of CNC and SNP coatings can be attributed to the size and the structural organization of the nanoparticles in the coating layer. The structural organization influences the diffusion path length of gas molecules in the film [59]. No improvement regarding the water vapor permeation was found. The intrinsic hydrophobicity of the nanoparticles in conjunction with the hygroscopic effect of the ionic residues is assumed to particularly impair the water vapor barrier properties. Microscopic cracks were found in starch coatings on PLA indicating embrittlement during solvent evaporation. Gentler drying conditions are not viewed as expedient. Instead, the addition of plasticizers may facilitate the prevention of cracks and lead to improved techno-functional properties [60].
Since the application of a double coating layer onto paper did not yield pinhole-free substrates, paper was excluded from further analyses. Alternatively to blade-coating, impregnating paper by dip-coating may lead to a pinhole-free substrate [5], however, accompanied by a higher expenditure of nanoparticles.
Results from other studies addressing the oxygen permeability of CNC coatings and cast films are shown in Table 5. A strong impact of the r.h., the substrate material and the nanoparticles themselves is recognizable. The OP Q100 at 50% r.h. of coatings in the present study were in the same range as plasticized nanocellulose films. However, compared to other approaches, the OP Q100 at 50% r.h. was up to 2 orders of magnitude higher. It was concluded that narrowing the particle size distributions of CNC and SNP by removing aggregates may be the decisive factor to further reduce the oxygen permeability of the nanoparticle coatings on polymer substrates.
Table 5.
Comparison of oxygen permeabilities of coatings of CNC and SNP with results from other studies.
4.3. Cast Films
Solvated and swollen starch granules formed the microstructure of the cast films. In CNC nanocomposites the agglomerates and hydrolyzed residues segregated from the starch-glycerol matrix. Similar behavior was assumed from the techno-functional properties of SNP nanocomposites. No improvement was determined regarding the WVP and the mechanical properties of CNC and SNP nanocomposites. Both types of nanoparticles may have a low percolation threshold in the starch-glycerol film. Thus, a negligible increase of the tortuosity and hindered force transmission in the polymer matrix resulted [59,63]. Agglomerates are considered as potential predetermined breaking points during applied mechanical stress. The reduced relative light transmittance and extinction coefficient with increasing CNC and SNP loading in the nanocomposites indicated increasing light scattering on nanoparticles and agglomerates.
Prolonged mixing at elevated temperature may have led to desulfation of the nanoparticles and promoted agglomeration [64]. Reducing mixing time and temperature in the polymer precursor as well as the addition of surfactants [32] and the adjustment of the surface energy by altering the ionic strength of the nanoparticle dispersions is considered beneficial.
5. Conclusions
The restricted efficiency of the extraction of CNC and SNP is one main limiting factor for the effective competition with already established additives for packaging materials [65]. While fossil-based polymers for packaging are still far ahead regarding economic competitiveness and techno-functional properties, such as barrier and mechanical properties, the potential of CNC and SNP is evident. In favor of the reduction of the complexity of multi-layer films and towards more ecofriendly and sustainable packaging solutions, CNC and SNP are promising candidates to enhance bio-based polymers with intrinsically attenuated barrier and mechanical properties. In this regard, an efficient post-processing method contributing to an overall economic extraction process was applied in this paper along with two examples of application. The use of non-functionalized CNC and SNP as coatings and nanofillers is attractive regarding an overall fast and green process.
From this study, we conclude:
- (h1)
- The neutralization-based approach for the extraction of CNC and SNP from biopolymeric feed stocks in combination with the applied post-processing method is time-efficient and resource-saving. With hydrolysis times of 3 h for cellulose and 120 h for starch, gross yields of 41.4% and 32.2%, respectively, were achieved. The nanoparticle dispersions showed long-term stability.
- (h2)
- Reduced oxygen permeabilities were achieved with coatings of CNC and SNP on PLA. The barrier improvement of paper failed due to pinholes in the substrate.
- (h3)
- No improvement of the WVP and the mechanical properties of cast starch-glycerol films incorporating CNC or SNP were found. It was deduced from the results that agglomeration of the nanoparticles during the cast film preparation and segregation of the filler from the matrix during drying compromised the techno-functional properties.
Further purification of the hydrolyzed products regarding ionic residues and agglomerates is suggested to improve the techno-functional properties of CNC and SNP applied in coatings and cast nanocomposite films.
Acknowledgments
This work was supported by the German Research Foundation (DFG) and the Technical University of Munich (TUM) in the framework of the Open Access Publishing Program. We did not receive any specific grant from funding agencies in the public, commercial, or not-for-profit sectors. The authors thank Vesna Müller for helpful discussions in the early stage of the study as well as Petra Dietl, Zuzana Scheurer, and Markus Pummer for their experimental contributions. Moreover, we want to thank Michael Gebhardt (TUM, chair of zoology) for providing access to the scanning electron microscope.
Author Contributions
Christoph Metzger and Solange Sanahuja conceived and designed the experiments; Christoph Metzger and Lisa Behrends carried out the experiments; Christoph Metzger, Martina Lindner, Heiko Briesen, and Sven Sängerlaub analyzed the data and interpreted the results; Heiko Briesen, Sven Sängerlaub and Martina Lindner contributed reagents, materials and measurement equipment, and contributed to and edited the manuscript; Christoph Metzger wrote the manuscript.
Conflicts of Interest
The authors declare no conflict of interest. The funding sponsors had no role in the design of the study; in the collection, analyses, or interpretation of data; in the writing of the manuscript, and in the decision to publish the results.
References
- LeCorre, D.; Dufresne, A.; Rueff, M.; Khelifi, B.; Bras, J. All starch nanocomposite coating for barrier material. J. Appl. Polym. Sci. 2014, 131, 39826. [Google Scholar] [CrossRef]
- Li, F.; Biagioni, P.; Bollani, M.; Maccagnan, A.; Piergiovanni, L. Multi-functional coating of cellulose nanocrystals for flexible packaging applications. Cellulose 2013, 20, 2491–2504. [Google Scholar] [CrossRef]
- Belbekhouche, S.; Bras, J.; Siqueira, G.; Chappey, C.; Lebrun, L.; Khelifi, B.; Marais, S.; Dufresne, A. Water sorption behavior and gas barrier properties of cellulose whiskers and microfibrils films. Carbohydr. Polym. 2011, 83, 1740–1748. [Google Scholar] [CrossRef]
- Herrera, M.A.; Mathew, A.P.; Oksman, K. Gas permeability and selectivity of cellulose nanocrystals films (layers) deposited by spin coating. Carbohydr. Polym. 2014, 112, 494–501. [Google Scholar] [CrossRef] [PubMed]
- Herrera, M.A.; Sirviö, J.A.; Mathew, A.P.; Oksman, K. Environmental friendly and sustainable gas barrier on porous materials. Mater. Des. 2016, 93, 19–25. [Google Scholar] [CrossRef]
- Zheng, H.; Ai, F.; Chang, P.R.; Huang, J.; Dufresne, A. Structure and properties of starch nanocrystal-reinforced soy protein plastics. Polym. Compos. 2009, 30, 474–480. [Google Scholar] [CrossRef]
- Angellier, H.; Molina-Boisseau, S.; Dufresne, A. Mechanical properties of waxy maize starch nanocrystal reinforced natural rubber. Macromolecules 2005, 38, 9161–9170. [Google Scholar] [CrossRef]
- Pei, A.; Malho, J.-M.; Ruokolainen, J.; Zhou, Q.; Berglund, L.A. Strong nanocomposite reinforcement effects in polyurethane elastomer with low volume fraction of cellulose nanocrystals. Macromolecules 2011, 44, 4422–4427. [Google Scholar] [CrossRef]
- Khan, A.; Khan, R.A.; Salmieri, S.; Le Tien, C.; Riedl, B.; Bouchard, J.; Chauve, G.; Tan, V.; Kamal, M.R.; Lacroix, M. Mechanical and barrier properties of nanocrystalline cellulose reinforced chitosan based nanocomposite films. Carbohydr. Polym. 2012, 90, 1601–1608. [Google Scholar] [CrossRef] [PubMed]
- Fortunati, E.; Peltzer, M.; Armentano, I.; Torre, L.; Jimenez, A.; Kenny, J.M. Effects of modified cellulose nanocrystals on the barrier and migration properties of PLA nano-biocomposites. Carbohydr. Polym. 2012, 90, 948–956. [Google Scholar] [CrossRef] [PubMed]
- Thompson, R.C.; Moore, C.J.; Vom Saal, F.S.; Swan, S.H. Plastics, the environment and human health: Current consensus and future trends. Philos. Trans. R. Soc. B Biol. Sci. 2009, 364, 2153–2166. [Google Scholar] [CrossRef] [PubMed]
- Miller, S.A. Sustainable polymers: Opportunities for the next decade. ACS Macro Lett. 2013, 2, 550–554. [Google Scholar] [CrossRef]
- Davis, G.; Song, J.H. Biodegradable packaging based on raw materials from crops and their impact on waste management. Ind. Crops Prod. 2006, 23, 147–161. [Google Scholar] [CrossRef]
- Niaounakis, M. Biopolymers: Processing and Products; Elsevier Science: Burlington, NJ, USA, 2015. [Google Scholar]
- Markarian, J. Biopolymers present new market opportunities for additives in packaging. Plast. Addit. Compd. 2008, 10, 22–25. [Google Scholar] [CrossRef]
- Vink, E.T.H.; Rábago, K.R.; Glassner, D.A.; Gruber, P.R. Applications of life cycle assessment to NatureWorks™ polylactide (PLA) production. Polym. Degrad. Stab. 2003, 80, 403–419. [Google Scholar] [CrossRef]
- Carothers, W.H.; Dorough, G.L.; van Natta, F.J. Studies of polymerization and ring formation—X. The reversible polymerization of six-membered cyclic esters. J. Am. Chem. Soc. 1932, 54, 761–772. [Google Scholar] [CrossRef]
- Lunt, J. Large-scale production, properties and commercial applications of polylactic acid polymers. Polym. Degrad. Stab. 1998, 59, 145–152. [Google Scholar] [CrossRef]
- Gruber, P.; O’Brien, M. Polylactides “NatureWorks® PLA”. In Biopolymers Online; Steinbüchel, A., Ed.; Wiley-VCH: Weinheim, Germany, 2005. [Google Scholar]
- Auras, R.; Harte, B.; Selke, S. An overview of polylactides as packaging materials. Macromol. Biosci. 2004, 4, 835–864. [Google Scholar] [CrossRef] [PubMed]
- Auras, R.; Harte, B.; Selke, S. Effect of water on the oxygen barrier properties of poly(ethylene terephthalate) and polylactide films. J. Appl. Polym. Sci. 2004, 92, 1790–1803. [Google Scholar] [CrossRef]
- Chaiwong, C.; Rachtanapun, P.; Wongchaiya, P.; Auras, R.; Boonyawan, D. Effect of plasma treatment on hydrophobicity and barrier property of polylactic acid. Surf. Coat. Technol. 2010, 204, 2933–2939. [Google Scholar] [CrossRef]
- Siracusa, V.; Blanco, I.; Romani, S.; Tylewicz, U.; Rocculi, P.; Rosa, M.D. Poly(lactic acid)-modified Films for food packaging application: Physical, mechanical, and barrier behavior. J. Appl. Polym. Sci. 2012, 125, 390–401. [Google Scholar] [CrossRef]
- Pant, A.F.; Sängerlaub, S.; Müller, K. Gallic acid as an oxygen scavenger in bio-based multilayer packaging films. Materials 2017, 10, 11. [Google Scholar] [CrossRef] [PubMed]
- Pan, Y.; Xiao, H.; Song, Z. Hydrophobic modification of cellulose fibres by cationic-modified polyacrylate latex with core-shell structure. Cellulose 2013, 20, 485–494. [Google Scholar] [CrossRef]
- Miller, K.S.; Krochta, J.M. Oxygen and aroma barrier properties of edible films: A review. Trends Food Sci. Technol. 1997, 8, 228–237. [Google Scholar] [CrossRef]
- Rhim, J.-W.; Park, H.-M.; Ha, C.-S. Bio-nanocomposites for food packaging applications. Prog. Polym. Sci. 2013, 38, 1629–1652. [Google Scholar] [CrossRef]
- Roman, M. Toxicity of cellulose nanocrystals—A review. Ind. Biotechnol. 2015, 11, 25–33. [Google Scholar] [CrossRef]
- Rånby, B.G.; Banderet, A.; Sillén, L.G. Aqueous colloidal solutions of cellulose micelles. Acta Chem. Scand. 1949, 3, 649–650. [Google Scholar] [CrossRef]
- Habibi, Y.; Lucia, L.A.; Rojas, O.J. Cellulose nanocrystals: Chemistry, self-assembly, and applications. Chem. Rev. 2010, 110, 3479–3500. [Google Scholar] [CrossRef] [PubMed]
- Müller, V.; Briesen, H. Nanocrystalline Cellulose, Its Preparation and Uses of Such Nanocrystalline Cellulose. U.S. Patent 20170306056 A1, 26 October 2017. [Google Scholar]
- Kim, J.; Montero, G.; Habibi, Y.; Hinestroza, J.P.; Genzer, J.; Argyropoulos, D.S.; Rojas, O.J. Dispersion of cellulose crystallites by nonionic surfactants in a hydrophobic polymer matrix. Polym. Eng. Sci. 2009, 49, 2054–2061. [Google Scholar] [CrossRef]
- Alves, J.S.; dos Reis, K.C.; Menezes, E.G.T.; Pereira, F.V.; Pereira, J. Effect of cellulose nanocrystals and gelatin in corn starch plasticized films. Carbohydr. Polym. 2015, 115, 215–222. [Google Scholar] [CrossRef] [PubMed]
- Li, F.; Mascheroni, E.; Piergiovanni, L. The potential of nanocellulose in the packaging field: A review. Packag. Technol. Sci. 2015, 28, 475–508. [Google Scholar] [CrossRef]
- Liu, H.; Brinson, L.C. Reinforcing efficiency of nanoparticles: A simple comparison for polymer nanocomposites. Compos. Sci. Technol. 2008, 68, 1502–1512. [Google Scholar] [CrossRef]
- Habibi, Y. Key advances in the chemical modification of nanocelluloses. Chem. Soc. Rev. 2014, 43, 1519–1542. [Google Scholar] [CrossRef] [PubMed]
- Murphy, S.H.; Marsh, J.J.; Kelly, C.A.; Leeke, G.A.; Jenkins, M.J. CO2 assisted blending of poly(lactic acid) and poly(ε-caprolactone). Eur. Polym. J. 2017, 88, 34–43. [Google Scholar] [CrossRef]
- Ge, H.; Yang, F.; Hao, Y.; Wu, G.; Zhang, H.; Dong, L. Thermal, mechanical, and rheological properties of plasticized poly(L-lactic acid). J. Appl. Polym. Sci. 2013, 127, 2832–2839. [Google Scholar] [CrossRef]
- Mihai, M.; Huneault, M.A.; Favis, B.D. crystallinity development in cellular poly(lactic acid) in the presence of supercritical carbon dioxide. J. Appl. Polym. Sci. 2009, 113, 2920–2932. [Google Scholar] [CrossRef]
- Angellier, H.; Choisnard, L.; Molina-Boisseau, S.; Ozil, P.; Dufresne, A. Optimization of the preparation of aqueous suspensions of waxy maize starch nanocrystals using a response surface methodology. Biomacromolecules 2004, 5, 1545–1551. [Google Scholar] [CrossRef] [PubMed]
- Lindner, M.; Rodler, N.; Jesdinszki, M.; Schmid, M.; Sängerlaub, S. Surface energy of corona treated PP, PE and PET films, its alteration as function of storage time and the effect of various corona dosages on their bond strength after lamination. J. Appl. Polym. Sci. 2018, 135, 45842. [Google Scholar] [CrossRef]
- Beck, S.; Bouchard, J. Auto-catalyzed acidic desulfation of cellulose nanocrystals. Nord. Pulp Pap. Res. J. 2014, 29, 6–14. [Google Scholar] [CrossRef]
- Lindner, M. Factors affecting the hygroexpansion of paper. J. Mater. Sci. 2018, 53, 1–26. [Google Scholar] [CrossRef]
- Jost, V.; Kobsik, K.; Schmid, M.; Noller, K. Influence of plasticiser on the barrier, mechanical and grease resistance properties of alginate cast films. Carbohydr. Polym. 2014, 110, 309–319. [Google Scholar] [CrossRef] [PubMed]
- DIN 53380-3 Testing of Plastics—Determination of Gas Transmission Rate—Part 3: Oxygen-Specific Carrier Gas Method for Testing of Plastic Films and Plastics Mouldings; German National Standard: Berlin, Germany, 1998.
- Langowski, H.-C. Permeation of gases and condensable substances through monolayer and multilayer structures. In Plastic Packaging: Interactions with Food and Pharmaceuticals, 2nd ed.; Piringer, O.G., Baner, A.L., Eds.; Wiley-VCH: Weinheim, Germany, 2008. [Google Scholar]
- DIN 53122-1 Testing of Plastics and Elastomer Films, Paper, Board and Other Sheet Materials—Determination of Water Vapour Transmission—Part 1: Gravimetric Method; German National Standard: Berlin, Germany, 2001.
- DIN EN ISO 527-3 Plastics—Determination of Tensile Properties—Part 3: Test Conditions for Films and Sheets; German National Standard: Berlin, Germany, 2012.
- LeCorre, D.; Bras, J.; Dufresne, A. Evidence of micro- and nanoscaled particles during starch nanocrystals preparation and their isolation. Biomacromolecules 2011, 12, 3039–3046. [Google Scholar] [CrossRef] [PubMed]
- Zirkel, L. PLA for thermoforming. Bioplast. Mag. 2012, 7, 18–20. [Google Scholar]
- Zhang, B.; Dhital, S.; Flanagan, B.M.; Gidley, M.J. Mechanism for starch granule ghost formation deduced from structural and enzyme digestion properties. J. Agric. Food Chem. 2014, 62, 760–771. [Google Scholar] [CrossRef] [PubMed]
- Mascheroni, E.; Rampazzo, R.; Ortenzi, M.A.; Piva, G.; Bonetti, S.; Piergiovanni, L. Comparison of cellulose nanocrystals obtained by sulfuric acid hydrolysis and ammonium persulfate, to be used as coating on flexible food-packaging materials. Cellulose 2016, 23, 779–793. [Google Scholar] [CrossRef]
- Chang, C.-P.; Wang, I.-C.; Hung, K.-J.; Perng, Y.-S. Preparation and characterization of nanocrystalline cellulose by acid hydrolysis of cotton linter. Taiwan J. For. Sci. 2010, 25, 251–264. [Google Scholar]
- LeCorre, D.; Bras, J.; Choisnard, L.; Dufresne, A. Optimization of the batch preparation of starch nanocrystals to reach daily time-scale. Starch 2012, 64, 489–496. [Google Scholar] [CrossRef]
- Phan-Xuan, T.; Thuresson, A.; Skepö, M.; Labrador, A.; Bordes, R.; Matic, A. Aggregation behavior of aqueous cellulose nanocrystals: The effect of inorganic salts. Cellulose 2016, 23, 3653–3663. [Google Scholar] [CrossRef]
- Cherhal, F.; Cousin, F.; Capron, I. Influence of charge density and ionic strength on the aggregation process of cellulose nanocrystals in aqueous suspension, as revealed by small-angle neutron scattering. Langmuir 2015, 31, 5596–5602. [Google Scholar] [CrossRef] [PubMed]
- Reiner, R.S.; Rudie, A.W. Process scale-up of cellulose nanocrystal production to 25 kg per batch at the forest products laboratory. In Production and Applications of Cellulose Nanomaterials; Postek, M.T., Moon, R.J., Rudie, A.W., Bilodeau, M.A., Eds.; TAPPI Press: Peachtree Corners, GA, USA, 2013; pp. 21–24. [Google Scholar]
- Xu, Y.; Atrens, A.D.; Stokes, J.R. Rheology and microstructure of aqueous suspensions of nanocrystalline cellulose rods. J. Colloid Interface Sci. 2017, 496, 130–140. [Google Scholar] [CrossRef] [PubMed]
- Nielsen, L.E. Models for the permeability of filled polymer systems. J. Macromol. Sci. Part A Chem. 1967, 1, 929–942. [Google Scholar] [CrossRef]
- Sanyang, M.L.; Sapuan, S.M.; Jawaid, M.; Ishak, M.R.; Sahari, J. Effect of plasticizer type and concentration on physical properties of biodegradable films based on sugar palm (arenga pinnata) starch for food packaging. J. Food Sci. Technol. 2016, 53, 326–336. [Google Scholar] [CrossRef] [PubMed]
- Fukuzumi, H.; Saito, T.; Isogai, A. Influence of TEMPO-oxidized cellulose nanofibril length on film properties. Carbohydr. Polym. 2013, 93, 172–177. [Google Scholar] [CrossRef] [PubMed]
- Vartiainen, J.; Kaljunen, T.; Kunnari, V.; Lahtinen, P.; Salminen, A.; Seppälä, J.; Tammelin, T. Nanocellulose films: Towards large scale and continuous production. In Proceedings of the 26th IAPRI Symposium on Packaging 2013, Espoo, Finland, 10–13 June 2013; Nissi, M.V., Ed.; VTT: Espoo, Finland, 2013; pp. 197–209. [Google Scholar]
- Favier, V.; Dendievel, R.; Canova, G.; Cavaille, J.Y.; Gilormini, P. Simulation and modeling of three-dimensional percolating structures: Case of a latex matrix reinforced by a network of cellulose fibers. Acta Mater. 1997, 45, 1557–1565. [Google Scholar] [CrossRef]
- Jiang, F.; Esker, A.R.; Roman, M. Acid-catalyzed and solvolytic desulfation of H2SO4-hydrolyzed cellulose nanocrystals. Langmuir 2010, 26, 17919–17925. [Google Scholar] [CrossRef] [PubMed]
- Tang, X.Z.; Kumar, P.; Alavi, S.; Sandeep, K.P. Recent advances in biopolymers and biopolymer-based nanocomposites for food packaging materials. Crit. Rev. Food Sci. Nutr. 2012, 52, 426–442. [Google Scholar] [CrossRef] [PubMed]


© 2018 by the authors. Licensee MDPI, Basel, Switzerland. This article is an open access article distributed under the terms and conditions of the Creative Commons Attribution (CC BY) license (http://creativecommons.org/licenses/by/4.0/).