1. Introduction
Phosphating is the most widely used process for surface treatment and finishing of both ferrous and non-ferrous metals. Because of its economy, speed of application and its ability to provide excellent corrosion and wear resistance, adhesion and lubrication properties, phosphating plays a significant role in the automobile process, and appliance industries. Changes in the end use of phosphated articles have resulted in the development of innovative production methods designed to achieve the desired coating properties. Narayanan published a review of this new technology and the associated analytical techniques used to develop and monitor the processes [
1]. Zimmermann et al. used X-ray fluorescence (XRF) and scanning electron microscopy (SEM) to monitor the nucleation and growth rate of Ni
2+ coatings of Zn-Ni alloys in new phosphating processes [
2]. Now, new accelerators such as silica nano particles are being introduced to improve the performance of phosphate coatings against corrosion [
3].
Phosphate coatings consist of a fine, crystalline film that contains insoluble iron phosphates together with manganese or zinc phosphates. After proper treatment with oils, varnishes or paints, phosphate coatings reliably protect the metal from corrosion. Phosphate-zinc coatings are usually applied with a thin 1–3 μm thick layer, which corresponds to a coating surface gravity of 1.0–3.3 g/m
2. Phosphate-iron coatings are used less often. Their thickness is normally 0.3–0.8 μm [
4,
5]. In addition to corrosion protection, phosphate coatings are widely used for electrical insulation, to reduce friction and as a primer for paint and varnish coatings. The essence of the process of precipitation of phosphate coatings is the treatment (immersion or spraying) of the metal surface with acidified solutions of mono substituted phosphates. As a result, a film of insoluble phosphates forms on the surface.
Measuring the thickness of coatings is a challenge for both the finishers and the companies that receive finished components. Defective coatings lead to the formation of corrosion and other defects on the surface of the material. The coating process usually involves selective quality control (random sampling): measurements are performed by the operator at line with portable analyzers or random samples are delivered to a laboratory. Typically, portable X-ray fluorescence gauges or gauges based on eddy-current, magnetic induction and Beta-backscatter are used for this purpose.
In recent years, manufacturing engineers have recognized the importance of automatic quality control procedures for monitoring coating thicknesses that can provide them with continuous, real-time data. These data are automatically measured and stored electronically in a plant database. It is easy to retrieve and use the necessary information in case of possible claims. Testing the coating thicknesses online means increased productivity and improved process efficiency and eliminates over-coating or under-coating of the finished goods.
Accurate thickness measurements depend on the design characteristics of the analyzer and how well they are met. State-of-the-art instrumentation, along with the computer hardware and software packages now available with X-ray fluorescence systems, has significantly reduced inspection time and improved accuracy, repeatability, and reproducibility. In addition, online quality control does not require cutting the sample (cutting a metal strip to cut out subsamples with subsequent removal of the coating and weighing of coated and uncoated samples), thus decreasing labor cost and intensity.
The publications on the industrial application of online X-ray coating thickness analyzers, which were found in the research literature and industrial journals, are limited to laboratory table-top or hand-held instruments [
6,
7,
8]. AXIC Application Report No.1 describes the results of a laboratory analysis of the phosphorus content of silicate glasses on silicon substrates and their thicknesses. Measurements were performed in a fabrication environment with the AXIC-100 XRF system [
9]. The range of glass film thicknesses described in this application report was from 30 to 3000 nm.
No articles on real-time measurement of phosphate coating thickness on a moving steel strip with the help of industrial online XRF instrumentation were found. The lack of publications on industrial applications of online XRF analyzers can be explained either by a serious underestimation of the potential demand for such measurements or by the complexity of such a projects and long time required to implement it.
2. Thickness Analyzer Design and Features
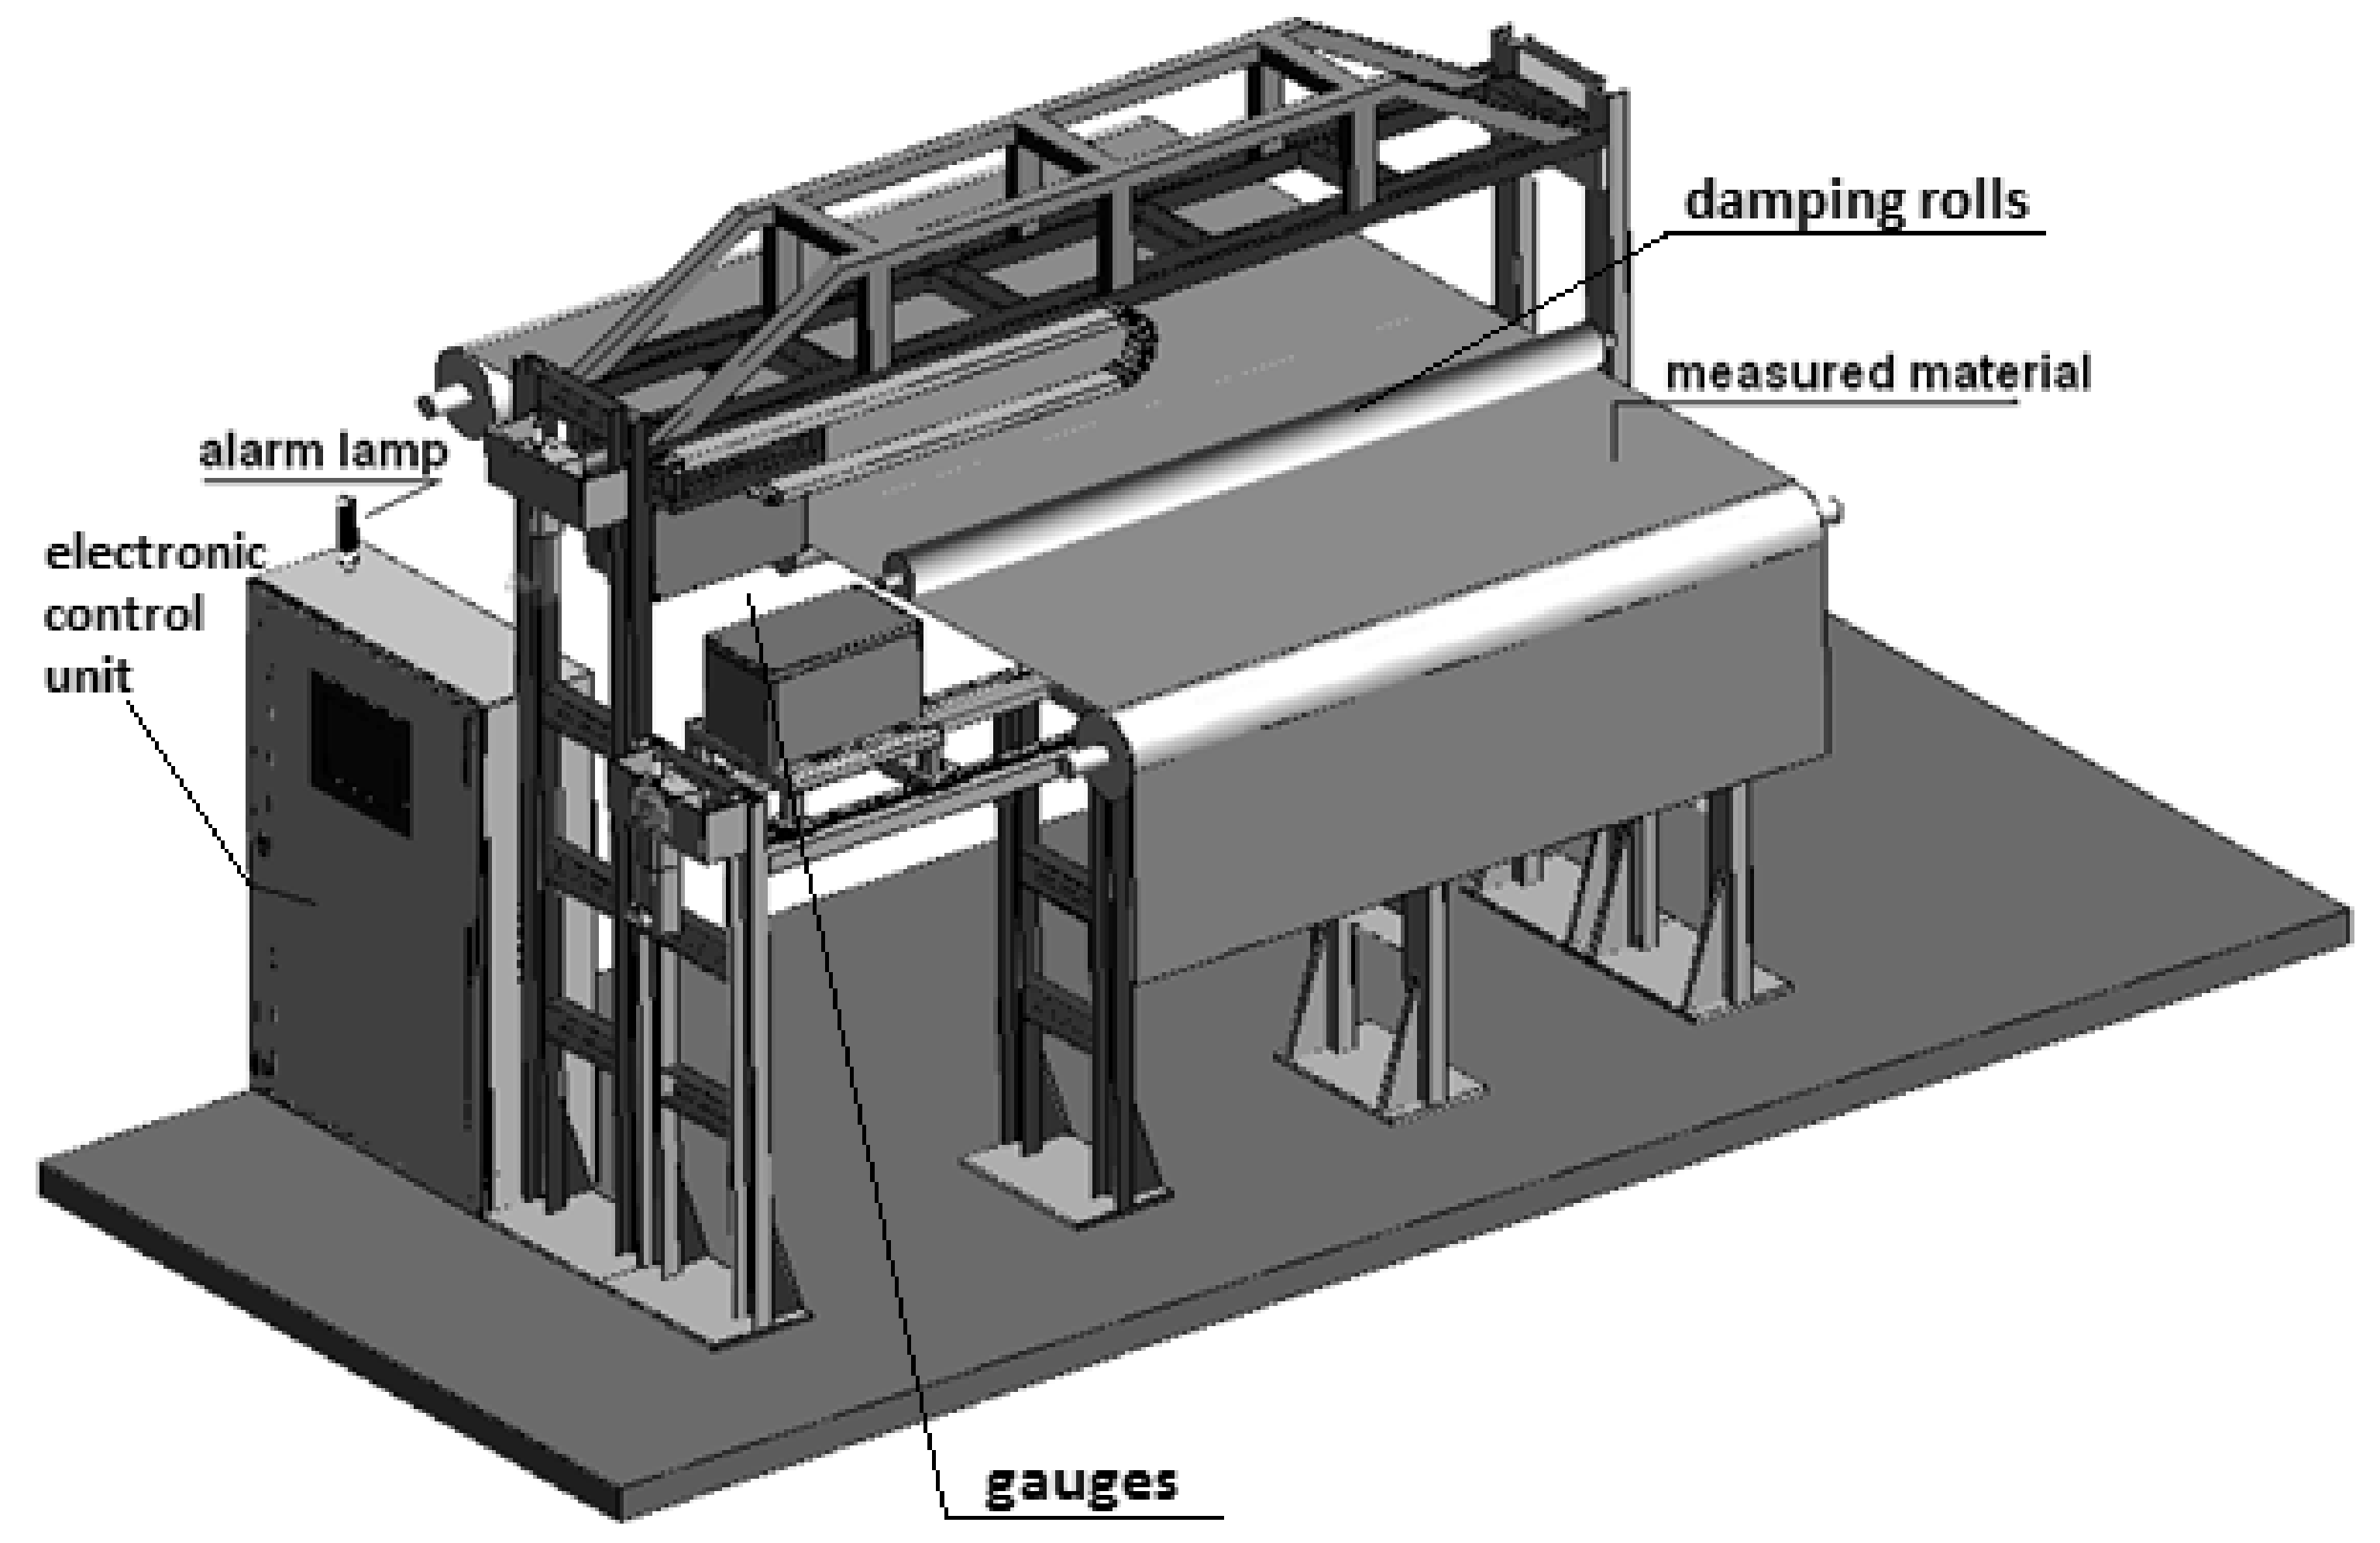
The design of developed industrial XRF coating thickness analyzer CTA-02 (Baltic Scientific Instruments, Riga, Latvia; EuroScience, Seongnam-si, Korea) schematically presented on
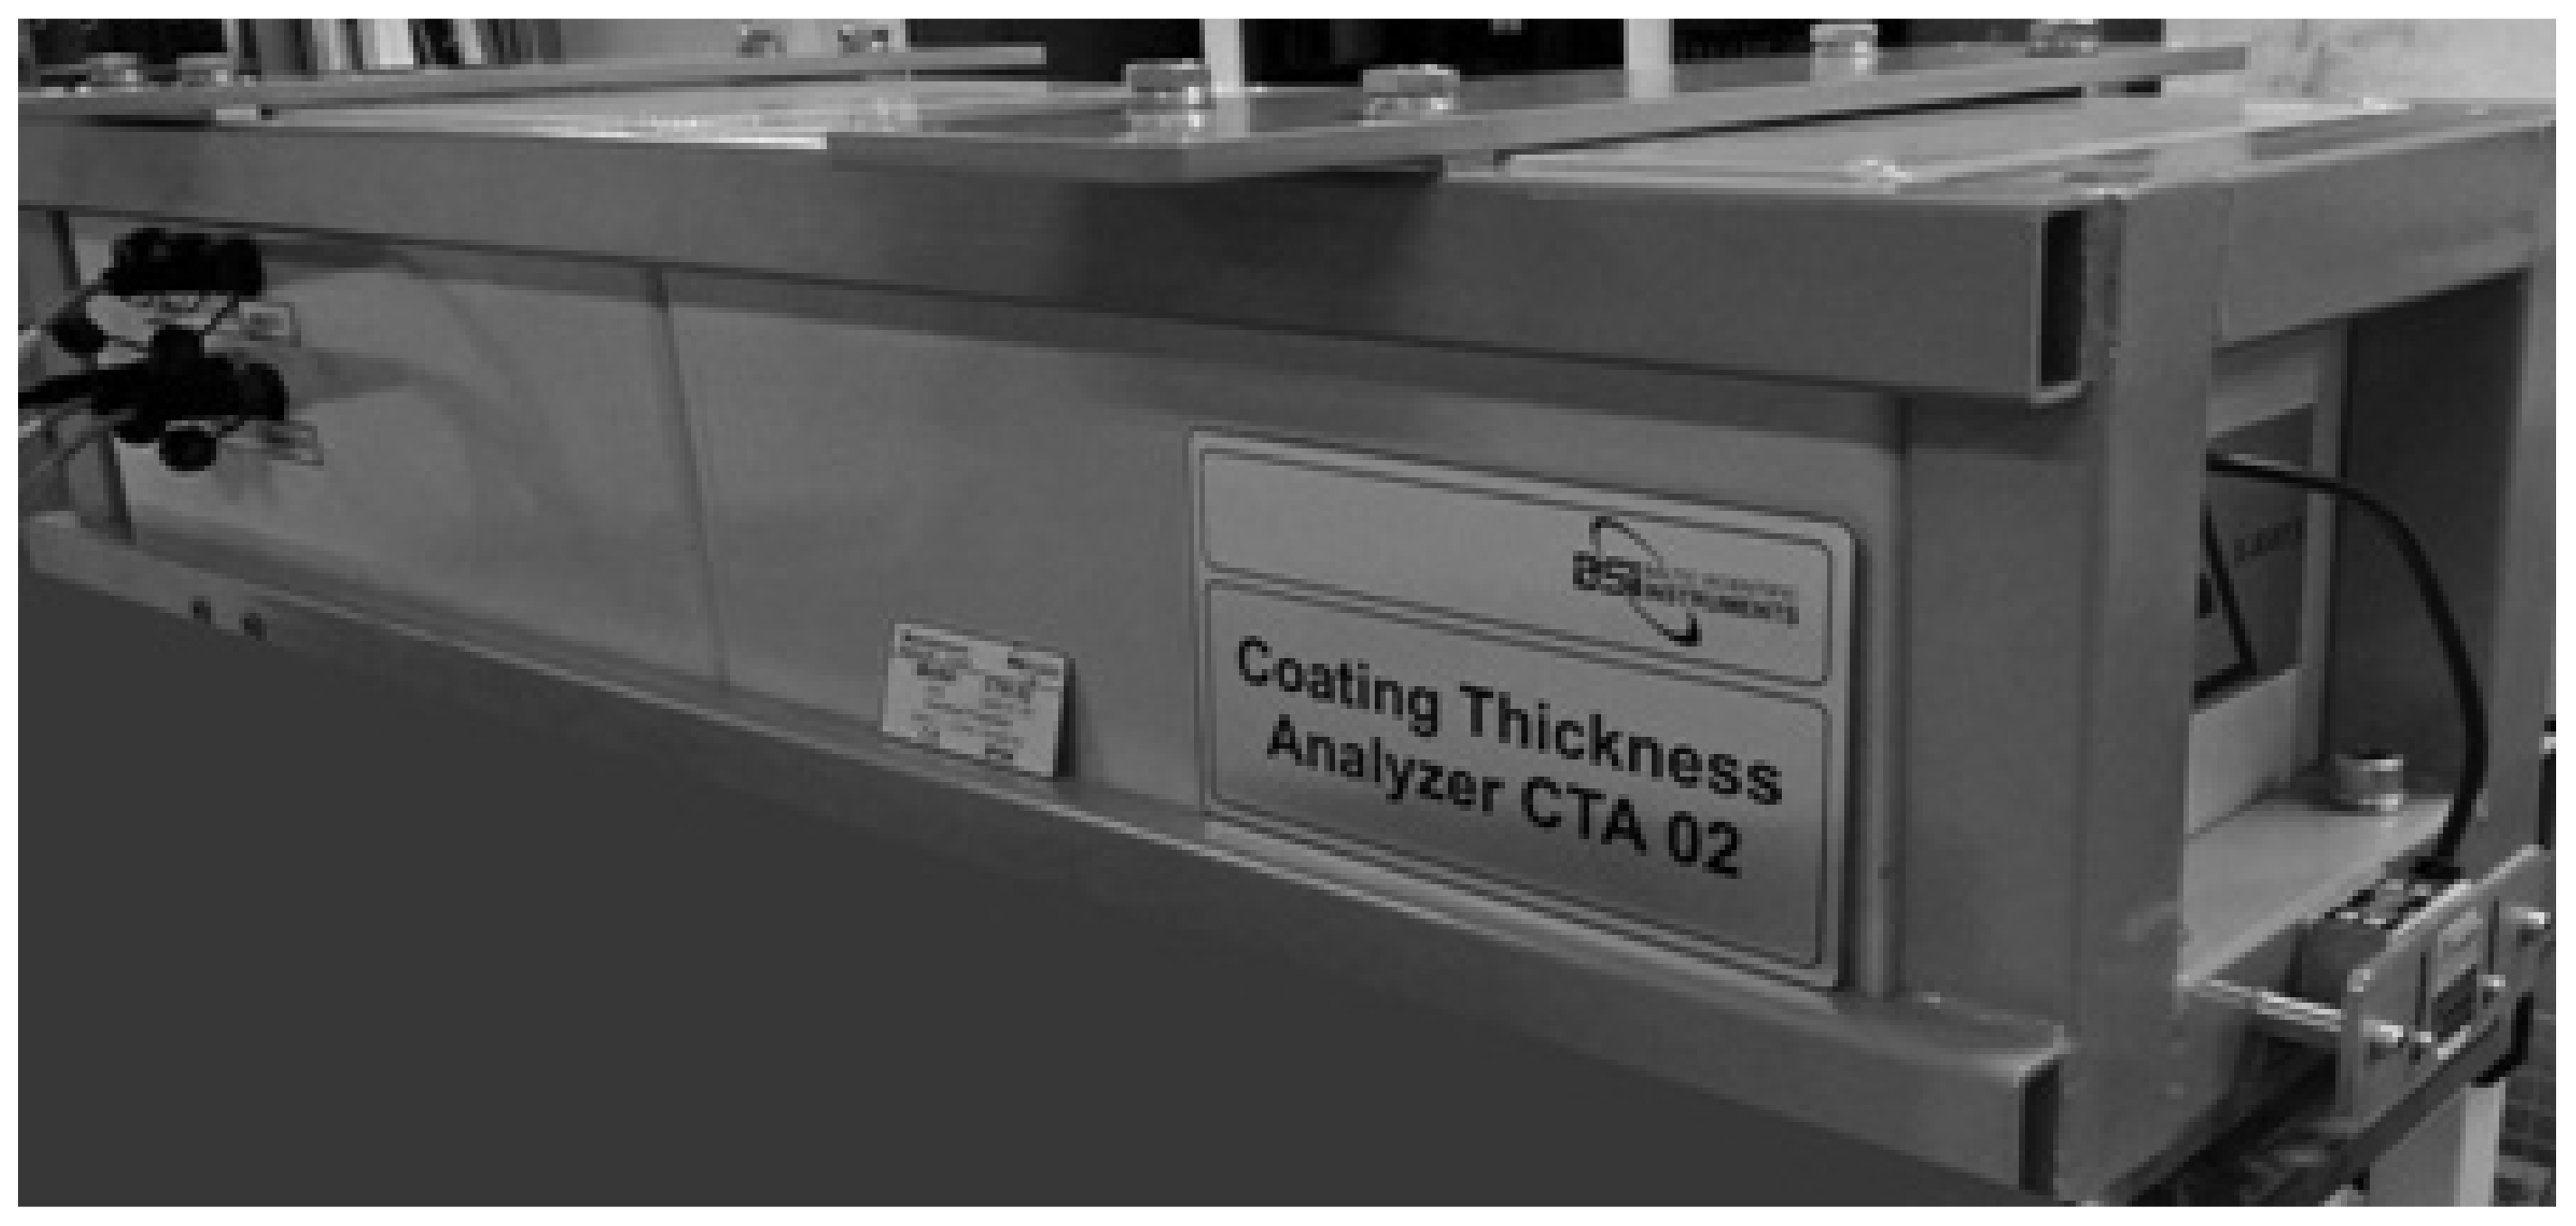
Figure 1. Analyzer consists of two XRF gauges, mounted above and below the steel strip and capable of moving across the process strip, construction system for their suspension and relocation and electronic control unit. XRF gauge for thickness analyzer is designed and manufactured based onCON-X analyzer (Baltic Scientific Instruments, Riga, Latvia) (
Figure 2), which is serially produced for XRF elemental analysis [
10,
11]. Basically, it is a classic design of XRF equipment, but in case of CTA-02 it is specially modified and customized to suit the requirements of the application and the industrial environment.
Accurate online coating thickness analysis is possible only if the results are not affected by variations in external parameters, such as the distance between the material surface and the measuring head, temperature and humidity of the material and industrial environment, surface uniformity and smoothness, etc. Severalfeatures of the analyzer’s intended application required the design of modifications and novelties to the series-production CTA system.
The thickness of the rolled steel strip varies from roll to roll. The distance between the measuring block and the measured material is extremely critical for accuracy of the results. That is why the CTA-02 is provided with specially designed, movable measuring head capable of maintaining a constant distance between the measuring block and the measured material. The distance from the measuring head to the metal strip is controlled and adjusted with the help of a motorized vertical lift stage. It provides precise vertical movement control for lifting or lowering the XRF measuring unit. The stage is equipped with a stepper motor. It is controlled by special controller board that communicates with the embedded microprocessor of the CTA-02. A special optoelectronic displacement sensor is integrated in the measuring system to account for changes in the distance between the analyzer and the steel strip surface. The sensor is used to determine optically the distance to the object and is very sensitive to distance changes. The sensor’s controller board also communicates with the embedded microprocessor and transmits data about the distance to the steel strip. The sensor is mounted at the bottom of the side frame of the analyzer in close vicinity to the strip being measured (
Figure 2).
Additionally, to that the next features were realized in developed analyzer: (1) The analyzer is provided with a special measuring gauge that is held close to the surface (4 mm between the surface of the material and the measuring unit) and specially designed line supplying helium to the measuring space. The reason is that a phosphorus XRF line (P Kα) was chosen for the measurements. The fluorescence yield of P Kα fluorescence is rather low (Z = 15). In order to increase the sensitivity of XRF to elements with low atomic numbers (such as Mg, Al, Si, P and S), XRF measurements is realized in close proximity to the surface of the coating and preferably in a Helium atmosphere to prevent the absorption of P fluorescence by atmospheric Argon; (2) When He flushing is used, the pressure and flow rate of the Helium is very stable so as to avoid fluctuations in the results. A specially designed measuring head with a built-in Helium supply line is used to provide a stable flow of Helium; (3) To ensure optimum conditions for the excitation of the P Kα line, the parameters of the primary X-ray excitation and the design of the tube itself were carefully selected. A low-voltage X-ray tube provides stable primary excitation parameters (low anode voltage and high anode current). The low anode voltage and high current provide the optimal conditions for excitation of the P Kα line, thus ensuring maximal fluorescence yield of the phosphorus line; (4) The fluorescence line from the coating shall not to be too close in energy to any of the fluorescence lines of the substrate. A high-resolution SDD is used in the measuring gauge (silicon drift SDD detector: FWHM resolution 140–160 eV @ 5.9 keV, s/n 20,000:1, area 25 mm2); (5) The high ambient temperatures found in the site of operation require the use of Vortex adiabatic coolers in order to protect the internal components of the analyzer from overheating and provide thermo-stabilization inside the measuring box. Vortex technology maintains the internal temperature within the specified range (below 40°C). All these features provide the ability to measure the thickness of light non-metallic coating (phosphate salt) on a metal substrate (steel).
3. Calibration of the Coating Thickness Analyzer
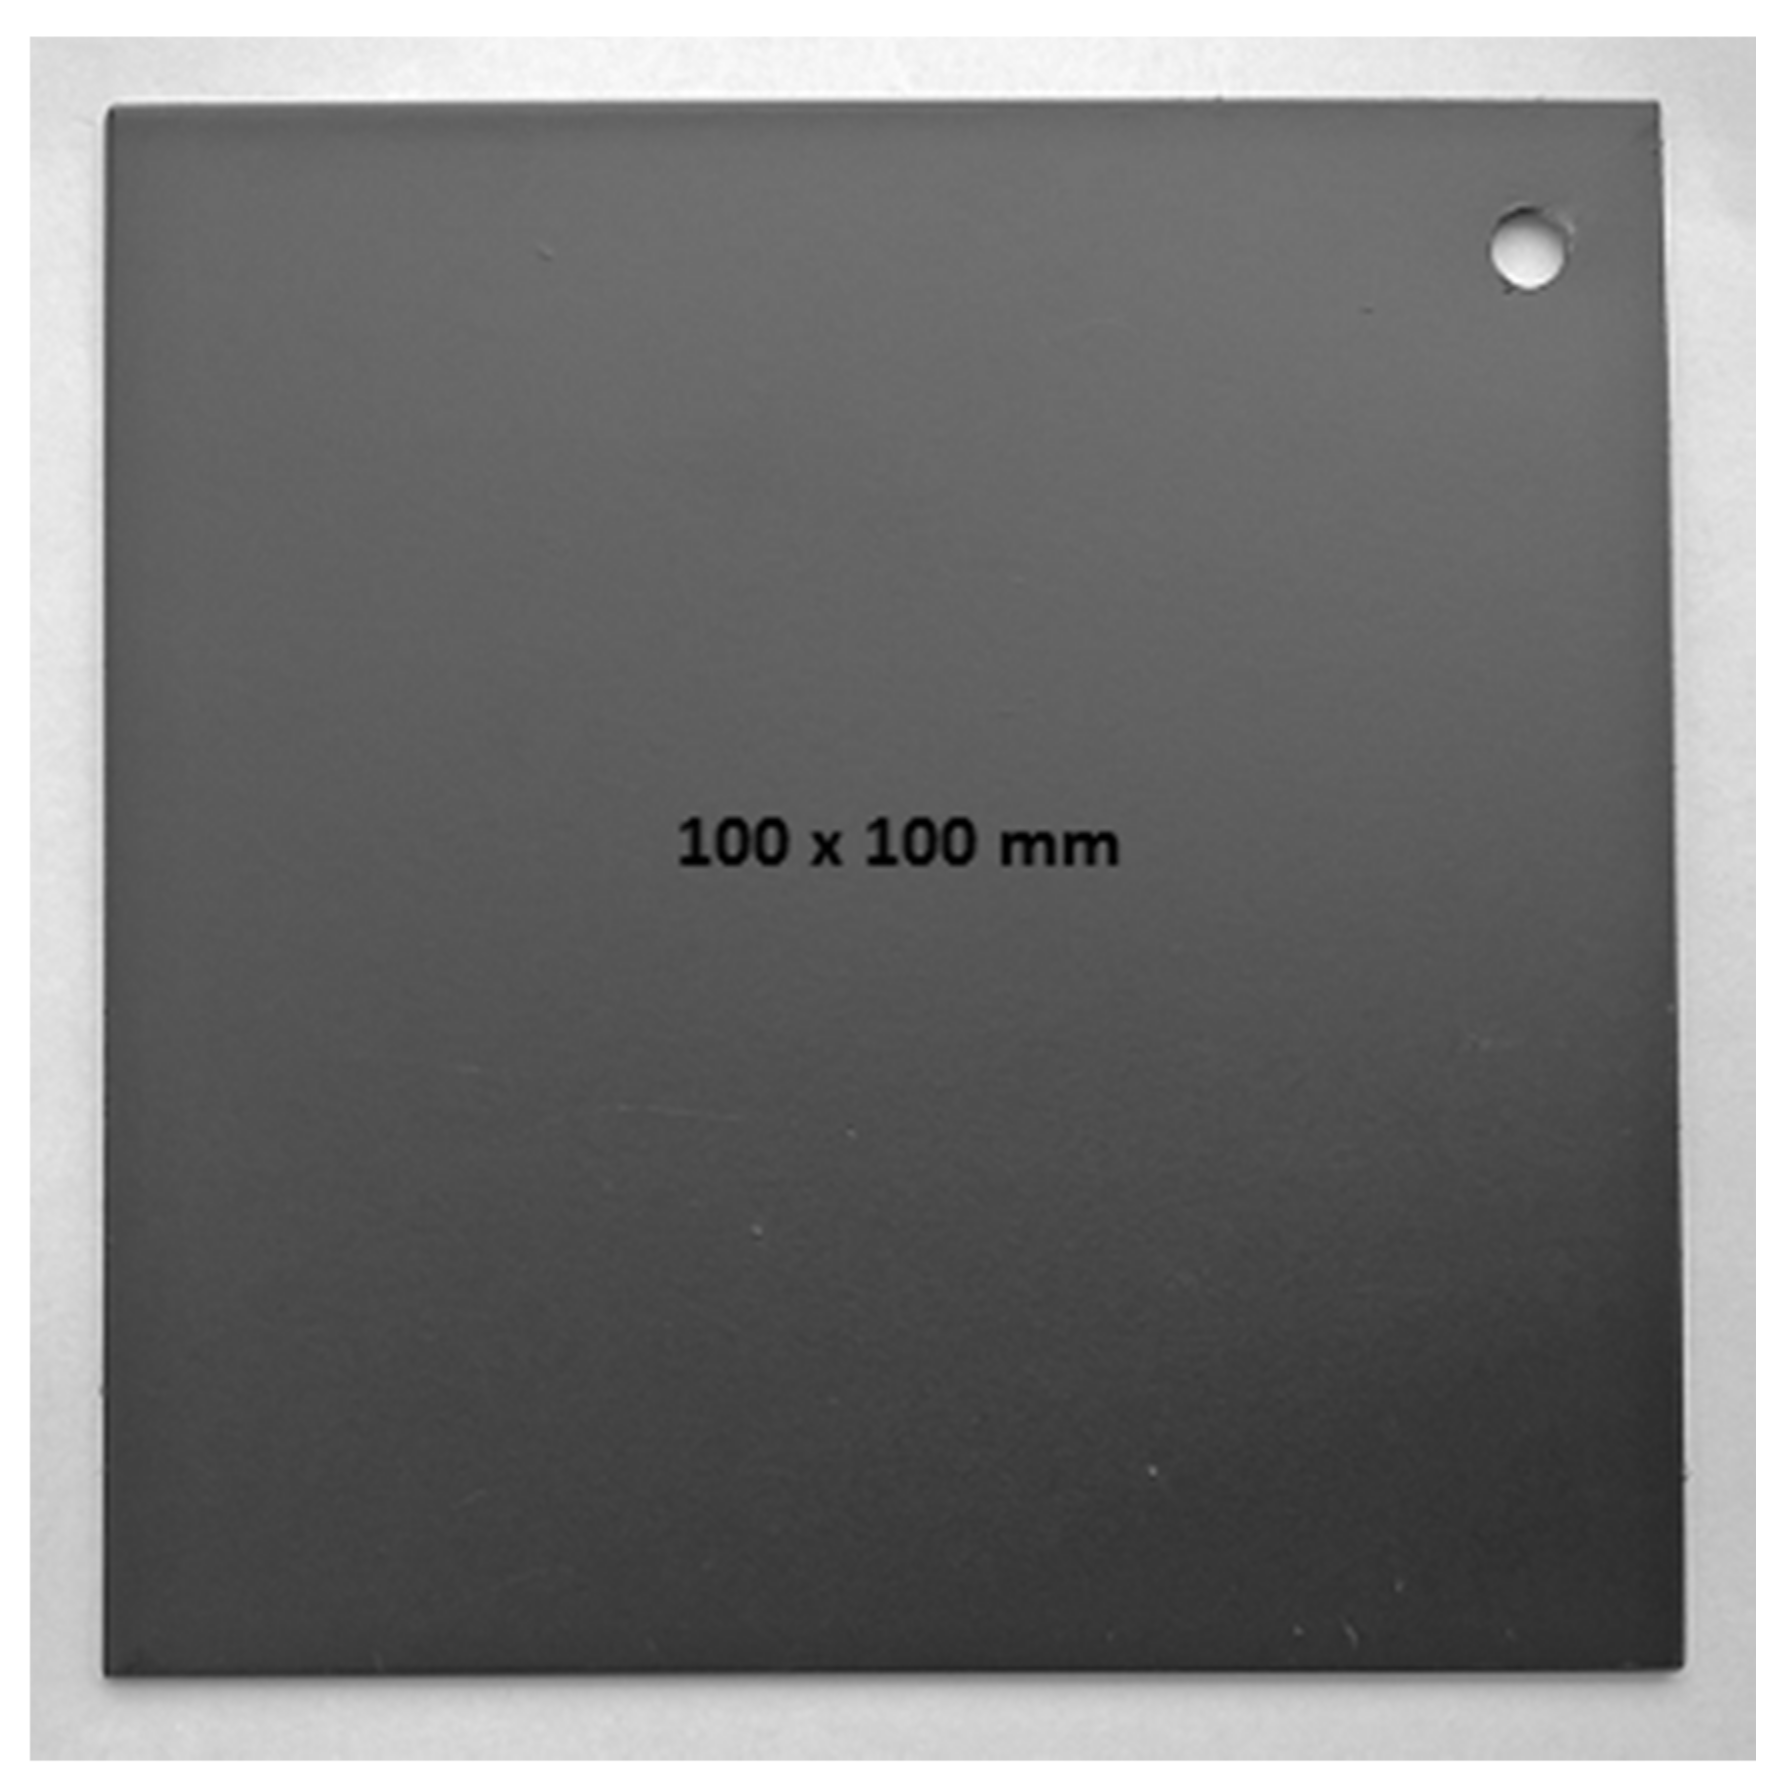
In-house laboratory calibration of the CTA-02 was carried out using secondary calibration samples that covered the range of thicknesses of phosphate film to be measured. The set of secondary calibration samples were provided by the customer. The coating thickness reference values of the samples were reported with the uncertainty of ±5% relative. An example of a calibration sample is shown in
Figure 3.
If the film density and composition does not change, it is possible to determine the thickness of the phosphate coating by measuring the intensity of the emission of the P Kα XRF line. If one of the parameters changes, it is desirable to have an appropriate set of calibration samples and to carry out an individual calibration for each grade of product.
The measurement conditions for the XRF calibration spectra were as follows: X-ray tube anode material: Mo; X-ray tube voltage and current: 7.5 kV and 1900 µA; measurement time: 30 s; distance between the sample and analyzer bottom: 4 mm.
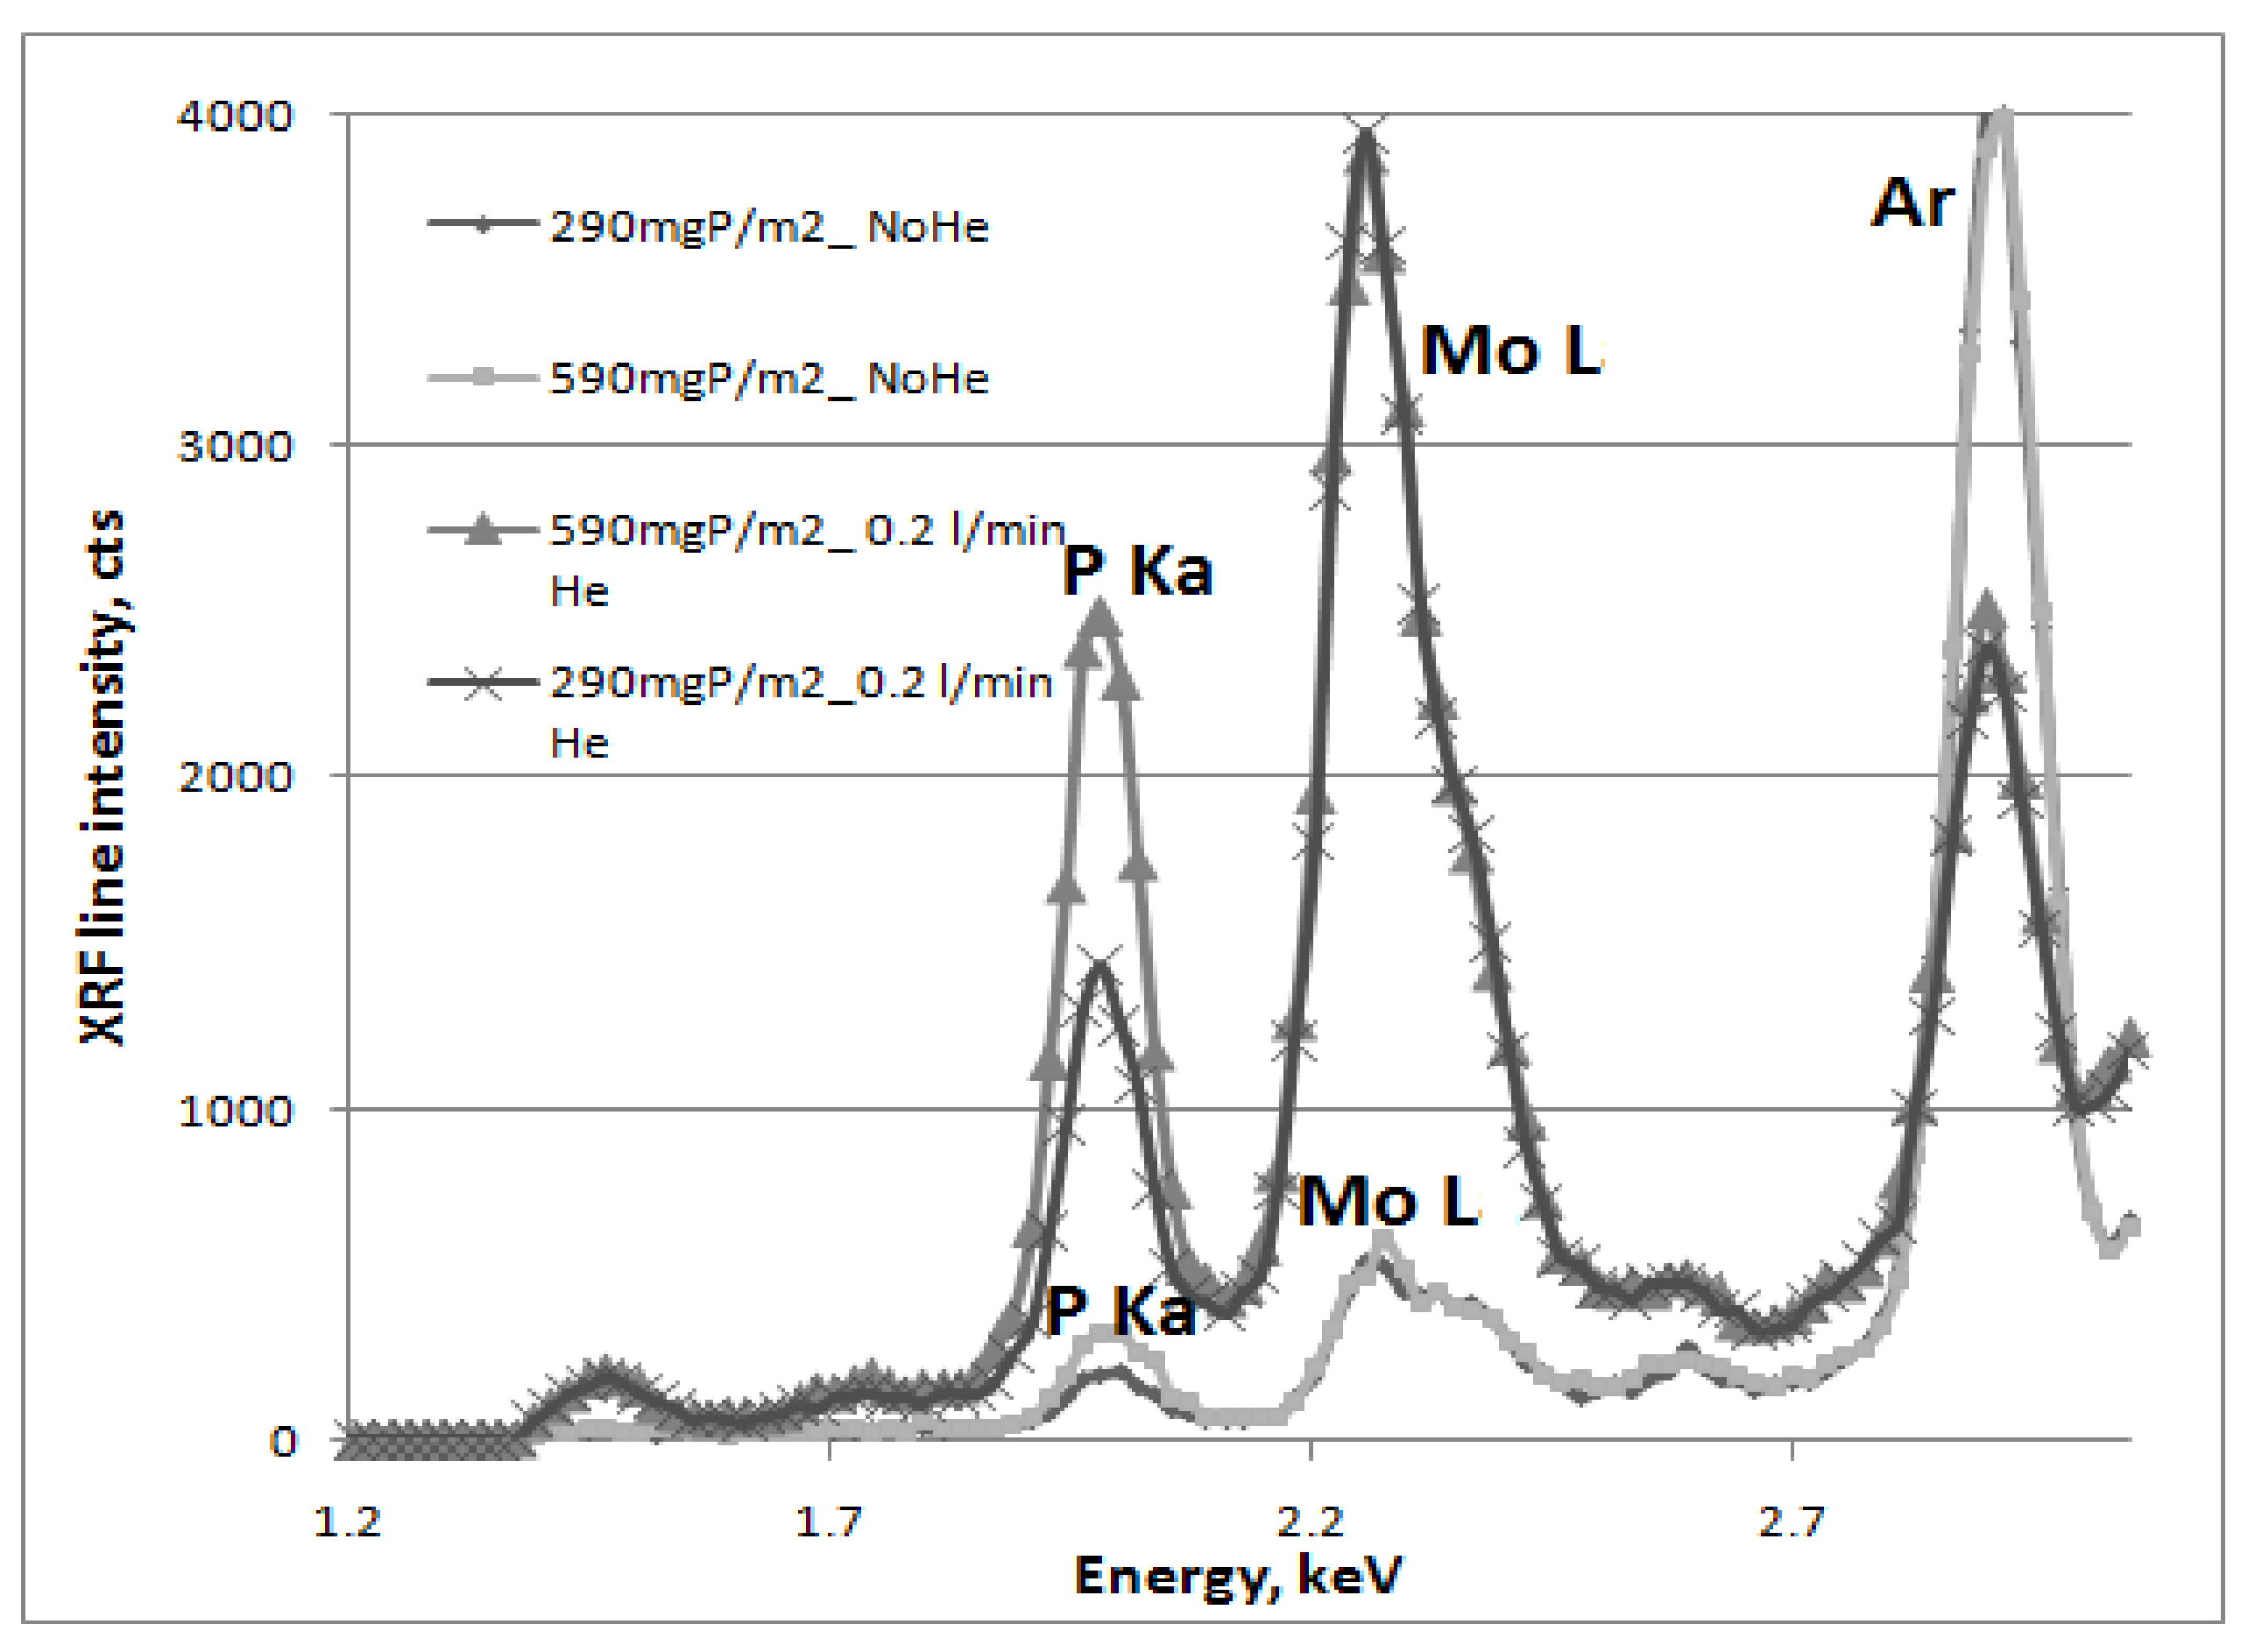
XRF spectra of two calibration samples measured at preset values of the X-ray tube excitation parameters are shown in
Figure 4 as an example. The spectra were measured both in air and using the Helium purge of the measuring space. Helium was used to displace part of the air from the measuring space, which improved the conditions for the excitation and detection of phosphorus line. The CTA-02 is equipped with a specially designed helium purge system that provides a constant flow and concentration of helium in the measuring space. From
Figure 4 it can be seen that the intensity of the phosphorus line grows proportionally to the coating thickness. What is more, in a helium atmosphere, the intensity of the P Kα line is higher than in air and rises with thickness growth more rapidly.
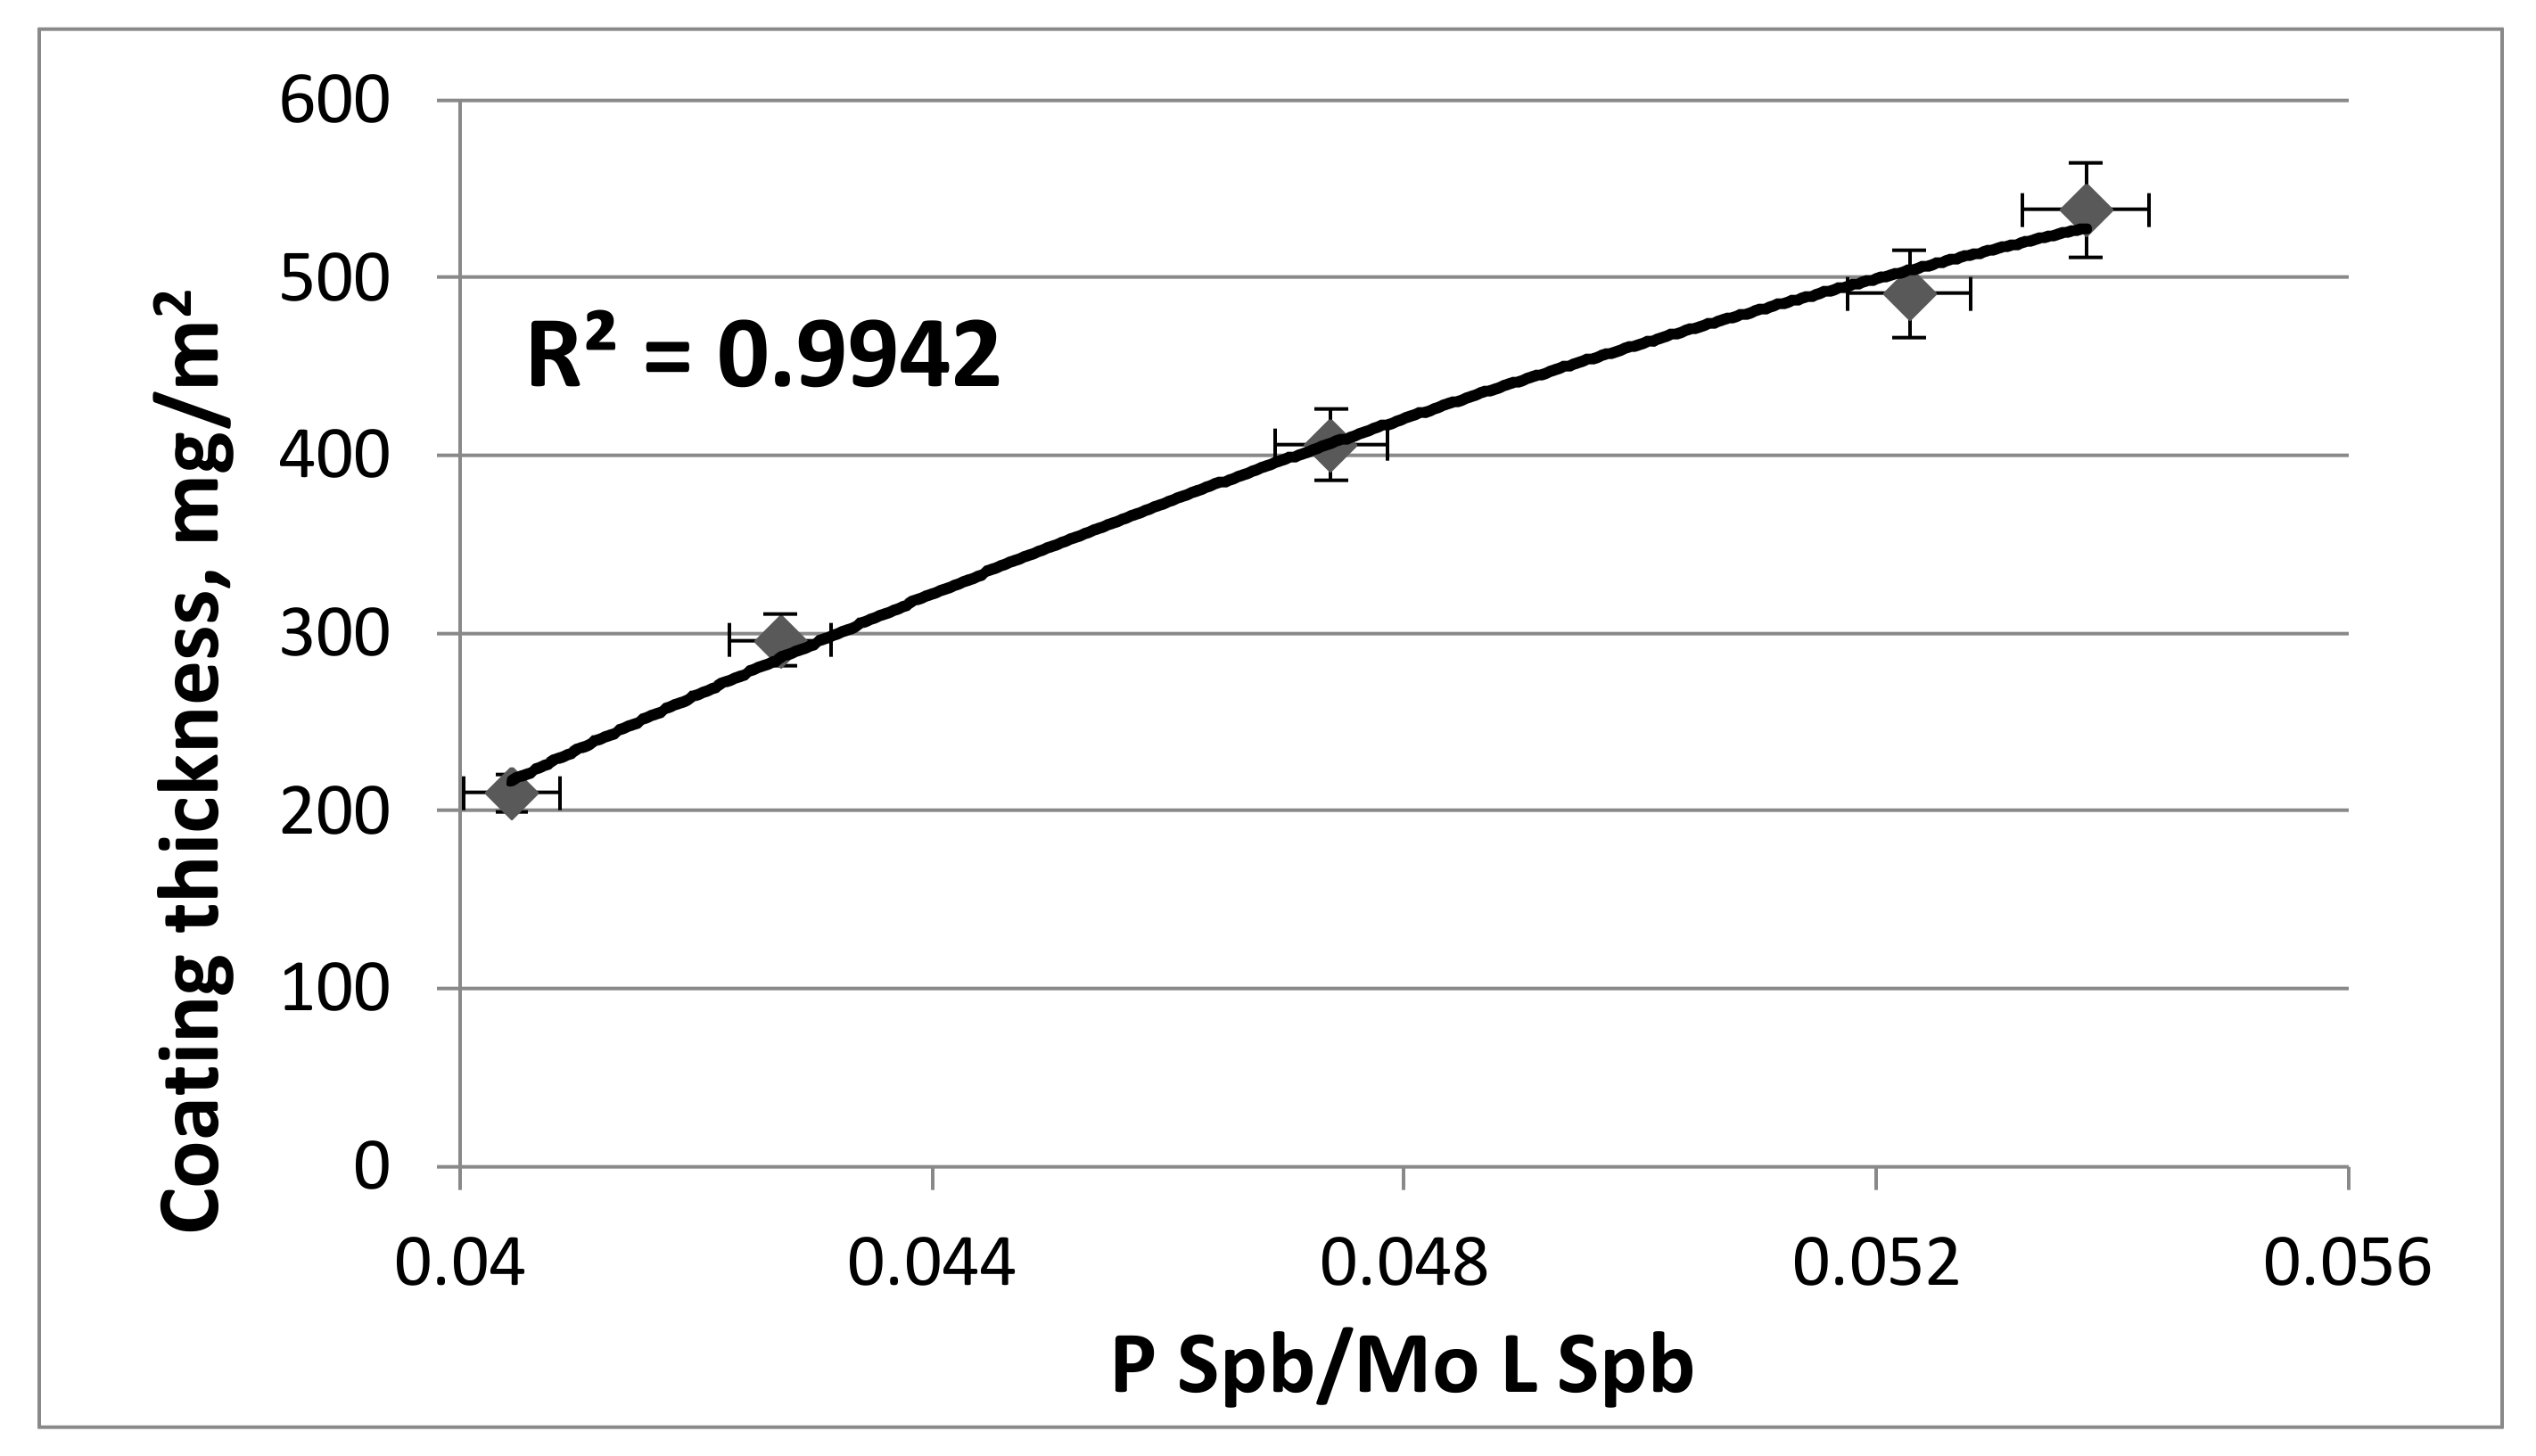
As a calibration parameter we used the ratio of the intensity of the P Kα XRF line to the intensity of Mo L scattered line of the X-ray tube. On the calibration plot (
Figure 5) line intensities are denoted as P Kα S
pb and Mo LS
pb. The ratios approach was used to compensate for small deviations in the measurement conditions (deviation in distance between sample surface and measuring unit or small changes in the helium flow rate) and in spectral statistics.
The calibration curve is shown in
Figure 5. The ratio of the intensities of the P Kα line and the Mo L scatter region is plotted relative to the thickness of the phosphate coating. The parameter (P Kα S
pb/Mo LS
pb) is proportional to the thickness but displays a kind of “saturation” phenomenon (
Figure 5). This behavior has two main causes: self-absorption of the P Kα line in the measured layer [
12] and peak pileup [
13]. These two phenomena lead to a nonlinear response curve that can be fitted to a good approximation with a second-order polynomial curve,
T =
aI2 +
bI +
c, where
T is the thickness of the deposited layer, and
I is the ratio of the intensities of the P Kα fluorescence peak and Mo L scatter region. The intensities are automatically calculated by the program according to a widely known empirical approach to the selection of the region of interest (ROI), which has been described by Carapelle et al. [
5]. The coefficients
a,
b, and
c are calculated by a program using a classical fitting procedure.
The use of the least squares method showed that the polynomial function of second order is the most suitable: the correlation coefficient R2 of the best fit is close to 1, which indicates that the calibration parameters are strongly and positively correlated via a polynomial relationship.
Helium Flow Test
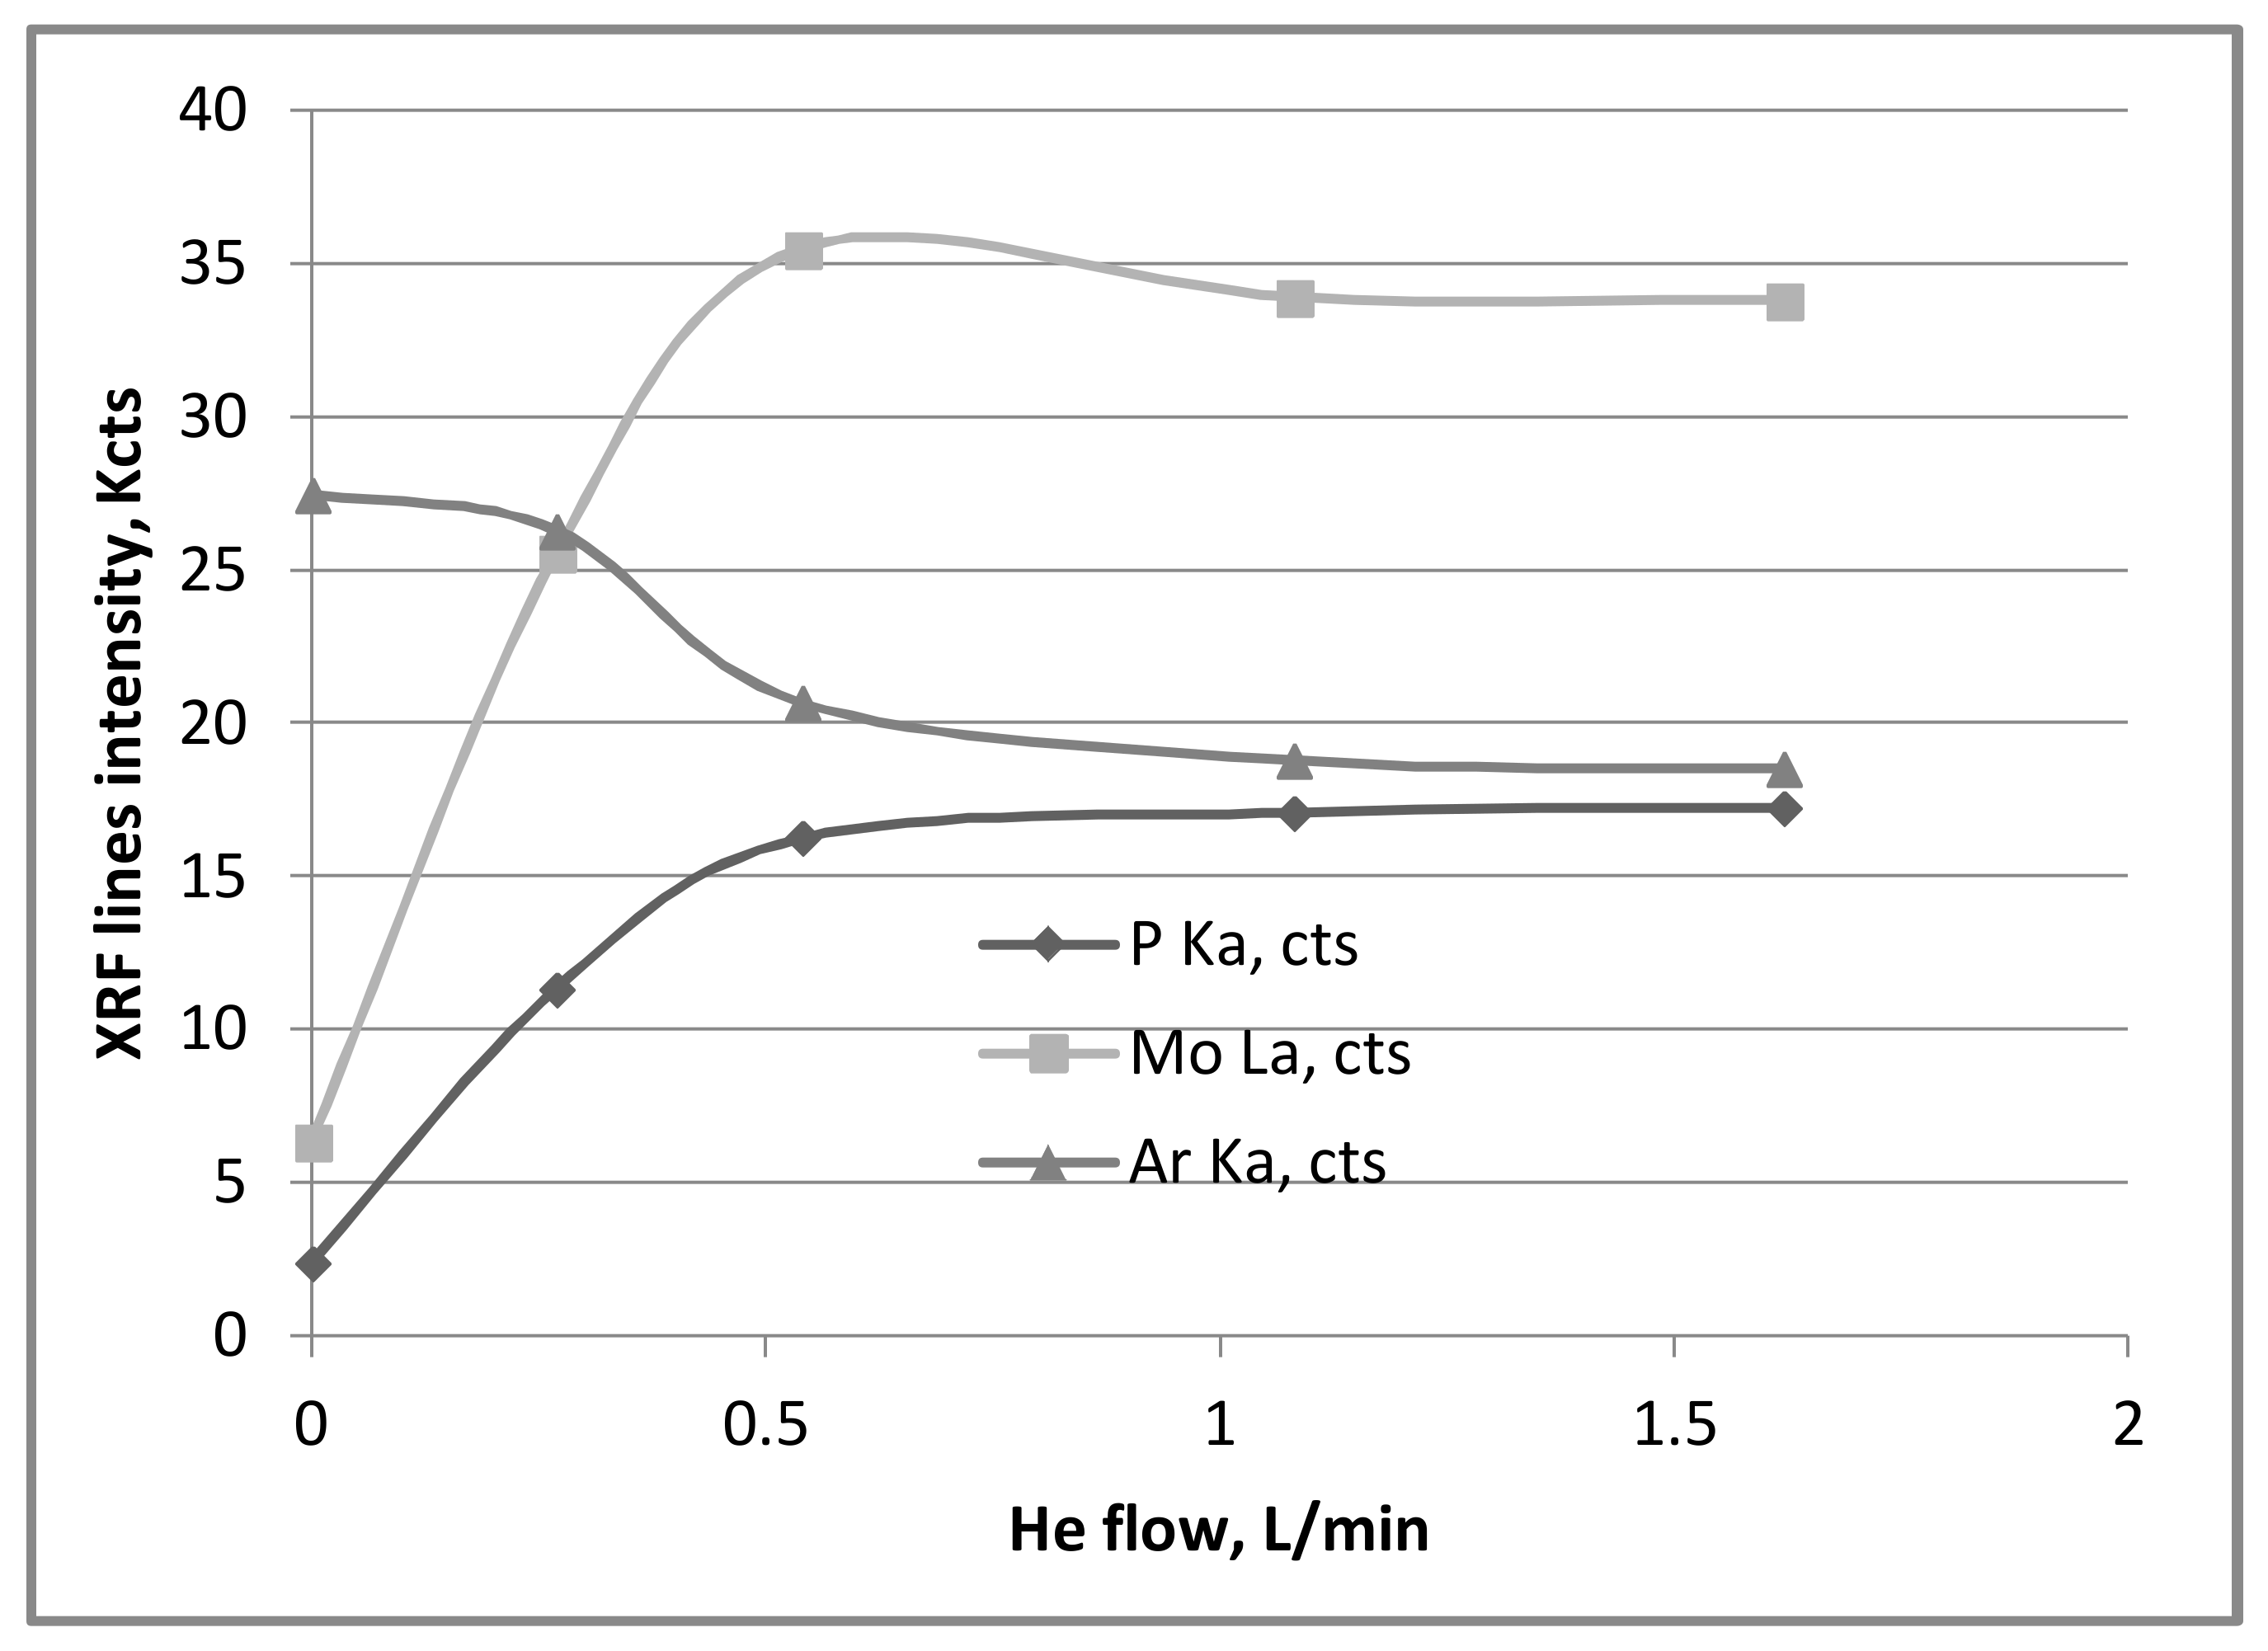
The dependence of the P Kα, Mo L, and Ar Kα XRF line intensities on the helium flow rate is shown in
Figure 6. As expected, the He purge improves the spectral statistics of the P Kα XRF line. At a helium flow rate of about 0.25 L/min the intensity of the P XRF line increases by 3–4 times compared to air. The intensity rises substantially up to a flow rate of 0.5 L/min. Further increases in the helium flow rates lead to the establishment of a dynamic equilibrium in the gas mixture within the measuring space. As a result, the intensity of the phosphorus line almost stops increasing.
The test with helium flow was carried out in static laboratory conditions (samples were maintained at a fixed position). The vortex coolers were disabled during this test. The following statistical parameters of the P Kα XRF line were estimated for a measurement time of 10 s (
Table 1) at different helium flow rates: detection limit (DL), relative standard deviation of counting rate (stdevrel %).
Table 1 shows that the DL estimated for static laboratory conditions is ~3 times lower and the relative standard deviation ~2.5 times lower in the helium atmosphere than in air. These results confirm that the design of the helium supply that is used in the CTA-02 analyzerworks efficiently: it provides a dynamic flow and a stable concentration of helium in the space between the measuring head and the material, which improves the analytical parameters used to determine the thickness of the phosphate coating.
4. Software
The dedicated software ThMeter (v.1.18) is designed for automatic and continuous (24/7) control of two CTA-02 coating thickness analyzers, scanning both sides of steel strip, developing and testing methods for measuring the thickness of new coatings and storing measurement results offline and retrieving them for viewing. The program calculates thecurrent values of the coating thickness, continuously monitors the state of the spectrometers, X-ray tubes and detectors, restores the operating modes in case of equipment failure during the measurement mode, automatically carries outcalibration runs when creating a new measurement method, and exchanges data with the computerlocated in the control room. All data on the current measurements, the operation and calibration modes, the status of all spectrometric equipment, including the state of the X-ray tubes and detectors, are transmitted to the computer in the control room. Commands controlling the analyzer’s movements are received from there (upper level computer). All data are transmitted in the JavaScript Object Notation (JSON) text file format.
5. Pre-Acceptance Test and Factory Acceptance Test, Results and Discussion
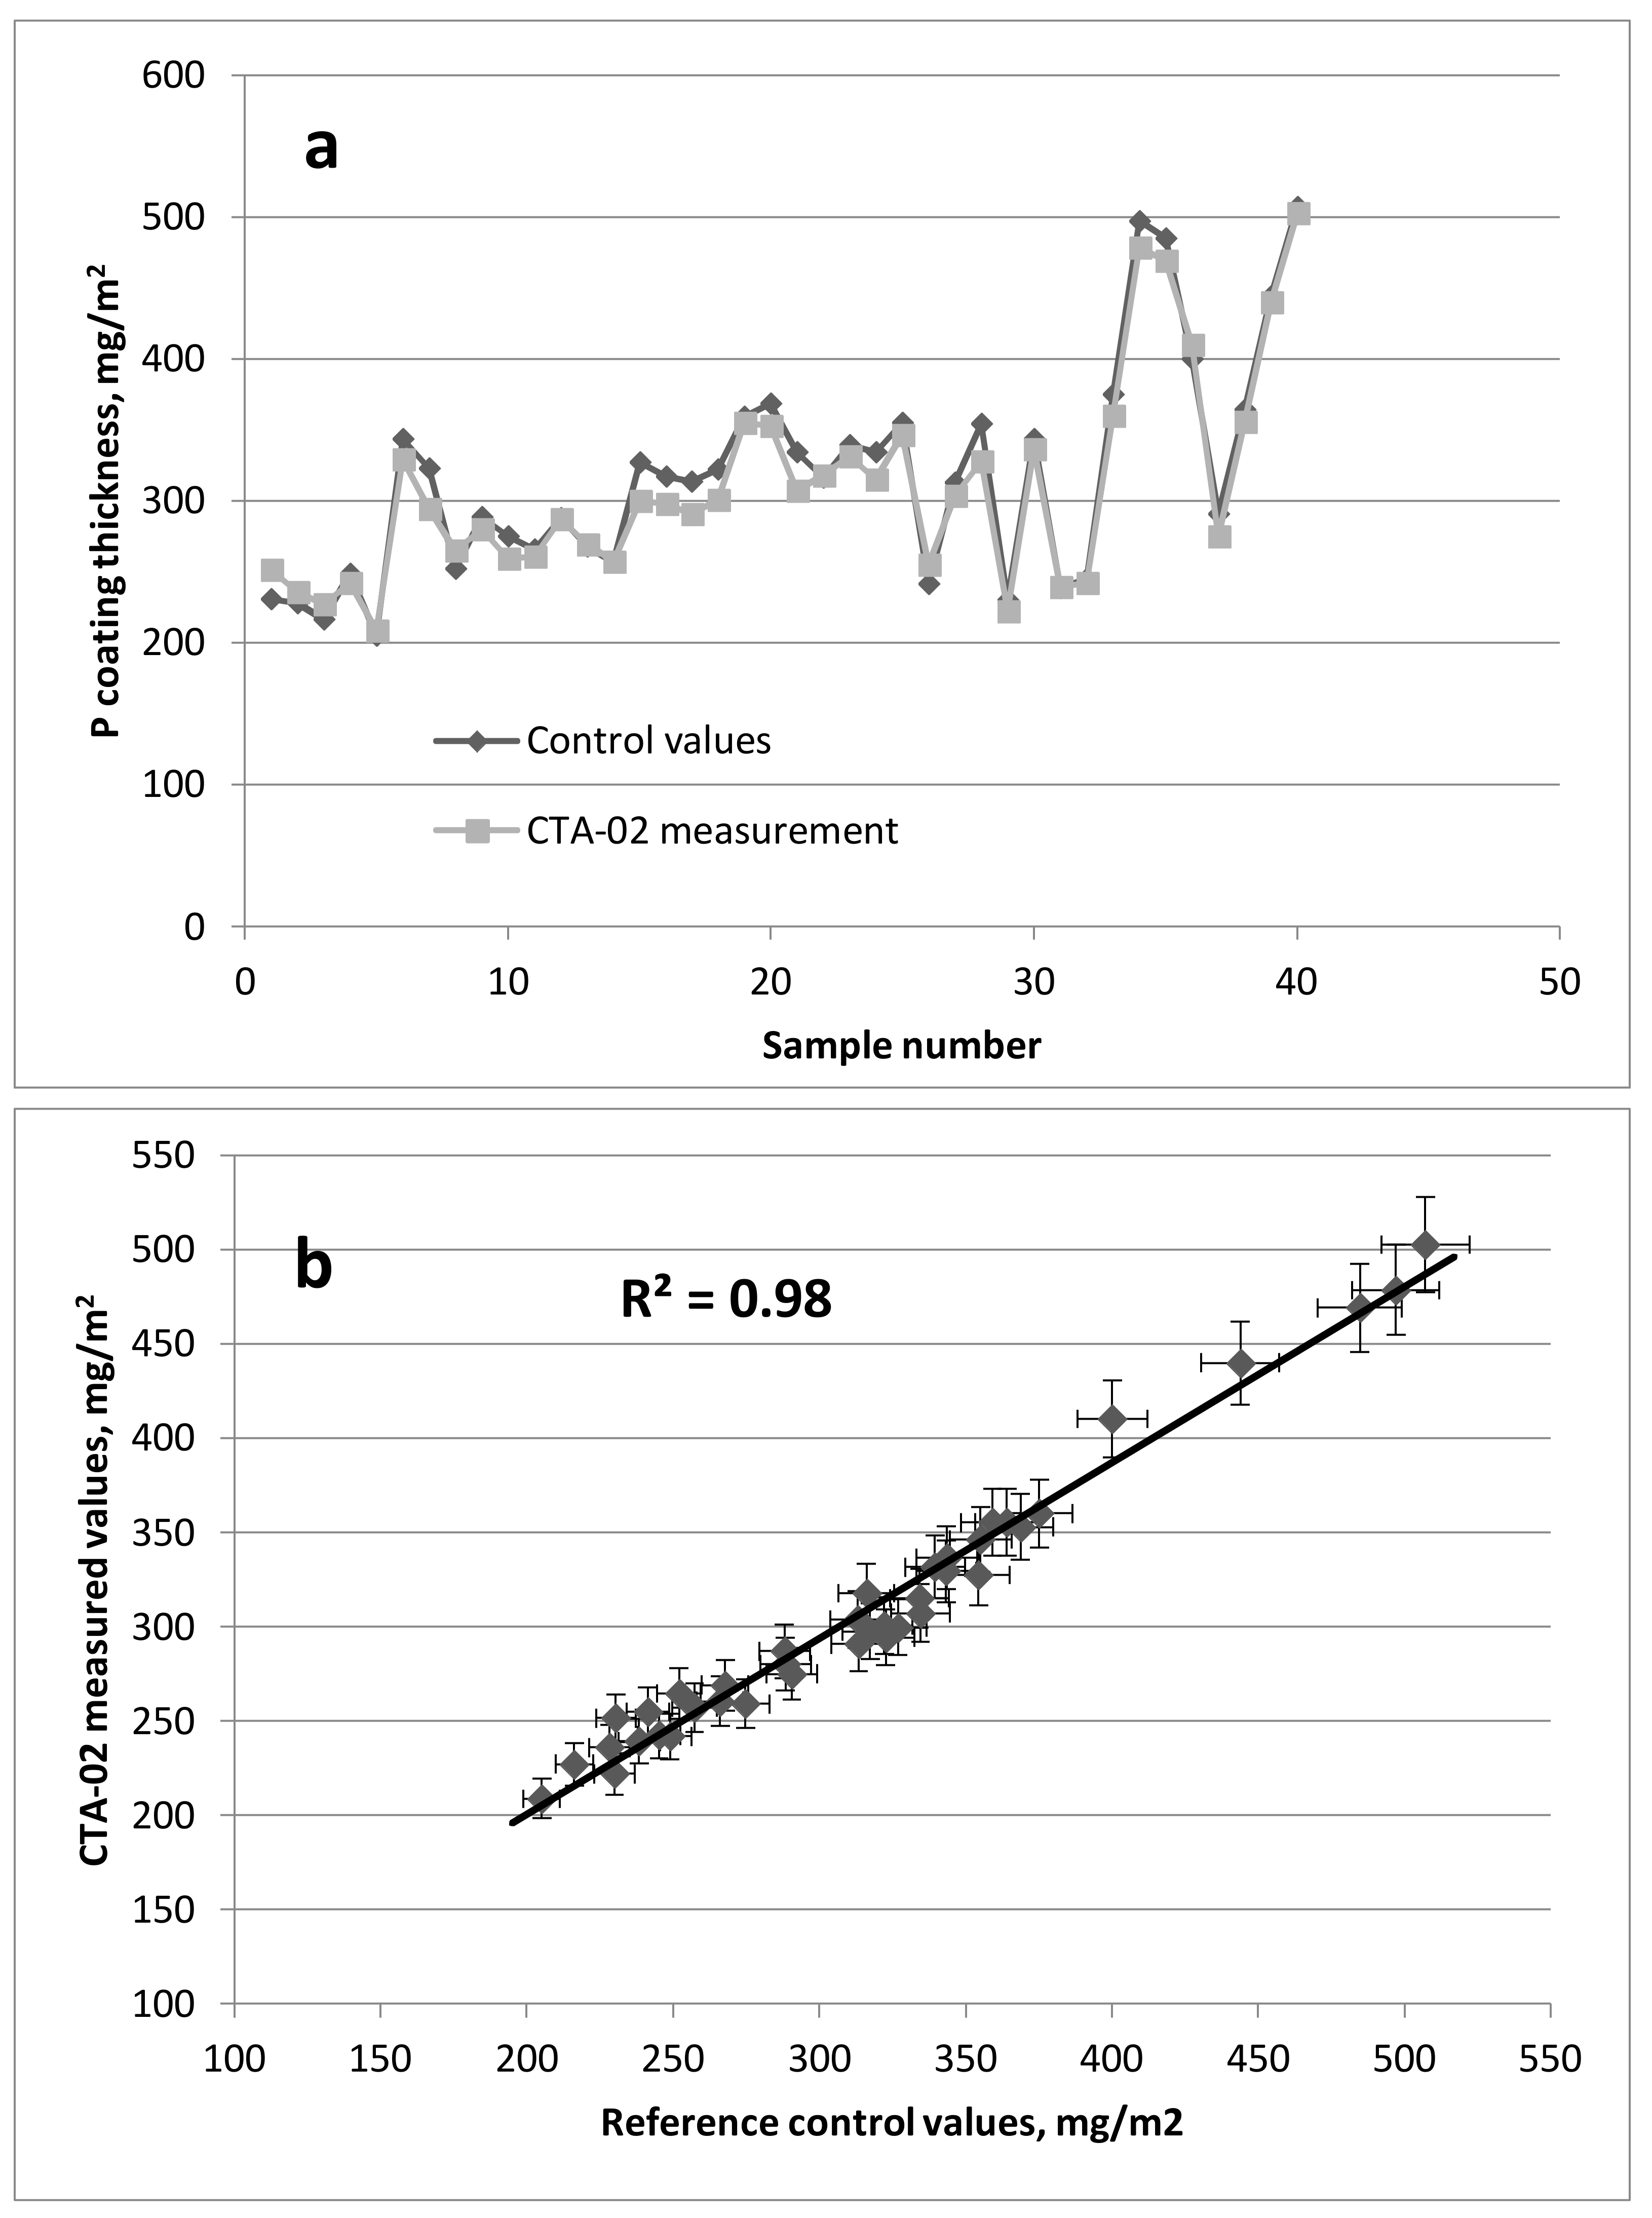
During the Pre-Acceptance Test (PAT) more than 40 control samples of phosphate coatings on steel were tested using pre-calibrated XRF gauges in the XRF applications laboratory of Baltic Scientific Instruments with the participation of the end user. The end user provided the new set of the control samples with known thicknesses of the phosphate film. The values measured with the CTA-02 analyzer were compared to the control values. The accuracy of the cross-check was determined in terms of the root mean square deviation (RMSD) calculated for the entire set of control samples (n = 40). The majority of the values measured during the PAT fell within ±10% relative error, which meets the requirements of the end user.
The CTA-02 measurements from the cross-check are plotted together with the control reference values in
Figure 7a,b.
A Factory Acceptance Test (FAT) of the CTA-02 analyzer operation was performed during full-scale operation in the following way. Two XRF gauges were attached to suspension and relocation frames mounted on rails that allow the gauges to move across a continuously moving steel strip. The analyzer consists of two gauges, one mounted above, and the other below, the steel strip. The gaugesconsider the synchronization between the movements of the strip and the measuring head, while changes in distance or thickness of the steel strip are checked by the embedded displacement sensor and are automatically compensated. Analysis can be performed in either ‘skating mode’ or step-by-step mode, revealing the distribution of coating thickness across the entire width of the strip. Coating thickness analysis of one measured step-by-step band can be available in just 10 s, depending on the application.
The CTA-02 analyzer is provided with a self-contained automatic calibration device. The device is equipped with a specially designed sample holder. Both gauges can be commanded from the control room to move along the rails to a specially configured calibration space away from the production line.
The average phosphate thicknesses for rolls of coated steel, measured by the CTA-02 analyzer, were compared to laboratory results of random control samples. The comparison was carried out during 3 days of continuous operation of the production line. The measurement accuracy shown during long-run factory acceptance test was 10–15%.
6. Conclusions
The capabilities of the CTA-02 analyzer for continuously and automatically analyzing thethickness of phosphate coatings of moving strips of rolled steel during production was demonstrated during the PAT and long-term Factory Acceptance Test in full-scale operation at a large steel plant. The XRF method capabilities for analysis of phosphate coatings on steel were demonstrated for the first time. This application became possible due to specially designed, movable measuring head capable of maintaining a constant distance between the measuring block and the measured material. The distance from the measuring head to the metal strip is controlled and adjusted with the help of a motorized vertical lift stage. Another feature, as a specially designed line, supplies helium to the measuring space, also provided the possibility to measure the thickness of a light non-metallic coating (phosphate salts) on a moving metal substrate (steel).
The CTA-02 analyzer showed stable operation and provided process engineers with reliable results in real time during the entire duration of the tests. The measurement accuracy shown during long-run factory acceptance test was 10–15%. In summary, the CTA-02 XRF coating thickness analyzer can meet the needs of general metal finishers, who are concerned with corrosion resistance and wear resistance, as well as the automotive industry with its need for analysis of coating passivation or the aerospace industry, which has the added concern of corrosion resistance and lubricity at high temperatures.


