Article

Self-Stratification of Ternary Systems Including a Flame Retardant Liquid Additive

1
University of Lille, ENSCL, CNRS, UMR 8207, UMET, Unité Matériaux et Transformations, F 59000 Lille, France
2
University of Lille, CNRS, UMR 8181, EA CMF-4478/Unité de Catalyse et de Chimie du Solide, F 59000 Lille, France
*
Author to whom correspondence should be addressed.
Coatings 2018, 8(12), 448; https://doi.org/10.3390/coatings8120448
Submission received: 3 November 2018 / Revised: 3 December 2018 / Accepted: 5 December 2018 / Published: 6 December 2018
(This article belongs to the Special Issue Advances in Organic and Polymeric Coatings )

Abstract

:
Particular coating compositions based on incompatible polymer blends can produce coatings having complex layered structures after film formation. The most traditional approaches to their structural modification are the introduction of additives (extenders, inorganic pigments, surface active agents, etc.). As minor additives, some are capable of substantially accelerating the phase separation process with a moderate or negligible influence on the composition equilibrium of solutions. In contrast, in order to be effective, some have to be introduced in significant amounts, thereby substantially changing the resulting distribution of components through the film. Up to now, most of the liquid additives that have been tested destabilized the solutions while impacting the layering process. In this work, two phosphorus based liquid fillers have been introduced (at 2.5 and 5 wt.%) in a partially incompatible polymer blend based on a silicone resin and a curable epoxy resin to fire retard a polycarbonate matrix. Self-stratification was evidenced by microscopic and chemical analyses, flammability by Limiting Oxygen Index (LOI) and UL-94 tests, fire performances by Mass Loss Calorimetry and thermal stability by using a tubular furnace and ThermoGravimetric Analysis. The ternary compositions including 5 wt.% of additives exhibit the best stratification and excellent adhesion onto polycarbonate. Improvements of the fire resistant properties were observed (+7% for the LOI compared to the virgin matrix) when a 200 µm wet thick coating was applied, due to reduced flame propagation and dripping.

1. Introduction

In the field of coatings science, significant improvements have been noted in properties such as chemical and fire resistance, antifouling, corrosion protection, flexibility and impermeability by using new approaches, such as the application of inorganic/organic hybrid coating systems, self-stratifying coatings, and so on [1,2,3,4,5]. These properties depend on the polymer selected as the bare resin of the formulation. Coatings in the industry are complex multilayer systems that must be designed to possess specific properties: the air-coating interface has to protect the underlying coatings against abrasion, chemical/solvents and UV-light, and to provide excellent impact resistance. The intermediate coating provides color, special effects and properties such as flame retardancy. Finally, the primer promotes adhesion to the substrate and protects against molecular diffusion (and corrosion in the case of a steel substrate). Each coating has a specific purpose; however, the successive application of multiple coatings is time consuming and leads to increased expenses as well as potential drawbacks such as, for example, poor interfacial adhesion.
During paint application and film formation, a polymer solution simultaneously undergoes mass and heat transfers, surface phenomena and sometimes also chemical reactions, especially in the presence of a two-component system. Phase separation of binders, from an initially constituted homophase solution, can occur under certain conditions leading to self-stratification, that is, to the formation of non-homogeneous in-layer coatings during after film formation (Figure 1). In addition, in the presence of reactive systems, further reactions like oxidation or crosslinking (e.g., two-component epoxies and urethanes) are required to generate a cross-linked film of higher molecular weight. During the reaction, the viscosity, density, and the modulus of elasticity increase due to an increase in the molar mass and crosslinking. Besides interfering with the self-stratifying process, it allows the formation of a harder primer, less flexible and much less susceptible to damage from chemical, weather or UV rays [6,7].
Besides polymer/polymer ratio and curing reaction, heterophase polymer structures are controlled by many process parameters in commercial coating compositions. The most important ones are the presence of fillers, the solvent properties and the processing conditions (application method and baking temperature). In particular, the incorporation of inorganic pigments, surface additives (polymer or oligomer surfactants), extenders or other types of fillers often interfere with the layering process. Most of these additives have a rather negative effect on the phase separation between two binders, and do not allow the development of sufficiently interesting properties compared to those of conventional multilayered systems. In many cases, liquid fillers (wetting, levelling, anti-flotting, surface active or dispersing agents) appear to impair the stratification process [8,9,10,11]. As an exception, some silicone or fluorine-containing oligomers added in minor amounts were proven to substantially accelerate the phase separation process with a moderate or negligible influence on the solutions equilibrium [9]. No previous study of the addition of a consequent amount (>2 wt.%) of a functional liquid additive in self-stratifying compositions has been reported. In this work, the aim was to design a self-stratifying coating on a polycarbonate substrate, incorporating a liquid flame retardant (FR) additive.
On the past few years, phosphorus-based flame retardants have been increasingly used as an alternative to halogen-based systems due to environmental considerations. This has generated active research in identifying novel phosphorus based FRs and also possible synergistic combinations with other elements, such as nitrogen for example [12]. Some phosphorus-containing compounds, besides their FR effect, have proven to be of great value due to their low toxicity and low smoke-emission during combustion [13]. In particular, arylphosphates have been proven to be suitable halogen-free FRs in blends containing polycarbonate (PC) (particularly in PC/ABS blends) [14,15].
In this work, film forming compositions based on a partially incompatible polymer blend, including a curable epoxy resin and a silicone resin in combination with a phosphorous-based liquid fire retardant filler are considered [16]. Two liquid fire retardant additives were tested: bisphenol-A-bis(diphenyl phosphate) (BDP) and resorcinol bis(diphenyl phosphate) (RDP). The objective was to form thin flame retardant films which spontaneously self-layer after application of one single formulation.

2. Experimental

2.1. Materials

On the basis of previous results [16], two commercial resins and a curing agent were selected, respectively: an epoxy (Bisphenol-A epoxide from Sigma-Aldrich, St. Louis, MO, USA, equivalent weight: 172–176, 100% solids), a silicone (a phenyl branched resin containing 6% of hydroxyl group from Dow Corning, Seneffe, Belgium) and a polyamine (diethylene triamine (99%), Sigma-Aldrich).
m-Xylene (99%) and butylacetate (BuAc, ≥99.5%) purchased from Sigma-Aldrich, were chosen as solvent and used without any purification.
Two phosphorus based liquid FRs, that is, bisphenol-A bis(diphenyl phosphate), Fyrolflex BDP, 8.9% of phosphorus and resorcinol bis(diphenyl phosphate), Fyrolflex RDP, 10.7% of phosphorus were purchased from ICL-Industrial Products (Amsterdam, The Netherlands) and were incorporated as additives in various amounts (2.5 wt.% and 5 wt.%).
Transparent polycarbonate plates (Lexan, 1mm-thick for microscopic analyses and 3 mm-thick for fire testing) were supplied by Polydis (Ligny Le Chatel, France).

2.2. Coatings Formulation and Application

Resins were separately dissolved at 30 wt.% in a blend of BuAc:xylene (1:1), mixed and then stirred together at a 1:1 ratio by weight (epoxy:silicone). Liquid additives were incorporated into the epoxy medium for 10 min at 300 rpm before the combination with the second resin. Finally, the curing agent was thoroughly added drop by drop, with respect to the epoxy number, and mixed for 3 min before the application of the thin film by spraying (air pressure of 200 kPa). The nominal wet film thickness was set at 200 µm. Coatings were dried at 20 °C for 24 h in an oven and then cured for 2 h at 110 °C.

2.3. Characterization of Film Properties

Microscopic analyses coupled with X-ray mappings were used to detect the potential formation of stratified layers and to determine the film thickness. Fire behavior and thermal stability of the samples were investigated using Limiting Oxygen Index (LOI), UL-94 Mass Loss Calorimetry (MLC) and ThermoGravimetric Analysis (TGA). The specimens and residues obtained were analyzed either by microscopic analyses coupled with X-ray mapping or by using a numerical microscope. To complete the evaluation of the film properties, cross-hatch testing was used to quantify the adhesion.

2.3.1. Microscopic Analyses

Coatings were cut in liquid nitrogen to allow the analysis of their cross-section and the determination of their thickness by Scanning Electron Microscopy with X-Ray mapping (SEM-EDX). Analyses were respectively carried out at 5.0 kV, 20 µA and 13.0 kV, 25 µA using a Hitachi S4700 (Tokyo, Japan) with field emission gun. Carbon metallization was carried out before any characterization.
Numerical pictures of sample residues were performed using a microscope VHX-1000 supplied by Keyence (Osaka, Japan, ×20). The microscope creates a 3D image based on automatically captured images.

2.3.2. Classification of Stratification

The degree of layering was measured following the guidelines developed in the Brite Euram Project [8]. The degree of stratification was classified from 1 to 4 according to the microscopic characterization of the cross-section of the coatings. From this ranking, a type I pattern corresponds to a perfect stratification (e.g., two well distinct and homogeneous layers), a type II pattern to an homogeneous concentration gradient between the two resins through the film thickness, a type III to the formation of spherical particles rich in one of the resins dispersed in a medium enriched with the other resin, and finally a type IV corresponds to the presence of large islands composed of a majority of one of the resins.

2.3.3. Adhesion Testing

Adhesion rating of the coating on polycarbonate was carried out following the ASTM D3359-97 standard [17]. An Elcometer 107 Cross Hatch Cutter was used to perform the test: a pressure-sensitive tape is applied and then removed over cuts made in the film, and according to the specimen obtained, adhesion is rated from 0B to 5B, 0B corresponding to the worst adhesion (no coating left on the substrate) and 5B to the best one (the edges after the test are completely smooth, and none of the squares of the lattice is detached).

2.3.4. Fire Testing

A FFT (Fire Testing Technology) mass loss calorimeter (MLC) was used to perform the experiments following the procedure defined in ASTM E906 [18]. Specimens measuring 100 × 100 × 3 mm3 were exposed in horizontal orientation to an external flux of 50 kW/m² and a forced ignition. The selected flux corresponds to the common heat flux generated in fully-developed fires. The equipment can be compared to the one used in oxygen consumption cone calorimetry (ASTM E-1354-90 [19]), except that a thermopile is set in the chimney in order to obtain the heat release rate (HRR) instead of using the oxygen consumption principle. The distance sample-heater was set to a distance of 35 mm from the cone base, on a ceramic backing board. The following parameters were estimated: heat release rate (HRR) as a function of time, time to ignition (TTI), peak of heat release rate (pHRR) and total heat release rate (THR). The experiments were carried out three times to ensure the repeatability of the results, and the data reported are the most representative of the three replicated experiments. Values were found to be reproducible within a relative standard deviation of ±10%.
Two vertical fire tests were used to complete the evaluation of fire performances on barrels (100 × 10 × 3 mm3): Limiting Oxygen Index (LOI) and UL-94 test. LOI, corresponding to the minimum oxygen concentration needed to support the candle like combustion of plastics, was measured using a Fire Testing Technology instrument following the standard oxygen index test ISO 4589-2 [20]. The UL-94 test was performed according to IEC 60695-11-10 standard [21], that is, in a vertical position (the bottom of the sample is ignited with a bunsen burner). This test provides a qualitative classification of the samples, from V0 (the best ranking, when burning is short and there is no dripping of flaming particles) to NC (non-classified, i.e., with a burning of more than 30 s or up to the holding clamps at 100 mm from the ignition point).

2.3.5. Thermal Stability

Thermogravimetric Analysis (TGA)

A Discovery TGA from TA Instrument was used to carry out thermogravimetric analyses. 10 mg samples (liquid materials or dry grounded coatings samples which have undergone the same heat treatment as the coatings) were thermally decomposed in alumina crucibles under a nitrogen atmosphere. They underwent an isotherm of 120 min at 50 °C for thermal homogeneity, followed by a heating ramp from 50 to 800 °C at 20 °C·min−1. The nitrogen flow rate was set at 50 mL·min−1. Difference weight loss curves were calculated to detect a potential variation in the thermal stability of the systems, due to the incorporation of the filler (Equation (1)). These curves represent the difference between the experimental TG curve for the mixture ( w e x p ( T ) ) and the linear combination of TG curves ( w t h e o ( T ) ) for the neat components (Equation (2)) when fillers are incorporated at x wt.%.
Δ w ( T ) =   w e x p ( T )   w t h e o ( T )
w t h e o ( T ) = ( 1 x ) × w r e s i n + x × w f i l l e r
where w r e s i n and w f i l l e r correspond to the weight determined from the experimental TG curves; x the weight percentages of the sole filler. If Δ w ( T ) < 0 , then the experimental weight loss is higher than the theoretical one. This shows that the reactivity and/or interaction between the polymer and the filler leads to a thermal destabilization of the material. If Δ w ( T ) > 0 , then the system is thermally stabilized.
Heat treatments and characterization of the heat-treated residues were carried out. Heat treatments of pure components or of coatings were carried out in a tubular furnace under nitrogen flow (75 mL·min−1) for 3 h at characteristic temperatures selected thanks to TG curves. The collected residues were then analyzed using a numerical microscope.

3. Results and Discussion

3.1. Stratification Study

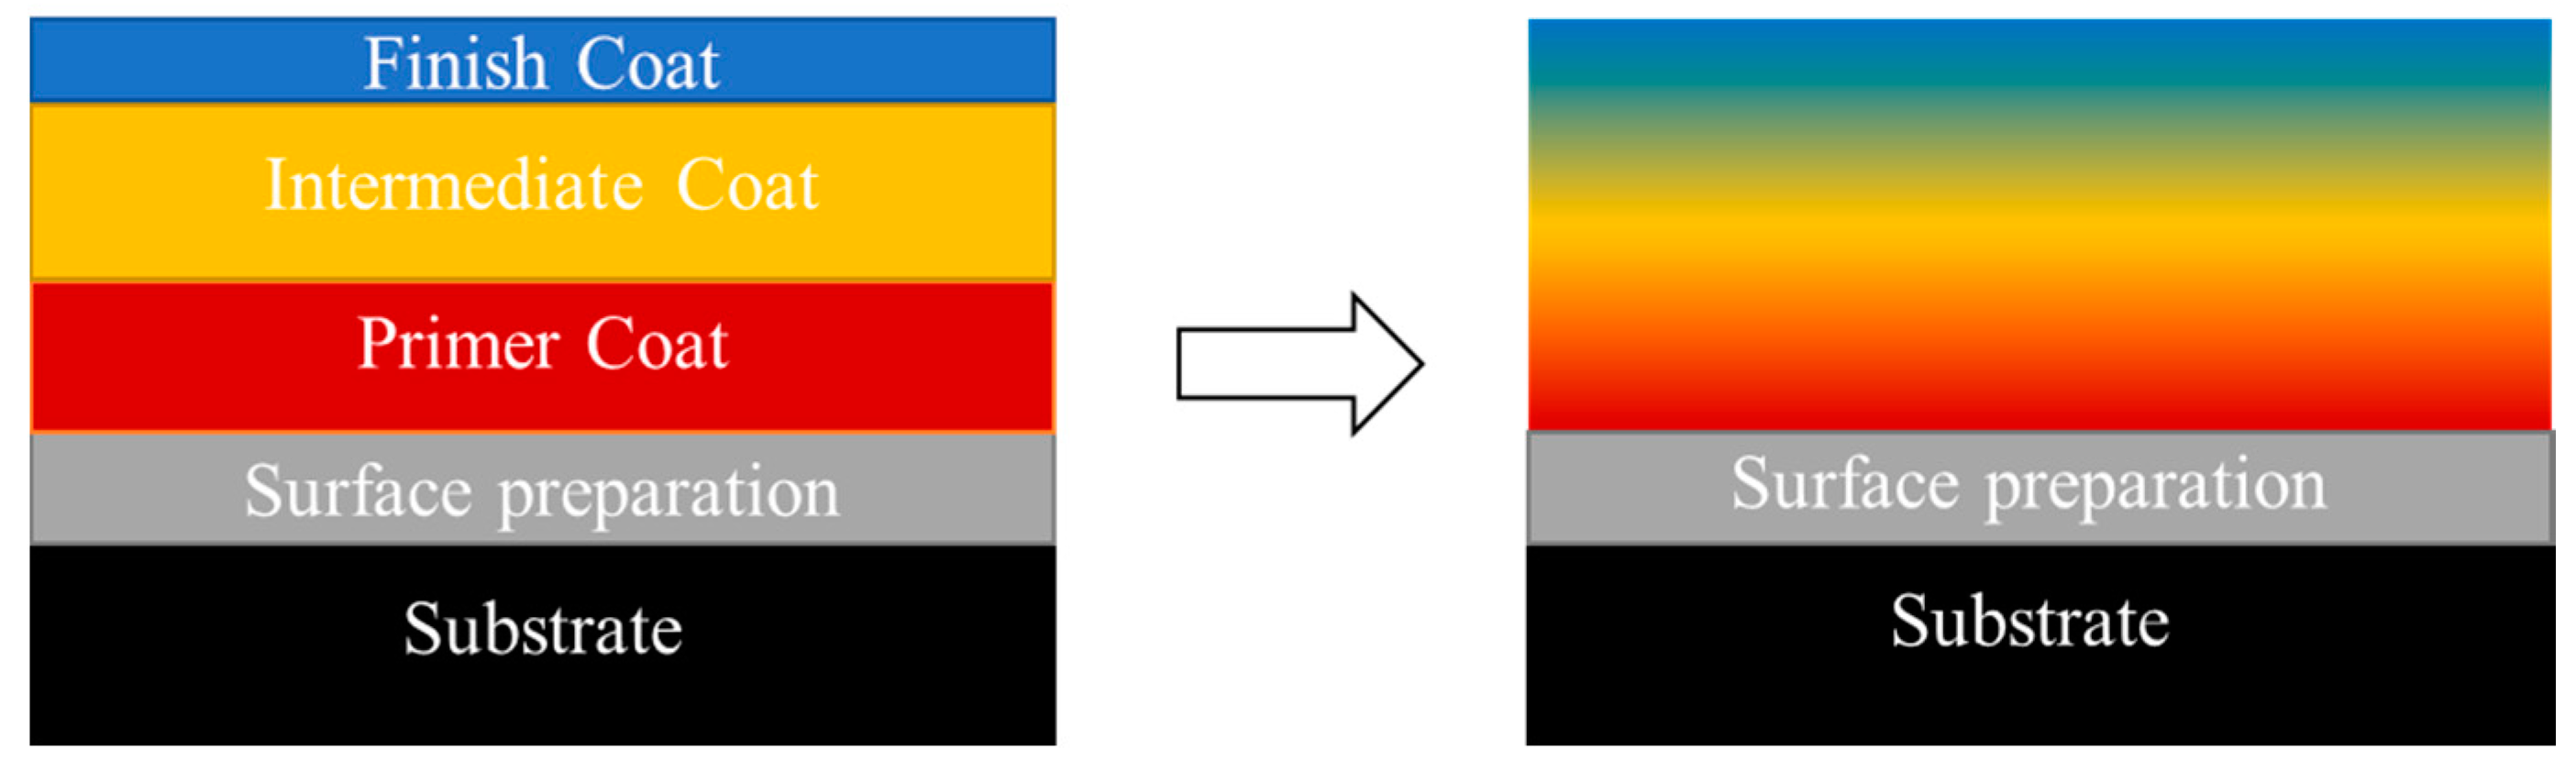
After mixing and before application as a film, the four-component system (epoxy and silicone resins, curing agent and phosphate additive) produced homophase solutions whatever the phosphate concentration. After drying and curing, the formation of separated in-layers coating structure through the film thickness was checked and adhesion properties were evaluated (Table 1).
The reference system without any phosphate additive shows perfect stratification (type I pattern) and the best adhesion rating (5B) on polycarbonate: the hydrophobic layer (the silicone medium) migrated to the upper part of the coating whereas the epoxy system was found at the interface with the substrate.
In presence of liquid FR fillers, nice coatings free of bubbles or defaults were obtained in all cases. They even show slight improvement in terms of surface aspect (less rough and glossier) than the reference coating. The 5B adhesion rating is maintained after the incorporation of RDP in the system, for both amounts tested, whereas the addition of BDP slightly impacts the adhesion of the coating (4B rating is obtained).
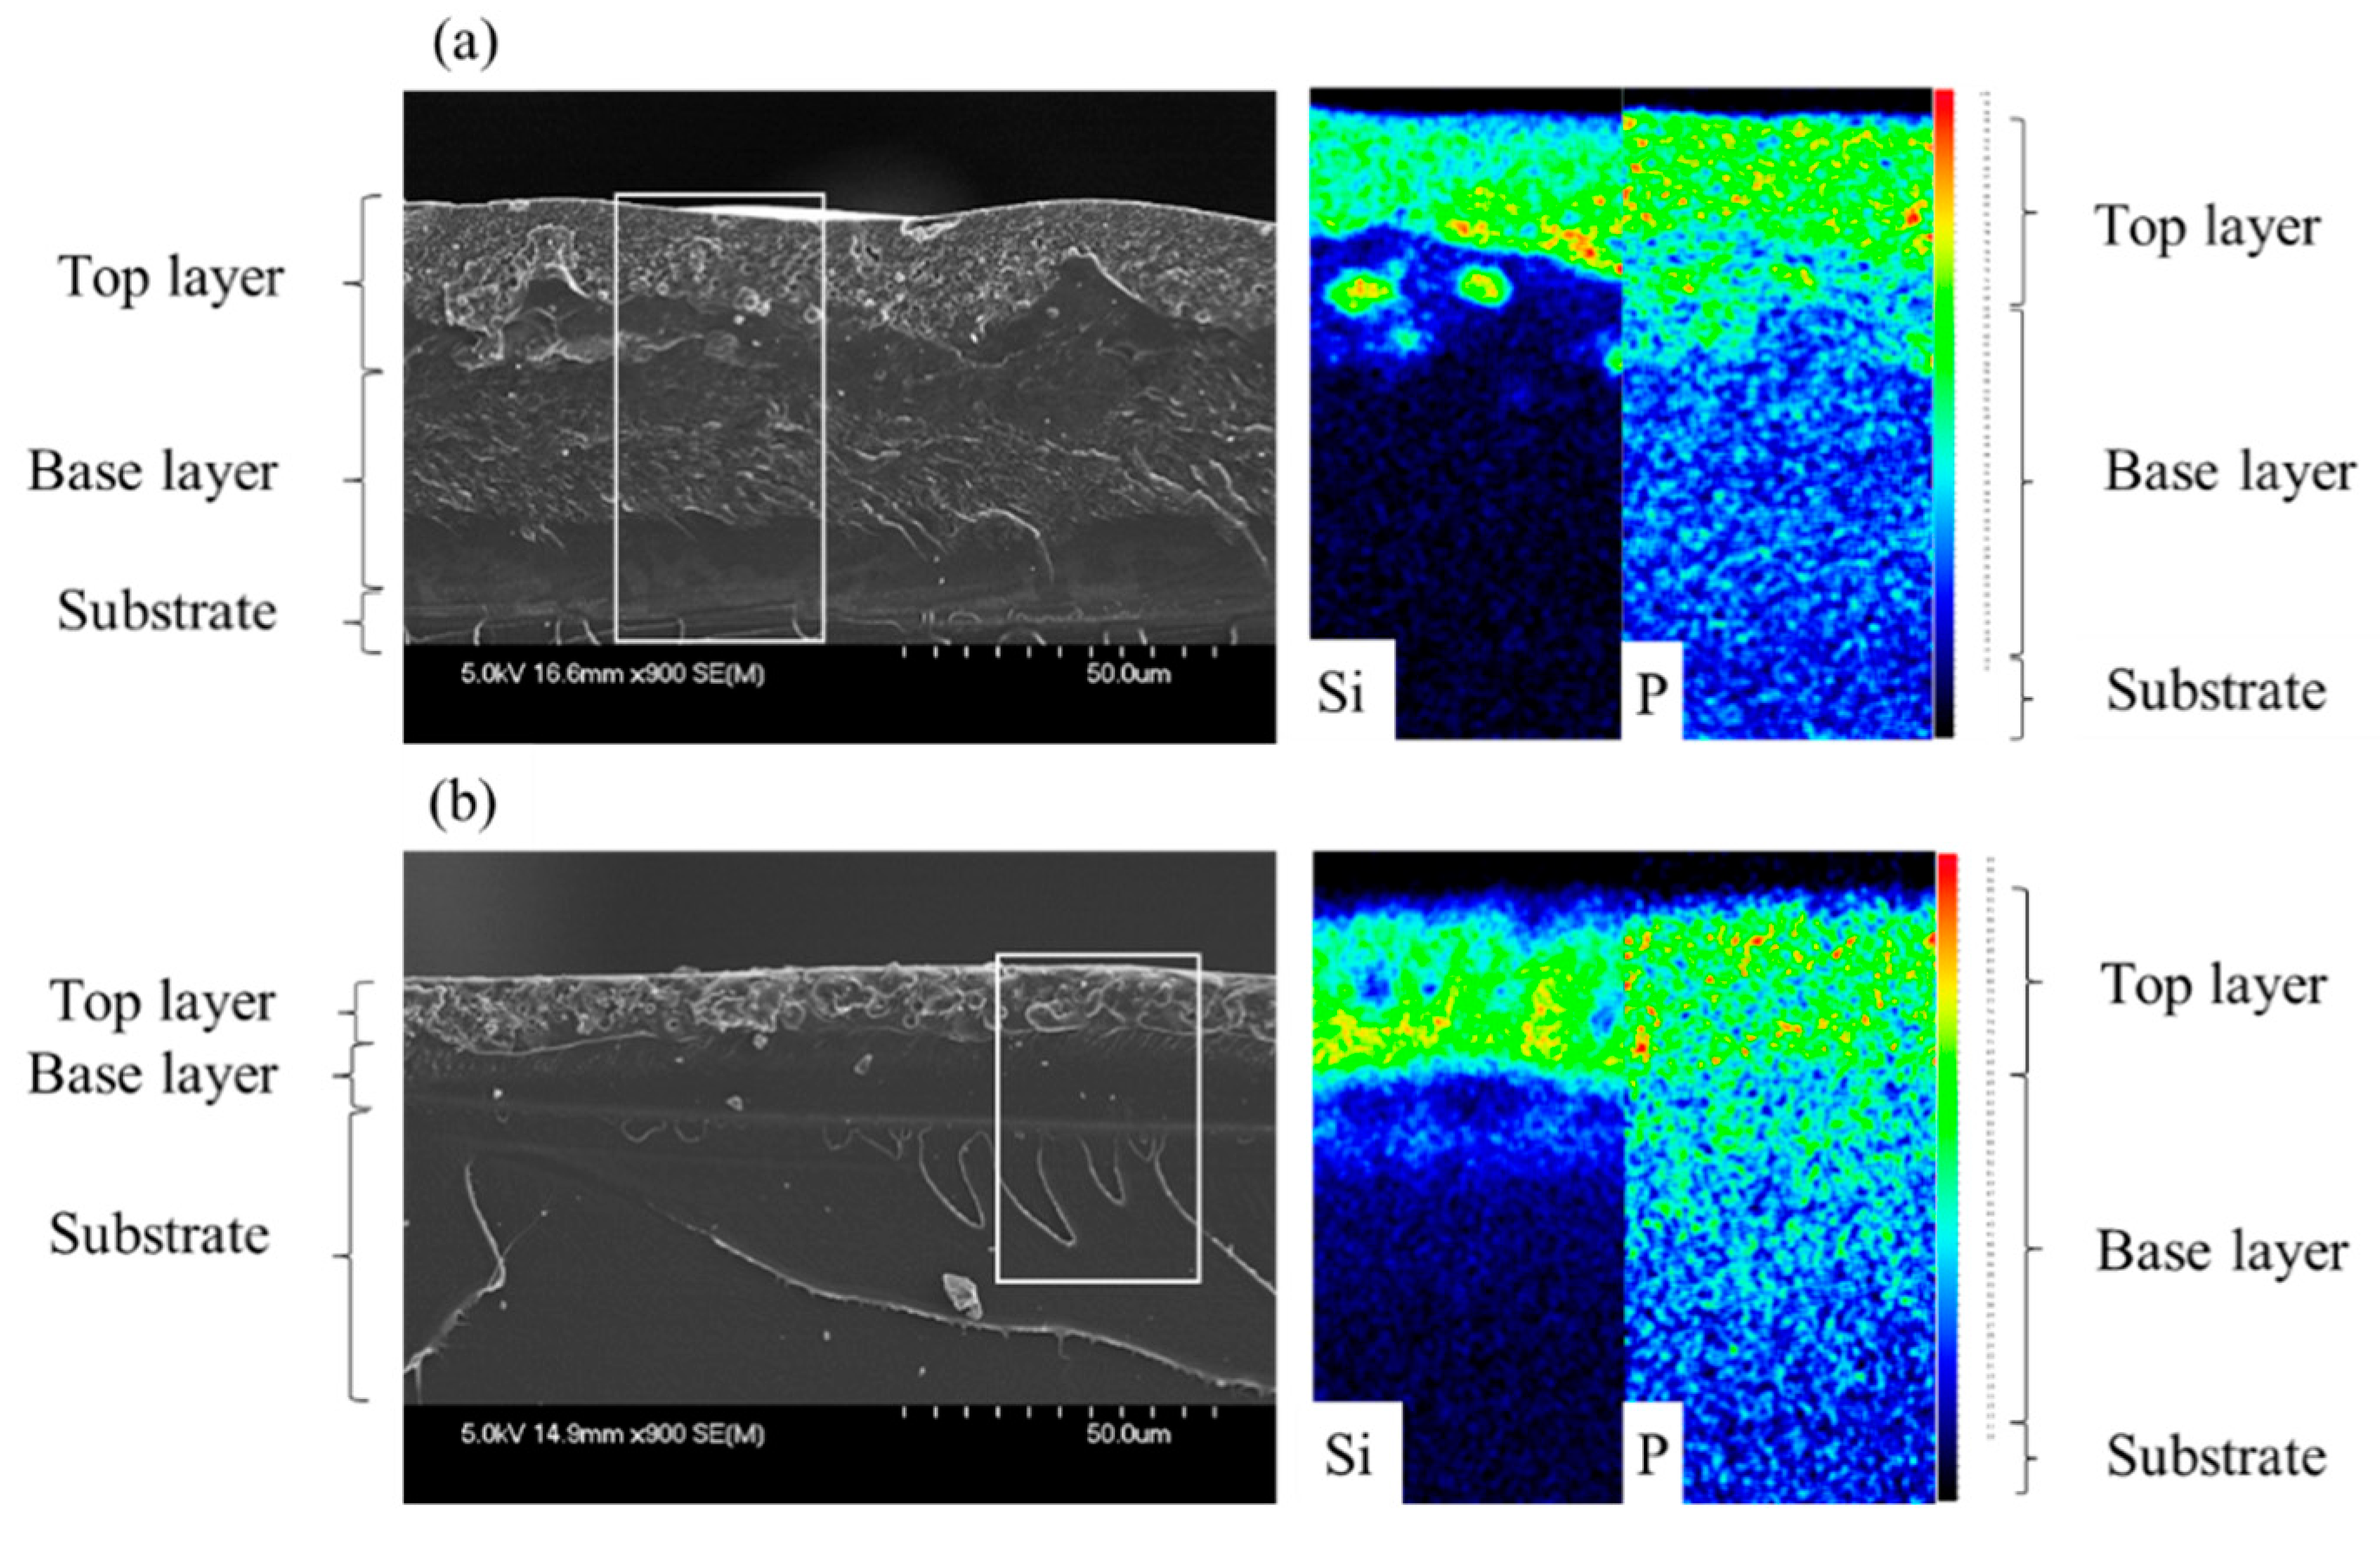
Unlike the results mentioned in the literature, it appears that neither RDP nor BDP affect the layering process when incorporated at 5 wt.% in the formulation: a type I pattern is obtained with fully separated layers, as observed with the unfilled system (Figure 2).
Both additives migrate to the upper layer of the film, in the silicone medium, meaning that RDP and BDP have a higher affinity with silicone than with epoxy. This migration is rather a positive phenomenon in this case as it allows concentrating the additives’ properties (i.e., flame retardant properties) in the upper part of the coating, where it is the most needed in case of fire. With RDP, some inhomogeneities are noticeable along the film near the two resins interface region: some island shaped regions rich in silicone have not totally migrated to the upper layer of the film. A concentration gradient of phosphorus is also detectable through the film thickness, although the major part of RDP has migrated to the upper layer. With BDP, the same behavior can be observed: the silicone resin and the filler are mainly concentrated in the upper part of the coating. However, the concentration gradient of phosphorus is more pronounced through the thickness than with RDP. The difference could be explained by a higher affinity of RDP with the silicone resin, promoting the migration of the additive to the air interface. However, the concentration gradient is much more noticeable with phosphorus than with silicium: this means that the affinity between the silicone resin and the filler is not strong enough to allow its complete migration toward the top layer. A difference in viscosity could also explain the difference in concentration gradient between BDP and RDP containing formulations. Indeed, BDP is much more viscous than RDP (17,000 CPS [22] compared to 12,450 CPS for RDP [23]. As its viscosity is higher, its migration to the upper layer may be slowed down. It is noteworthy to notice that even if the additive has not enough time to completely migrate to the upper layer of the film, it does not impair the stratification process: the layering of the silicone to the top of the coating remains perfect.
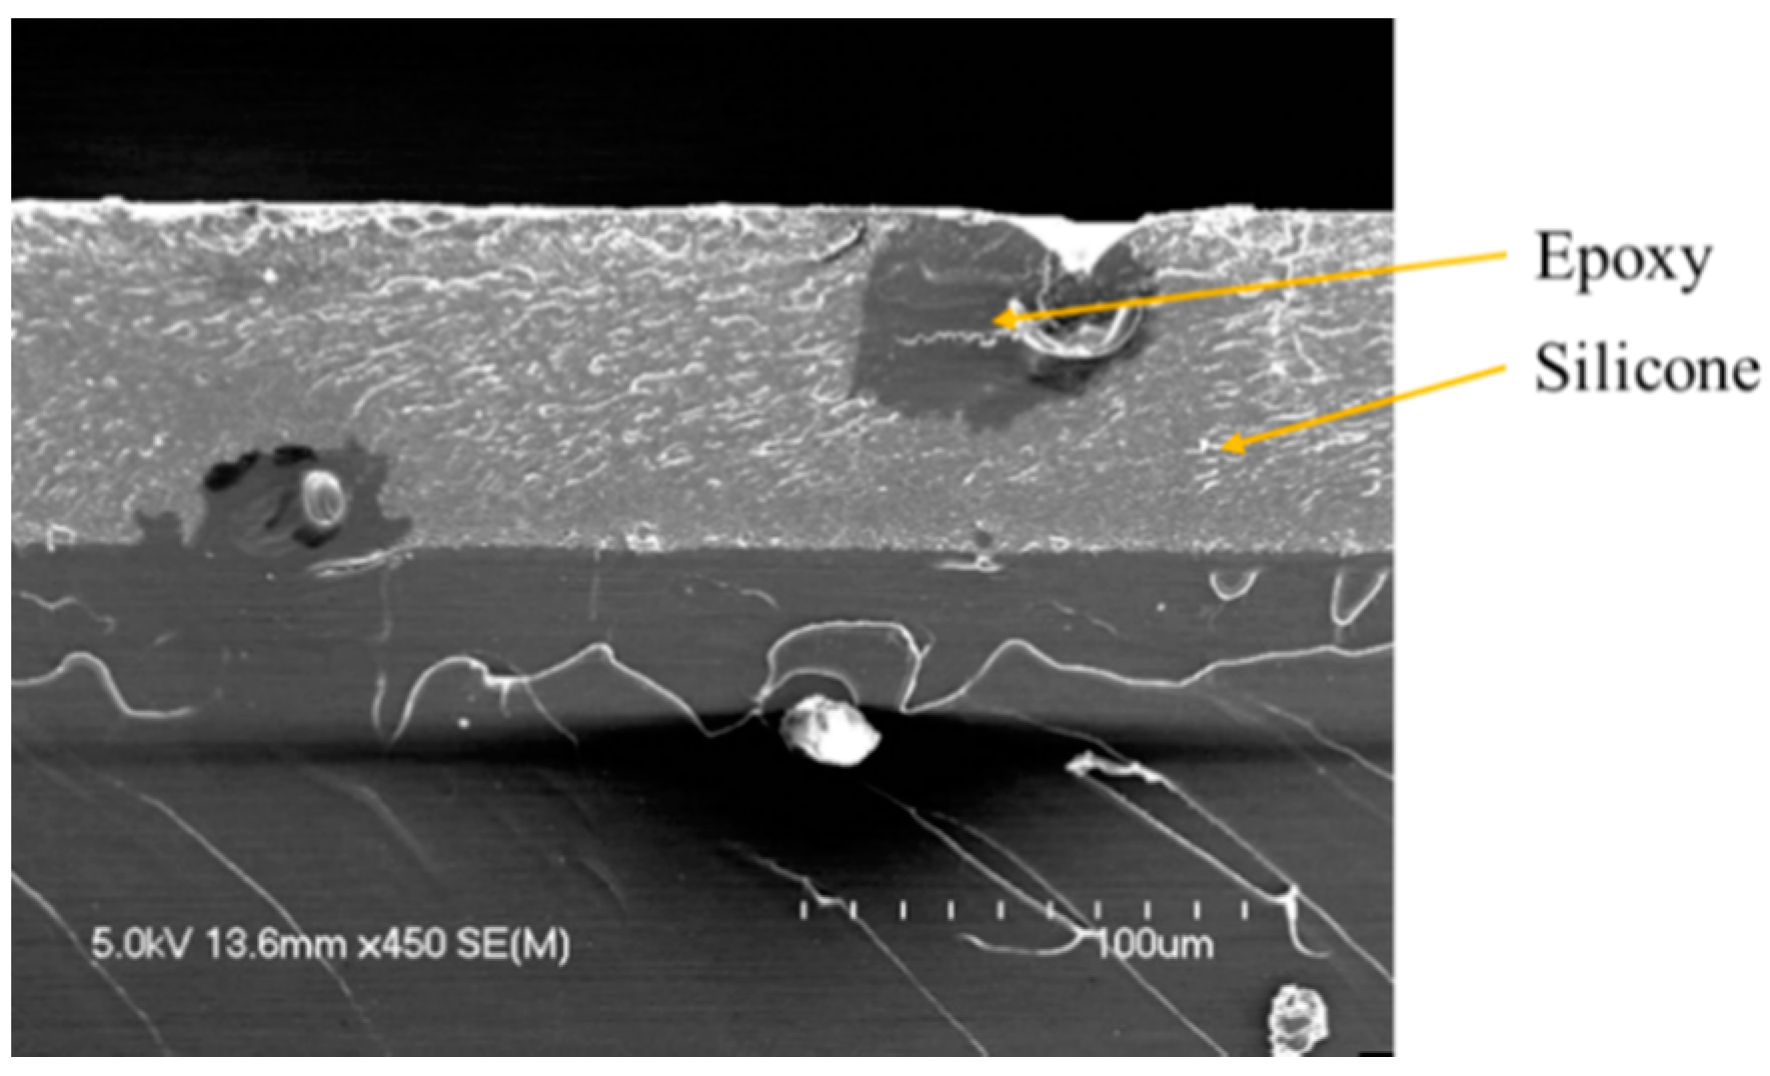
When a smaller amount of phosphate additives is introduced in the formulation (2.5 wt.%), evidences of phase separation are found with a concentration gradient of silicone through the thickness. Nevertheless, some inhomogeneities in the matrix are observed (Figure 3), consisting in isolated spherical particles composed of epoxy resin dispersed in the continuous silicon matrix. Furthermore, the phosphorus element is found in the silicone phase whereas the stratification is not complete in those areas. This corroborates its higher affinity with silicone compare to that of epoxy. The phosphate additive destabilizes the interface between the two phases and, in that case, influences the preferential orientation of the phases in the course of film forming process. The dispersion of the filler is portioned in the silicone medium, however interacting in some way in the course of crosslinking reactions. A minimum amount of filler may be needed to allow a homogeneous dispersion into the silicone medium and this would need further investigation to the forces questioned in this process. This morphology corresponds to a type II/type III stratification pattern. However, this incomplete phase separation has no influence on the adhesion properties of the coatings as similar adhesion ratings are obtained with 2.5 wt.% and 5 wt.% of fillers, for both RDP and BDP [24].
In conclusion, when a low amount of additive is added (2.5 wt.%), self-layering is slightly compromised in some areas of the film. The filler destabilizes the equilibrium between the two solutions, and impairs the formation of two distinct and homogeneous layers. On the contrary, the phosphorus-based fillers tested do not affect the formation of oriented heterophase structures when they are introduced at 5 wt.%: they mostly migrate, with a concentration gradient more or less pronounced, towards the air interface with the silicone resin. In that case, some disparities in the concentration gradient can be observed, which may be due to a difference in viscosity between the two phases. Finally, coating’s composition provided nice visual appearance and a high adhesion onto the polycarbonate substrate. It was proven that it is possible to add a substantial amount (5 wt.%) of liquid functional filler in a self-layering formulation without affecting the self-stratification process, the coating aspect and the adhesion. In these formulations, the phosphorus FR additives migrate into the upper silicone layer, which can potentially lead to an effective FR effect of the coating when exposed to fire.

3.2. Flame Retardant Properties

Virgin PC and PC coated with the unfilled and filled self-stratified compositions were then tested for fire performances (MLC) and flammability (UL-94 and LOI).
HRR curves and characteristic MLC parameters of the systems are given in Figure 4 and Table 2. It is noteworthy that no ignition of the coated samples (filled and unfilled) occurs at 35 kW/m² (mild fire scenario), even after 30 min of exposure; whereas the raw PC ignites after 319 s and releases a total heat of 35 MJ/m² (with a pHRR of 202 kW/m², see Supplementary Materials Figure S1). PC is a char-forming polymer. At 50 kW/m², after its ignition, it melts and forms a char which swells until a height of about eight centimeters is reached. The char then degrades and only ashes remain at the end of the test.
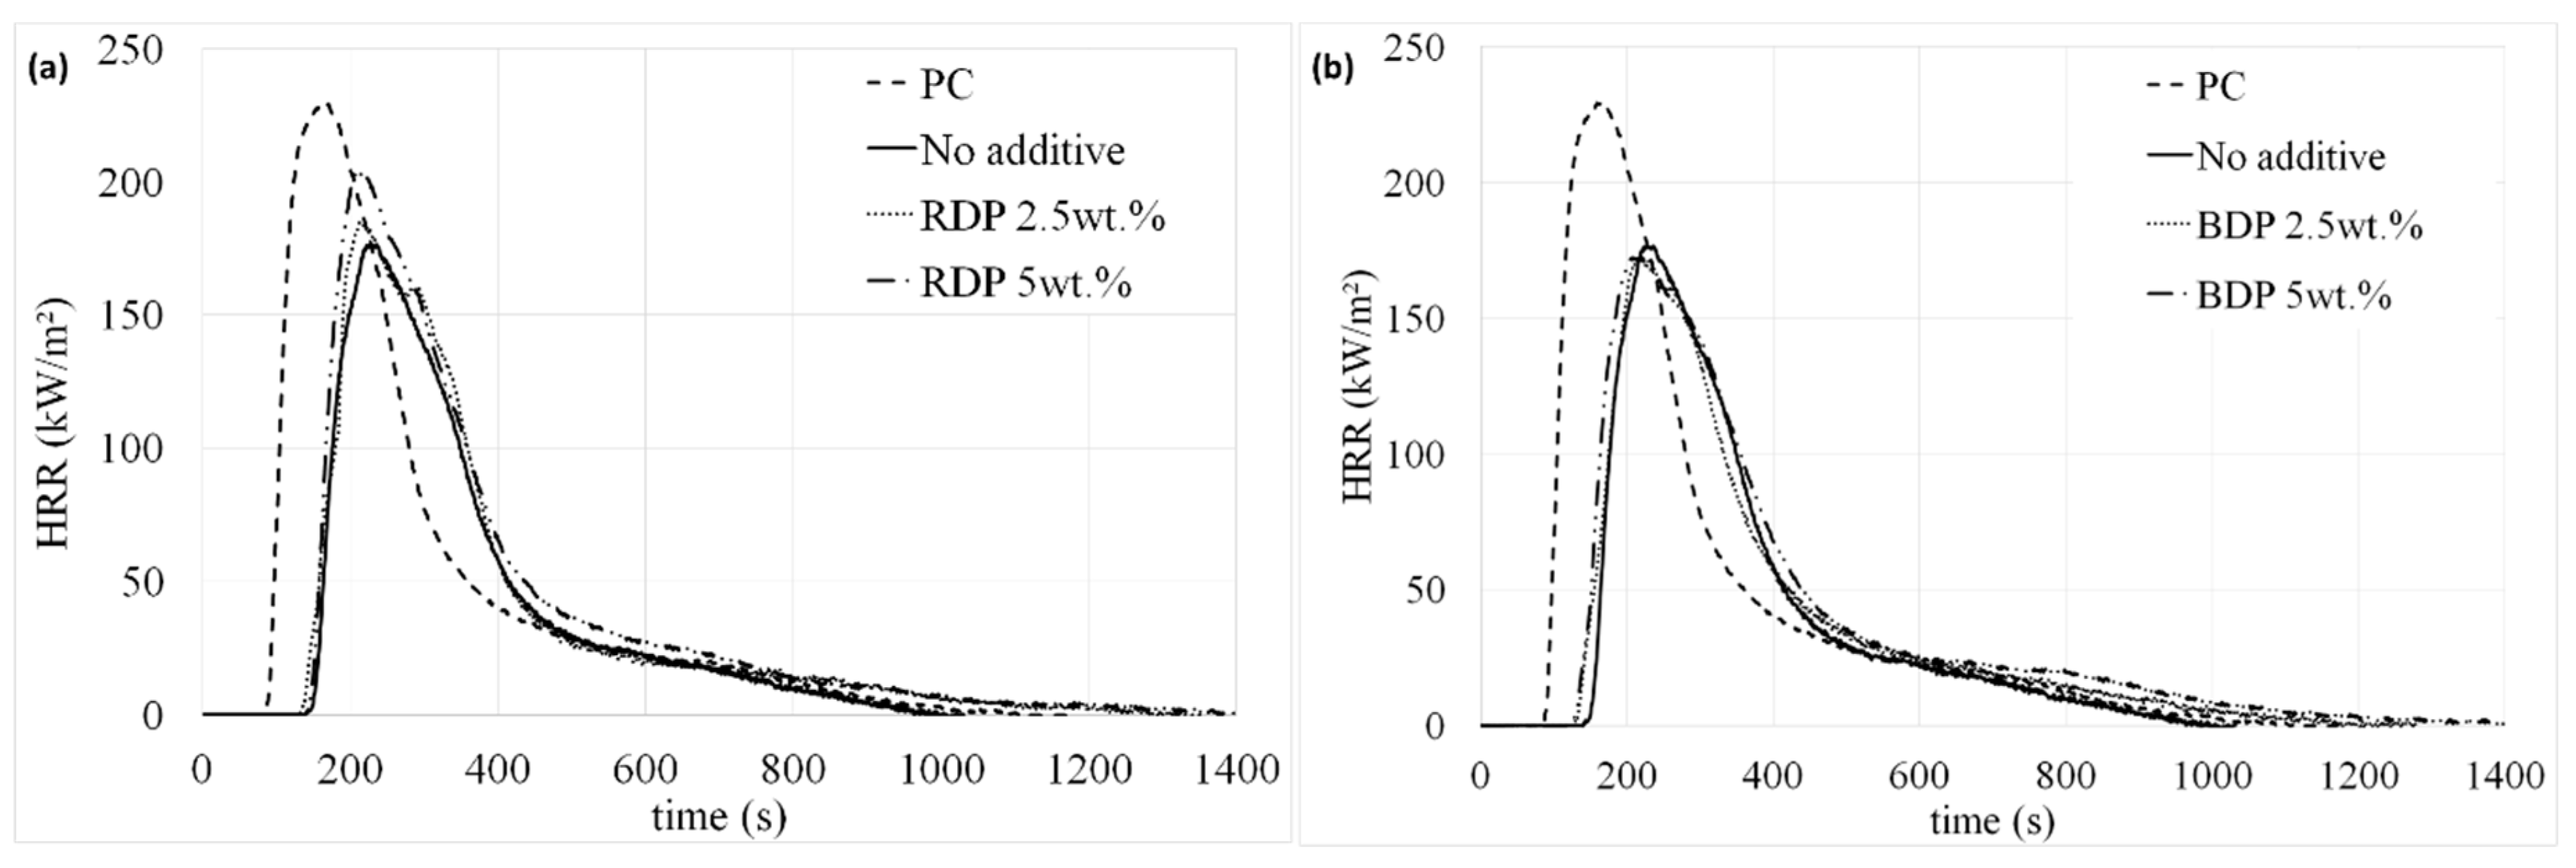
Even at a higher heat flux (50 kW/m²), the coating allows protecting temporarily the PC. MLC results obtained for the coating with the unfilled epoxy/silicone coating evidence an improvement of the fire behavior, as both the pHRR and THR are reduced, respectively by 24% and 21% compared to raw PC. Ignition time is also delayed more than 50 s, which is remarkable with such thickness (55 µm). Ignition occurs only because PC swells under the coating, which thus progressively delaminates from the edges of the plate due to the uprising of the PC char. Once ignited, PC forms a char which rapidly swells up to 8 cm. The char is then consumed and collapses before the flame out takes place. At the end of the test, PC is completely consumed, which also explains the pHRR and THR values obtained.
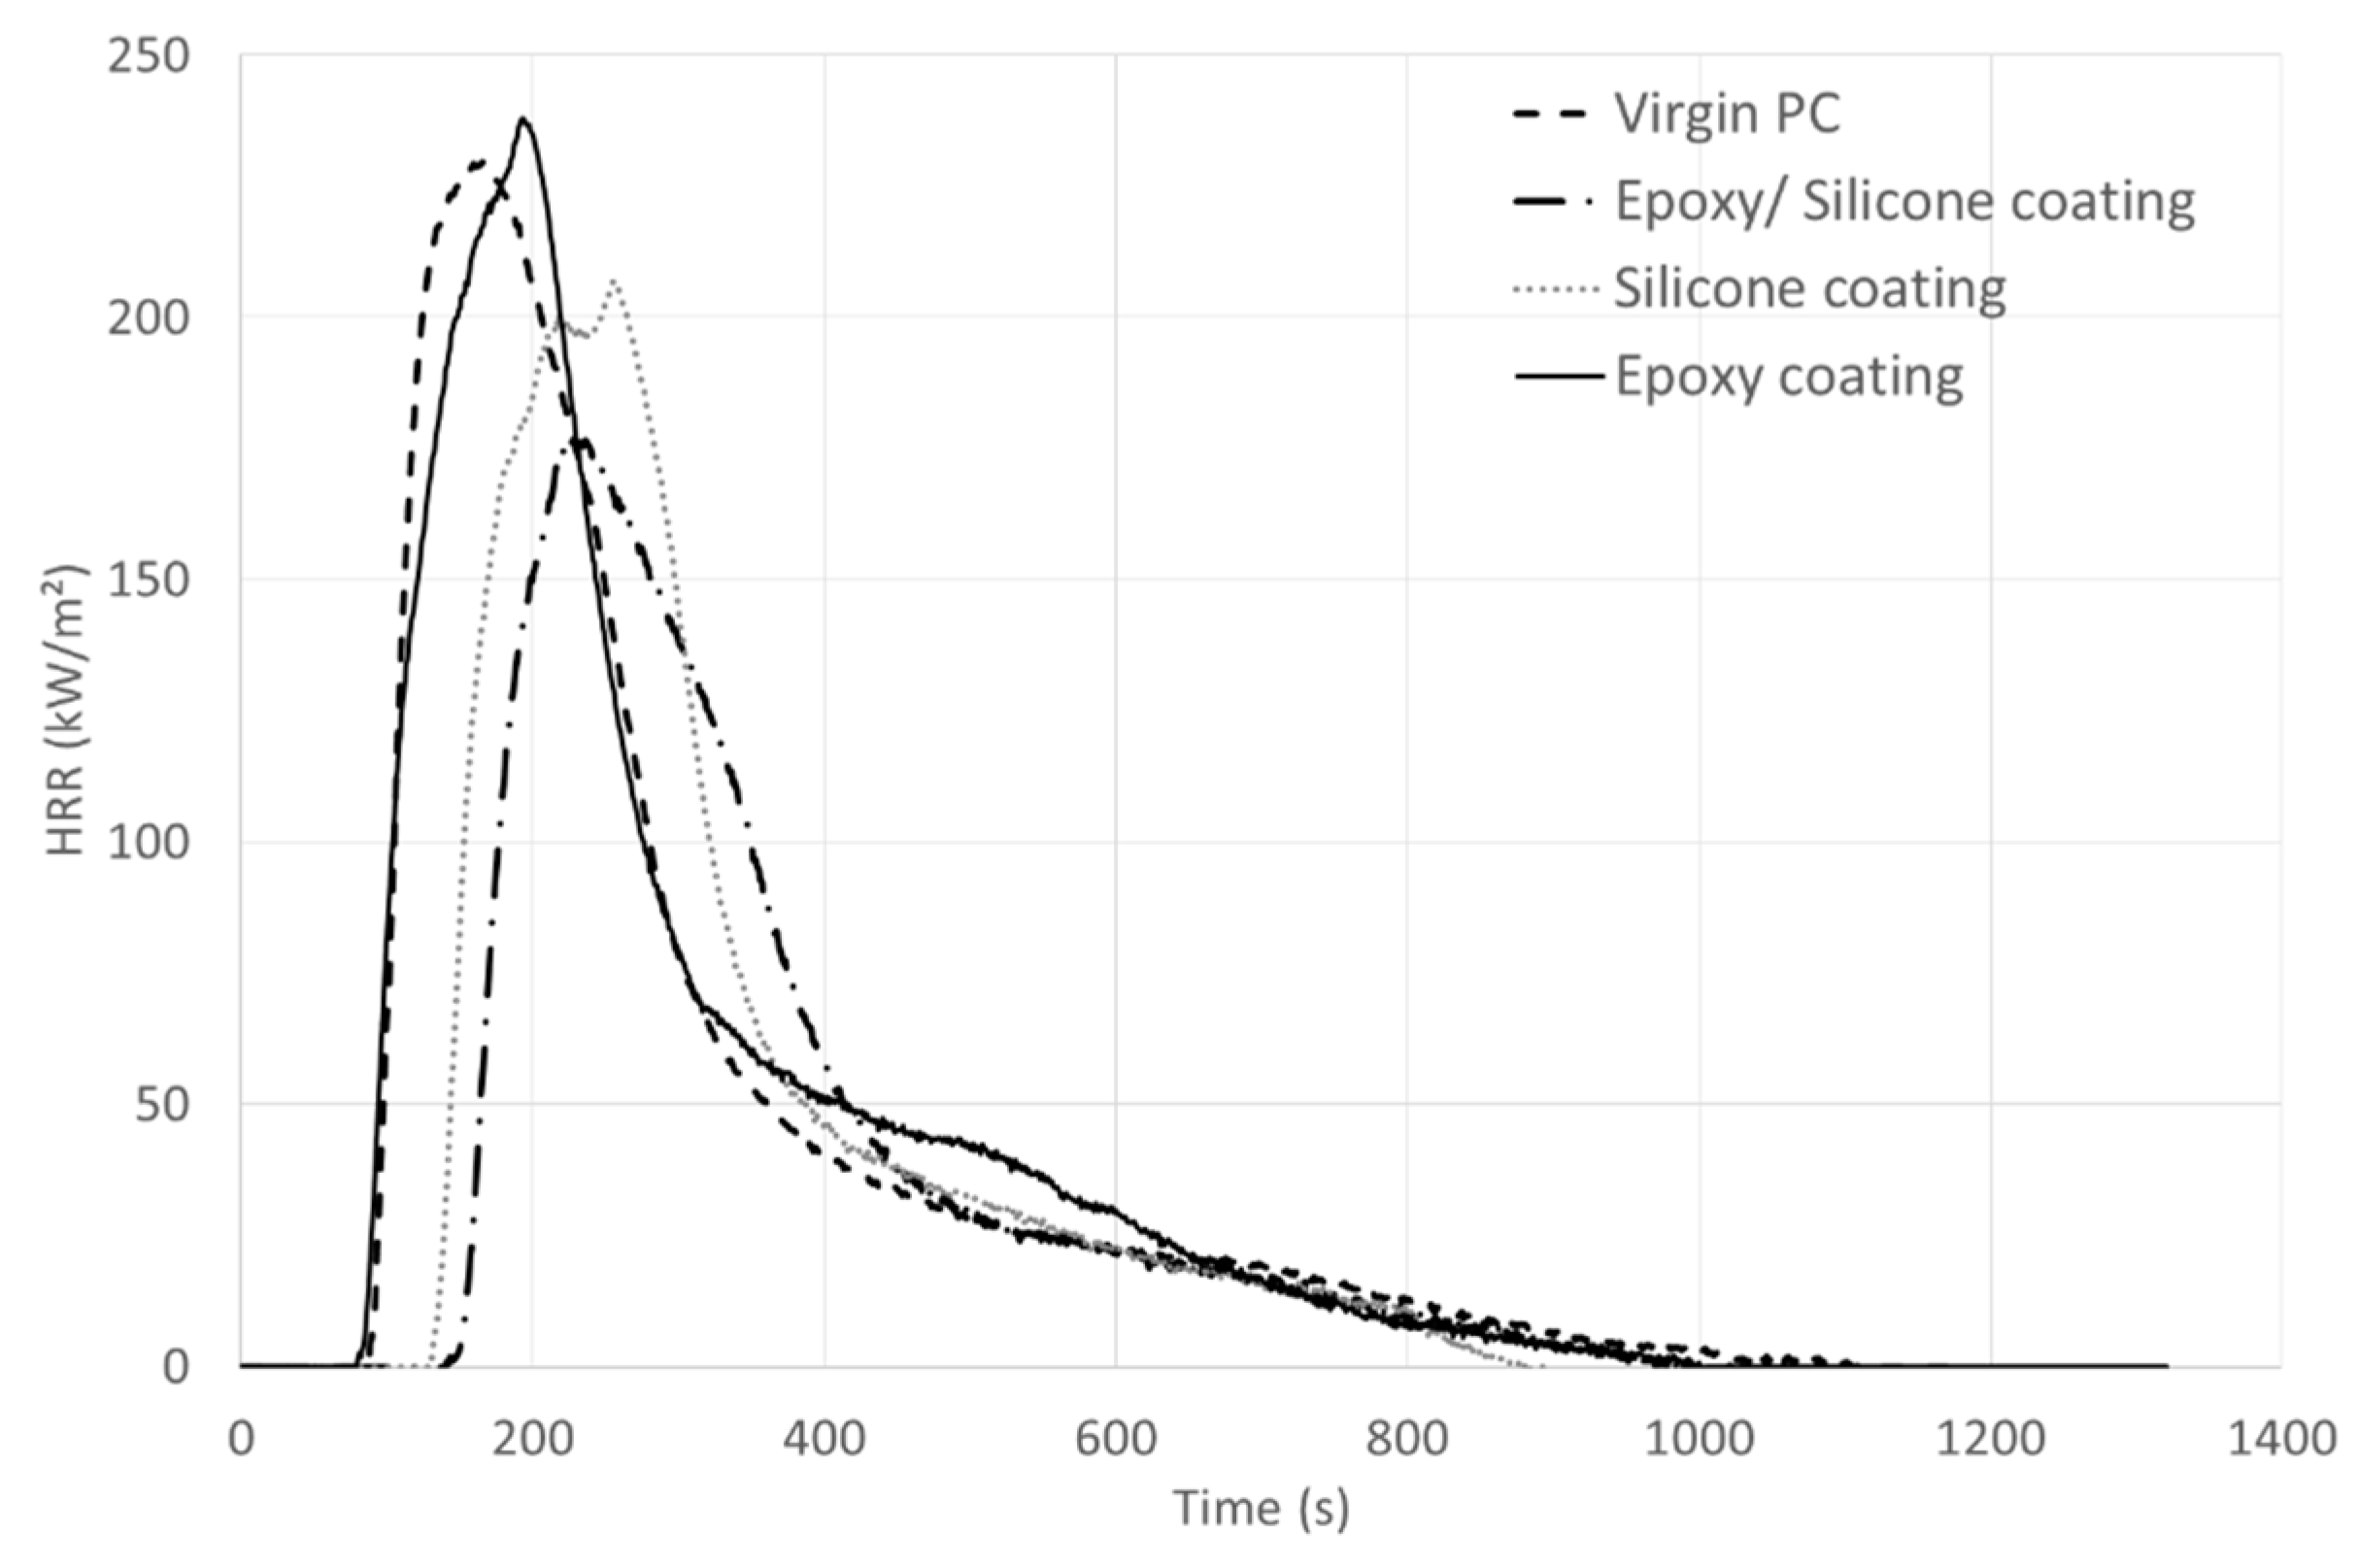
MLC experiments on PC samples coated with only one resin, whether the epoxy resin or the silicone one, have been carried out to try to explain the behavior of PC coated with the unfilled epoxy/silicone blend (Figure 5, Table 3). When the epoxy resin is applied on PC, the behavior during the MLC test is similar to that of pure PC: no delay of the TTI and similar pHRR and THR. Thus, the epoxy resin does not bring any fire retardant effect, which is not surprising as it is composed of Bisphenol A (similarly to PC). On the contrary, the application of a silicone coating on PC leads to a fire retardant effect: slight decrease of pHRR and THR and TTI increase of about 40 s. Thus, the presence of silicone is responsible for the improvement of the fire behavior when the epoxy/silicone coating is applied to PC. However, the epoxy resin contributes to bringing better adherence between the self-stratifying coating and PC. In fact, the silicone coating gives a 3B rating on PC compared to a 5B rating with the self-stratifying coating. Moreover, there is no interlayer adhesion failure between the epoxy and the silicone layers thanks to the use of the self-stratifying coating.
Similar trends are observed when PC is coated with the epoxy/ silicone/ filler mixture, whatever the amount of additive incorporated. However, although the best TTI is obtained when RDP/BDP are incorporated at 2.5 wt.%, fire behavior are similar compared to that of the binary composition. The impact of RDP and BDP addition in terms of flame retardant behavior is thus negligible compared to the FR effect of the silicone coating itself. Finally, BDP seems slightly more efficient than RDP, which is not surprising as at a same ratio, BDP contains more phosphorus than RDP. Indeed, there is 10.7% of P in RDP whereas 8.9% are present in BDP. All the systems were consumed at the end of the test at 50 kW/m²: only residue of silica and ashes remained. The slight thickness difference between the two samples (Table 1) is not responsible for this effect since any correlation is noted between the thickness, the TTI and THR: close THRs are reached by both filled coatings at equal weight percentage whereas a reverse effect is observed on the time before ignition.
LOI and UL-94 tests were also performed on uncoated and coated PC formulations (Table 4). The epoxy/silicone reference coating does not improve the intrinsic flame retardant properties of PC in the case of vertical burning tests: close LOI values (27 vol.% and 28 vol.% respectively for the raw and coated PC) and a NC rating are obtained for both samples. Up to 28 vol.%, the extinction of virgin PC occurs mainly because of the flaming drops or of the rapid combustion of the material. The unfilled coating allows reducing the combustion speed of the material and prevents the dripping of PC. At UL-94 test, virgin PC is not classified at 3 mm, but close to meet the requirements of V-2 classification: short combustion time (<32 s) and dripping (Table 5).
When the polymer is coated with the filled mixture, the fire behavior is strongly dependent on the amount of fillers used in the coating, whatever the type of additive (BDP or RDP). The addition of 2.5 wt.% of additives does not improve the fire behavior compared to the unfilled system: similar LOI value and same rating at UL-94 test. For these materials, the amount of additives is too low to allow the decrease of the flame spread. With 5 wt.% of additives, although the rating at UL-94 test is the same (NC), the behavior is much different: the combustion time is very short (≤2 s) after the first ignition and remains shorter than the unfilled system after the second ignition (Table 5). The classification is very close to V-1, as with both additives= only one specimen out of the five tested has a t2 afterflame time higher than 30 s (in bold, Table 5). In addition, LOI values are significantly improved: 34 vol.% and 32 vol.% respectively with RDP and BDP fillers. The charring is more pronounced (fast expansion of the foamed structure) and no dripping occurs. Last but not least, samples were more prone for burning during the second ignition with a lower concentration of additive in the coating.
Thus, similar behavior between RDP and BDP can be registered: they are both more efficient when they are introduced at a higher amount (5 wt.%). As with MLC, the slight difference observed between RDP and BDP may be due to the higher amount of phosphorus in the RDP formulation.
To conclude, formulations containing 5 wt.% of RDP and BDP exhibit the most promising results: charring is more pronounced and dripping is avoided. At MLC test, fire performances of coated formulations are mainly enhanced through the shift of the TTI toward higher values due to the silicone coating. The influence of the two phosphorus-based additives on the fire properties is not significant compared to the improvements already reached by the unfilled epoxy/silicone system.
Occurrence and efficiency of the systems depend not only on the FR itself, but also on the interactions with the degradation products of the different components of the materials (resins and substrate). To go deeper in the understanding of the mode of action of the phosphorus compounds, TG analyses and difference weight loss calculations were carried out on the silicone resin, containing phosphorus additives or without. During a fire scenario, the silicone will be the resin in contact with the open flame or exposed to the heat source as it is located in the upper layer of the film. Consequently, only the silicone resin was considered.

3.3. Thermal Stability

The thermal stability of the unfilled system and systems filled with RDP and BDP were investigated using TG analyses (Figure 6 and Figure 7. Weight difference curves between experimental and calculated TG curves when RDP or BDP is added to the resin (10 wt.%) under N2 conditions). The percentage of fillers introduced in the silicone medium was kept constant compared to the epoxy/silicone system as the major part of the filler migrates to the silicone layer (i.e., 10 wt.% of filler in the silicone medium).
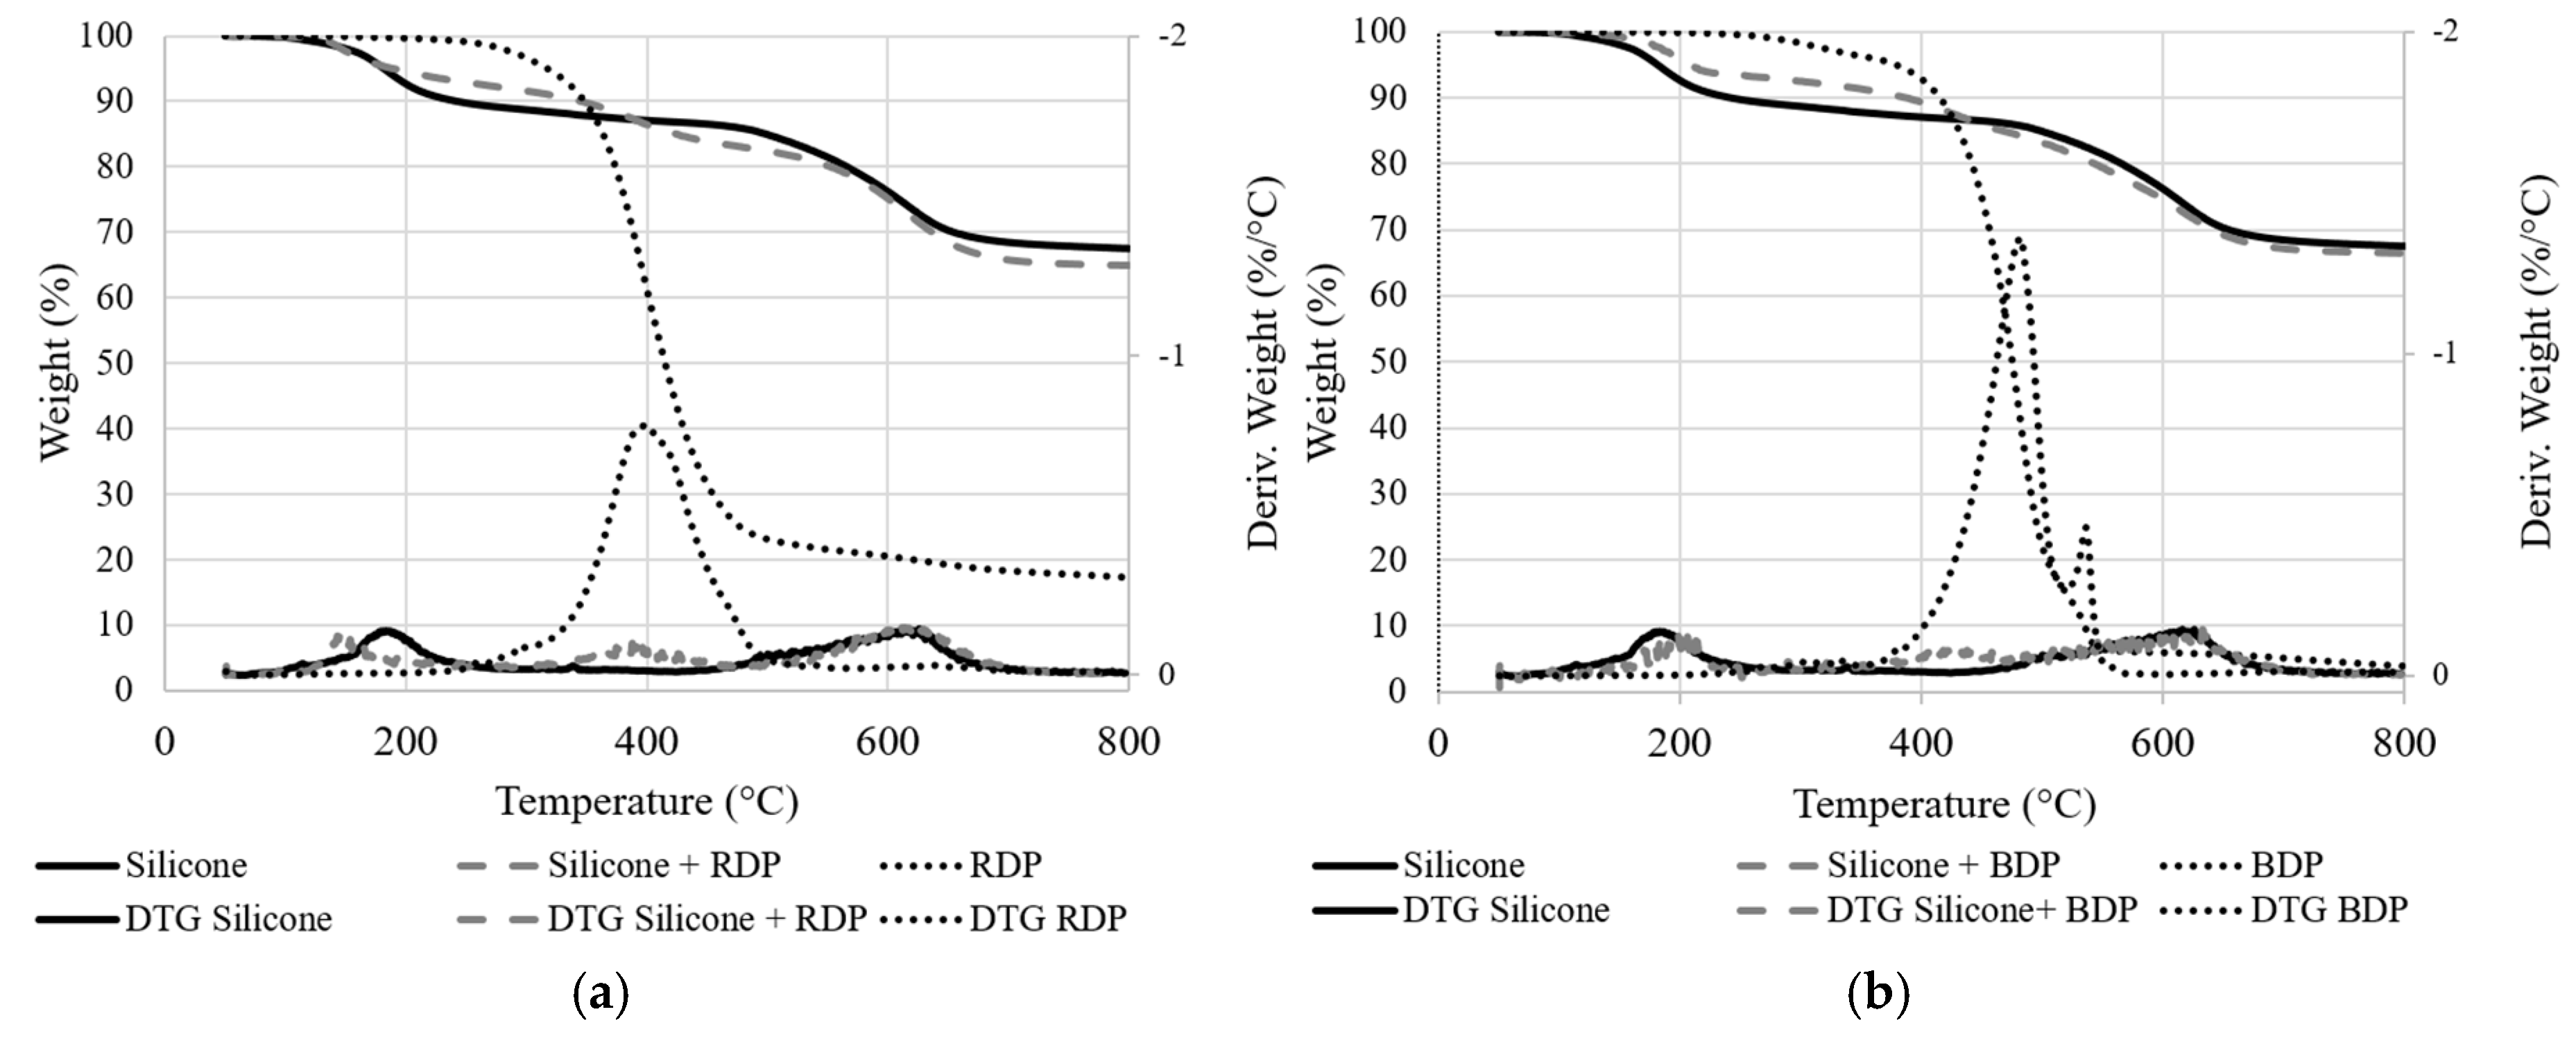
The decomposition of the pure silicone film involves a three-step process with a 68 wt.% residual weight at 800 °C. The first degradation step may be coupled with the release of the remaining solvents from the resin’s preparation and the release of silicone oligomers (11 wt.%) and the second and third steps (overlapped) are correlated with to the release of aromatic compounds (such as benzene and bisphenyl, 21 wt.%) [
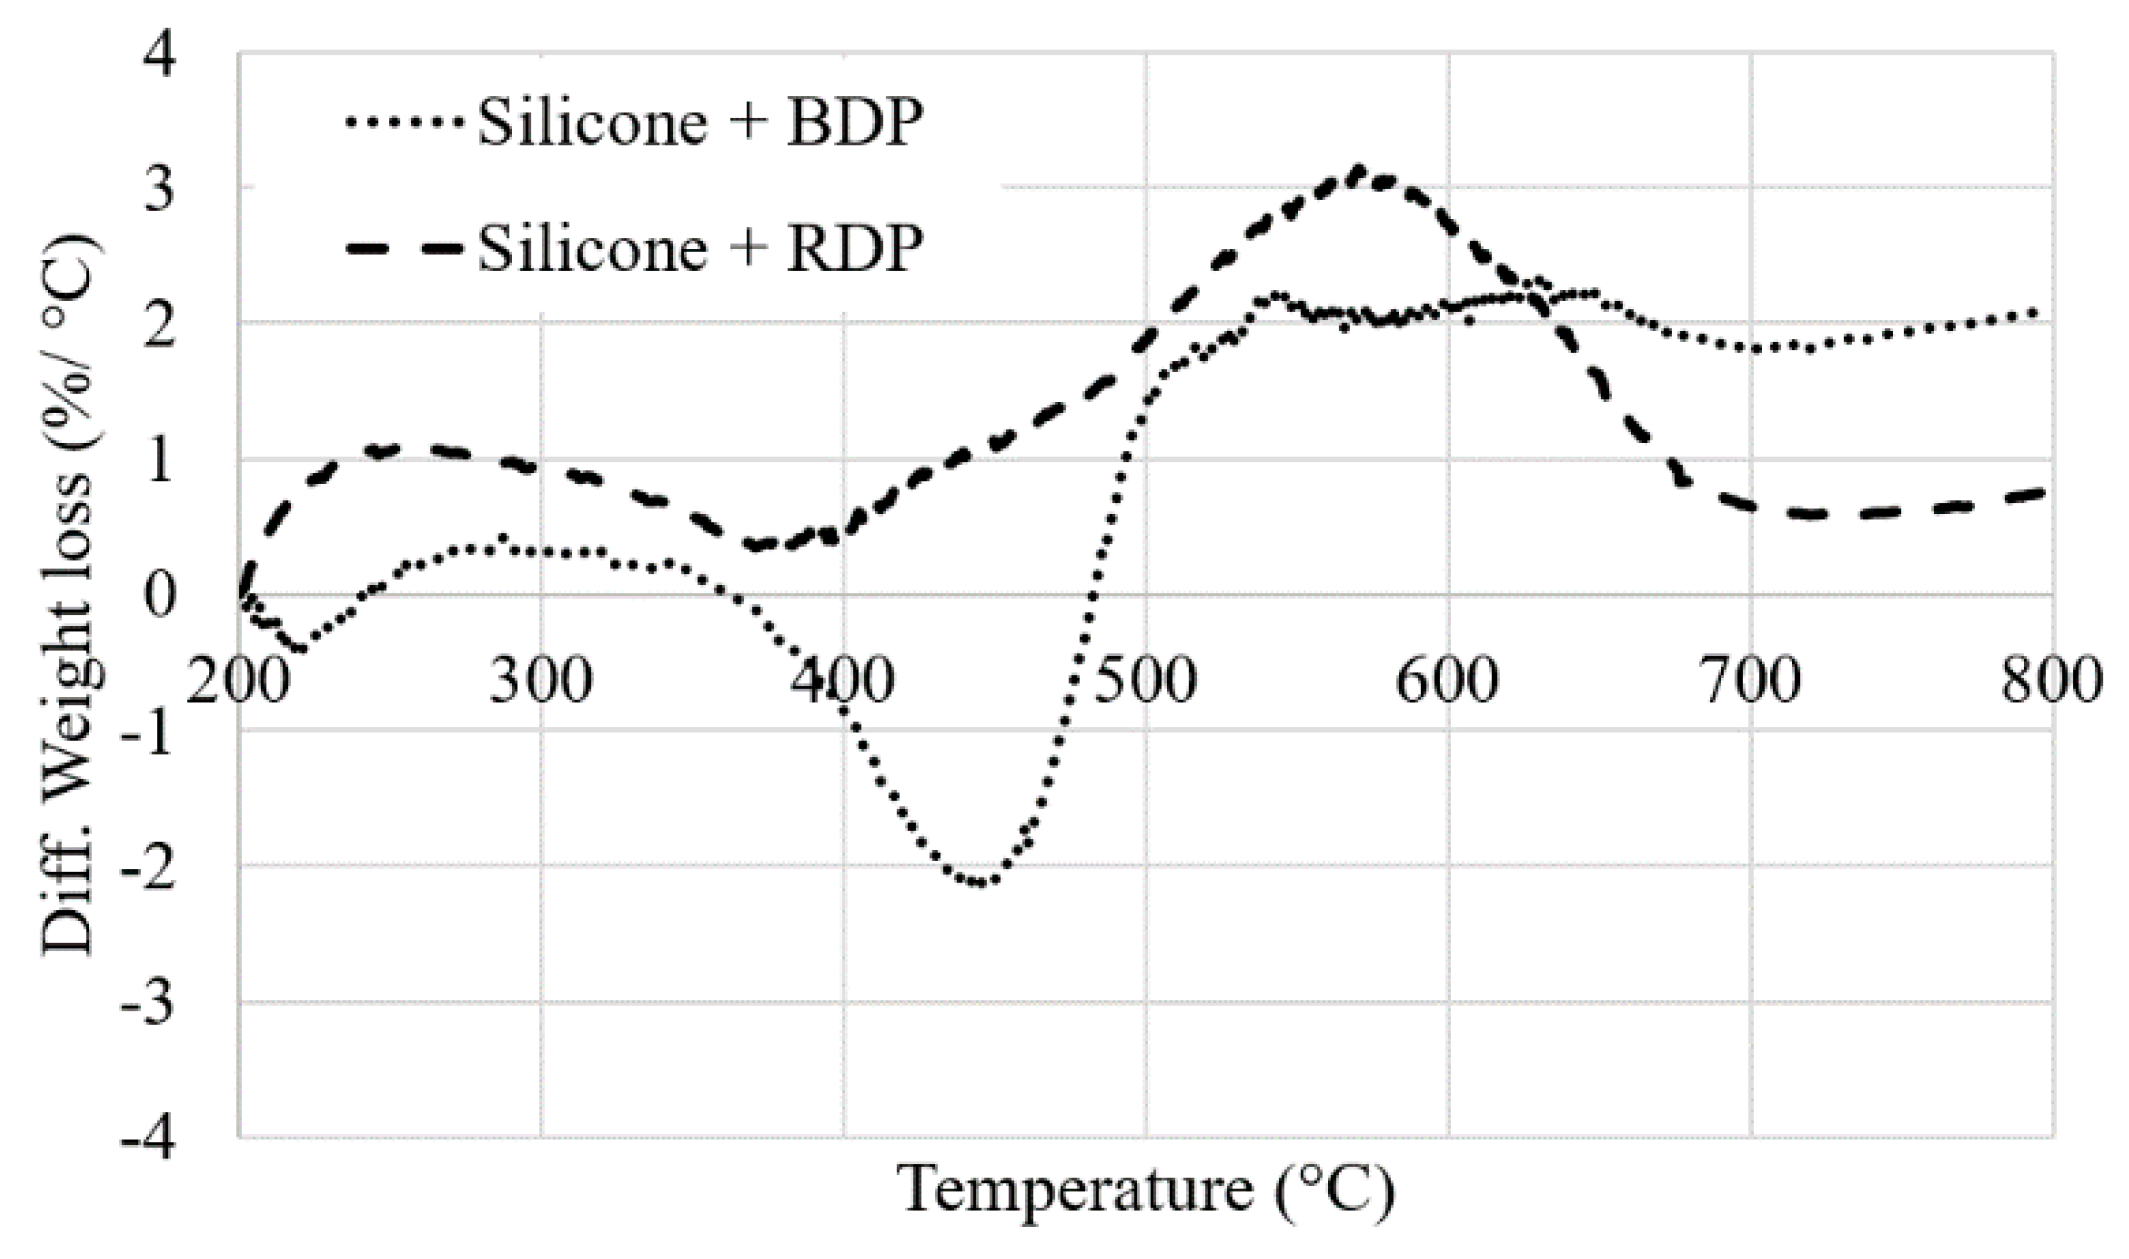
25]. The total weight loss is only 32% at 800 °C, demonstrating the excellent thermal stability of the silicone resin (under TGA conditions). When FR liquid additives are incorporated, an additional degradation step occurs close to the maximum degradation temperature of RDP and BDP (at respectively 398 and 420 °C). This leads to a slight destabilization of the system, particularly with BDP between 370 and 480 °C (−2 %/°C, Figure 7). Weight difference curves between experimental and calculated TG curves when RDP or BDP is added to the resin (10 wt.%) under N2 conditions). The residual weights of the additives are low (respectively 4 wt.% and 17 wt.% at 800 °C with BDP and RDP), although it does not neither influence significantly the thermal stability of the resins nor favor the formation of a charring structure at high temperature.
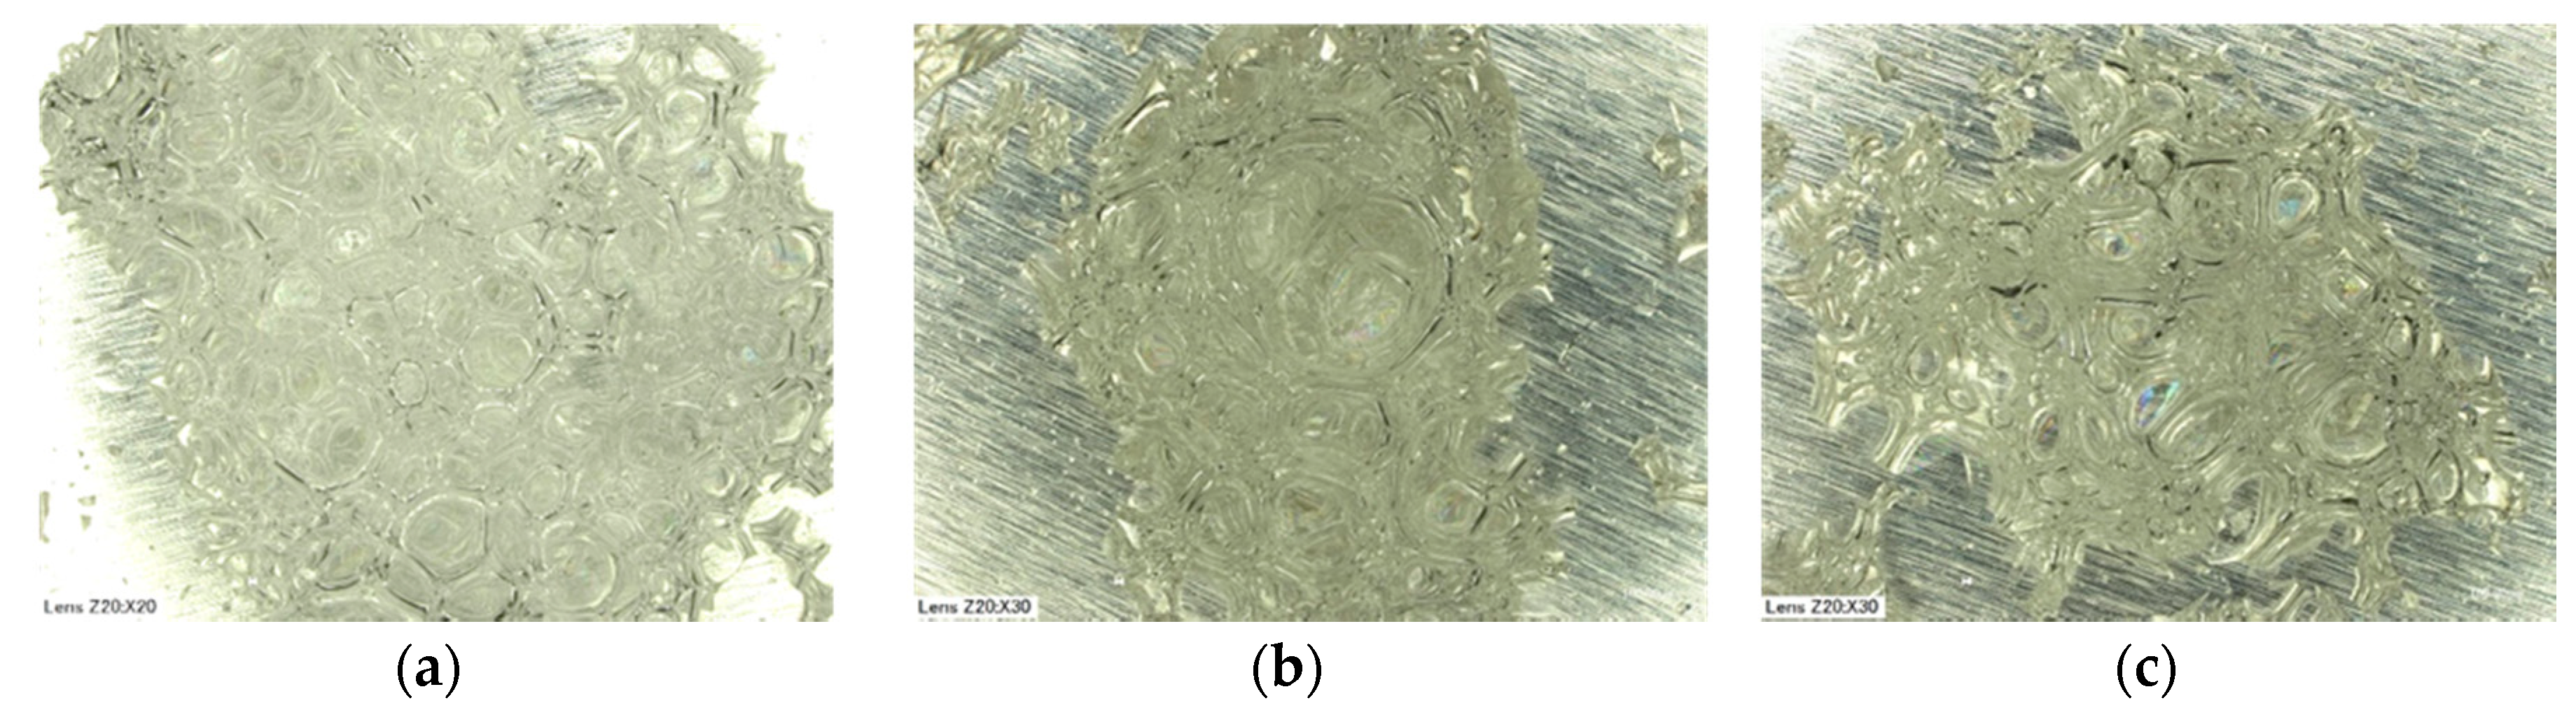
TG experiments enable us to define characteristic temperatures of degradation. Accordingly, heat treatments were performed at 300 °C in a tubular furnace and under a nitrogen flow on the silicone and the silicone/fillers systems (Figure 8). From the numerical pictures, the formation of an expanded foamed structure with small cells, whatever the phosphorus compound used is evidenced: the fillers do not modify the cellular structure. Finally, RDP and BDP have low influence on the thermal stability of the silicone resin; the amount of the remaining residue at 800 °C is almost the same, and the degradation process remains unchanged compared to the pure silicone. Based on those observations, the formation of an expanded coating during the test explains, at least partially, the fire protection brought by the paint and the silicone-based coating containing the fillers. The silicone and silicone/filler compositions allow the formation of a protective barrier, thus reducing heat transfers from the external heating source to the substrate.
Visual observations during the horizontal fire tests confirm the higher char yield obtained when phosphorus compounds are incorporated into the systems, even if thermal analyses did not show major improvements in terms of stability. Based on the literature review, phosphorus compounds accumulate in the condensed phase in the char layer, at the surface of the burning specimens in a blend of PC-ABS + RDP [26]. Results suggested that PC undergoes photo-fries rearrangement upon thermal decomposition, and RDP would react with the formed phenolic groups through a trans-esterification mechanism. Kinetic analysis of the thermal decomposition of PC containing RDP supported the proposed mechanism.
In conclusion, the high thermal stability of the silicone resin under inert atmosphere at elevated temperatures has been demonstrated. As this component is at the interface with the air in the self-stratifying coating composition, it will consequently be the first in contact with either the heat source or the flame during the fire tests. According to the results, the silicone resin provides some thermal stability to the system, which may explain the higher time to ignition obtained during MLC experiments. Under elevated temperatures, the silicone coating protects the underlying substrate (and the epoxy resin) from decomposition and creates a barrier between the heat source and the substrate. Moreover, the similar behavior in terms of thermal stability for the silicone resin with and without fillers could explain the close results at MLC test for all the epoxy/silicone coatings.

4. Conclusions

A properly-selected partially incompatible polymer blend composed of silicone, of a curable epoxy resin and of a liquid functional filler successfully formed a double-layered coating, showing excellent adhesion to the underlying polycarbonate substrate. The binders, dissolved in solvents to produce a two-phase liquid medium during film formation, led to structures with sharply defined layers. The topcoat layer was found to be composed of the silicone resin, and the base layer of the curable epoxy resin. Microscopic analyses demonstrated that phosphorus-based liquid fillers do not impact the stratification process when incorporated at 5 wt.%. However, their migration to the upper layer of the coating (silicone phase) was not always complete: a concentration gradient of additives through the film thickness is obtained, with a higher concentration toward the top of the coating. When fillers were incorporated at a lower amount (2.5 wt.%), incomplete phase separation was observed in some areas of the film, although a high adhesion rating (5B and 4B with RDP and BDP fillers respectively) and nice visual appearance remained.
The two phosphorus-based compounds led to an increase in the LOI value: up to 34 vol.% is obtained with 5 wt.% RDP compared to 27 vol.% for the unfilled system. However, the systems are still non classified at UL-94, even if combustion times with 5 wt.% additives are very close to a V1 rating. For MLC test at 35 kW/m², the coated samples do not ignite, and at 50 kW/m², the application of the epoxy/silicone coating allows delaying the TTI, with and without the presence of phosphate additives: improvements are due to the silicone resin and are not significantly modified by the addition of the liquid fire retardants. Synergistic effects between the two liquid fillers are not expected, the level of flame properties reached are mainly dependent on the amount of phosphorus introduced in the system.
Finally, numerous factors are of importance for the formation of two well separated layers. It is known that the efficiency and mechanism of action of phosphorus flame retardants in coating compositions are influenced and can be optimized by modifying them using specific synergists. In that respect, the surface tension of the paint components, their viscosity and the amount introduced in the coating compositions have a decisive role.

Supplementary Materials

The following are available online at https://www.mdpi.com/2079-6412/8/12/448/s1, Figure S1: HRR curves obtained with PC and coated PC with the self-stratified epoxy/silicone compositions containing RDP and BDP FR additives at 2.5 wt. % and 5 wt. % (the four curves overlapped).

Author Contributions

Conceptualization, A.B., M.J., M.C., S.B., S.D. (Stephanie Degoutin), S.D. (Sophie Duquesne), C.P. Methodology, A.B., M.J., S.B., C.P.; Software, S.B., C.P.; Validation, M.J., M.C., S.B., S.D. (Stephanie Degoutin), S.D. (Sophie Duquesne), C.P.; Investigation, A.B., S.B.; Resources, M.J., M.C., S.B., S.D. (Stephanie Degoutin), S.D. (Sophie Duquesne), C.P.; Data Curation, A.B.; Writing-Original Draft Preparation, A.B.; Writing-Review & Editing, M.J., M.C., S.D. (Stephanie Degoutin), S.D. (Sophie Duquesne), C.P.; Visualization, A.B., M.J., M.C.; Supervision, M.J., M.C. and S.D. (Sophie Duquesne); Project Administration, M.J.; Funding Acquisition, M.J.

Funding

This research was funded by the french ANR (Agence Nationale de la Recherche, No. ANR-14-CE27-0010), STIC project.

Acknowledgments

We are also thankful to the MATIKEM competitiveness cluster for supporting the project and Lille University for administrative support.

Conflicts of Interest

The authors declare no conflict of interest.

References

  1. Novak, B.M. Hybrid nanocomposite materials—Between inorganic glasses and organic polymers. Adv. Mater. 1993, 5, 422–433. [Google Scholar] [CrossRef]
  2. Mackulin, P.J.; Krafcik, R.B. Hybrid Latex Particles For Self-Stratifying Coatings. U.S. Patent 20140303281 A1, 9 October 2014. [Google Scholar]
  3. Wen, J.; Jordens, K.; Wilkes, G.L. Hybrid organic/inorganic coatings for abrasion resistance on plastic and metal substrates. MRS Online Proc. Lib. Arch. 1996, 435, 207. [Google Scholar] [CrossRef]
  4. Yagci, M.B.; Bolca, S.; Heuts, J.P.A.; Ming, W.; de With, G. Self-stratifying antimicrobial polyurethane coatings. Prog. Org. Coat. 2011, 72, 305–314. [Google Scholar] [CrossRef]
  5. Prolongo, S.G.; Moriche, R.; Sánchez, M.; Ureña, A. Self-stratifying and orientation of exfoliated few-layer graphene nanoplatelets in epoxy composites. Compos. Sci. Technol. 2013, 85, 136–141. [Google Scholar] [CrossRef]
  6. Funke, W. Preparation and properties of paint films with special morphological structure. J. Oil Colour Chem. Assoc. 1976, 59, 398–403. [Google Scholar]
  7. Murase, H.; Funke, W. Formation of two-phase coatings from a mixture of powdered polymers. In Congress Book, XVth FATIPEC Congress, 8ȁ13 June 1980, Amsterdam: 3E-Activities; Netherlands Association of Coatings Technologists NVVT: Amsterdam, The Netherlands, 1980; Volume 2, pp. 387–409. [Google Scholar]
  8. Toussaint, A. Self-stratifying coatings for plastic substrates (Brite euram project RI 1B 0246 C(H)). Prog. Org. Coat. 1996, 28, 183–195. [Google Scholar] [CrossRef]
  9. Verkholantsev, V.; Flavian, M. Polymer structure and properties of heterophase and self-stratifying coatings. Prog. Org. Coat. 1996, 29, 239–246. [Google Scholar] [CrossRef]
  10. Verkholantsev, V.; Flavian, M. Epoxy thermoplastic heterophase and self-stratifying coatings. Mod. Paint Coat. 1995, 85, 100–107. [Google Scholar]
  11. Vink, P.; Bots, T.L. Formulation parameters influencing self-stratification of coatings. Prog. Org. Coat. 1996, 28, 173–181. [Google Scholar] [CrossRef]
  12. Joseph, P.; Ebdon, J.R. Phosphorus-based flame retardants. In Fire Retardancy of Polymeric Materials, 2nd ed.; Wilkie, C.A., Morgan, A.B., Eds.; CRC Press: Boca Raton, FL, USA, 2010; pp. 107–127. [Google Scholar]
  13. Yeh, J.T.; Hsieh, S.H.; Cheng, Y.C.; Yang, M.J.; Chen, K.N. Combustion and smoke emission properties of poly(ethylene terephthalate) filled with phosphorous and metallic oxides. Polym. Degrad. Stab. 1998, 61, 399–407. [Google Scholar] [CrossRef]
  14. Dressler, H. The uses of resorcinol/derivatives in polymers. In Resorcinol: Its Uses and Derivatives; Springer: Boston, MA, USA, 1994. [Google Scholar]
  15. Price, D.; Anthony, G.; Carty, P. Introduction: Polymer combustion, condensed phase pyrolysis and smoke formation. In Fire Retardant Materials; Horrocks, A.R., Price, D., Eds.; CRC press: Cambridge, UK, 2001; pp. 1–30. [Google Scholar]
  16. Beaugendre, A.; Degoutin, S.; Bellayer, S.; Pierlot, C.; Duquesne, S.; Casetta, M.; Jimenez, M. Self-stratifying epoxy/silicone coatings. Prog. Org. Coat. 2017, 103, 101–110. [Google Scholar] [CrossRef]
  17. ASTM D3359-97 Standard Test Methods for Measuring Adhesion by Tape Test; ASTM International: West Conshohocken, PA, USA, 1997.
  18. ASTM E-906 Standard Test Method for Heat and Visible Smoke Release for Materials and Products; ASTM International: West Conshohocken, PA, USA, 1987; pp. 921–942.
  19. ASTM E-1354-90 Standard Test Method for Heat and Visible Smoke Release for Materials and Products Using an Oxygen Consumption Calorimeter; ASTM International: West Conshohocken, PA, USA, 1990.
  20. ISO 4589-2 Determination of Burning Behavior by Oxygen Index; International Organization for Standardization: Geneva, Switzerland, 2017.
  21. IEC 60695-11-10 Fire Hazard Testing—Part 11-10: Test Flames—50W Horizontal and Vertical Flame Test Methods; International Electrotechnical Commission: Geneva, Switzerland, 2013.
  22. ICL Industrial Product, Fyrolflex® BDP, Bis-phenol A-bis(diphenyl phosphate). Available online: http://icl-ip.com/wp-content/uploads/2012/05/090625_Fyrolflex_BDP.pdf (accessed on 5 December 2018).
  23. ICL Industrial Product, Fyrolflex™ RDP, Resorcinol bis(diphenyl phosphate). Available online: http://icl-ip.com/products/fytol-rdp/ (accessed on 5 December 2018).
  24. Verkholantsev, V.V. Nonhomogeneous-in-layer coatings. Prog. Org. Coat. 1985, 13, 71–96. [Google Scholar] [CrossRef]
  25. Gardelle, B.; Duquesne, S.; Vu, C.; Bourbigot, S. Thermal degradation and fire performance of polysilazane-based coatings. Thermochim. Acta 2011, 519, 28–37. [Google Scholar] [CrossRef]
  26. Murashko, E.A.; Levchik, G.F.; Levchik, S.V.; Bright, D.A.; Dashevsky, S. Fire-retardant action of resorcinol bis(diphenyl phosphate) in PC–ABS blend. II. Reactions in the condensed phase. J. Appl. Polym. Sci. 1999, 71, 1863–1872. [Google Scholar] [CrossRef]
Figure 1. Self-layering concept.
Coatings 08 00448 g001
Figure 2. EDS X-ray mappings of Silicon and Phosphorus on a cross-section of an epoxy/silicone coating filled with 5 wt.% of (a) resorcinol bis(diphenyl phosphate) (RDP) and (b) bisphenol-A-bis(diphenyl phosphate) (BDP) additives.
Coatings 08 00448 g002
Figure 3. Scanning Electron Microscopy (SEM) pictures of the cross-section of the ternary system filled with 2.5 wt.% of BDP.
Coatings 08 00448 g003
Figure 4. Heat release rate (HRR) curves obtained with uncoated polycarbonate (PC) and coated PC with the self-stratified epoxy/silicone compositions containing (a) RDP and (b) BDP flame retardant (FR) additives at 2.5 wt.% and 5 wt.%.
Coatings 08 00448 g004
Figure 5. HRR curves obtained with uncoated PC and coated PC with the self-stratified epoxy/silicone coating, the epoxy coating and the silicone coating alone.
Coatings 08 00448 g005
Figure 6. Comparison of TG and DTG curves of the silicone system with and without (a) RDP and (b) BDP (10 wt.%) under nitrogen at a heating rate of 20 °C/min.
Coatings 08 00448 g006
Figure 7. Weight difference curves between experimental and calculated TG curves when RDP or BDP is added to the resin (10 wt.%) under N2 conditions.
Coatings 08 00448 g007
Figure 8. Numerical pictures of residues of (a) silicone, and (b) silicone/RDP, (c) silicone/BDP at 10 wt.% at 300 °C.
Coatings 08 00448 g008
Table 1. Morphology and adhesion properties of the coatings containing or not phosphate additives.
Fillerwt.%Fillers Location after Film FormationAppearance of the CoatingThickness (µm)Adhesion RatingStratification Pattern
No filler0Slightly rough, glossy555BI
RDP2.5Mainly in the silicone layer, sight concentration gradient near the silicone-epoxy interfaceLess rough than without additive, higher gloss455BII-III
5605BI
BDP2.5High concentration in the silicone layer, concentration gradient in the epoxy phase from top to bottom684BII-III
5304BI
Table 2. Mass loss calorimeter (MLC) values obtained at 35 and 50 kW/m with uncoated and coated PC with the epoxy/silicone composition with and without FR additives.
Heat Flux, Parameters MeasuredRaw PCNo AdditiveWith RDPWith BDP
2.5 wt.%5 wt.%2.5 wt.%5 wt.%
35 kW/m²TTI (s)319No ignitionNo ignitionNo ignition
pHRR (kW/m²)202
THR (MJ/m²)35
50 kW/m²TTI (s)92148154143140132
pHRR (kW/m²)231176189 (+7%) 1209 (+19%)174 (−1%)180 (+2%)
THR (MJ/m²)524145 (+9%)50 (+21%)44 (+7%)50 (+21%)
1 Percentages represent the difference compared to the unfilled epoxy/silicone system.
Table 3. MLC values obtained at 50 kW/m² with uncoated and coated PC with the epoxy/silicone self-stratifying coating, the epoxy and the silicone coating solely.
Parameters MeasuredUncoated PCCoated PC
Epoxy/Silicone Self-Stratifying CoatingEpoxy CoatingSilicone Coating
TTI (s)9214880131
pHRR (kW/m²)231176 (−24%) 1238 (+3%)206 (−11%)
THR (MJ/m²)5241 (−21%)53 (+2%)45 (−13%)
1 Percentages represent the difference compared to uncoated PC.
Table 4. LOI, UL-94 rating for PC, and coated PC with the binary and ternary mixtures.
Fire TestRaw PCNo AdditiveWith RDPWith BDP
2.5 wt.%5 wt.%2.5 wt.%5 wt.%
LOI (vol.% O2)272827342632
Coatings 08 00448 i001 Coatings 08 00448 i002 Coatings 08 00448 i003 Coatings 08 00448 i004 Coatings 08 00448 i005 Coatings 08 00448 i006
UL-94NC
Dripping
NC
No dripping
NC
No dripping
NC
No dripping
NC
No dripping
NC
No dripping
Coatings 08 00448 i007 Coatings 08 00448 i008 Coatings 08 00448 i009 Coatings 08 00448 i010 Coatings 08 00448 i011 Coatings 08 00448 i012
Table 5. Time of the two flaming combustions during UL-94 test.
SampleRaw PCNo AdditiveWith RDPWith BDP
2.5 wt.%5 wt.%2.5 wt.%5 wt.%
Ignition1st2nd1st2nd1st2nd
Flaming combustion time241516902836
321767195
18236472780
116250413
2351154220
Total flaming time1086695199120154

