Article

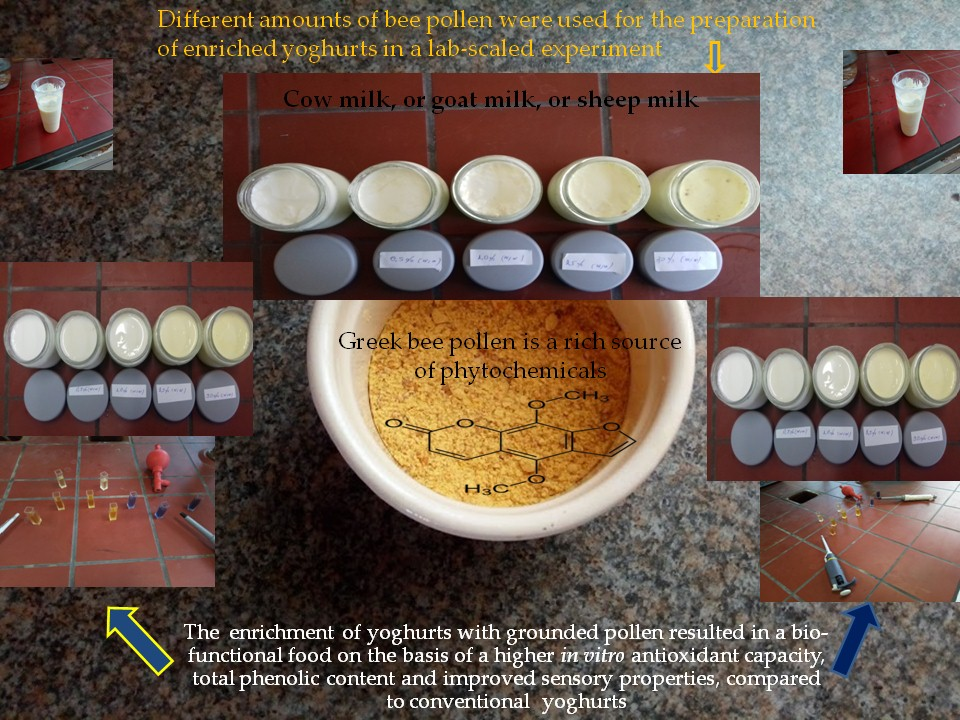
Bio-Functional Properties of Bee Pollen: The Case of “Bee Pollen Yoghurt”

by
Ioannis K. Karabagias
*,
Vassilios K. Karabagias
,
Ilias Gatzias
and
Kyriakos A. Riganakos
Laboratory of Food Chemistry, Department of Chemistry, University of Ioannina, 45110 Ioannina, Greece
*
Author to whom correspondence should be addressed.
Coatings 2018, 8(12), 423; https://doi.org/10.3390/coatings8120423
Submission received: 7 October 2018 / Revised: 30 October 2018 / Accepted: 21 November 2018 / Published: 24 November 2018

Abstract

:
The objectives of the present work were: (a) to characterize bee pollen from the region of Epirus in terms of biofunctional activity parameters as assessed by (i) the determination of specific polyphenols using high performance liquid chromatography electrospray ionization mass spectrometry (HPLC/ESI-MS), (ii) antioxidant capacity (DPPH assay), and (iii) total phenolic content (Folin-Ciocalteu assay), and (b) to prepare yoghurts from cow, goat, and sheep milk supplemented with different concentrations of grounded bee pollen (0.5, 1.0, 2.5 and 3.0%, w/v), and study afterwards the trend in antioxidant capacity and total phenolic content along with product’s sensory properties. Results showed that bee pollen ethanolic extracts are a rich source of phytochemicals based on the high total phenolic content and in vitro antioxidant activity that were monitored. The addition of grounded bee pollen in yoghurts resulted in a food matrix of a higher in vitro antioxidant capacity and total phenolic content, whereas it improved the yoghurt’s taste, odour, appearance, and cohesion; the latter indicates its beneficial use as a general food surface and interface material enhancer due to the possible formation of surface/interface active lipid-linked proteins. Based on the present findings, bee pollen yoghurt is proposed as a novel and costless functional food whereas it may comprise a research basis for food or material science in the scientific society of the future. Results were further supported by implementation of advanced chemometric analyses providing a full characterization of the product’s uniqueness.

Graphical Abstract

1. Introduction

Research on the properties and health benefits of functional foods has greatly expanded the last 35 years. The term “functional foods” may be used to describe a food given an additional function in terms of health promotion or disease prevention, by adding new components or more of the existing components, or even highlight the synergistic action between specific or new bio-molecules that may be formed. The term was first introduced in Japan in the 1980s where there was a government approval process for functional foods called: “Foods for Specified Health Use”. On the other hand, the functional food industry, consisting of food, beverage, and supplement sectors, is one of several areas of the food industry that is experiencing fast growth in recent years [1].
A great bet, however, for researchers and food industry is that functional foods should be prepared to have physiological benefits and/or reduce the risk of chronic disease beyond basic nutritional functions and to be similar in appearance to conventional food and consumed as part of a regular diet [2]. It has been well documented that a regular diet based on the consumption of antioxidants (polyphenols) may enhance healthcare. Some common natural sources of polyphenols comprise vegetables, fruits or fruit juices, olive oil, beans, etc. [3]
An alternative natural based product that is in the spotlight of research, and could serve as a functional food, is bee pollen. Bee pollen is the pollen ball that has been packed by worker honeybees into pellets. The chemical composition of bee pollen depends on the plants the worker bees gather the pollen from, and may vary from hour to hour, day to day, week to week, colony to colony, even in the same apiary. Although there is no specific chemical composition, the average composition is reported to be 40%–60% simple sugars (fructose and glucose), 20%–60% proteins, 3% minerals and vitamins, 1%–32% fatty acids, and 5% diverse other components including among others considerable amounts of vitamins, flavonoids, and phenolic acids [4]. Some potential applications of bee pollen include its use in apitherapy and as a functional food in the food industry due to pollen nutritional and sensory properties along with its potential in medical and nutritional applications [5]. Bee pollen has demonstrated numerous health promoting actions, such as antifungal, antimicrobial, antiviral, anti-inflammatory, hepatoprotective, anticancer immune-stimulating, and local analgesic properties [6]. In a recent work, Graminex pollen (Graminex™, Deshler, OH, USA) characterized as a promising natural product for the management of the inflammatory components in the prostate [7].
On the other hand, yoghurt is a favourable milk product that is widely consumed. It is produced by bacterial fermentation of milk. The bacteria used to make yoghurt are known as “yoghurt cultures”. Fermentation of lactose by these bacteria produces lactic acid, which acts on milk protein to give yogurt its texture and characteristic tart flavour [8]. Cow’s milk is commonly available worldwide and serves as the dominant type of milk for the preparation of yoghurt. Milk from water buffalo, goats, ewes, mares, camels, and yaks (if available) is also used for the production of yogurt. Lactobacillus delbrueckii subsp. bulgaricus and Streptococcus thermophilus bacteria are used as starting cultures for the production of yoghurt. In addition, other lactobacilli and bifidobacteria may also be added during or after culturing yoghurt.
Recent studies have demonstrated that bee pollen-based yoghurt using probiotic bacteria as culture starters improved sensory and rheological characteristics, especially body and texture of the enriched product, compared to conventional made yoghurt. Furthermore, the addition of bee pollen in yoghurts or milk-fermented beverages decreased microorganisms’ population during storage [9,10,11]. The enrichment of yoghurts with different fruits or plants resulted in increasing its in vitro antioxidant properties using the 2,2-diphenyl-1-picryl hydrazil (DPPH) and ferric reducing antioxidant power (FRAP) assays, respectively [12,13].
Given the fact that there are limited studies in the literature that highlight the antioxidant capacity and total phenolic content of Greek bee pollen [14], along with the fact that there is no study in the literature reporting the in vitro antioxidant capacity and total phenolic content of bee pollen-enriched yoghurts, the aim of the present work was to investigate the polyphenol profile of bee pollen using HPLC/ESI-MS analysis along with the antioxidant properties of its ethanolic extracts. A further investigation included the question: Would the addition of different amounts of grounded bee pollen in prepared yoghurt of different milk types result in an acceptable and authentic product of high in vitro antioxidant capacity, total polyphenol content, and improved sensory properties? May grounded bee pollen be used as a surface and interface material enhancer to improve appearance and cohesion of yoghurt? What are the limitations and benefits? This information has been provided throughout the present study for the first time in the literature and it has been further supported by implementation of advanced chemometrics.

2. Materials and Methods

2.1. Bee Pollen Samples

Pollen originating from a mixture of flowers (400 g) (Papaver rhoes, Chamomila recutita, Sinapis arvensis, Cistus sp., Trifolium sp., Dorycnium sp., Cichorium sp., Convolvulus sp., Circium sp., Malva sylvestris, Fumana sp., Eucalyptus camaldulensis, Anemone sp., Ononis sp., Asphodelus sp., Quercus ilex) was purchased from a local supermarket in Ioannina, Epirus, Greece. The pollen brand name was: Greek Bee Pollen (Attiki Bee Culturing Co.-Alex Pittas S.A., Athens, Greece). ATTIKI bee pollen is a totally pure, natural, and completely unprocessed foodstuff, that consists of protein, amino acids, sugars, minerals, vitamins, flavonoids, and other compounds of immense biological value. Some typical compositional data are given in Supplementary Materials (Table S1). The bee pollen was blended prior analyses using a commercial house-hold blender (Izzy Multi Plus, Kalamata, Greece).

2.2. Collection of Milk and Preparation of Yoghurt Samples

The cow and goat milk samples used were purchased from a local supermarket, whereas those of sheep milk were donated by local farmers. The typical composition of milk samples including fat, protein, salt and ash contents along with pH is given in Supplementary Materials (Table S1) Therefore, thirty yoghurt samples (N = 30), including control samples, were prepared after supplementation with 0.50, 1.00, 2.50 and 3.00% (w/v) of ground bee pollen with respect to each milk type. In particular, the number of yoghurt samples used in the study was as follows: 10 samples of cow milk, 10 samples of goat milk, and 10 samples of sheep milk.
Yoghurt samples were prepared as follows: 150 mL of cow and goat milk were heated at a temperature of 72 °C for 3 s in order to eliminate any source of exοgenous contamination during milk handling, since these milk types were already pasteurized. For the preparation of sheep yoghurt, sheep milk was boiled for 5 min in order to eliminate undesired microorganisms, remove oxygen, and to provide good cohesion in yoghurts by coagulation of milk serum proteins. After boiling, 150 mL of milk was transferred into polypropylene plastic containers (thermal resistance to liquids at temperature of ≤120 °C) to cool until 45 °C (alternatively the whole procedure can be followed in glass containers) (graphical abstract). Afterwards a starting culture (live yoghurt) (Streptococcus thermophilus and Lactobacillus bulgaricus) of ca. 3 g of commercial yoghurt was added and samples were properly mixed. Fermentation of milk was completed after 7 h in a yoghurt incubator (JH 650, ismet, VS-Schwenningen, Germany) at a temperature of 40–45 °C. The samples were then cooled at room temperature and coagulation was accomplished at a refrigerated temperature of 4 ± 1 °C within 7 h.

2.3. Reagents and Solutions

Gallic acid (3,4,5-trihydrobenzoic acid) anhydrous for synthesis was purchased from Merck (Darmstadt, Germany). Ethanol absolute for analysis, acetate buffer (CH3COONa·3H2O), Folin-Ciocalteu phenol reagent, sodium chloride (NaCl), and sodium carbonate (Na2CO3) were purchased from Merck. Water and acetonitrile for HPLC analysis were purchased from Merck. Finally, 2,2-diphenyl-1-picrylhydrazyl (DPPH), acetic acid (CH3COOH), and quercetin (3,5,7,3′,4′-pentahydroxyflavone) ≥95%, were purchased from Sigma-Aldrich (Munich, Germany).

2.4. Physicochemical Parameter Analysis

The typical composition and physicochemical properties of bee pollen and milk types used for the preparation of functional yoghurts, with respect to total fat, saturated fat, protein, sugars, fibre, and salt contents were provided by the suppliers. Ash content and pH of milk types used were determined according to the methodology described in the Supplementary Materials (Section S.1). The same methodology was followed for the determination of pH in the prepared yoghurts.

2.5. Extraction of Phenolic Compounds

Approximately 5 g of dried pollen grains were placed in a glass vial containing 40 mL of ethanol. The vial with the prepared solution (mother solution A: 125,000 mg∙L−1) was wrapped with aluminium foil, vortexed for 5 min and then every 1 h for 8 h. Finally, it was left in a dark place at room temperature for 24 h until exhaustive extraction [15]. Additionally, the mother solution A was kept at −18 °C and used for the determination of phenolic compounds and total phenolic content (TPC). The whole experimental procedure is given in the Supplementary Materials (Section S.2).

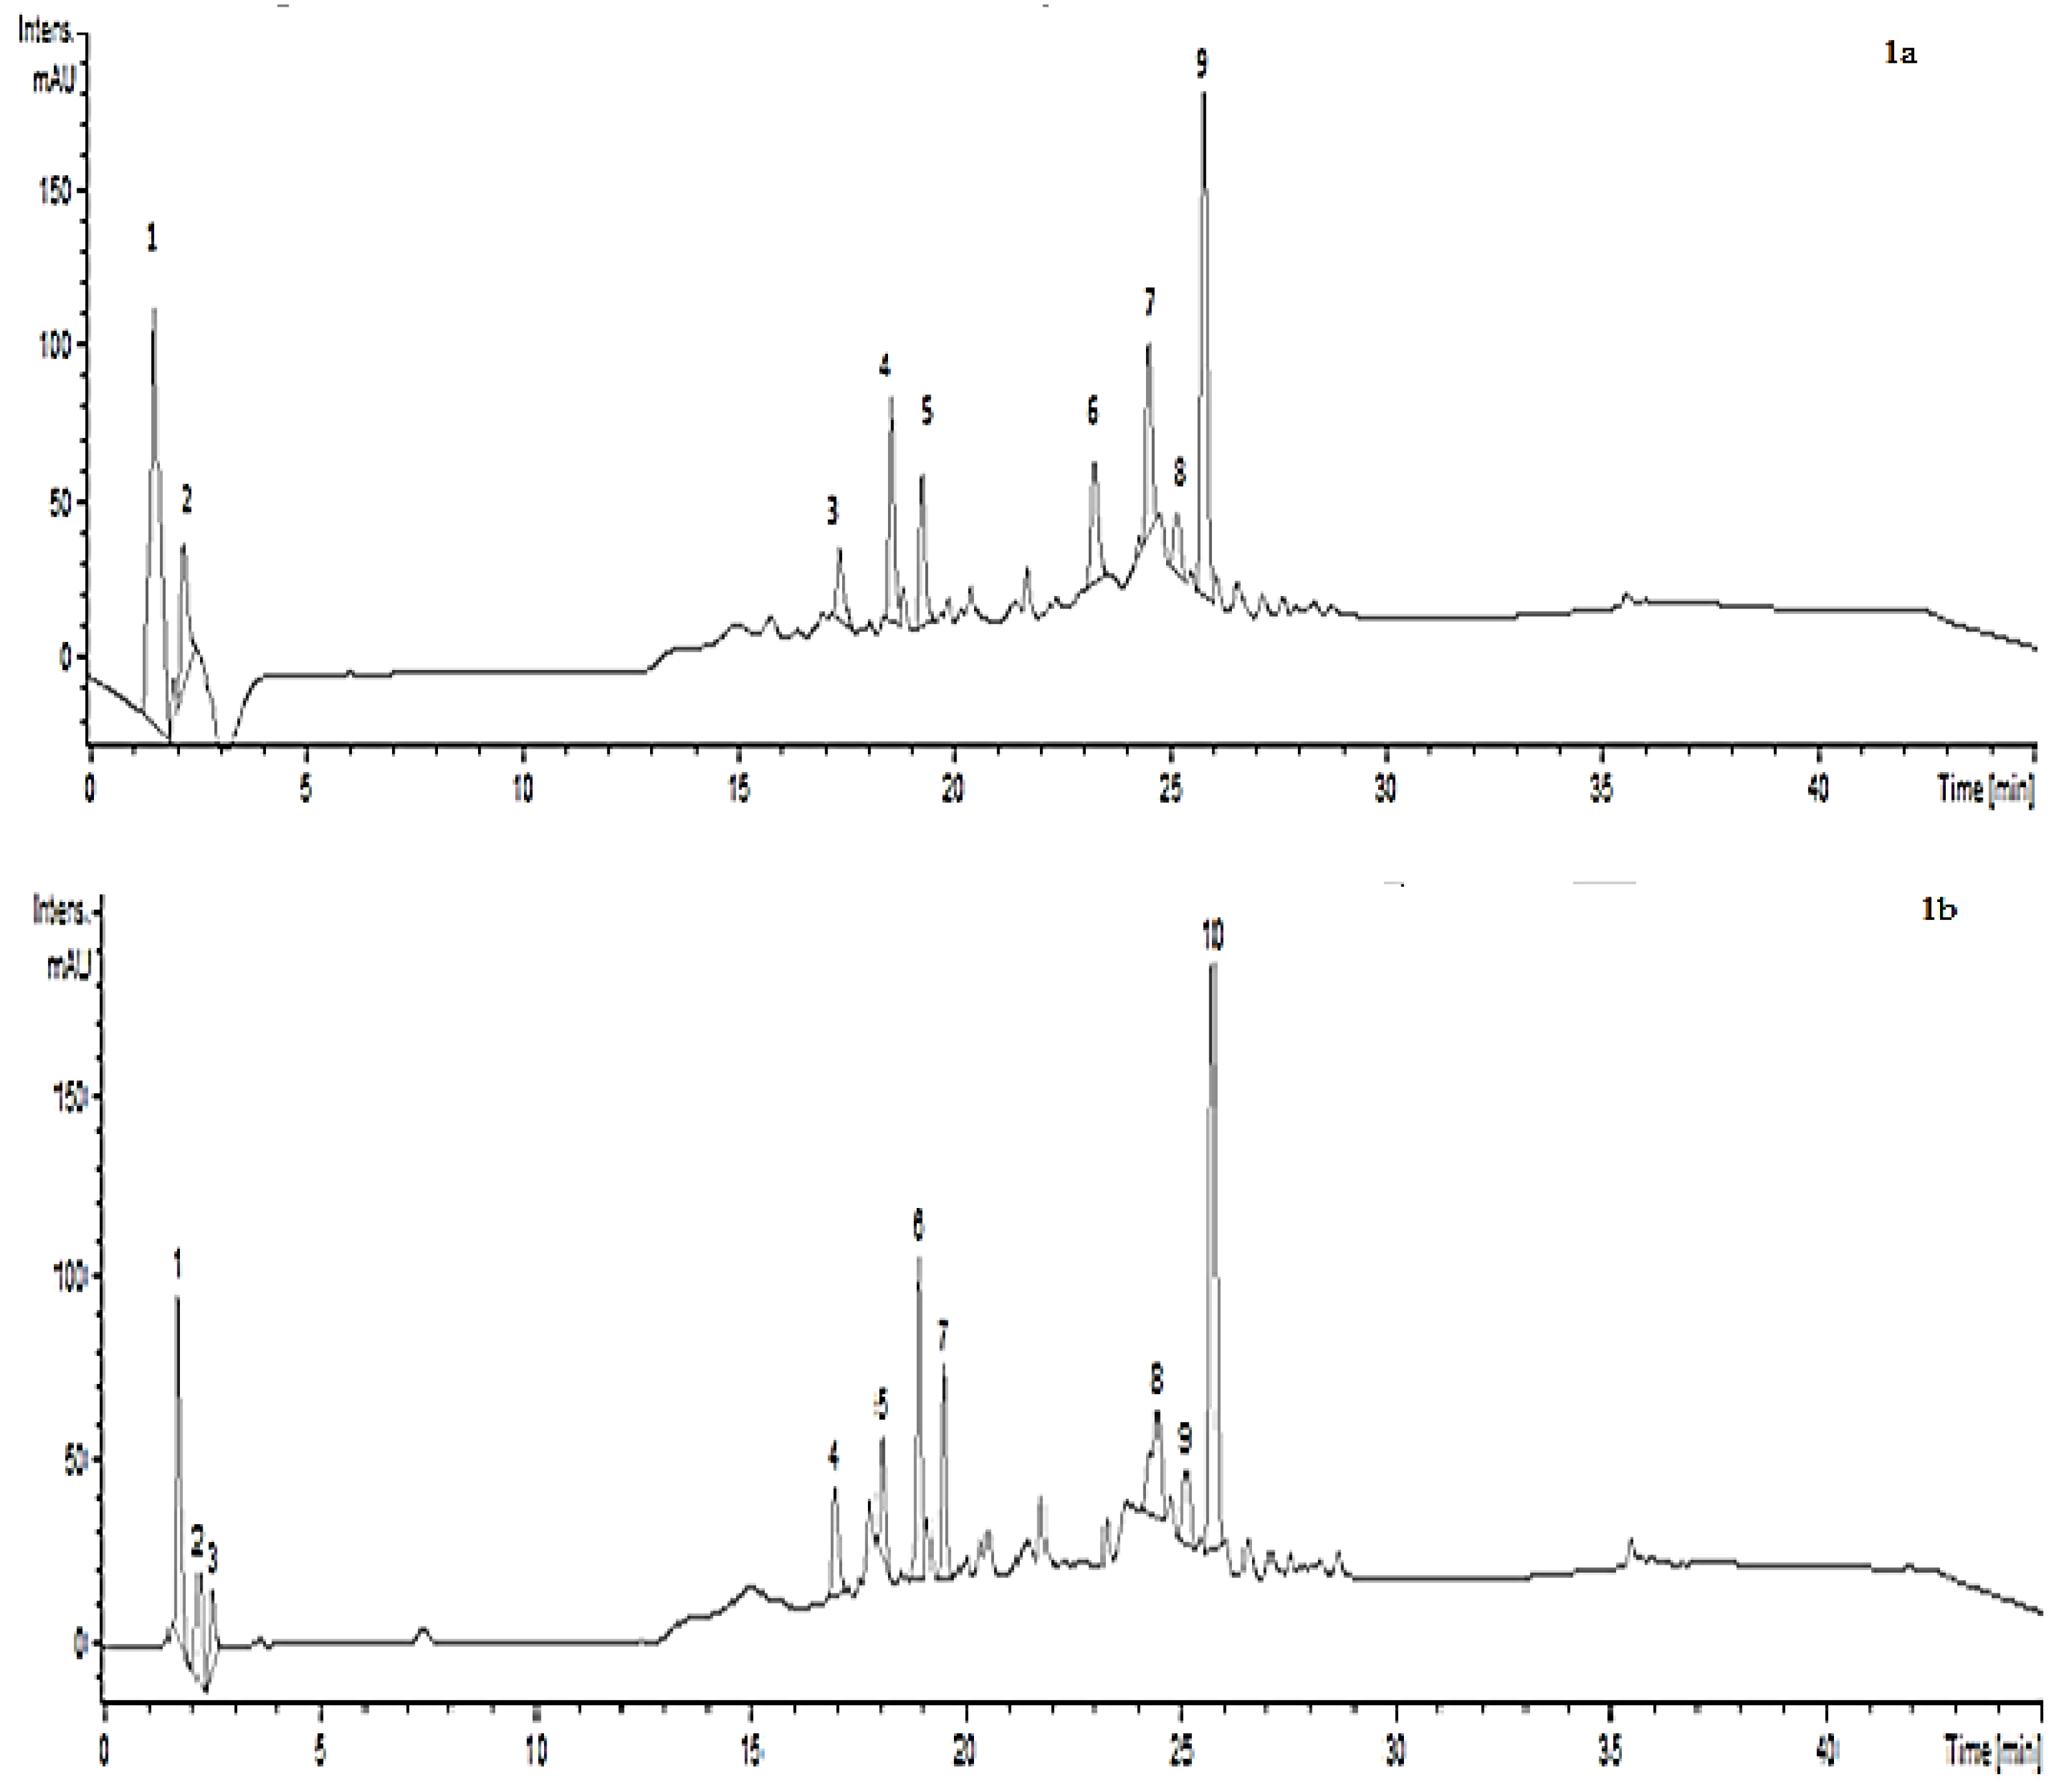
2.6. Analysis of Bee Pollen Phenolic Compounds Using High Performance Liquid Chromatography Electrospray Ionization Mass Spectrometry (HPLC/ESI-MS)

HPLC analysis (qualitative determinations) of bee pollen phenolic compounds was carried out according to a previous work with modifications [16]. ESI-MS analysis conditions are fully described in the Supplementary Materials (Section S.3).

2.7. Determination of Total Phenolic Content

The total phenolic content of bee pollen (BP) and yoghurt samples enriched with bee pollen (BPY) of different concentrations was determined using the Folin-Ciocalteu colorimetric method [17]. The absorbance of the obtained reaction medium (final volume of 5 mL) was measured after 2 h (time starts when Folin-Ciocalteu reagent is added to the medium) at 760 nm in a UV–Vis Spectrophotometer (SHIMADJU, UV-1280, Kyoto, Japan). Prior absorbance measurements all solutions were filtered using Whatman filters (GD/X 25 mm Syringe Filter, Nylon 0.45 µm, w/GMF, G E Healthcare Whatman, Buckinghamshire, UK) with a pore size of 0.45 μm. For quantification purposes, a calibration curve of standard gallic acid (Figure S1a) was constructed in the range of 195–6240 mg∙L−1. The respective equation was as follows:
y = 0.0004x + 0.2041; R2 = 0.9954
Total phenolic content was expressed as mg of gallic acid equivalents per mL of pollen extract or yoghurt, respectively. Each sample was run in triplicate (n = 3).

2.7.1. Preparation of DPPH Free Radical Standard Solution

A standard solution of [DPPH] in ethanol equal to ca. 0.29 mM (mmol L−1) was prepared according to Karabagias et al. [15].

2.7.2. Preparation of DPPH Free Radical Calibration Curve

In order to estimate the % decrease in [DPPH] absorbance (% antioxidant capacity—%AC) and the % decrease in the free radical concentration of the final mixture obtained after the addition of bee pollen ethanolic extracts or pollen based yoghurts, namely Δ[DPPH], during the DPPH assay, the construction of a calibration curve is mandatory [15,18]. A calibration curve of concentration versus absorbance of [DPPH] was constructed by preparing ethanolic dilutions of [DPPH] in the range of 0–116 mg∙L−1 (Figure S1b). The calibration curve of absorbance (y) versus concentration (x) of [DPPH] was expressed by the following equation:
y = 0.0213x − 0.0411; R2 = 0.9901

2.7.3. Determination of In Vitro Antioxidant Capacity of Bee Pollen Ethanolic Extracts and Pollen Enriched Yoghurts

The antioxidant capacity of pollen ethanolic extracts and pollen based yoghurts was estimated in vitro using the [DPPH] assay according to the methodology described in previous studies with some modifications [15,18]. The whole experimental procedure is given in the Supplementary Materials (Section S.4).

2.7.4. Sensory Analysis

Sensory analysis was based on descriptive test, carried out by a group of seven experienced panellists. The panel was trained in discrimination of small differences in sensory characteristics among the prepared yoghurts. The panellists were consisted of four males and three females (aged between 25–64 years old). The sensory characteristics evaluated were taste, odour, appearance and cohesion. A five-point scale was used for the estimation of the aforementioned sensory characteristics. The scale was set as follows: 5 = excellent, 4 = very good, 3 = acceptable, 2 and 1 = not acceptable.

2.8. Statistical Analysis

The differences of bee pollen ethanolic extracts and enriched yoghurts with respect to the in vitro antioxidant capacity and total phenolic content values were tested using T-test at the confidence level p < 0.05. A T-test was also applied to evaluate the differences of bee pollen prepared yoghurts with respect to sensory analysis carried out (taste, odour, appearance, cohesion). Furthermore, in order to evaluate whether the prepared yoghurts (control and enriched with bee pollen) could be classified with respect to milk type used, multivariate analysis of variance (MANOVA) and linear discriminant analysis (LDA) was applied to the whole set of data according to Miller and Miller [19] and Karabagias et al. [15]. Wilks’ Lambda index, as a probability distribution used in multivariate hypothesis testing, was computed to determine a possible significant effect of the examined parameters with respect to the milk type used for the preparation of yoghurts.
In order investigate further the potential of preparing such yoghurts at a commercial level (by pointing out specific predictors of product’s uniqueness), a regression analysis model was built using antioxidant capacity/total phenolic content values and sensory analysis data based on analysis of variance (ANOVA). The efficiency of the model was estimated by calculating the squared-R2, predicted-R2, and adjusted-R2 parameters (Supplementary Materials). Correlations were obtained by Pearson’s correlation coefficient (r), at the confidence level p < 0.05. Statistical analysis was performed using the SPSS v.20.0 statistics software.

3. Results and Discussion

3.1. Physicochemical Parameter Analysis

Table S1 lists the typical composition and physicochemical properties of bee pollen and milk types used for the preparation of bee pollen yoghurts. In addition, the pH of the prepared yoghurts was measured and confirmed the lactic acid fermentation during yoghurt preparation (Supplementary Materials, Section S.5).

3.2. Phytochemicals of Bee Pollen

Bee pollen has been reported to possess considerable amounts of flavonoids (kaempferol, quercetin, isorhamnetin, etc.), phenolic acids (p-coumaric acid, ferulic acid, their glycerol esters, and glycerol ester of caffeic acid) or other phytochemicals [4,14].
HPLC/ESI-MS analysis of bee pollen ethanolic extracts showed the presence of furancoumarins (isopimpinellin) and hydroxycoumarins (urolithin B), flavononols 3-O- or 7-O-glucosides (quercetin 3-O-rhamnosyl-galactoside, quercetin 3-O-xylosyl-glucuronide, Isorhamnetin-3-O-glucoside 7-O rhamnoside, quercetin 3-O-rutinoside) and a minor contribution of phenolic acids hydroxycinnamic acids (hydroxyl caffeic acid, coumaroyl tyrosine) as these were identified using the Phenol-Expoler 3.6 database (Figure 1a,b) (Table 1) at 254 ± 2 nm [20]. What is of great interest is that 10 more unknown polyphenols were isolated.
In a similar work carried out by Graikou et al. [14] in the aqueous fractions of bee pollen from the region of Peloponnese, bee pollen samples contained kaempferol 3-O-rhamnoside, quercetin 3-O-glucoside, quercetin 3-O-galactoside, quercetin 3-O-rhamnoside, isorhamnetin 3-O-xylosyl(1-6) glucoside, 7-Omethylherbacetin 3-O-sophoroside, and 7-O-methylherbacetin 3-O-glucosyl-8-O-galactoside. With a fast look on the aforementioned results, it is clearly shown that the isolated flavonoids were flavonols 3-glycosides, in agreement with results of the present study. In another study, similar in structure compounds were identified in bee pollen from New Zealand and Portugal [21]. Another important observation, through the literature cited articles, is that the phytochemical composition of bee pollen may be affected by botanical and geographical origin [14,21].

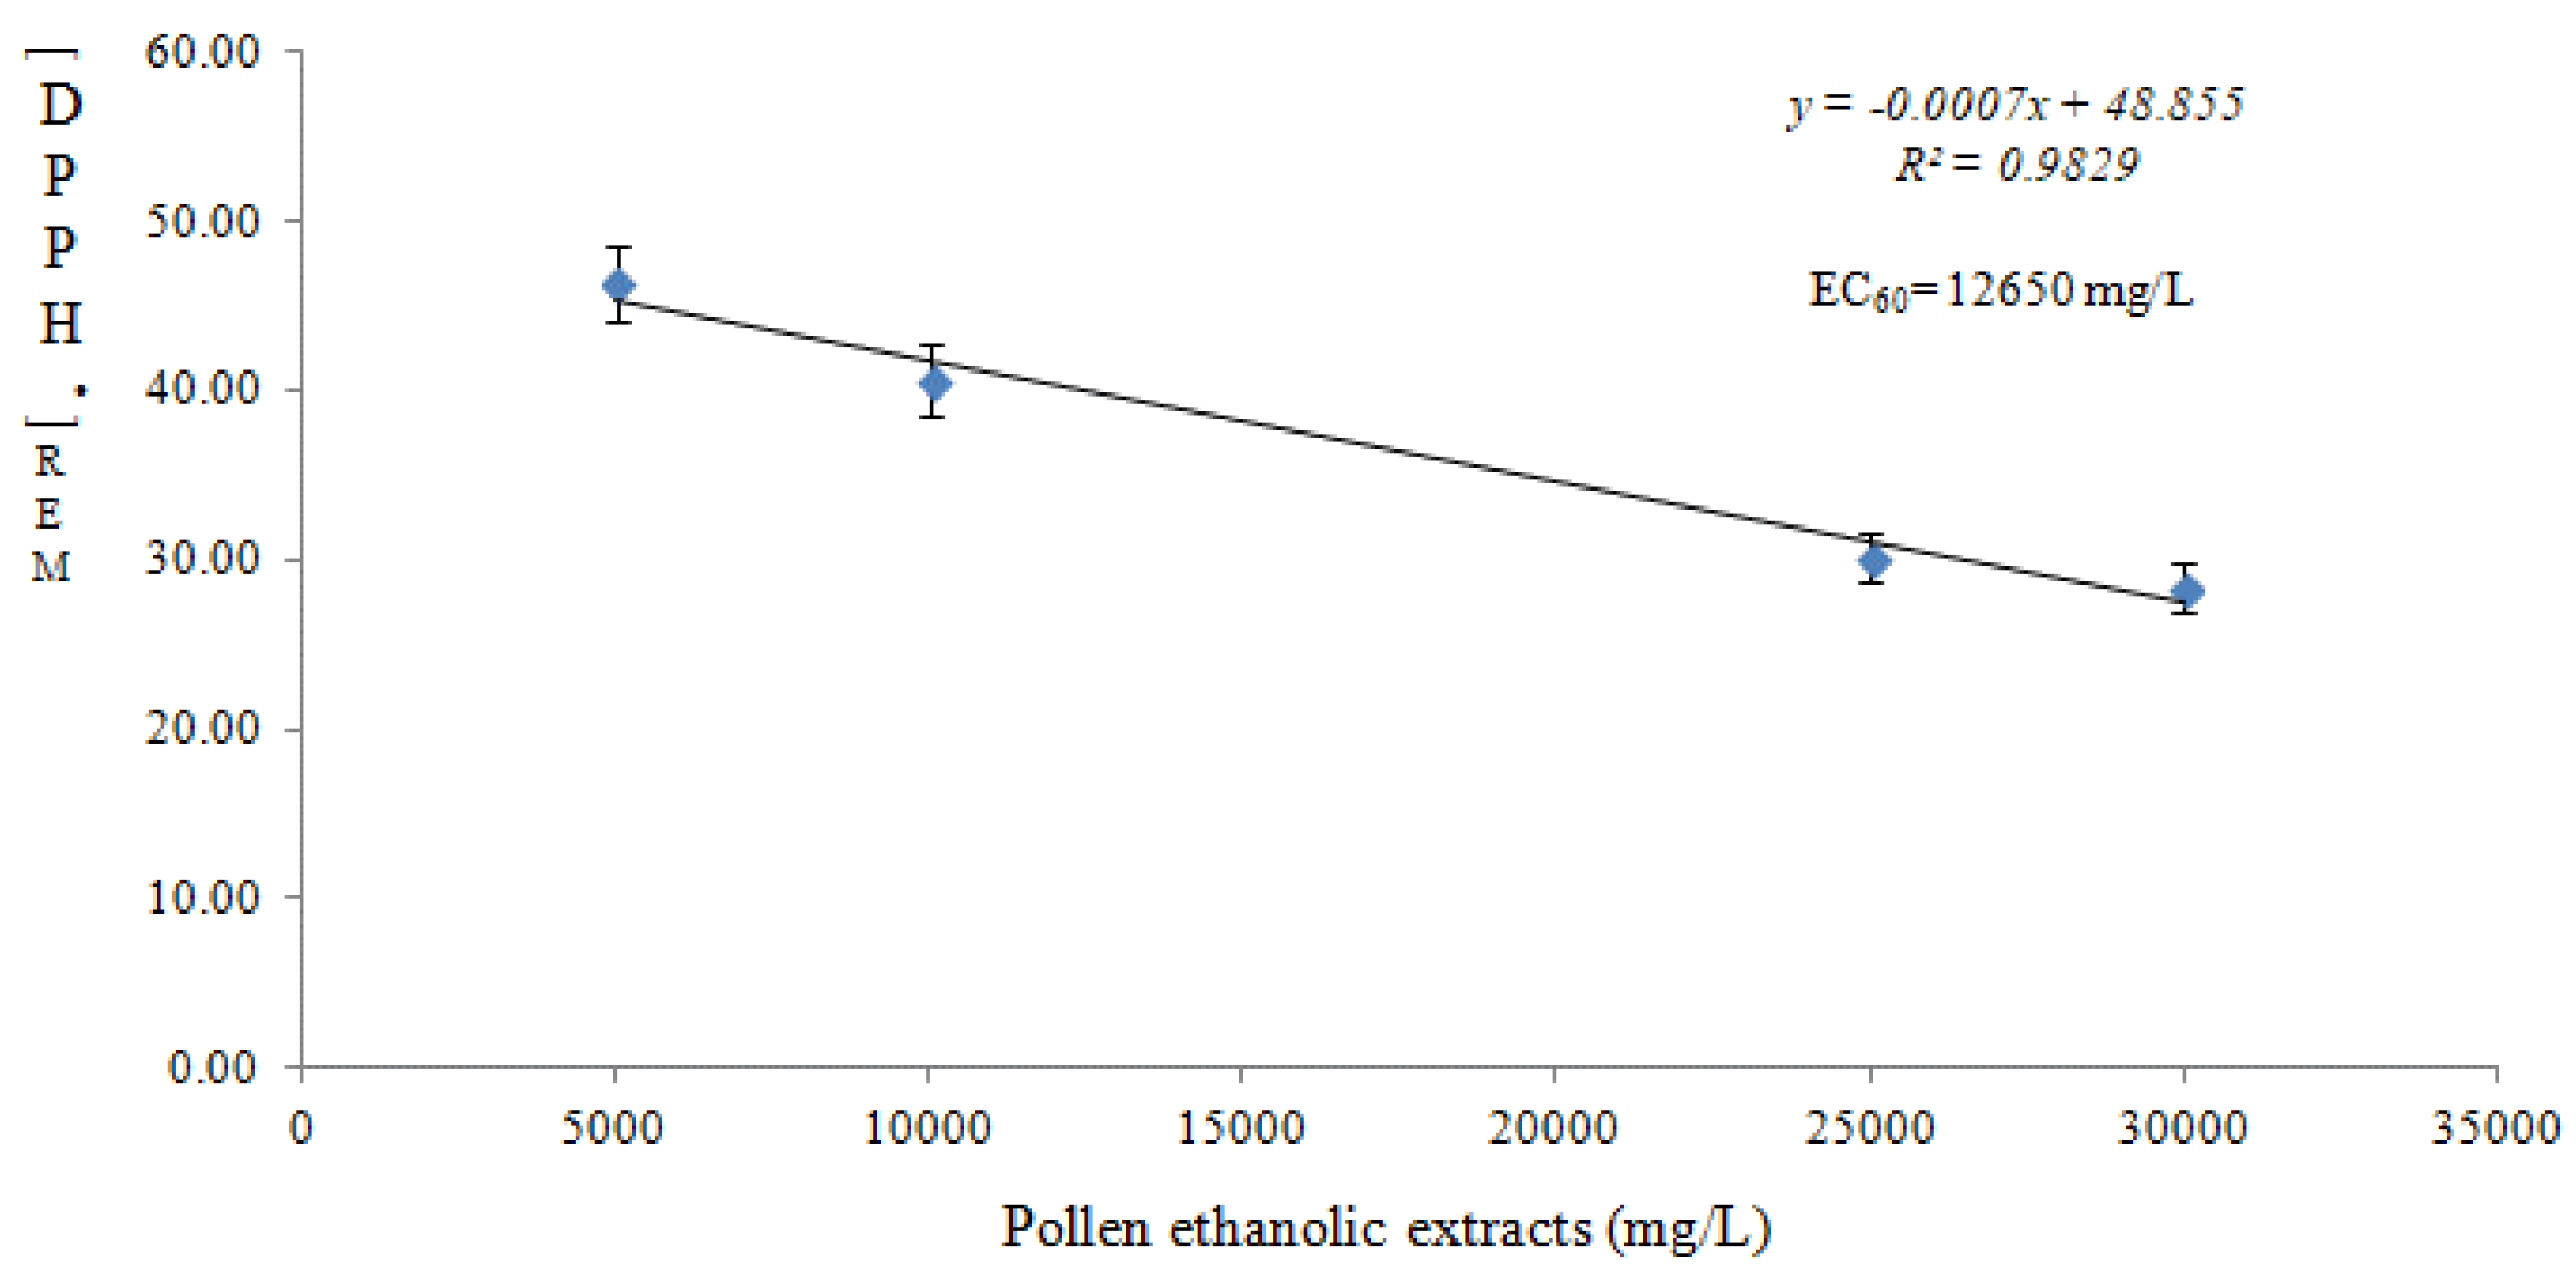
3.3. In Vitro Antioxidant Capacity of Bee Pollen Ethanolic Extracts

The in vitro antioxidant capacity of Greek bee pollen was affected by the ethanolic extract concentration. The mother bee pollen ethanolic solution (125,000 mg L−1) recorded the higher antioxidant capacity (88.26%) followed by those of 30,000 (86.81%), 25,000 (81.75%), 10,000 (71.06%), and 5000 (68.7%) mg∙L−1, respectively (Table 2). However, the concentration of bee pollen ethanolic extracts included those of 30,000, 25,000, 10,000, and 5000 mg∙L−1, in order to have the same concentration of ground bee pollen added in the prepared yoghurts. The high in vitro antioxidant capacity of Greek bee pollen ethanolic extracts led us to propose a new index of the effective concentration of antioxidants against the DPPH free radical, the EC60 value, defined as the amount of natural based antioxidant that could cause inhibition of the [DPPH] by 60%. Therefore, the amount of DPPH that could not be inhibited by the antioxidants [DPPH remaining (REM)] would be 40%. Indeed, by plotting the [DPPH]REM (y-axis) versus the Greek bee pollen ethanolic extracts studied (x-axis), a calibration curve of good linearity was obtained (Figure 2). By setting y = 40% the x value (amount of antioxidants in mg∙L−1) was 12,650 mg∙L−1 (or 12.65 mg mL−1).
The use of a new index for the estimation of antioxidant capacity of certain antioxidants has been previously considered [22]. This theory is in line with our findings regarding Greek bee pollen ethanolic extracts and the application of EC60. The composition of Greek bee pollen with respect to its protein, mineral, fatty acid, polyphenol, and carotenoid contents should be considered for the overall antioxidant activity measured in the present work and the application of a new index to evaluate the effective concentration of antioxidants against [DPPH] radical.
Present results are in agreement with previous studies involving American [23], Greek [14], and Algerian [24] bee pollen samples, where the high antioxidant capacity of the respective methanolic extracts was highlighted. It should be stressed that the antioxidant capacity of bee pollen ethanolic extract is strictly related to its phenolic fraction, as it has been well demonstrated in the literature [25]. To avoid any kind of misleading, ethanol (consumable at concentrations of i.e. 5%–40% v/v in the form of alcoholic beverages) was used as a solvent for the extraction of bee pollen phytochemicals because future work will be focused on the preparation of alcoholic beverages from bee pollen.

3.4. In Vitro Antioxidant Capacity of Bee Pollen Enriched Yoghurts

The basic principle was to investigate if the new matrix possessed higher in vitro antioxidant capacity compared to bee pollen ethanolic extracts or conventional yoghurts (control samples). Therefore, the composition of milk type used, especially ash content, protein content, and fatty acid content (Table S1), along with literature data involving the presence of specific vitamins in milk, were considered for the evaluation of the total antioxidant capacity measured.
For example, cow milk fat contains approximately 57% saturated, 25% monounsaturated, and 6% polyunsaturated fatty acids [2]. In particular, conjugated linolenic acid is a trans fatty acid found in milk fat that is beneficial to humans in many ways [26]. The in vivo antioxidant character of ω-3 polyunsaturated fatty acids has been previously highlighted [27].
Given that minerals or milk salts, such as calcium, phosphate, magnesium, sodium, potassium, citrate, and chlorine, may interact with casein, these compounds could have antioxidant activity. In addition, milk is a good source of many vitamins. Vitamins A, B6, B12, C, D, K, E, thiamine, niacin, biotin, riboflavin, folates, and pantothenic acid are all present in milk and, thus, could contribute to the overall antioxidant capacity [28].
The higher antioxidant capacity of bee pollen enriched yoghurts was recorded for sheep milk yoghurts, followed by those of cow and goat milk yoghurts, respectively (Table 2). The higher amount of bee pollen added in yoghurts resulted in a significantly (p < 0.05) higher antioxidant capacity compared to control samples (free of bee pollen prepared yoghurts). Therefore, all bee pollen prepared yoghurts recorded a significantly (p < 0.05) higher antioxidant capacity compared to control samples. The present findings are really promising and may be characterized as “expectable” only in theoretical basis. It is not always sure that by adding a higher amount of an antioxidant in a food matrix, the latter will possess a higher antioxidant activity, since the “complete distribution” (solubility) of the specific compound(s) added to the food matrix is the key parameter. Given the “fatty” nature of yoghurt along with the fatty nature, and in particular, the fatty acid content of the outer lipid layer of the grounded bee pollen grains, the new matrix (yoghurt plus grounded bee pollen) showed a higher in vitro antioxidant capacity. As an executive summary, present results showed that the basic composition of milk used for the preparation of yoghurts with respect to its mineral, protein, fatty acid, and vitamin content along with the ability of grounded be pollen to be diffused in the yoghurt matrix, is of great importance to understand the increasing of the in vitro antioxidant capacity in yoghurts supplemented with grounded bee pollen.

3.5. Total Phenolic Content of Bee Pollen Ethanolic Extracts

Bee pollen ethanolic extracts showed a high total phenolic content (mg GAE/L) with respect to concentration (Figure S1c). In particular the mother ethanolic extract (125,000 mg∙L−1) recorded the higher total phenolic content equal to 5050 ± 520 mg GAE/L. Therefore, bee pollen could serve as a good source of polyphenols in the daily diet in different amounts, as shown in the present study, considering the pathophysiology of each human. There was a strong Pearson correlation (r = 0.993) (p = 0.007 < 0.01) between antioxidant capacity and total phenolic content with respect to the concentration of the prepared bee pollen ethanolic extracts.
In a previous study, total phenolic content of Greek bee pollen methanolic extracts was found higher, ranging between 10.49 ± 0.3 mg of protocatechuic acid equivalents per gram of pollen [14]. The same holds for TPC content values (15.91 ± 0.05–34.85 ± 0.08 mg GAE/g) of different American bee pollen types [23] or Algerian ones (30.46 ± 8.22 mg GAE/g) [24]. However, the observed differences may be also attributed to harvesting year, practices of bee pollen collection and processing, the solvent used for the extraction of polyphenols, along with the plant taxa contribution.

3.6. Total Phenolic Content of Bee Pollen Enriched Yoghurts

Total phenolic content of bee pollen prepared yoghurts was affected significantly (p < 0.05) by the type of milk used along with the concentration of grounded pollen added in yoghurts (Table 3). The synergistic action of the new matrix, that is ground bee pollen and yoghurt, resulted in a significant increase in total phenolic content. The higher total phenolic content was recorded for sheep, followed by those of cow and goat yoghurts, respectively. To avoid any source of misleading it should be stressed that Folin reagent does not measure only phenols, but will react with any reducing substance. It, therefore, measures the total reducing capacity of a sample, not just phenolic compounds. Additionally, this was, among others, the objective of the present work: To estimate total phenolic content and antioxidant capacity of the new functional matrix, taking into consideration products’ overall composition.
Folin reagent is part of the Lowry protein assay and will also react with some nitrogen-containing compounds, such as proteins, hydroxylamine and guanidine. The reagent has also been shown to be reactive towards thiols, many vitamins, the nucleotide base guanine, the trioses glyceraldehyde and dihydroxyacetone and some inorganic ions. It has been reported that, copper complexation increases the reactivity of phenols towards this reagent, as well as inorganic ions Fe2+, Mn2+, I, and SO32− [29,30]. However, because it measures, in a short time, antioxidant capacity in vitro, the reagent has been used to assay foods and supplements in food science [31]. From the results obtained, the addition of grounded pollen in yoghurts prepared from different types of milk resulted in a “super polyphenol” food.

3.7. Comparison of the In Vitro Antioxidant Capacity of Bee Pollen Ethanolic Extracts/Bee Pollen Yoghurts with Those of Standard Gallic Acid and Quercetin Solutions and Prospective Healthy Eating Habits

In order to compare the in vitro antioxidant capacity of bee pollen ethanolic extracts and bee pollen yoghurts, with that of a strong synthetic antioxidant, standard gallic acid and quercetin were dissolved in water and ethanol, respectively, at a concentration of 5380 mg∙L−1. After the dilutions in the reaction medium (final volume of 3 mL in the cuvette) the respective concentrations for gallic acid and quercetin were 359 mg∙L−1 (prior testing, preliminary results showed the high in vitro antioxidant capacity of gallic acid and quercetin at concentrations ranged between 350 and 1000 mg∙L−1). The use of such a gallic acid concentration resulted in 100% inhibition of the free radical [DPPH] in a short time (<2 min). Regarding quercetin the respective inhibition of [DPPH] was 86.39% at 60 min.
Respective results for the lower concentration (5000 mg∙L−1) of bee pollen ethanolic extracts and bee pollen yoghurts were 75.70%, 82.06% (cow milk), 81.46% (goat milk), and 86.79% (sheep milk) (Table 2). However, as it is clearly given in Table 2 the higher amount of ground bee pollen in yoghurts (3.0% w/v) resulted in almost 100% inhibition of [DPPH]. The concentration of ground bee pollen used for the preparation of yoghurts is within the range of the concentration of flavonoid glycosides reported in bee pollen which cover the range of 400–30,000 mg/kg [32].
The undisputed role of phytochemicals identified previously, and in the present study, as antioxidant and chemo-preventive agents has been highlighted [33,34]. Therefore, present data can be generalized and may include bee pollen or bee pollen based foodstuffs in the human diet. Indeed, previous studies have demonstrated that in adults 20–40 g of bee pollen per day may be applied therapeutically. In the case of young children the dose may be within the range of ca. 7.5–15 g. The usual treatment is for a period of 1–3 months but it may be repeated 2–4 times a year. However, a lower dose may be used in combination with other natural healers in chronic diseases [4]. Despite the fact that the higher amount of added bee pollen in yoghurts resulted in 100% inhibition of the free radical this was not supported by sensory analysis in terms of product acceptability. This is definitely a problem that it was faced in the present research and specific proposals/solutions have been then defined.

3.8. Sensory Analysis

Results of sensory analysis are shown in Table 4. The most preferred yoghurts were those prepared by using sheep milk, followed by cow and goat milk yoghurts, respectively. The bee pollen enriched yoghurts at a concentration of 0.5 and 1.0% (w/w) recorded the higher sensory scores for the three different types of milk used and improved significantly (p < 0.05) cohesion, indicating the potential of using bee pollen as a surface and interface material enhancer in applied surface/interface science. But which may be a possible mechanism that underlies this hypothesis? In Supplementary Materials (Table S1) is shown that the total fat and protein contents of bee pollen used in the study were 7 g/100 g and 17.60 g/100 g, respectively. As the grounded bee pollen was inserted in a matrix of lipid/protein nature (yoghurt), there might be the formation of surface or interface active lipid-linked proteins that may act as glazing agents. These agents provided an additional coating that was obvious by the improvement of product’s appearance and cohesion. This coating may also serve as an agent to prevent water loss and provide surface protection to the new matrix (yoghurt plus grounded bee pollen). Future research will be focused on the possible formation/and or characterization of such lipid-linked proteins.
Based on data collected, some typical characterizations by the panellists for bee pollen enriched yoghurts were: “wonderful”, “sweet and pleasant taste”, “nice smell”, “covers the odour of sheep, cow, and goat milks”, and “attractive appearance and improved cohesion”. The higher concentration of grounded bee pollen added in yoghurts resulted in a spicy after taste, not preferred by some panellists. In a recent work, the fortification of bee pollen (1, 2, 3, 4, and 5%) improved texture, colour, and sensory properties of gluten-free bread [5]. However, at the highest level of pollen supplementation some detrimental effects were observed [5]. Such an observation is in conformity with the results of the present study.

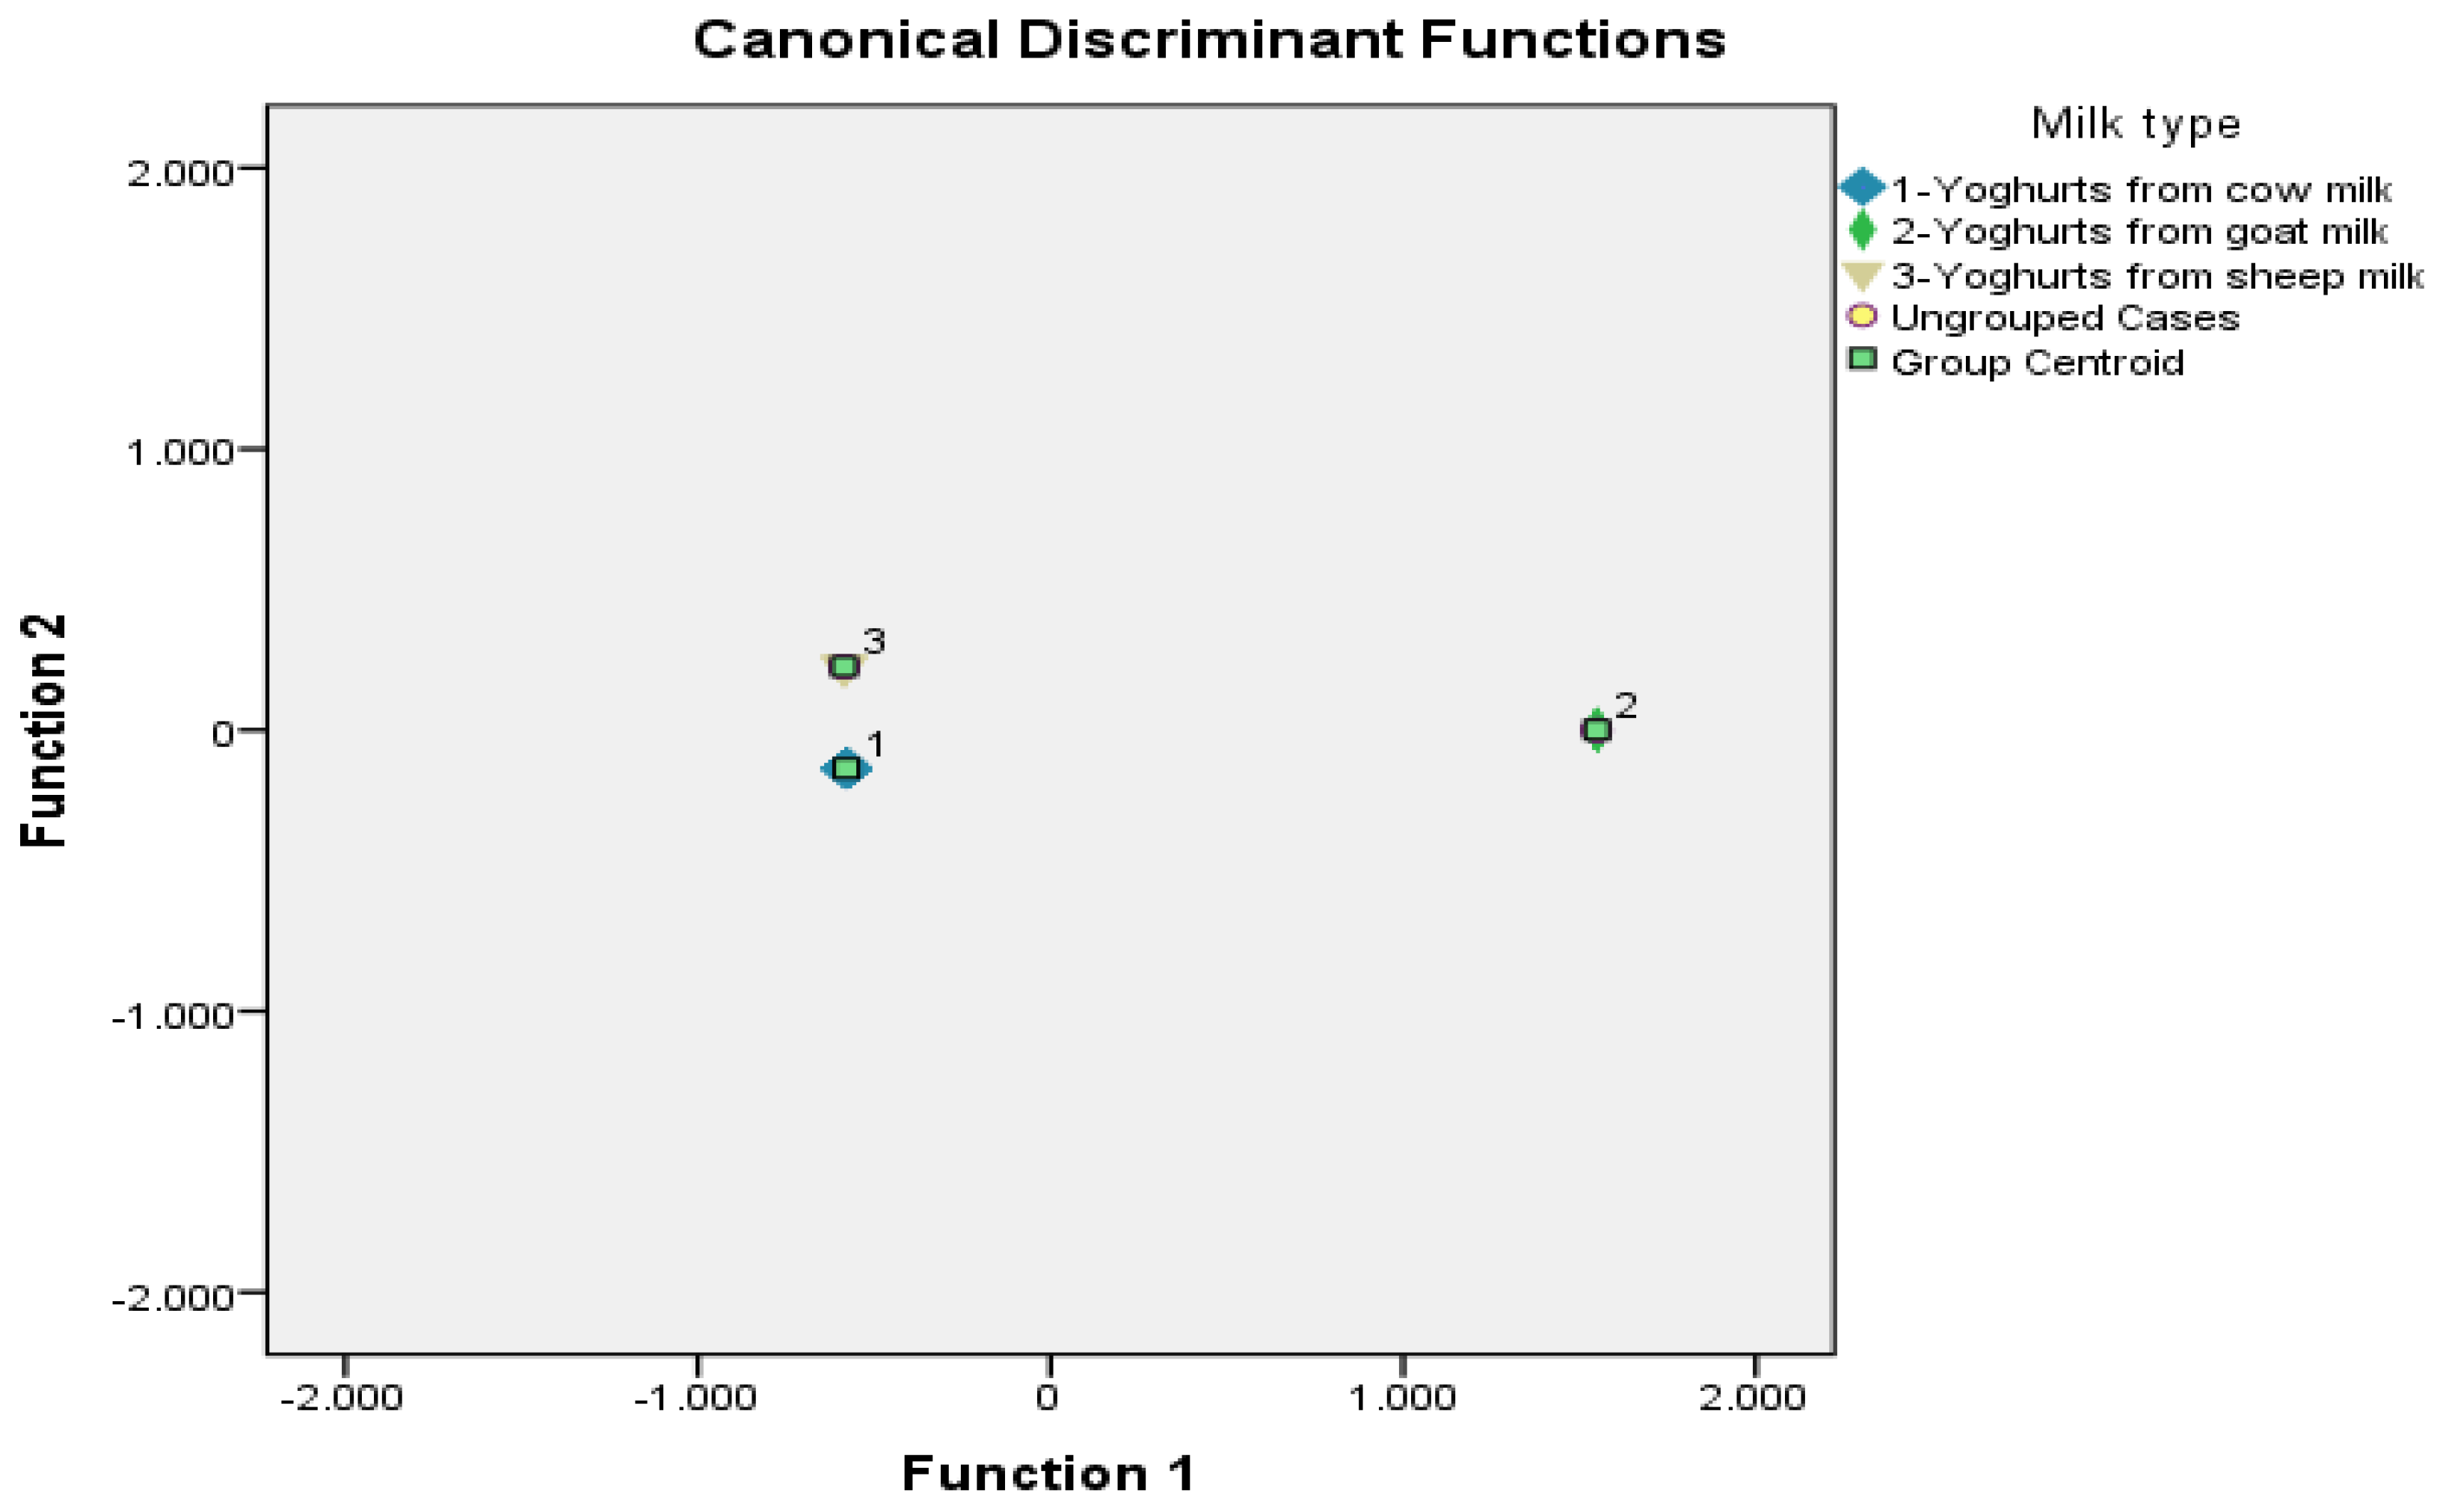
3.9. Discrimination of Conventional and Bee Pollen Yoghurts According to Milk Type-Quality Control Analysis

In real market analysis a new product must totally guarantee criteria of uniqueness in order to be recognized from similar products and gain consumers support along with its high commerciality. Quality control analysis based on innovative chemometrics could aid to the purity control of products having been termed as “functional foods”, in which the amount of a functional component added must be specified and totally differentiated among other similar products. Based on this theory, chemometric analysis was then applied to the investigated parameters of the prepared yoghurts, with respect to milk type.
Multivariate analysis of variance was firstly applied to 29 independent parameters/variables (total phenolic content of control yoghurts, total phenolic content of yoghurts supplemented with 0.5% of bee pollen, total phenolic content of yoghurts supplemented with 1.0% of bee pollen, total phenolic content of yoghurts supplemented with 2.5% of bee pollen, total phenolic content of yoghurts supplemented with 3.0% of bee pollen, in vitro antioxidant capacity of control yoghurts, in vitro antioxidant capacity of yoghurts supplemented with 0.5% of bee pollen, in vitro antioxidant capacity of yoghurts supplemented with 1.0% of bee pollen, in vitro antioxidant capacity of yoghurts supplemented with 2.5% of bee pollen, in vitro antioxidant capacity of yoghurts supplemented with 3.0% of bee pollen, taste score of control yoghurts, taste scores of yoghurts supplemented with 0.5% of bee pollen, taste scores of yoghurts supplemented with 1.0% of bee pollen, taste scores of yoghurts supplemented with 2.5% of bee pollen, taste scores of yoghurts supplemented with 3.0% of bee pollen, odour scores of control yoghurts, odour scores of yoghurts supplemented with 0.5% of bee pollen, odour scores of yoghurts supplemented with 1.0% of bee pollen, odour scores of yoghurts supplemented with 2.5% of bee pollen, odour scores of yoghurts supplemented with 3.0% of bee pollen, appearance scores of control yoghurts, appearance scores of yoghurts supplemented with 0.5% of bee pollen, appearance scores of yoghurts supplemented with 1.0% of bee pollen, appearance scores of yoghurts supplemented with 2.5% of bee pollen, appearance scores of yoghurts supplemented with 3.0% of bee pollen, cohesion scores of control yoghurts, cohesion scores of yoghurts supplemented with 0.5% of bee pollen, cohesion scores of yoghurts supplemented with 1.0% of bee pollen, cohesion scores of yoghurts supplemented with 2.5% of bee pollen and cohesion scores of yoghurts supplemented with 3.0% of bee pollen) in order to find the significant parameters (p < 0.05) that could differentiate the prepared yoghurts according to milk type. Milk type used for the preparation of yoghurts was taken as the dependent variable. Twenty three of the 29 variables (Table S2) were found to be significant (p < 0.05) for the differentiation of yoghurts. Thus, these 23 significant variables were subjected to linear discriminant analysis.
Results showed that two statistically significant discriminant functions were formed: Wilks’ Lambda = 0.000, χ2 = 396.328, df (degrees of freedom) = 12, p < 0.001 for the first function and Wilks’ Lambda = 0.000, χ2 = 167.688, df (degrees of freedom) = 5, p < 0.001, for the second. The first discriminant function recorded the higher eigenvalue (1,042,287.060) and canonical correlation of 1.000, accounting for 97.6% of total variance. The second discriminant function recorded a much lower eigenvalue (25,923.218) and canonical correlation of 1.000, accounting for 2.4% of total variance. Both accounted for 100% of total variance which is a perfect rate.
In Figure 3 it is shown that the prepared yoghurts are perfectly separated. The correct classification rate was 100% using the original and 100% using the cross validation method, an excellent discrimination rate for this method of “modelling” (Table S3). The effective parameters of the discrimination model were 6: (i) total phenolic content of conventional yoghurts (control samples), (ii) total phenolic content of yoghurts supplemented with 0.5% (w/v) of bee pollen, (iii) total phenolic content of yoghurts supplemented with 1.0% (w/v) of bee pollen, (iv) in vitro antioxidant capacity of yoghurts supplemented with 2.5% (w/v) of bee pollen, (v) taste scores of yoghurts supplemented with 1.0% (w/v) of bee pollen, and (vi) appearance scores of yoghurts supplemented with 3.0% (w/v) of bee pollen (Table 5).
As it can be observed the different treatments followed for the preparation of conventional and bee pollen enriched yoghurts were perfectly highlighted using chemometrics. This approach may be generalized and lead to the development of an accurate methodology for the adulteration control of products having been labelled as “functional” or of specific composition.

3.10. Modeling of Results Using Regression Analysis

The collected experimental data were further evaluated using a regression analysis model as assessed by the application of ANOVA (Supplementary Materials, Section S.5.2). The significant parameters (p < 0.001) that best explained the regression analysis model (predictors) were eight: total phenolic content of conventional yoghurts (control samples), taste scores of yoghurts supplemented with 1.0% and 2.5% of bee pollen, odour scores of yoghurts supplemented with 3.0% of bee pollen, appearance scores of yoghurts supplemented with 0.5%, 1.0%, and 3.0% of bee pollen, and cohesion of yoghurts supplemented with 3.0% of bee pollen. At this point let us take a look at the developed model.
The squared-R2, predicted-R2, and adjusted-R2 were all 1.000, whereas the standard error of the estimate was 0.000. It should be stressed that, a large value of squared-R2 does not always mean a strong efficiency of the model. In that sense, the predicted-R2 and adjusted-R2 should be primarily considered. The predicted residual error sum of squares statistic (predicted-R2) is a form of cross-validation used in regression analysis to provide the efficiency of the fit of a model to a number of observations [35].
In the present model, the Durbin-Watson statistic was also considered. The respective value was 0.550. In particular, the Durbin–Watson statistic (d) is a statistical test used to detect the presence of autocorrelation (a relationship between values separated from each other by a given time lag) in prediction errors from a regression analysis. The value of d always lies between 0 and 4. If the Durbin–Watson statistic is substantially less than 2, there is evidence of positive serial correlation [36]. In addition, there is a great challenge to explore the best predictors that built a regression analysis model and express/or not a high correlation [35].

4. Conclusions

Bee pollen from the region of Epirus is a rich and natural source of biofunctional constituents and possesses high in vitro antioxidant capacity. Nine polyphenols were identified using HPLC/ESI-MS, while 10 more were unknown. The complexity of bee pollen matrix in terms of its phytochemical composition creates the basis for future research. In addition, grounded bee pollen may act as surface or interface enhancer in material or food science based on its total fat and protein contents, among others. The preparation of bee pollen based yoghurts may add valuable eating habits in consumers all over the world since the in vitro antioxidant capacity and total polyphenol content was significantly increased compared to conventional yoghurts. In addition product’s taste, odour, appearance and cohesion were significantly (p < 0.05) improved. Based primarily on sensory evaluation data and chemometrics, bee pollen based yoghurts of 0.5%–1.0% (w/v) are proposed as new bio-functional foods, and maybe as alternative options for the treatment of chronic health diseases of humans. In vivo clinical studies will further validate the bio-functional character of bee pollen prepared yoghurts. Finally, chemometric analyses may provide some decisive points for the commercialization and uniqueness/functionalization of such products.

5. Patent

There is an ongoing patent resulting from the work reported in the manuscript.

Supplementary Materials

Supplementary Materials are available online at https://www.mdpi.com/2079-6412/8/12/423/s1.

Author Contributions

Conceptualization: I.K.K.; Methodology: I.K.K.; Software: I.K.K.; Validation: I.K.K., V.K.K., and I.G.; Formal Analysis: I.K.K., V.K.K., and I.G.; Investigation: I.K.K.; Resources: I.K.K. and K.A.R.; Data Curation: I.K.K.; Writing—Original Draft Preparation: I.K.K.; Writing—Review and Editing: I.K.K.; Supervision: I.K.K.

Funding

This research received no external funding.

Acknowledgments

The authors are grateful to Sofia Karabournioti (Attiki Bee Culturing Co.—Alex Pittas S.A.) for the information she provided regarding the microscopic pattern of bee pollen plant taxa. The authors also thank the Mass Spectrometry Unit at Chemistry Department of University of Ioannina and Anastasia Badeka for her technical assistance during the HPLC/ESI-MS analysis.

Conflicts of Interest

The authors declare no conflict of interest.

References

  1. Roberts, W.A., Jr. Benefiting Beverages. Prepared Foods Website. Available online: https://www.preparedfoods.com/articles/107718-article-benefiting-beverages----august-2009 (accessed on 22 November 2018).
  2. Basics about Functional Food; US Department of Agriculture, Agricultural Research Service: Washington, DC, USA.
  3. Lin, D.; Xiao, M.; Zhao, J.; Li, Z.; Xing, B.; Li, X.; Kong, M.; Li, L.; Zhang, Q.; Liu, Y.; et al. An overview of plant phenolic compounds and their importance in human nutrition and management of type 2 Diabetes. Molecules 2016, 21, 1374. [Google Scholar] [CrossRef] [PubMed]
  4. Bogdanov, S. Pollen: Production, Nutrition and Health: A Review. Bee Product Science Website. Available online: https://www.bee-hexagon.net (accessed on 22 November 2018).
  5. Conte, P.; Del Caro, A.; Balestra, F.; Piga, A.; Fadda, C. Bee pollen as a functional ingredient in gluten-free bread: A physical-chemical, technological and sensory approach. LWT Food Sci. Technol. 2018, 90, 1–7. [Google Scholar] [CrossRef]
  6. Komosinska-Vassev, K.; Olczyk, P.; Kafmierczak, J.; Mencner, L.; Olczyk, K. Bee Pollen: Chemical composition and therapeutic application. J. Evid. Based Complement. Altern. Med. 2015, 2015. [Google Scholar] [CrossRef] [PubMed]
  7. Locatelli, M.; Macchione, N.; Ferrante, C.; Chiavaroli, A.; Recinella, L.; Carradori, S.; Zengin, G.; Cesa, S.; Leporini, L.; Leone, S.; et al. Graminex Pollen: Phenolic pattern, colorimetric analysis and protective effects in immortalized prostate cells (PC3) and rat prostate challenged with LPS. Molecules 2018, 23, 1145. [Google Scholar] [CrossRef] [PubMed]
  8. Pehrsson, P.R.; Haytowitz, D.B.; Holden, J.M.; Perry, C.R.; Beckler, D.G. USDA’s National Food and Nutrient Analysis Program: Food Sampling. J. Food Compos. Anal. 2000, 13, 379–389. [Google Scholar] [CrossRef]
  9. Yerlikaya, O. Effect of bee pollen supplement on antimicrobial, chemical, rheological, sensorial properties and probiotic viability of fermented milk beverages. Mijekarstvo 2014, 64, 268–279. [Google Scholar] [CrossRef]
  10. Lomova, N.; Narizhnyi, S.; Snizhko, O. Yoghurt enrichment with natural bee farming products. Ukr. Food J. 2014, 3, 415–421. [Google Scholar]
  11. Atallah, A.A. The production of bio-yoghurt with probiotic bacteria, royal jelly and bee pollen grains. J. Nutr. Food Sci. 2016, 6, 510. [Google Scholar]
  12. Cossu, M.; Juliano, C.; Pisu, R.; Alamanni, M.C. Effects of enrichment with polyphenolic extracts from Sardinian plants on physico-chemical, antioxidant and microbiological properties of yogurt. Ital. J. Food Sci. 2009, 21, 447–459. [Google Scholar]
  13. Najgebauer-Lejko, D.; Marek Sady, M. Estimation of the antioxidant activity of the commercially available fermented milks. Acta Sci. Pol. Technol. Aliment. 2015, 14, 387–396. [Google Scholar] [CrossRef] [PubMed] [Green Version]
  14. Graikou, K.; Kapeta, S.; Aligiannis, N.; Sotiroudis, G.; Chondrogianni, N.; Gonos, E.; Chinou, I. Chemical analysis of Greek pollen-Antioxidant, antimicrobial and proteasome activation. Chem. Cent. J. 2011, 5, 33. [Google Scholar] [CrossRef] [PubMed]
  15. Karabagias, I.K.; Koutsoumpou, M.; Liakou, V.; Kontakos, S.; Kontominas, M.G. Characterization and geographical discrimination of saffron from Greece, Spain, Iran, and Morocco based on volatile and bioactivity markers, using chemometrics. Eur. Food Res. Technol. 2017, 243, 1577–1591. [Google Scholar] [CrossRef]
  16. Karabagias, I.K.; Vavoura, M.V.; Badeka, A.; Kontakos, S.; Kontominas, M.G. Differentiation of Greek thyme honeys according to geographical origin based on the combination of phenolic compounds and conventional quality parameters using chemometrics. Food Anal. Methods 2014, 7, 2113–2121. [Google Scholar] [CrossRef]
  17. Singleton, V.L.; Orthofer, R.; Lamuela-Raventós, R.M. Analysis of total phenols and other oxidation substrates and antioxidants by means of Folin–Ciocalteu reagent. Methods Enzymol. 1999, 299, 152–178. [Google Scholar] [CrossRef]
  18. Locatelli, M.; Gindro, R.; Travaglia, F.; Coïsson, J.-D.; Rinaldi, M.; Arlorio, M. Study of the DPPH-scavenging activity: Development of a free software for the correct interpretation of data. Food Chem. 2009, 114, 889–897. [Google Scholar] [CrossRef]
  19. Miller, J.N.; Miller, J.C. Statistics and Chemometrics for Analytical Chemistry, 6th ed.; Prentice Hall: Harlow, UK, 2010. [Google Scholar]
  20. Rothwell, J.A.; Perez-Jimenez, J.; Neveu, V.; Medina-Remón, A.; M’Hiri, N.; García-Lobato, P.; Manach, C.; Knox, C.; Eisner, R.; Wishart, D.S.; et al. Phenol-Explorer 3.0: A major update of the Phenol-Explorer database to incorporate data on the effects of food processing on polyphenol content. Database 2013, 2013, bat070. [Google Scholar] [CrossRef] [PubMed]
  21. Markham, K.R.; Campos, M.G. 7- and 8-O-methylherbacetin-3-O-sophorosides from bee pollen and some structure/activity observations. Phytochemistry 1996, 43, 763–767. [Google Scholar] [CrossRef]
  22. Buenger, J.; Ackermann, H.; Jentzsch, A.; Mehling, A.; Pfitzner, I.; Reiffen, K.A.; Schroeder, K.R.; Wollenweber, U. An interlaboratory comparison of methods used to assess antioxidant potentials. Int. J. Cosmet. Sci. 2006, 28, 135–146. [Google Scholar] [CrossRef] [PubMed]
  23. Leblanc, B.W.; Davis, O.K.; Boue, S.; Delucca, A.; Deeby, T. Antioxidant activity of Sonoran Desert bee pollen. Food Chem. 2009, 115, 1299–1305. [Google Scholar] [CrossRef]
  24. Rebiai, A.; Lanez, T. Chemical composition and antioxidant activity of Apis mellifera bee pollen from Northwest Algeria. J. Fundam. Appl. Sci. 2012, 4, 26–35. [Google Scholar] [CrossRef]
  25. Menghini, L.; Leporini, L.; Vecchiotti, G.; Locatelli, M.; Carradori, S.; Ferrante, C.; Zengin, G.; Recinella, L.; Chiavarolia, A.; Leone, S.; et al. Crocus sativus L. stigmas and byproducts: Qualitative fingerprint, antioxidant potentials and enzyme inhibitory activities. Food Res. Int. 2018, 108, 91–98. [Google Scholar] [CrossRef] [PubMed]
  26. Dhiman, T.R.; Satter, L.D.; Pariza, M.W.; Galli, M.P.; Albright, K.; Tolosa, M.X. Conjugated Linoleic Acid (CLA) content of milk from cows offered diets rich in linoleic and linolenic acid. J. Dairy Sci. 2000, 83, 1016–1027. [Google Scholar] [CrossRef]
  27. Richard, D.; Kefi, K.; Barbe, U.; Bausero, P.; Visioli, F. Polyunsaturated fatty acids as antioxidants. Pharmacol. Res. 2008, 57, 451–455. [Google Scholar] [CrossRef] [PubMed]
  28. Fox, P.F. Advanced Dairy Chemistry, 2nd ed.; Chapman and Hall: London, UK, 1995; Volume 3. [Google Scholar]
  29. Ikawa, M.; Schaper, T.D.; Dollard, C.A.; Sasner, J.J. Utilization of Folin–Ciocalteu phenol reagent for the detection of certain nitrogen compounds. J. Agric. Food Chem. 2003, 51, 1811–1815. [Google Scholar] [CrossRef] [PubMed]
  30. Everette, J.D.; Bryant, Q.M.; Green, A.M.; Abbey, Y.A.; Wangila, G.W.; Walker, R.B. Thorough study of reactivity of various compound classes toward the Folin−Ciocalteu reagent. J. Agric. Food Chem. 2010, 58, 8139–8144. [Google Scholar] [CrossRef] [PubMed]
  31. Prior, R.; Wu, X.; Schaich, K. Standardized methods for the determination of antioxidant capacity and phenolics in foods and dietary supplements. J. Agric. Food Chem. 2005, 53, 4290–4302. [Google Scholar] [CrossRef] [PubMed]
  32. Bogdanov, S. Quality and standards of pollen and beeswax. APIACTA 2004, 38, 334–341. [Google Scholar]
  33. Cerdá, B.; Tomás-Barberán, F.A.; Espín, J.C. Metabolism of antioxidant and chemopreventive ellagitannins from strawberries, raspberries, walnuts, and oak-aged wine in humans: Identification of biomarkers and individual variability. J. Agric. Food Chem. 2005, 53, 227–235. [Google Scholar] [CrossRef] [PubMed]
  34. Bialonska, D.; Kasimsetty, S.G.; Khan, S.I.; Ferreira, D. Urolithins, intestinal microbial metabolites of pomegranate ellagitannins, exhibit potent antioxidant activity in a cell-based assay. J. Agric. Food Chem. 2009, 57, 10181–10186. [Google Scholar] [CrossRef] [PubMed]
  35. Chatterjee, S.; Simonoff, J. Handbook of Regression Analysis; John Wiley & Sons: Hoboken, NJ, USA, 2013. [Google Scholar]
  36. Durbin, J.; Watson, G.S. Testing for serial correlation in least squares regression III. Biometrika 1971, 58, 1–19. [Google Scholar] [CrossRef]
Figure 1. (a) A typical HPLC chromatogram of bee pollen ethanolic extract at positive mode. 1: Isopimpinellin, 2: unknown, 3: Quercetin 3-O-xylosyl-glucuronide, 4: unknown, 5: unknown, 6: unknown, 7: unknown, 8: unknown, 9: unknown; (b) A typical HPLC chromatogram of bee pollen ethanolic extract at negative mode. 1: Hydroxycaffeic acid, 2: Urolithin B, 3: p-Coumaroyl tyrosine, 4: Quercetin 3-O-rhamnosyl-galactoside, 5: Quercetin 3-O-xylosyl-glucuronide, 6: Isorhamnetin-3-O-glucoside 7-O-rhamnoside, 7: Quercetin 3-O-rutinoside, 8: unknown, 9: Unknown, 10: unknown. X-axis: Intensity (mAU). Y-axis: Time (min).
Coatings 08 00423 g001
Figure 2. Ability of Greek pollen ethanolic extracts to inhibit [DPPH] radical. Implementation of EC60. Error bars are provided at the confidence level of p < 0.05.
Coatings 08 00423 g002
Figure 3. Classification of conventional and bee pollen enriched yoghurts with respect to milk type.
Coatings 08 00423 g003
Table 1. Phenolic compounds identified in the ethanolic extract of bee pollen from the region of Epirus using HPLC/ESI-MS [MS mode: (±). Rt: retention time. λmax: 254 ± 2 nm].
CompoundRt (min)[M − H]+ (m/z)CompoundRt (min)[M − H] (m/z)
4,9-dimethoxyfuro[3,2-g]chromen-7-One (C13H10O5) (Isopimpinellin)1.6247Hydroxycaffeic acid (C9H8O5)1.8195
Unknown2.3235Urolithin B (C13H8O3)2.5211
Quercetin 3-O-xylosyl-glucuronide (C26H26O17)17.4145p-Coumaroyl tyrosine2.6326
Unknown18.5438Quercetin 3-O-rhamnosyl-galactoside (C27H30O16)17.0609
Unknown19.3438Quercetin 3-O-xylosyl-glucuronide (C26H26O17)18.1609
Unknown23.1616Isorhamnetin-3-O-glucoside 7-O rhamnoside (C28H32O16)18.9623
Unknown24.6600Quercetin 3-O-rutinoside (C27H30O16)19.4609
Unknown25.2584Unknown24.6598
Unknown25.7584Unknown25.1582
Unknown25.7582
Table 2. Antioxidant capacity (%AC) and total phenolic content (TPC) of bee pollen ethanolic extracts.
Ethanolic Extracts (mg∙L−1)(AC) (%)[DPPH]0 (mg∙L−1)[DPPH]t (mg∙L−1)Δ[DPPH] (%)[DPPH]REM (%)
500075.70 ± 0.01 a27.6012.78 ± 0.01 e53.70 ± 0.02 i46.30 ± 0.02 m
1000081.44 ± 0.01 b27.6011.22 ± 0.01 f59.35 ± 0.02 j40.65 ± 0.02 n
2500085.71 ± 0.03 c27.608.31 ± 0.01 g69.89 ± 0.04 k30.11 ± 0.04 o
3000086.81 ± 0.01 d27.607.82 ± 0.01 h71.67 ± 0.04 l28.33 ± 0.04 p
AC: % antioxidant capacity; [DPPH]0: initial concentration of the free radical in the cuvette; [DPPH]t: concentration of the free radical after the reaction with pollen antioxidants at the plateau (steady state); Δ[DPPH]: % decrease in free radical concentration defined as the ratio of ([DPPH]0-[DPPH]t)/ ([DPPH]0) × 100. The results are the average ± standard deviation values of three (n = 3) measurements. Different letters in each column indicate statistically significant differences (p < 0.05).
Table 3. Total phenolic content and in vitro antioxidant capacity of bee pollen enriched yoghurts with respect to milk type.
Type of MilkControl0.5% (w/v)1.0% (w/v)2.5% (w/v)3.0% (w/v)
Cow milk (N = 10)
TPC (mgGAE/L)2882.5 ± 1.32 a4131.5 ± 0.50 d4935.83 ± 1.04 g7180 ± 1.80 j7771.5 ± 2.29 m
AC (%)71.90 ± 0.02 aa82.06 ± 0.01 ad90.33 ± 0.02 ag98.69 ± 0.01 aj98.79 ± 0.01 am
Goat milk (N = 10)
TPC (mgGAE/L)2198.3 ± 1.53 b4107.17 ± 2.0 e4877.5 ± 0.50 h7094.33 ± 3.75 k7490.5 ± 0.50 n
AC(%)71.50 ± 0.01 ab81.46 ± 0.05 ae88.53 ± 0.04 ah95.88 ± 0.01 ak95.91 ± 0.02 an
Sheep milk (N = 10)
TPC (mgGAE/L)2900.3 ± 2.25 c4315.33 ± 0.76 f5093 ± 0.50 i7546.2 ± 0.7 l8780 ± 2.25 o
AC (%)74.65 ± 0.01 ac86.79 ± 0.03 af94.40 ± 0.08 ai99.40 ± 0.02 al99.69 ± 0.01 ao
N: number of yoghurt samples with respect to milk type used; TPC: total phenolic content; AC: antioxidant capacity; Different letters in each column indicate statistically significant differences (p < 0.05); The results are the average ± standard deviation values of three (n = 3) measurements; The amount of pollen added in yoghurts is expressed as weight of pollen per volume of (w/v) each type of milk used for the preparation of yoghurts.
Table 4. Sensory evaluation of bee pollen enriched yoghurts.
Milk TypeControl0.5% (w/v)1.0% (w/v)2.5% (w/v)3.0% (w/v)
Cow milk (N = 10)
Taste4.65 ± 0.30 a5.00 ± 0.00 b5.00 ± 0.00 b3.67 ± 0.00 c3.00 ± 0.29 d
Odour5.00 ± 0.00 e4.80 ± 0.10 f4.90 ± 0.10 f4.00 ± 0.00 g3.67 ± 0.58 g
Appearance4.70 ± 0.30 h5.00 ± 0.00 h5.00 ± 0.00 h4.33 ± 0.58 h4.20 ± 0.00 h
Cohesion4.42 ± 0.58 i5.00 ± 0.00 i5.00 ± 0.00 i4.72 ± 0.18 j4.67 ± 0.15 j
Goat milk (N = 10)
Taste4.45 ± 0.55 k4.40 ± 0.60 l4.10 ± 0.80 l3.66 ± 0.65 m3.10 ± 0.65 m
Odour4.16 ± 0.84 n4.80 ± 0.20 o4.3 ± 0.70 o3.50 ± 0.50 o3.30 ± 0.27 o
Appearance5.00 ± 0.00 p4.75 ± 0.20 p4.70 ± 0.25 p4.50 ± 0.50 p4.20 ± 0.75 p
Cohesion4.70 ± 0.30 p4.60 ± 0.35 p4.60 ± 0.40 p4.40 ± 0.60 p4.30 ± 0.67 p
Sheep milk (N = 10)
Taste4.67 ± 0.33 p5.00 ± 0.00 p4.67 ± 0.33 p3.83 ± 1.04 p3.17 ± 0.76 p
Odour5.00 ± 0.00 q5.00 ± 0.00 q5.00 ± 0.00 q4.67 ± 0.33 q3.77 ± 0.59 r
Appearance5.00 ± 0.00 s5.00 ± 0.00 s5.00 ± 0.00 s4.33 ± 0.58 s4.33 ± 0.58 s
Cohesion5.00 ± 0.00 s5.00 ± 0.00 s5.00 ± 0.00 s5.00 ± 0.00 s5.00 ± 0.00 s
N: number of yoghurt samples with respect to milk type used; Different letters in each row indicate statistically significant differences (p < 0.05). The results are the average ± standard deviation values of the evaluation results based on the comments of seven panellists. The amount of pollen added in yoghurts is expressed as weight of pollen per volume of (w/v) each type of milk used for the preparation of yoghurts.
Table 5. Standardized canonical discriminant function coefficients of the developed statistical model for the discrimination of conventional and bee pollen enriched yoghurts.
Discriminatory Parameters of Conventional and Bee Pollen Enriched YoghurtsDiscriminant FunctionFisher’s CoefficientProbability
12Fp
Total phenolic content of conventional yoghurts (control samples)−4.190−0.145494,107.133<0.001
Total phenolic content of yoghurts supplemented with 0.5% (w/v) of bee pollen6.2331.46674,090.195<0.001
Total phenolic content of yoghurts supplemented with 1.0% (w/v) of bee pollen−4.4860.645170,809.528<0.001
In Vitro antioxidant capacity of yoghurts supplemented with 2.5% (w/v) of bee pollen0.584−1.31842,385.052<0.001
Taste scores of yoghurts supplemented with 1.0% (w/v) of bee pollen8.9572.25710.7870.001
Appearance scores of yoghurts supplemented with 3.0% (w/v) of bee pollen0.006−0.2823.6310.046

