Particle Characterisation and Depletion of Li2CO3 Inhibitor in a Polyurethane Coating


Abstract
1. Introduction
2. Experimental
2.1. Materials and Sample Preparation
2.2. NSS Exposure
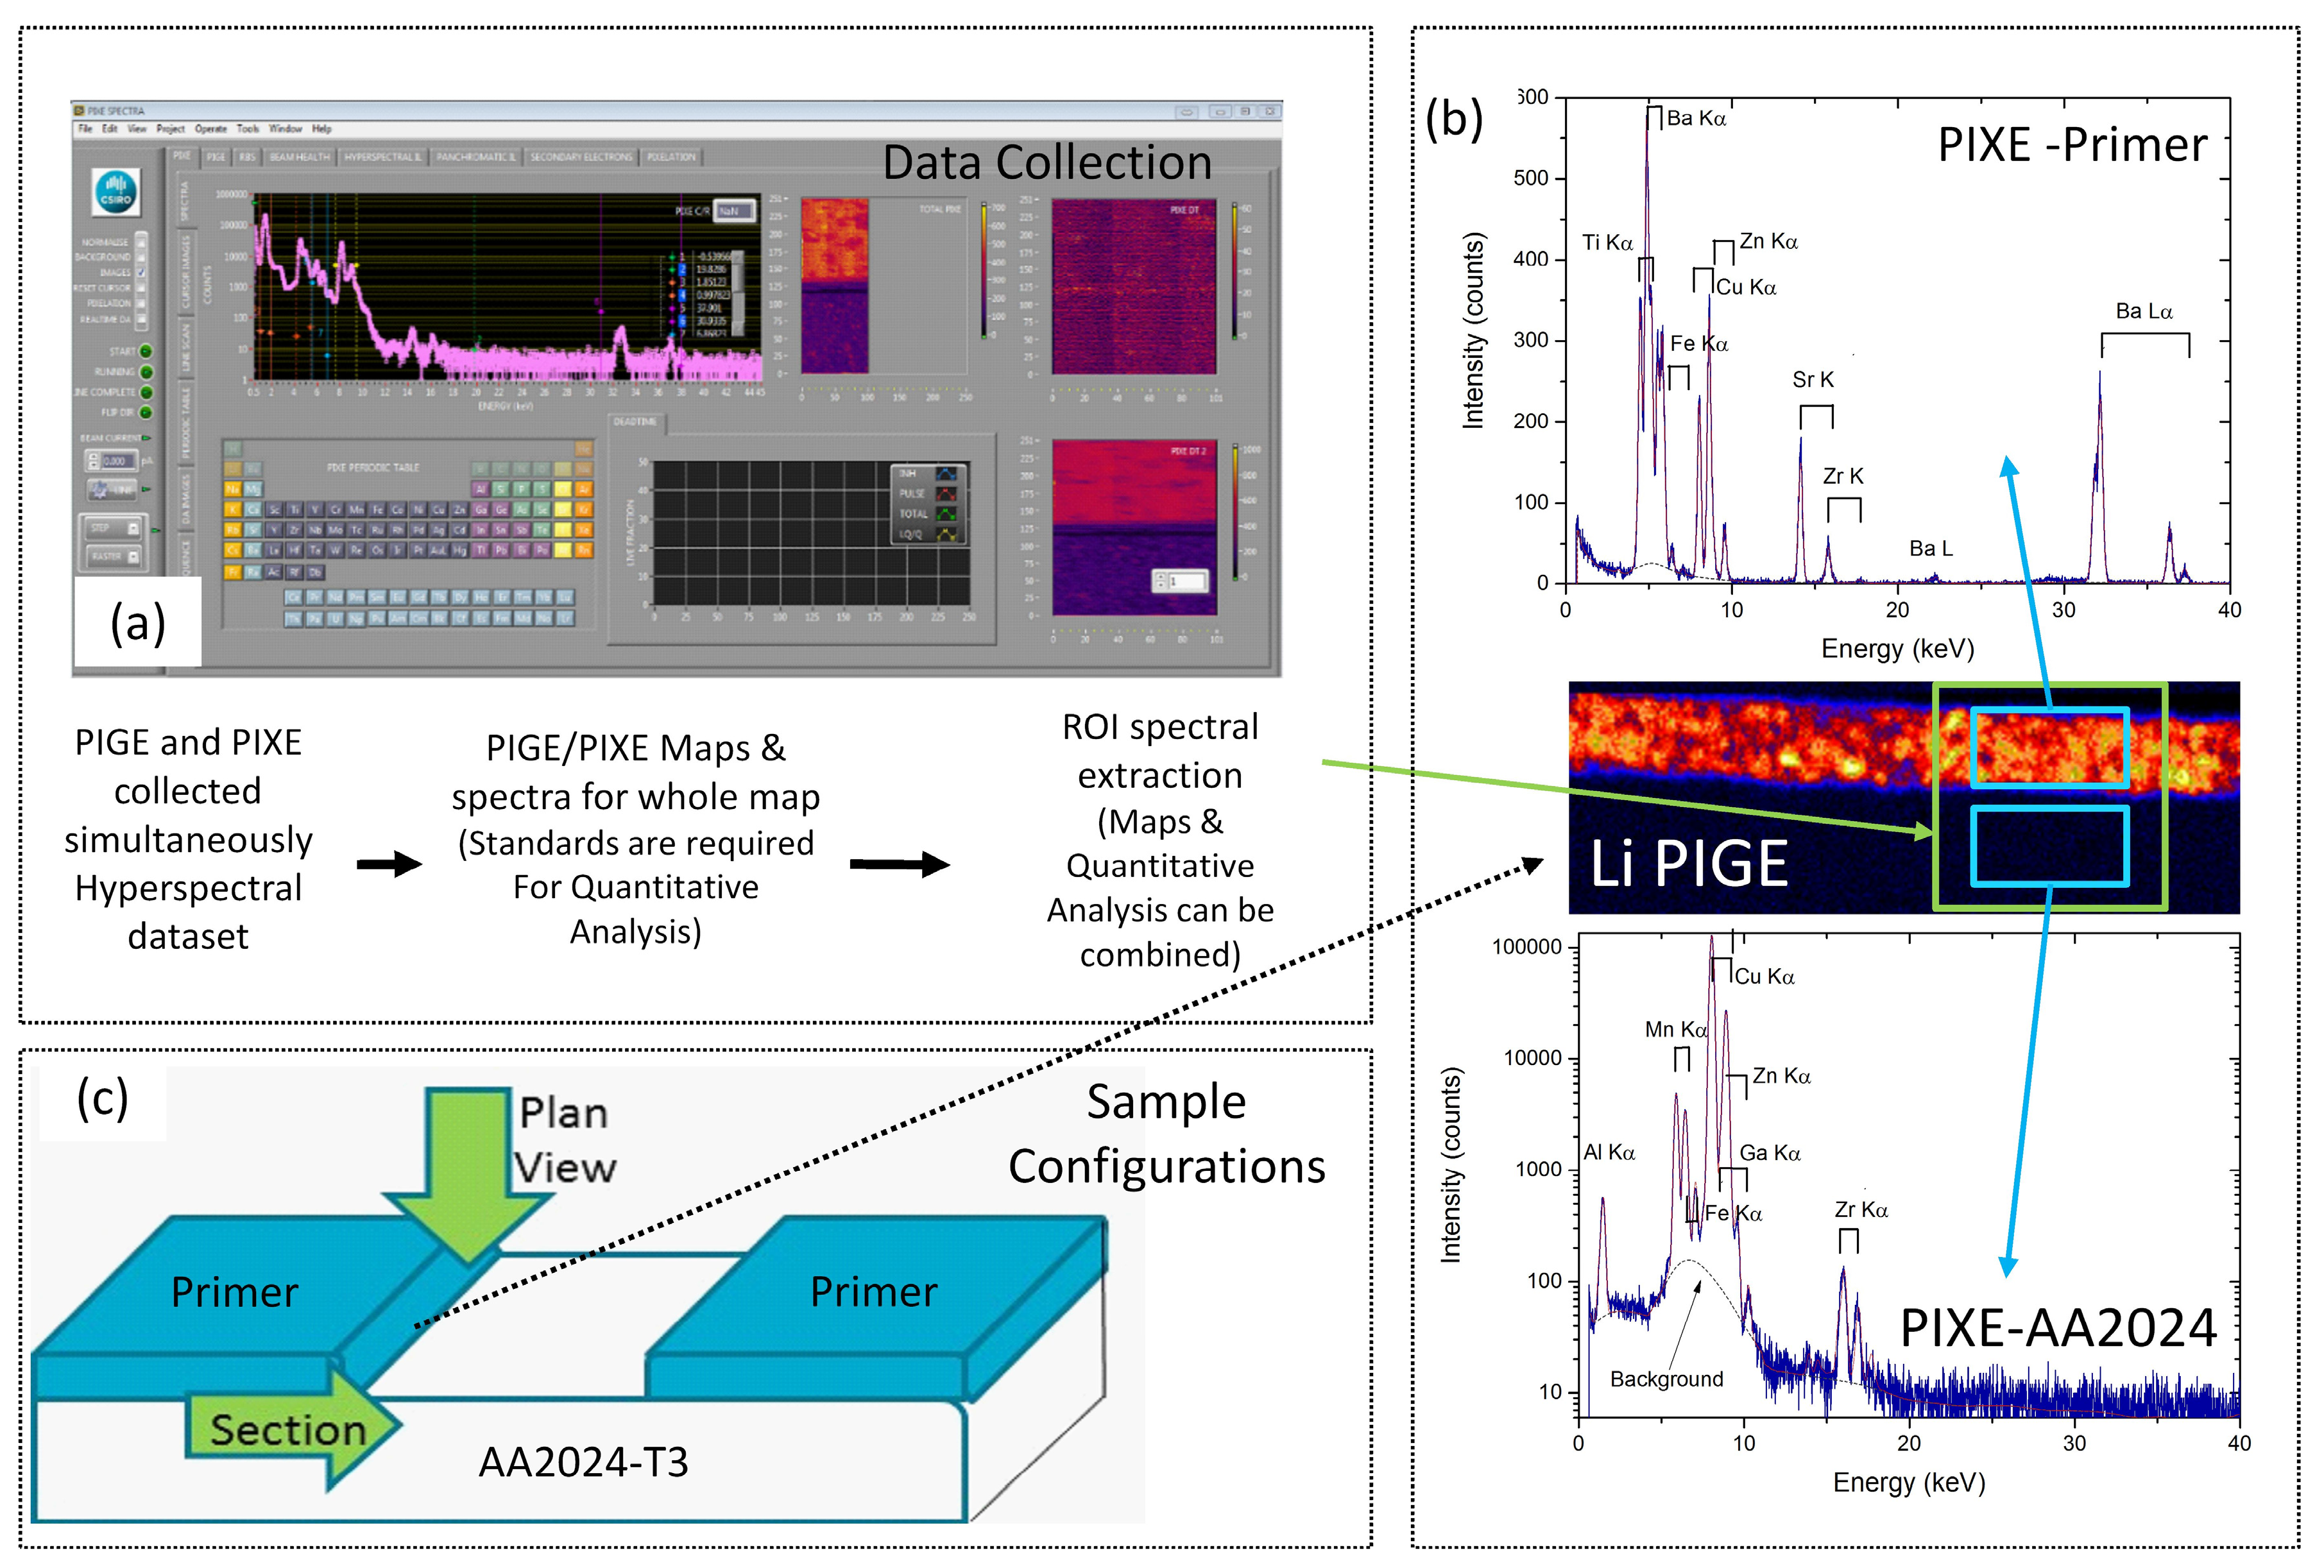
2.3. Particle Induced ϒ (PIGE) and X-ray Emission (PIXE)
2.4. Scanning Electron Microscopy
3. Results
3.1. Characterisation of the Primer Prior to Leaching
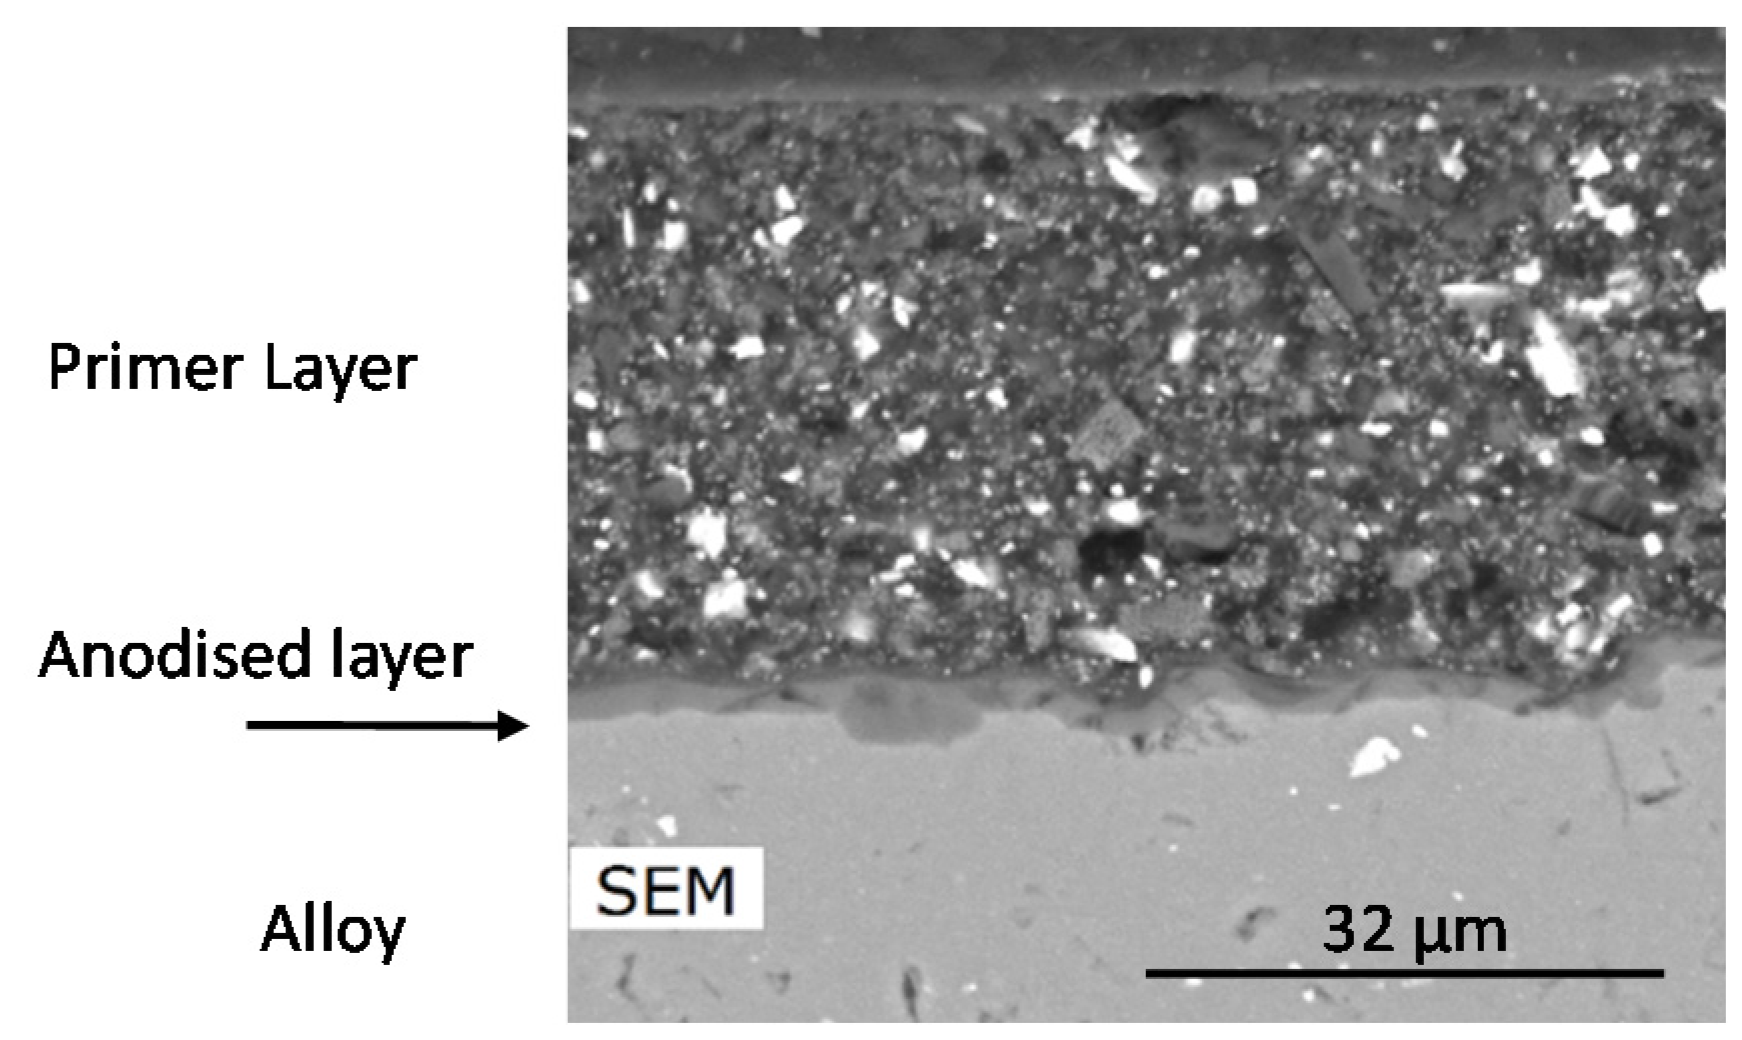
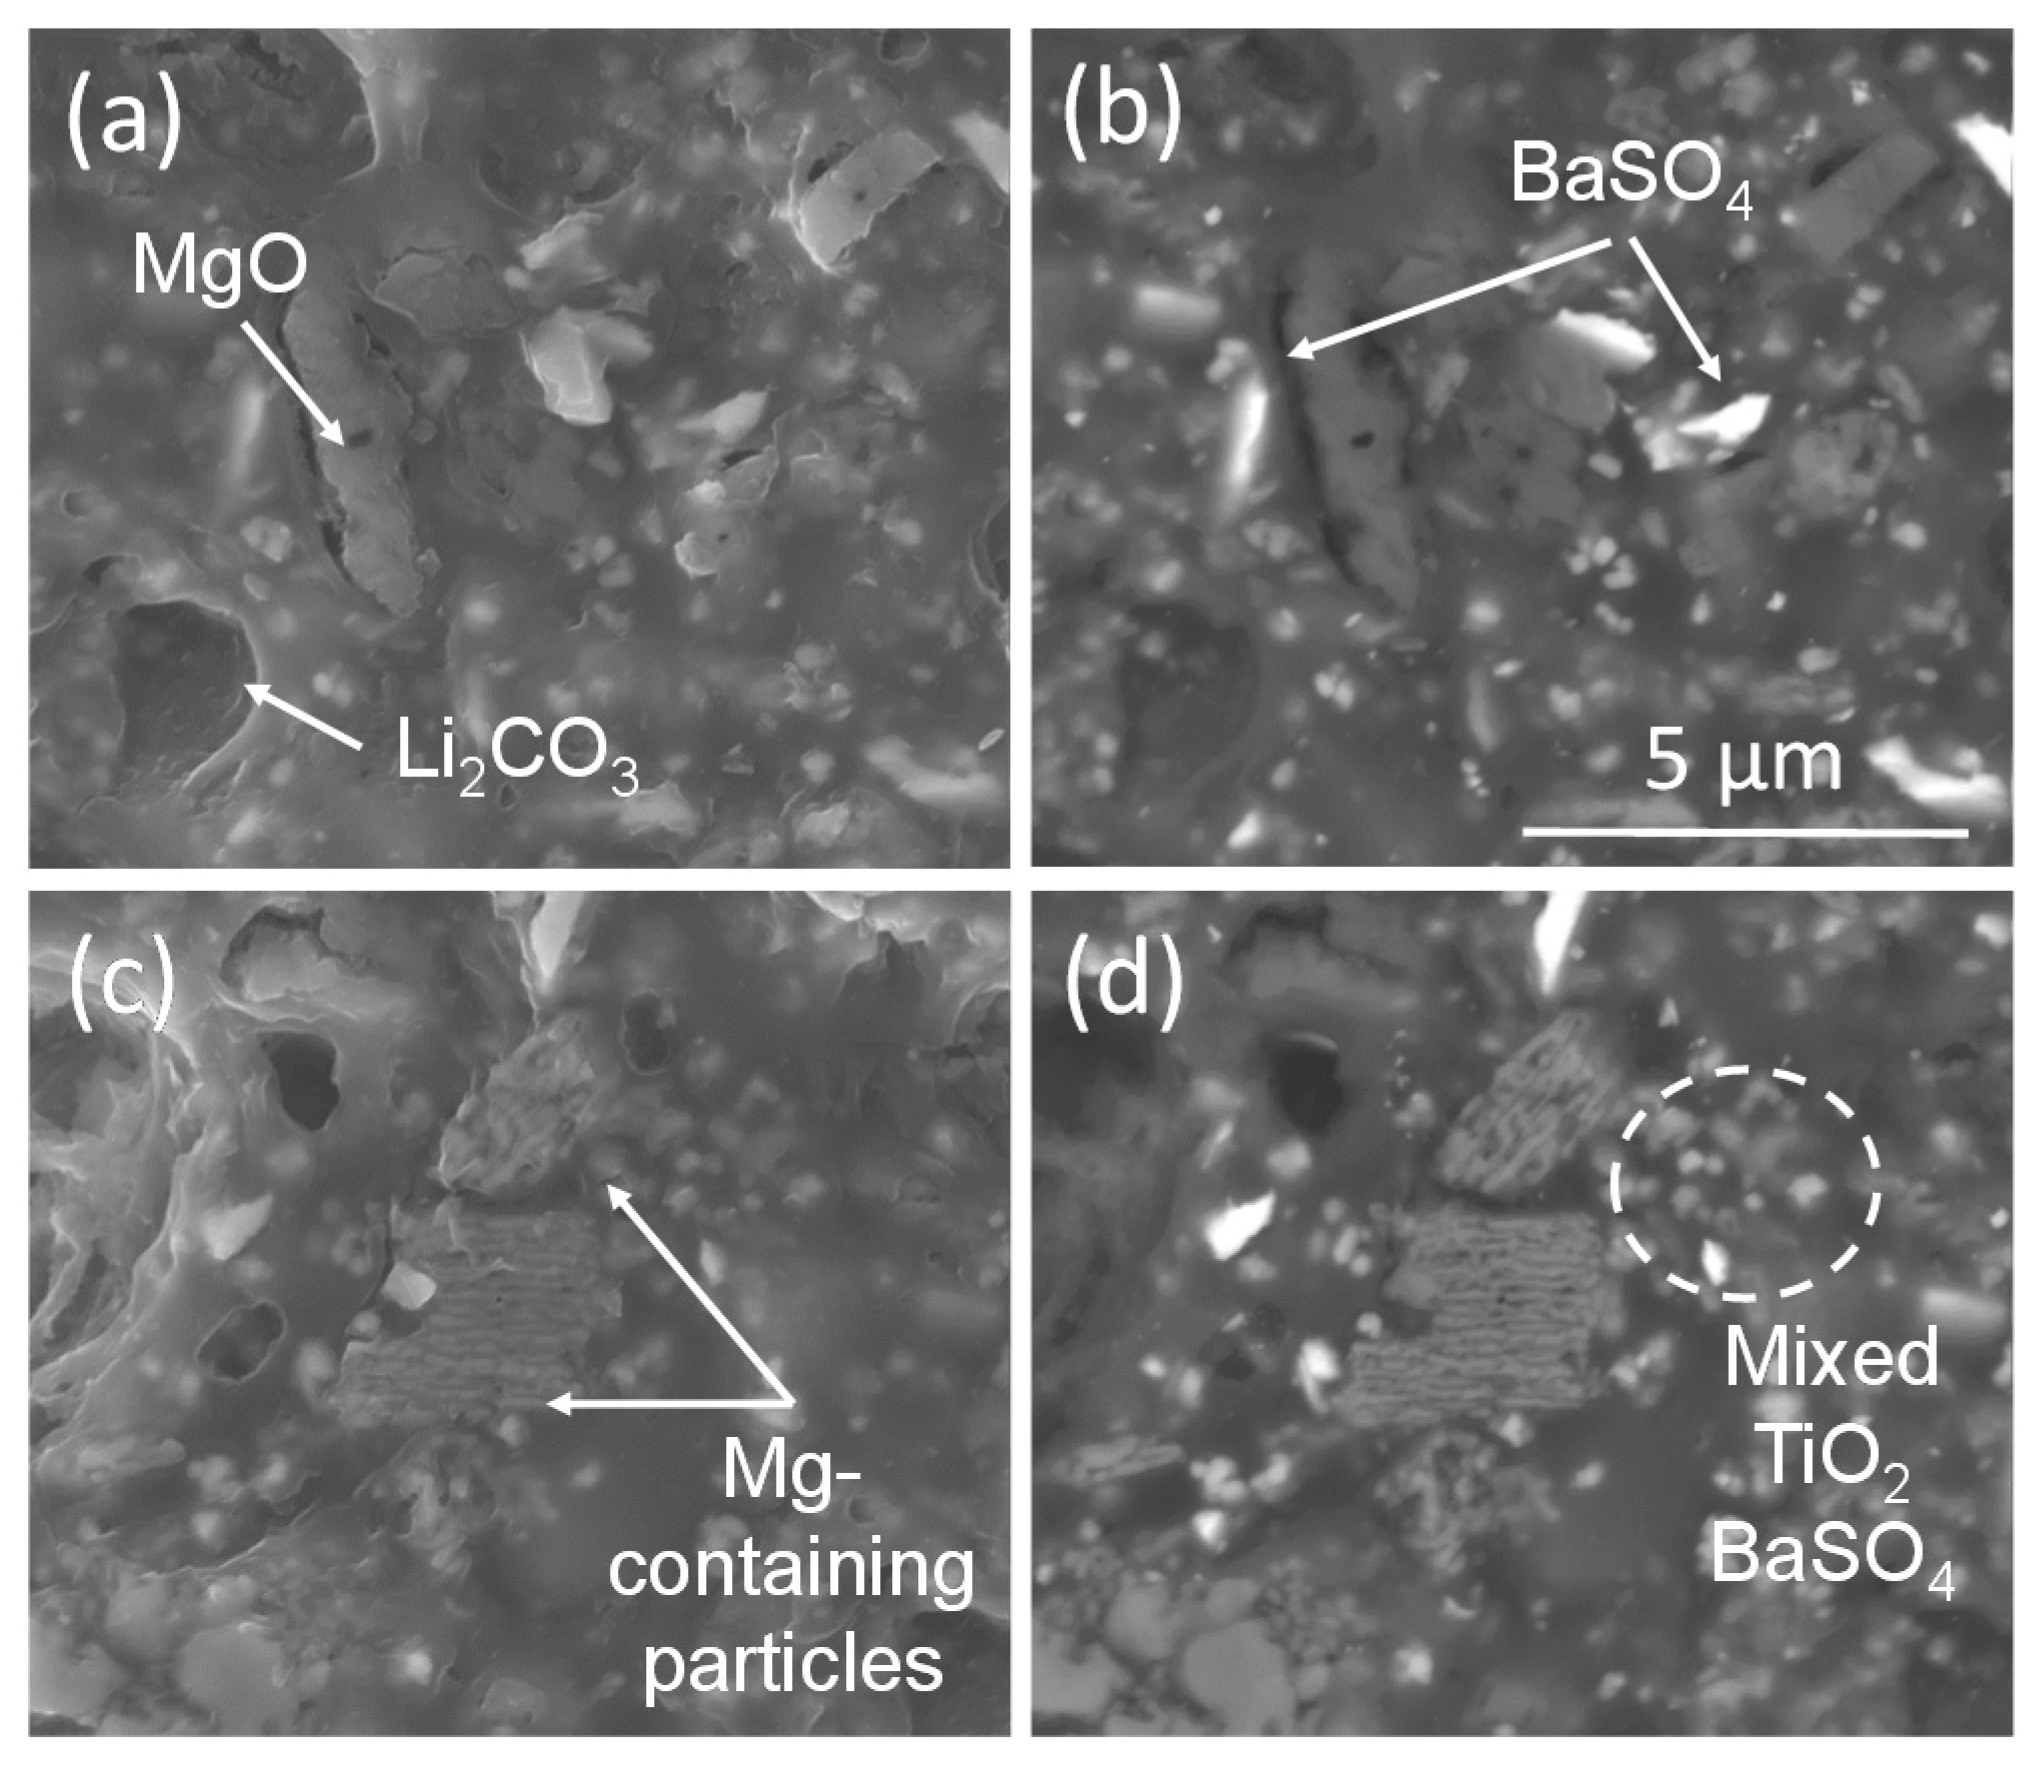
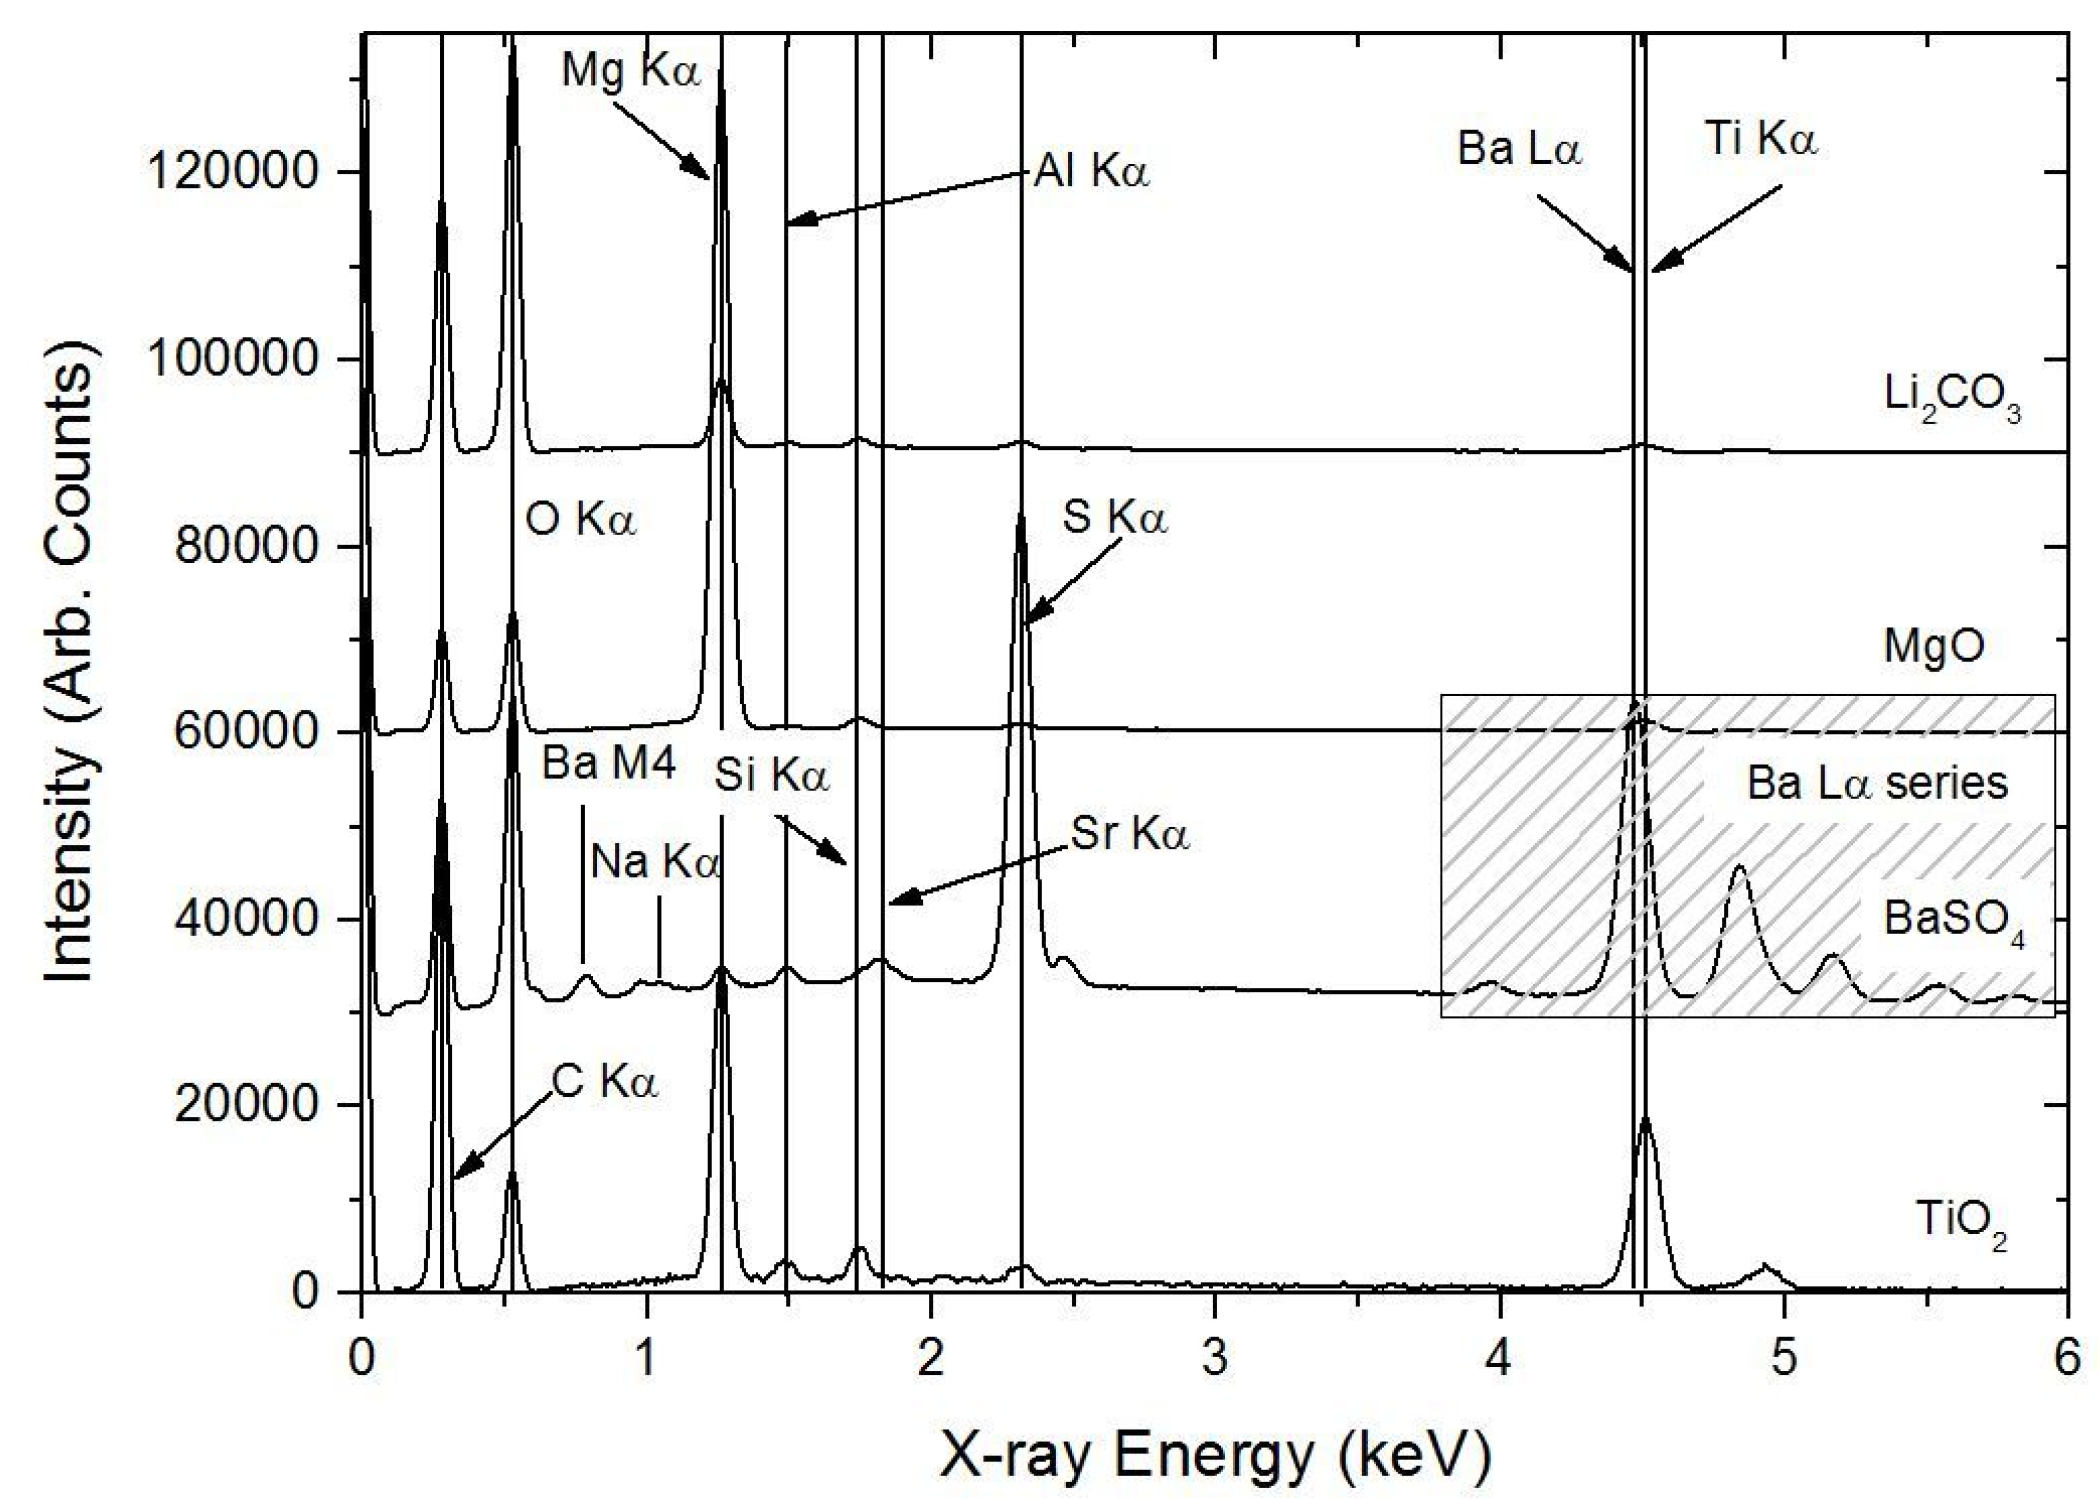
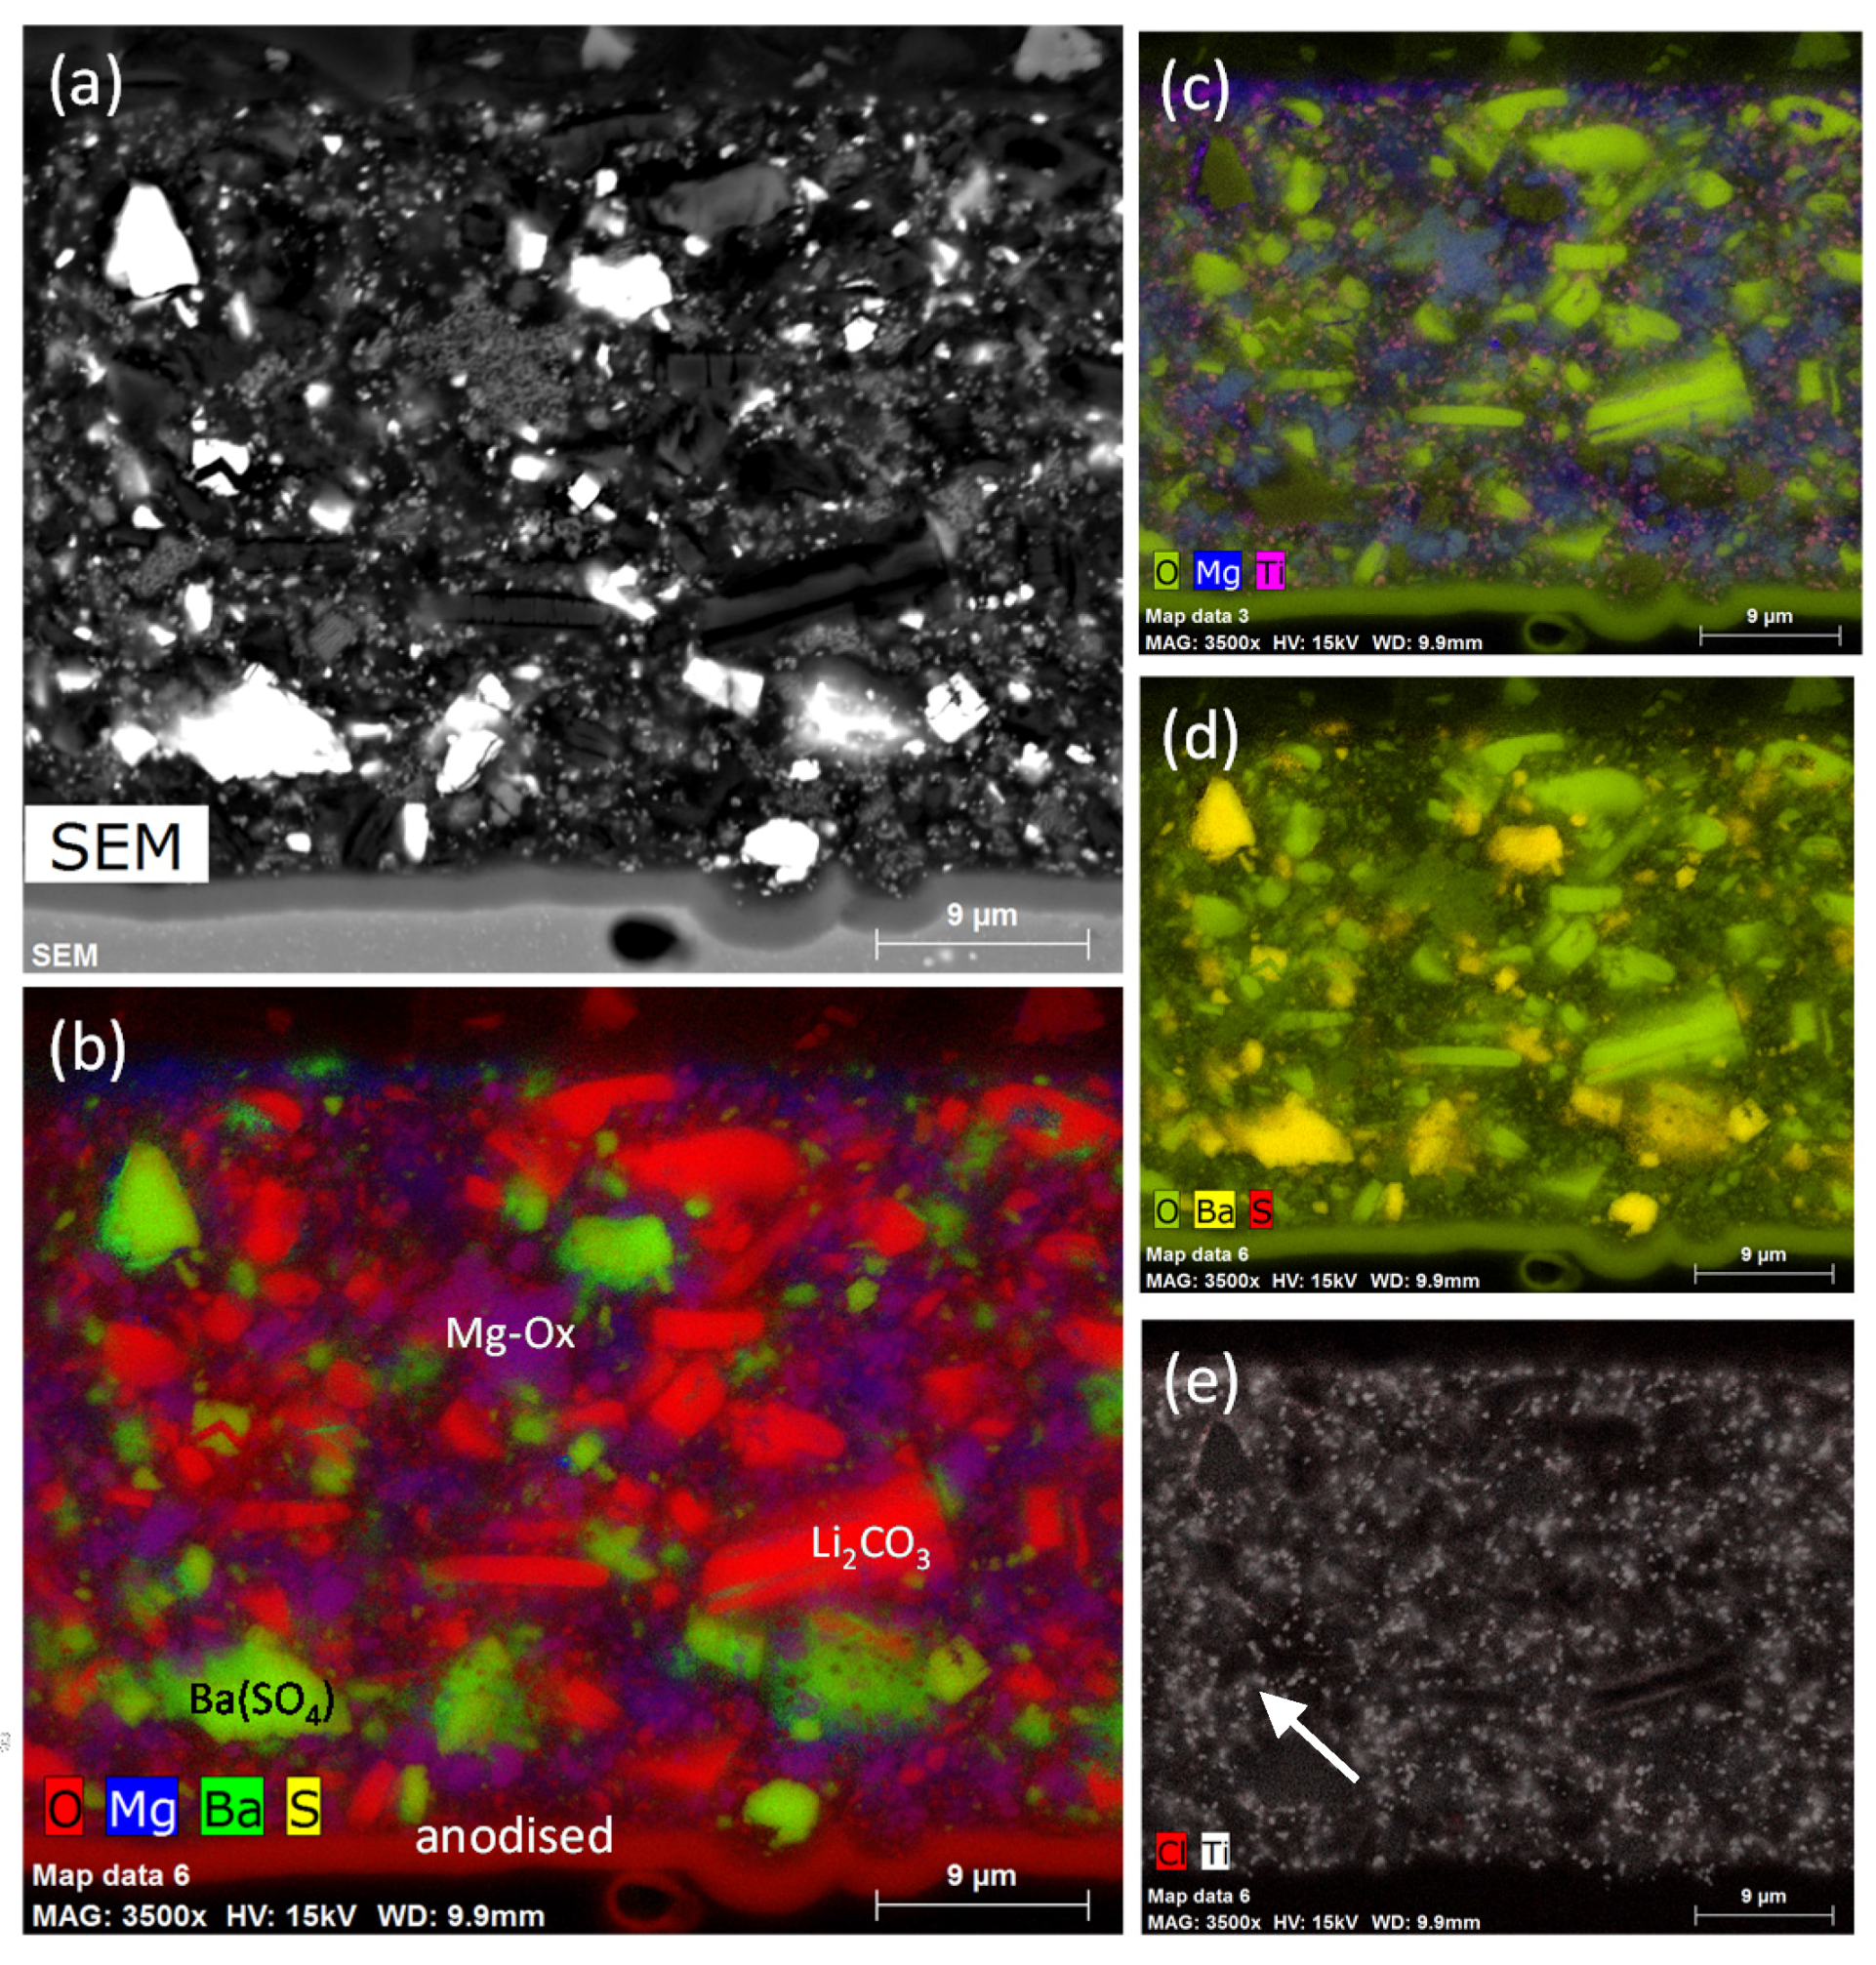
3.1.1. SEM/EDS
3.1.2. PIXE/PIGE
3.2. NSS Exposure and Li Depletion in the Primer
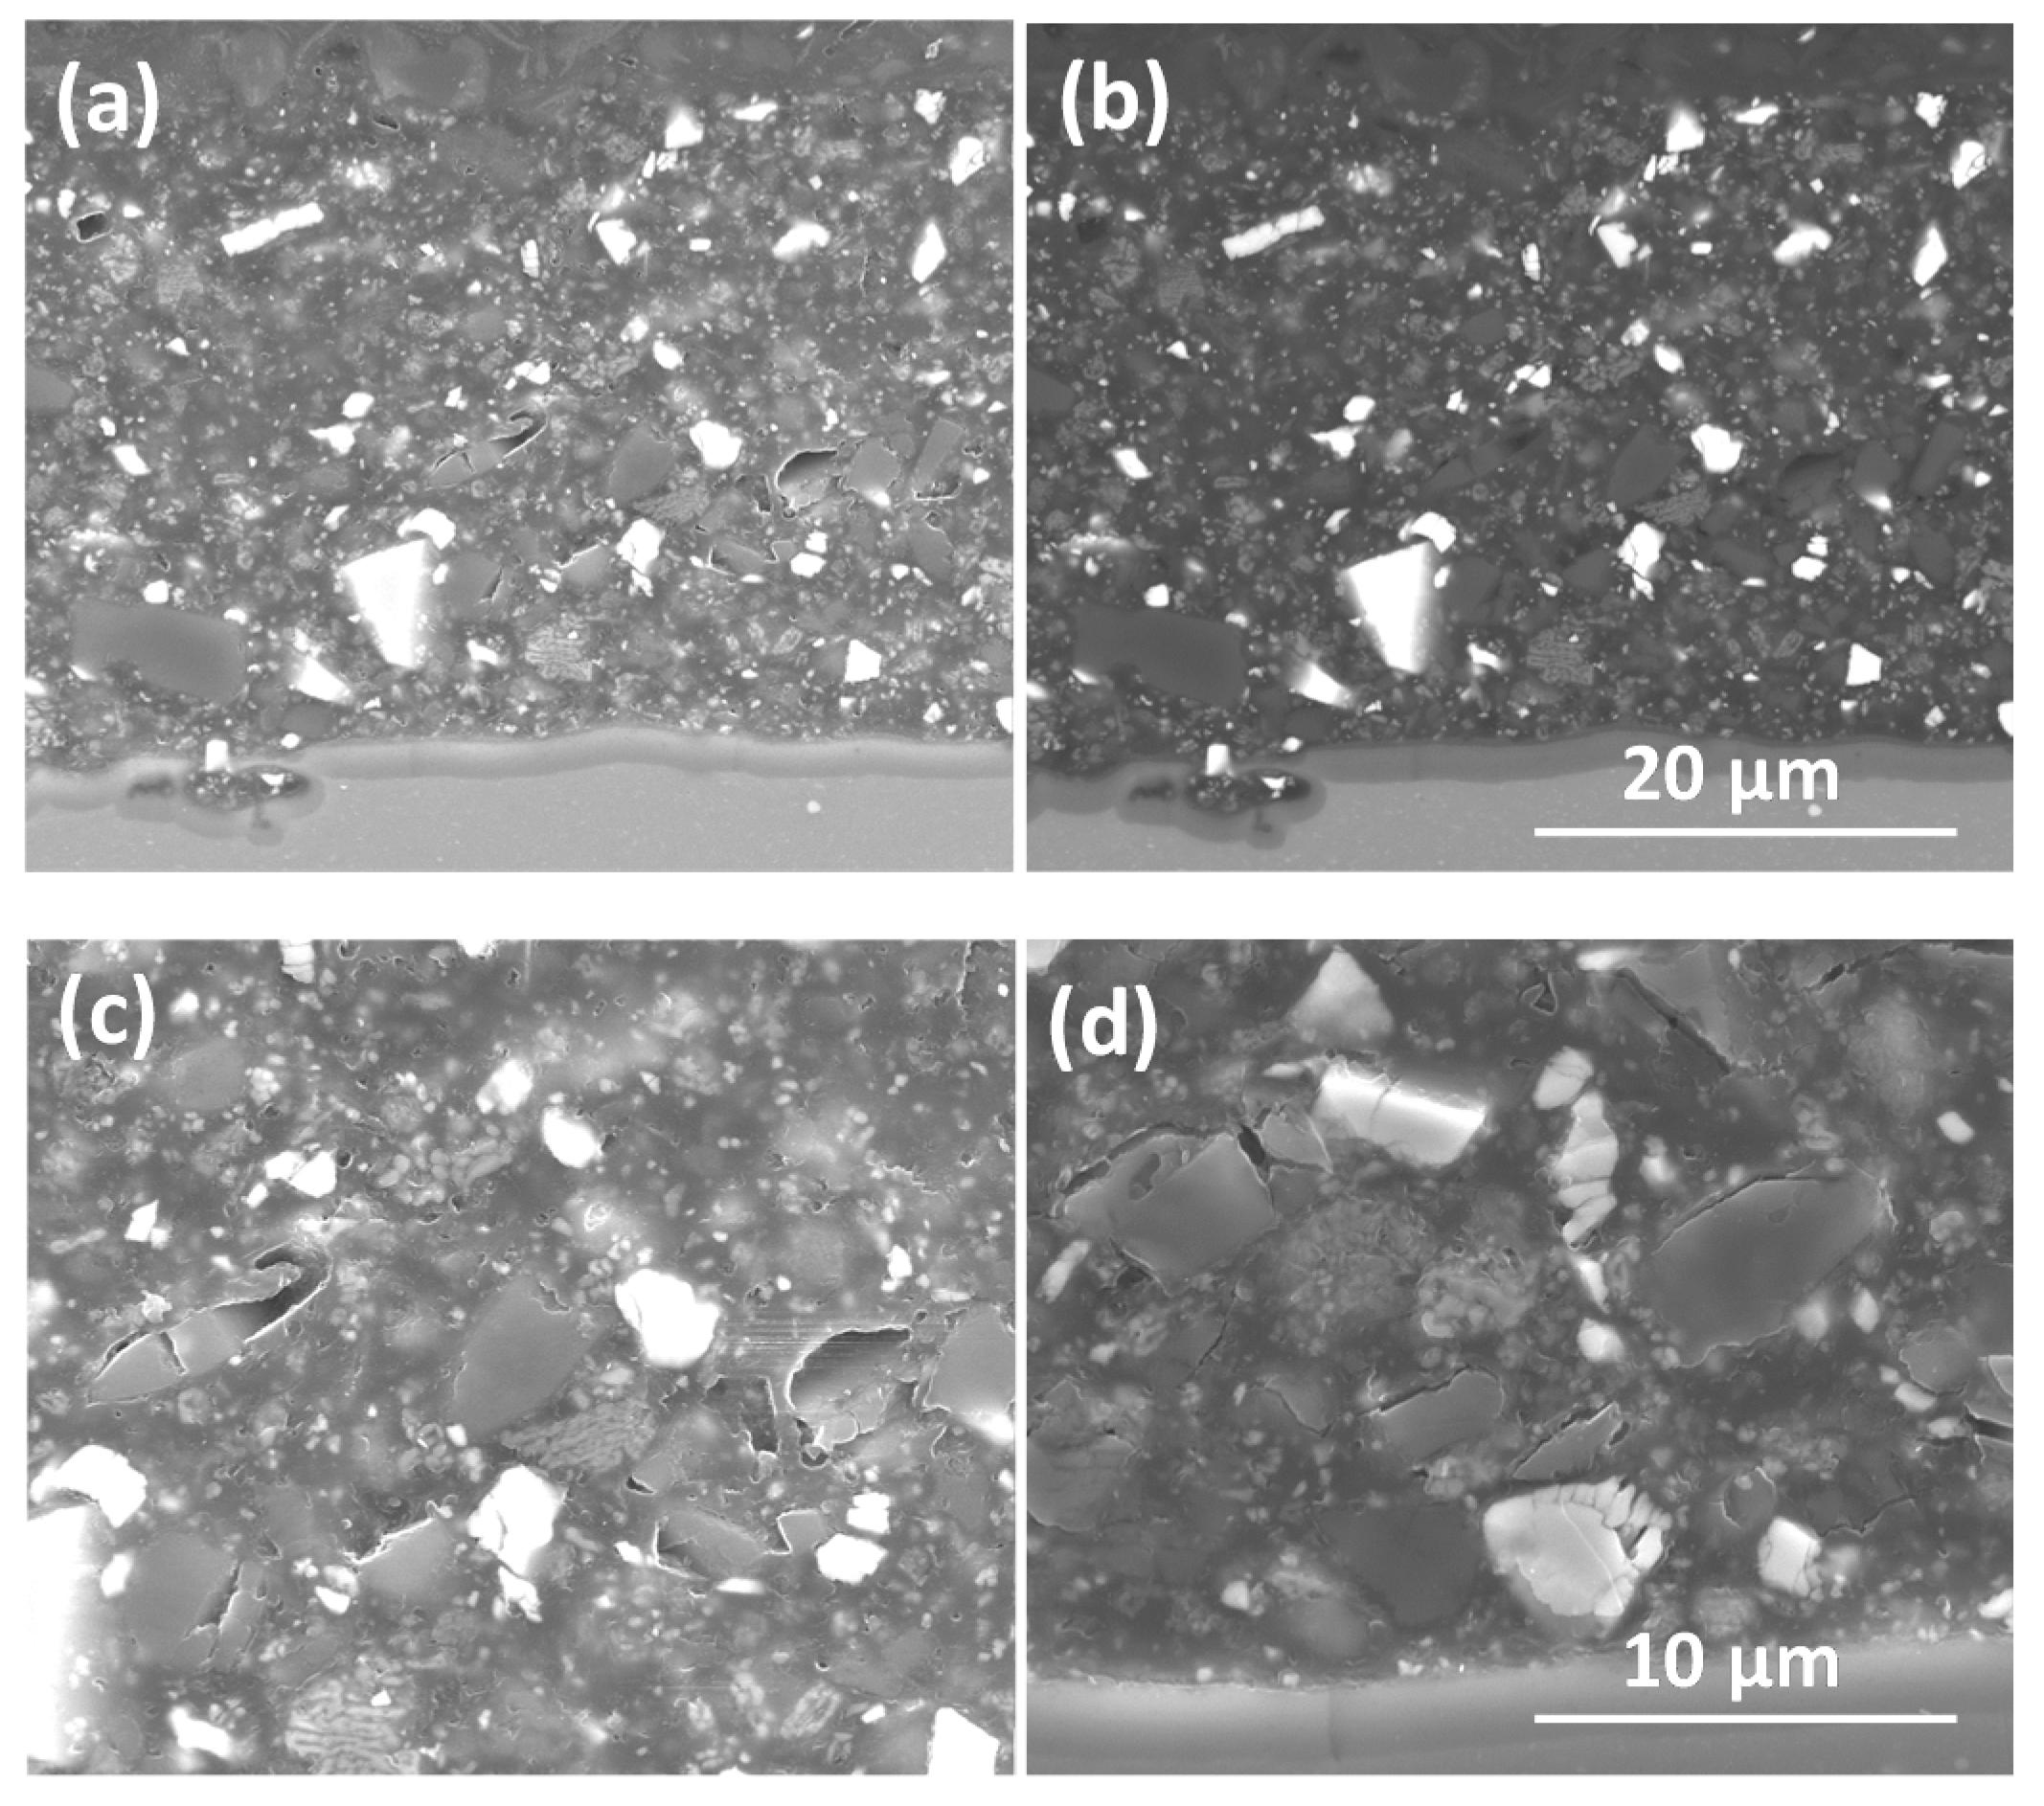
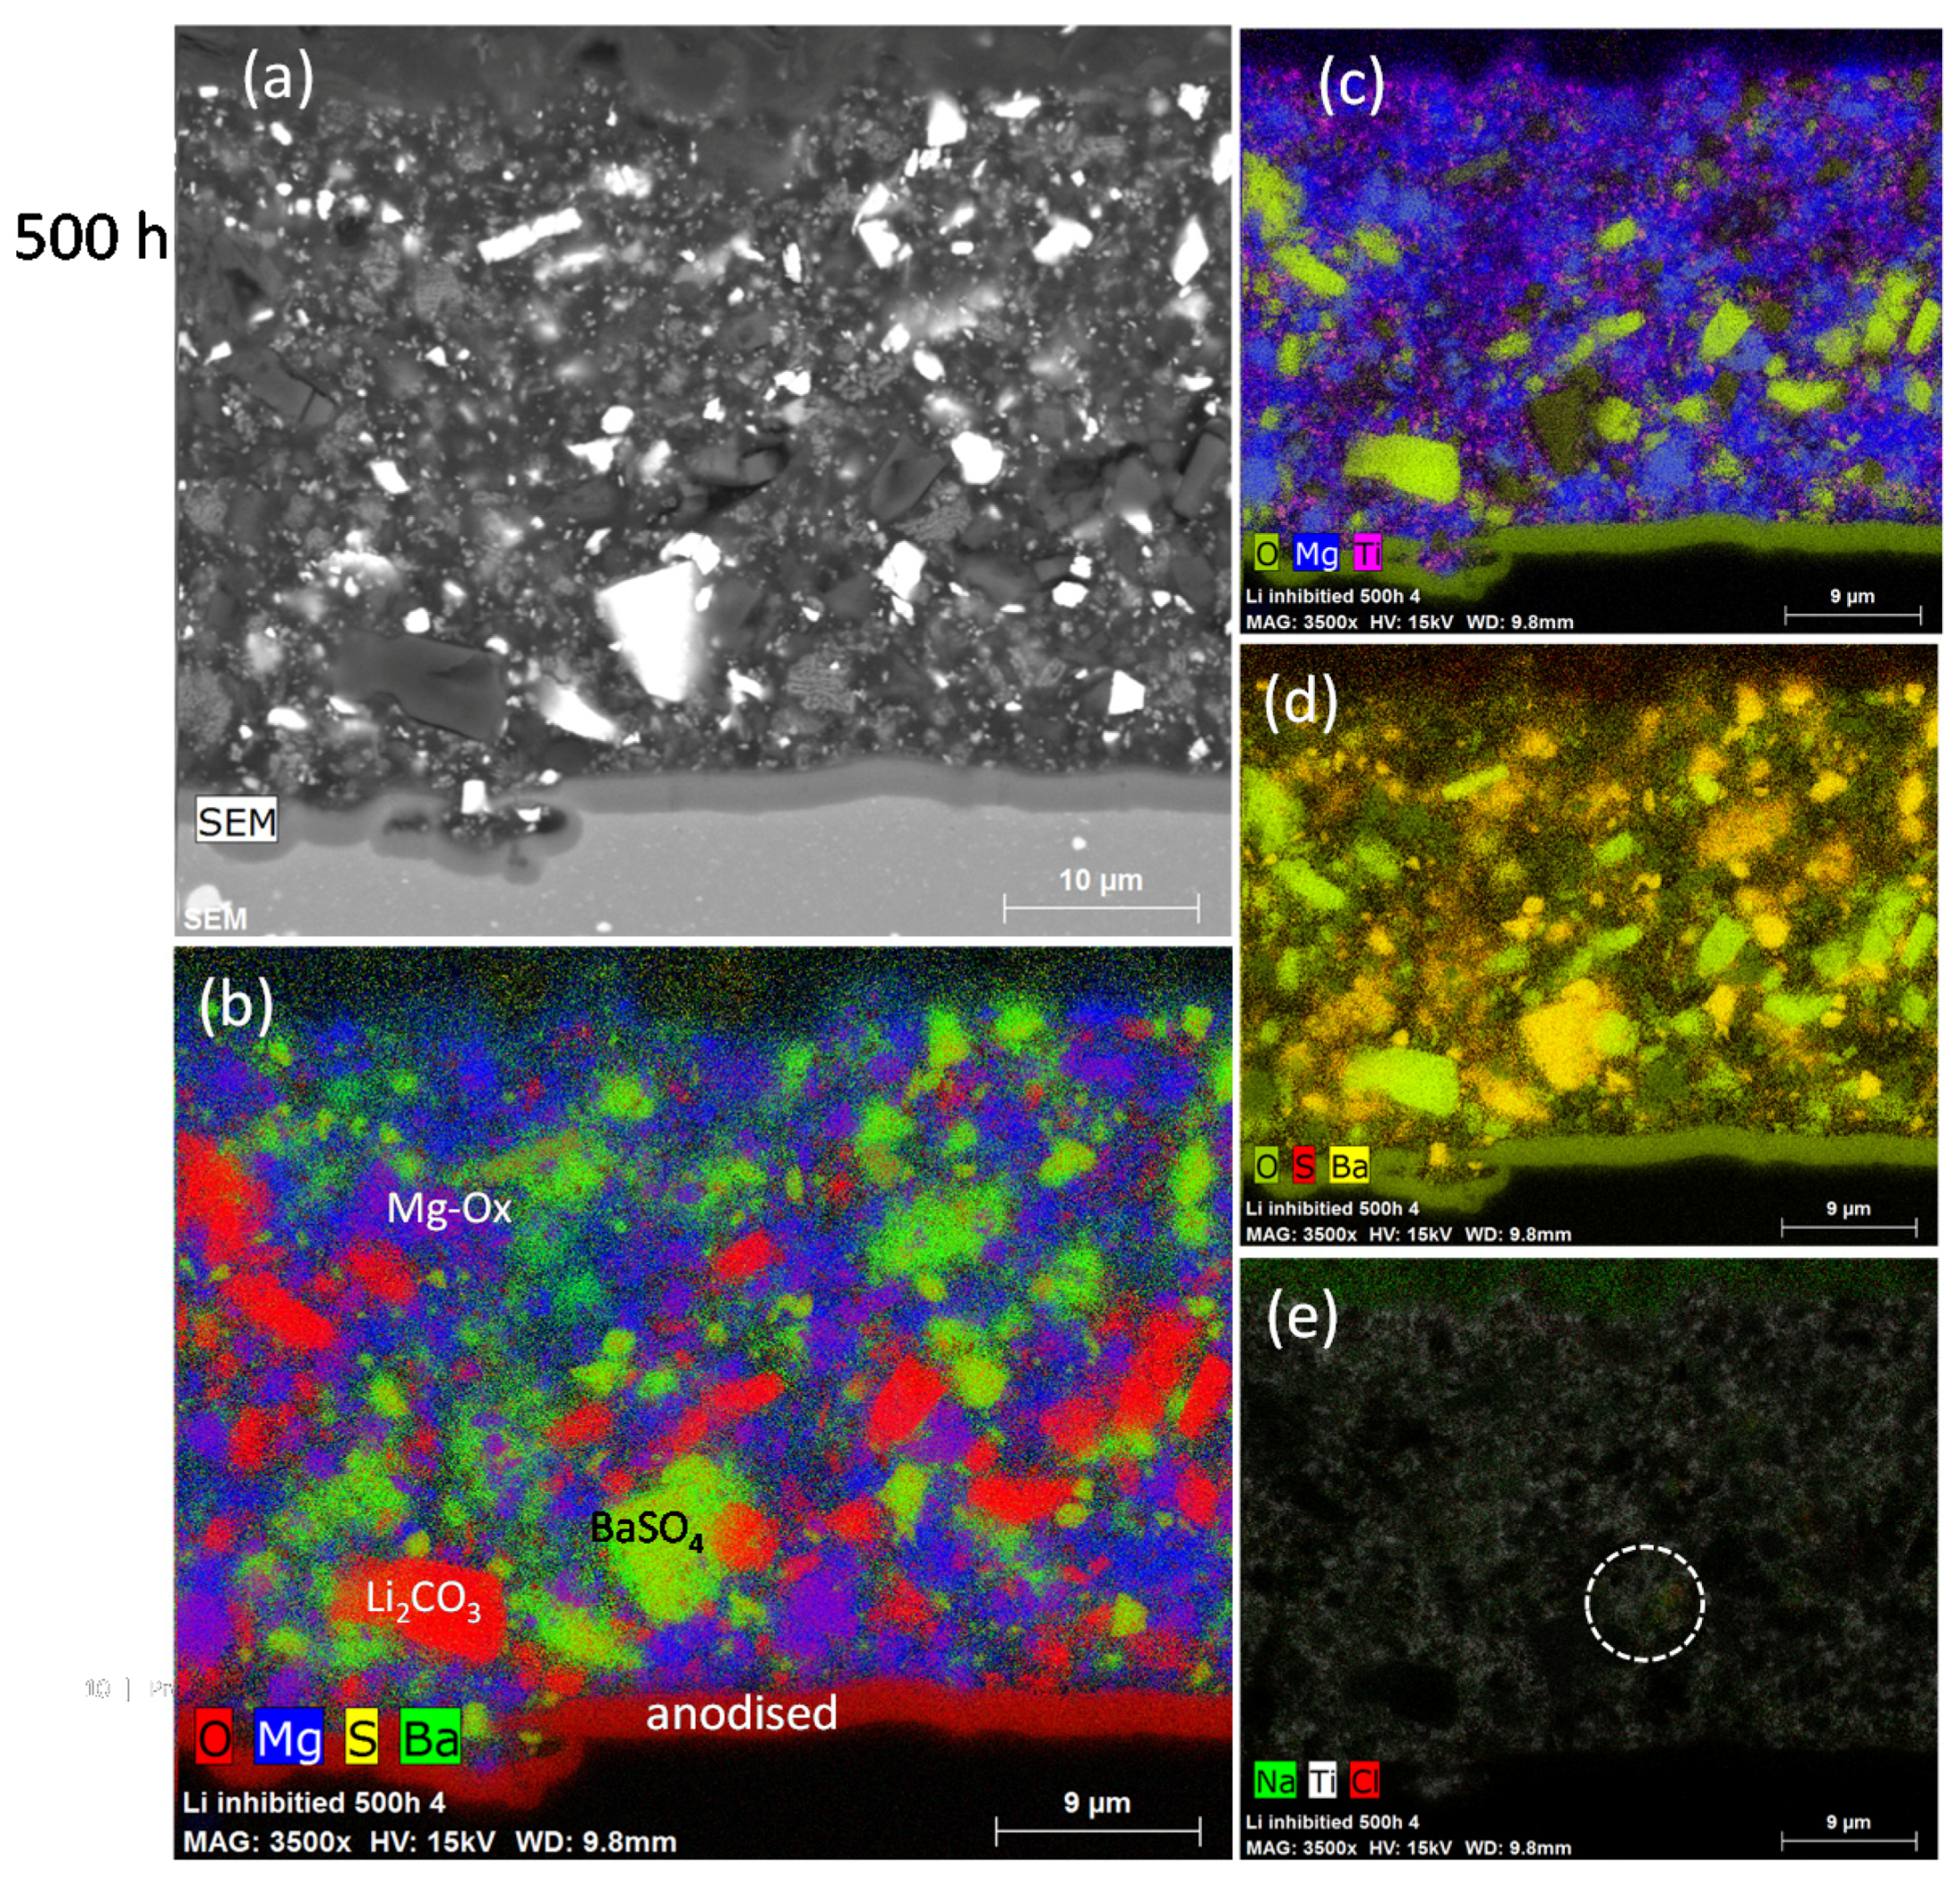
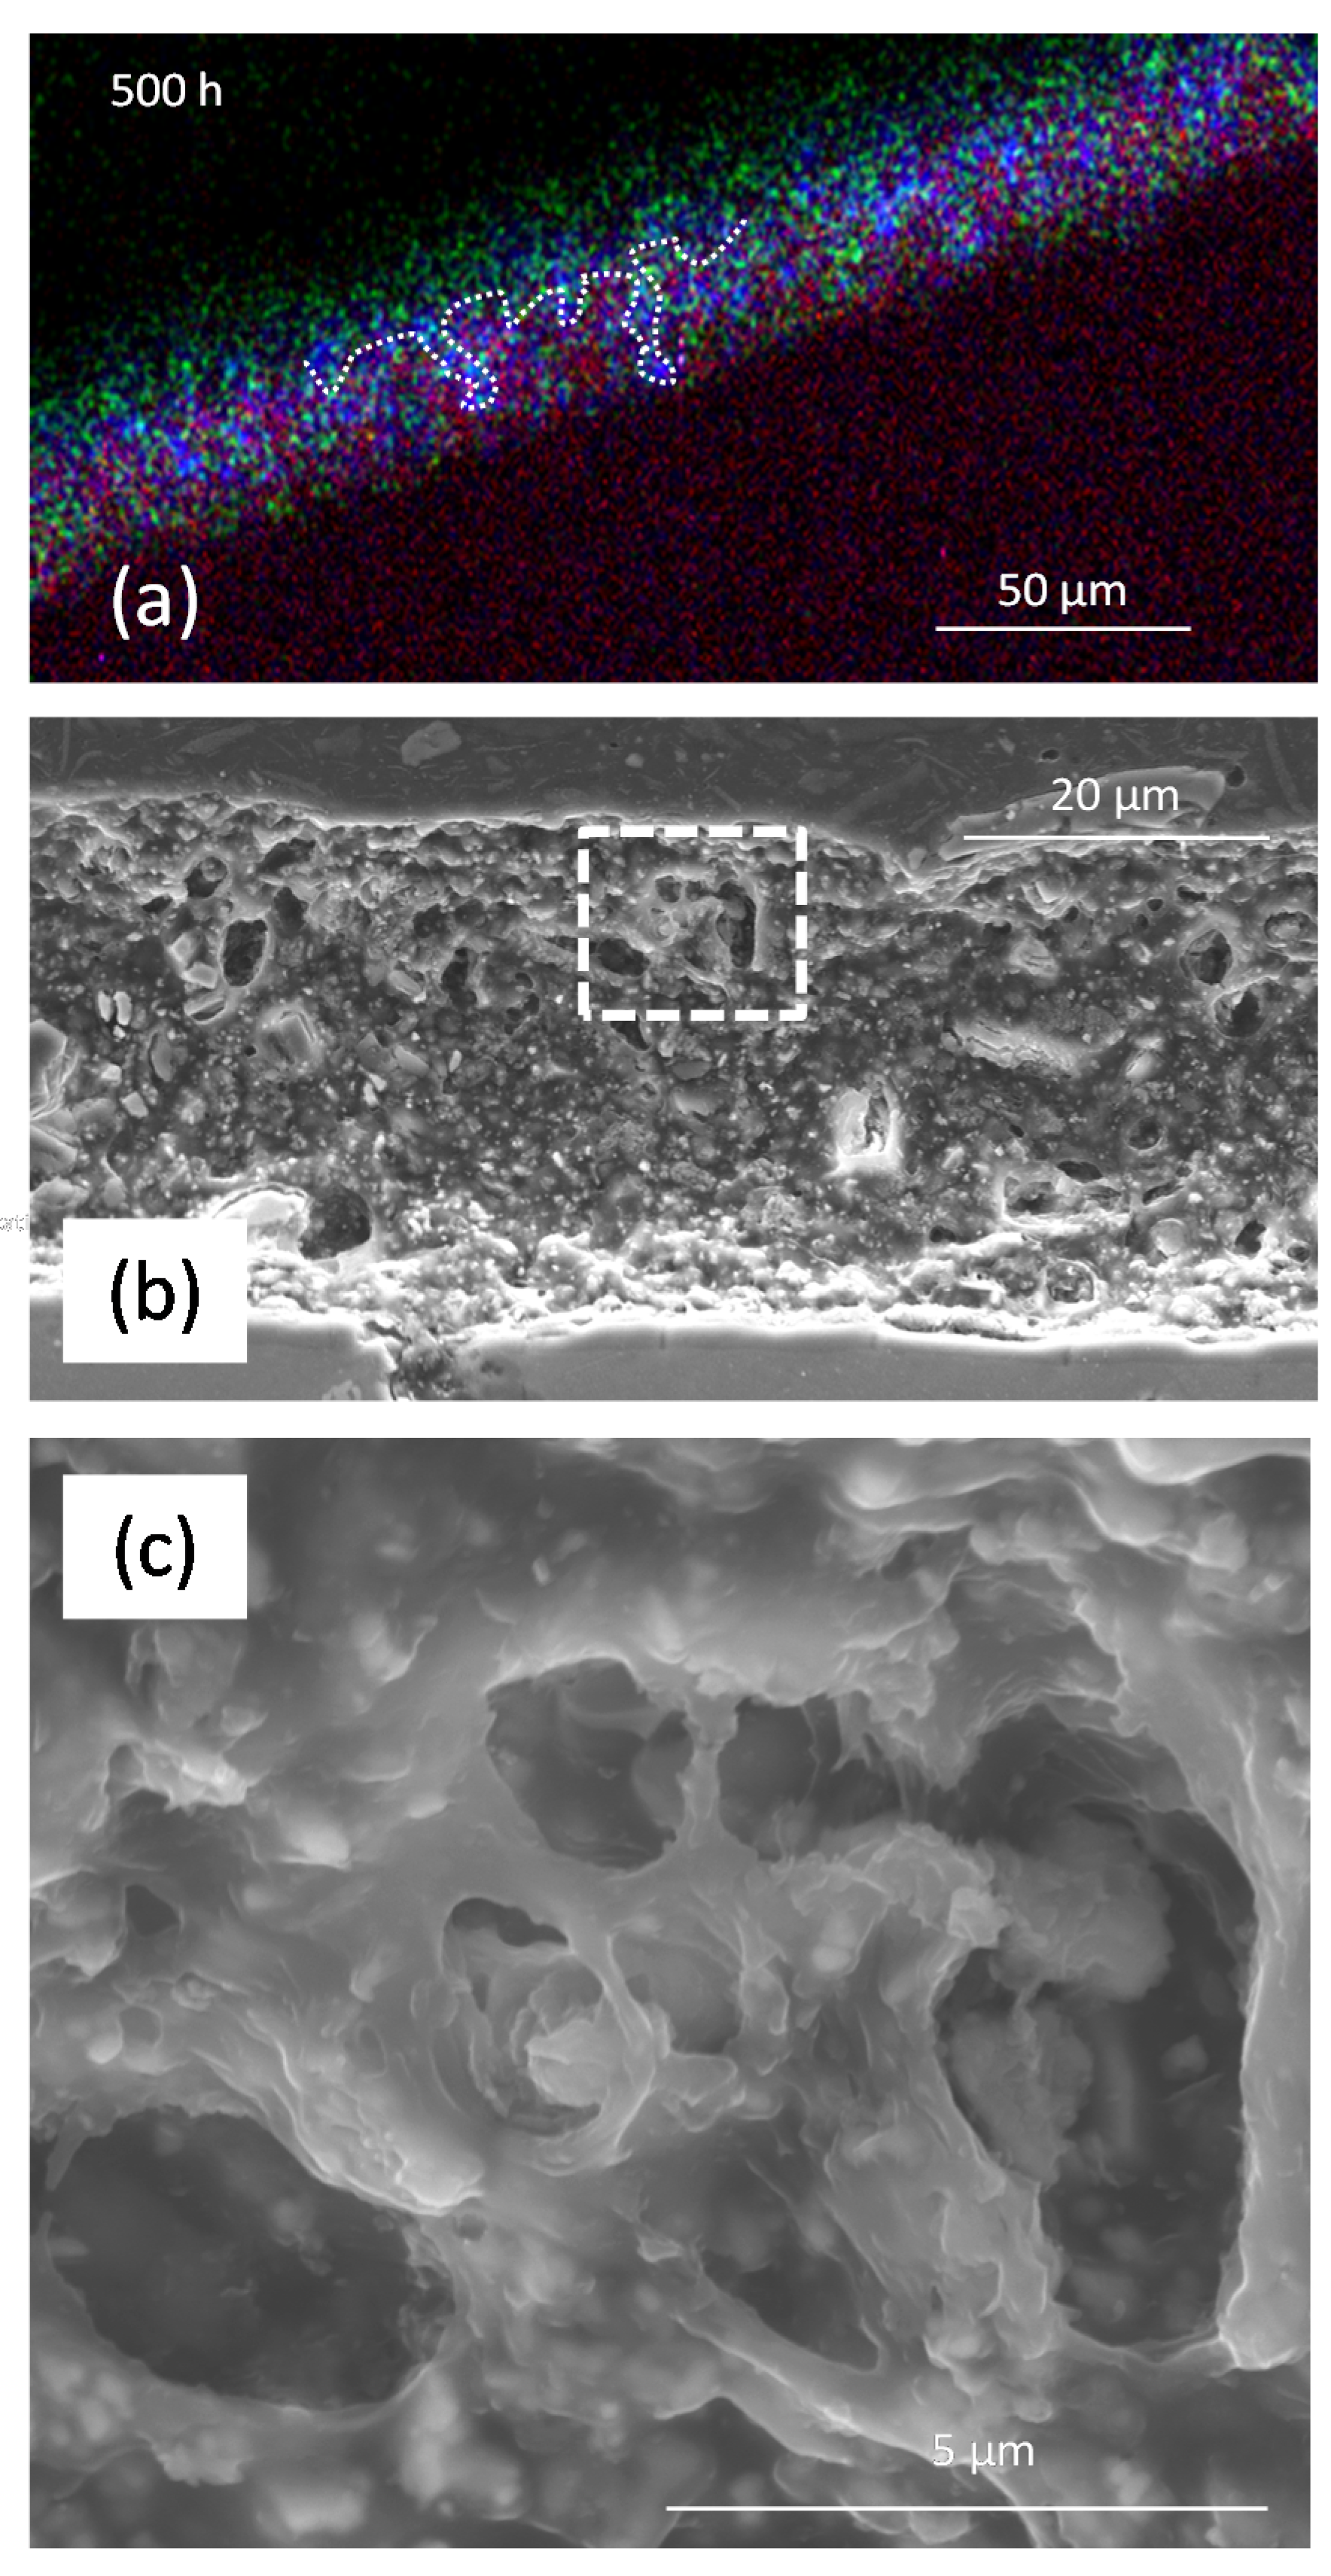
3.2.1. SEM/EDS
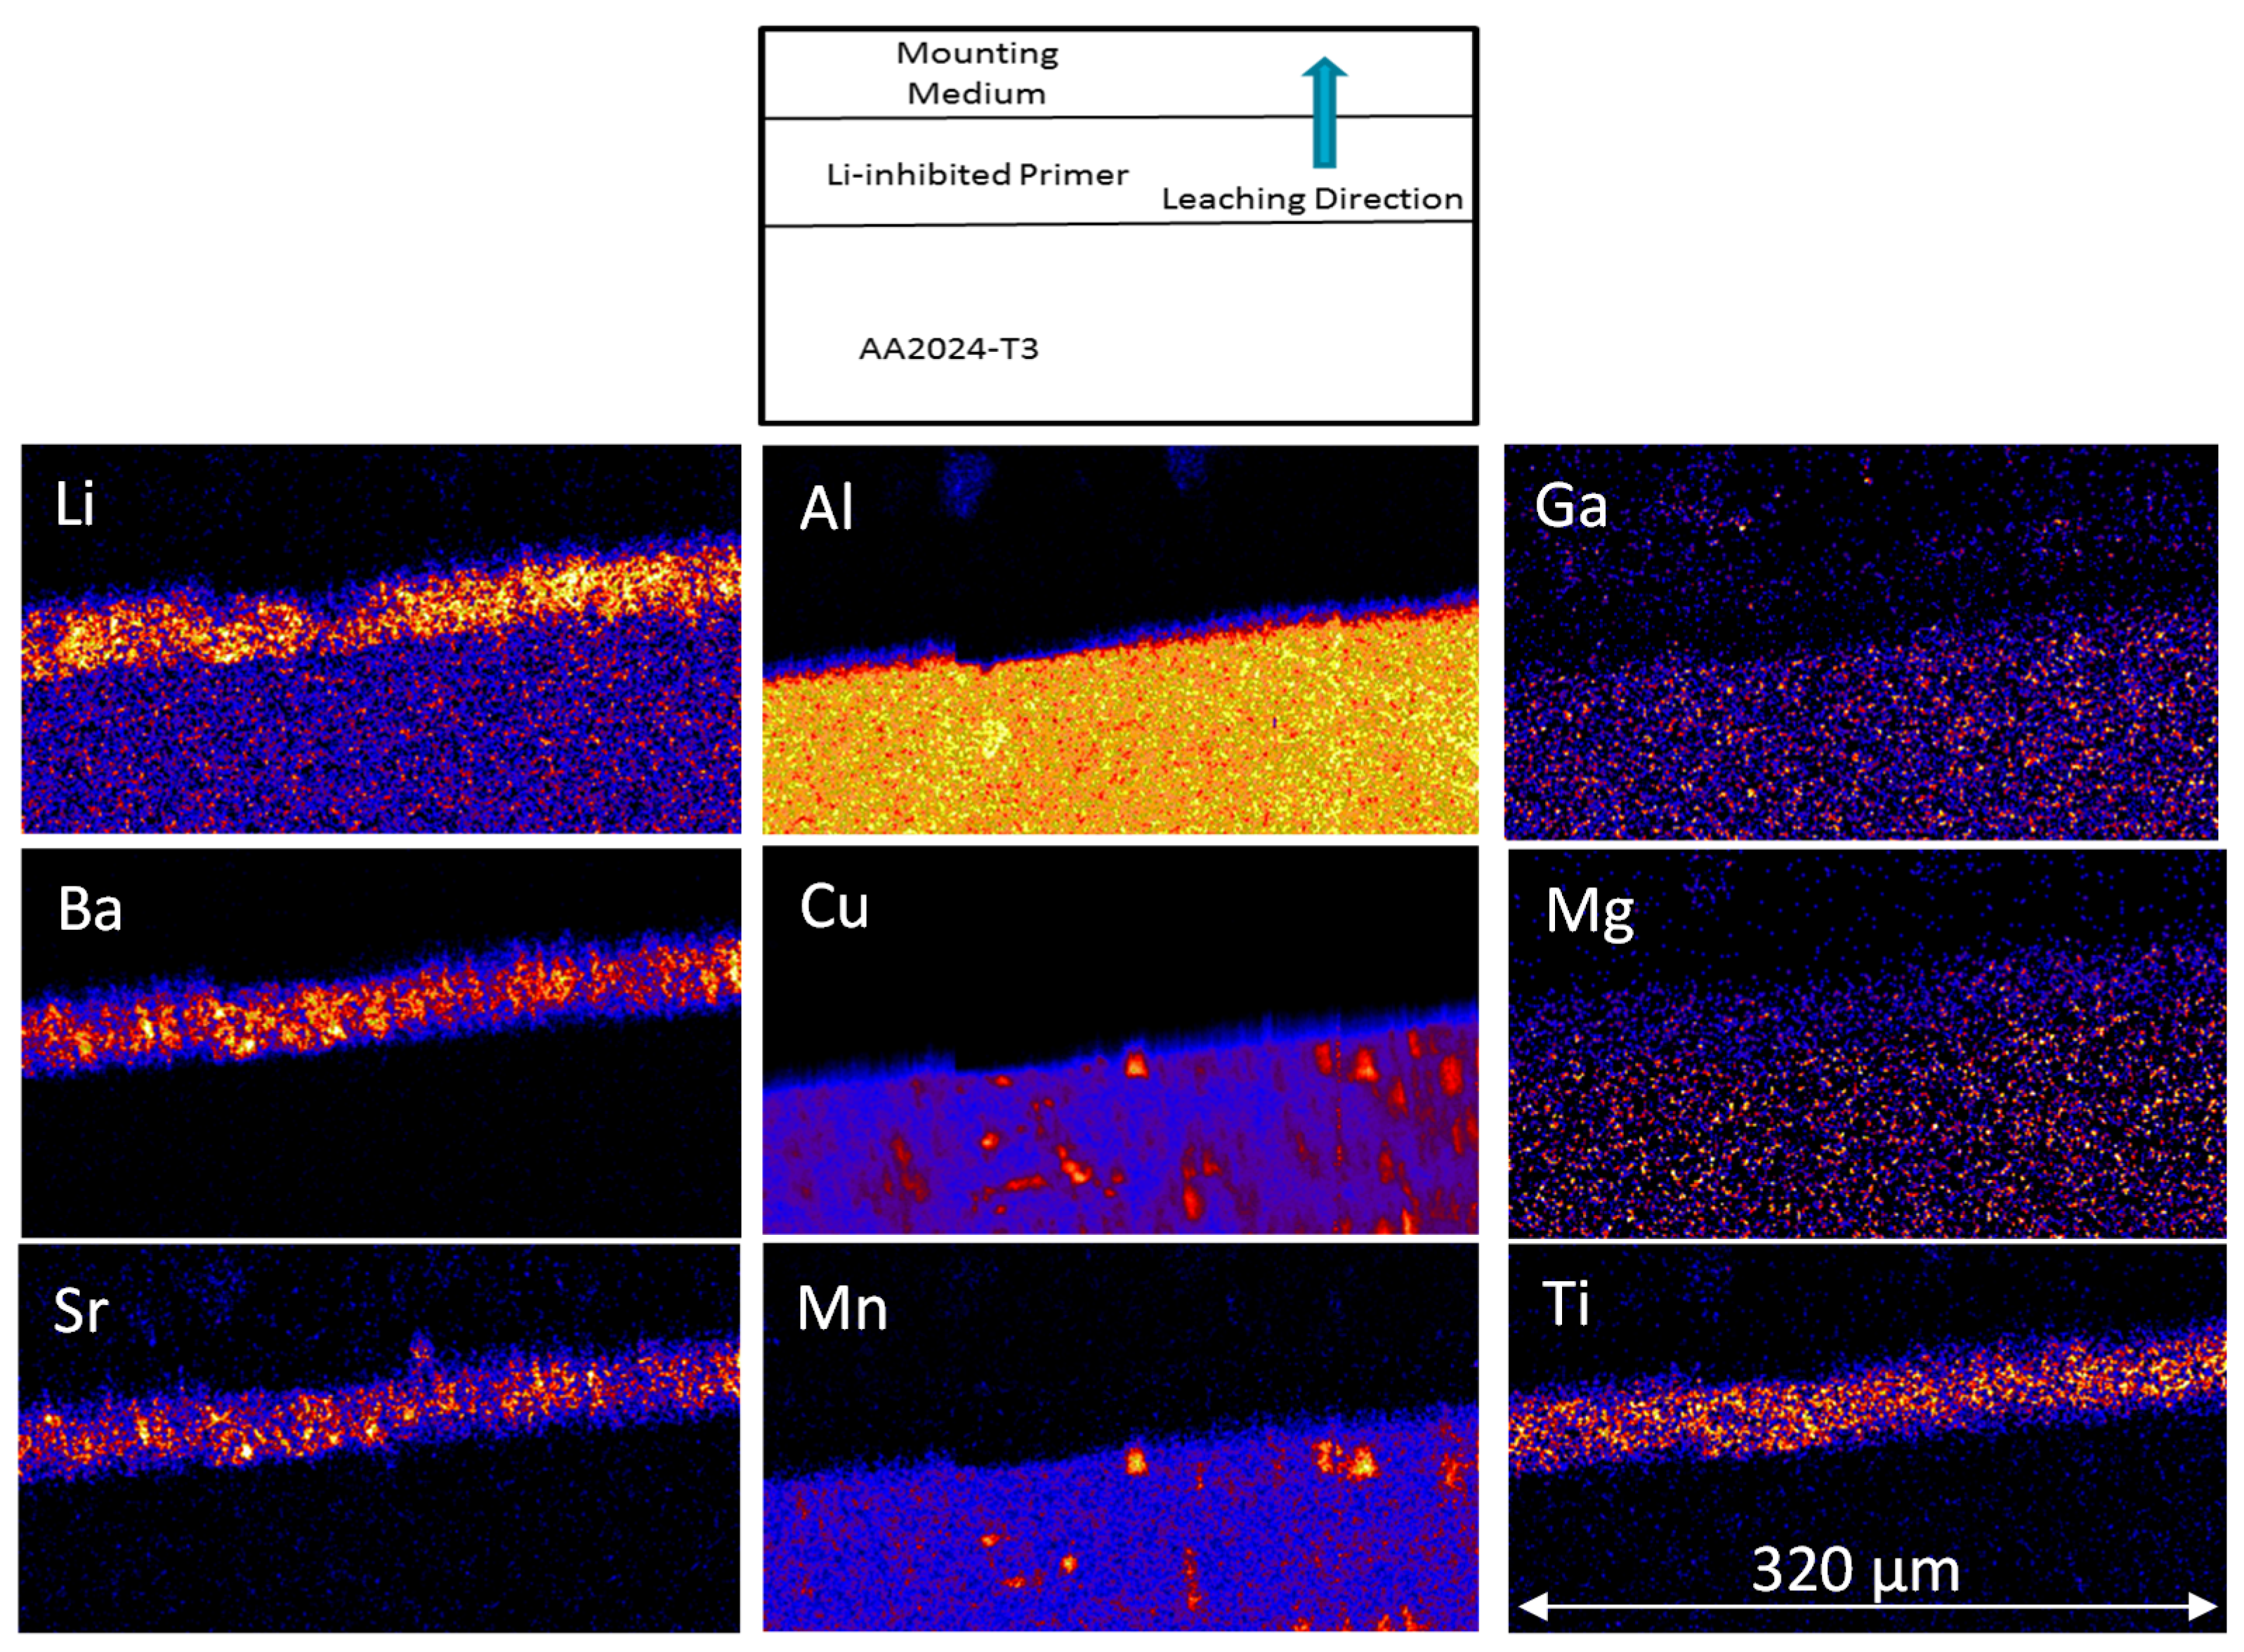
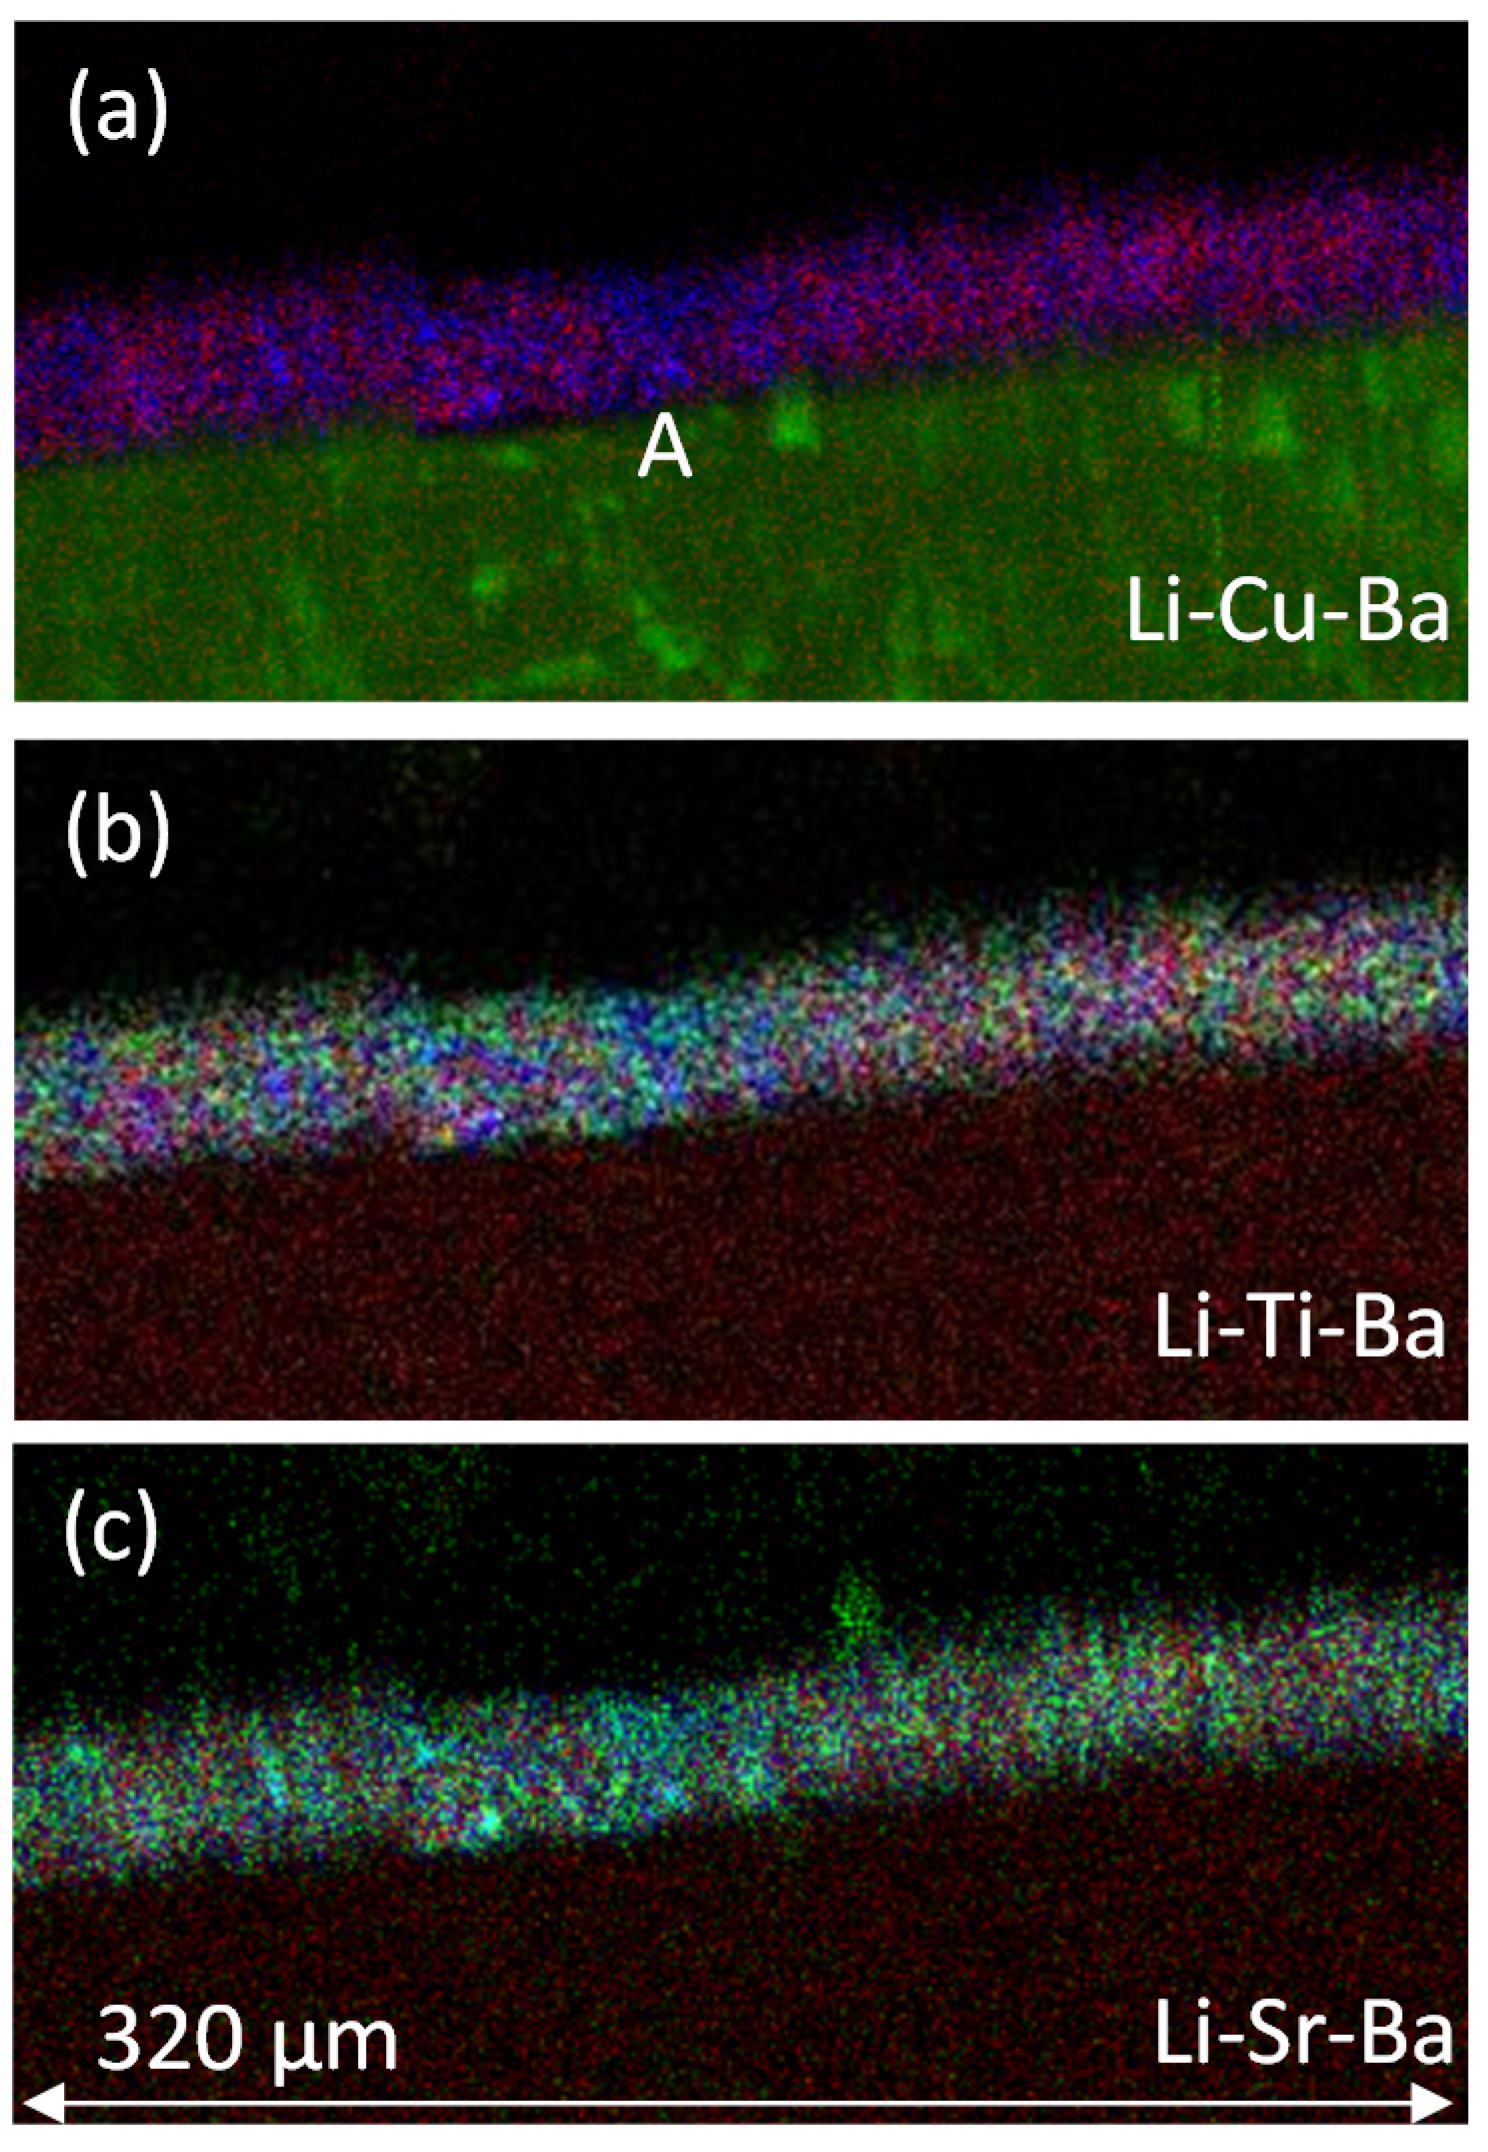
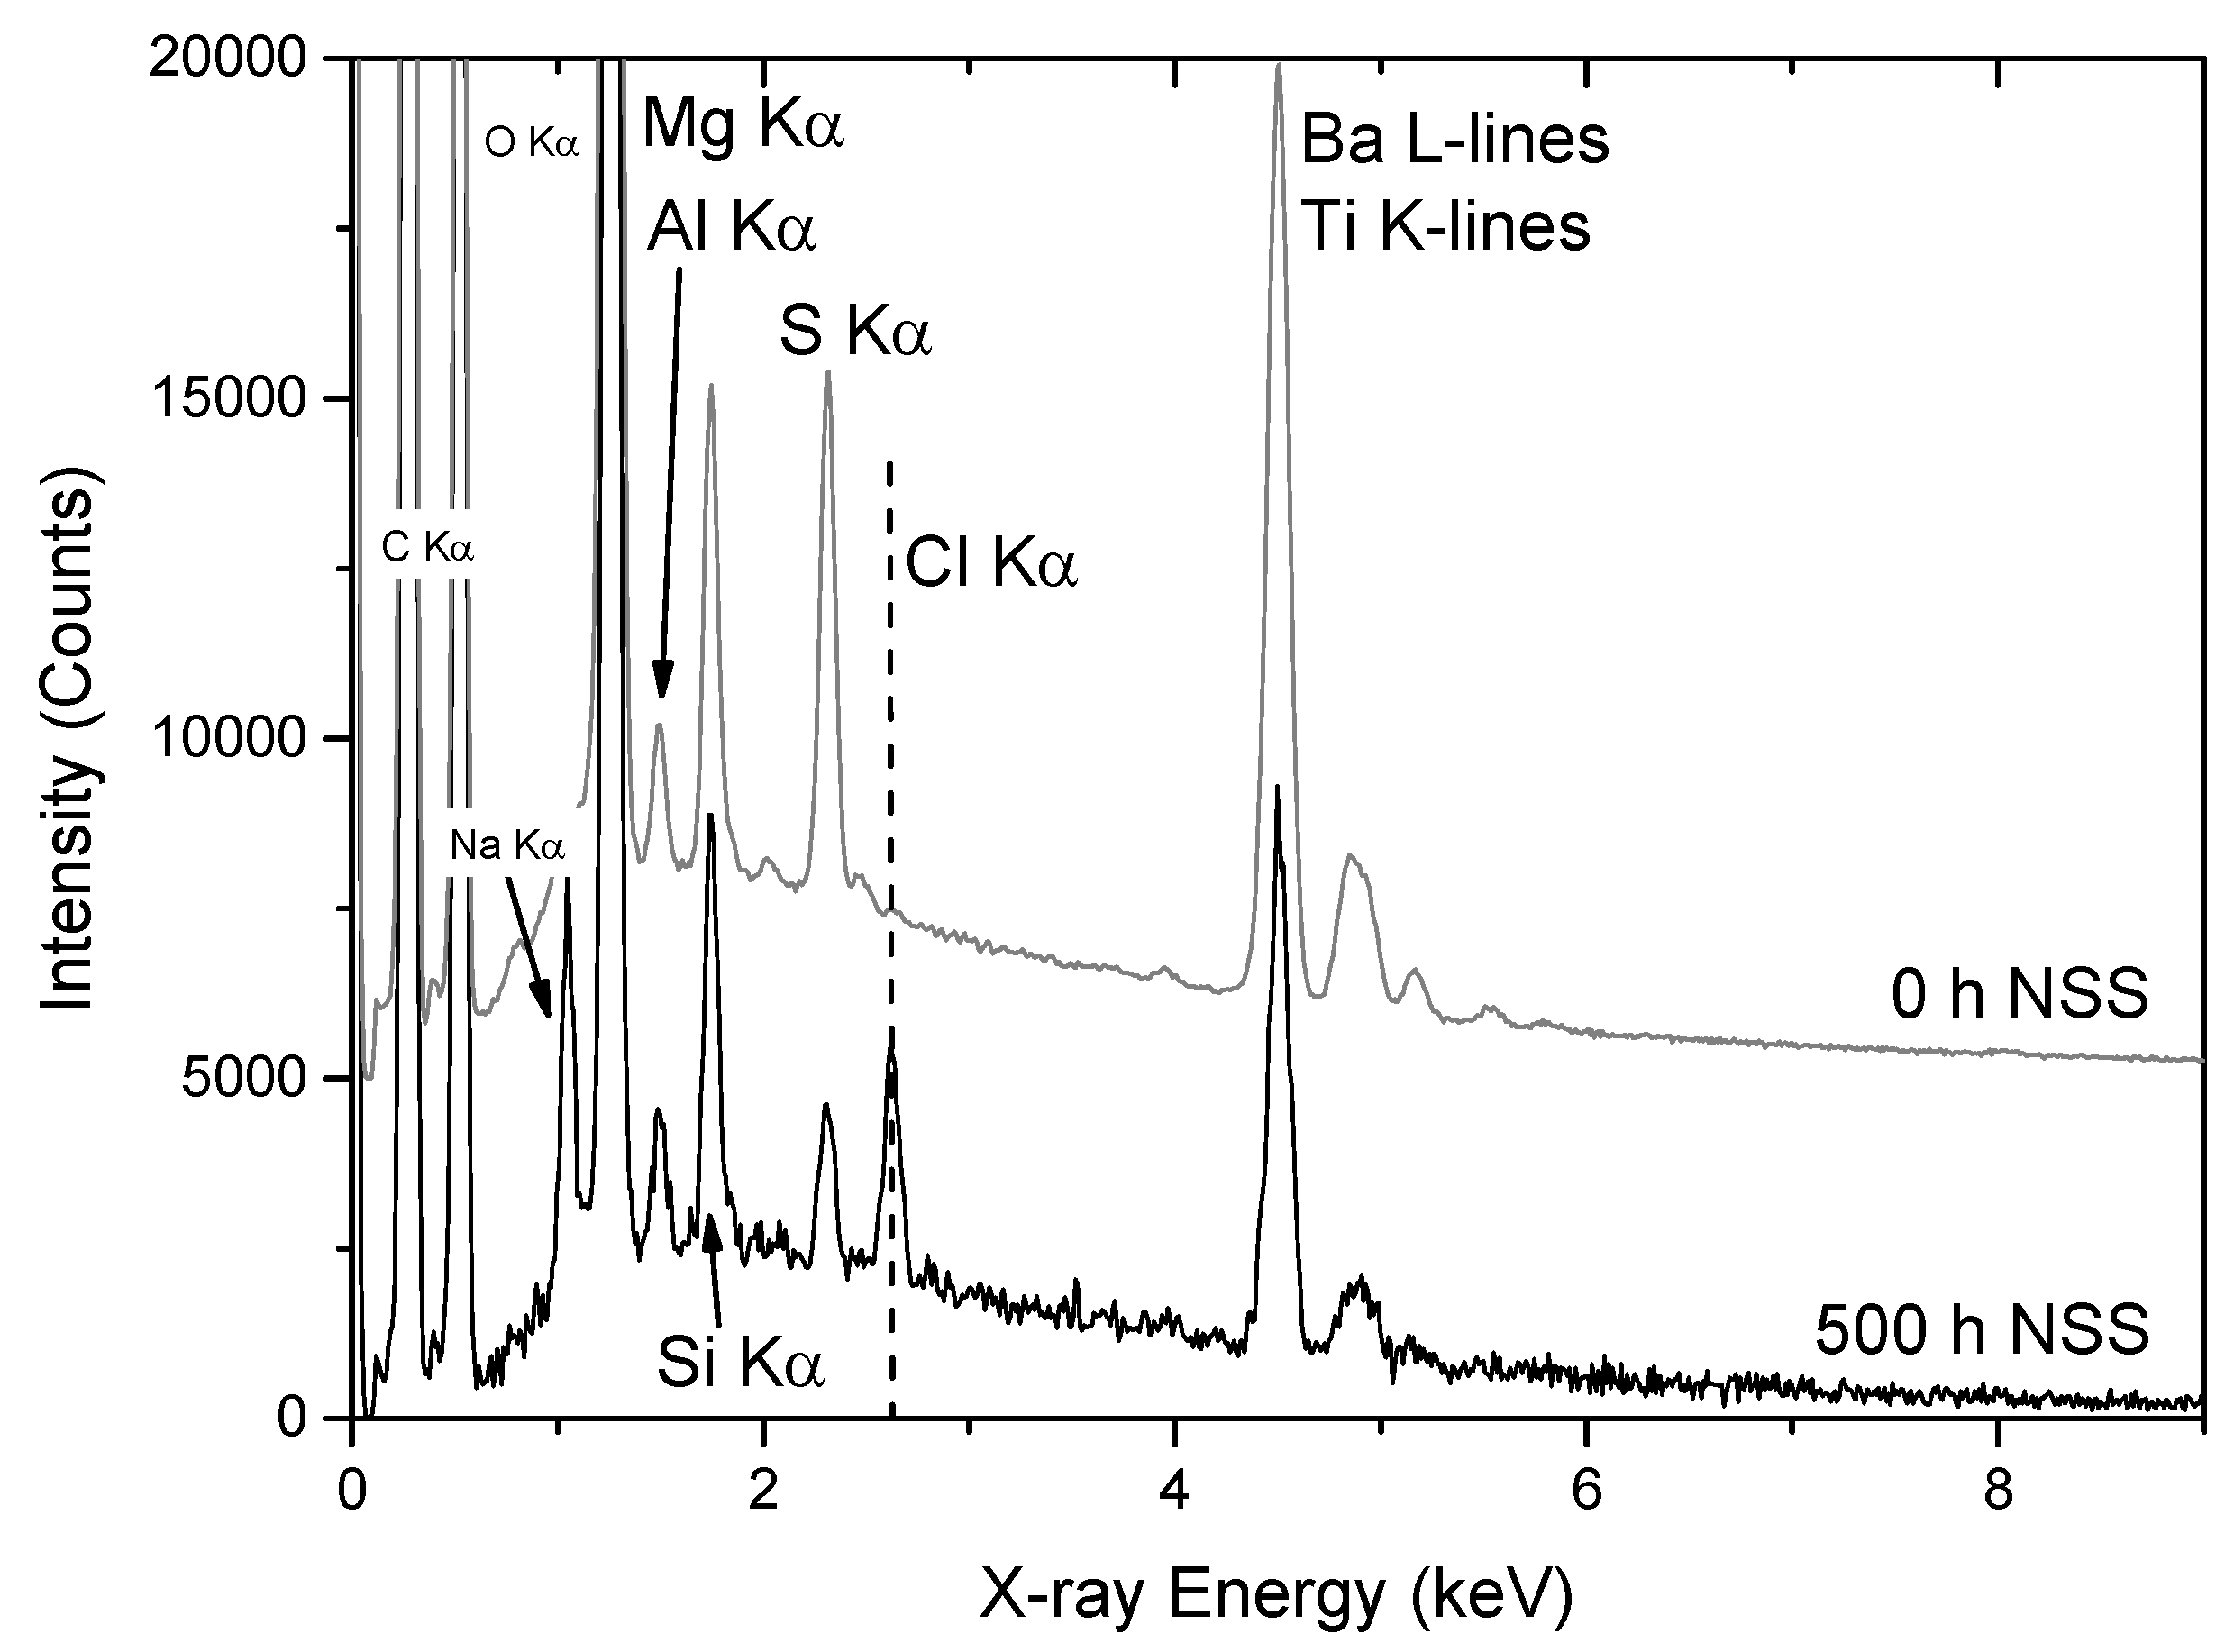
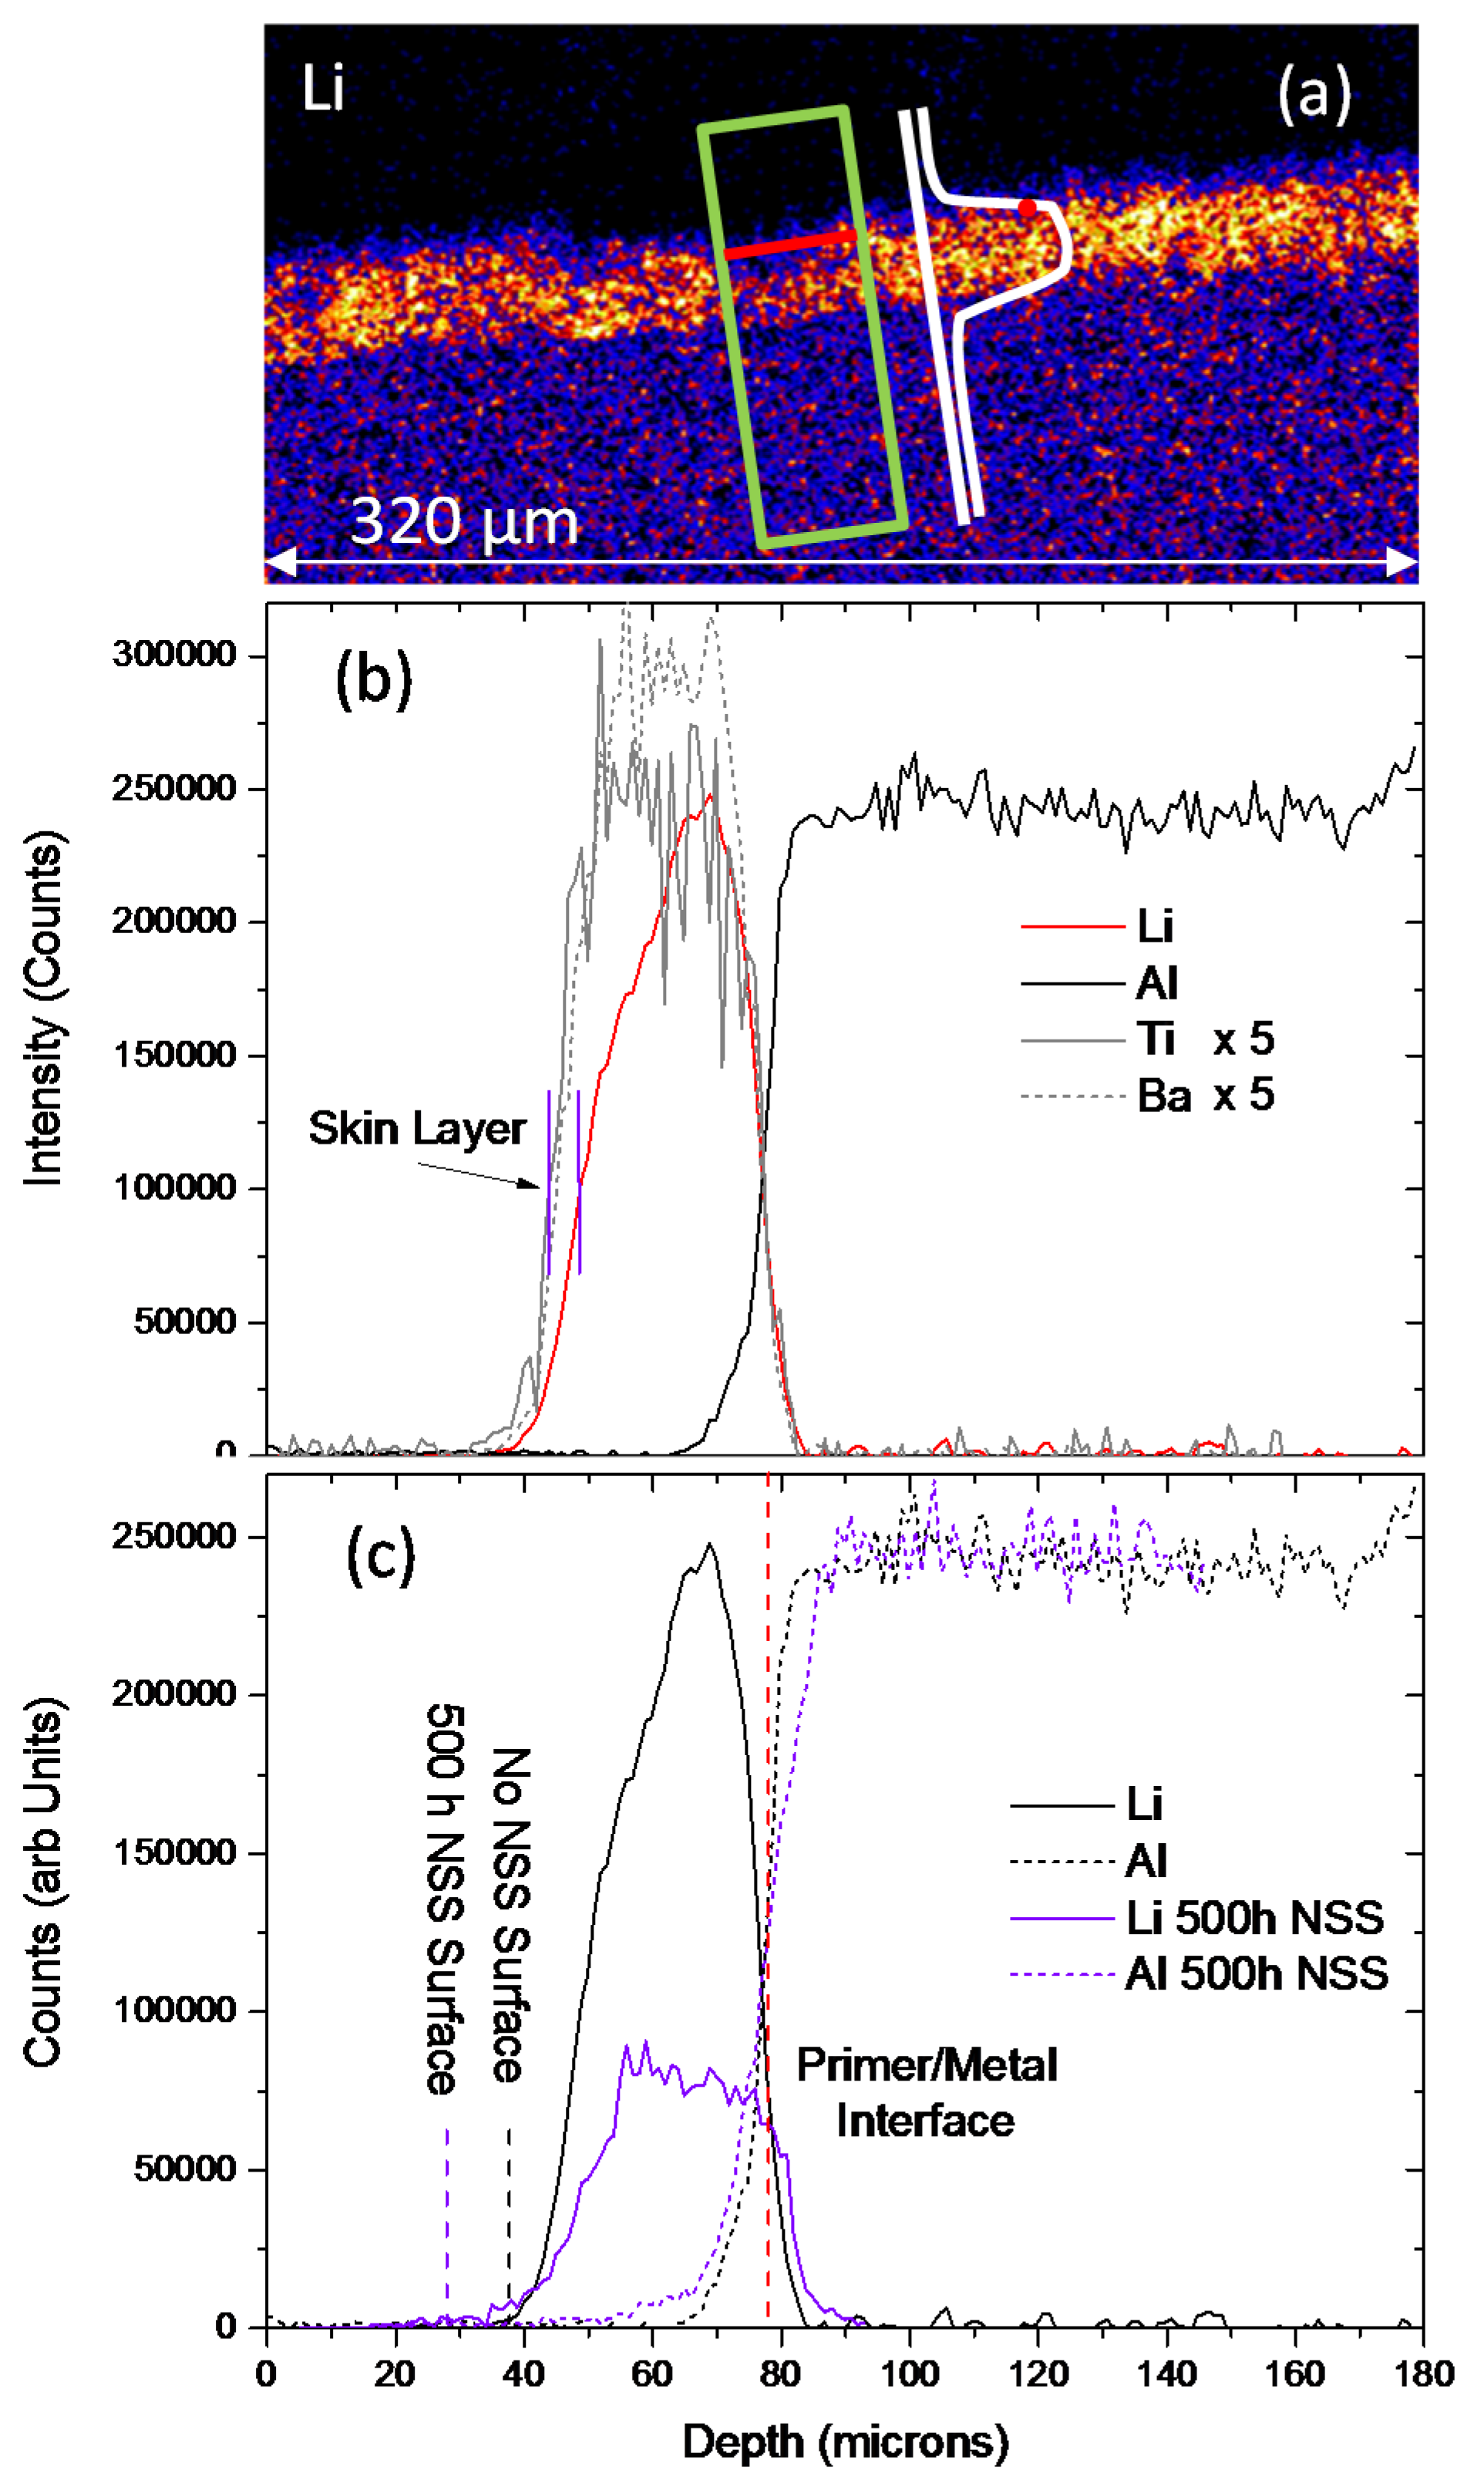
3.2.2. PIXE/PIGE
3.3. Measurement of Li-Depletion
4. Discussion
5. Conclusions
Author Contributions
Conflicts of Interest
Appendix


References
- Catubig, R.; Hughes, A.E.; Cole, I.S.; Hinton, B.R.W.; Forsyth, M. The use of cerium and praseodymium mercaptoacetate as thiol-containing inhibitors for AA2024-T3. Corros. Sci. 2014, 81, 45–53. [Google Scholar] [CrossRef]
- Markley, T.A.; Mardel, J.I.; Hughes, A.E.; Hinton, B.R.W.; Glenn, A.M.; Forsyth, M. Chromate replacement in coatings for corrosion protection of aerospace aluminium alloys. Mater. Corros. Werkstoffe Und Korros. 2011, 62, 836–840. [Google Scholar] [CrossRef]
- Hughes, A.E.; Ho, D.; Forsyth, M.; Hinton, B.R.W. Towards replacement of chromate inhibitors by rare earth systems. Corros. Rev. 2007, 25, 591–605. [Google Scholar] [CrossRef]
- Mardel, J.; Garcia, S.J.; Corrigan, P.A.; Markley, T.; Hughes, A.E.; Muster, T.H.; Lau, D.; Harvey, T.G.; Glenn, A.M.; White, P.A.; et al. The characterisation and performance of Ce(dbp)3-inhibited epoxy coatings. Prog. Org. Coat. 2011, 70, 91–101. [Google Scholar] [CrossRef]
- Hughes, A.E.; Cole, I.S.; Muster, T.H.; Varley, R.J. Combining Green and Self Healing for a new Generation of Coatings for Metal Protection. Nat. Asia Mater. 2010, 2, 143–151. [Google Scholar] [CrossRef]
- Shi, H.; Han, E.-H.; Lamaka, S.V.; Zheludkevich, M.L.; Liu, F.; Ferreira, M.G.S. Cerium cinnamate as an environmentally benign inhibitor pigment for epoxy coatings on AA 2024-T3. Prog. Org. Coat. 2014, 77, 765–773. [Google Scholar] [CrossRef]
- Yasakau, K.A.; Tedim, J.; Zheludkevich, M.L.; Drumm, R.; Shem, M.; Wittmar, M.; Veith, M.; Ferreira, M.G.S. Cerium molybdate nanowires for active corrosion protection of aluminium alloys. Corros. Sci. 2012, 58, 41–51. [Google Scholar] [CrossRef]
- Schem, M.; Schmidt, T.; Gerwann, J.; Wittmar, M.; Veith, M.; Thompson, G.E.; Molchan, I.S.; Hashimoto, T.; Skeldon, P.; Phani, A.R.; et al. CeO2-filled sol-gel coatings for corrosion protection of AA2024-T3 aluminium alloy. Corros. Sci. 2009, 51, 2304–2315. [Google Scholar] [CrossRef]
- Yasakau, K.A.; Zheludkevich, M.L.; Ferreira, M.G.S. Lanthanide salts as corrosion inhibitors for AA5083. Mechanism and efficiency of corrosion inhibition. J. Electrochem. Soc. 2008, 155, C169–C177. [Google Scholar] [CrossRef]
- Montemor, M.F.; Trabelsi, W.; Lamaka, S.V.; Yasakau, K.A.; Zheludkevich, M.L.; Bastos, A.C.; Ferreira, M.G.S. The synergistic combination of bis-silane and CeO2.ZrO2 nanoparticles on the electrochemical behaviour of galvanised steel in NaCl solutions. Electrochim. Acta 2008, 53, 5913–5922. [Google Scholar] [CrossRef]
- Zheludkevich, M.L.; Serra, R.; Montemor, M.F.; Yasakau, K.A.; Salvado, I.M.M.; Ferreira, M.G.S. Nanostructured sol-gel coatings doped with cerium nitrate as pre-treatments for AA2024-T3—Corrosion protection performance. Electrochim. Acta 2005, 51, 208–217. [Google Scholar] [CrossRef]
- Paussa, L.; Andreatta, F.; de Felicis, D.; Bemporad, E.; Fedrizzi, L. Investigation of AA2024-T3 surfaces modified by cerium compounds: A localized approach. Corros. Sci. 2014, 78, 215–222. [Google Scholar] [CrossRef]
- Andreatta, F.; Druart, M.E.; Lanzutti, A.; Lekka, M.; Cossement, D.; Olivier, M.G.; Fedrizzi, L. Localized corrosion inhibition by cerium species on clad AA2024 aluminium alloy investigated by means of electrochemical micro-cell. Corros. Sci. 2012, 65, 376–386. [Google Scholar] [CrossRef]
- Paussa, L.; Rosero-Navarro, N.C.; Andreatta, F.; Castro, Y.; Duran, A.; Aparicio, M.; Fedrizzi, L. Inhibition effect of cerium in hybrid sol-gel films on aluminium alloy AA2024. Surf. Interface Anal. 2010, 42, 299–305. [Google Scholar] [CrossRef]
- Ralston, K.D.; Young, T.L.; Buchheit, R.G. Electrochemical Evaluation of Constituent Intermetallics in Aluminum Alloy 2024-T3 Exposed to Aqueous Vanadate Inhibitors. J. Electrochem. Soc. 2009, 156, C135–C146. [Google Scholar] [CrossRef]
- Ralston, K.D.; Chrisanti, S.; Young, T.L.; Buchheit, R.G. Corrosion inhibition of aluminum alloy 2024-T3 by aqueous vanadium species. J. Electrochem. Soc. 2008, 155, C350–C359. [Google Scholar] [CrossRef]
- Harvey, T.G.; Hardin, S.G.; Hughes, A.E.; Muster, T.H.; White, P.A.; Markley, T.A.; Corrigan, P.A.; Mardel, J.; Garcia, S.J.; Mol, J.M.C.; et al. The effect of inhibitor structure on the corrosion of AA2024 and AA7075. Corros. Sci. 2011, 53, 2184–2190. [Google Scholar] [CrossRef]
- Zheludkevich, M.L.; Tedim, J.; Freire, C.S.R.; Fernandes, S.C.M.; Kallip, S.; Lisenkov, A.; Gandini, A.; Ferreira, M.G.S. Self-healing protective coatings with “green” chitosan based pre-layer reservoir of corrosion inhibitor. J. Mater. Chem. 2011, 21, 4805–4812. [Google Scholar] [CrossRef]
- Raps, D.; Hack, T.; Wehr, J.; Zheludkevich, M.L.; Bastos, A.C.; Ferreira, M.G.S.; Nuyken, O. Electrochemical study of inhibitor-containing organic-inorganic hybrid coatings on AA2024. Corros. Sci. 2009, 51, 1012–1021. [Google Scholar] [CrossRef]
- Montemor, M.F. Fostering green inhibitors for corrosion prevention. In Series in Materials Science; Springer: Berlin, Germany, 2016; pp. 107–137. [Google Scholar]
- El-Faham, A.; Dahlous, K.A.; al Othman, Z.A.; Al-Lohedan, H.A.; El-Mahdy, G.A. sym-Trisubstituted 1,3,5-Triazine Derivatives as Promising Organic Corrosion Inhibitors for Steel in Acidic Solution. Molecules 2016, 21, 436. [Google Scholar] [CrossRef] [PubMed]
- Winkler, D.A.; Breedon, M.; Hughes, A.E.; Burden, F.R.; Barnard, A.S.; Harvey, T.G.; Cole, I. Towards chromate-free corrosion inhibitors: Structure-property models for organic alternatives. Green Chem. 2014, 16, 3349–3357. [Google Scholar] [CrossRef]
- Gonzalez-Olvera, R.; Roman-Rodriguez, V.; Negron-Silva, G.E.; Espinoza-Vazquez, A.; Rodriguez-Gomez, F.J.; Santillan, R. Multicomponent Synthesis and Evaluation of New 1,2,3-Triazole Derivatives of Dihydropyrimidinones as Acidic Corrosion Inhibitors for Steel. Molecules 2016, 21, 250. [Google Scholar] [CrossRef] [PubMed]
- Allahar, K.N.; Wang, D.; Battocchi, D.; Bierwagen, G.P.; Balbyshev, S. Real-Time Monitoring of a United States Air Force Topcoat/Mg-Rich Primer System in ASTM B117 Exposure by Embedded Electrodes. Corros. Sci. 2010, 66, 075003. [Google Scholar] [CrossRef]
- Bierwagen, G.; Brown, R.; Battocchi, D.; Hayes, S. Active metal-based corrosion protective coating systems for aircraft requiring no-chromate pretreatment. Prog. Org. Coat. 2010, 68, 48–61. [Google Scholar] [CrossRef]
- Wang, D.H.; Battocchi, D.; Allahar, K.N.; Balbyshev, S.; Bierwagen, G.P. In situ monitoring of a Mg-rich primer beneath a topcoat exposed to Prohesion conditions. Corros. Sci. 2010, 52, 441–448. [Google Scholar] [CrossRef]
- Xu, H.; Battocchi, D.; Tallman, D.E.; Bierwagen, G.P. Use of Magnesium Alloys as Pigments in Magnesium-Rich Primers for Protecting Aluminum Alloys. Corros. Sci. 2009, 65, 318–325. [Google Scholar] [CrossRef]
- Figueira, R.; Fontinha, I.; Silva, C.; Pereira, E. Hybrid Sol-Gel Coatings: Smart and Green Materials for Corrosion Mitigation. Coatings 2016, 6, 12. [Google Scholar] [CrossRef]
- Kozmel, T.; Vural, M.; Tin, S. EBSD analysis of high strain rate application Al-Cu based alloys. Mater. Sci. Eng. A 2015, 630, 99–106. [Google Scholar] [CrossRef]
- Zheludkevich, M.L.; Poznyak, S.K.; Rodrigues, L.M.; Raps, D.; Hack, T.; Dick, L.F.; Nunes, T.; Ferreira, M.G.S. Active protection coatings with layered double hydroxide nanocontainers of corrosion inhibitor. Corros. Sci. 2010, 52, 602–611. [Google Scholar] [CrossRef]
- Snihirova, D.; Lamaka, S.V.; Taryba, M.; Salak, A.M.; Kallip, S.; Zheludkevich, M.L.; Ferreira, M.G.S.; Montemor, M.F. Hydroxyapatite microparticles as feedback-active reservoirs of corrosion inhibitors. ACS Appl. Mater. Interfaces 2010, 2, 3011–3022. [Google Scholar] [CrossRef] [PubMed]
- Poznyak, S.K.; Tedim, J.; Rodrigues, L.M.; Salak, A.N.; Zheludkevich, M.L.; Dick, L.F.P.; Ferreira, M.G.S. Novel Inorganic Host Layered Double Hydroxides Intercalated with Guest Organic Inhibitors for Anticorrosion Applications. ACS Appl. Mater. Interfaces 2009, 1, 2353–2362. [Google Scholar] [CrossRef] [PubMed]
- Mahajanarn, S.P.V.; Buchheit, R.G. Characterization of inhibitor release from Zn-Al-[V10O28]6− hydrotalcite pigments and corrosion protection from hydrotalcite-pigmented epoxy coatings. Corros. Sci. 2008, 64, 230–240. [Google Scholar] [CrossRef]
- Chrisanti, S.; Buchheit, R.G. Use of Ce-modified bentonite clay as a pigment for corroion inhibition and sensing. In Papers Presented at the Philadelphia, Pennsylvania Meeting; American Chemical Society: Washington, DC, USA, 2004; Volume 45, pp. 148–149. [Google Scholar]
- Mahajanam, S.P.V.; Buchheit, R.G. Characterization of Zn-Al-V10 corrosion-inhibiting hydrotalcite pigments in epoxy resins. In Corrosion and Protection of Light Metal Alloys; Buchheit, R.G., Kelly, R.G., Missert, N.A., Shaw, B.A., Eds.; Electrochemical Society Inc.: Pennington, NJ, USA, 2004; pp. 270–282. [Google Scholar]
- Buchheit, R.G.; Guan, H. Formation and characteristics of Al-Zn hydrotalcite coatings on galvanized steel. JCT Res. 2004, 1, 277–290. [Google Scholar] [CrossRef]
- Kendig, M.; Hon, M. A hydrotalcite-like pigment containing an organic anion corrosion inhibitor. Electrochem. Solid State Lett. 2005, 8, B10–B11. [Google Scholar] [CrossRef]
- McMurray, H.N.; Williams, G. Inhibition of filiform corrosion on organic-coated aluminum alloy by hydrotalcite-like anion-exchange pigments. Corros. Sci. 2004, 60, 219–228. [Google Scholar] [CrossRef]
- Williams, G.; McMurray, H.N. Inhibition of filiform corrosion on polymer coated AA2024-T3 by hydrotalcite-like pigments incorporating organic anions. Electrochem. Solid State Lett. 2004, 7, B13–B15. [Google Scholar] [CrossRef]
- Williams, G.; McMurray, H.N. Anion-exchange inhibition of filiform corrosion on organic coated AA2024-T3 aluminum alloy by hydrotalcite-like pigments. Electrochem. Solid State Lett. 2003, 6, B9–B11. [Google Scholar] [CrossRef]
- Williams, G.; McMurray, H.N.; Worsley, D.A. Cerium(III) inhibition of corrosion-driven organic coating delamination studied using a scanning kelvin probe technique. J. Electrochem. Soc. 2002, 149, B154–B162. [Google Scholar] [CrossRef]
- Visser, P.; Terryn, H.; Mol, J.M.C. Aerospace Coatings. Act. Prot. Coat. 2016, 233, 315–372. [Google Scholar]
- Visser, P.; Liu, Y.; Zhou, X.; Hashimoto, T.; Thompson, G.E.; Lyon, S.B.; van der Ven, L.G.J.; Mol, A.J.M.C.; Terryn, H.A. The corrosion protection of AA2024-T3 aluminium alloy by leaching of lithium-containing salts from organic coatings. Faraday Discuss. 2015, 180, 511–526. [Google Scholar] [CrossRef] [PubMed]
- Visser, P.; Lutz, A.; Mol, J.M.C.; Terryn, H. Study of the formation of a protective layer in a defect from lithium-leaching organic coatings. Prog. Org. Coat. 2016, 99, 80–90. [Google Scholar] [CrossRef]
- Visser, P.; Liu, Y.; Terryn, H.; Mol, J.M.C. Lithium salts as leachable corrosion inhibitors and potential replacement for hexavalent chromium in organic coatings for the protection of aluminum alloys. J. Coat. Technol. Res. 2016, 13, 557–566. [Google Scholar] [CrossRef]
- Liu, Y.; Visser, P.; Zhou, X.; Lyon, S.B.; Hashimoto, T.; Curioni, M.; Gholinia, A.; Thompson, G.E.; Smyth, G.; Gibbon, S.R.; et al. Protective film formation on AA2024-T3 Aluminum Alloy by leaching of lithium carbonate from an organic coating. J. Electrochem. Soc. 2016, 163, C45–C53. [Google Scholar] [CrossRef]
- Laird, J.S.; Hughes, A.E.; Ryan, C.G.; Visser, P.; Terryn, H.; Mol, J.M.C. Particle induced gamma and X-ray emission spectroscopies of lithium based alloy coatings. Nucl. Instrum. Methods Phys. Res. Sect. B Beam Interact. Mater. Atoms 2017, 404, 167–172. [Google Scholar] [CrossRef]
- Boag, A.; Taylor, R.J.; Muster, T.H.; Goodman, N.; McCulloch, D.; Ryan, C.; Rout, B.; Jamieson, D.; Hughes, A.E. Stable pit formation on AA2024-T3 in a NaCl environment. Corros. Sci. 2010, 52, 90–103. [Google Scholar] [CrossRef]
- Boag, A.P.; McCulloch, D.G.; Jamieson, D.N.; Hearne, S.M.; Hughes, A.E.; Ryan, C.G.; Toh, S.K. Combined nuclear microprobe and TEM study of corrosion pit nucleation by intermetallics in aerospace aluminium alloys. Nucl. Instrum. Methods Phys. Res. Sect. B Beam Interact. Mater. Atoms 2005, 231, 457–462. [Google Scholar] [CrossRef]
- Furman, S.A.; Scholes, F.H.; Hughes, A.E.; Jamieson, D.N.; Macrae, C.M.; Glenn, A.M. Corrosion in artificial defects. II. Chromate reactions. Corros. Sci. 2006, 48, 1827–1847. [Google Scholar] [CrossRef]
- Polmear, I.J. Light Allopys: Metallurgy of the Light Metals, 3rd ed.; Arnold: London, UK, 1995. [Google Scholar]
- ASTM B117–16 Standard Practice for Operating Salt Spray (Fog) Apparatus; ASTM International: West Conshohocken, PA, USA, 2016.
- Ryan, C.G.; Jamieson, D.N.; Griffin, W.L.; Cripps, G.; Szymanski, R. The new CSIRO-GEMOC nuclear microprobe: First results, performance and recent applications. Nucl. Instrum. Methods Phys. Res. Sect. B Beam Interact. Mater. Atoms 2001, 181, 12–19. [Google Scholar] [CrossRef]
- Laird, J.S.; Szymanski, R.; Ryan, C.G.; Gonzalez-Alvarez, I. A Labview based FPGA data acquisition with integrated stage and beam transport control. Nucl. Instrum. Methods Phys. Res. Sect. B Beam Interact. Mater. Atoms 2013, 306, 71–75. [Google Scholar] [CrossRef]
- Ryan, C.G.; van Achterbergh, E.; Yeats, C.J.; Tin Win, T.; Cripps, G. Quantitative PIXE trace element imaging of minerals using the new CSIRO-GEMOC Nuclear Microprobe. Nuclear Instrum. Methods Phys. Res. Section B Beam Interact. Mater. Atoms 2002, 189, 400–407. [Google Scholar] [CrossRef]
- Boni, C.; Cereda, E.; Marcazzan, G.M.B.; de Tomasi, V. Prompt gamma emission excitation functions for PIGE analysis. Nucl. Inst. Methods Phys. Res. B 1988, 35, 80–86. [Google Scholar] [CrossRef]
- Abrahami, S.T.; Hauffman, T.; de Kok, J.M.M.; Mol, J.M.C.; Terryn, H. XPS Analysis of the Surface Chemistry and Interfacial Bonding of Barrier-Type Cr(VI)-Free Anodic Oxides. J. Phys. Chem. C 2015, 119, 19967–19975. [Google Scholar] [CrossRef]
- Hatch, J.E. Aluminium: Porperties and Physical Metallurgy; ASM International: Materials Park, OH, USA, 1984. [Google Scholar]
- Ovcharenko, R.E.; Tupitsyn, I.I.; Savinov, E.P.; Voloshina, E.N.; Dedkov, Y.S.; Shulakov, A.S. Calculation of the X-ray emission K and L 2,3 bands of metallic magnesium and aluminum with allowance for multielectron effects. J. Exp. Theor. Phys. 2014, 118, 11–17. [Google Scholar] [CrossRef]
- Hughes, A.E.; Glenn, A.M.; Wilson, N.; Moffatt, A.; Morton, A.J.; Buchheit, R.G. A consistent description of intermetallic particle composition: An analysis of ten batches of AA2024-T3. Surf. Interface Anal. 2013, 45, 1558–1563. [Google Scholar] [CrossRef]
- Hughes, A.E.; Birbilis, N.; Mol, J.M.C.; Garcia, S.J.; Zhou, X.; Thompson, G.E. High Strength Al-Alloys: Microstructure, Corrosion and Principles of Protection. In Recent Trends in Processing and Degradation of Aluminium Alloys; Ahmad, Z., Ed.; Intech Publishing: Rijeka, Croatia, 2011. [Google Scholar]
- Hughes, A.E.; MacRae, C.; Wilson, N.; Torpy, A.; Muster, T.H.; Glenn, A.M. Sheet AA2024-T3: A new investigation of microstructure and composition. Surf. Interface Anal. 2010, 42, 334–338. [Google Scholar] [CrossRef]
- Buchheit, R.G.; Grant, R.P.; Hlava, P.F.; McKenzie, B.; Zender, G.L. Local dissolution phenomena associated with S phase (Al2CuMg) particles in aluminum alloy 2024-T3. J. Electrochem. Soc. 1997, 144, 2621–2628. [Google Scholar] [CrossRef]
- Lacroix, L.; Ressier, L.; Blanc, C.; Mankowski, G. Combination of AFM, SKPFM, and SIMS to study the corrosion behavior of S-phase particles in AA2024-T351. J. Electrochem. Soc. 2008, 155, C131–C137. [Google Scholar] [CrossRef]
- Lacroix, L.; Ressier, L.; Blanc, C.; Mankowski, G. Statistical study of the corrosion behavior of Al2CuMg intermetallics in AA2024-T351 by SKPFM. J. Electrochem. Soc. 2008, 155, C8–C15. [Google Scholar] [CrossRef]
- Ilevbare, G.O.; Schneider, O.; Kelly, R.G.; Scully, J.R. In situ confocal laser scanning microscopy of AA 2024-T3 corrosion metrology—I. Localized corrosion of particles. J. Electrochem. Soc. 2004, 151, B453–B464. [Google Scholar] [CrossRef]
- Schneider, O.; Ilevbare, G.O.; Scully, J.R.; Kelly, R.G. In situ confocal laser scanning microscopy of AA 2024-T3 corrosion metrology—II. Trench formation around particles. J. Electrochem. Soc. 2004, 151, B465–B472. [Google Scholar] [CrossRef]
- Hughes, A.E.; Parvizi, R.; Forsyth, M. Microstructure and corrosion of AA2024. Corros. Rev. 2015, 33, 1–30. [Google Scholar] [CrossRef]
- Wu, X.; Hebert, K. Development of Surface Impurity Segregation during Dissolution of Aluminum. J. Electrochem. Soc. 1996, 143, 83–91. [Google Scholar] [CrossRef]
- Cavanaugh, M.K.; Birbilis, N.; Buchheit, R.G. Modeling pit initiation rate as a function of environment for Aluminum alloy 7075-T651. Electrochim. Acta 2012, 59, 336–345. [Google Scholar] [CrossRef]
- Lide, D.R. CRC Handbook of Chemistry and Physics; CRC Press: Boston, MA, USA, 1990. [Google Scholar]
- Hughes, A.E.; Trinchi, A.; Chen, F.F.; Yang, Y.S.; Cole, I.S.; Sellaiyan, S.; Carr, J.; Lee, P.D.; Thompson, G.E.; Xiao, T.Q. Revelation of Intertwining Organic and Inorganic Fractal Structures in Polymer Coatings. Adv. Mater. 2014, 26, 4504–4508. [Google Scholar] [CrossRef] [PubMed]
- Sellaiyan, S.; Hughes, A.E.; Smith, S.V.; Uedono, A.; Sullivan, J.; Buckman, S. Leaching properties of chromate-containing epoxy films using radiotracers, PALS and SEM. Prog. Org Coat. 2014, 77, 257–267. [Google Scholar] [CrossRef]
- Hughes, A.E.; Trinchi, A.; Chen, F.F.; Yang, Y.S.; Cole, I.S.; Sellaiyan, S.; Carr, J.; Lee, P.D.; Thompson, G.E.; Xiao, T.Q. The application of multiscale quasi 4D CT to the study of SrCrO4 distributions and the development of porous networks in epoxy-based primer coatings. Prog. Org Coat. 2014, 77, 1946–1956. [Google Scholar] [CrossRef]


| Element | Li2CO3 (mg/kg) | TiO2 (%m/m) | MgO (mg/kg) | BaSO4 (%m/m) |
|---|---|---|---|---|
| Al | 5 | 1.4 | 70–77 | 0.1 |
| Ca | 91–98 | – | 1500–1900 | 0.1 |
| Na | 660–810 | – | 180–210 | 0.4 |
| Ba | 2 | – | 2–5 | res |
| Si | – | – | – | 0.4 |
| Sr | – | – | – | 0.9 |
| Ti | – | – | – | 0.1 |
| Zr | – | 0.4 | – | – |
| Fe | 2 | – | 73–78 | – |
| Mn | – | – | 13–15 | – |
| Ni | – | – | 5–6 | – |
| K | 400–700 | – | 200–300 | – |
| Mg | 39–40 | – | – | 1 |
| Additive | 10% | 50% | 90% | 99% |
|---|---|---|---|---|
| MgO | 3.91 | 8.48 | 14.58 | 20.23 |
| Li2CO3 | 4.78 | 8.87 | 13.44 | 18.26 |
| TiO2 | 3.22 | 5.64 | 8.84 | 13.94 |
| BaSO4 | 3.82 | 6.48 | 10.19 | 49.68 |
| Particle Type | No NSS | 500 h NSS |
|---|---|---|
| BaSO4 (Ba:S:O) | 1.00:1.04 ± 0.05:3.89 ± 0.71 | 1.00:0.98 ± 0.01:3.51 ± 0.26 |
| Mg-(hydr)oxide (Mg:O) | 1.00:1.64 ± 0.11 | 1.00:0.93 ± 0.15 |
| Li2CO3 (O:C) | 1.72 ± 0.21 | 2.02 ± 0.32 |
| Sample | Total Thickness (μm) | Skin Layer (μm) | Homogenously Depleted Zone (μm) | Deepest Depletion (μm) |
|---|---|---|---|---|
| SEM No NSS | 33.5 ± 5 | 3–4 | – | – |
| PIXE/PIGE No NSS | 33.7 ± 2.5 | Up to 5 | – | – |
| PIXE/PIGE 500 h NSS | 45.4 ± 6.5 | – | 11 ± 8 | 25 |
| SEM 500 h NSS | 32.6 ± 1.0 | – | 9–12 | Film thickness |
© 2017 by the authors. Licensee MDPI, Basel, Switzerland. This article is an open access article distributed under the terms and conditions of the Creative Commons Attribution (CC BY) license (http://creativecommons.org/licenses/by/4.0/).
Share and Cite
Hughes, A.; Laird, J.; Ryan, C.; Visser, P.; Terryn, H.; Mol, A. Particle Characterisation and Depletion of Li2CO3 Inhibitor in a Polyurethane Coating. Coatings 2017, 7, 106. https://doi.org/10.3390/coatings7070106
Hughes A, Laird J, Ryan C, Visser P, Terryn H, Mol A. Particle Characterisation and Depletion of Li2CO3 Inhibitor in a Polyurethane Coating. Coatings. 2017; 7(7):106. https://doi.org/10.3390/coatings7070106
Chicago/Turabian StyleHughes, Anthony, James Laird, Chris Ryan, Peter Visser, Herman Terryn, and Arjan Mol. 2017. "Particle Characterisation and Depletion of Li2CO3 Inhibitor in a Polyurethane Coating" Coatings 7, no. 7: 106. https://doi.org/10.3390/coatings7070106
APA StyleHughes, A., Laird, J., Ryan, C., Visser, P., Terryn, H., & Mol, A. (2017). Particle Characterisation and Depletion of Li2CO3 Inhibitor in a Polyurethane Coating. Coatings, 7(7), 106. https://doi.org/10.3390/coatings7070106