
Internally Oxidized Ru–Zr Multilayer Coatings

Abstract
:1. Introduction
2. Materials and Methods
3. Results
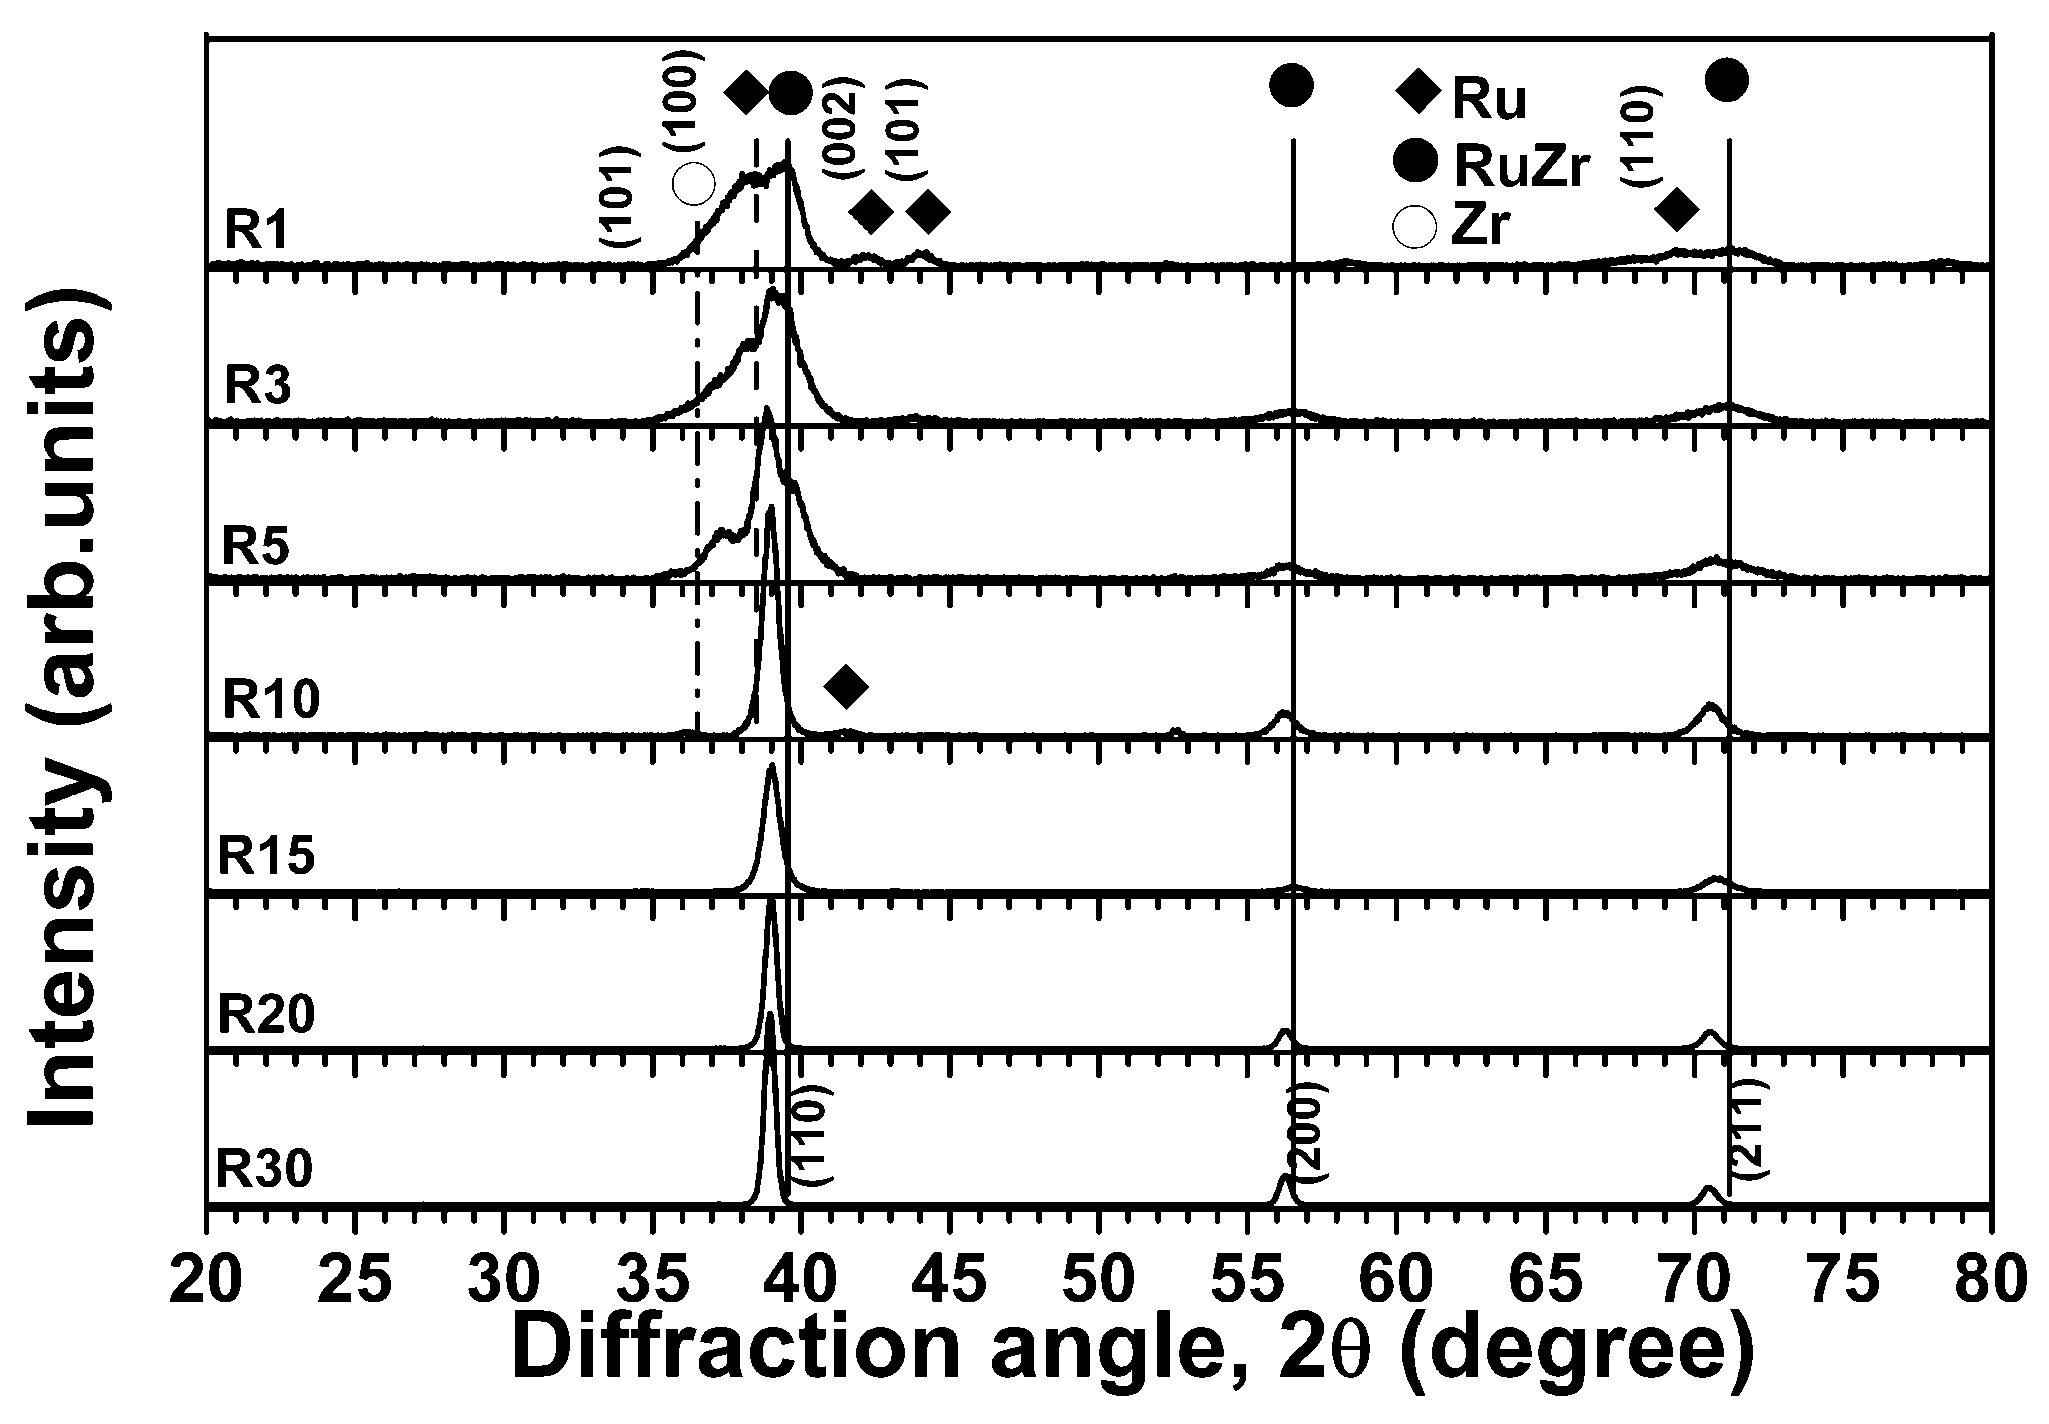
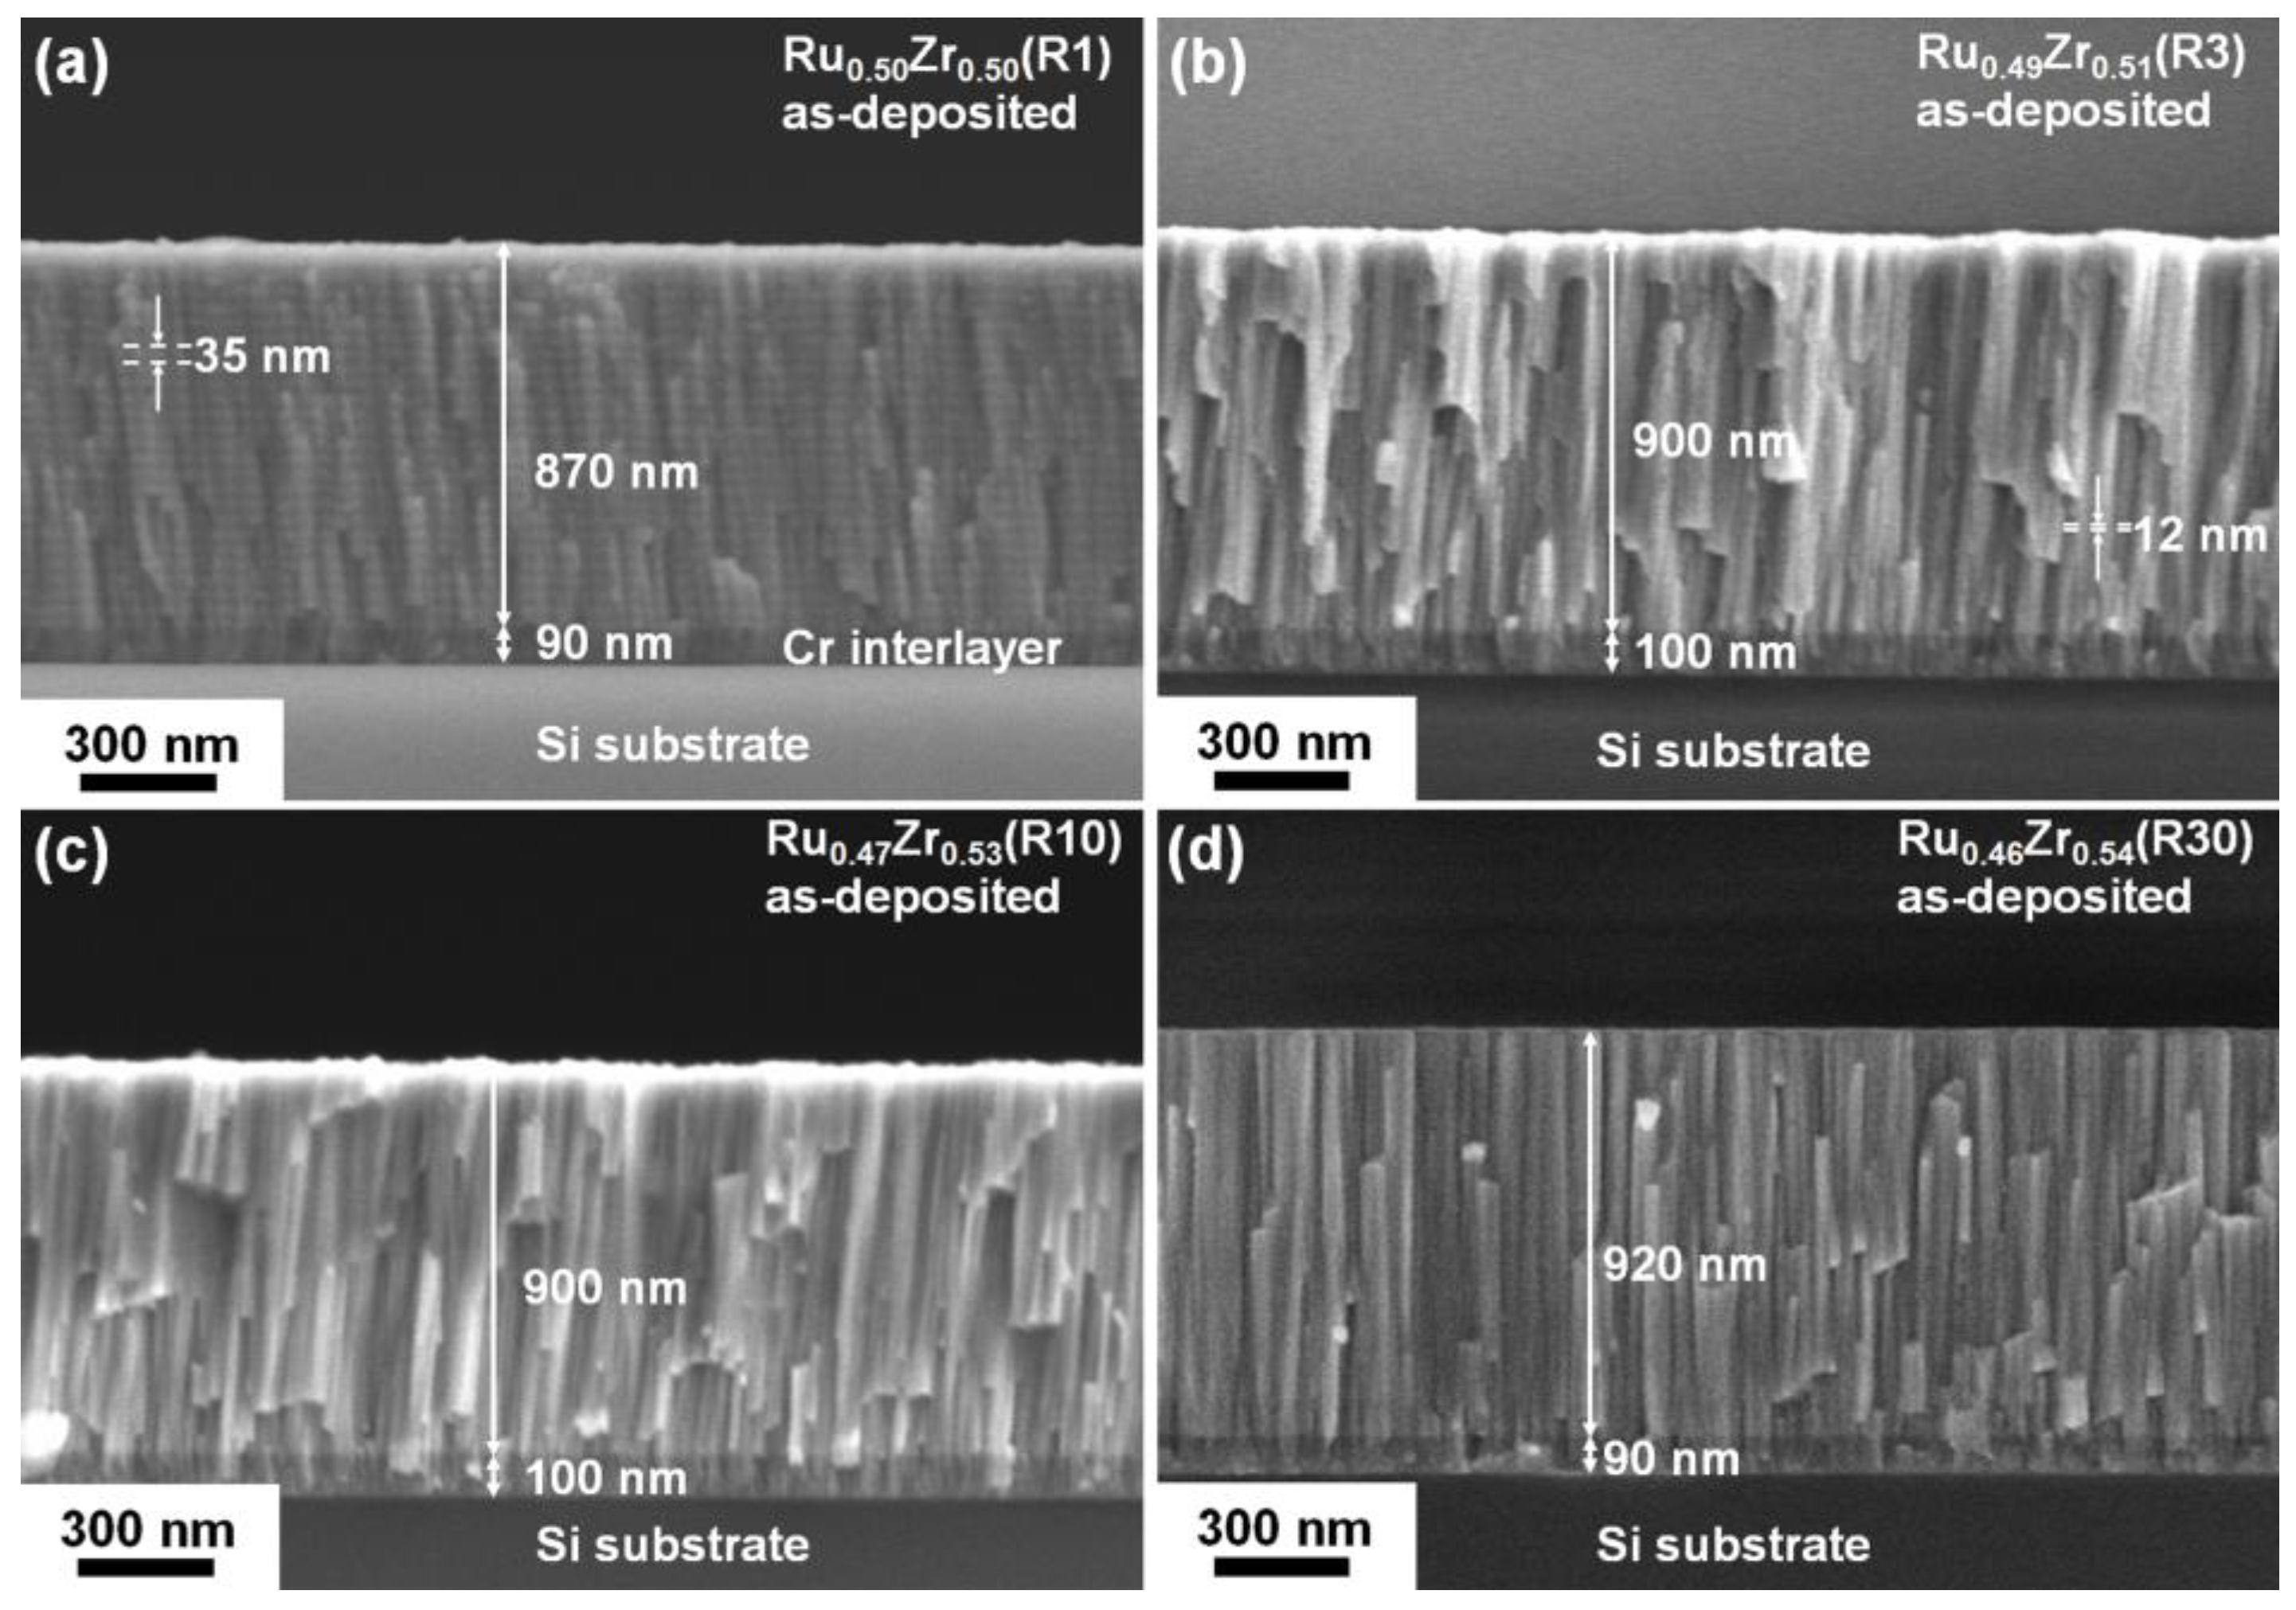
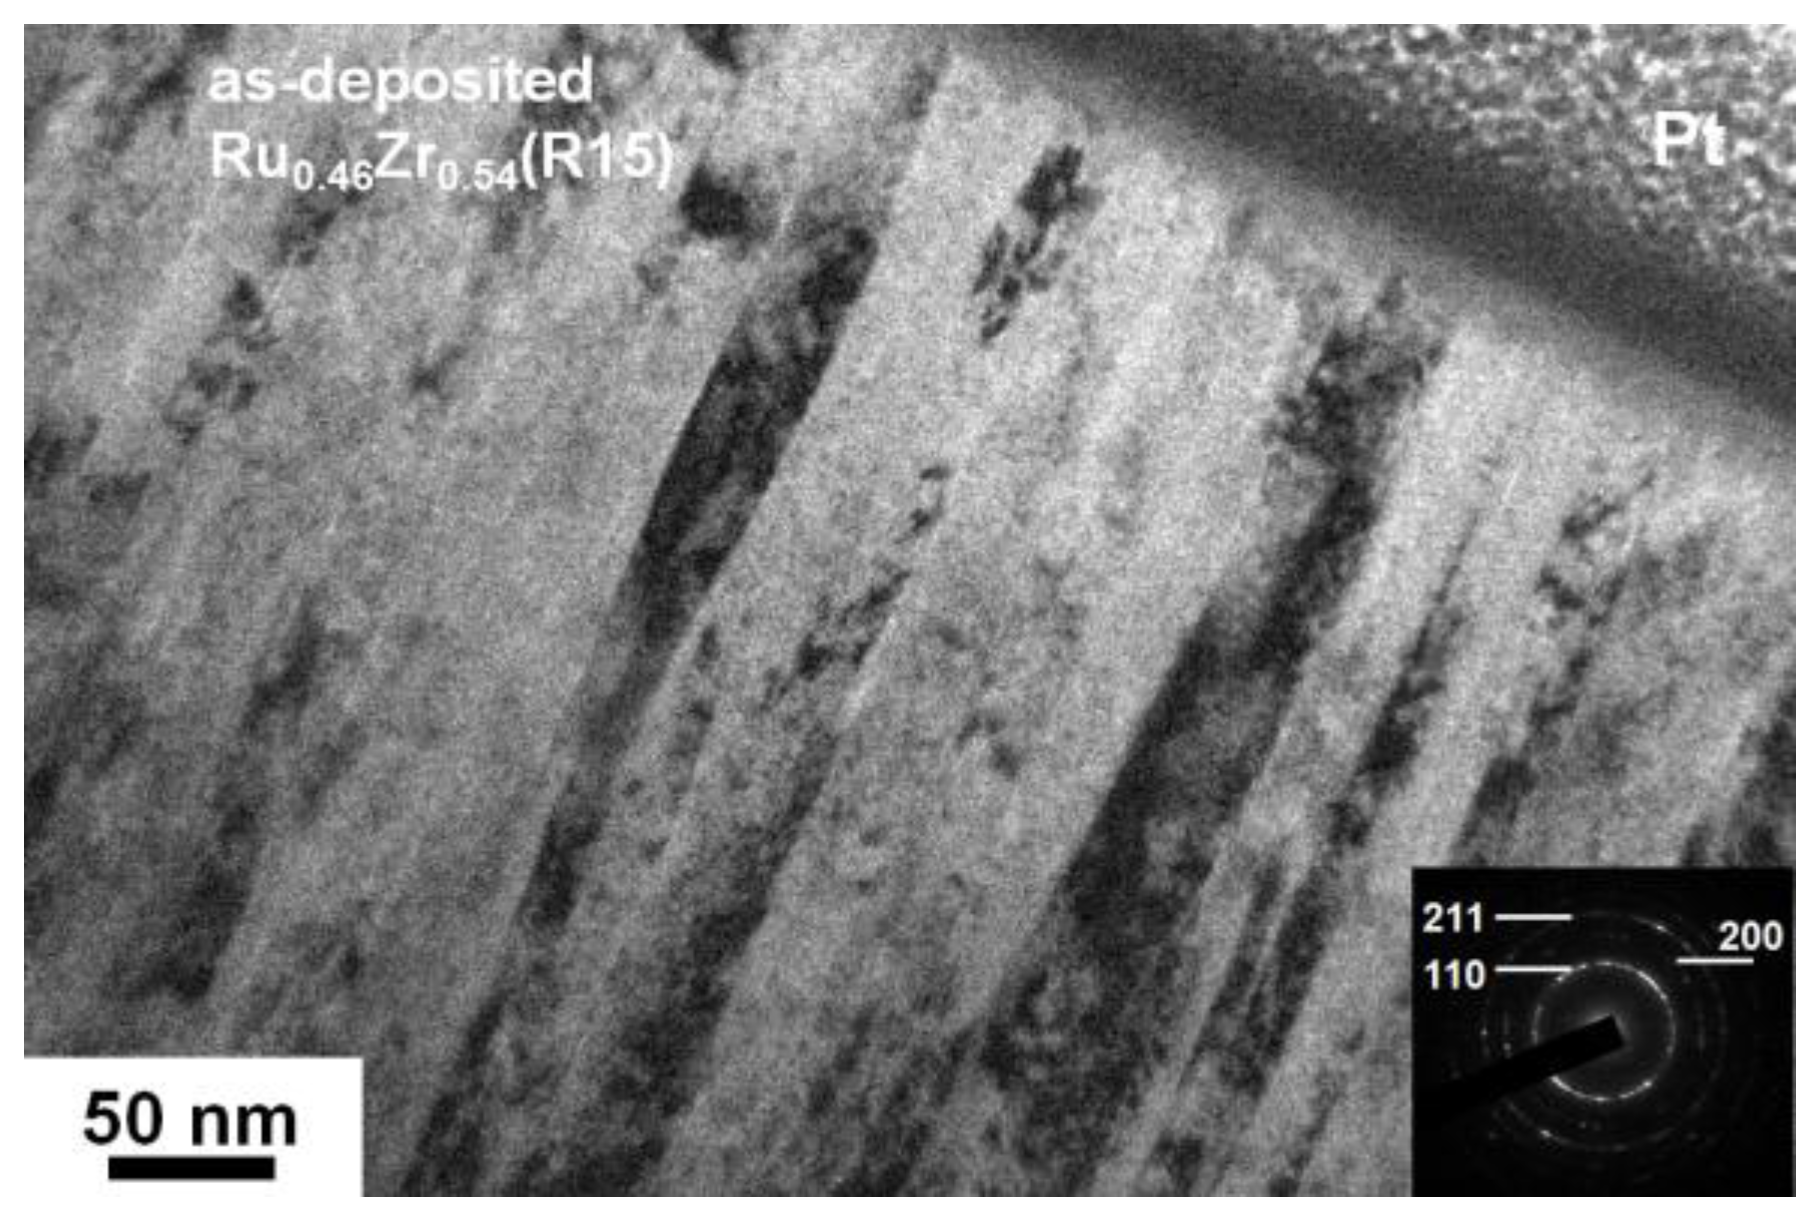
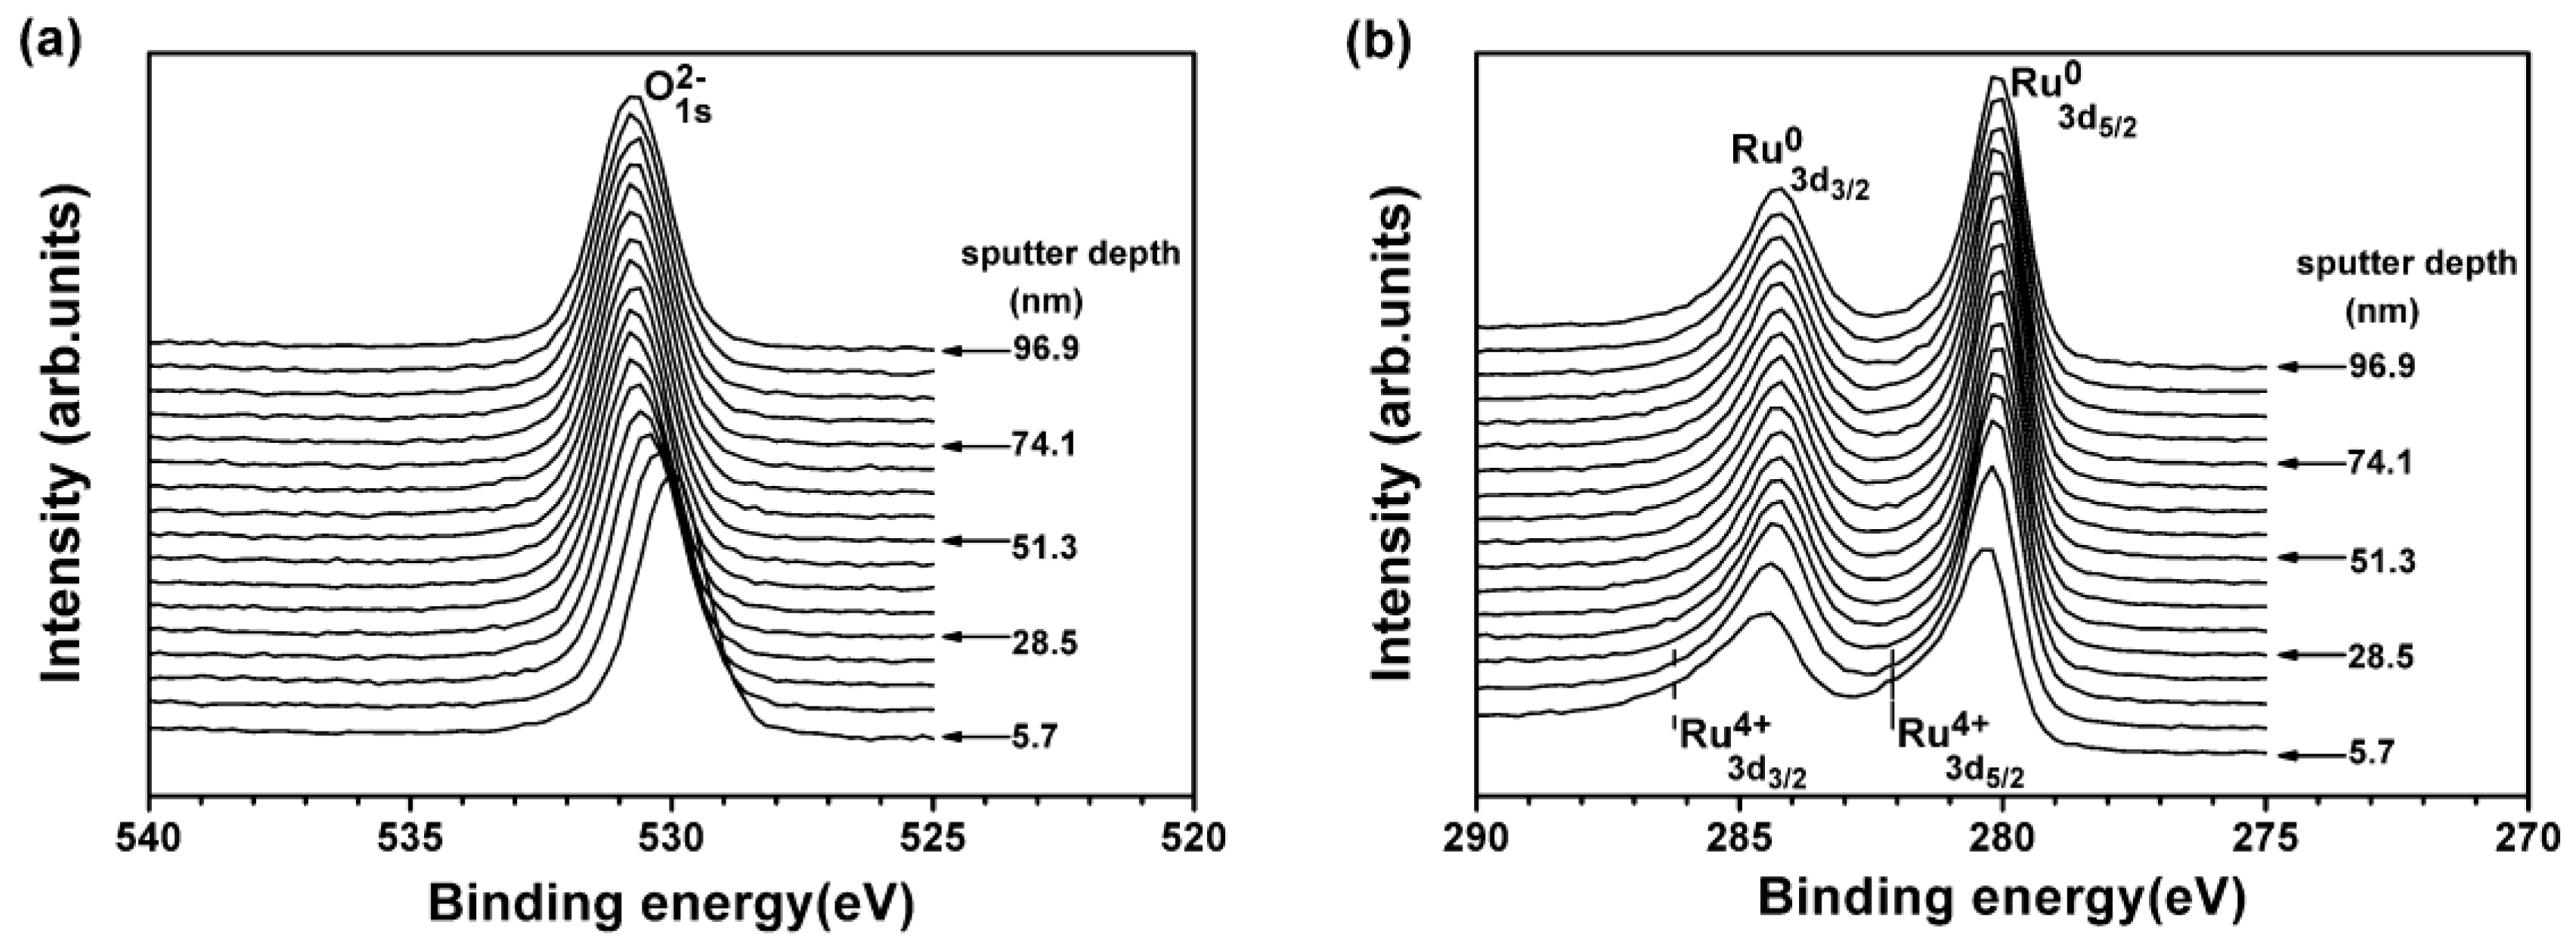
3.1. As-Deposited Equiatomic Ru–Zr Coatings
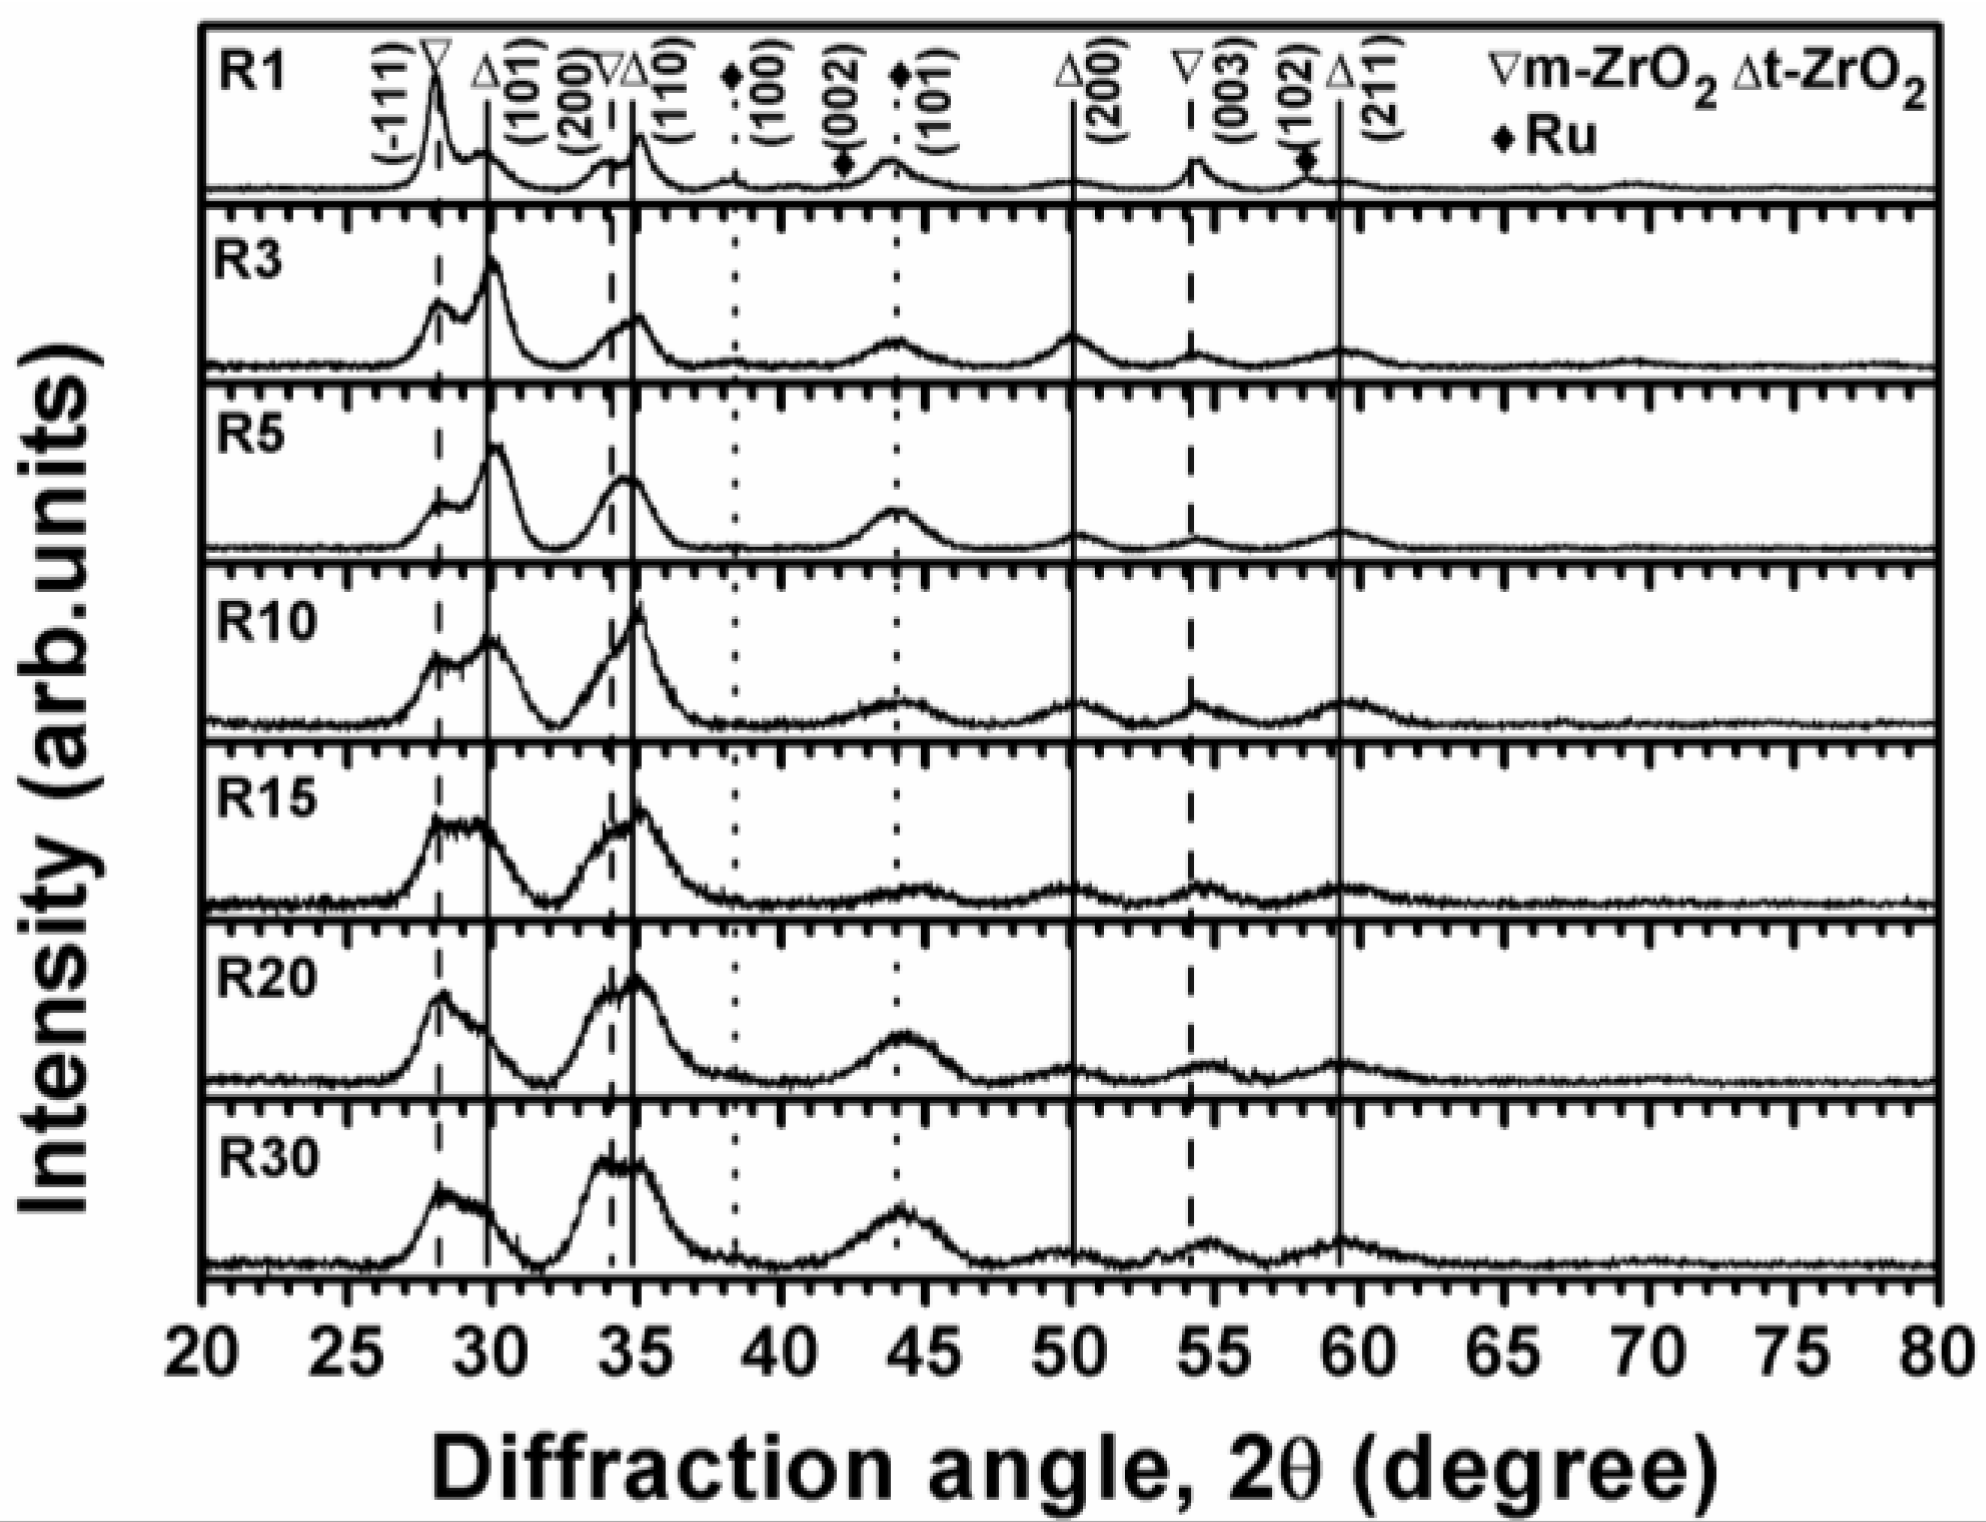
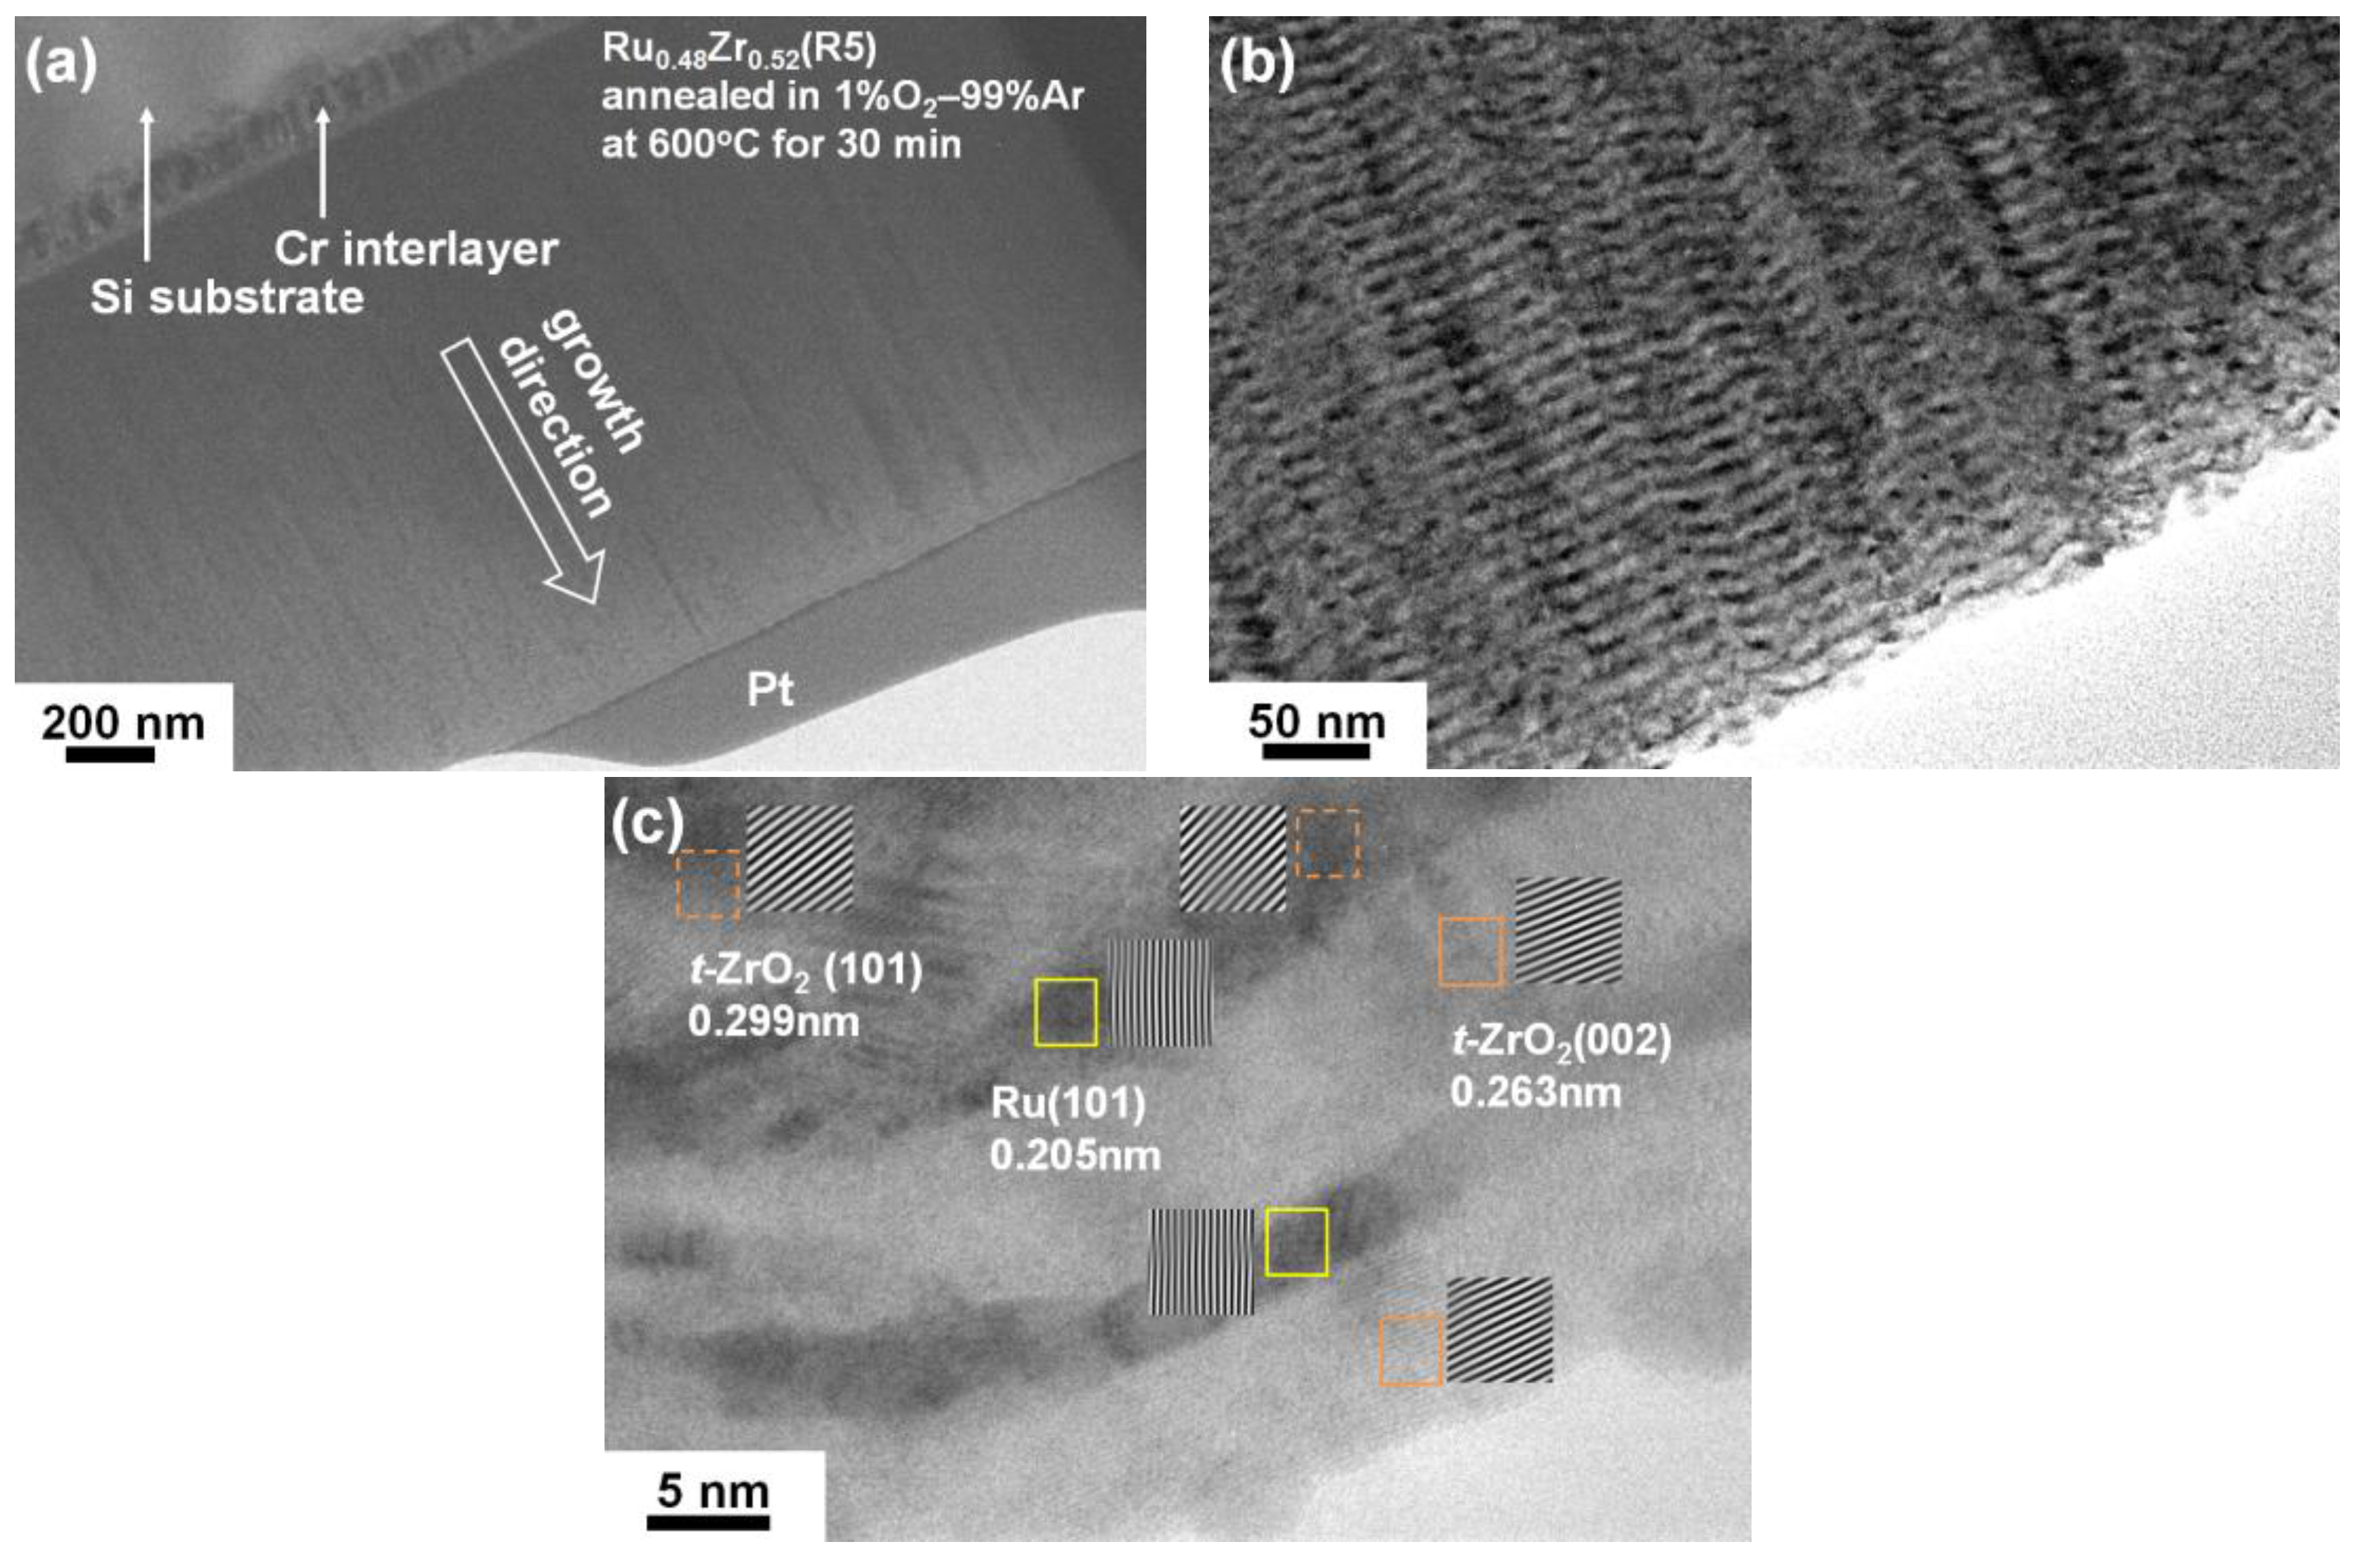
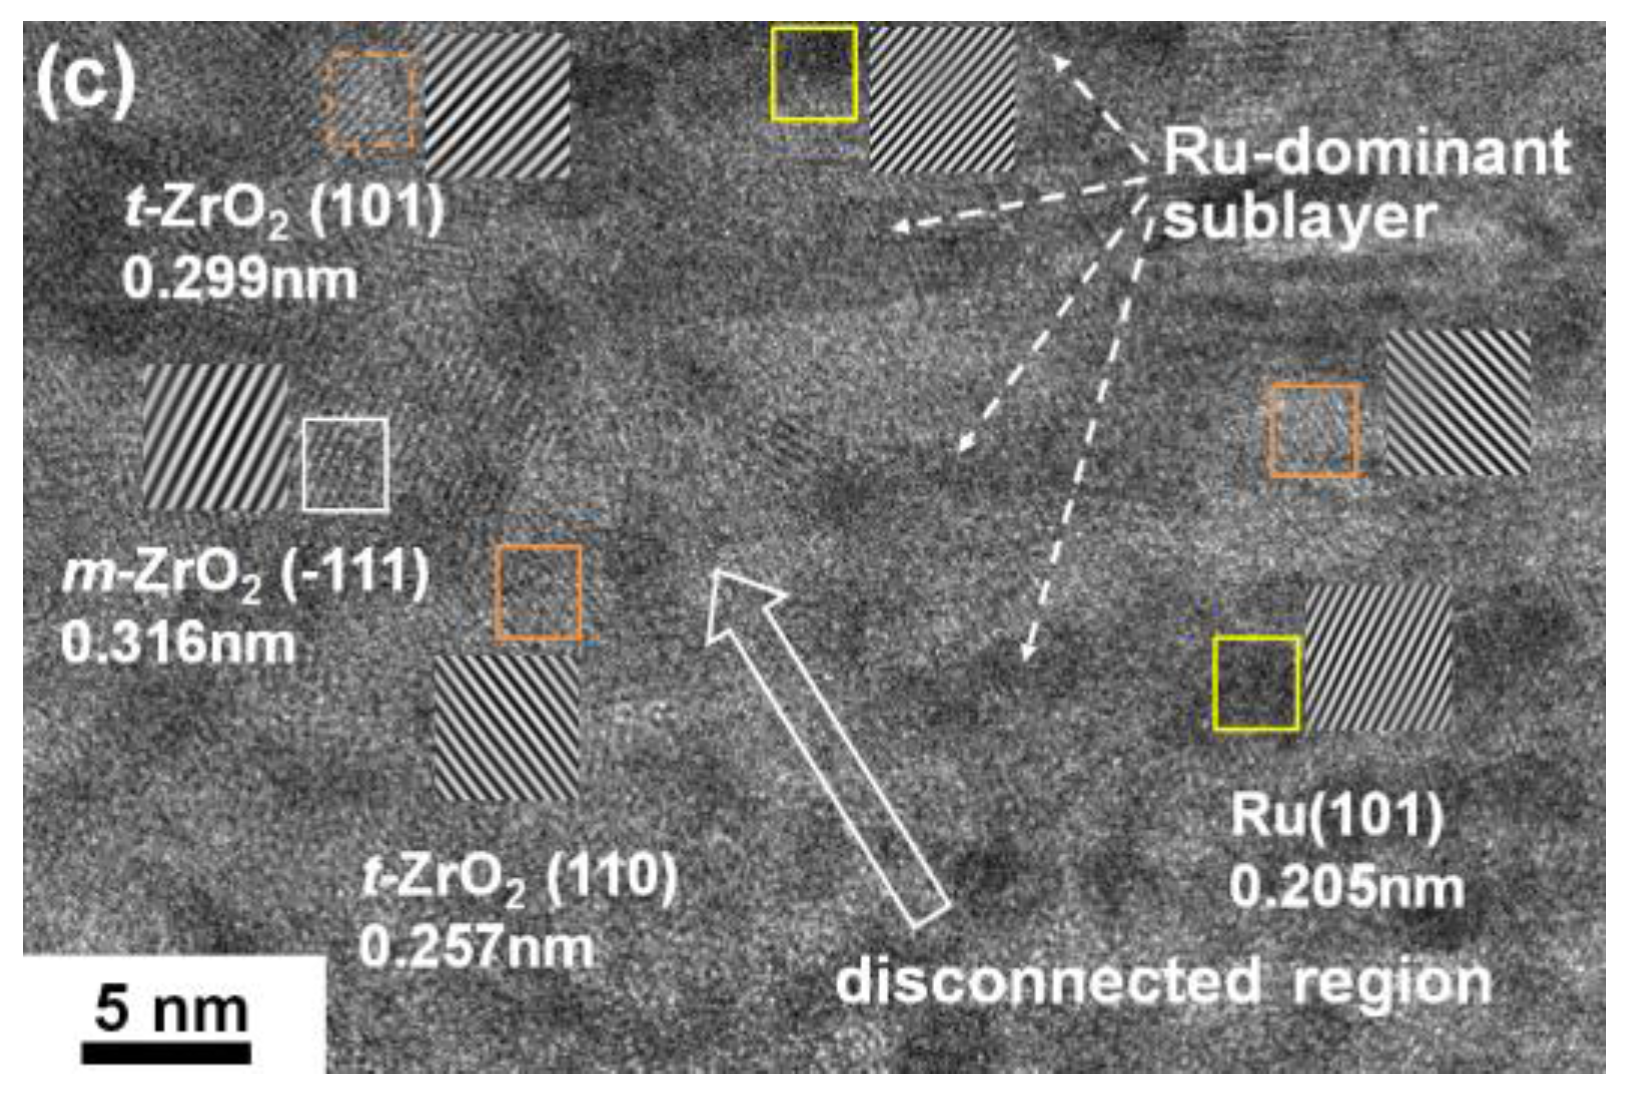
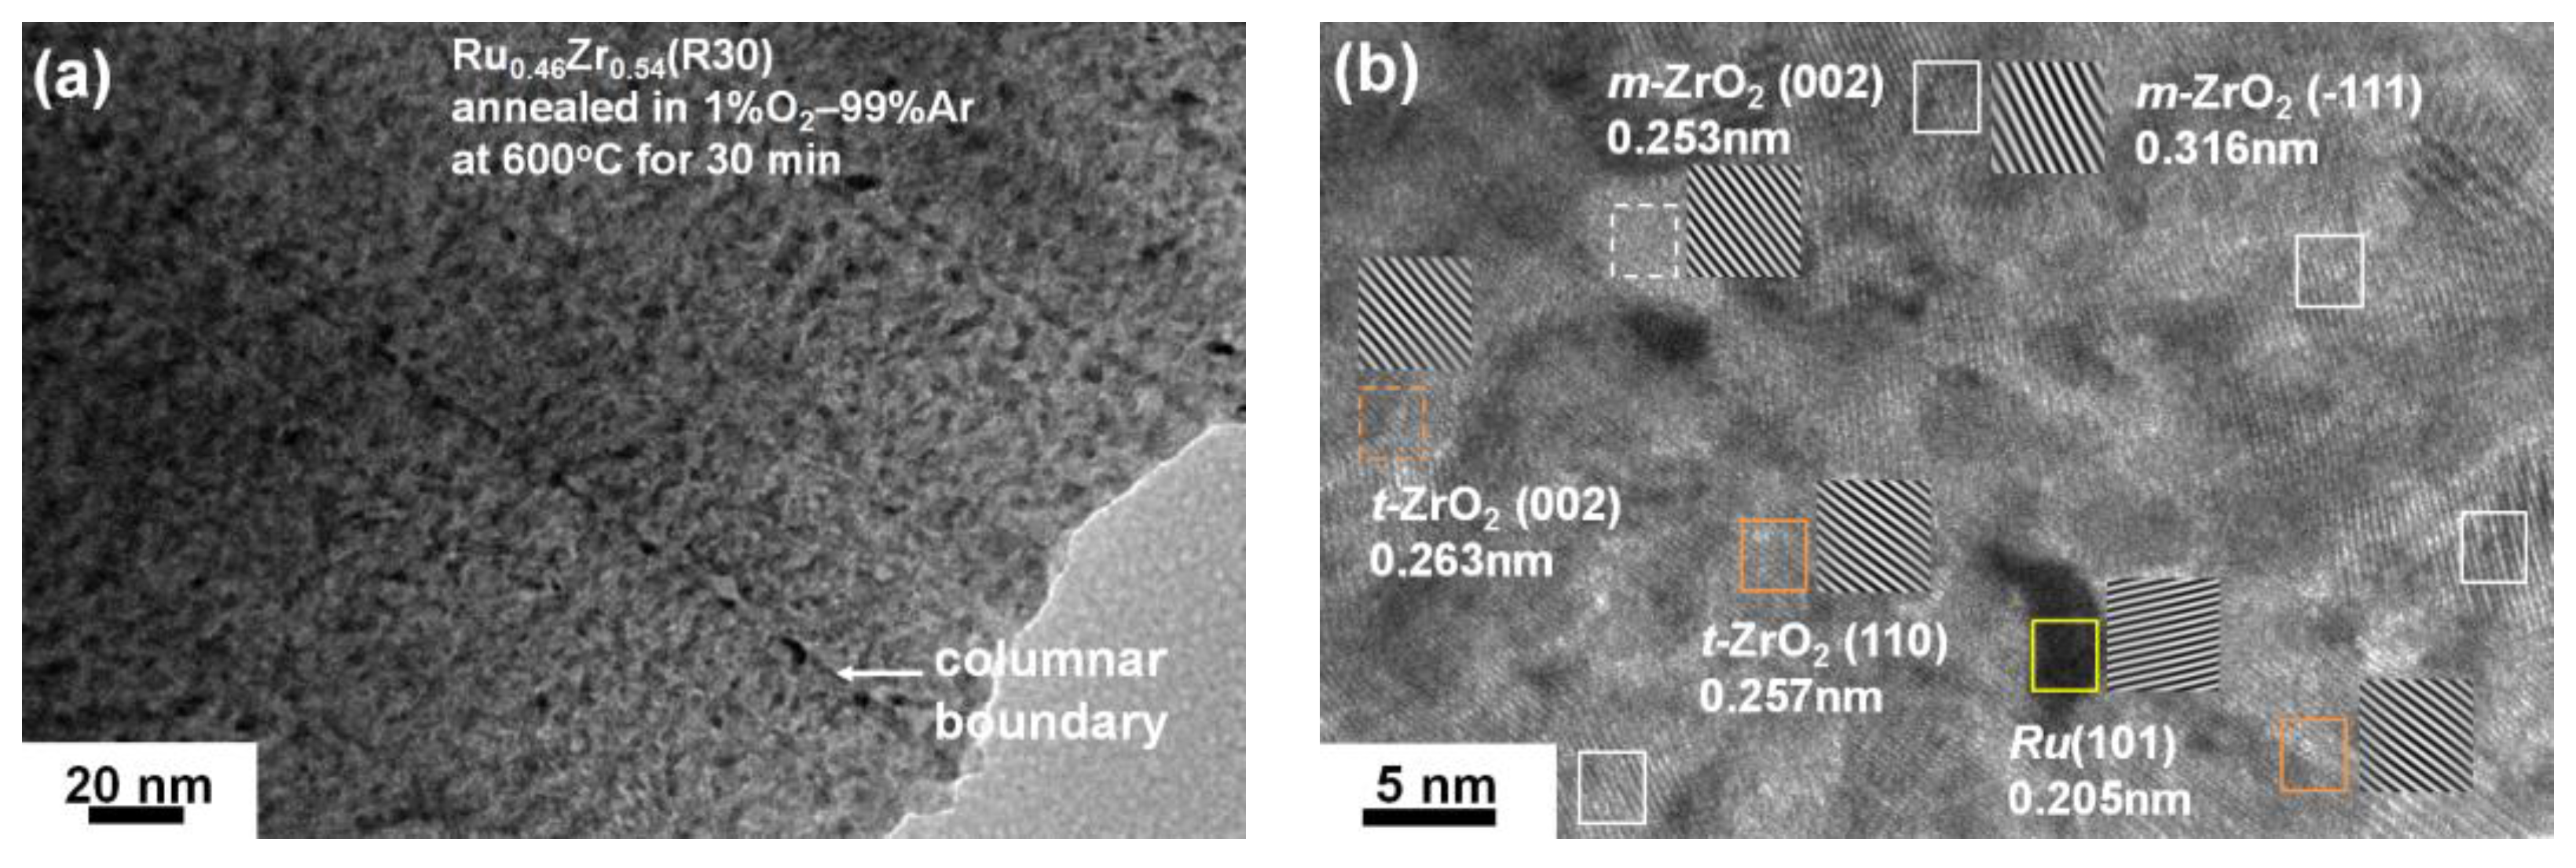
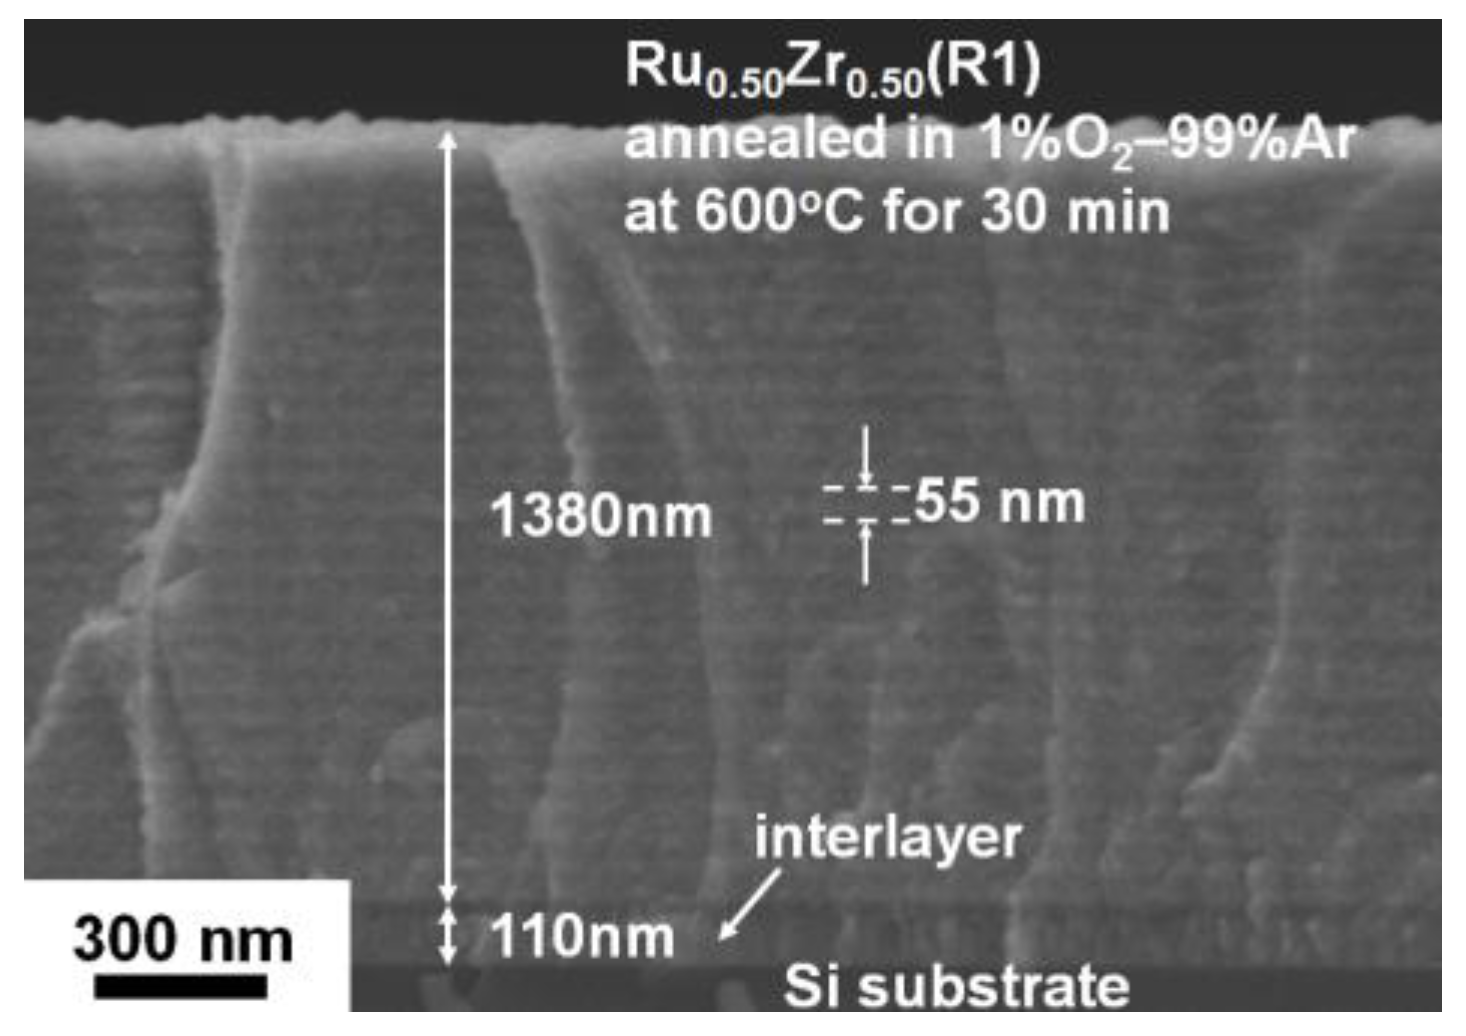
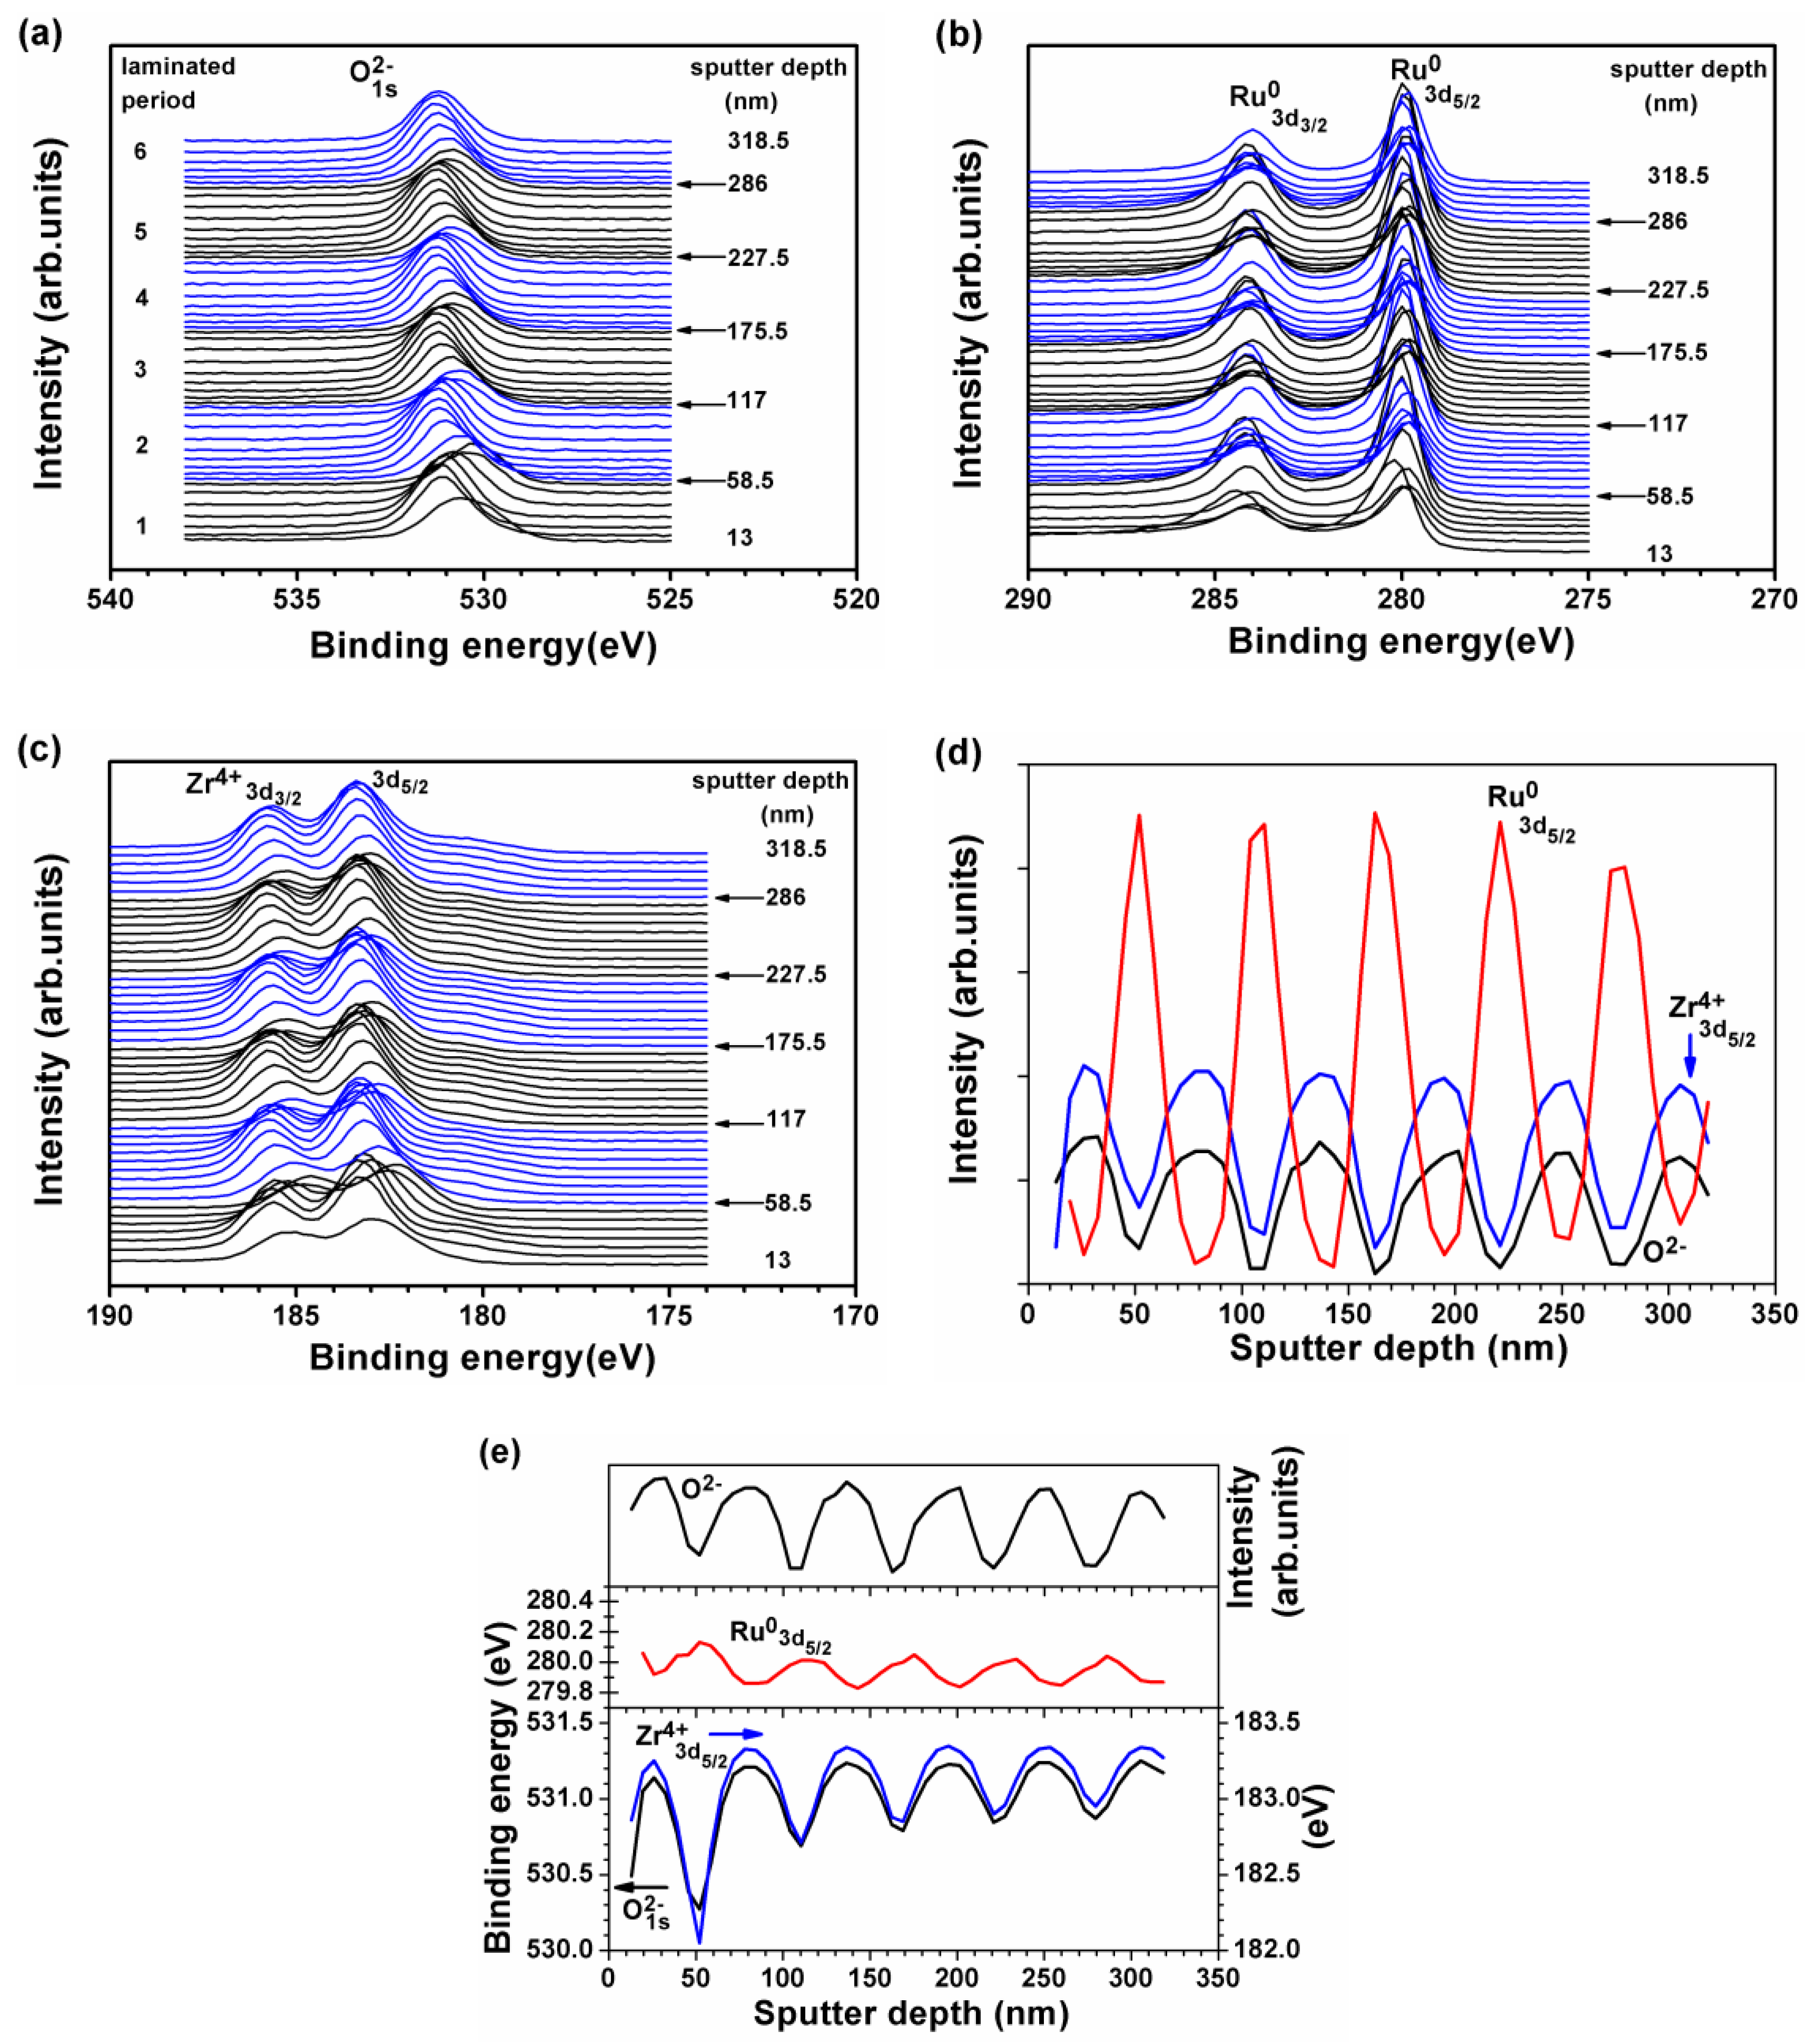
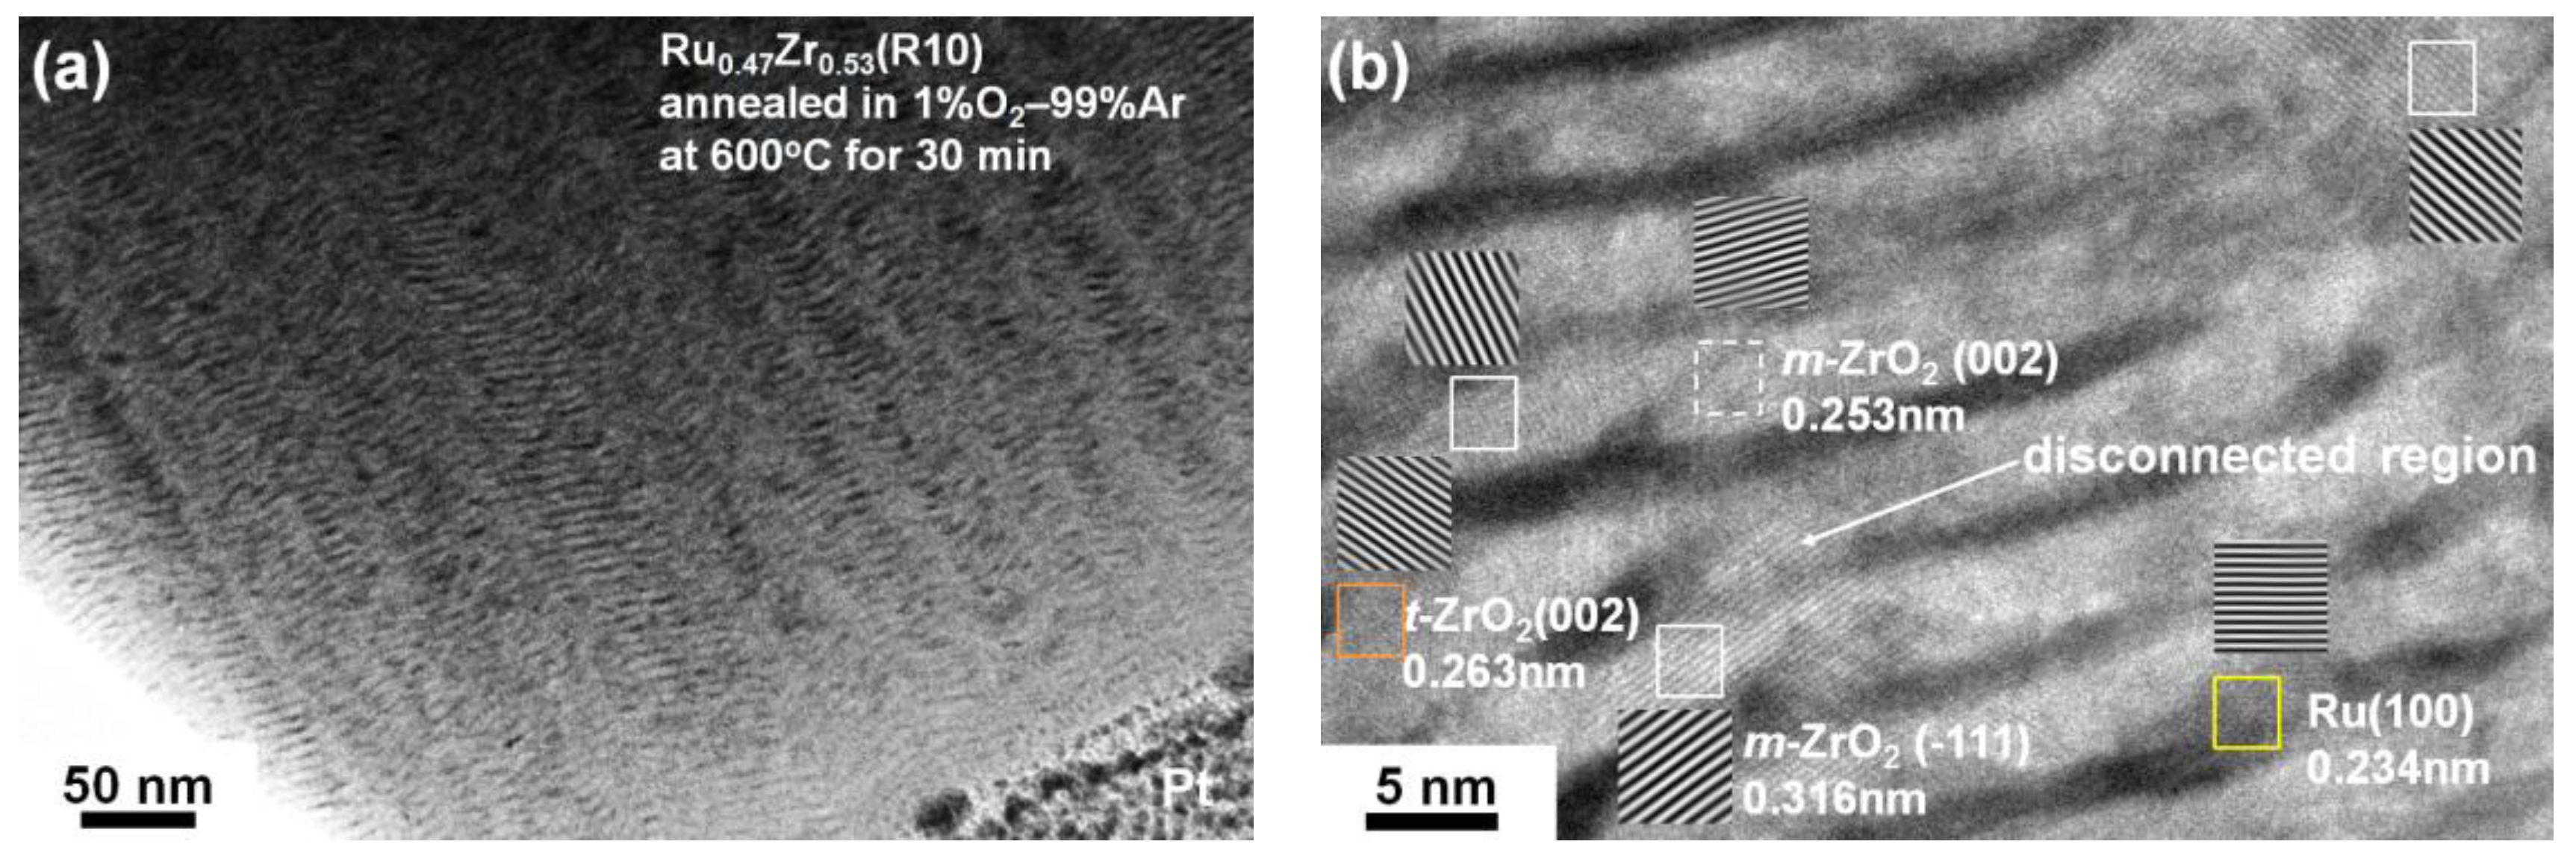
3.2. Internally Oxidized Ru–Zr Coatings
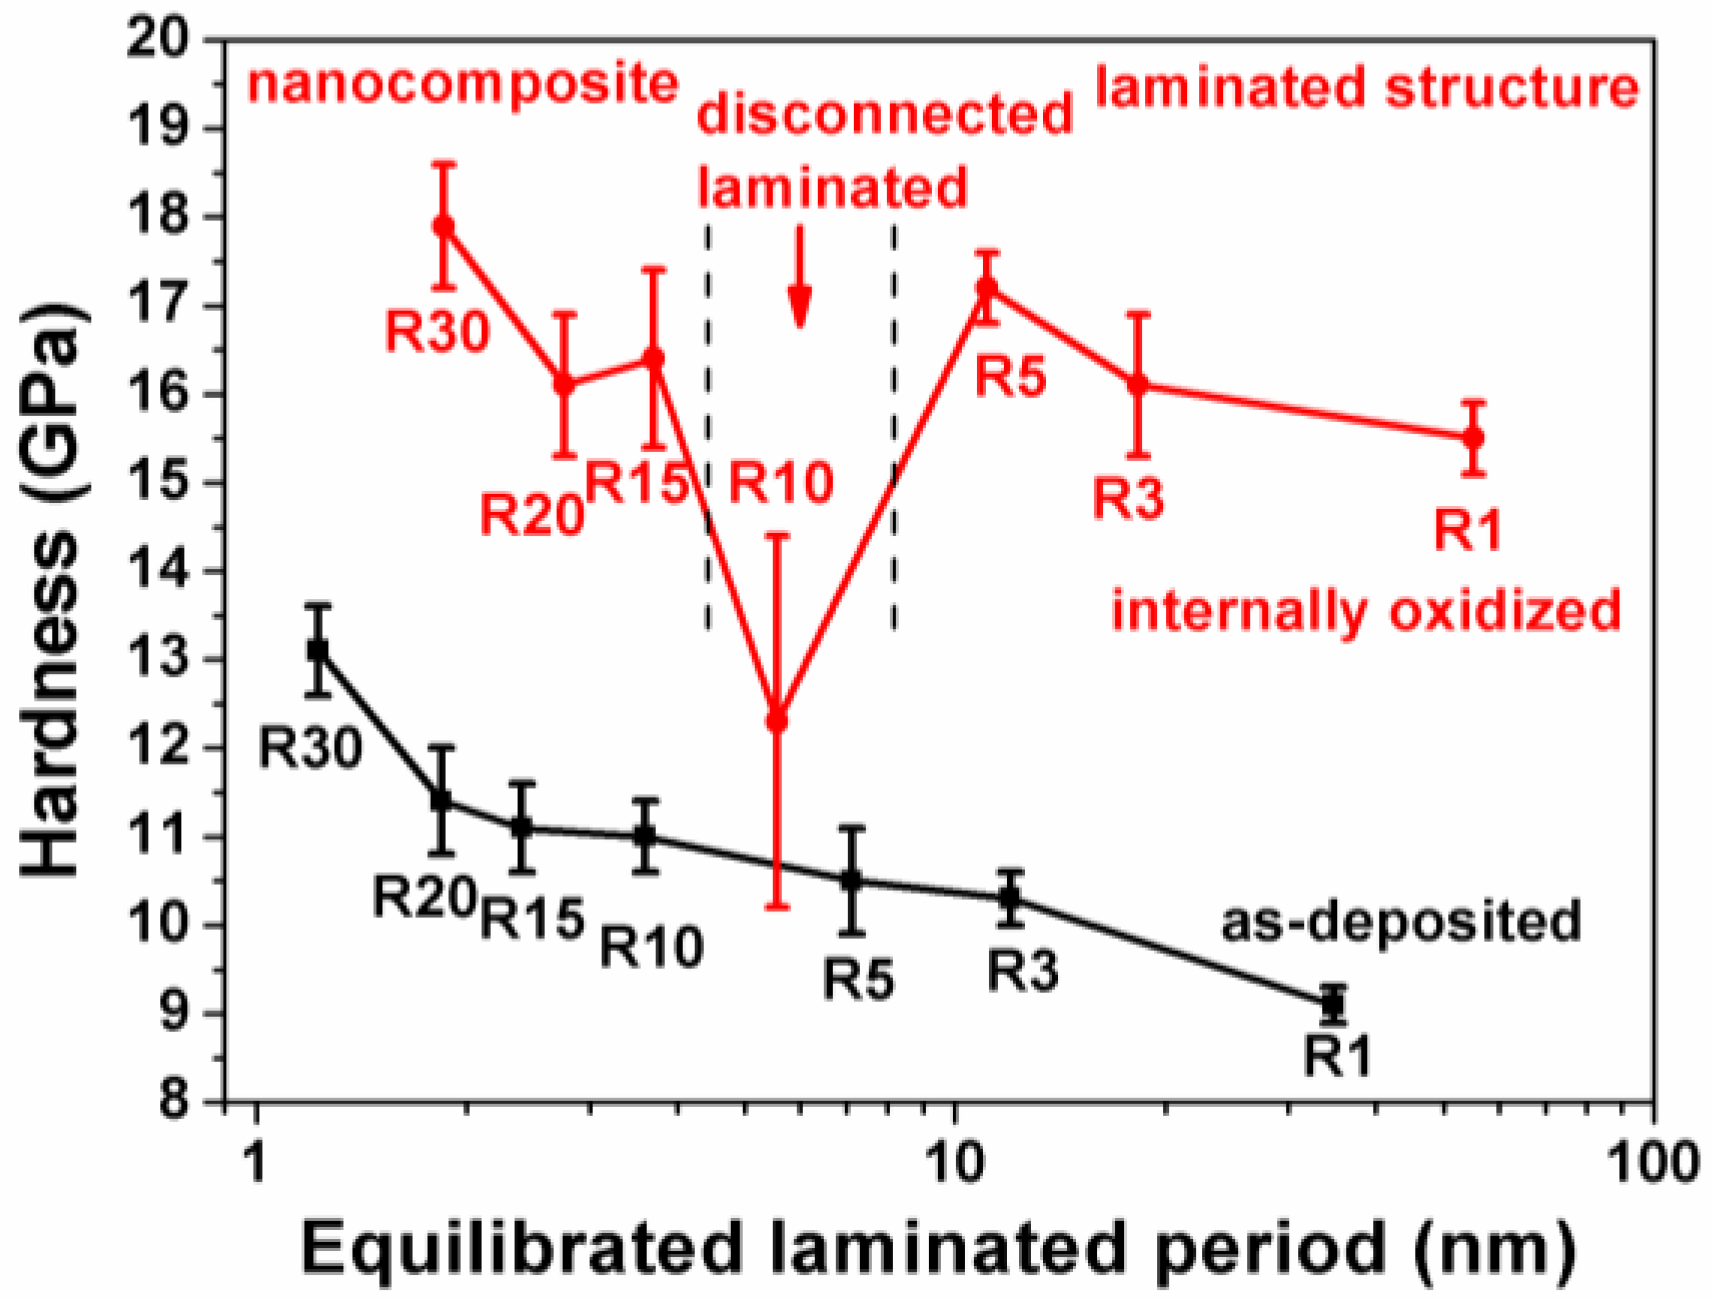
3.3. Mechanical Properties of Internally Oxidized Ru–Zr Coatings
4. Conclusions
Acknowledgments
Author Contributions
Conflicts of Interest
References
- Yashar, P.C.; Sproul, W.D. Nanometer scale multilayered hard coatings. Vacuum 1999, 55, 179–190. [Google Scholar] [CrossRef]
- Yashar, P.C.; Barnett, S.A.; Hultman, L.; Sproul, W.D. Deposition and mechanical properties of polycrystalline Y2O3/ZrO2 superlattices. J. Mater. Res. 1999, 14, 3614–3622. [Google Scholar] [CrossRef]
- Vüllers, F.T.N.; Spolenak, R. From solid solutions to fully phase separated interpenetrating networks in sputter deposited ‘‘immiscible’’ W–Cu thin films. Acta Mater. 2015, 99, 213–227. [Google Scholar] [CrossRef]
- Beainou, R.E.; Martin, N.; Potin, V.; Pedrosa, P.; Yazdi, M.A.P.; Billard, A. Correlation between structure and electrical resistivity of W–Cu thin films prepared by GLAD co-sputtering. Surf. Coat. Technol. 2017, 313, 1–7. [Google Scholar] [CrossRef]
- Müller, C.M.; Sologubenko, A.S.; Gerstl, S.S.A.; Süess, M.J.; Courty, D.; Spolenak, R. Nanoscale Cu/Ta multilayer deposition by co-sputtering on a rotating substrate. Empirical model and experiment. Surf. Coat. Technol. 2016, 302, 284–292. [Google Scholar] [CrossRef]
- Müller, C.M.; Spolenak, R. An in situ X-ray diffraction study of phase separation in Cu–Ta alloy thin films. Thin Solid Films 2016, 598, 276–288. [Google Scholar] [CrossRef]
- Zotov, N.; Woll, K.; Mücklich, F. Phase formation of B2-RuAl during annealing of Ru/Al multilayers. Intermetallics 2010, 18, 1507–1516. [Google Scholar] [CrossRef]
- Guitar, M.A.; Aboulfadl, H.; Pauly, C.; Leibenguth, P.; Migot, S.; Mücklich, F. Production of single-phase intermetallic films from Ru-Al multilayers. Surf. Coat. Technol. 2014, 244, 210–216. [Google Scholar] [CrossRef]
- Manhardt, H.; Lupton, D.F.; Kock, W. Gold-Free Platinum Material Dispersion-Strengthened by Small, Finely Dispersed Particles of Base Metal Oxide. U.S. Patent 6,663,728, 16 December 2003. [Google Scholar]
- Nakamura, T.; Sakaguchi, O.; Kusamori, H.; Matsuzawa, O.; Takahashi, M.; Yamamoto, T. Method for Preparing Ag-ZnO Electric Contact Material and Electric Contact Material Produced Thereby. U.S. Patent 6,432,157, 13 August 2002. [Google Scholar]
- Khanna, A.S. Introduction to High Temperature Oxidation and Corrosion; ASM International: Materials Park, OH, USA, 2002. [Google Scholar]
- Chen, Y.I.; Chang, L.C.; Huang, R.T.; Tsai, B.N.; Kuo, Y.C. Internal Oxidation of Mo–Ru Coatings. Thin Solid Films 2010, 518, 3819–3824. [Google Scholar] [CrossRef]
- Chen, Y.I.; Tsai, B.N. Annealing and oxidation study of Ta–Ru hard coatings. Surf. Coat. Technol. 2010, 205, 1362–1367. [Google Scholar] [CrossRef]
- Chen, Y.I. Laminated structure in internally oxidized Ru–Ta coatings. Thin Solid Films 2012, 524, 205–210. [Google Scholar] [CrossRef]
- Chen, Y.I.; Chu, H.N.; Chang, L.C.; Lee, J.W. Internal oxidation and mechanical properties of Ru based alloy coatings. J. Vac. Sci. Technol. A 2014, 32, 02B101. [Google Scholar] [CrossRef]
- Chen, Y.I.; Lu, T.S. Internal oxidation of laminated ternary Ru–Ta–Zr coatings. Appl. Surf. Sci. 2015, 353, 245–253. [Google Scholar] [CrossRef]
- Chen, Y.I.; Chu, H.N.; Kai, W. Internal oxidation of laminated Nb–Ru coatings. Appl. Surf. Sci. 2016, 389, 477–483. [Google Scholar] [CrossRef]
- Saha, R.; Nix, W.D. Effects of the substrate on the determination of thin film mechanical properties by nanoindentation. Acta Mater. 2002, 50, 23–38. [Google Scholar] [CrossRef]
- Oliver, W.C.; Pharr, G.M. An improved technique for determining hardness and elastic modulus using load and displacement sensing indentation experiments. J. Mater. Res. 1992, 7, 1564–1583. [Google Scholar] [CrossRef]
- Bennett, J.M. Rough Surfaces, 2nd ed.; Imperial College Press: London, UK, 1999. [Google Scholar]
- Mahdouk, K.; Elaissaoui, K.; Charles, J.; Bouirden, L.; Gachon, J.C. Calorimetric study and optimization of the ruthenium-zirconium phase diagram. Intermetallics 1997, 5, 111–116. [Google Scholar] [CrossRef]
- Wang, F.E. Equiatomic binary compounds of Zr with transition elements Ru, Rh, and Pd. J. Appl. Phys. 1967, 38, 822–824. [Google Scholar] [CrossRef]
- David, N.; Benlaharche, T.; Fiorani, J.M.; Vilasi, M. Thermodynamic modeling of Ru–Zr and Hf–Ru systems. Intermetallics 2007, 15, 1632–1637. [Google Scholar] [CrossRef]
- Arikan, N.; Bayhan, Ü. Ab initio calculation of structural, electronic and phonon properties of ZrRu and ZrZn in B2 phase. Phys. B 2011, 406, 3234–3237. [Google Scholar] [CrossRef]
- Xing, W.; Chen, X.Q.; Li, D.; Li, Y.; Fu, C.L.; Meschel, S.V.; Ding, X. First-principles studies of structural stabilities and enthalpies of formation of refractory intermetallics: TM and TM3 (T = Ti, Zr, Hf; M = Ru, Rh, Pd, Os, Ir, Pt). Intermetallics 2012, 28, 16–24. [Google Scholar] [CrossRef]
- Chen, Y.I.; Zheng, Z.T.; Kai, W.; Huang, Y.R. Oxidation behavior of Ru–Al multilayer coatings. Appl. Surf. Sci. 2017, 406, 1–7. [Google Scholar] [CrossRef]
- Chen, Y.I.; Chang, L.C.; Lee, J.W.; Lin, C.H. Annealing and oxidation study of Mo–Ru hard coatings on tungsten carbide. Thin Solid Films 2009, 518, 194–200. [Google Scholar] [CrossRef]
- Rochefort, D.; Dabo, P.; Guay, D.; Sherwood, P.M.A. XPS investigations of thermally prepared RuO2 electrodes in reductive conditions. Electrochim. Acta 2003, 48, 4245–4252. [Google Scholar] [CrossRef]
- Chen, Y.I.; Chen, S.M.; Chang, L.C.; Chu, H.N. X-ray photoelectron spectroscopy and transmission electron microscopy study of internally oxidized Nb–Ru coatings. Thin Solid Films 2013, 544, 491–495. [Google Scholar] [CrossRef]
- Cox, P.A.; Goodenough, J.B.; Tavener, P.J.; Telles, D.; Egdell, R.G. The electronic structure of Bi2−xGdxRu2O7 and RuO2: A study by electron spectroscopy. J. Solid State Chem. 1986, 62, 360–370. [Google Scholar] [CrossRef]
- Morant, C.; Sanz, J.M.; Galán, L.; Soriano, L.; Rueda, F. An XPS study of the interaction of oxygen with zirconium. Surf. Sci. 1989, 218, 331–345. [Google Scholar] [CrossRef]
- Maurice, V.; Salmeron, M.; Somorjai, G.A. The epitaxial growth of zirconium oxide thin films on Pt (111) single crystal surfaces. Surf. Sci. 1990, 237, 116–126. [Google Scholar] [CrossRef]
- Wang, Y.M.; Li, Y.S.; Wong, P.C.; Mitchell, K.A.R. XPS studies of the stability and reactivity of thin films of oxidized zirconium. Appl. Surf. Sci. 1993, 72, 237–244. [Google Scholar] [CrossRef]
- Ramana, C.V.; Atuchin, V.V.; Kesler, V.G.; Kochubey, V.A.; Pokrovsky, L.D.; Shutthanandan, V.; Becker, U.; Ewing, R.C. Growth and surface characterization of sputter-deposited molybdenum oxide thin films. Appl. Surf. Sci. 2007, 253, 5368–5374. [Google Scholar] [CrossRef]
- Gan, Z.; Yu, G.; Zhao, Z.; Tan, C.M.; Tay, B.K. Mechanical properties of zirconia thin films deposited by filtered cathodic vacuum arc. J. Am. Ceram. Soc. 2005, 88, 2227–2229. [Google Scholar] [CrossRef]
- Qasmi, M.; Delobelle, P. Influence of the average roughness Rms on the precision of the Young’s modulus and hardness determination using nanoindentation technique with a Berkovich indenter. Surf. Coat. Technol. 2007, 201, 1191–1199. [Google Scholar] [CrossRef]
- Walter, C.; Antretter, T.; Daniel, R.; Mitterer, C. Finite element simulation of the effect of substrate roughness on nanoindentation of thin films with spherical indenters. Surf. Coat. Technol. 2007, 202, 1103–1107. [Google Scholar] [CrossRef]
- Kim, J.Y.; Kang, S.K.; Lee, J.J.; Jang, J.; Lee, Y.H.; Kwon, D. Influence of surface-roughness on indentation size effect. Acta Mater. 2007, 55, 3555–3562. [Google Scholar] [CrossRef]


| Sample | Chemical Composition (at.%) | Atomic Ratio | Thickness (nm) | Period (nm) | H (GPa) | E (GPa) | Roughness (nm) | |||
|---|---|---|---|---|---|---|---|---|---|---|
| Ru | Zr | O | Ru:Zr | Coating | Interlayer | |||||
| As-deposited | ||||||||||
| Ru0.50Zr0.50(R1) | 50.2 | 49.6 | 0.2 | 50.3:49.7 | 870 | 90 | 34.8 | 9.1 ± 0.2 | 128 ± 3 | 1.76 ± 0.04 |
| Ru0.49Zr0.51(R3) | 48.7 | 50.9 | 0.4 | 48.9:51.1 | 900 | 100 | 12.0 | 10.3 ± 0.3 | 142 ± 3 | 2.51 ± 0.02 |
| Ru0.48Zr0.52(R5) | 47.9 | 51.8 | 0.3 | 48.0:52.0 | 890 | 100 | 7.2 | 10.5 ± 0.6 | 137 ± 6 | 3.35 ± 0.06 |
| Ru0.47Zr0.53(R10) | 47.2 | 52.3 | 0.5 | 47.4:52.6 | 900 | 100 | 3.6 | 11.0 ± 0.4 | 161 ± 4 | 2.62 ± 0.05 |
| Ru0.46Zr0.54(R15) | 46.3 | 53.4 | 0.3 | 46.4:53.6 | 900 | 90 | 2.4 | 11.1 ± 0.5 | 177 ± 7 | 4.08 ± 0.04 |
| Ru0.47Zr0.53(R20) | 46.6 | 53.4 | 0.1 | 46.6:53.4 | 920 | 95 | 1.8 | 11.4 ± 0.6 | 171 ± 6 | 1.25 ± 0.01 |
| Ru0.46Zr0.54(R30) | 46.4 | 53.6 | 0.1 | 46.4:53.6 | 920 | 90 | 1.2 | 13.1 ± 0.5 | 172 ± 5 | 1.37 ± 0.01 |
| Annealed | ||||||||||
| Ru0.50Zr0.50(R1) | 21.3 | 21.1 | 57.5 | 50.1:49.9 | 1380 | 110 | 55.2 | 15.5 ± 0.4 | 157 ± 10 | 5.33 ± 0.50 |
| Ru0.49Zr0.51(R3) | 21.2 | 21.2 | 59.2 | 48.0:52.0 | 1370 | 110 | 18.1 | 16.1 ± 0.8 | 158 ± 8 | 4.26 ± 0.10 |
| Ru0.48Zr0.52(R5) | 20.6 | 20.6 | 60.7 | 47.6:52.4 | 1390 | 110 | 11.1 | 17.2 ± 0.4 | 178 ± 9 | 7.02 ± 0.37 |
| Ru0.47Zr0.53(R10) | 20.3 | 20.3 | 61.5 | 47.3:52.7 | 1390 | 110 | 5.5 | 12.3 ± 2.1 | 164 ± 16 | 17.32 ± 0.53 |
| Ru0.46Zr0.54(R15) | 20.2 | 20.2 | 62.5 | 46.1:53.9 | 1390 | 110 | 3.7 | 16.4 ± 1.0 | 182 ± 6 | 7.05 ± 0.20 |
| Ru0.47Zr0.53(R20) | 20.8 | 20.8 | 61.3 | 46.3:53.7 | 1380 | 110 | 2.8 | 16.1 ± 0.8 | 160 ± 6 | 1.89 ± 0.00 |
| Ru0.46Zr0.54(R30) | 21.0 | 21.0 | 61.4 | 45.7:54.3 | 1390 | 110 | 1.9 | 17.9 ± 0.7 | 175 ± 6 | 5.90 ± 1.05 |
© 2017 by the authors. Licensee MDPI, Basel, Switzerland. This article is an open access article distributed under the terms and conditions of the Creative Commons Attribution (CC BY) license (http://creativecommons.org/licenses/by/4.0/).
Share and Cite
Chen, Y.-I.; Lu, T.-S.; Zheng, Z.-T. Internally Oxidized Ru–Zr Multilayer Coatings. Coatings 2017, 7, 46. https://doi.org/10.3390/coatings7040046
Chen Y-I, Lu T-S, Zheng Z-T. Internally Oxidized Ru–Zr Multilayer Coatings. Coatings. 2017; 7(4):46. https://doi.org/10.3390/coatings7040046
Chicago/Turabian StyleChen, Yung-I, Tso-Shen Lu, and Zhi-Ting Zheng. 2017. "Internally Oxidized Ru–Zr Multilayer Coatings" Coatings 7, no. 4: 46. https://doi.org/10.3390/coatings7040046
APA StyleChen, Y.-I., Lu, T.-S., & Zheng, Z.-T. (2017). Internally Oxidized Ru–Zr Multilayer Coatings. Coatings, 7(4), 46. https://doi.org/10.3390/coatings7040046