Article

Natural Deposit Coatings on Steel during Cathodic Protection and Hydrogen Ingress

1
National Structural Integrity Research Centre, Granta Park, Cambridge CB21 6AL, UK
2
TWI, Granta Park, Cambridge CB21 6AL, UK
*
Author to whom correspondence should be addressed.
Coatings 2015, 5(4), 816-829; https://doi.org/10.3390/coatings5040816
Submission received: 29 September 2015 / Revised: 27 October 2015 / Accepted: 6 November 2015 / Published: 12 November 2015
(This article belongs to the Special Issue Trends in Coatings and Surface Technology—Feature Papers)

Abstract

:
The calcareous coating formed during cathodic protection (CP) in seawater is known to reduce the current demand by hindering the transport of species required to support the cathodic reactions and, thereby, improve the economic performance of CP systems. There is, however, uncertainty as to whether the coating reduces hydrogen uptake or indeed enhances it. To ascertain this, two sets of samples were polarized at −1.1 V (standard calomel electrode, SCE) in 3.5% w/v NaCl and synthetic seawater (ASTM D1141) at 20 °C and the diffusible hydrogen content measured over a period of 530 h. Under such conditions reports suggest a deposit with two distinct layers, comprising an initial brucite layer followed by an aragonite layer. Contrary to other findings, a fine initial layer containing Ca and Mg followed by a brucite layer was deposited with a few specks of Ca-containing zones in synthetic seawater. The hydrogen uptake was found to occur within the initial 100 h of exposure in synthetic seawater whilst it continued without the benefit of a deposit coating, i.e., in 3.5 wt % NaCl solution.

1. Introduction

Cathodic protection (CP) is an important technique widely adopted to prevent corrosion on a range of structures including below the waterline of offshore structures [1]. During cathodic protection, the structure to be protected is made a cathode by polarizing it. Cathodic polarization leads to the formation of a calcareous coating on the cathode (or the structure to be protected) in seawater which reduces the current demand by hindering the oxygen transport to the metal surface (or the structure). As well as the economic benefit of the calcareous deposit, it is also suggested as an inexpensive and environmentally-friendly corrosion control coating to protect structures in seawater [2,3,4,5,6,7].
The formation of the deposit on the cathodically-polarized surface involves the following reactions. As the applied potential becomes more negative the oxygen reduction reaction (1):
O2 + 2H2O + 4e → 4OH
is overtaken by the dissociation of water to produce the hydroxyl ions:
2H2O + 2e → H2 + 2OH
The evolution of H2 on the cathodically-polarized surface consists of a series of steps in which protons become adsorbed to the surface in a series of reactions, known as the Volmer-Tafel-Hetrovsky reactions respectively:
H+ + e ⇌ Hads
2Hads ⇌ H2
Hads + H+ + e ⇌ H2
When the overpotential is zero the reactions go in both directions at the same rate and the electrode is at its reversible potential. Overpotential is the additional potential required to drive the reactions in a direction at a specific rate. When the coverage of the cathode is too high protons discharge onto adsorbed Hads, reaction 5. Additionally, the hydrogen may penetrate into the metal:
Hads ⇌ Habs
After reaction 3 either reaction 4, 5, or 6 takes place and is highly dependent on the surface and its effect on hydrogen mobility within the double layer at the metal electrolyte interface. The rate of the adsorption step, reaction 3, is also dependent on the metal–hydrogen (M–H) bond strength and the substrate material [8].
The production of the hydroxyl ions from reactions 1 and 2 increases the pH at the metal surface which results in the precipitation of coatings from the following reactions of carbonate, bicarbonate, and magnesium ions in seawater:
OH + HCO3 → H2O + CO32−
CO32− + Ca2+ → CaCO3
Mg2+ + 2OH → Mg (OH)2
Calculations for the pH required for the deposition have yielded values of pH 7.3–8.7 for the CaCO3 polymorphs (calcite and aragonite) and pH 9.3–11.25 for brucite (Mg(OH)2 [6,7,9,10,11] and the composition achieved dependent on the potential applied, temperature, and flow of the electrolyte (ASTM D1141 [12] in our case) [9,13,14,15]. In previous studies it has been established that the deposit has a two layer structure made up of a fine layer of Mg-rich brucite followed by a Ca-rich polymorph [7,14,16,17,18,19,20,21]. Leeds and Cottis [22] found that a CaCO3 only deposit occurred at a potential of −0.7 V (SCE) and Barchiche et al. [19] suggested an aragonite deposit would be formed at a potential −0.9 ≤ E ≤ −1.1 V (SCE), a combination of aragonite and brucite at −1.2 V (SCE) with brucite the only phase forming at a potential more negative than −1.3 V (SCE) in the 10–30 °C range with rotating electrodes. The transition from a Mg(OH)2 to CaCO3 composition is still not fully understood and several explanations of the mechanism have been proposed [10,11,16,17,18]. The most widely adopted is the inhibiting effect of Mg2+ ions on the nucleation and growth of calcite and the nucleation of aragonite and once the formation of the brucite layer depletes the zone of Mg2+ ions the calcite and aragonite can nucleate and grow [16,18]. Other explanations involve a change in the electrostatic properties of the brucite layer [10,11,17].
Generally, as far as calcareous deposits are concerned, the design philosophy for CP is to have a high initial current density to promote their rapid formation [23] and, thereby, achieve a more economical CP system [10]. The application of CP has limitations: due to structural complexity it is possible to have potentials more negative around the anodes and more positive at remote or shielded locations. In moderation the only harm from overprotection is a waste of electric power or consumption of the anodes but as the potential becomes more negative the dissociation of water at the surface also produces hydrogen (2). These discharge at the surface forming atomic hydrogen which can either combine as gas bubbles or be absorbed into the metal lattice. Within the lattice it has a high mobility and can diffuse to stressed areas and cause hydrogen-induced damage with blistering, hydrogen embrittlement, or cracking. The levels of diffusible hydrogen needed can be extremely low in susceptible materials [24,25,26,27] which include many high strength steels. The problem has been addressed with empirically-derived recommendations for more careful application of CP and qualification testing.
The reduction of oxygen transport to the metal surface is attributed to the structure of the deposit and it has also been suggested that this will reduce the metal surface area for the dissociation of water and, therefore, hydrogen ingress [28,29]. Both CaCO3 and Mg(OH)2 deposits have been shown to act as hydrogen diffusion barriers, with Mg(OH)2 showing a lower hydrogen permeation rate [30]. It is also considered plausible that the deposit could enhance the ingress of hydrogen by restricting the flow of hydrogen from the metal surface, or delaying the combination of atomic hydrogen [28,29]. There is still some uncertainty on the role calcareous deposits play in hydrogen ingress. It has also been shown that hydrogen uptake in supermartensitic stainless steel can be 2–3 times lower at depth in seawater in situ compared to laboratory tests in a 3.5% NaCl solution, which lacks the ions required for a calcareous deposit to precipitate [31].
Despite this extensive work on calcareous coatings there are still important gaps in the understanding and there remains little quantitative data of the levels of hydrogen ingress in steel during CP in open literature. This study addresses the above mentioned knowledge gap to enhance the understanding of the dependency of hydrogen ingress on the deposit coating under CP. In accomplishing this, laboratory experiments were performed on cathodically-protected specimens in ASTM D1141 synthetic seawater and 3.5% w/v NaCl solutions to make a direct comparison of the hydrogen content in a susceptible material with and without the benefit of the calcareous coating.

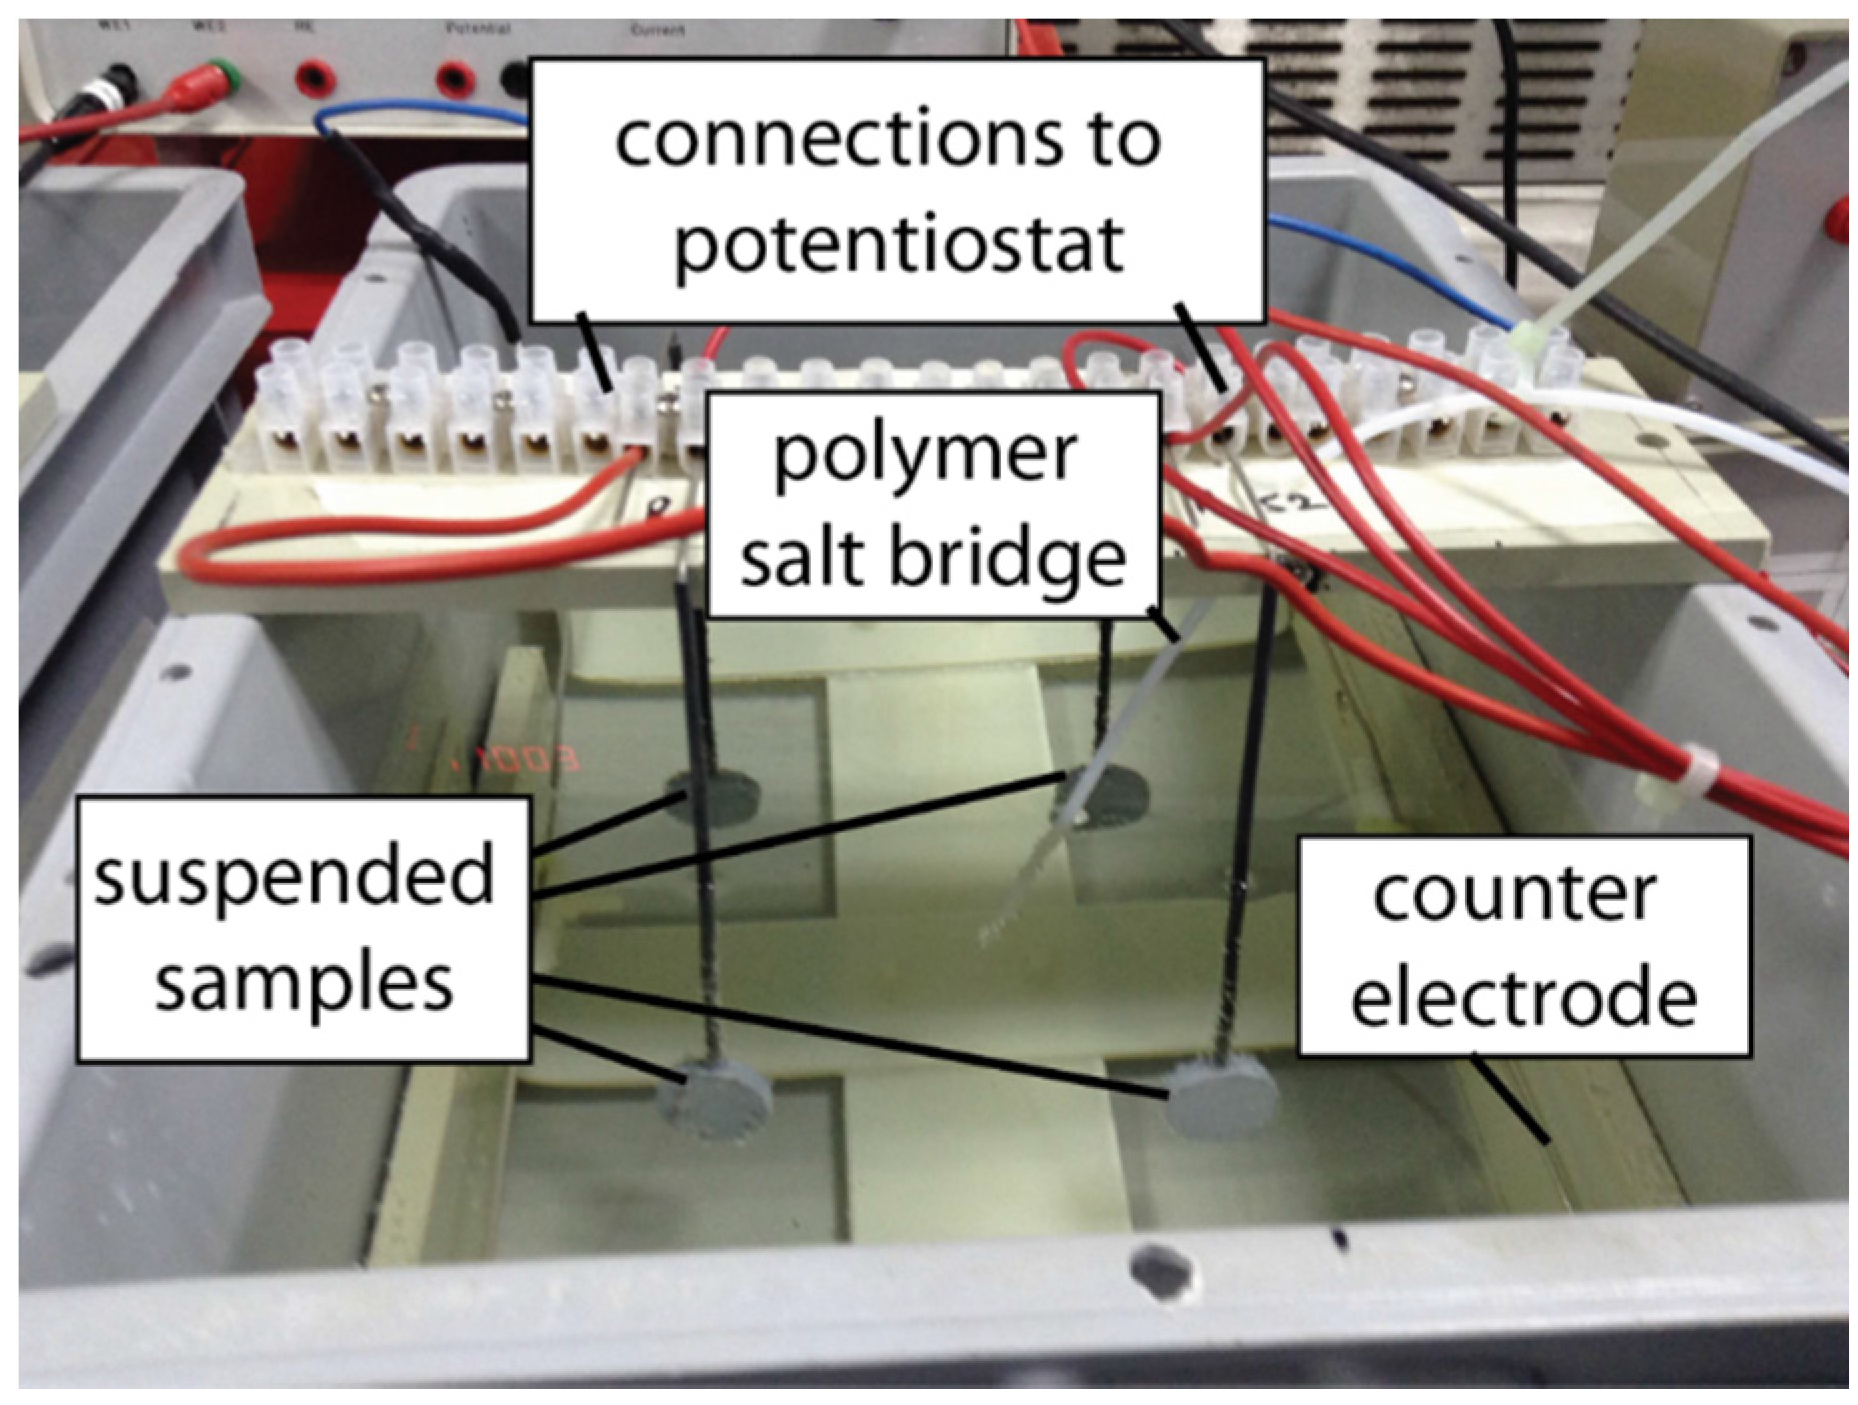
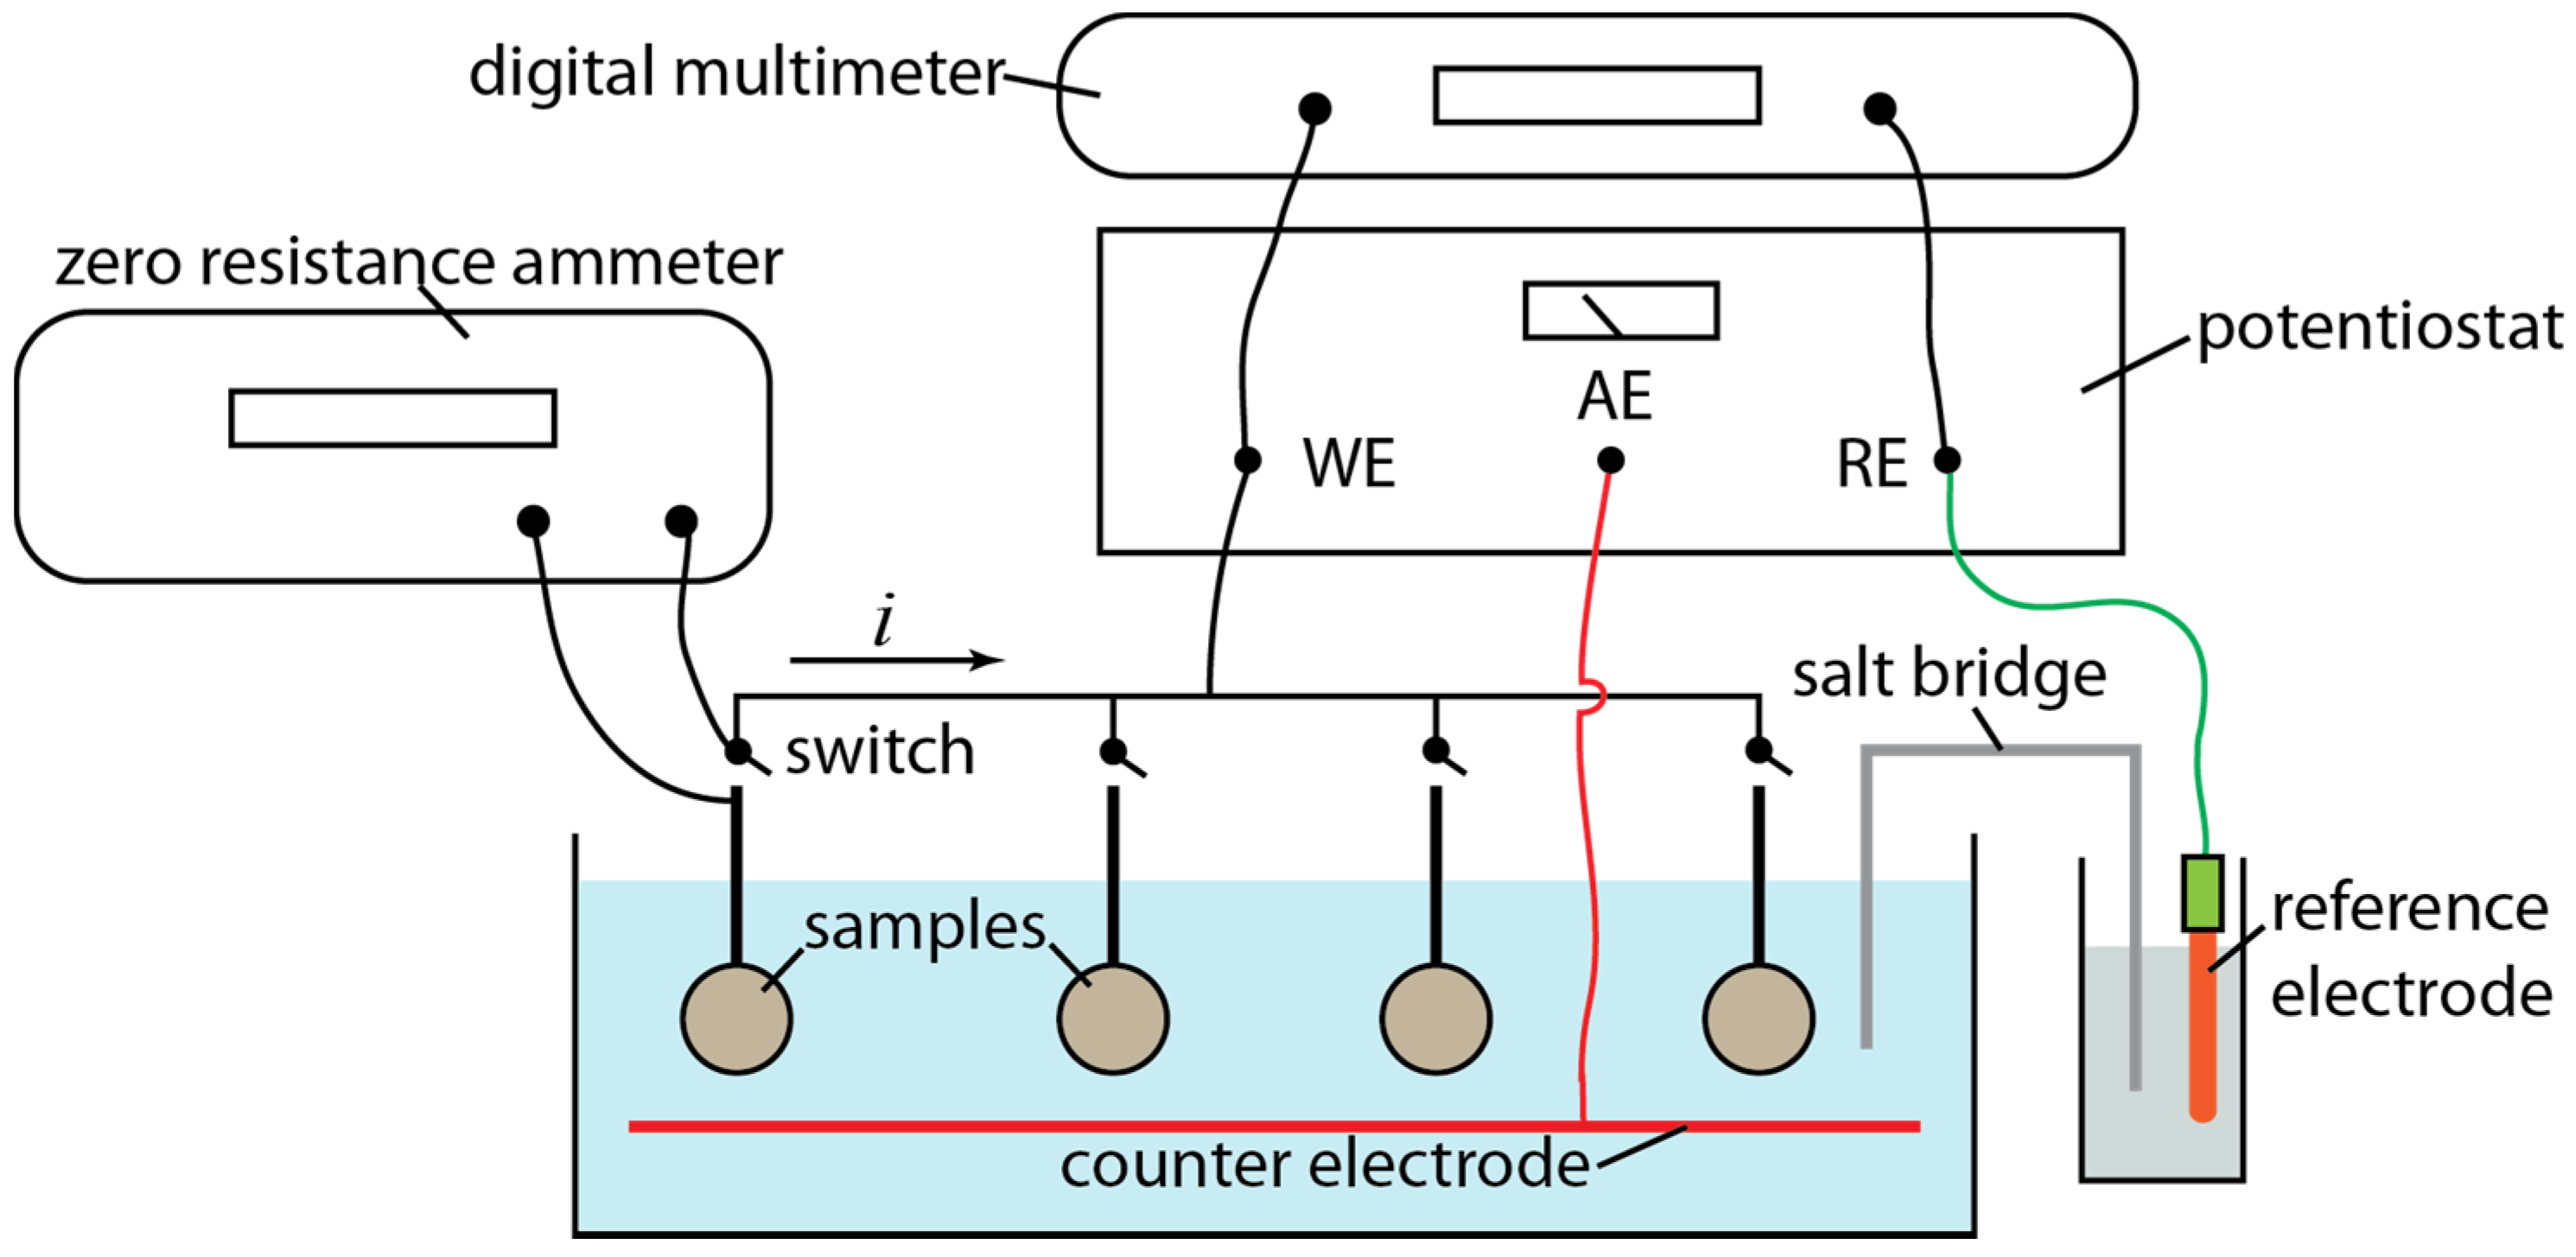
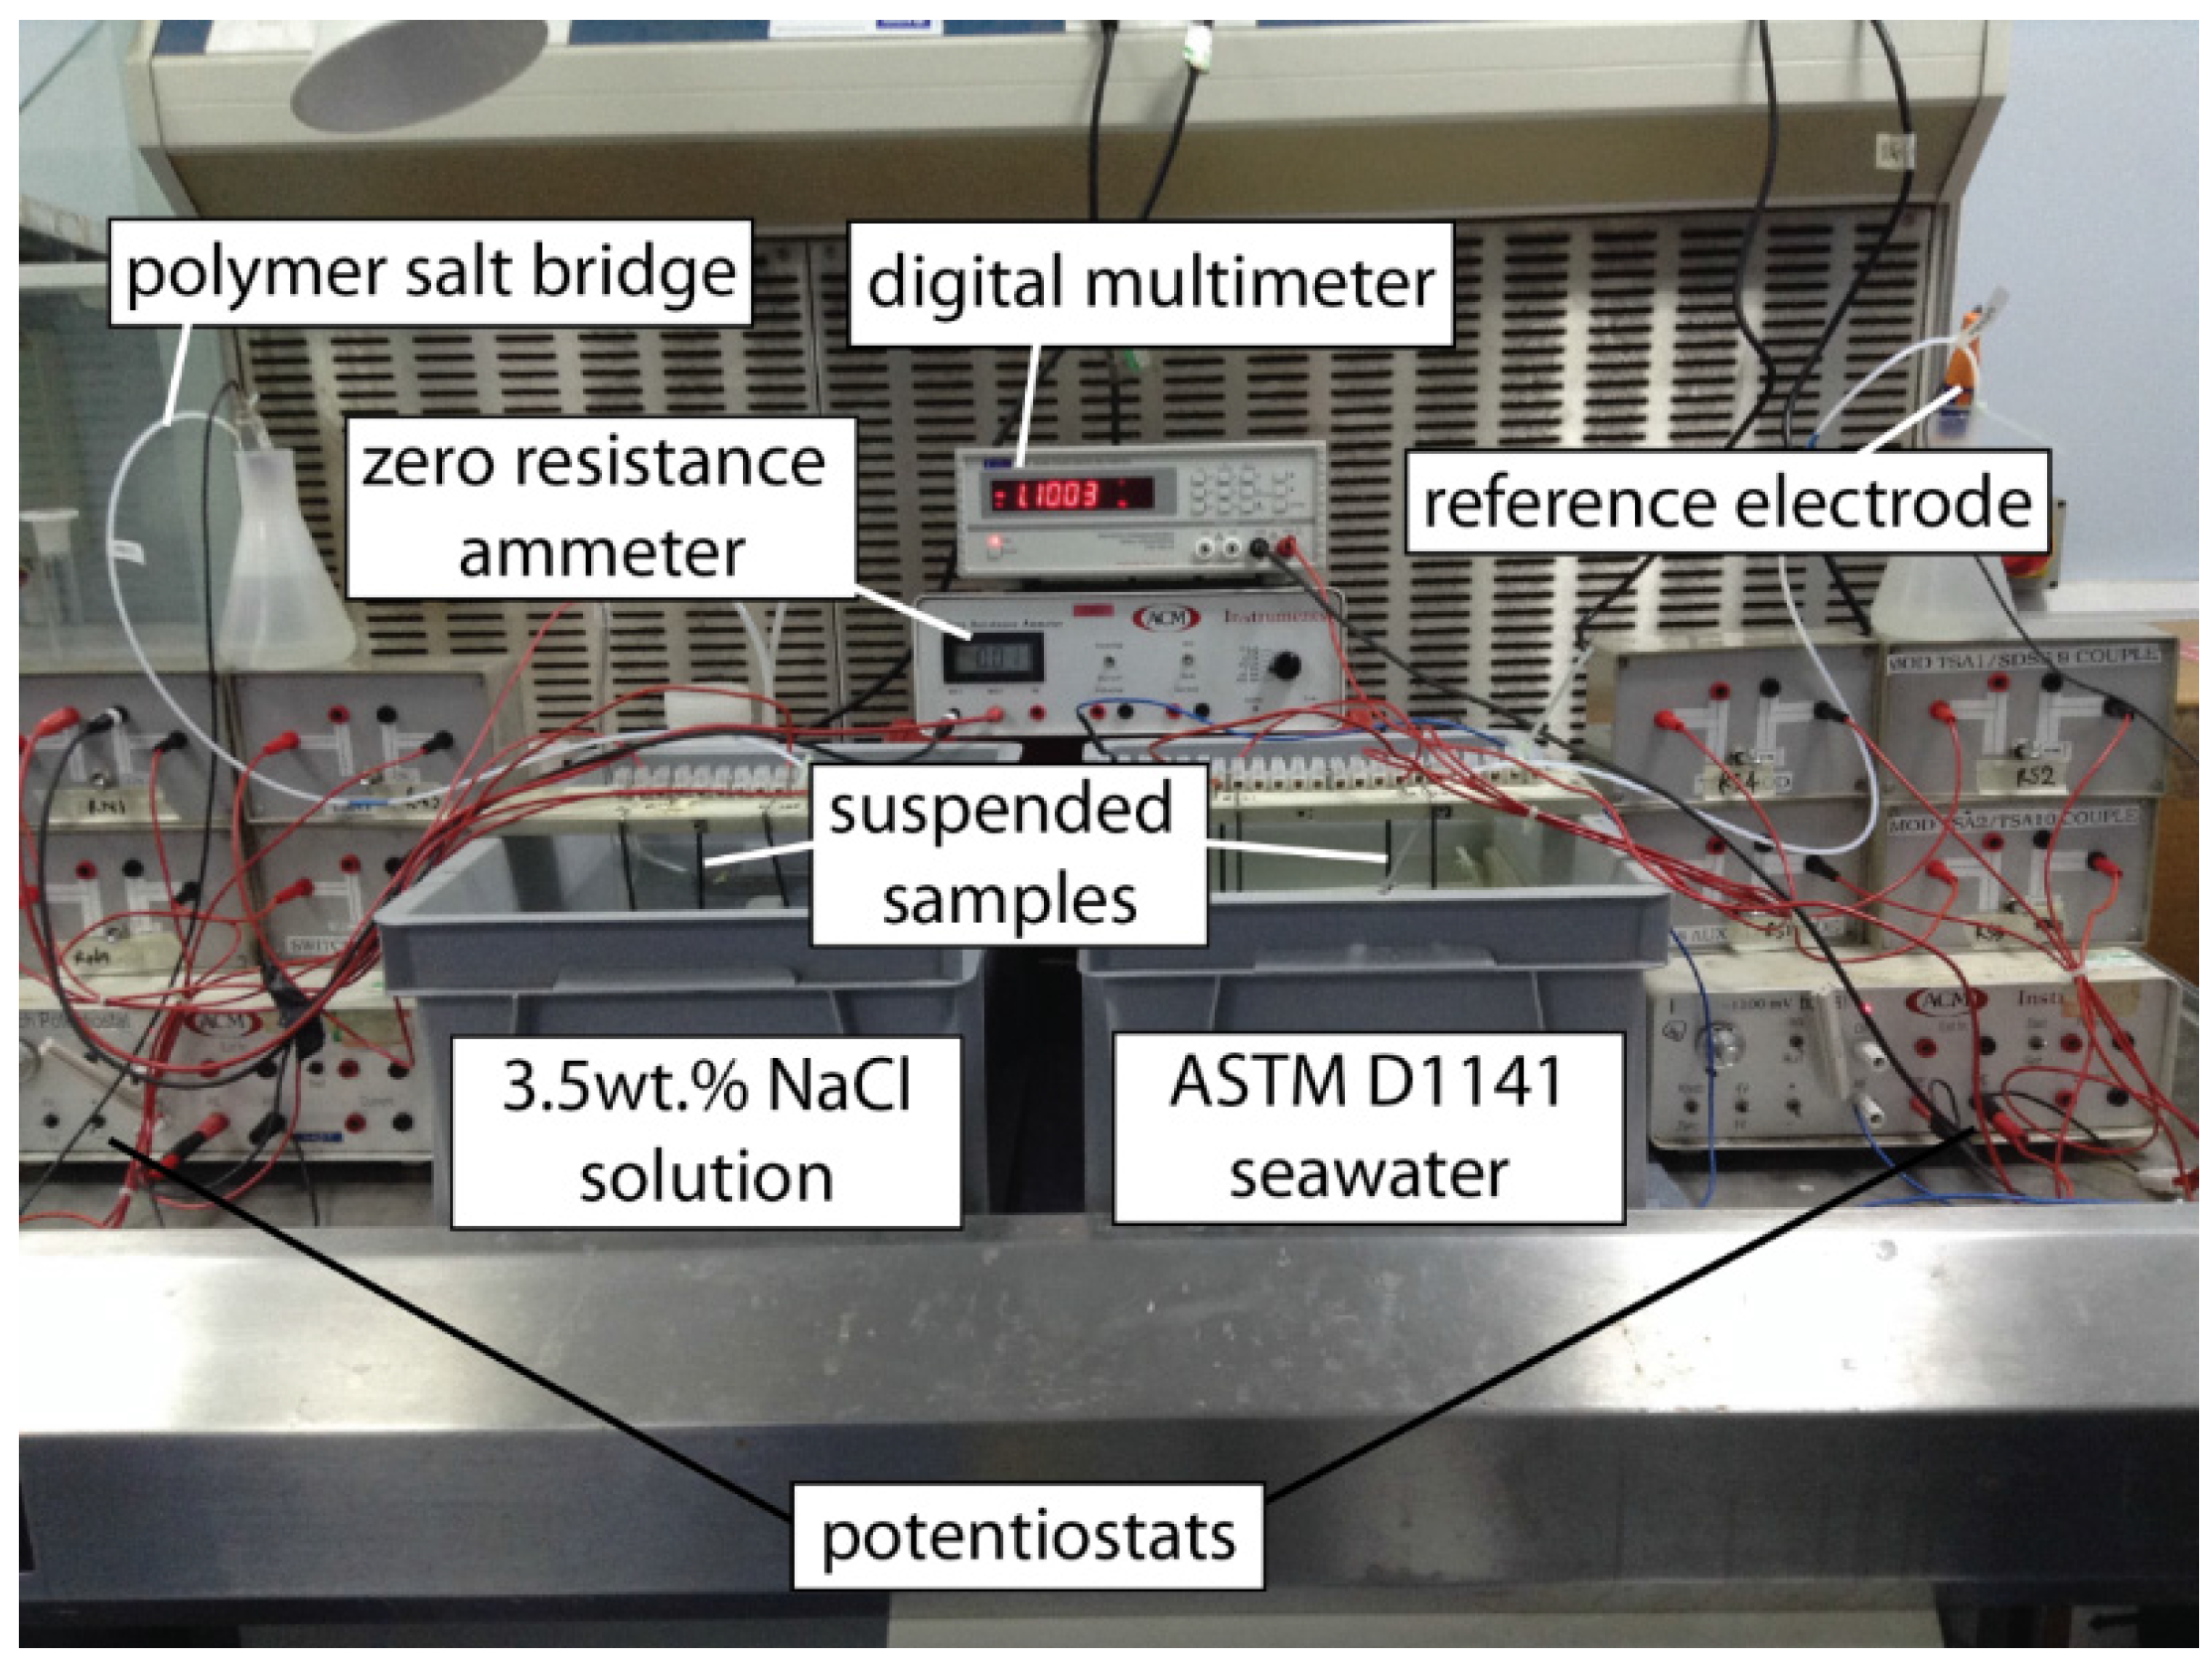
2. Experimental Section

Discs of nominal 25 mm diameter and 5 mm thickness were cut from a link of R5 grade high-strength low-alloy steel (DNV-RP-E302(2008) [32]) with the properties in Table 1. The samples were degreased in acetone and given a 120 grit finish.
Table 1. R5 grade steel properties (DNV-OS-E302 (2008) [32]).
Mechanical PropertiesCharpy V-notch Parameters
Yield Stress (N/mm2)Tensile strength (N/mm2)Elongation (%)Reduction of Area (%)Temp. (°C)Av. Energy (J)Single Energy (J)
76010001250−205844
Two sets of four samples were potentiostatically polarized in solutions of 3.5% w/v NaCl and ASTM D1141 [12] synthetic seawater at room temperature (20 °C). The 3.5% w/v NaCl solution was prepared using analytical grade reagent NaCl and deionized water.
The three electrode system used for the experiment is shown in Figure 1, with a 2 μm platinized titanium (Pt/Ti) counter electrode of 2 mm diameter placed around the outside perimeter of the tank, a saturated calomel reference electrode (Sentek, Braintree, UK) in 3.5% w/v NaCl and a polymer salt bridge filled with agar (Labtech Workshop, Northwich, UK). A potential of −1.1V (SCE) was applied with a research potentiostat (ACM Instruments, Grange-over-Sands, UK) and the individual specimen currents measured via an in-line switch with a zero resistance ammeter (ZRA) (ACM Instruments, Grange-over-Sands, UK).
Figure 1. Schematic layout of the experiment.
Coatings 05 00816 g001
The samples were suspended from a beam with 316L stainless steel wires (dia. = 1.6 mm) welded (Instrument Welder J60M) to the specimen edge and covered with a heat-shrink sleeve. The specimens were then aligned with the 25 mm diameter face parallel to the counter electrode at approximately mid height and 100 mm distance. Figure 2 and Figure 3 show the experimental equipment used and the tank layout.
The experimental equipment was set up dry and, with the holding beam out of position, the tanks filled with their respective solutions. The potential was set at the required level, the potentiostat switched on, the beams with samples and salt bridge lowered into the solutions, and the potential finely adjusted.
Figure 2. Experimental equipment.
Coatings 05 00816 g002
Figure 3. The tank layout.
Coatings 05 00816 g003
Solution pH and the individual sample current were measured periodically with a pH meter and a ZRA, respectively. The pH was measured at a fixed counter electrode position, at approximately 1 cm from the sample surface (interfacial) and in the bulk solution with a Jenway Model 370 meter. All data were manually collected.
For hydrogen testing the samples were removed at intervals (100,170, 360, and 530 h), the welded wire detached, and the samples immediately placed in liquid nitrogen. The calcareous deposit and any weld residue were removed by filing and wire brushed with intermittent return to the liquid nitrogen container before degreasing in acetone and weighing. The hydrogen content was measured using the hot extraction method with Bruker G4 Phoenix equipment. Diffusible hydrogen was measured at 400 °C for 20 min and any residual hydrogen measured at 800 °C. For the final sample the removed coating was analysed with X-ray diffraction (XRD) equipment (Bruker D8 Advance) to determine the composition.

3. Results and Discussion

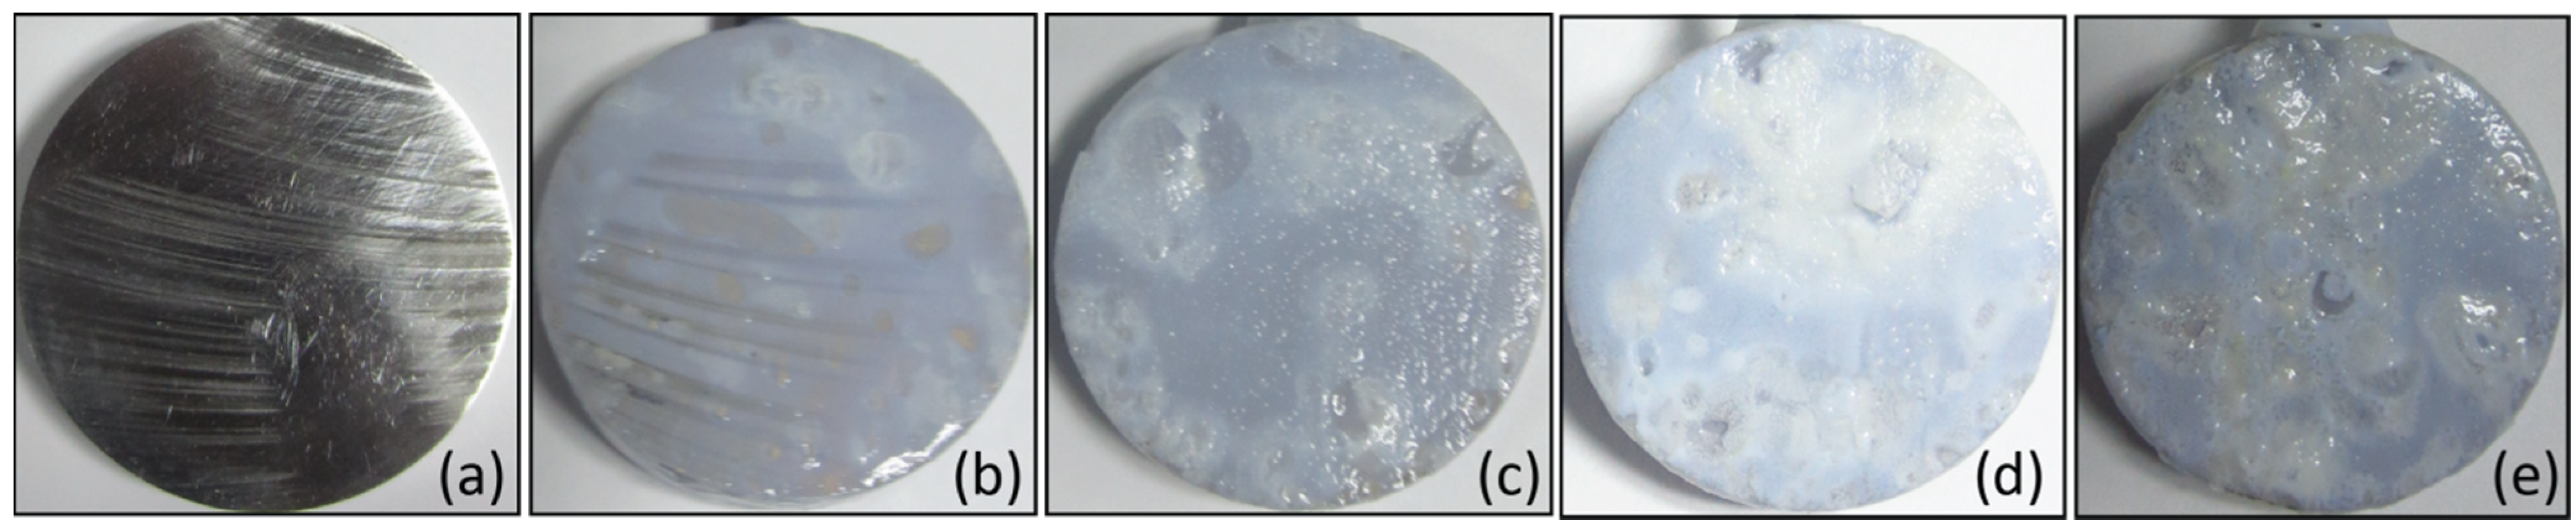
3.1. Visual Observations

Photographs showing the development of a calcareous coating is presented in Figure 4. The whitening of the specimen surface in synthetic seawater was evident within the first few hours. The specimens tested in the 3.5% w/v NaCl showed no signs of corrosion products or deposits, the CP was effective.
The coating had a gel-like consistency on the removed samples at both 100 h and 170 h as reported by others [19], but on the later samples were denser. After 100 h the samples had developed noticeable blisters on the surface of the coating from possible hydrogen egress and small amounts of deposit were evident on the bottom of the tank. Small amounts of deposit continued to be shed consistently throughout the remainder of the experiment.
Figure 4. Specimens on removal from the synthetic seawater. (a) Reference (before testing); (b) 100 h; (c) 170 h; (d) 360 h; (e) 530 h.
Coatings 05 00816 g004

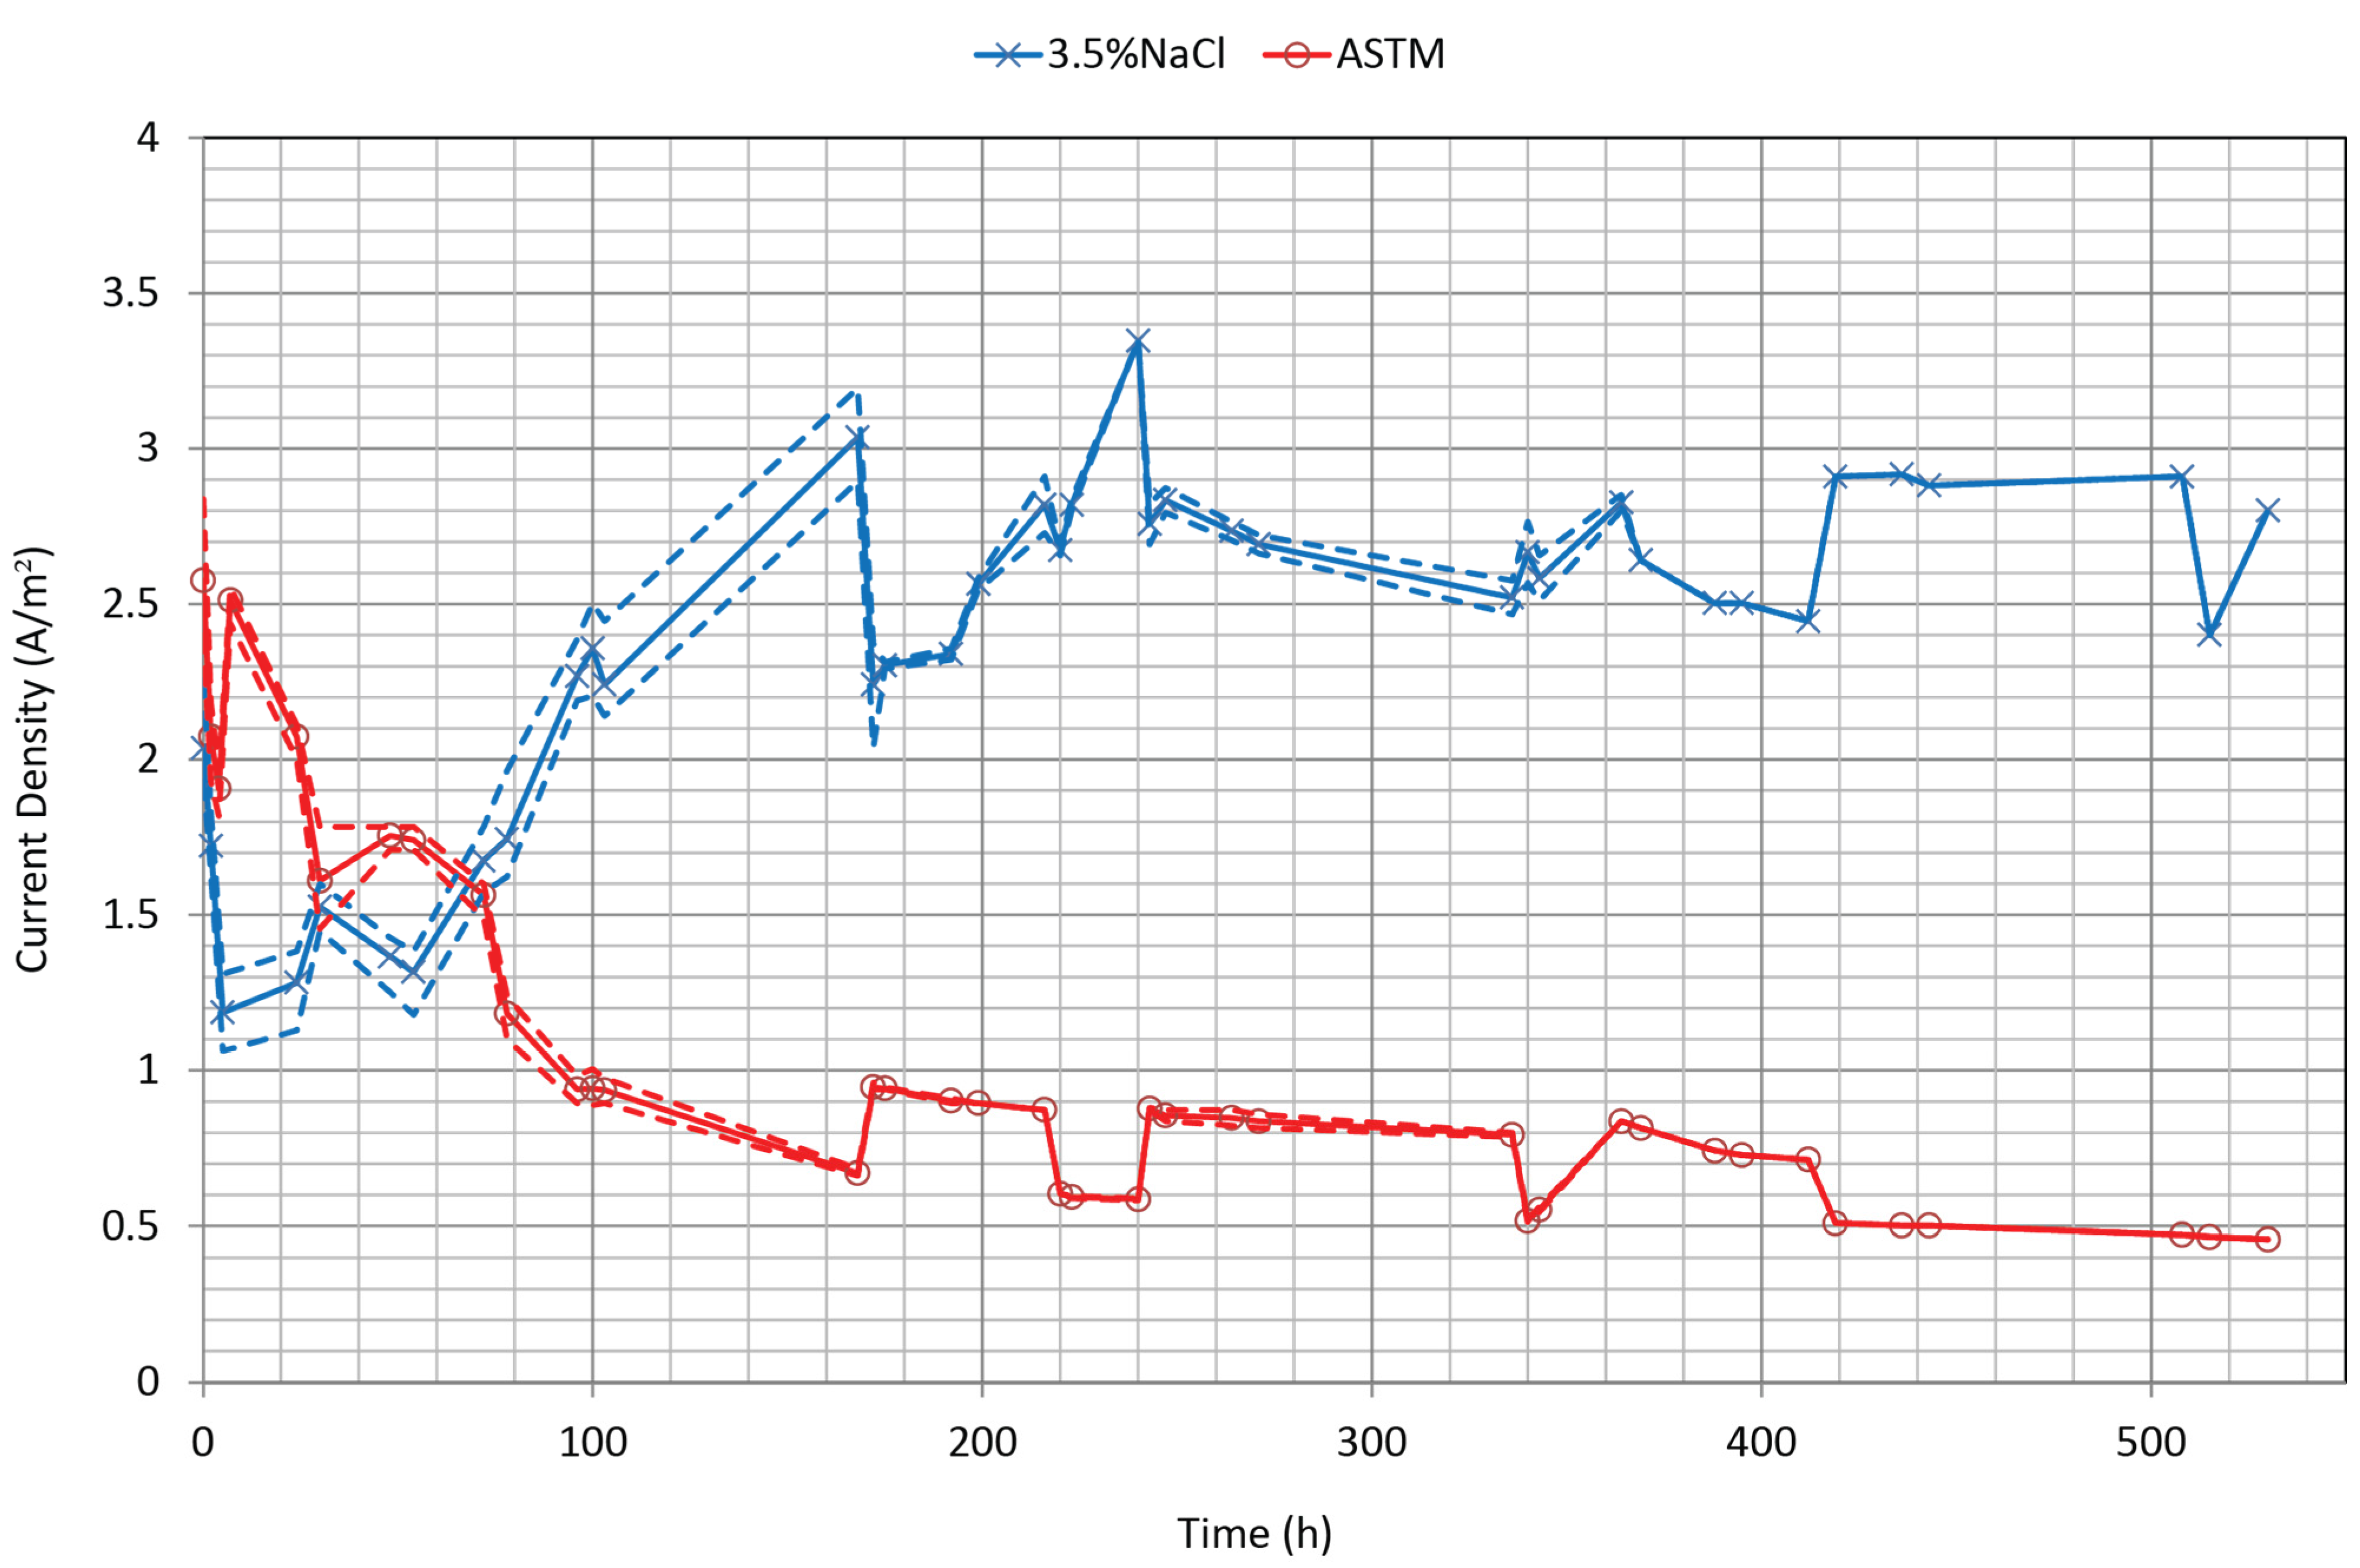
3.2. Current Density

Figure 5 shows the current density decay over the experiment as the coating developed. From approximately 70 h the current density for the synthetic seawater is lower than the 3.5% w/v NaCl solution. After the initial 100 h less than 25% of the current required to polarize the steel in 3.5% w/v NaCl was required to polarize in the synthetic seawater due to the deposition of the calcareous coating. The current density decay over the experiment for this coating is comparable with previous findings for a mixed Mg(OH)2 and CaCO3 deposit [9,33].

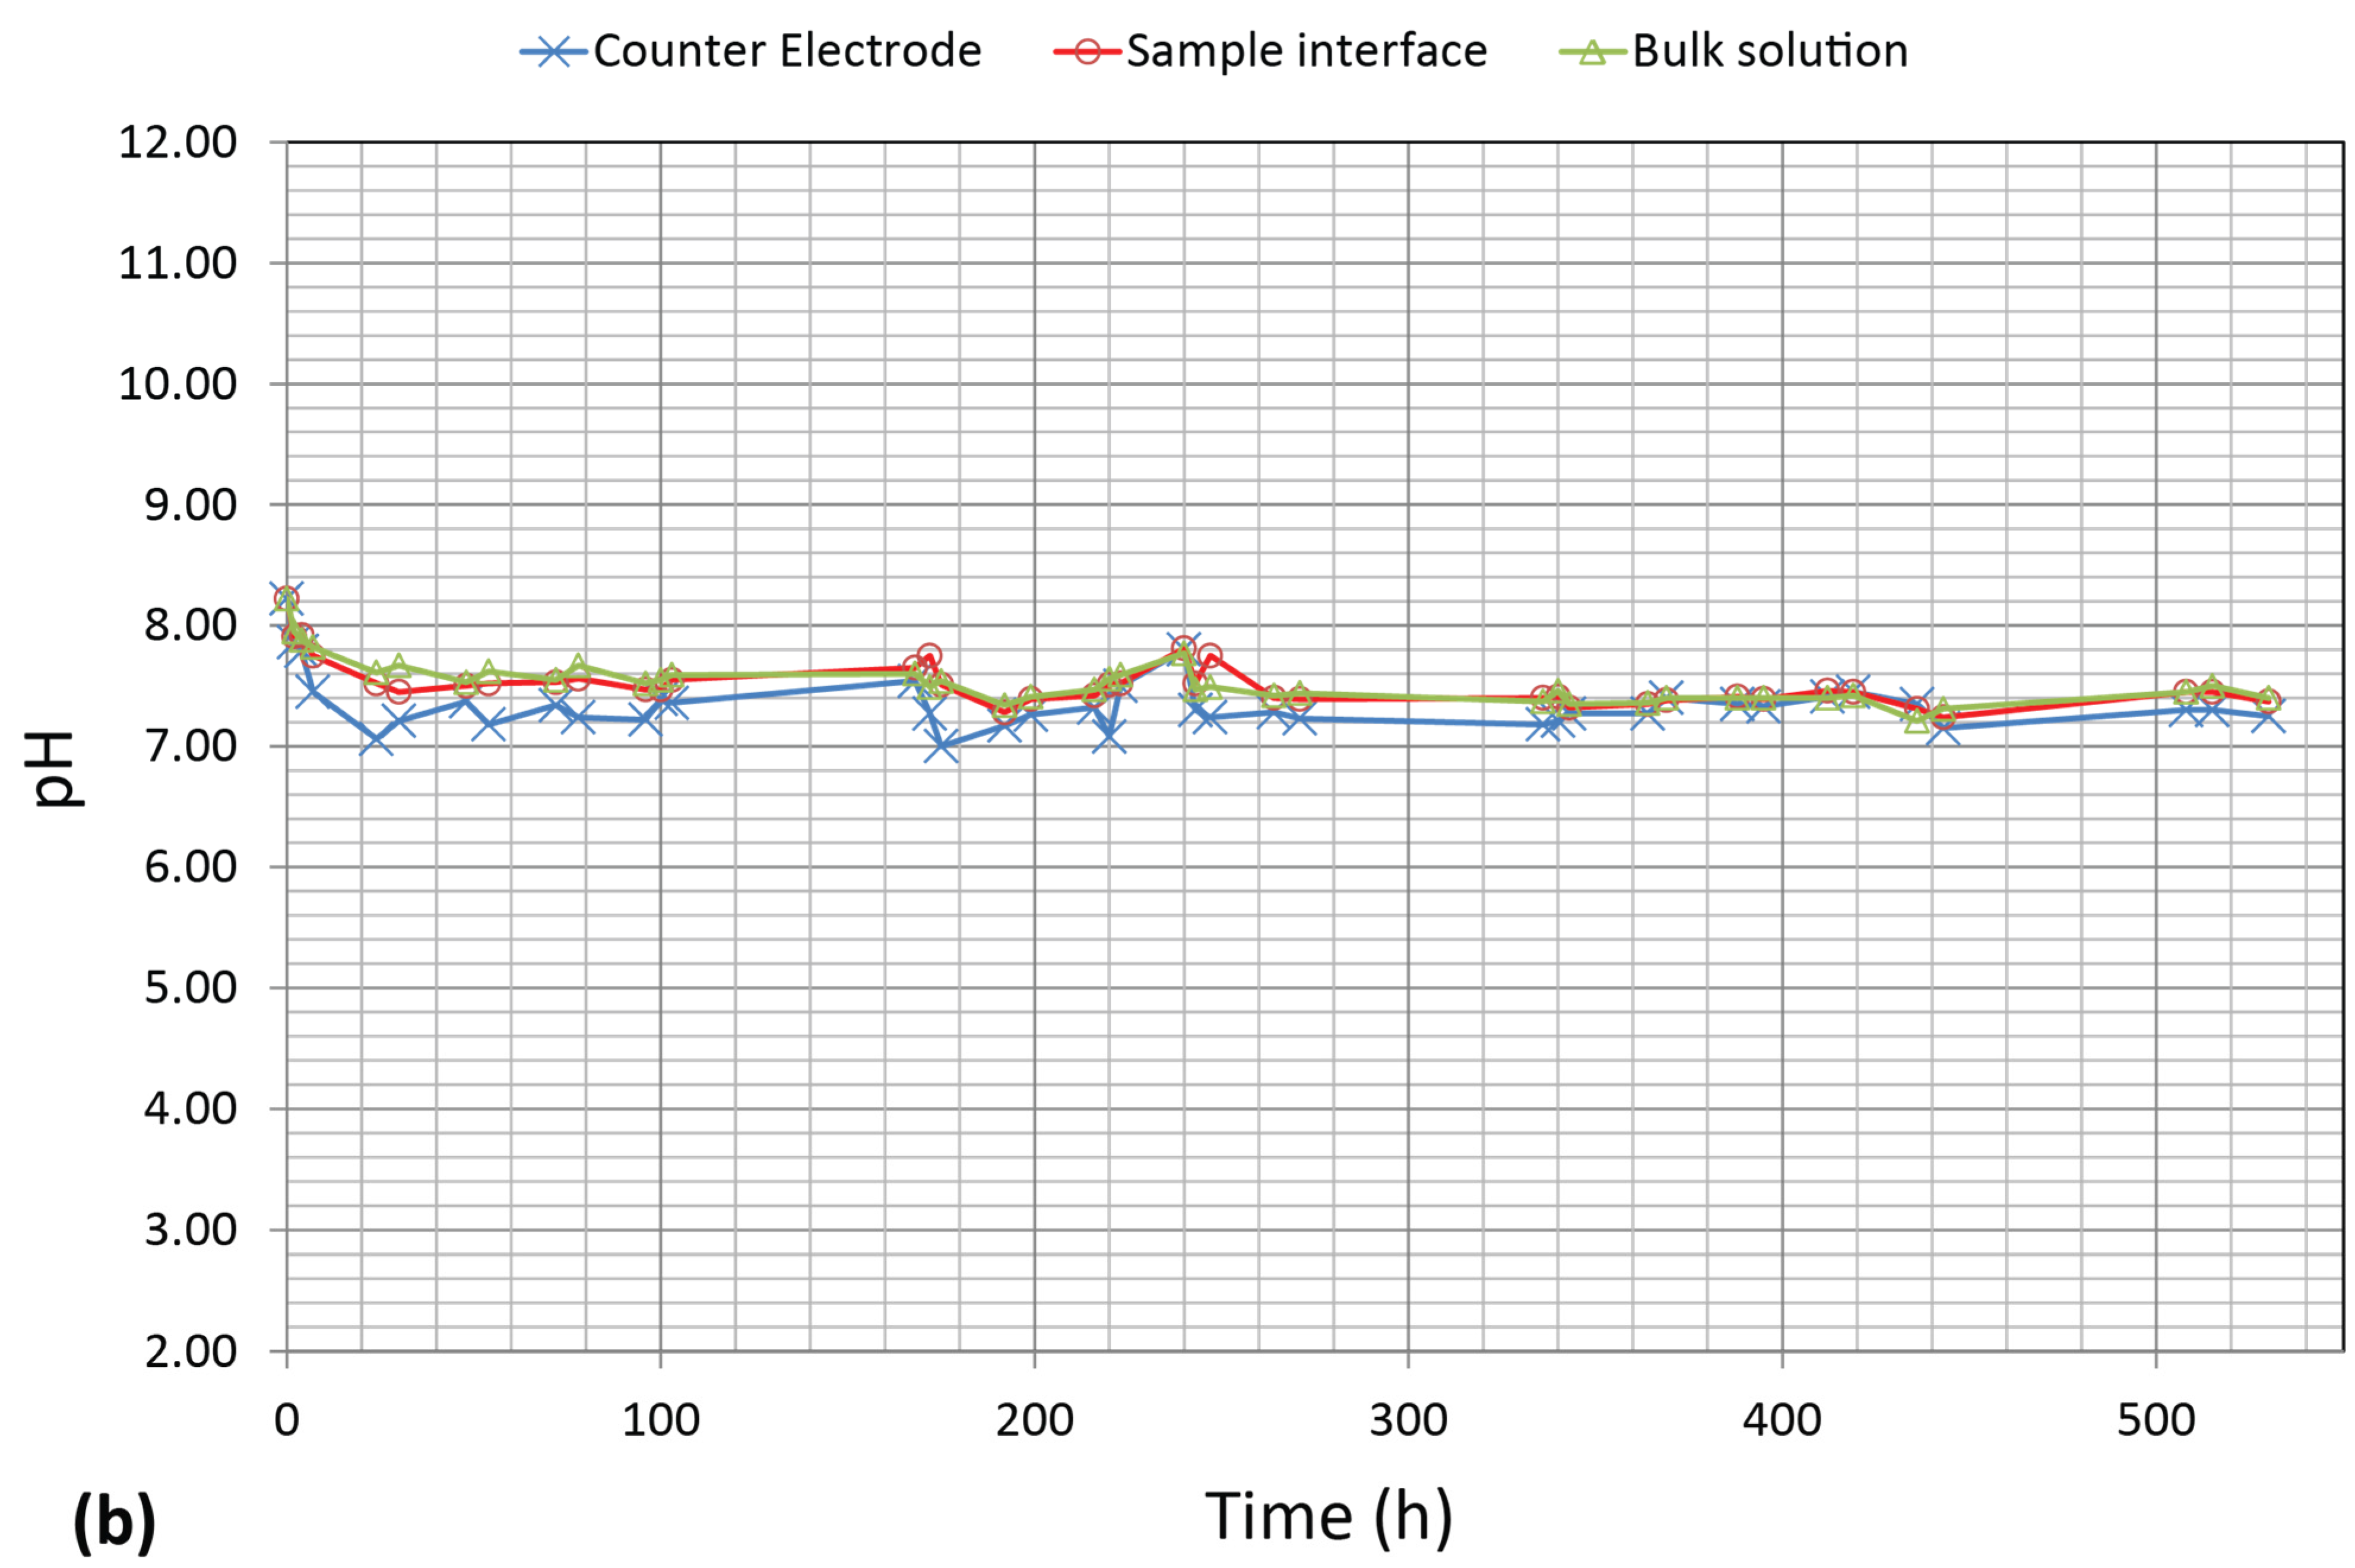
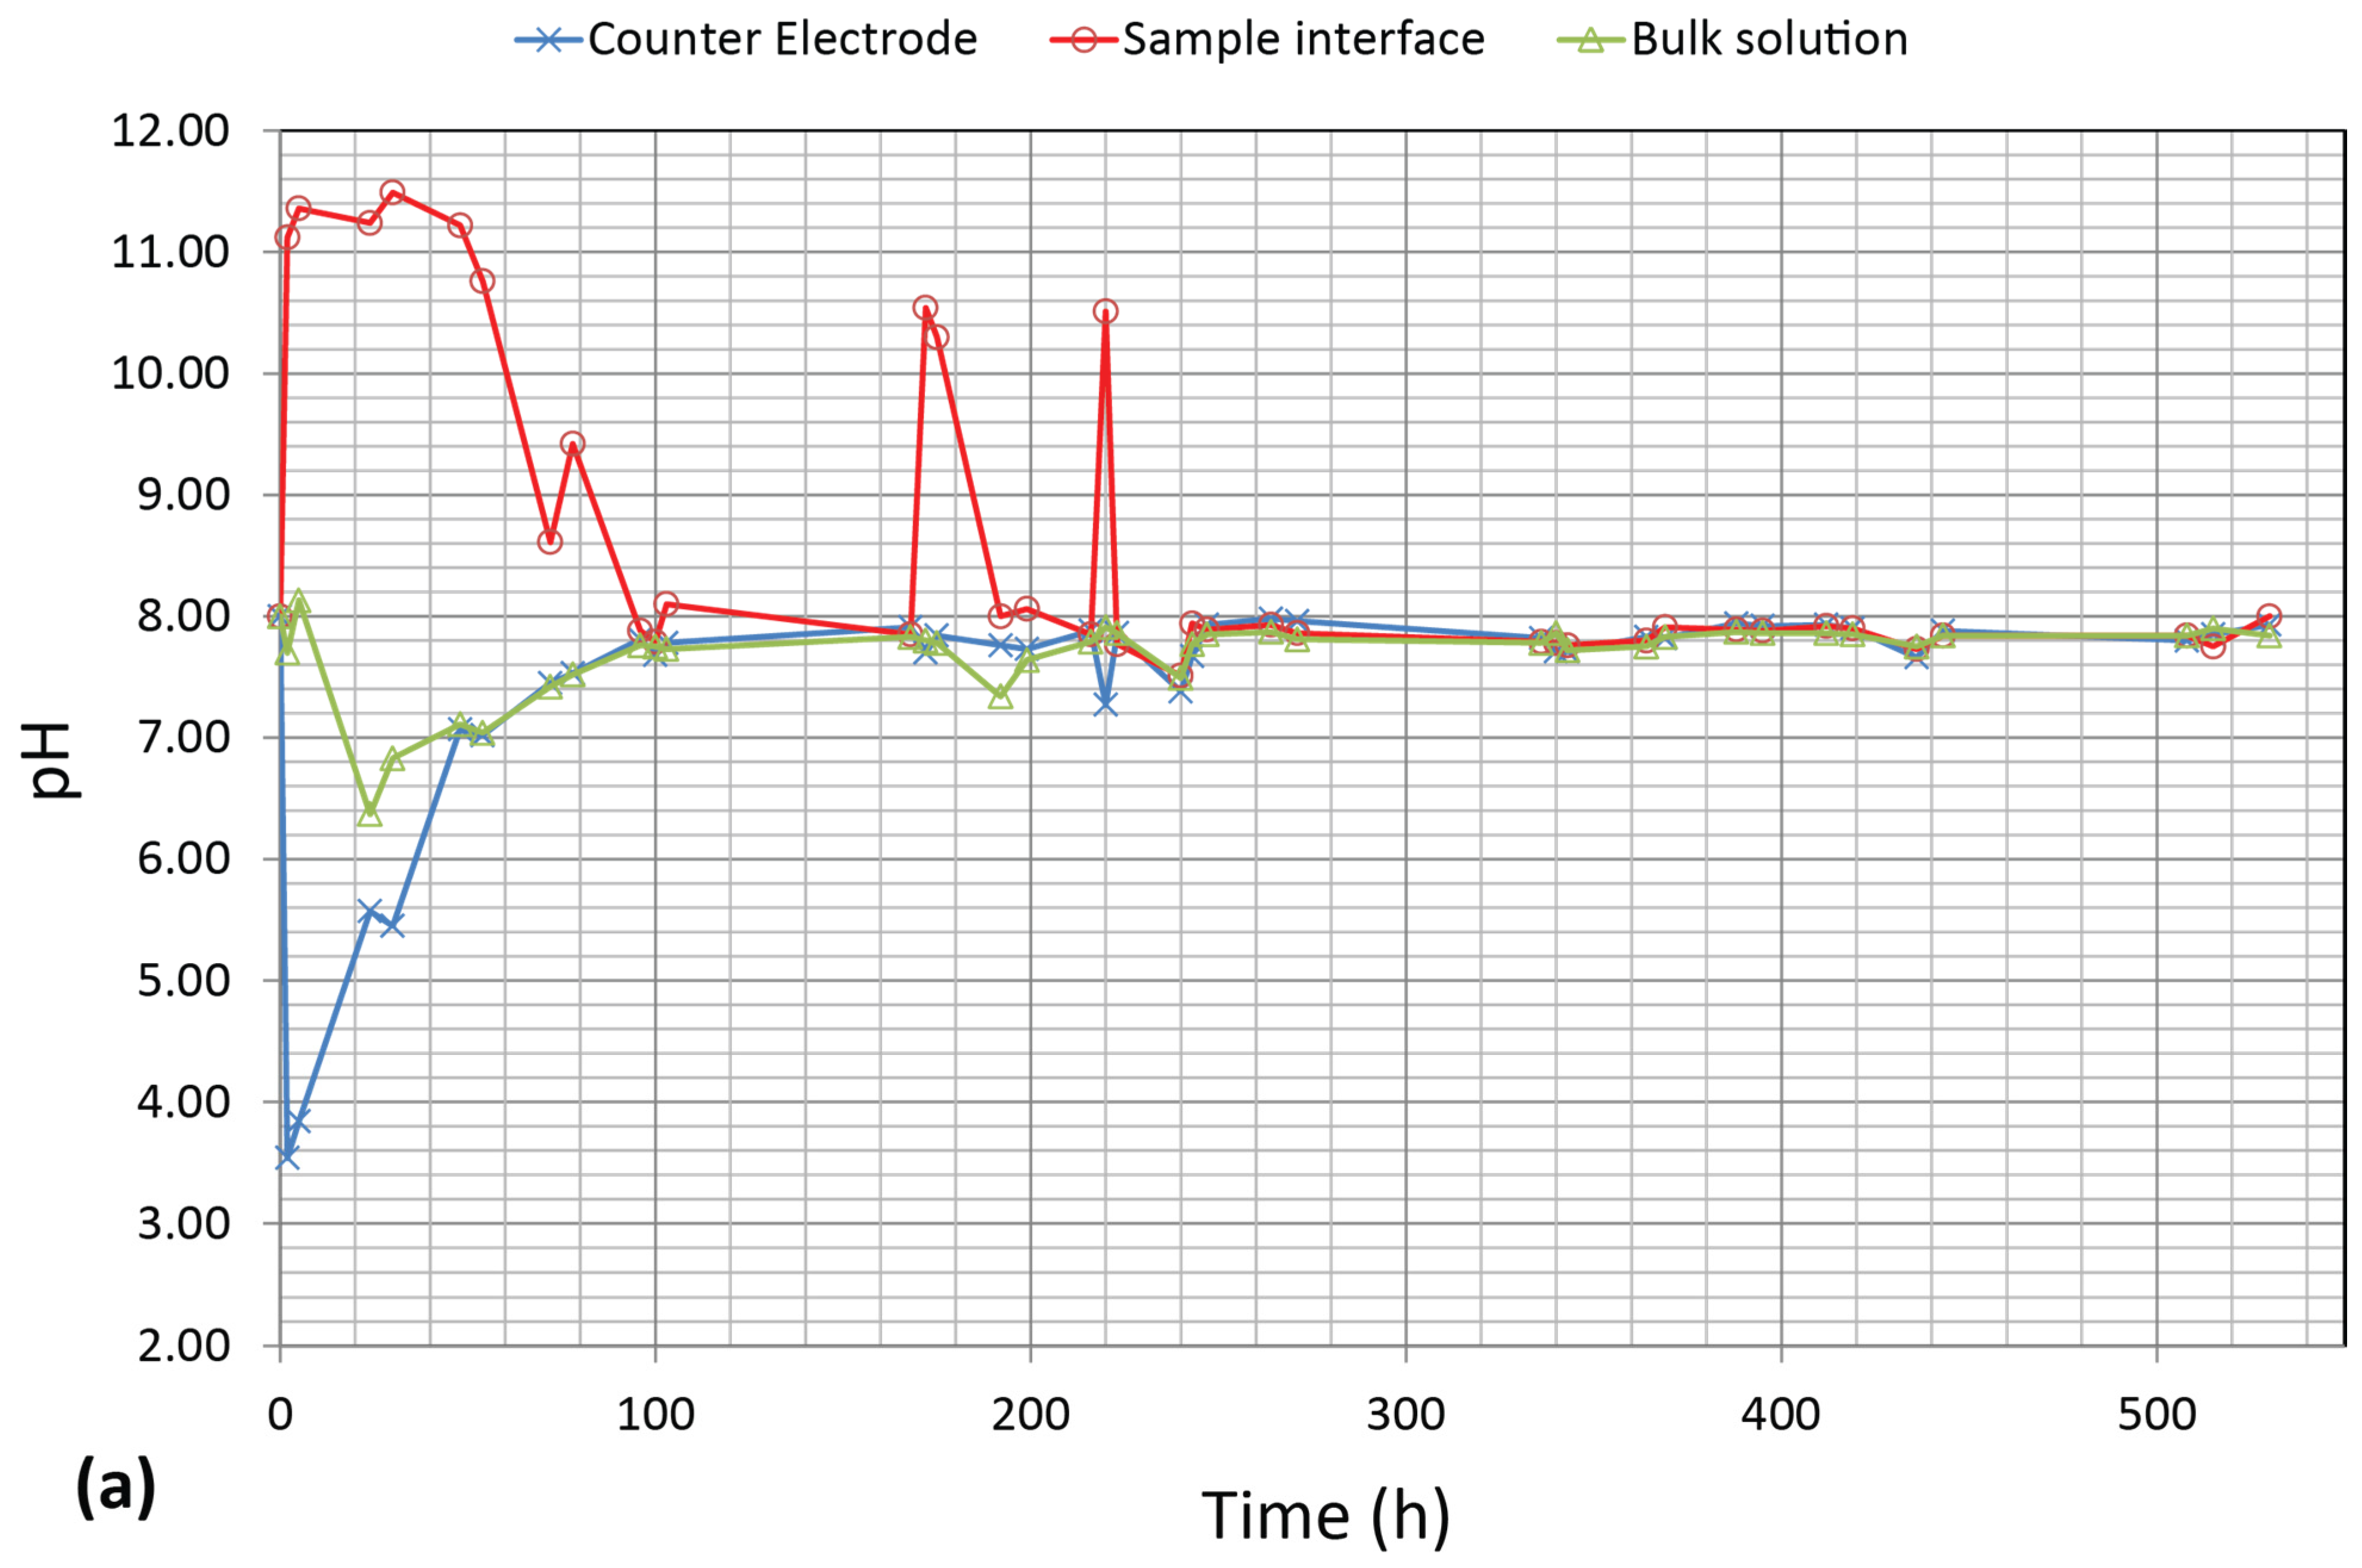
3.3. pH Measurements
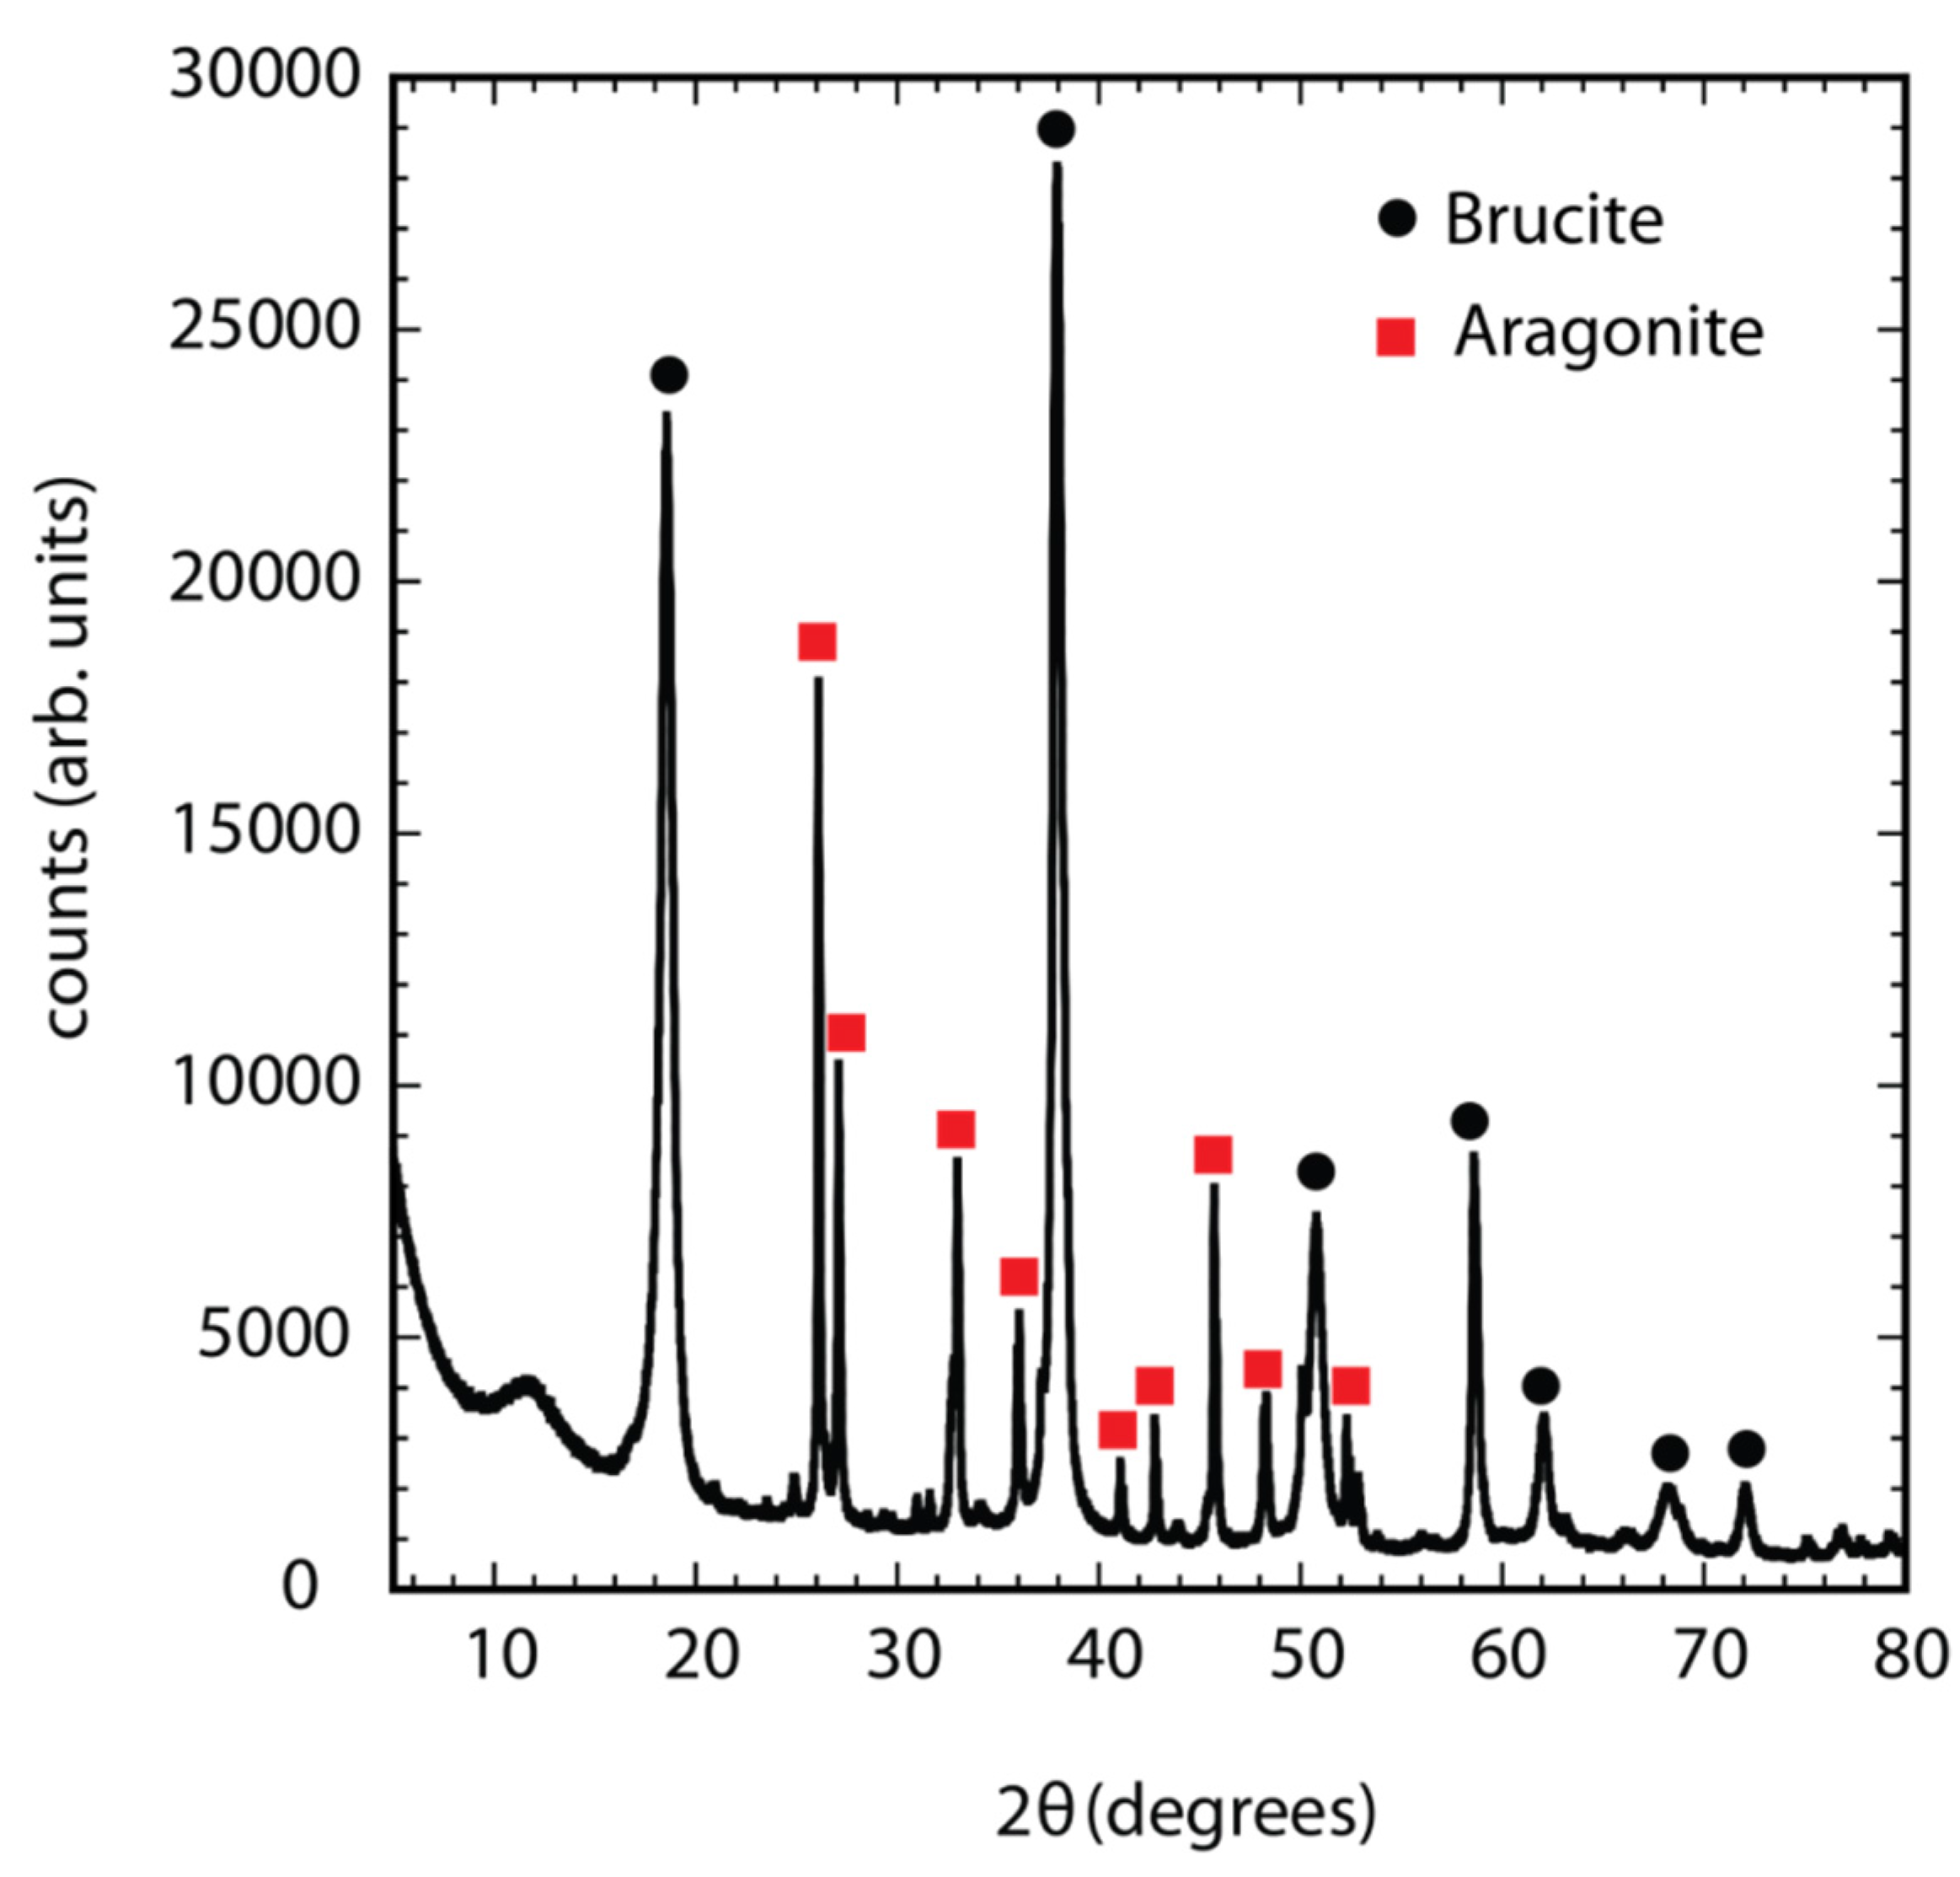
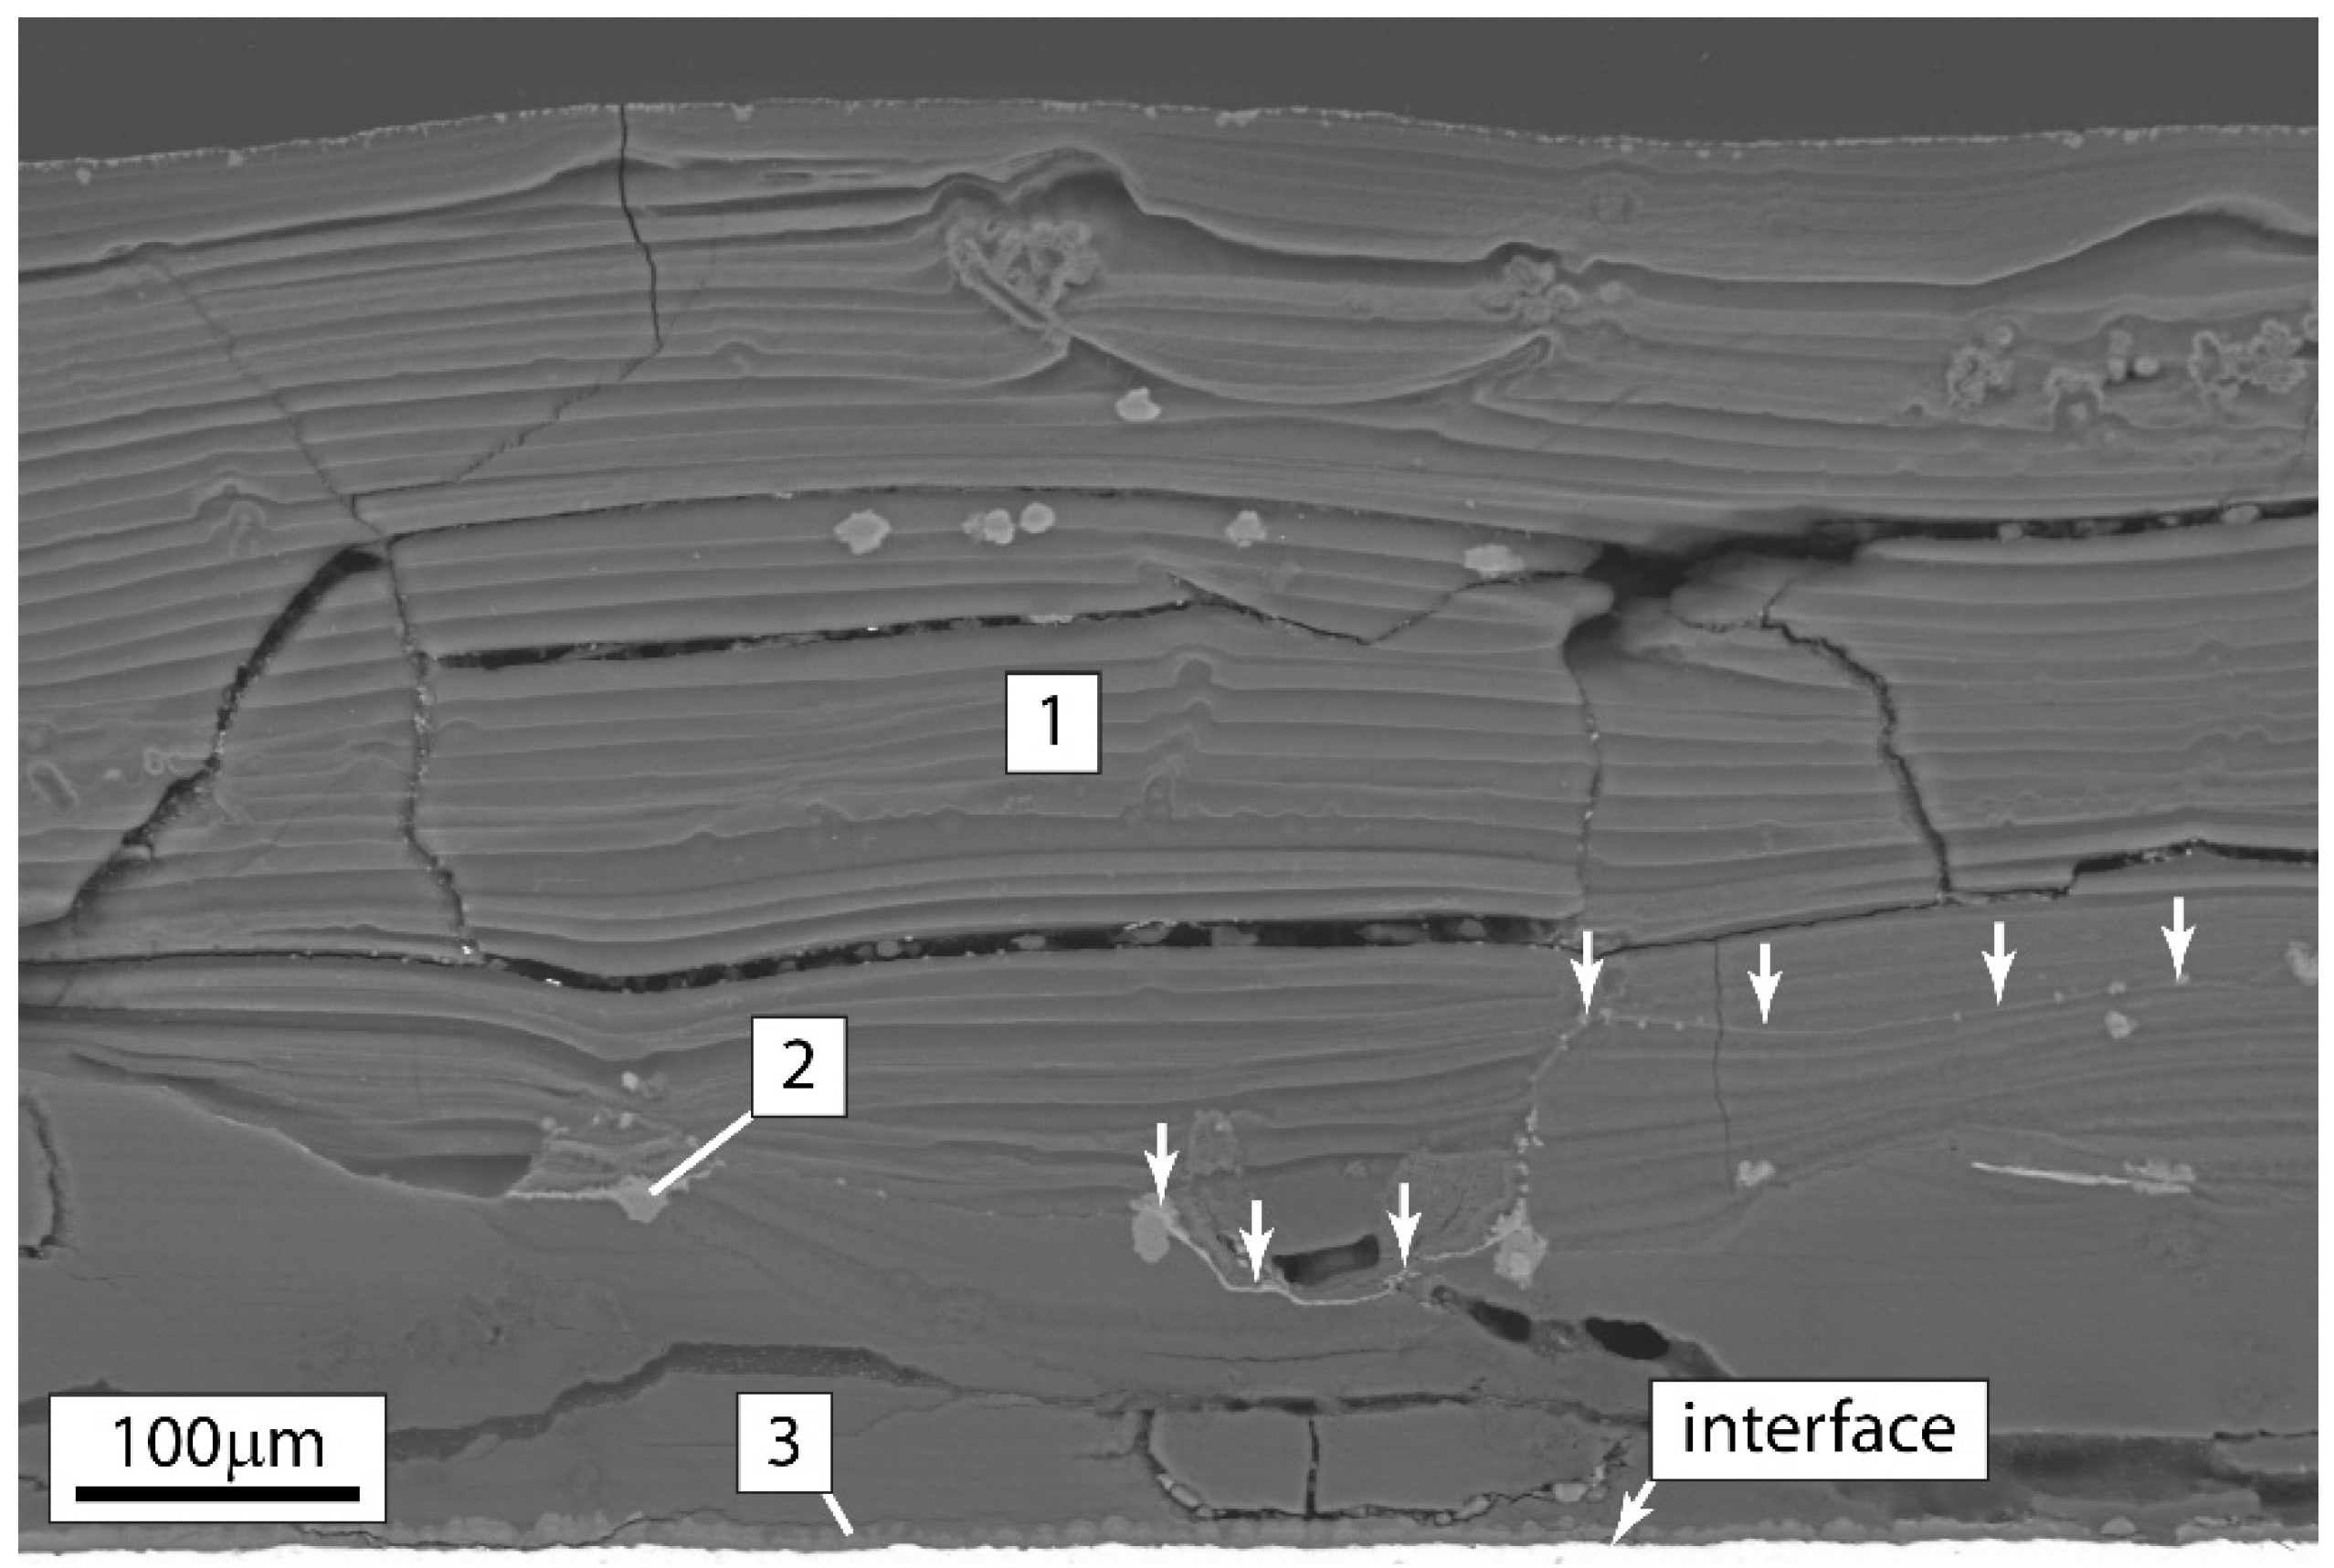
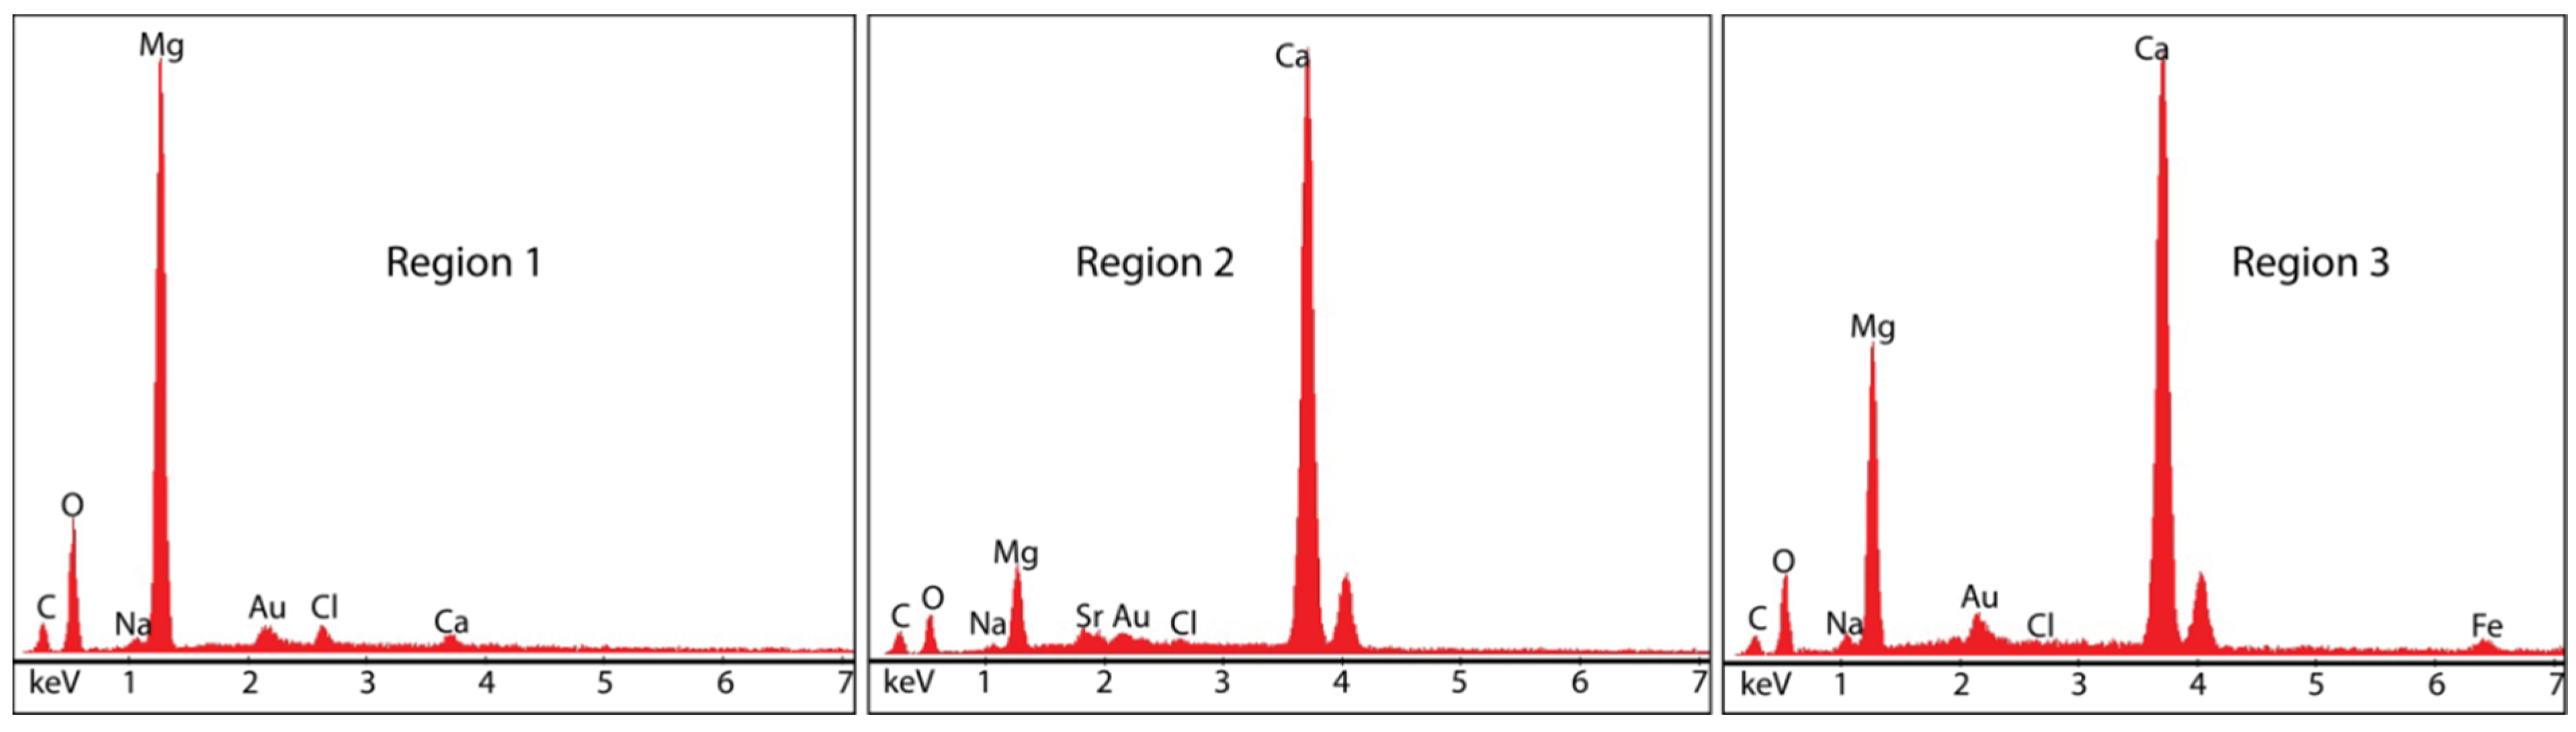
Figure 6a,b show pH measurements for the two solutions 3.5% w/v NaCl and synthetic seawater. For each solution the pH was measured at the counter electrode, sample interface, and bulk solution and are plotted over the time of the experiment.
The divergence of the pH values in the 3.5% w/v NaCl solution at the start reflects the cathodic and anodic reactions. The spikes in the pH at the sample interface are due to the solutions being topped up with deionized water with the turbulence and available oxygen, but this effect diminishes over time. In the synthetic seawater this does not occur due to the formation of the coating and the pH remains fairly constant throughout, given there is no temperature adjustment.
Figure 5. Average sample current density (dashed min and max).
Coatings 05 00816 g005
Figure 6. pH plots for (a) 3.5% w/v NaCl and (b) ASTM D1141 synthetic seawater.
Coatings 05 00816 g006aCoatings 05 00816 g006b

3.4. Composition

From XRD the composition of the deposit after 530 h exposure in synthetic seawater (sample RS1) was predominantly brucite (Mg(OH)2) with aragonite and very little calcite (CaCO3), Figure 7. This composition is in agreement with general trends of others [5,15] the more quiescent the conditions the higher the potential required to get a predominantly Ca containing coating. The amount of brucite is, however, more than expected at this potential. This is without the pH required for the deposition of Mg(OH)2 > 9.3 being evident throughout the experiment in the synthetic seawater though Elbiek et al. [2] suggests the pH can be one or two units higher at very near the surface distances (0.1 mm). There is clearly a supply of Mg2+ ions from the synthetic seawater and the OH ions are immediately used to form the Mg(OH)2 coating without any increase in the pH away from the sample surface.
A coating formed on carbon steel after 21 days at −1.1 V (SCE) in synthetic seawater and then an additional seven days at −1.2 V (SCE) using the same equipment and layout was cross-sectioned for further analysis. Scanning electron microscope (SEM) and energy dispersive X-ray spectroscopy (EDX) were used to examine the structure and composition of the coating throughout the growth. Figure 8 shows a SEM image through the coating.
Figure 7. X-ray diffraction pattern.
Coatings 05 00816 g007
Figure 8. SEM image of the coating on carbon steel.
Coatings 05 00816 g008
The image clearly shows the fine layers of the brucite coating (region 1 in Figure 8) above the fine deposit indicated by the arrows (Figure 8). This is possibly where the transition in composition is triggered to change to CaCO3 but clearly not under these conditions or where the potential was increased after 21 days, but that would indicate a significant increase in growth of the coating afterwards. There is also a well-defined layer at the metal surface (region 3 in Figure 8). The composition from the EDX at the indicated locations is presented in Figure 9. The layers (region 1 in Figure 8) are clearly Mg-rich with the lighter contrast areas (region 2 in Figure 8) and Ca-rich with the fine layer at the metal surface a combination containing both Ca and Mg. The coating consists of a fine layer of a mixture of Ca and Mg, followed by a predominantly brucite coating; this is contrary to others findings of the two layer structure of a fine brucite layer followed by CaCO3 [7,14,16,17,19,20,21].
Figure 9. EDX analysis at the locations in Figure 8.
Coatings 05 00816 g009

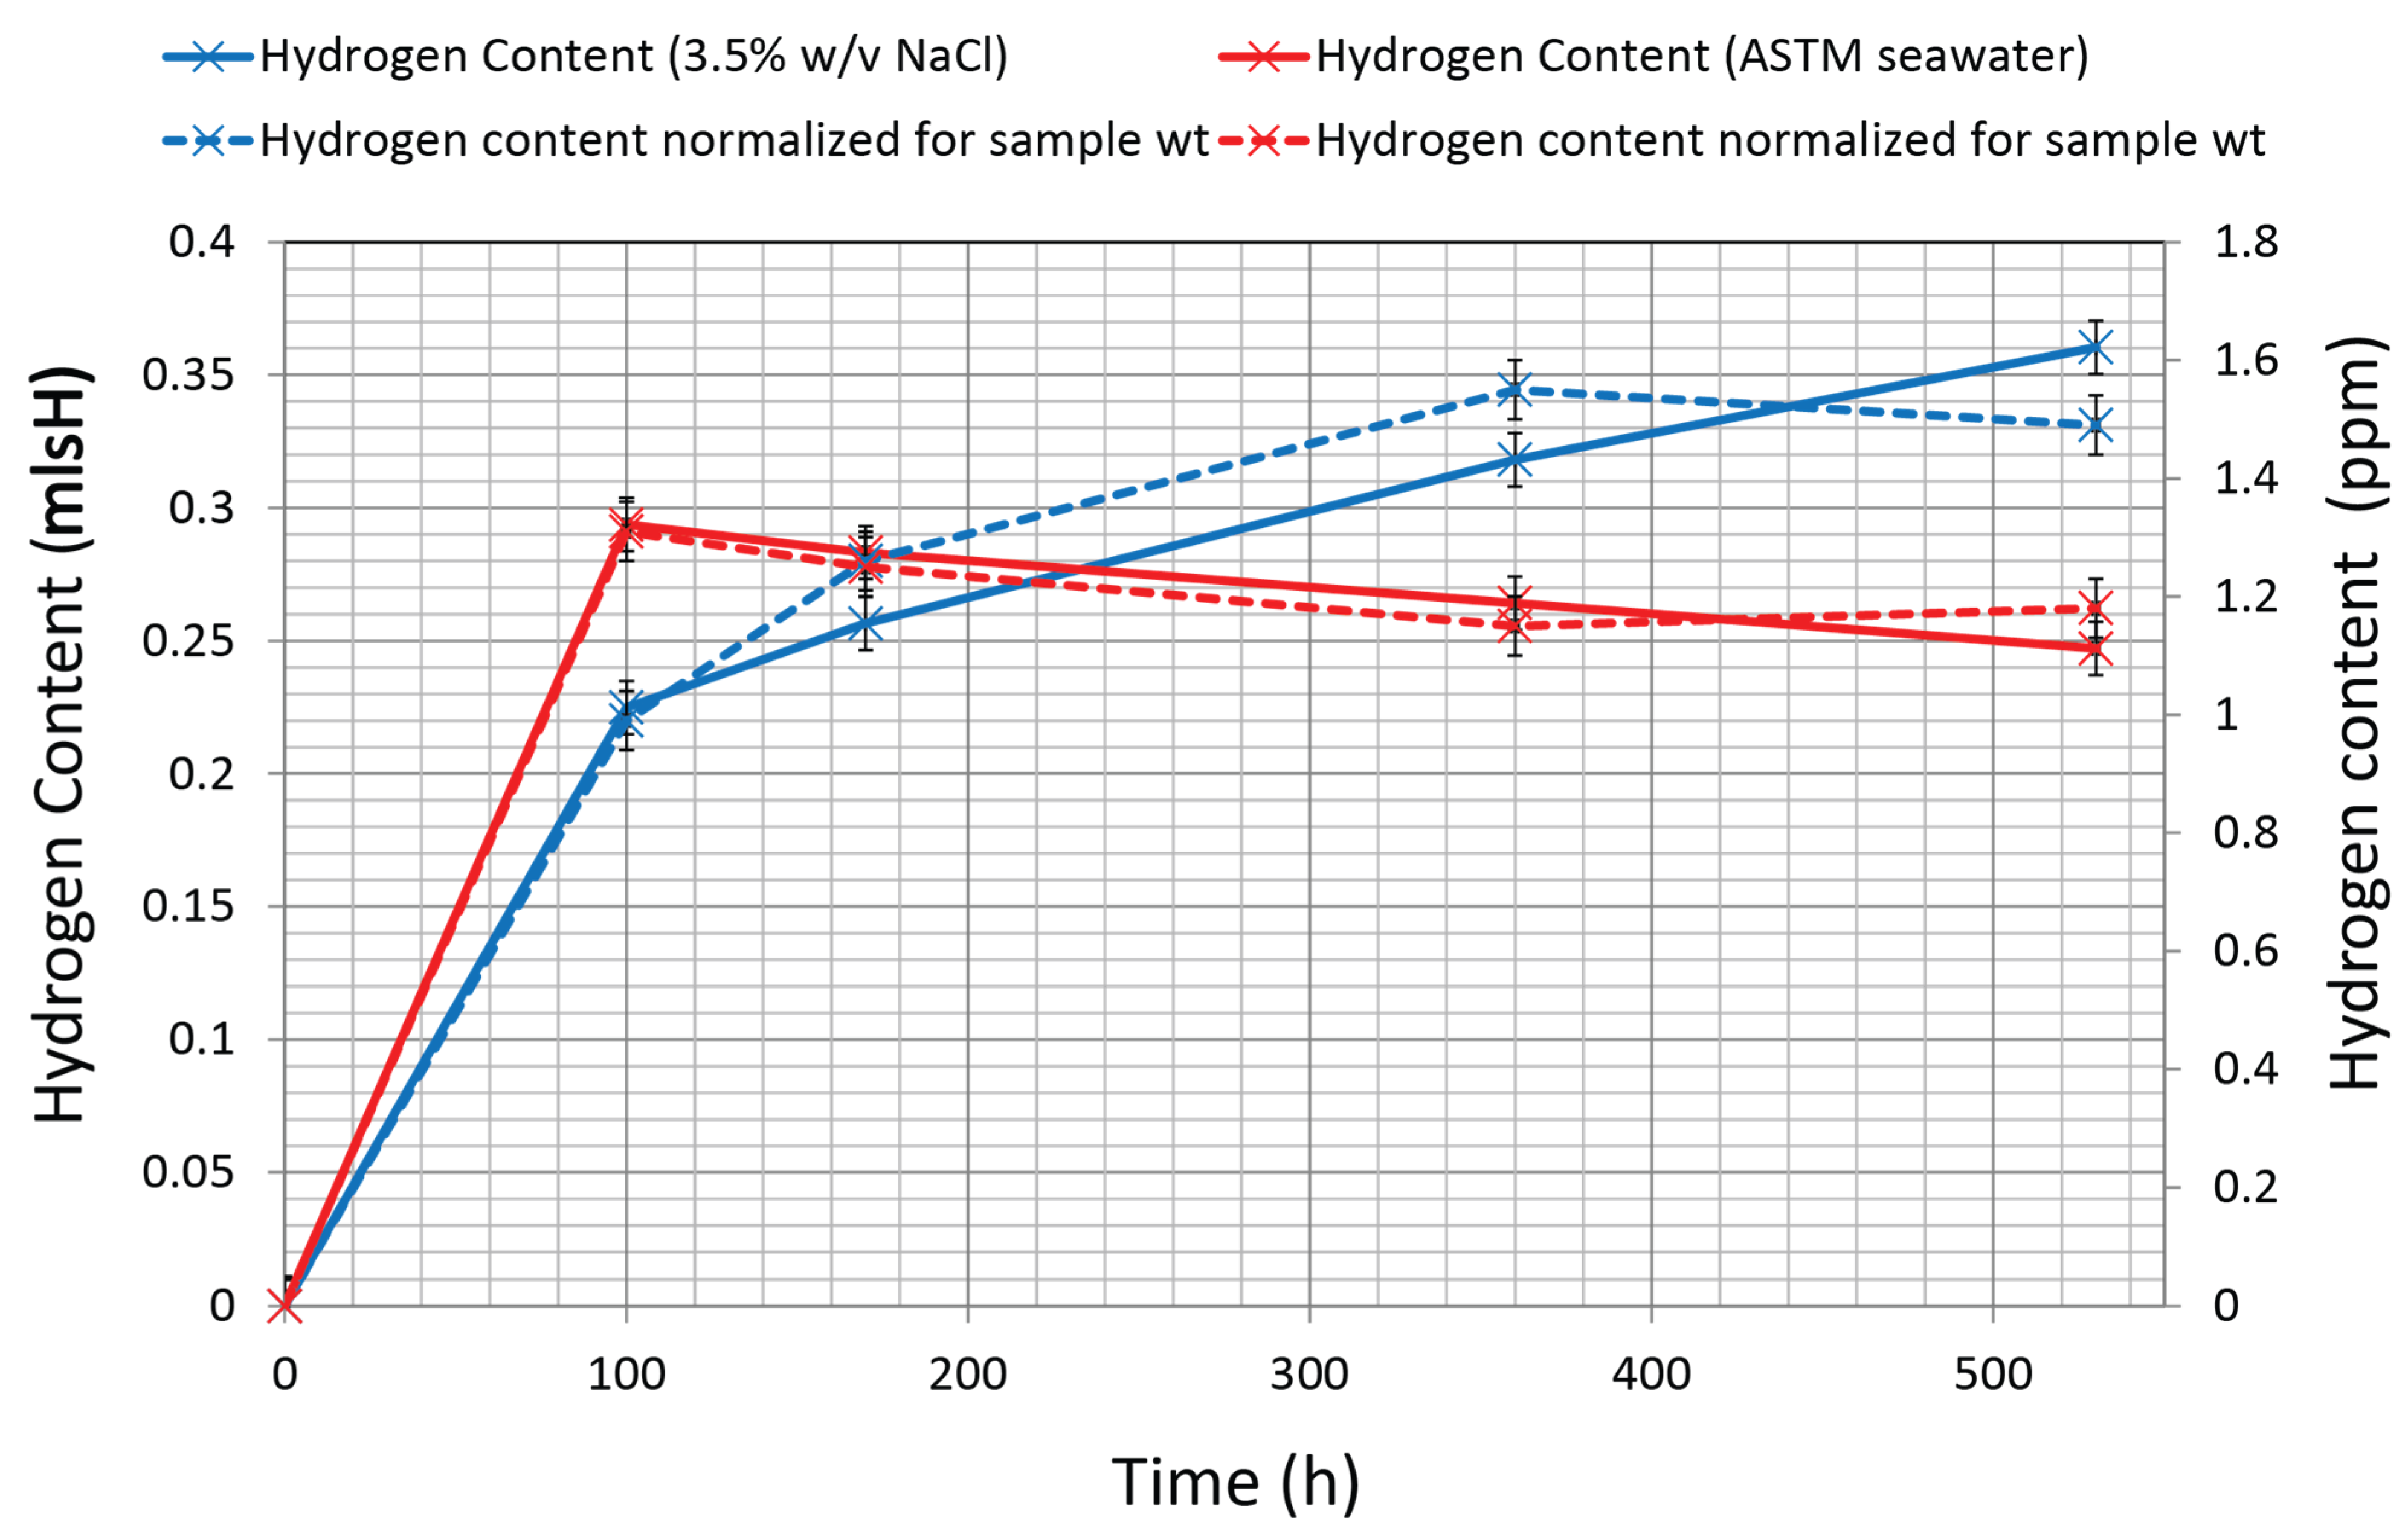
3.5. Hydrogen Content

The levels of diffusible hydrogen recorded are listed in Table 2 and plotted in Figure 10. The reference sample contained <0.1 ppm. It was felt the residual hydrogen levels measured after 100 and 170 h (<0.1 ppm) were insignificant and the tests were discontinued. The results are from a limited number of samples and, hence, treated with some caution before drawing any broad conclusions. The minimum measurable hydrogen concentration by the analyser is 0.05 ppm (dependent on the sample weight) with an accuracy of ±0.05 ppm. Both the measured hydrogen level and the normalized level for sample weight are included.
The apparent reduction in hydrogen content for the samples in synthetic seawater cannot be explained and it is thought likely due to experimental error. The hydrogen levels in the 3.5% w/v NaCl solution does, however, follow an expected trend suggesting saturation is not achieved within the 530 hours of the test.
Table 2. Diffusible hydrogen content.
Time Exposure (h)Sample IDWeight (g)Diffusible Hydrogen Content (mlsH)Diffusible Hydrogen Content Normalized by wt (ppm)
3.5% w/v NaCl solution
100RN420.28070.22490.99
170RN318.17760.25651.26
360RN218.32460.31811.55
530RN121.59520.36041.49
ASTM synthetic seawater
100RS420.01660.29371.31
170RS320.22860.28321.25
360RS220.51580.26421.15
530RS118.69830.24711.18
Figure 10. Diffusible hydrogen content.
Coatings 05 00816 g010
With this in mind, however, it does appear that the hydrogen ingress takes place before the measurements were started at 100 h with the deposit coated samples. It appears the deposit prevents further ingress from the early stages, by the time the current density is reduced the hydrogen has already been taken up and the coating does not enhance the uptake of hydrogen. As mentioned in the introduction, it is generally thought that the deposit reduces the exposed surface at which the water reduction reaction can take place and, therefore, reduces the hydrogen ingress. These results indicate that there is a more definite halt, at least after 100 h.
The uncoated samples, however, continue to show hydrogen pick-up until >360 h when the actual level continues to rise, but when normalized for sample weight shows a levelling off. This indicates any delay in the formation of the coating will increase the hydrogen ingress in susceptible materials.

4. Conclusions

Hydrogen ingress was measured on samples under CP in solutions of 3.5% w/v NaCl and ASTM D1141 synthetic seawater to compare the effects of the calcareous coating.
  • A more conservative approach would be to pre-charge with hydrogen in 3.5% w/v NaCl solutions over the longer term.
  • The ingress of hydrogen takes place within the initial 100 h of CP when a coating is precipitated whilst it continues in uncoated samples for >360 h. The overall ingress of hydrogen is reduced when a predominantly brucite deposit is formed
  • A predominantly brucite layer with some aragonite and calcite deposit forms at −1.1 V (SCE) at 20 °C in quiescent conditions.
  • The coating formed consists of multiple layers of brucite interspersed with minor calcium carbonate deposits, and the initial fine layer formed is of mixed composition with slightly higher levels of Ca and Mg.
  • The current density requirements for the predominantly brucite deposit are comparable with those for a mixed deposit.
Further testing earlier in the deposition would indicate how the CP can be optimized to reduce hydrogen up-take.

Acknowledgments

The authors would like to thank TWI for funding the research, and Mike Bennett, Sheila Stevens and Sally Day for their technical assistance.

Author Contributions

Shiladitya Paul (S.P.) conceived the experiment, S.P. and Wayne R. Smith (W.R.S.) designed the experiment, W.R.S. conducted the experiment, analyzed the data and wrote the paper. S.P. reviewed the paper and made final corrections.

Conflicts of Interest

The authors declare no conflict of interest.

References

  1. Wyatt, B.S. Cathodic protection of offshore structures. Anti-Corros. Methods Mater. 1977, 24, 5–10. [Google Scholar] [CrossRef]
  2. Elbiek, E.; Tseung, A.C.C.; Mackay, A.L. The formation of calcareous deposits during the corrosion of mild steel in seawater. Corros. Sci. 1984, 26, 669–680. [Google Scholar] [CrossRef]
  3. Hilbertz, W.H. Electrodeposition of minerals in sea water: Experiments and applications. IEEE J. Ocean. Eng. 1979, 4, 94–113. [Google Scholar] [CrossRef]
  4. Barchiche, C.; Deslouis, C.; Festy, D.; Gil, O.; Refait, P.; Touzain, S.; Tribollet, B. Characterization of calcareous deposits in artificial seawater by impedance techniques—II. Deposit of CaCO3 in the presence of Mg(II). Electrochim. Acta 2003, 48, 1645–1654. [Google Scholar] [CrossRef]
  5. Cottis, R.A.; Tu, K. Controlling the Components of calcareous Deposit to Protect Steel Structures from ALWC with DC and Pulse Current. In Proceedings of the NACE Corrosion Conference, Atlanta, GA, USA, 22–26 March 2009.
  6. Yang, Y.; Scantlebury, J.D.; Koroleva, E.V. A study of calcareous deposits on cathodically protected mild steel in artificial seawater. Metals 2015, 5, 439–456. [Google Scholar] [CrossRef]
  7. Hartt, W.H.; Smith, S.W. Chemistry-Structure-Property Interrelayionships for Calcareous Deposits as Stand-alone Coatings; Center for Marine Materials, Office of Naval Research: Arlington, VA, USA, 1989. [Google Scholar]
  8. Bockris, J.O’M. Hydrogen. Materials 2011, 4, 2073–2091. [Google Scholar] [CrossRef]
  9. Wolfson, S.L.; Hartt, W.H. An initial investigation of calcareous deposits upon cathodic steel surfaces in sea water. Corrosion 1981, 37, 70–76. [Google Scholar] [CrossRef]
  10. Deslouis, C.; Festy, D.; Gil, O.; Maillot, V.; Touzain, S.; Tribollet, B. Characterization of calcareous deposits in artificial sea water by impedances techniques: 2-deposit of Mg(OH)2 without CaCO3. Electrochim. Acta 2000, 45, 1837–1845. [Google Scholar] [CrossRef]
  11. Akamine, K.; Kashiki, I. Corrosion protection of steel by calcareous electrodeposition in seawater: Part 1: Mechanism of electrodeposition. Eng. Rev. 2002, 36, 636–642. [Google Scholar]
  12. D1141–98 Standard Practice for the Preparation of Substitute Ocean Water; American Society for Testing and Materials (ASTM): West Conshohocken, PA, USA, 2013.
  13. Engell, H.J.; Forchhammer, P. The change of pH under a paint film due to cathodic protection. Corros. Sci. 1965, 5, 479–484. [Google Scholar] [CrossRef]
  14. Luo, J.S.; Lee, R.U.; Chen, T.Y.; Hartt, W.H.; Smith, S.W. Formation of calcareous deposits under different modes of cathodic polarization. Corrosion 1991, 47, 189–196. [Google Scholar] [CrossRef]
  15. Okstad, T.; Rannestad, O.; Johnsen, R.; Nisancioglu, K. Significance of hydrogen evolution during cathodic protection of carbon steel in seawater. Corrosion 2007, 63, 857–865. [Google Scholar] [CrossRef]
  16. Neville, A.; Morizot, A.P. Calcareous scales formed by cathodic protection—An assessment of characteristics and kinetics. J. Cryst. Growth 2002, 243, 490–502. [Google Scholar] [CrossRef]
  17. Kunjapur, M.M.; Hartt, W.H.; Smith, S.W. Influence of Temperature and Exposure Time upon Calcareous Deposits. Corrosion 1987, 43, 674–679. [Google Scholar] [CrossRef]
  18. Lin, S.; Dexter, S.C. Effects of temperature and magnesium ions on calcareous deposition. Corros. J. 1988, 44, 615–622. [Google Scholar] [CrossRef]
  19. Barchiche, C.; Deslouis, C.; Gil, O.; Refait, P.; Tribollet, B. Characterization of calcareous deposits by electrochemical methods: Role of sulphates, calcium concentration and temperature. Electrochim. Acta 2004, 49, 2833–2839. [Google Scholar] [CrossRef]
  20. Barchiche, C.; Deslouis, C.; Gil, O.; Joiret, S.; Refait, P.; Tribollet, B. Role of sulphate ions on the formation of calcareous deposits on steel in artificial seawater; the formation of Green Rust compounds during cathodic protection. Electrochim. Acta 2009, 54, 3580–3588. [Google Scholar] [CrossRef]
  21. Deslouis, C.; Festy, D.; Gil, O. Characterization of calcareous deposits in artificial seawater by impedance techniques—I. Deposit of CaCO3 in the absence of Mg(OH)2. Electrochim. Acta 1998, 43, 1891–1901. [Google Scholar] [CrossRef]
  22. Leeds, S.S.; Cottis, R.A. An Investigation into the Influence of Surface Films on the Mechanism of Cathodic Protection. In Proceedings of the NACE Corrosion Conference, San Diego, CA, USA, 12–16 March 2006.
  23. Fairhurst, D. Offshore cathodic protection. What we have learnt? J. Corros. Sci. Eng. 2003, 4, 1–17. [Google Scholar]
  24. Ju, C.P.; Don, J.; Rigsbee, J.M. A high voltage electron microscopy study of hydrogen-induced damage in a low alloy. Medium Carbon Steel Mater. Sci. Eng. 1986, 77, 115–123. [Google Scholar]
  25. Thomas, R.L.S.; Scully, J.R.; Gangloff, R.P. Internal hydrogen embrittlement of ultrahigh-strength AERMET 100 steel. Metall. Mater. Trans. A 2003, 34, 327–344. [Google Scholar]
  26. Gangloff, R.P. Hydrogen Assisted Cracking of High Strength Alloys. In Comprehensive Structural Integrity, Elsevier Science; Milne, I., Ritchie, R.O., Karihaloo, B.L., Eds.; Elsevier: Amsterdam, The Netherlands; Boston, MA, USA, 2003; Volume 6, p. 31. [Google Scholar]
  27. Murakami, Y.; Kanezaki, T.; Mine, Y. Hydrogen effect against hydrogen embrittlement. Metall. Mater. Trans. A 2010, 41, 2548–2562. [Google Scholar] [CrossRef]
  28. Hinds, G.; Turnbull, A. Technical note: Does calcareous scale formation on cathodically protected steel affect hydrogen uptake? Corrosion 2005, 61, 835–837. [Google Scholar] [CrossRef]
  29. Hartt, W.H. Discussion: Does calcareous scale formation on cathodically protected steel affect hydrogen uptake? Corrosion 2006, 62, 947–949. [Google Scholar] [CrossRef]
  30. Ou, K.C.; Wu, J.K. Effect of calcareous deposits formation on the hydrogen absorption of steel. Mater. Chem. Phys. 1997, 48, 52–55. [Google Scholar] [CrossRef]
  31. Olsen, S.; Hesjevik, S.M. Hydrogen Embrittlement from CP on Supermartensitic Stainless Steels—Recommendations for New Qualification Methods. In Proceedings of the NACE Corrosion Conference, New Orleans, LA, USA, March 2004.
  32. Offshore Mooring Chain; Offshore Standard DNV-OS-E302; Det Norske Veritas (DNV GL): Oslo, Norway, 2013.
  33. Hack, H.P.; Guanti, R.J. Effect of High Flow on Calcareous Deposits and Cathodic Protection Current Density; Research and Development Report, DTRC/SME-87/82; David Taylor Research Center: Bethesda, MD, USA, 1988. [Google Scholar]

