1. Introduction
The diffusional transformation of spinodal decomposition [
1,
2,
3,
4,
5,
6,
7,
8,
9,
10] proceeds by the growth of a periodic composition fluctuation as the α-phase matrix decomposes at temperatures within the spinodal into α' and αʺ phases, without a change in the crystal structure. The evolution continues of the linear Cahn-Hilliard model for spinodal decomposition. The effect of nonlinear relaxation dynamics [
11] is considered with respect to the interaction of phase boundaries and their motion. The case for multilayered structures is investigated wherein it can be modeled that the motion of an interface is affected by interactions with second nearest interfaces, leading towards the tendency of doubling the composition wavelength over time. Mossbauer measurements [
12] evidence the continued decomposition of Cu-Ni(Fe) at room temperature.
The relevance of lattice coherency effects are seen in material behaviors of Cu-Ni(Fe) alloys including mechanical and magnetic. Numerous spinodal decomposition studies use the processing of bulk alloys. Mechanical alloying [
13] provides a route to produce nanostructured powder precursors as well. The effect of coherency strains is evident in the yield strength [
14,
15] of age-hardened alloys where maximum strength was achieved for lower aging temperatures. An advantage of spinodal decomposition for mechanical hardening [
16] is that excellent dimensional stability can be maintained since no crystallographic changes take place. A giant magnetoresistance behavior was introduced [
17] by aging a bulk alloy through processing via spinodal decomposition with uniaxial deformation to produce local superlattice-type nanostructures. Coatings [
18] on low-carbon steels have been evaluated for improved corrosion behavior. In multilayered form, a more recent investigation [
19] of ferromagnetic nanostructured multilayers considers the effect of growth conditions to superparamagnetic contributions to magnetoresistance behavior that result from composition-rich regions.
This study considers the effects of strain energy from a one-dimensional modulation in nanolaminate structures on the kinetics of the spinodal decomposition process.
2. Background
The free energy f at a temperature Ti is considered for an alloy system composed of elements A and B. The compositions cα' and cαʺ indicate the lower and upper bounds, respectively, for the composition cB of element B within the miscibility gap. The local minima in the free energy curve, i.e., at f′ = ∂f/∂c = 0, provide the locus of points at temperatures Ti that form the miscibility gap.
The phase transformation process of spinodal decomposition [
1,
2,
3,
4,
5,
6,
7,
8,
9,
10] proceeds via uphill diffusion when the second-order derivative of the Helmholtz free energy
f with respect to composition
c is less than zero,
i.e.,
fʺ = ∂
2f/∂
c2 <0. The locus of points for those compositions at temperatures that are between the bounds defined by
fʺ = 0 is the chemical spinodal. There is no barrier for decomposition for temperatures within the spinodal
Ti <
Ts. Decomposition for one-dimensional diffusion is found [
20] where satellite reflections are observed about the Bragg peaks in X-ray diffraction patterns for a heat treated Cu-Ni-Fe alloy. An initial explanation considers an interfacial energy term [
1] between adjacent atomic planes. The additional consideration of a gradient energy term [
3,
4] provides the identification of a critical wavenumber β
c to the composition fluctuation where the wavenumber-dependent interdiffusivity
ĎB equals zero. The decomposition stops and decay occurs beyond a critical wavenumber,
i.e., β > β
c, where maximum growth occurs at a wavenumber β
m (classically, equal to β
c/
).
The presence of coherency effects [
5] from a strained lattice will further depress the transformation temperature of the chemical spinodal
Ts to a coherent spinodal
Ts*. The decrease of the spinodal temperature,
i.e.,
Ts –
Ts*, can be significant [
21] for some alloy systems such as Au-Ni with a large lattice misfit, whereas it is potentially smaller for bulk alloy systems such as Cu-Ni(Fe) that have a smaller misfit strain. Along with a composition gradient energy, the presence of interfaces provides a strain energy term that evidences maximum growth of a characteristic composition wavelength along elastically soft directions. Consequently, an applied stress [
8] during aging affects the evolving morphology of the composition fluctuation.
The linear theory of diffusion for spinodal decomposition [
1,
2,
3,
4,
5,
8,
21,
22,
23,
24] provides for the accommodation of energy associated with new evolving surfaces and interface strain for the composition fluctuations. The wavenumber dependent interdiffusivity
ĎB is linearly proportional to the square of the wavenumber β
2 where the amplification factor
R of growth to the composition wave equals −β
2·
ĎB. The values of β
c and β
m will change with the depression of the coherent spinodal temperature for the aging process.
The consideration of additional gradient-energy terms
Kμ as (e.g., from the effects of distant interface interactions) is used in a further modified formulation [
25] of diffusion. In concept, this allows for fitting a higher-order, non-quadratic relationship between the interdiffusivity
ĎB and wavenumber,
i.e., as can be directionally quantified using the dispersion relationship
B. This has been accomplished by simultaneous determination [
25,
26] of
Kμ and
Ď. However, uncertainty is introduced without direct use of the long-wavelength boundary condition.
A condition arises during decomposition that the presence of strain energy will always decrease the amplification factor R. The effect is to increase the magnitude of interdiffusivity ĎB outside the spinodal, but decrease its magnitude within the spinodal. This requires use of higher-order terms in a polynomial expansion that should meet the requirement for establishing an upper bound to the amplification factor variation with the dispersion relation and, consequently, a lower bound for the value of measured diffusion behavior.
The magnitude of the 2η2·Y (the elastic modulus Y) strain energy depends upon the accommodation of strain η within the crystal structure, and its variation with the dispersion relation. As the wavenumber, i.e., dispersion relation, decreases towards zero the strain through the nanolaminate structure will decay in magnitude. This represents the conditions for a bulk-diffusion couple. Maximum strain is often seen experimentally in metallic superlattices as Cu-Ni(Fe) at relatively small composition wavelengths of 2–3 nm that correspond with a decrease in wavenumber to 3–2 nm−1. Therefore, a variation in the 2η2·Y term with composition wavelength is anticipated.
3. Experimental Section
Nanolaminate structures consist of an alternating sequence of constituent components that form a composition fluctuation. Nanolaminate thin films of Cu
0.53/Ni
0.40Fe
0.07 are prepared [
26] by alternating the vapor flux between Cu and Ni-Fe sources onto a heated substrate. The deposition chamber is evacuated to a base pressure of 20 μPa (0.2 μTorr) with use of a liquid-nitrogen cooled Meissner trap. The source metals are >0.99995 pure and are thermally evaporated from 7 cm
3 crucibles at 0.1–1 nm·s
−1 evaporation rates to produce a 0.5–0.9 μm film thickness. The source-to-substrate separation of 30 cm enables thickness control with use of 6 MHz gold-coated quartz crystal microbalances to produce a coating composition to within ±1 at.%. The nanolaminates coatings are deposited onto 4 cm × 8 cm sheets of both cleaved mica and polished Si wafers (with the native oxide intact). A 20–40 nm thick buffer layer of pure Cu is deposited initially to introduce (111) film growth. The substrate is an oxygen-free Cu plate that is heated with a quartz lamp for a growth temperature of 350 ± 5 °C. The deposition process produces a dense columnar structure with a single habit plane of dense packed growth. The growth of (111) is typical for face-center-cubic metal alloys such as Cu-Ni(Fe). The alternating layers of Cu and Ni(Fe) grow epitaxial with one another.
The growth or decay in amplitude
Q of an A/B composition fluctuation with wavelength (λ
A/B) for layer pairs of components A and B is accomplished again [
26] using anneal treatments within a turbo-molecular pumped, quartz tube at temperatures of 320, 345, and 400 °C. Samples are annealed to reduce the amplitude of the composition fluctuation from which growth or decay of the composition wave is assessed. A series of X-ray diffraction patterns are taken in the θ/2θ mode, as shown in
Figure 1 and
Figure 2 using a Rigaku Miniflex II diffractometer (Rigaku Americas Corp., The Woodlands, TX, USA) equipped with a graphite monochromator. A monochromatic Cu
kα radiation is used to measure the amplitude and wavelength of the composition fluctuation where a 25 kV-10 mA current was applied to the Cu anode. For a sample rotation θ, the X-ray detector is rotated 2θ. Each increment Δ2θ of rotation is 0.02° with a 5–10 s dwell time. The integrated intensity of each reflection is computed from digitized X-ray reflectivity spectra using the diffraction peak de-convolution software provided with the Rigaku Miniflex II diffractometer. Satellite peaks (±) about the superlattice peak of the (111) Bragg reflection correspond with the short-range order for the composition modulation in the nanolaminate growth direction. A change in the satellite intensity (
I) will occur as the sample is annealed at time (
t) intervals that range from 20 to 1000 min. The calculation of the composition profile is made wherein the satellite peak intensity
I± is proportional with the wave amplitude. Homogenization of the structure and decay in the composition wave amplitude result for anneal treatments above the spinodal temperature, whereas growth occurs within the chemical spinodal.
4. Method of Analysis
A review is presented of the formulations [
1,
2,
3,
4,
5,
6,
7,
8,
9,
10] for spinodal decomposition that relate to use of the X-ray diffraction method for experimental measurement [
21,
22,
23,
24,
25,
26,
27,
28,
29,
30,
31,
32,
33,
34] of the time-temperature dependent changes in the composition wave. In particular, reference to formulations and the equations are shown which comprise the basis to compute the higher-order gradient energy coefficients, the diffusion coefficients, and the strain energy variation with nanolaminate spacing. The Background contains equations [
25,
26,
27,
28,
32,
33] that are now adapted for analysis of spinodal decomposition in the Cu-Ni(Fe) alloy system, and as modified to determine strain energy effects in the Current Approach.
4.1. Modified Diffusion Formulation
The stability of a nanolaminate interface with respect to diffusion along the A/B fluctuation at time
t can be considered using the discrete theory in terms of a static concentration wave [
32]. The composition wavelength λ
A/B of the fluctuation between A-rich and B-rich regions,
i.e., layer pair spacing for nanostructures, is equated to the wavenumber β as 2π/λ
A/B. The microscopic theory of diffusion [
10,
25,
29] is used to quantify the interdiffusivity coefficient
ĎB of each nanolaminate as dependent on its composition wavelength at temperature
Ti. The macroscopic diffusion coefficient
Ď for the alloy system corresponds with an infinite composition wavelength. The relative decay in satellite intensity
I±(
t) for the composition fluctuation is normalized to the Bragg peak intensity, and this value is used to determine [
22,
23,
24,
25,
26,
33] the amplification factor
R as
The measured intensity
Im of the Bragg peak and satellite reflections are normalized to compute corrected values
Ic with respect to the 2θ peak positions. Details of the X-ray intensity formulations are provided in
Appendix. The amplification factor
R is related to the generalized
ĎB through the dispersion relationship
B2(β) according to the expression
The
B2(
h) expression [
32] derived for face-centered-cubic [100] or [111] growth is
The interplanar spacing is
d(hkl) and
h equals
d(hkl)/λ
A/B. The use of a curvilinear fit to the variation of
ĎB with
B2(
h) yields the value of
Ď at
B2(
h) = 0. That is, a nanolaminate with an infinite composition wavelength is the equivalent of a macroscopic diffusion couple. A generalized expression for
ĎB is presented in terms of its energetic components to account for potential nonlinear effects. The
Ď coefficient is related to
ĎB through [
25,
26] the Fourier transform
Fe(
h) of the elastic strain energy for the distorted lattice, the second derivative
fʺ of the Helmholtz free energy (per atom volume
Nv), and the gradient-energy coefficients
Kμ as
For a face-center cubic system,
Nv equals 4/
a3 for an alloy lattice parameter
a. The order of the polynomial is µ, and the diffusion coefficient
Ď is related [
21] to the mobility
M according to the expression
The
fʺ and
Kμ terms in Equation (4) are identical with expressions [
3,
4,
29,
30,
31,
32] that appear in both the continuous and discrete theories of spinodal decomposition. The expression for the diffusion coefficient used in Equation (5) includes only the Helmholtz free energy term
fʺ because the presence of strain energy is not a prerequisite, but it varies with each nanolaminate sample—An original criterion of the modified diffusion equation [
21] for spinodal decomposition. A direct series expansion of the
ĎB with
B2(
h) relationship is now used to fit the experimental data as
Accordingly, from Equations (5) and (6), the coefficients
K'
μ are used to compute the gradient energy coefficients
Kμ, where
K'
μ is now equal to 2
Kμ/
fʺ. Equation (6) will be used in this analysis to determine the diffusion coefficient
Ď, and finalize the values for both the
K'
μ and
Kμ gradient energy coefficients. The
B(
h) value is equal to β in the long wavelength approximation. The
Fe(
h) quantity is equated [
21] with strain energy and is, therefore, a function of
B(
h). The strain energy term equals 2η
2·
Y, where η is the compositionally dependent variation of strain that equals (1/
a)·(∂
a/∂
c), and
Y is the <
hkl> orientation-dependent biaxial modulus.
The diffusivity is zero at the coherent spinodal (
Ts*). From the linear theory using Equation (4) where only one gradient energy coefficient is considered, the following condition is found.
The gradient energy coefficient
K can be determined from Equation (7) with respect to the critical wavenumber where there is no growth or decay. Where the wavenumber
B equals zero,
i.e., for a macroscopic diffusion couple where the wavelength goes to infinity, Equation (7) reduces to
This relationship indicates that the
fʺ = 0 condition for the chemical spinodal is changed with a suppression to the condition of
fʺ = –2η
2·
Y for the coherent spinodal. From an experimental estimate of the chemical spinodal temperature
Ts, the value of
fʺ for any temperature can then be computed [
21] using Boltzmann’s constant
kB as
The amount that the coherent spinodal temperature is suppressed below the chemical spinodal, i.e., Ts – Ts*, can be determined using the Equation (8) equivalence where the temperature T is now equated as Ts*.
4.2. Current Approach
In order to uniquely determine the diffusion coefficient Ď and the unknown effect of strain energy on diffusion, the higher-order gradient-energy coefficients are now included in the expansion of the modified linear theory as seen in Equations (4) and (6). To reiterate, the suppression of the coherent spinodal described in Equations (7)–(9) will vary from sample to sample since the wavenumber-dependent Fourier transform Fe(h) of the elastic strain energy is equal to 2[η(h)]2·Y(h). Simulated curves are used to establish baseline behavior without inclusion of the strain energy term. This approach is taken since it has been well established for nanolaminate structures that both the strain η and modulus Y components can vary with the wavenumber, i.e., these are not constant values. In this approach, the difference between the measured data and simulated values will be used to quantify the effect of strain energy.
The value of the temperature-dependent diffusion coefficient
Ď, representative of diffusion behavior for the long-wavelength equivalent, has been
extrapolated previously [
25,
26,
27,
28] from the behavior of composition fluctuations with shorter wavelengths,
i.e., longer wavenumbers, by fitting the variation of the interdiffusion coefficient
ĎB with
B2. Without a known boundary condition, modeling of the gradient energy coefficient
K'
μ terms and the diffusion coefficient
Ď from the
ĎB variation with
B2 behavior has introduced some uncertainty. Since all diffusion coefficients are derived from the direct measurement of the amplification factor
R as seen in Equation (2), the computation of the gradient energy coefficients using the microscopic theory of diffusion will now be approached by, first, using the
R variation with
B rather than the
ĎB variation with
B2. The value of
R value approaches zero for the infinite wavelength case,
i.e.,
B = 0, providing a boundary condition that will be used in the interpolative analysis of data to follow.
The sign conventions are reviewed to distinguish the effects of the strain energy during diffusion. Growth of the composition fluctuation when T < Ts requires that the diffusivity is negative (ĎB < 0) for uphill diffusion, and the amplification factor is positive (R > 0). Similarly, decay of the composition fluctuation when T > Ts requires that the interdiffusivity is positive (ĎB > 0) for downhill diffusion, and the amplification factor is negative (R < 0). Accordingly, from Equations (2), (4) and (5), growth of the composition wave amplitude within the spinodal occurs when fʺ < 0 and K > 0, whereas decay outside the spinodal occurs when fʺ > 0 and K < 0.
For growth of the fluctuation, and to be consistent with the sign requirements of the model formulation reviewed in the Background, the variation of
R with
B is simulated using a new higher-order polynomial expansion,
From Equations (2) and (4), it follows that the difference Δ
R between the simulated value of the amplification factor
Rs and the experimental value
Re,
i.e., Δ
R =
Rs –
Re, will be positive for all temperatures and attributable as a sole consequence of strain energy. It has been shown [
21] that the strain energy accelerates diffusion outside the spinodal, but hinders it within the spinodal. So, the simulated variation of
R with
B must now envelope all experimental data as an upper bound. In addition, for decay it is already seen from Equation (10) that ∂
R/∂
B < 0 as evaluated at
B = 0, and for growth that ∂
R/∂
B > 0. These ∂
R/∂
B requirements guide the fitting procedure to determine the order μ of the polynomial to appropriately provide the correct (
±) sign of the first
k'
μ term from Equation (10),
i.e.,
k'
1 < 0 for decay and
k'
1 > 0 for growth. The
k'
μ terms as determined from Equation (10) are then used to compute the simulated values for interdiffusivity
ĎBs that correspond with Equation (2) as
The simulated
ĎBs values are then curve fit using Equation (6) to evaluate the
K'
μ values corresponding to the fit of the
R variation with
B. Since
K'
μ is equal to 2
Kμ/
fʺ from Equations (5) and (6), it follows that a condition for growth is
K'
1 >0 (since
fʺ <0,
Ď <0 and
K1 >0 within the spinodal), whereas the condition for decay is
K'
1 <0 (since
fʺ >0,
Ď >0 and
K1 <0 outside the spinodal). From Equations (4)–(6), it follows that the difference Δ
ĎB between the experimental value of the interdiffusion coefficient
ĎBe and the simulated value
ĎBs,
i.e., Δ
ĎB =
ĎBe –
ĎBs, will be positive for all temperatures and is a sole consequence of strain energy. Again, strain energy [
21] accelerates diffusion outside the spinodal and hinders it within the spinodal. So, the simulated variation of the magnitude of the interdiffusivity |
ĎB| with
B must envelope all experimental data as a lower bound. The predetermined
K'
μ values that follow from evaluating Equation (6), as consistent with the Equation (10) data fit, are used to determine the one remaining, unknown diffusion parameter,
i.e.,
Ď, at each temperature.
The determination of the
K'
μ values by curve fitting both the amplification factor and interdiffusivity variation with wavenumber, allows for the computation of the strain energy term consistent with previous [
21] derivation. The strain energy is determined in the solution by equating the difference between Equations (4) and (11) as
A plot of the strain energy term 2η2·Y can then be made to evaluate its variation with composition wavelength λ.
5. Results and Discussion
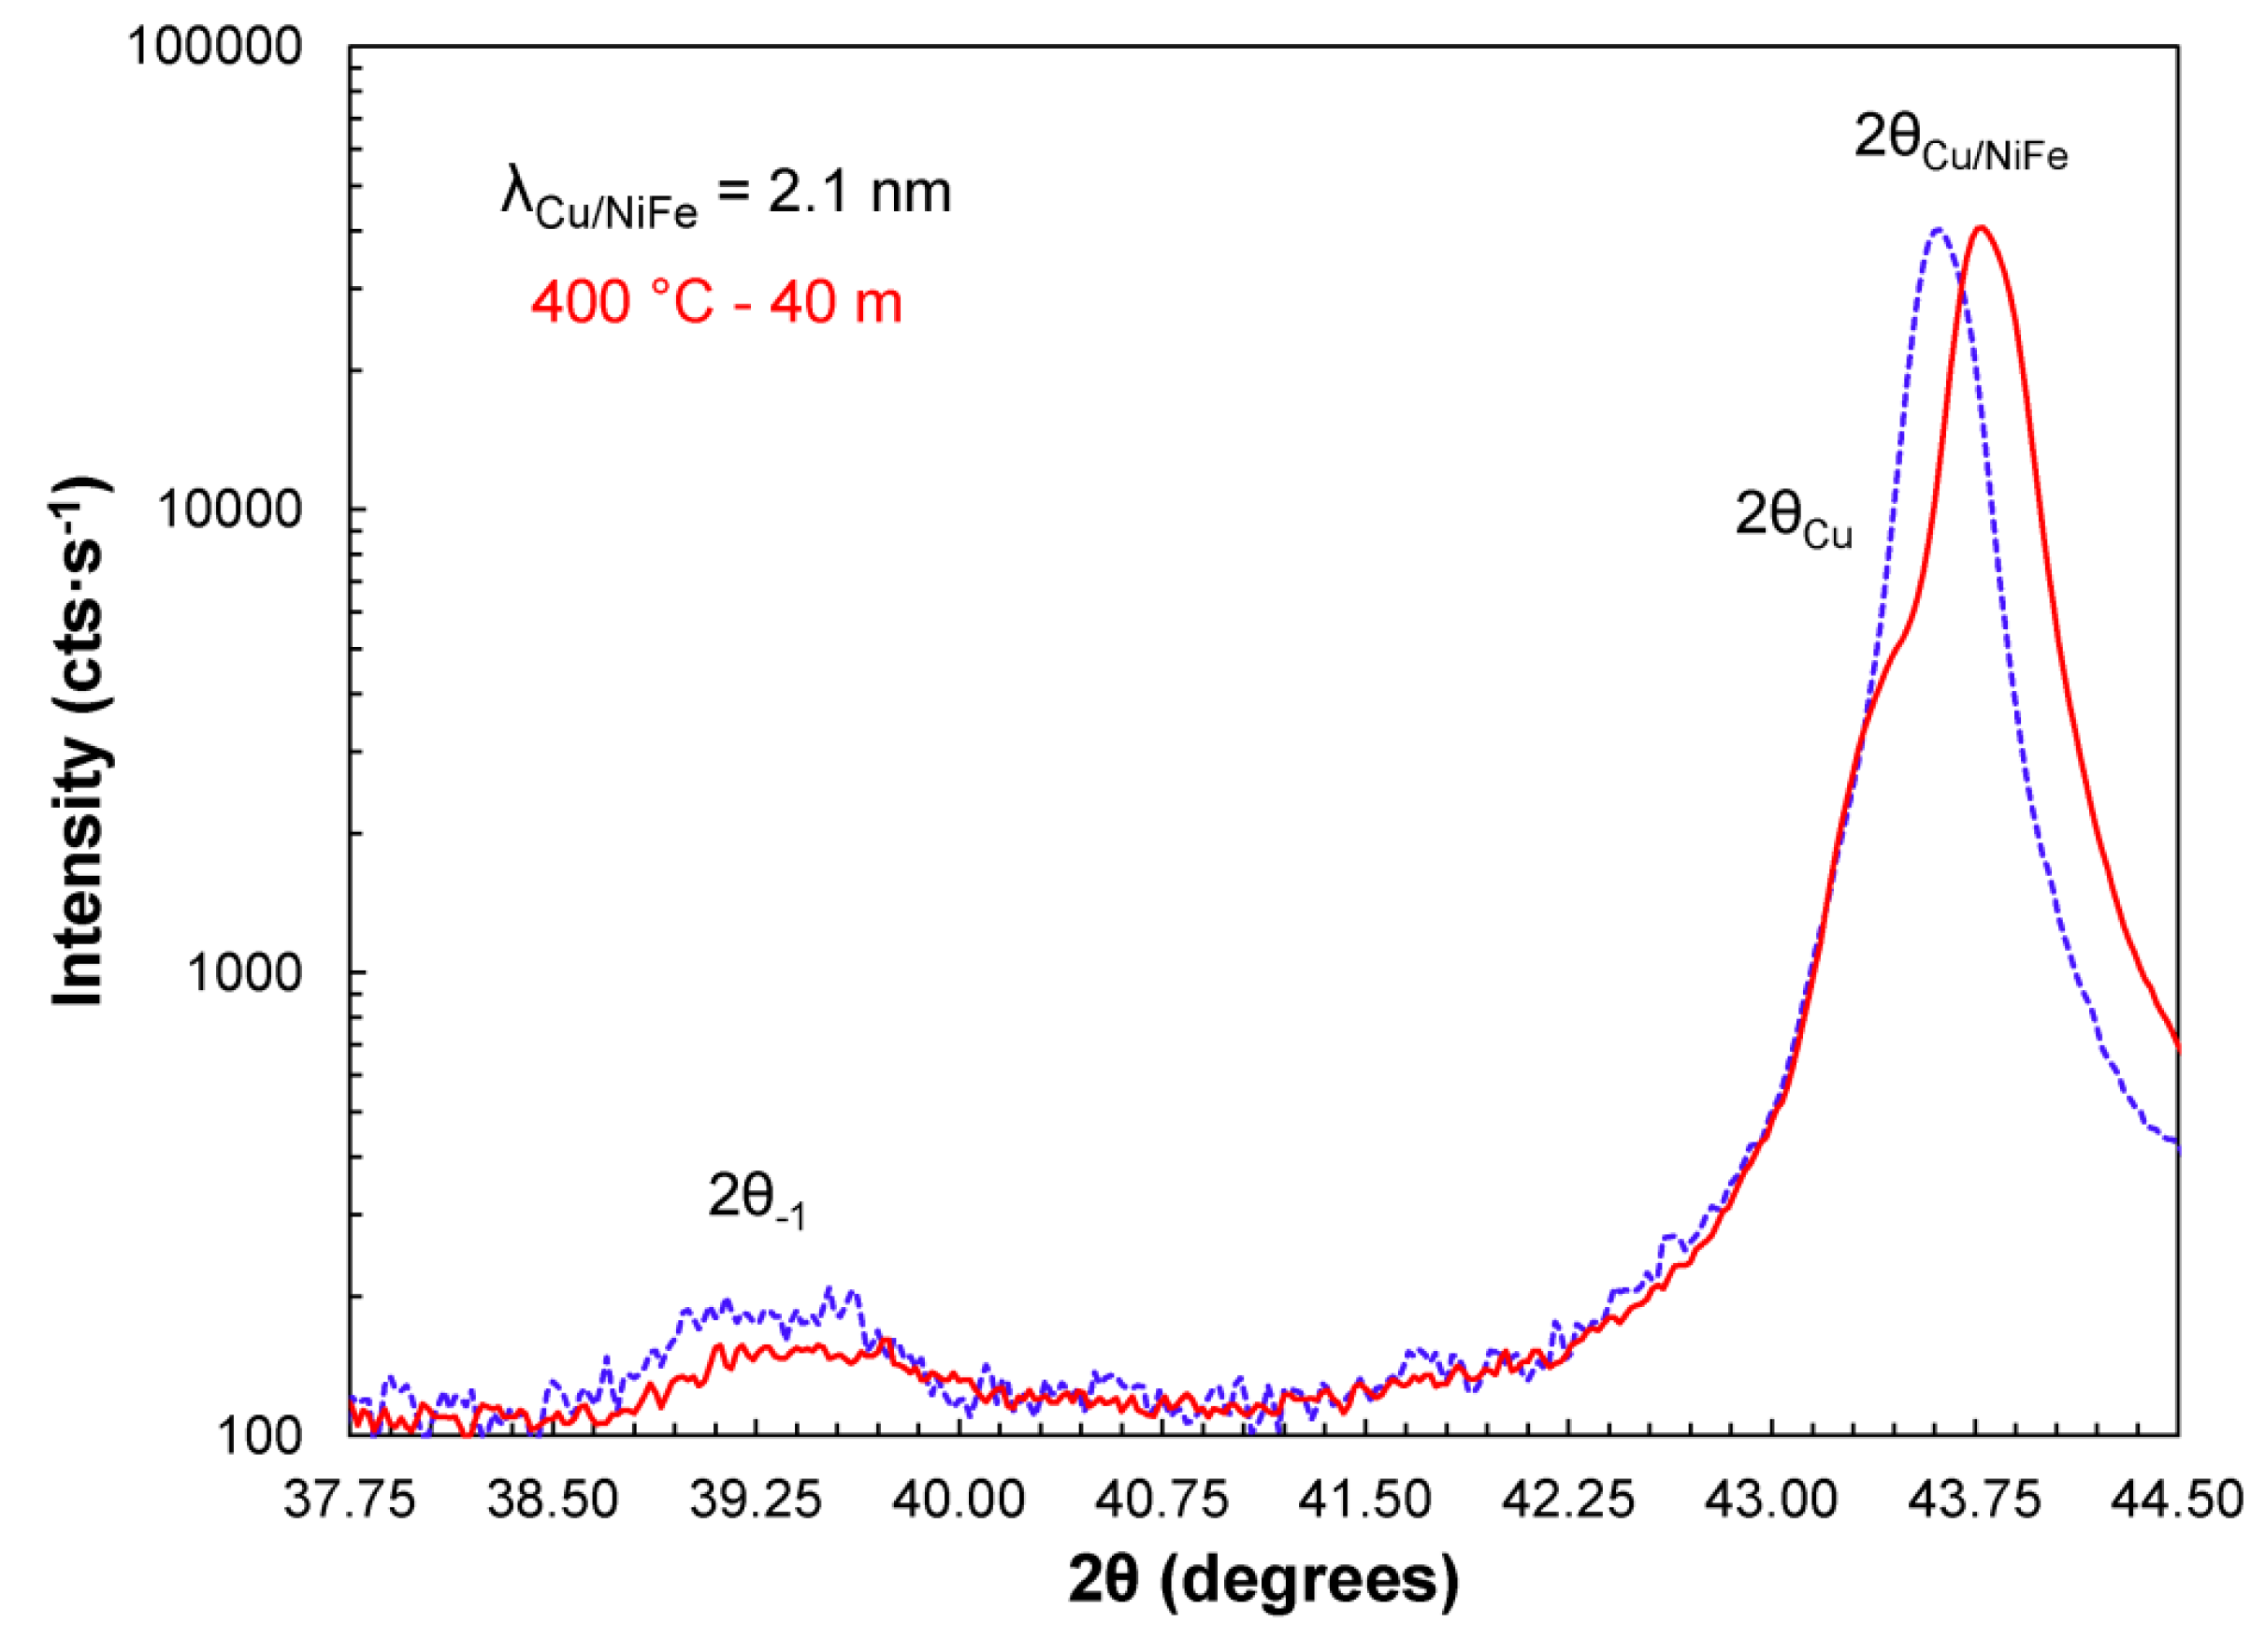
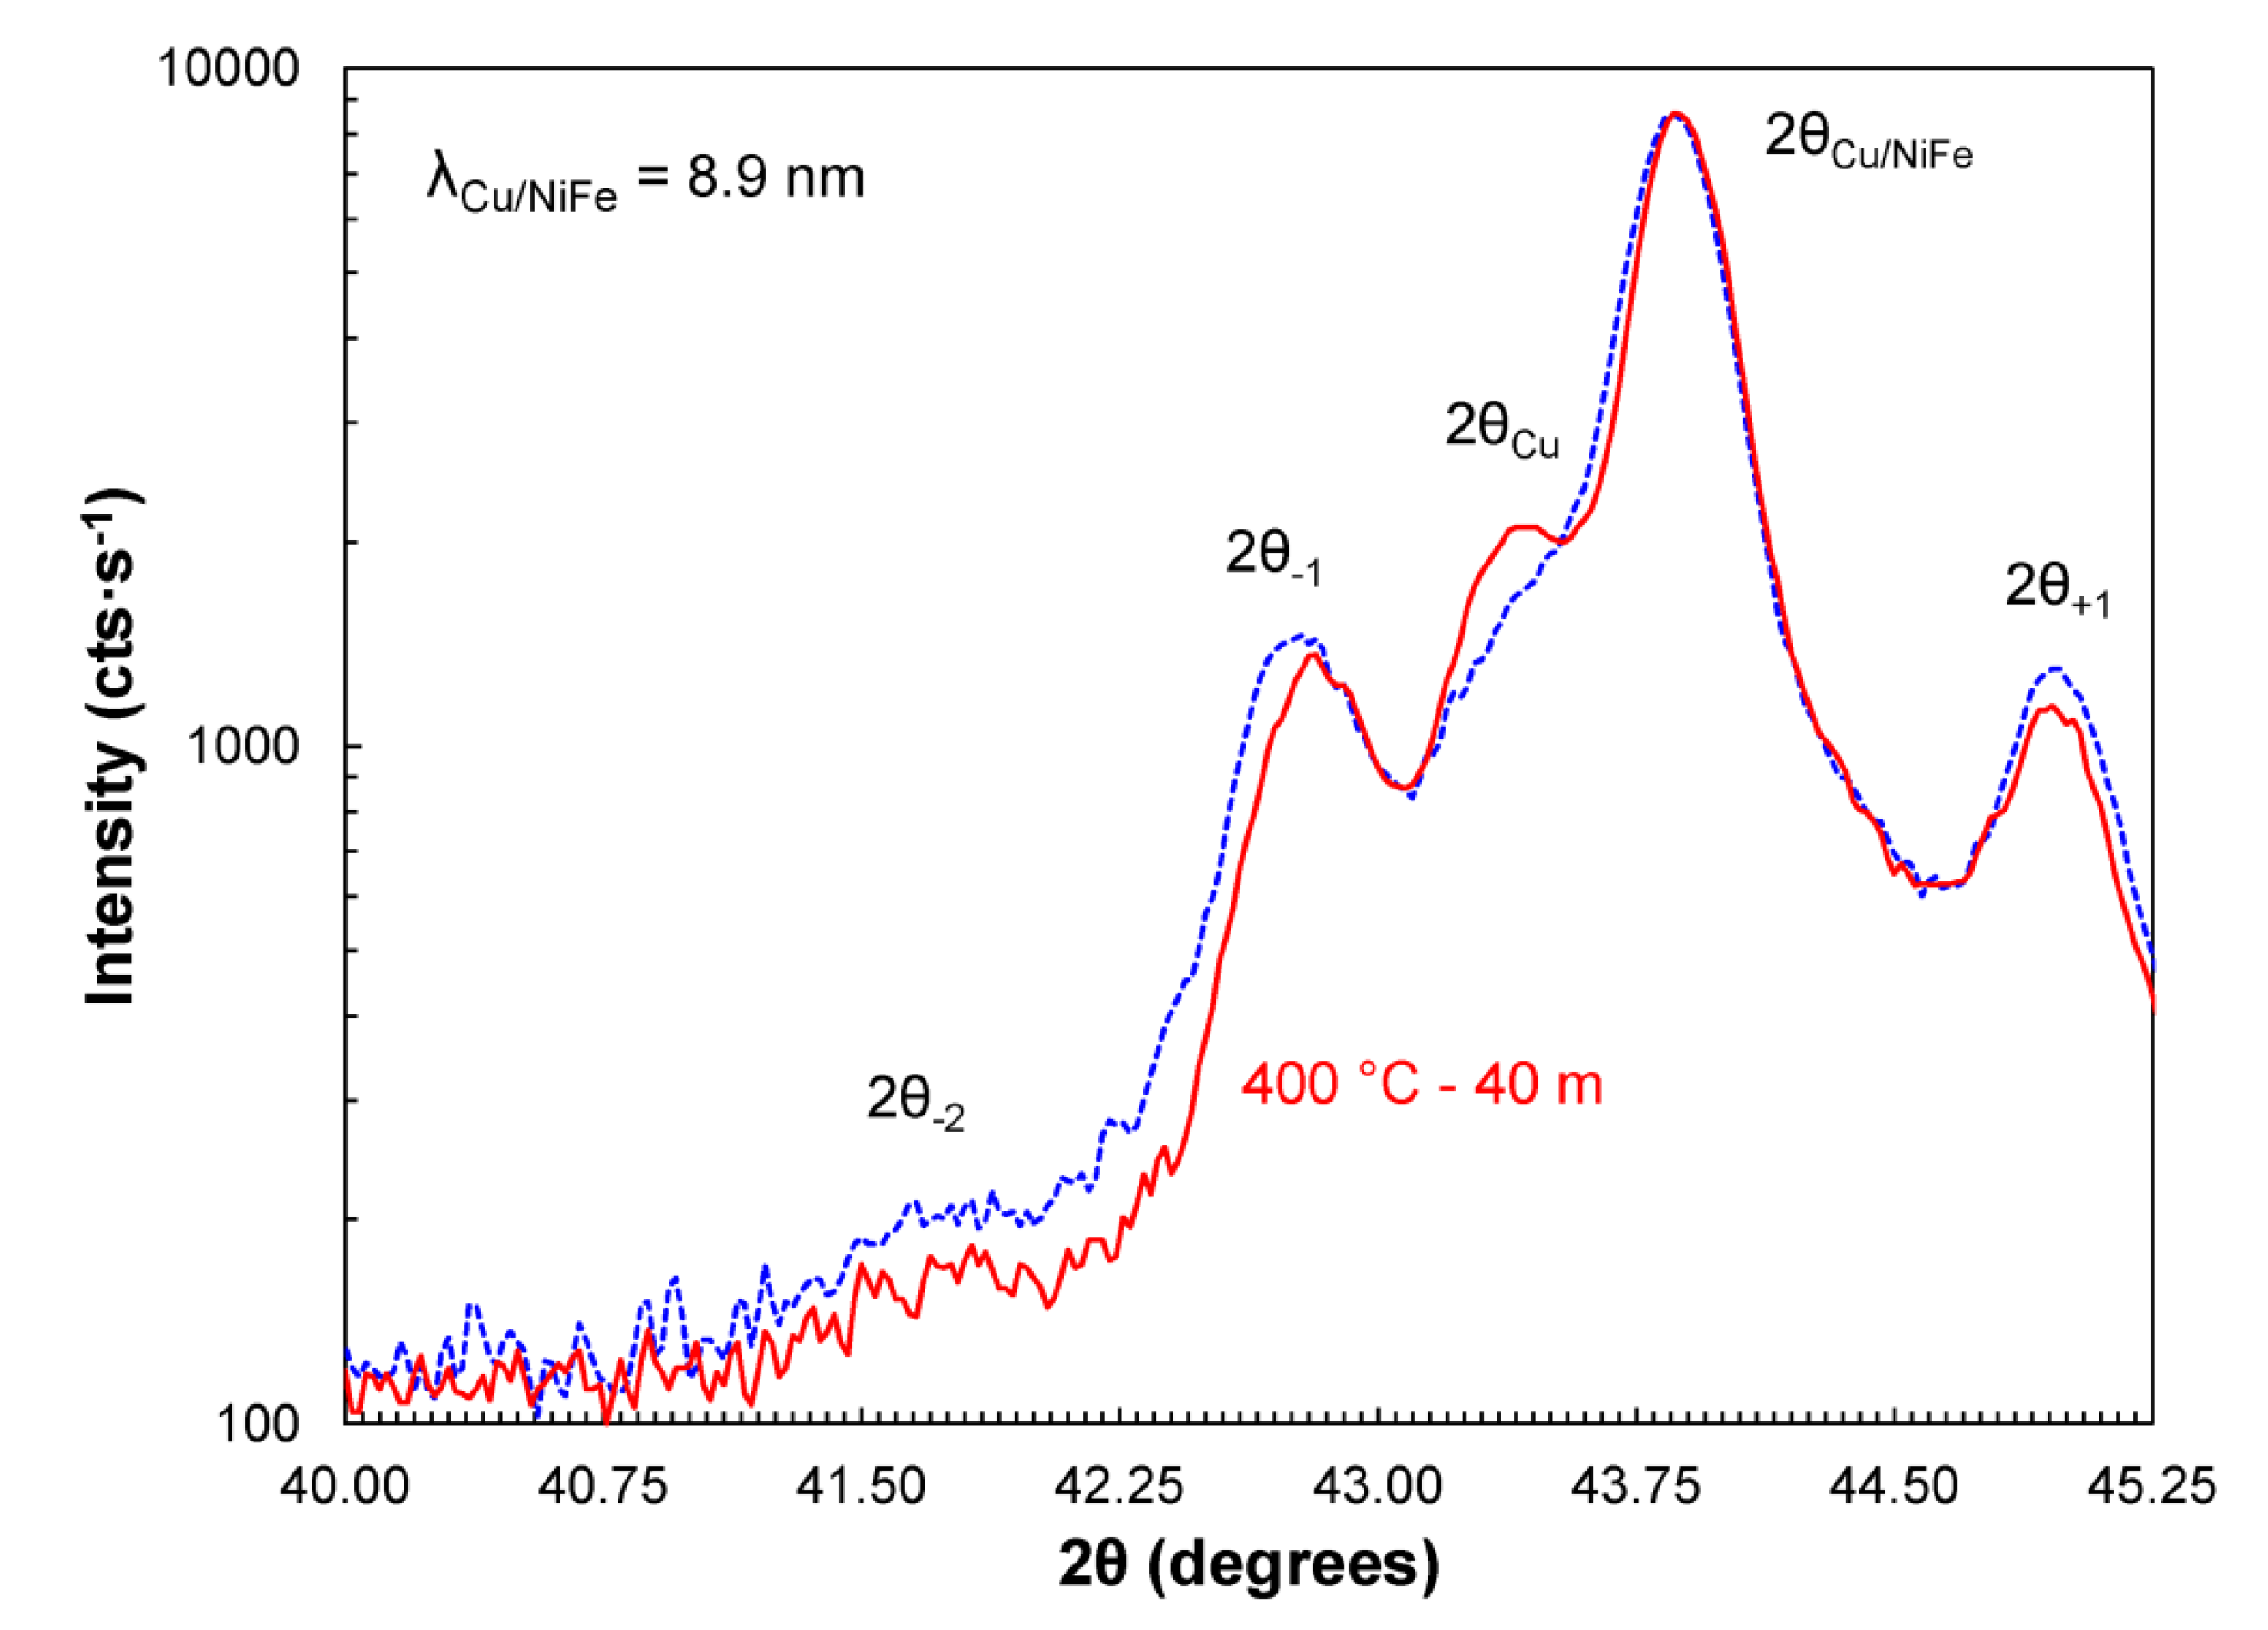
The growth of structures with longer wavelengths,
i.e., smaller wavenumbers, occurs in the α-phase for temperatures within the spinodal to produce phase separated regions of α' and αʺ with dissimilar lattice spacing. The consequence for a bulk α-phase alloy will be a tendency to split the Bragg X-ray reflection, decrease its intensity, and broaden its shoulder as is consistent with the growth of long wavelength components. However, for nanolaminate structures, there is an initial composition wavelength along a specific crystallographic direction. With annealing, the Cu/Ni(Fe) superlattice Bragg peak may first narrow in width due to the effects of nanocrystalline grain growth, and split due to phase separation where a 2θ
Cu peak may appear, as seen in
Figure 1 and
Figure 2 for 2.1 and 8.9 nm wavelength samples annealed at 400 °C for 40 min. The satellite peaks that correspond with the composition fluctuation are indicated in the subscript of the 2θ
i peak position in
Figure 1 and
Figure 2.
Figure 1.
The intensity I± of the Bragg and satellite peak variation with 2θ position for the Cu/Ni(Fe) nanolaminate coating with a 8.9 nm wavelength λ before (dashed line) and after (solid line) a 40 min at 400 °C anneal treatment.
Figure 1.
The intensity I± of the Bragg and satellite peak variation with 2θ position for the Cu/Ni(Fe) nanolaminate coating with a 8.9 nm wavelength λ before (dashed line) and after (solid line) a 40 min at 400 °C anneal treatment.
Figure 2.
The intensity I± of the Bragg and satellite peak variation with 2θ position for the Cu/Ni(Fe) nanolaminate coating with a 2.1 nm wavelength λ before (dashed line) and after (solid line) a 40 min at 400 °C anneal treatment.
Figure 2.
The intensity I± of the Bragg and satellite peak variation with 2θ position for the Cu/Ni(Fe) nanolaminate coating with a 2.1 nm wavelength λ before (dashed line) and after (solid line) a 40 min at 400 °C anneal treatment.
The relaxation of lattice strain (when present) can shift the Bragg peak position as seen for the 2.1 nm nanolaminate sample of
Figure 2. In addition, enhanced diffusivity for an artificial composition wave during the early stages of annealing [
24,
25,
26] causes an initial, nonlinear decay of satellite peak intensity with time.
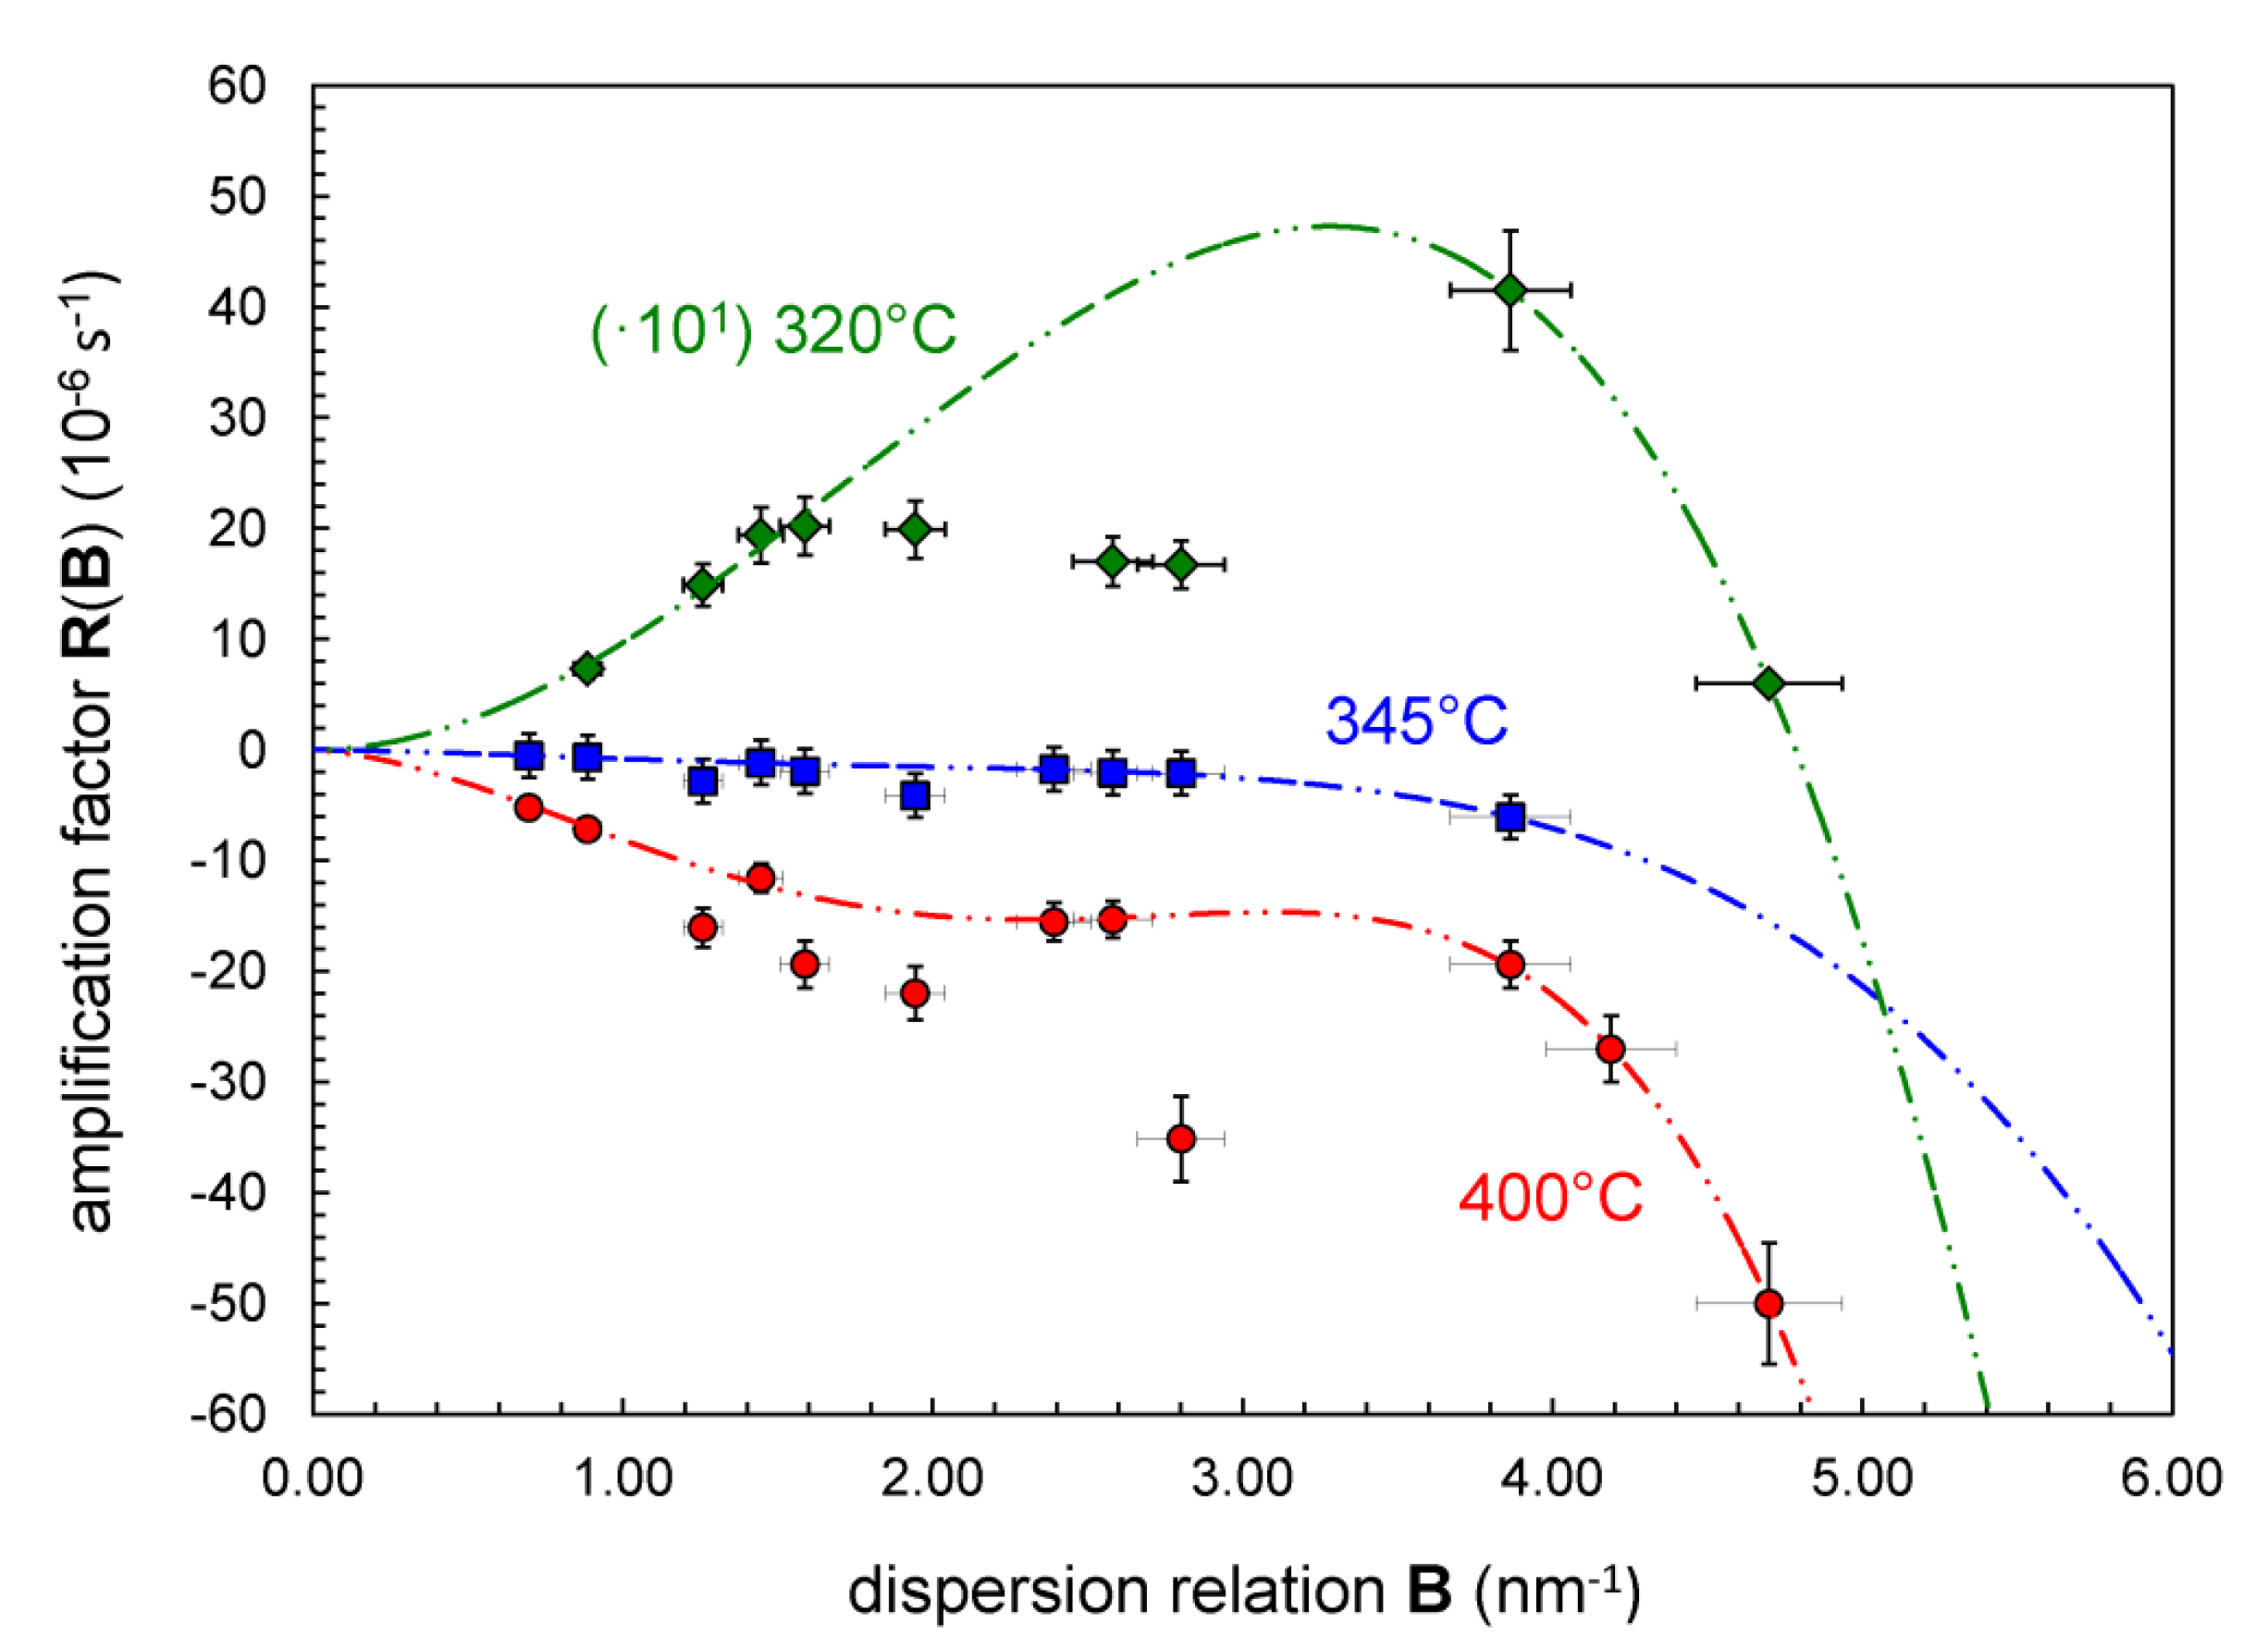
The amplification factor
R variation for the nanolaminates (at each anneal temperature) is computed from the integrated peak intensities of the diffraction spectra as shown in
Figure 1 and
Figure 2 using Equation (1). The
R-values are plotted in
Figure 3 as a function of the dispersion relation
B which is computed using Equation (3) for a (111) growth of the Cu/Ni(Fe) structure. Decay of the composition fluctuation occurs above 345 °C and growth below 320 °C, providing an interpolated estimate for the chemical spinodal of 335 °C. There is insufficient temperature-dependent data in this study to detail the effects of composition wavelength on the depression of the spinodal due to coherency effects. However, a critical wavelength λ
c of 1.26 nm is found for growth at 320 °C,
i.e., the coherent spinodal temperature
Ts* is 320 °C for a 1.26 nm composition wavelength. This corresponds with the
Bc value of 4.78 nm−1 where
Rλ equals zero as determined from the Equation (10) fitting of the
R-values in
Figure 3. This λ
c-value corresponds with a composition wavelength for maximum growth λ
m of 1.78 nm at 320 °C, where [
21] λ
m equals λ
c·
.
Figure 3.
The amplification factor R (106 s−1) variation with the dispersion-relation wavenumber B (nm−1) as computed from the decay or growth of the first-order satellite intensity I− at peak position of 2θ−1 for Cu/Ni(Fe) nanolaminate samples annealed at 320 °C (diamond) as scaled by a factor of 10, at 345 °C (squares), and 400 °C (circles).
The
fʺ values can next be computed, as listed in
Table 1, using Equation (9) where
Ts equals 335 °C for Cu
0.53/Ni
0.40Fe
0.07 using a
Nv value of 86.1 atom·nm
−3 as computed for 4 atoms in a unit cell volume with a 0.3595 nm lattice parameter. A positive
fʺ value is consistent with the heat of mixing wherein unlike atoms cluster as opposed to having the tendency for long-range ordering for systems with a negative heat of mixing. The baseline
R behavior for growth or decay is modeled as a function of
B using a fourth-order polynomial expansion of Equation (10). This is the minimum order of expansion required to meet the sign criteria for the modeled
k'
μ values that is described in the Current Approach
Section 4.2.
Table 1.
Diffusion and gradient energy coefficients for Cu/Ni(Fe) nanolaminates.
Table 1.
Diffusion and gradient energy coefficients for Cu/Ni(Fe) nanolaminates.
| Diffusion and Gradient Energy Coefficients | Cu/Ni(Fe) | Cu/Ni |
|---|
| T (°C) | 320 | 345 | 400 | 400 |
| Ď (10−6 nm2·s−1) | −1.065 | 1.208 | 11.27 | 4.846 |
| M (10+16 nm2·J−1·s−1) | 0.1285 | 0.2187 | 0.3139 | 0.1350 |
| fʺ (10−19 J·nm−3) | −0.7134 | 0.4756 | 3.091 | 3.078 |
| K1 (10−20 J·nm−1) | 0.3496 | −0.9311 | −4.494 | −2.650 |
| K2 (10−21 J·nm) | −0.2735 | 1.890 | 5.752 | 2.582 |
| K3 (10−22 J·nm3) | 0.1496 | −1.702 | −3.991 | −0.9814 |
| K4 (10−23 J·nm5) | −0.0295 | 0.5397 | 0.6091 | 0.1309 |
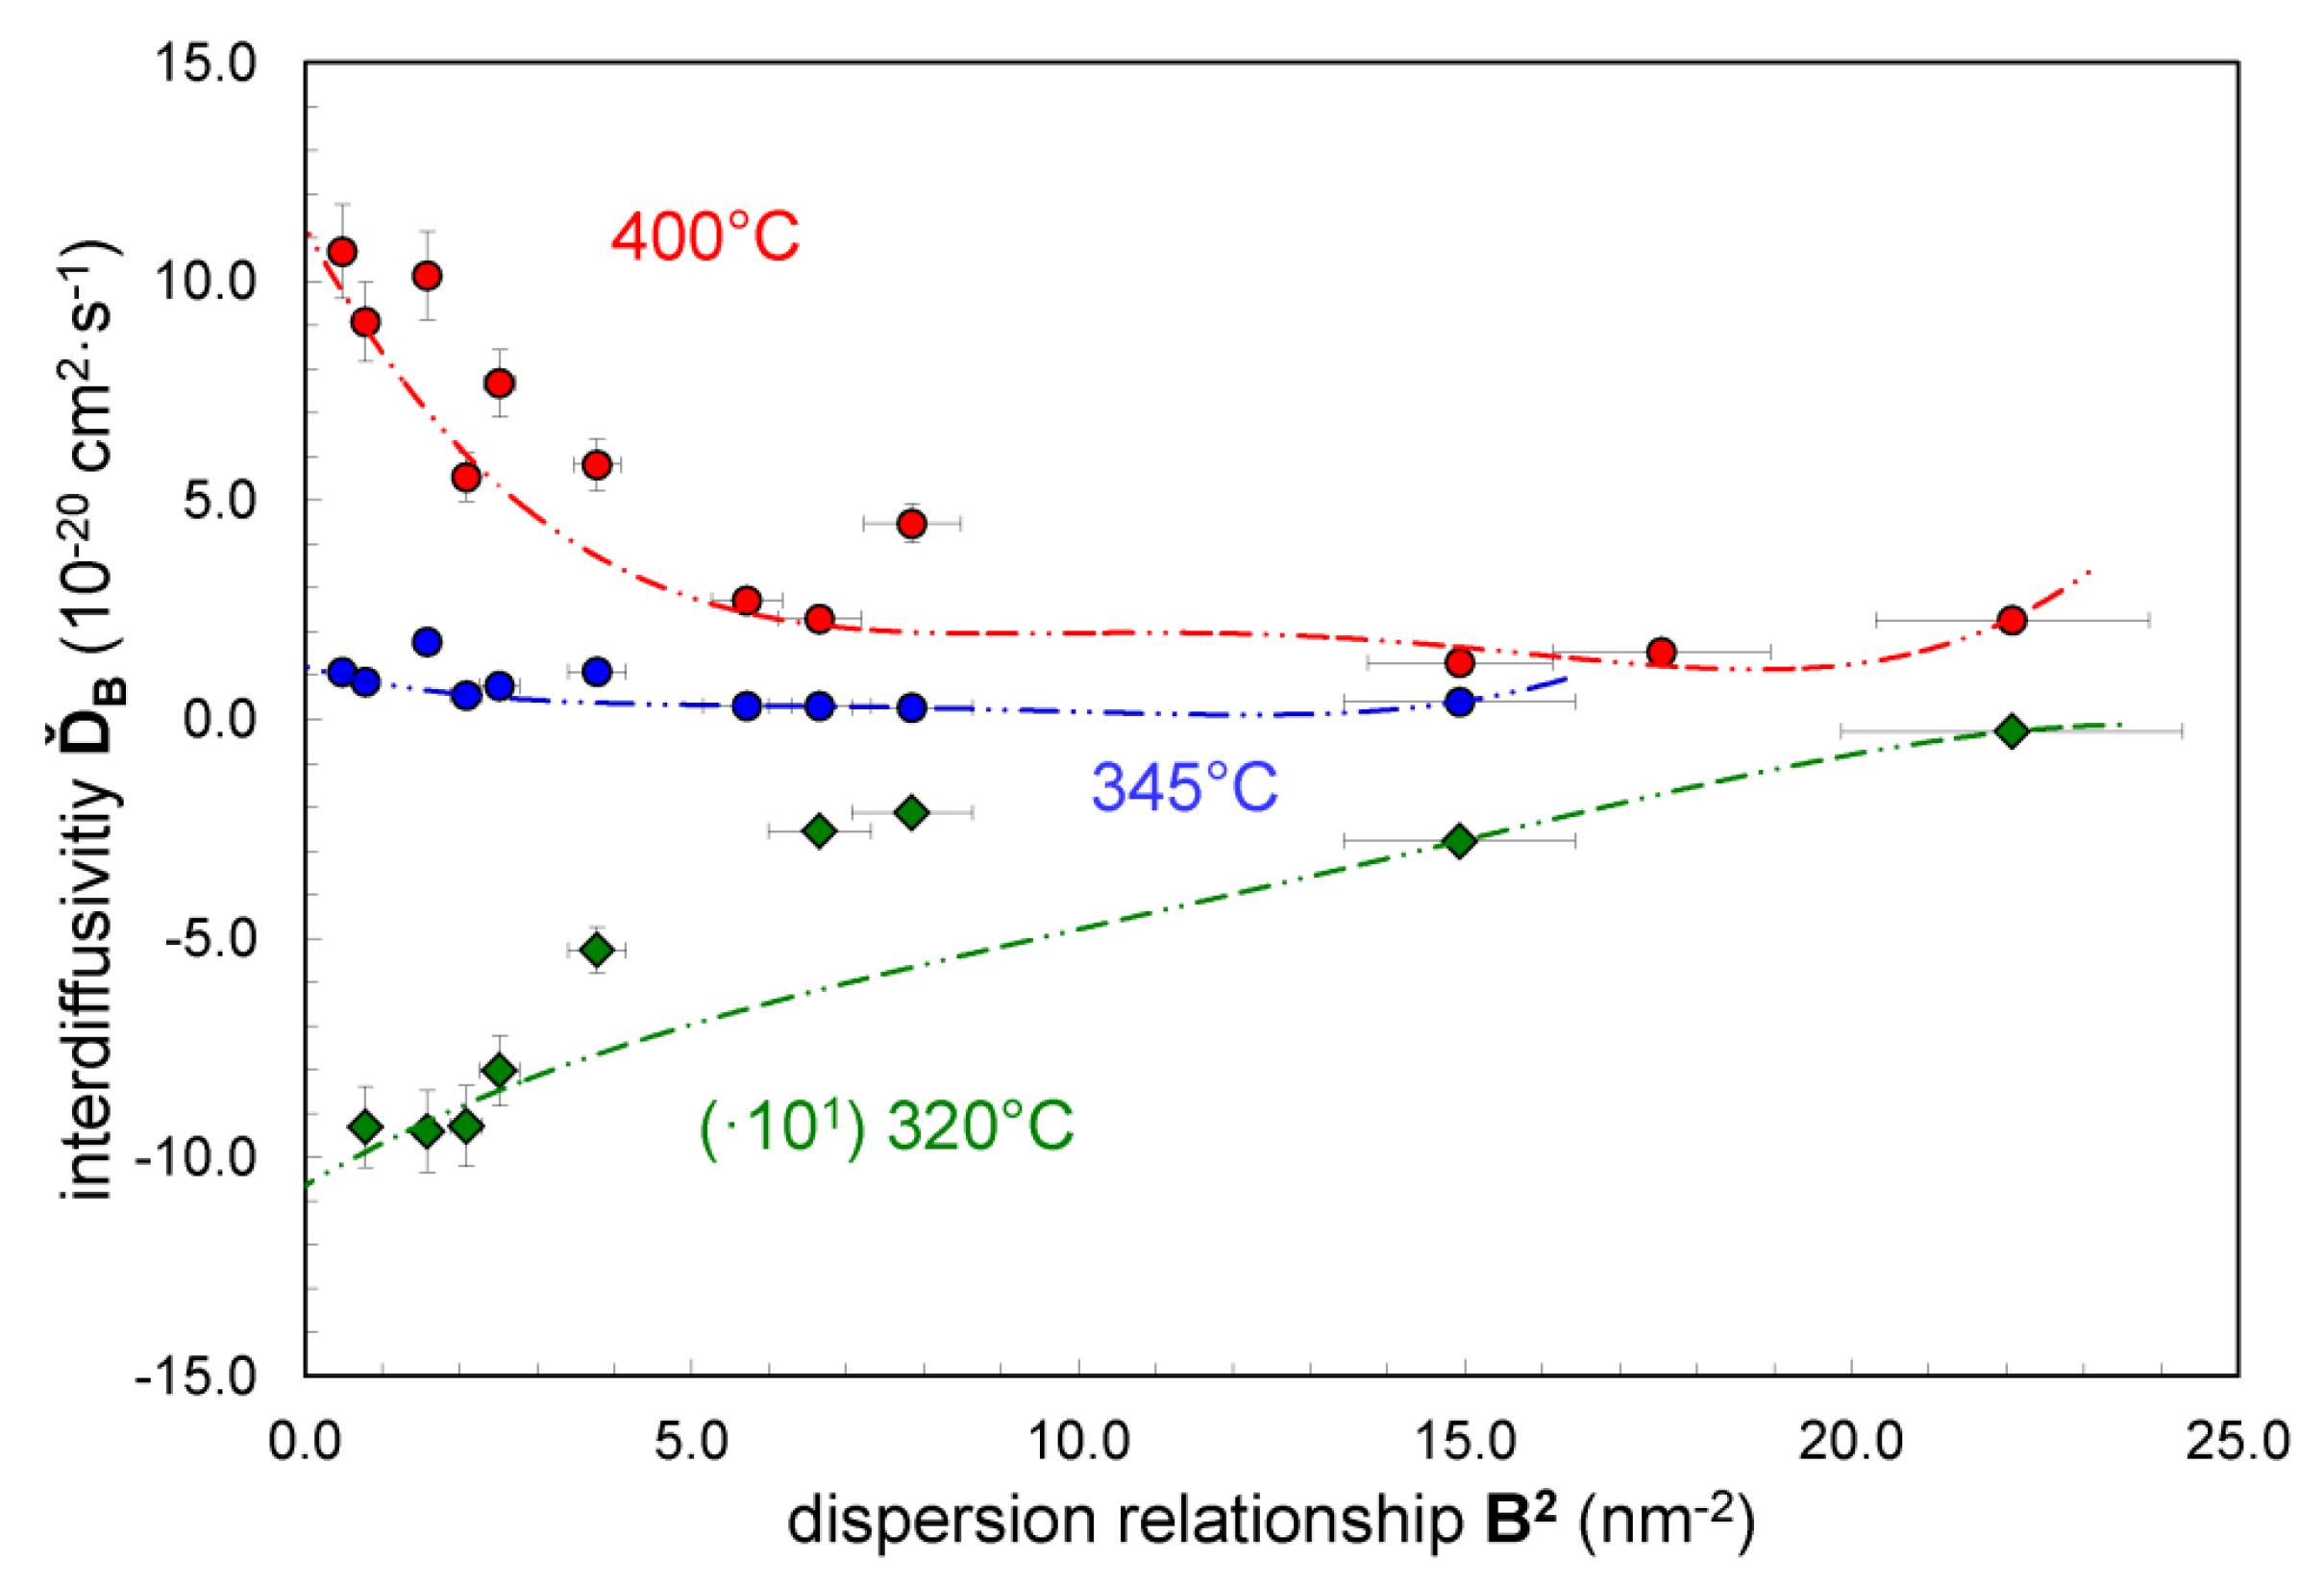
The corresponding
ĎB-values that correspond to the measured
R-values are computed using Equation (2) and are plotted in
Figure 4. The baseline
ĎB behavior for growth or decay is computed as a function of
B2 using the
k'
μ coefficients. The
K'
μ coefficients are determined by using a fourth-order expansion of Equation (6) to fit the baseline
ĎB-values. This is the minimum order needed to meet the sign criteria for the modeled
K'
μ values as described in the Current Approach
Section 4.2. From this data fit that prescribes conversion of
k'
μ into
K'
μ coefficients, the remaining unknown,
i.e., the intercept value for
Ď, is uniquely determined. The corresponding
Kμ values of Equation (4) are listed in
Table 1, where it has been noted previously that
K'
μ equals 2
Kμ/
fʺ. The mobility
M values at each temperature are listed in
Table 1 as computed using Equation (5). In general, the mobility
M will decrease with a decreasing value of the
Ď/
fʺ ratio.
Figure 4.
The interdiffusivity ĎB (cm2·s−1) variation with the square of the dispersion relation wavenumber B2 (nm−2) as computed from the amplification factor R for Cu/Ni(Fe) nanolaminate samples annealed at 320 °C (diamond) as scaled by a factor of 10, at 345 °C (squares), and 400 °C (circles).
Figure 4.
The interdiffusivity ĎB (cm2·s−1) variation with the square of the dispersion relation wavenumber B2 (nm−2) as computed from the amplification factor R for Cu/Ni(Fe) nanolaminate samples annealed at 320 °C (diamond) as scaled by a factor of 10, at 345 °C (squares), and 400 °C (circles).
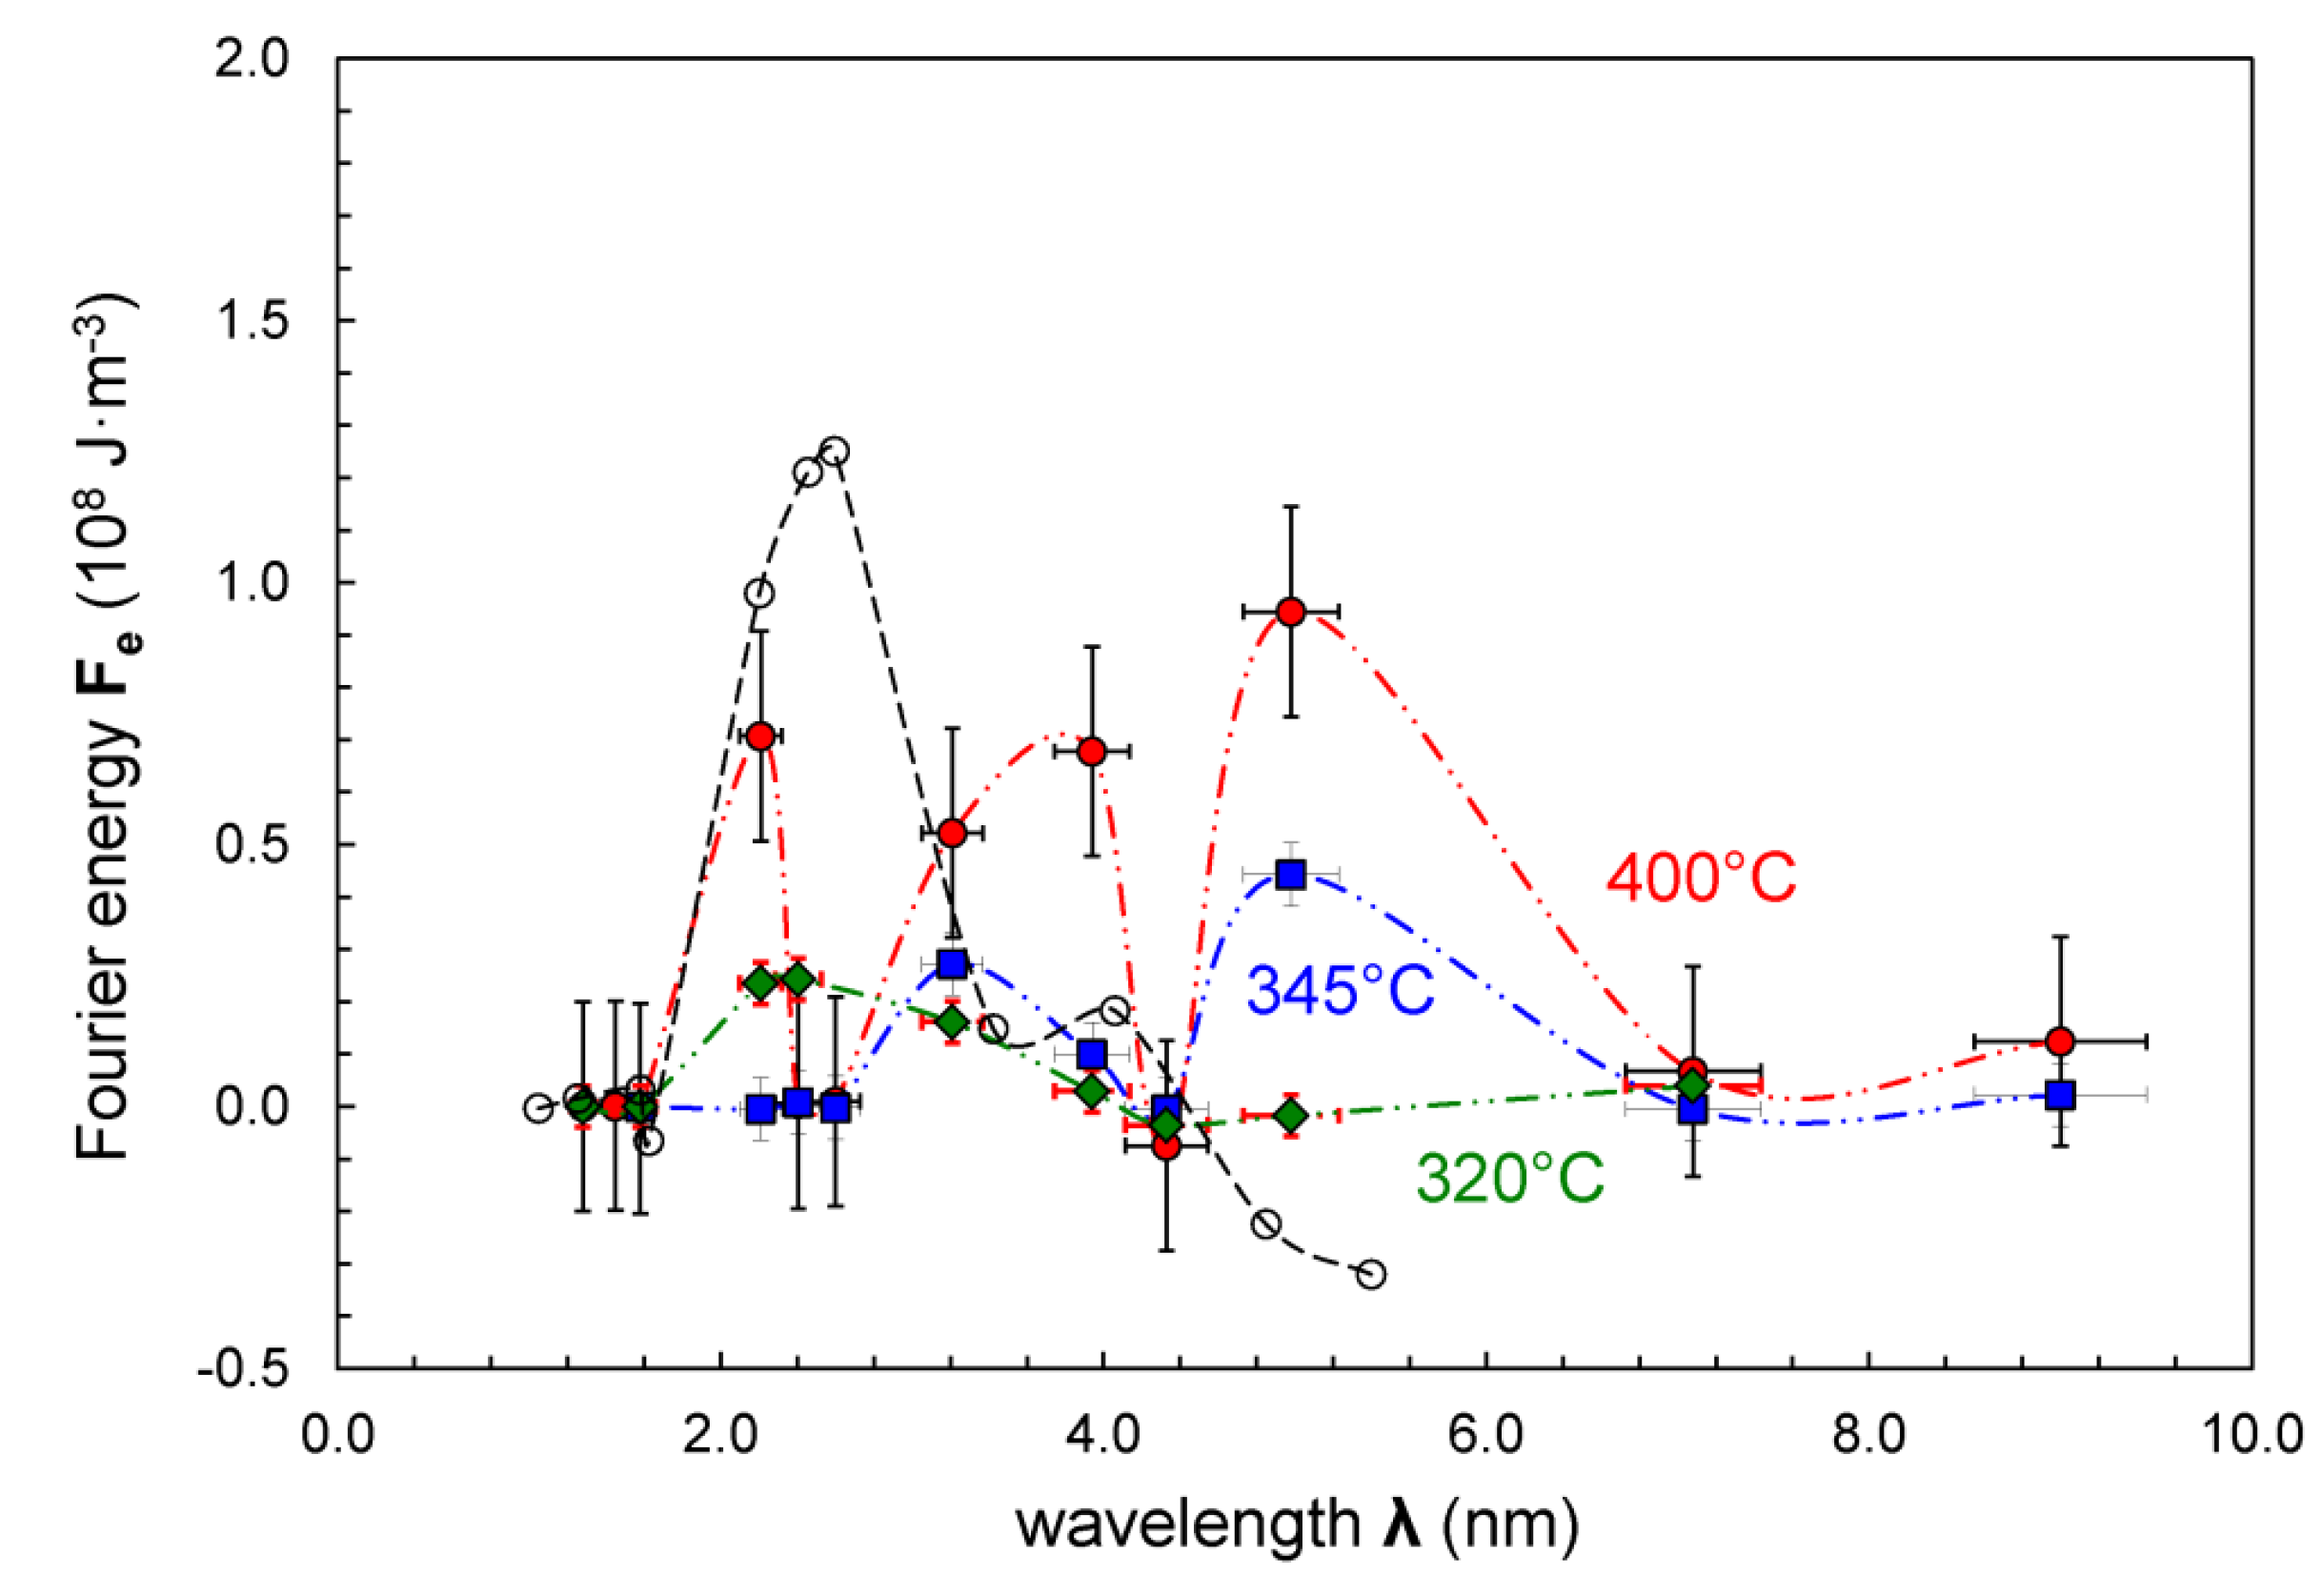
The strain energy component, that primarily constitutes [
21] the Fourier energy
Fe, is computed using Equation (12). The energy variation with composition wavelength is plotted in
Figure 5. It is clear that a strain energy contribution provides a significant effect in some nanolaminates by enhancing the decay of the composition fluctuation outside the spinodal and hindering its decay within the spinodal as seen in the results of
Figure 3 and
Figure 4. The peak (strain) energy computed for the Cu/Ni(Fe) nanolaminates has a value of 0.94 × 10
8 J·m
−3. The magnitude for this energetic component as seen in
Figure 5 is comparable to the values of the Helmholtz free-energy term
fʺ that are listed in
Table 1. In comparison, a smaller 2η
2·
Y value of 0.43 × 10
8 J·m
−3 can be computed for Cu/Ni(Fe) using a rule-of-mixtures formulation with a biaxial modulus
Y of 200 GPa and a 2η
2 strain term of 2.14 × 10
−4 assuming a 1.03% interface misfit strain.
Figure 5.
The Fourier energy Fe (108 J·m−3) variation with composition wavelength λ (nm) as computed from the difference between experimental values and the modeled fit of the amplification factor R variation with the dispersion relation wavenumber B (nm−1) for nanolaminate samples of: Cu/Ni(Fe) annealed at 320 °C (diamond), 345 °C (squares), and 400 °C (solid circles); as well as Cu/Ni annealed at 400 °C (open circles).
6. Analysis and Discussion
Single and multiple peaks in the interdiffusivity variation with wavenumber are reported [
24,
25,
35] for the diffusion results of the Cu/Ni, Cu/Pd, Au/Cu, and Ag/Pd nanolaminate systems. The multiple fluctuations observed in both the amplification of
Figure 3 and the interdiffusivity of
Figure 4 are a potential consequence of: a shift towards longer wavelengths that can occur with aging time; and that strain energy will still enhance (outside the spinodal) or hinder (within the spinodal) diffusion at the shorter wavelengths. As introduced in
Section 4.2, some data points in
Figure 3 and
Figure 4 will vary from the simulated curves that are used to fit and establish the baseline behavior without the strain energy term. Consequently a variation in the Fourier energy
Fe, is an anticipated result,
i.e., the strain energy dependence on composition wavelength as plotted in
Figure 5. It is seen here that the magnitude of
Fe measured for the Cu/Ni(Fe) nanolaminates decreases somewhat with reduced annealing temperature. In addition, computations of
Fe for the Cu-Ni nanolaminate system from interdiffusion data reported at 400 °C [
25] are plotted (with open circles) in
Figure 5 using the present model approach for determining the gradient energy and diffusion coefficients as listed in
Table 1. The Cu/Ni data shows a bimodal distribution with a peak value of 1.25·10
8 J·m
−3 at a composition wavelength of 2.6 nm. The strain energy effects will be lost for very-long composition wavelengths where strained-layer superlattice growth is difficult due to the introduction of threading dislocations, and for very short (<1 nm) wavelengths where there is elastic homogenization from interface mixing. Therefore, strain energy will vary with the composition wavelength from ~1 to 9 nm. Periodic or irregular variations in strain energy may result, as well, for nanolaminate structures that do not have a commensurate structure. A variety of X-ray techniques and analysis methods [
36,
37,
38,
39,
40,
41] are available to assess strain distributions through surface regions and strained-layer superlattices. However, a detailed assessment for profiling of elastic strains and the variation through the interface is beyond the scope of this present analysis.
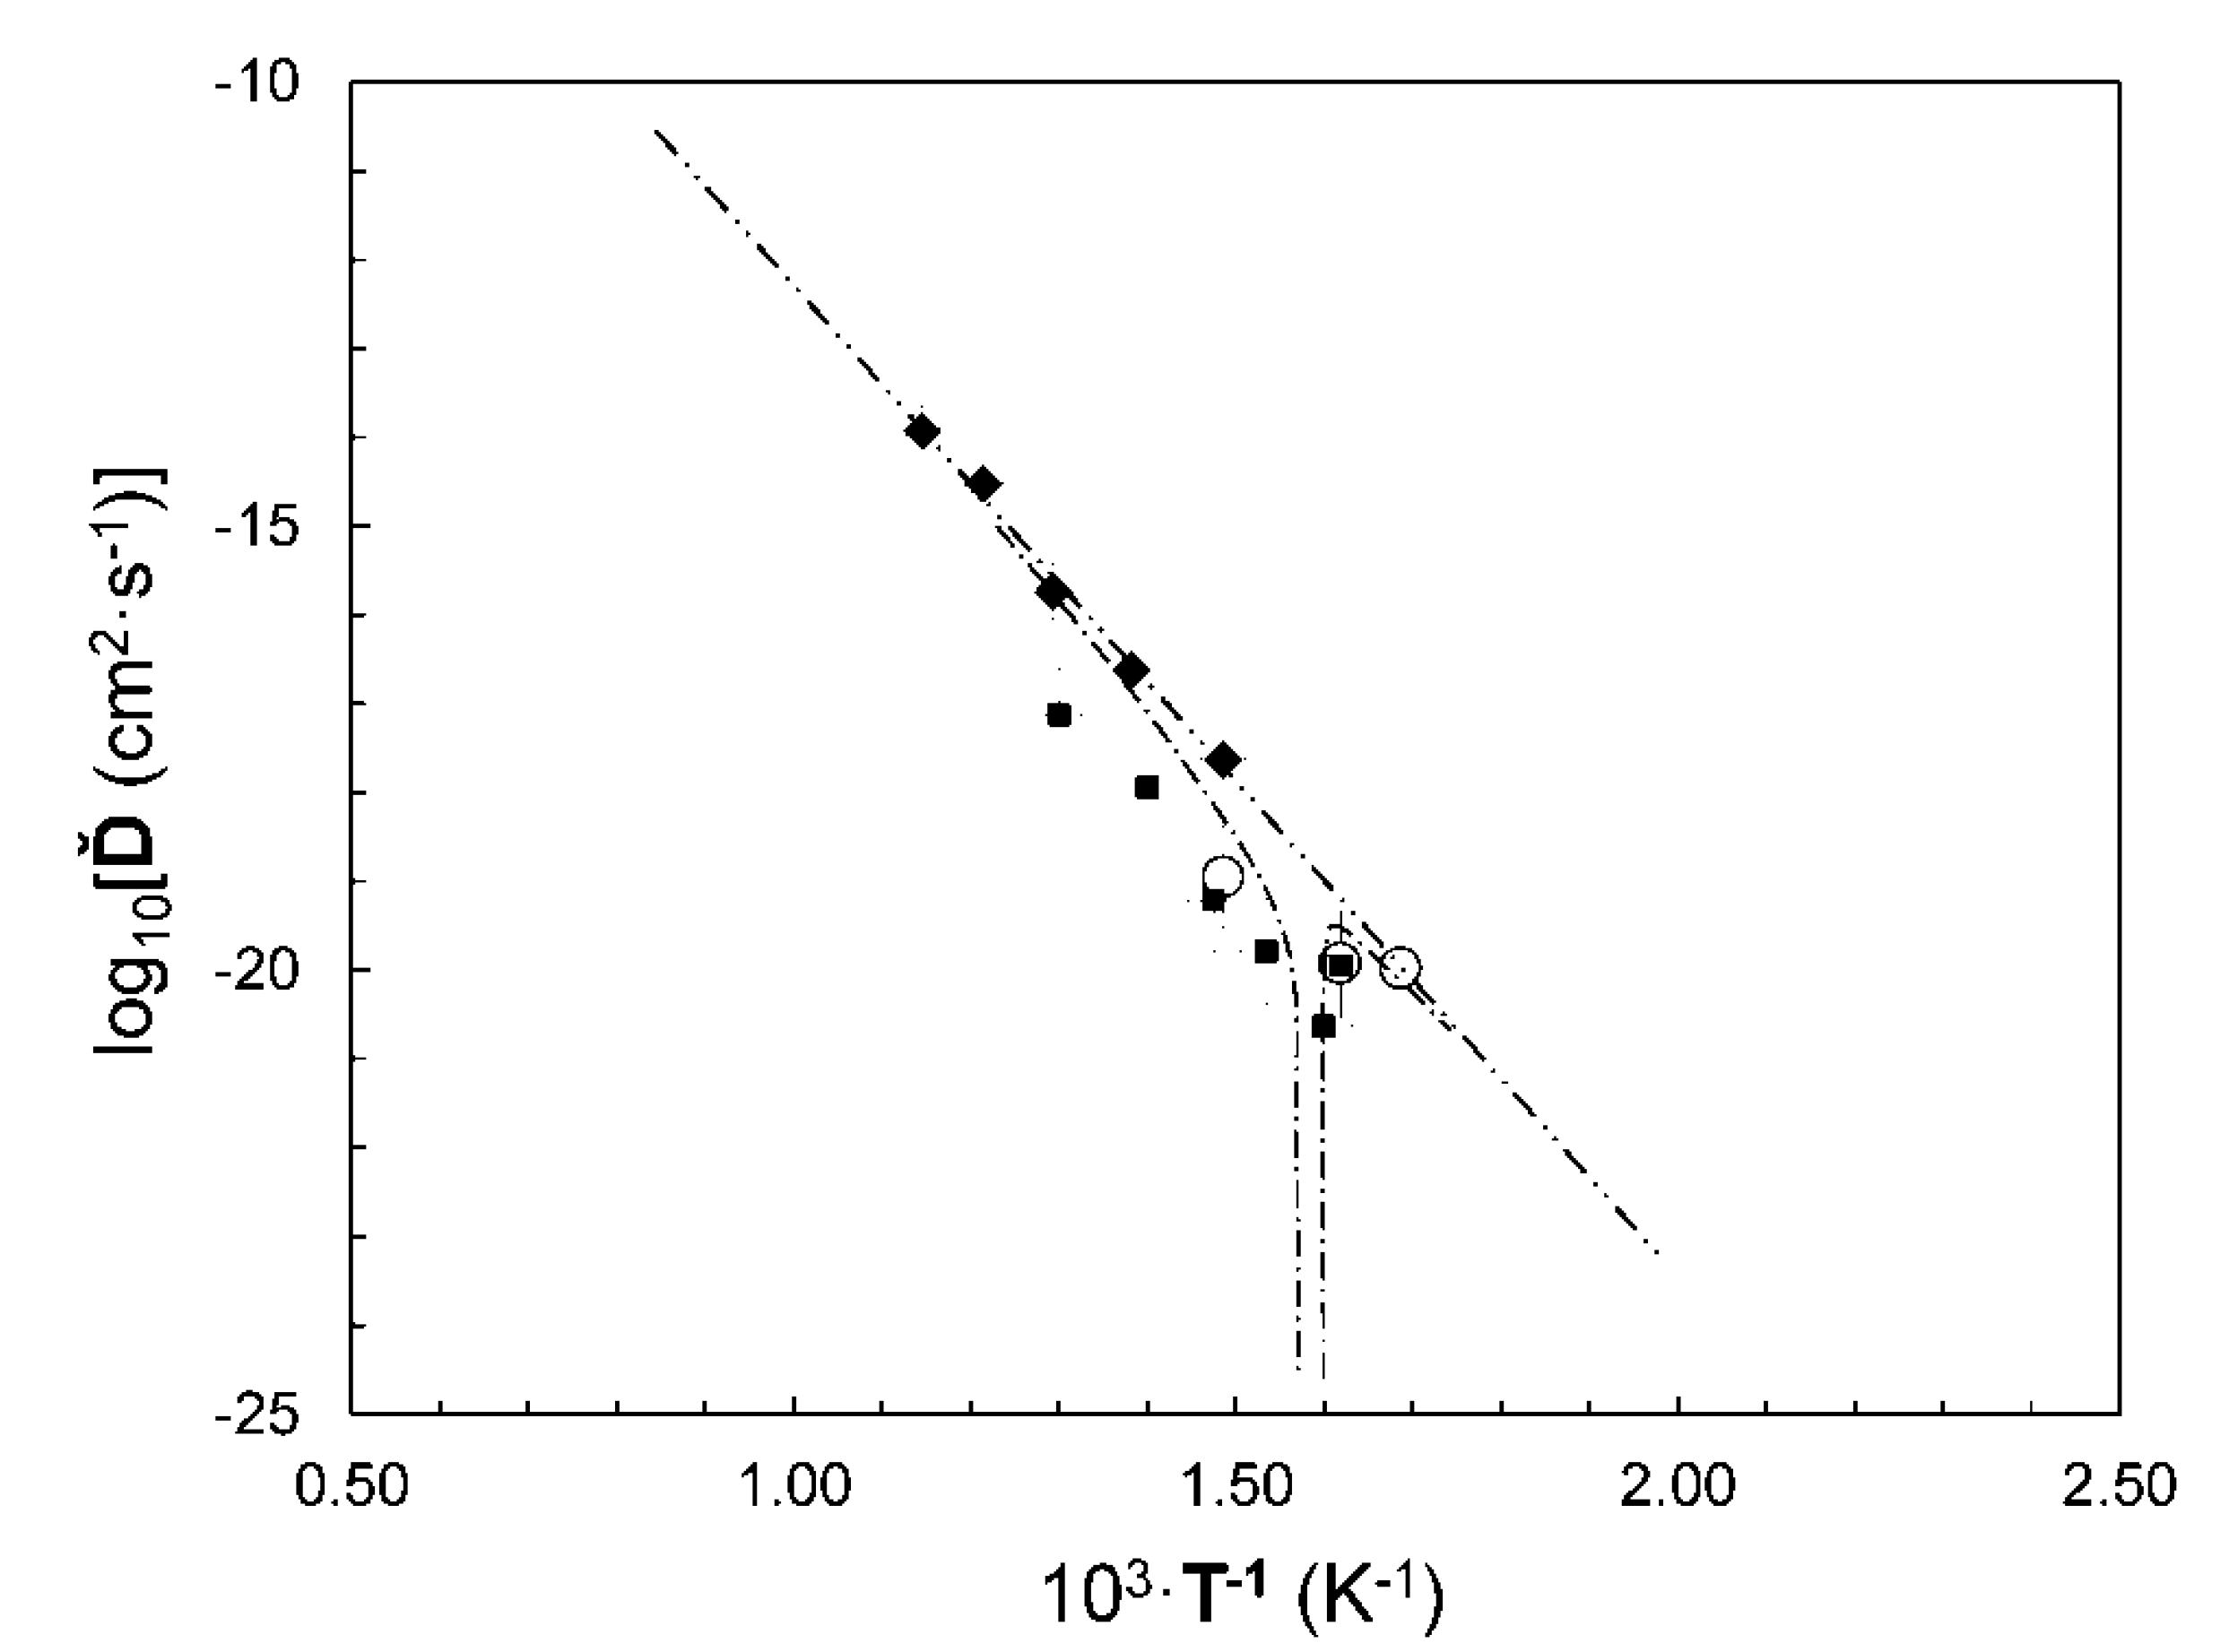
The Arrhenius plot of
Ď versus
T−1 in
Figure 6 is used to compare the |
Ď| values of the Cu
0.53/Ni
0.40Fe
0.07 nanolaminates to the bulk diffusion measurements of Cu
0.877Ni
0.107Fe
0.016 [
42] and Cu
0.5Ni
(0.5−x)Fe
x where 0.02 <
x < 0.08 [
43,
44] alloys. An activation energy
Q of 51 ± 2 kcal/mol (215 ± 6 kJ/mol; 1.34 ± 0.06 eV/atom) is determined from the slope of a linear fit to the Cu
0.877Ni
0.107Fe
0.016 data. This linear fit provides an upper bound to the bulk measurements, and is consistent with the new |
Ď| values for the nanolaminates as computed from Equations (6), (10) and (11). It has been postulated [
21] that an asymptotic discontinuity is possible at the spinodal temperature, where the magnitude of the diffusion coefficient |
Ď| vanishes since the composition fluctuation neither grows nor decays at
Tc. Curvilinear (dashed) lines are constructed in
Figure 6 where the diffusion values drop below the upper bound linear curve. A local depression in |
Ď| is seen near a 10
3/
T value of ~1.6 which corresponds with a spinodal temperature of ~350 °C. This value for the spinodal temperature is close to the 335 °C assumed in the computation of
fʺ using Equation (9), which is similar to the 333 °C result from a thermodynamic evaluation [
45] of the Cu-Ni alloy system using the CALPHAD approach. In an assessment of the collective interdiffusion in both Fe- and Si-based nanolaminate structures [
46], it has been proposed that a collective atomic jumping mechanism that governs interdiffusion involves at least 8–15 atoms.
Figure 6.
The Arrhenius-type relationship is plotted for the log
10-scale variation of diffusion
Ď (cm
2·s
−1) with inverse temperature 10
3·
T−1 (K
−1) for the Cu/Ni(Fe) nanolaminates (open circles) along with experimental data for Cu
0.877Ni
0.107Fe
0.016 (solid diamonds) [
33] and Cu
0.5Ni
0.5−xFe
x (solid squares) [
34,
35].


