Article

Evaluation of Yerba Mate Extract as a Green Inhibitor for Aluminum Corrosion in 0.5 M HCl

by
Adriana Arlet Pérez Amaro
,
Alicia Esther Ares
and
Claudia Marcela Méndez
*
Programa de Materiales y Fisicoquímica (ProMyF), Instituto de Materiales de Misiones (IMAM), Facultad de Ciencias Exactas, Químicas y Naturales (FCEQyN), Universidad Nacional de Misiones (UNaM), 1552 Félix de Azara Street, Posadas 3300, Misiones, Argentina
*
Author to whom correspondence should be addressed.
Coatings 2026, 16(7), 795; https://doi.org/10.3390/coatings16070795
Submission received: 7 June 2026 / Revised: 30 June 2026 / Accepted: 1 July 2026 / Published: 3 July 2026

Abstract

Aluminum corrosion in acidic media leads to accelerated material degradation and significant economic losses. This study evaluated the aqueous extract of yerba mate (Ilex paraguariensis) as a green inhibitor for aluminum corrosion in 0.5 M HCl at temperatures (298–323 K) and extract concentrations (1%, 2.5%, and 5% v/v). The extract was characterized by FTIR, and its inhibitory performance was assessed using weight loss measurements, potentiodynamic polarization, electrochemical impedance spectroscopy (EIS), scanning electron microscopy (SEM), and contact angle analysis. Gravimetric results showed a decrease in corrosion rate with increasing extract concentration, reaching a maximum inhibition efficiency of 94% at 308 K and 5% v/v. The increase in activation energy in the presence of the inhibitor suggested the formation of an energy barrier associated with adsorption on the aluminum surface. Polarization studies indicated that the extract behaves as a mixed-type inhibitor, while EIS revealed an increase in charge transfer resistance and the formation of a protective adsorbed film. SEM images confirmed reduced corrosion damage, and contact angle measurements indicated increased surface hydrophobicity. The inhibition mechanism followed Langmuir adsorption behavior, suggesting adsorption of organic species at the aluminum–solution interface. These findings demonstrate that yerba mate extract is an effective corrosion inhibitor.

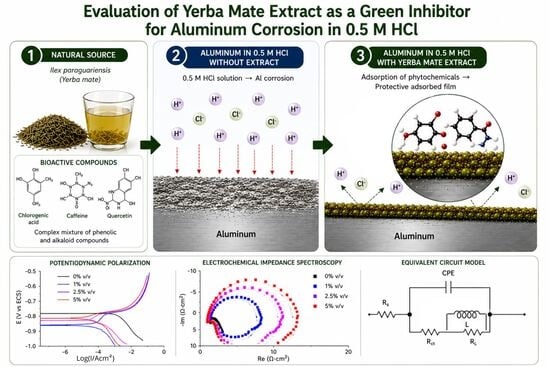
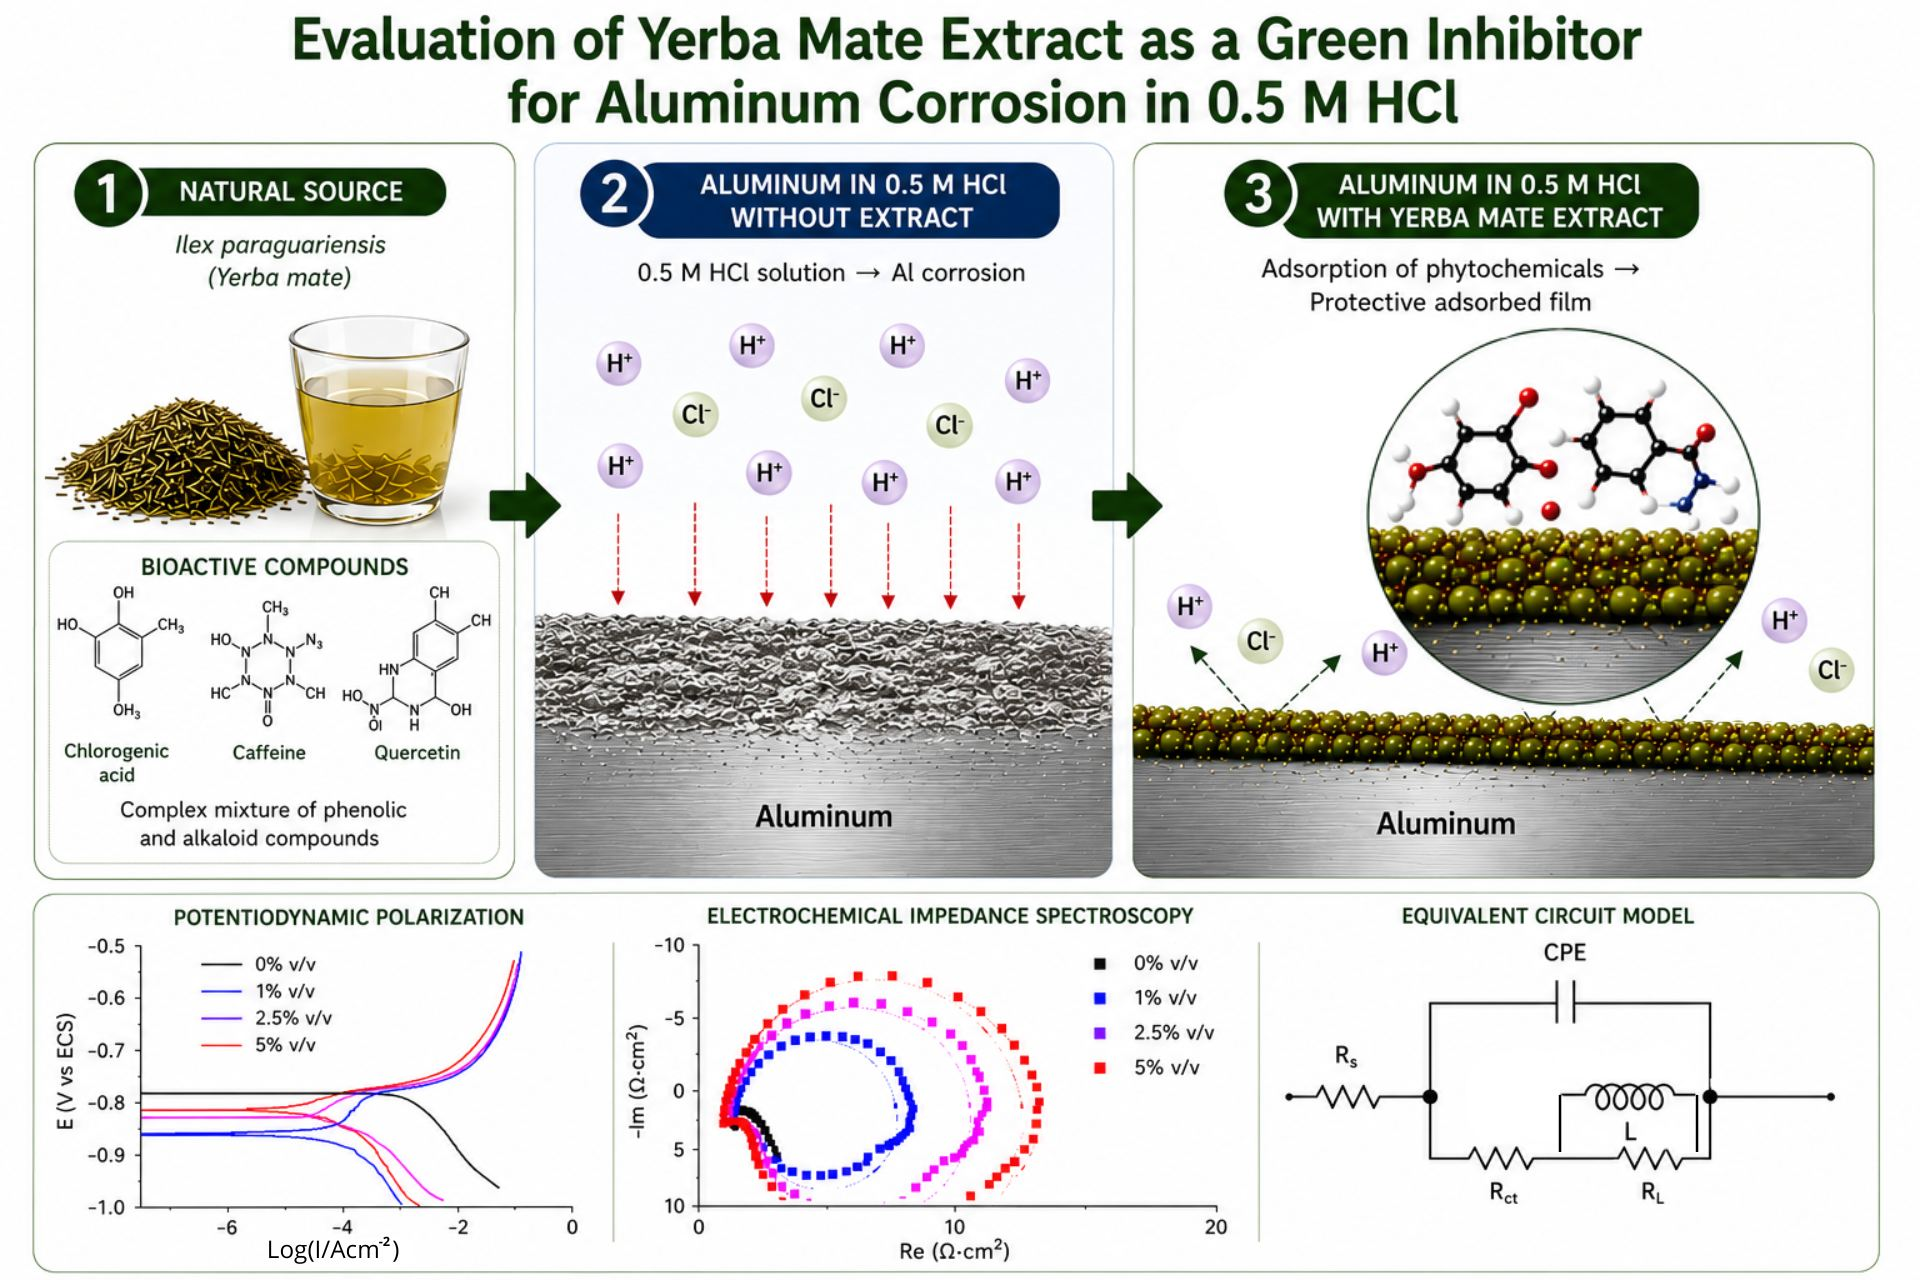
Graphical Abstract

1. Introduction

Corrosion is a natural process of degradation in metallic materials caused by the exchange of ions with the surrounding environment (chemical or electrochemical reactions) [1]. This phenomenon results in significant economic losses for countries, and preventing or slowing down the corrosion process requires substantial investments; therefore, it is essential to design and implement corrosion protection strategies to minimize these economic losses [2].
Corrosion is, in many cases, the cause of process plant shutdowns and reduced equipment operating efficiency [3], and the occurrence of accidents such as fires, explosions, and the release of toxic substances into the atmosphere, water, or soil [4,5].
Among the various methodologies for controlling and reducing corrosion, the use of inhibitors is one of the most common, as it preserves the service life of metals [6]. Corrosion inhibitors are chemical substances that, when added in small quantities to a corrosive environment, significantly reduce the corrosion rate of both pure metals and alloys [7].
In general, synthetic inhibitors can be costly and hazardous to living organisms due to their high toxicity [8,9]. These compounds can enter natural water bodies and spread throughout ecosystems, potentially causing adverse effects on sensitive species. In this context, numerous studies have focused on green inhibitors or organic bioinhibitors, which are characterized by their biodegradability and lower environmental impact [10]. Eco-friendly corrosion inhibitors derived from green sources rich in alkaloids and polyphenols have garnered interest [11]. These compounds, which contain heteroatoms such as N, O, and S, are capable of adsorbing onto metal surfaces to form a protective barrier that limits electrochemical attack. Although not all eco-friendly inhibitors share the same characteristics, their performance depends largely on the environmental conditions to which they are exposed (temperature, pH), their molecular structure, and their interaction with other chemicals [7].
Yerba mate extract (Ilex paraguariensis) is obtained from the plant of the same name, belonging to the Aquifoliaceae family, which is found primarily in South America [12,13].
The two main compounds in yerba mate are polyphenols (chlorogenic acid) and xanthines (caffeine and theobromine), followed by purine alkaloids (caffeic acid, 3,4-dicaffeoylquinic acid, and 3,5-dicaffeoylquinic acid), flavonoids (quercetin, kaempferol, and rutin), amino acids, minerals (P, Fe, and Ca), and vitamins (C, B1, and B2) [14,15]. Previous studies have investigated the influence of yerba mate extract on the inhibition of copper corrosion in 0.5 M NaCl and 1 M HCl solutions, and aluminum in 0.5 M NaCl at room temperature [16], and on aluminum in 0.1 M HCl at different temperatures [10], where it has been demonstrated that yerba mate inhibits corrosion. The production and industrial processing of yerba mate in Argentina reaches approximately 277,000 tons of processed yerba mate annually. According to estimates provided by the industry, about 3% of this production corresponds to residual dust and stems, representing nearly 8000 tons of unused agro-industrial waste with potential application as a raw material for corrosion inhibitors [17]. Owing to their high content of polyphenols, alkaloids, and oxygen-containing compounds, these residues constitute a promising renewable source of corrosion-inhibiting molecules. Therefore, their valorization as green corrosion inhibitors could simultaneously contribute to sustainable corrosion protection and to the circular utilization of agro-industrial waste.
The present study evaluates the extract obtained from the processing of yerba mate dust, a residue generated by the yerba mate industry, in an acidic medium (0.5 M HCl) over a wide temperature range. In addition, the formation and stability of the protective layer adsorbed on the aluminum surface, generated in situ through the adsorption of organic compounds dissolved in the solution, are investigated by means of electrochemical, spectroscopic, morphological, and wettability analyses.

2. Materials and Methods

2.1. Yerba Mate Extract Preparation

The aqueous extract was prepared by weighing 100 g of the yerba mate powder mixture obtained from an industrial processing facility as a by-product of the fine grinding stage of production. Next, 500 mL of distilled water at 333 K was added to the mixture, and the solution was transferred to another container by filtering through a metal mesh filter. The entire contents were then transferred to Falcon tubes, which were weighed in pairs and placed in the centrifuge for 10 min. Finally, the entire contents of the test tubes were poured into a 500 mL container and filtered using standard filter paper.
The resulting extract was allowed to cool to room temperature (298 K). Finally, the solids were discarded, and the yerba mate extract was stored in the refrigerator for up to 48 h before use as an inhibitor.

2.2. Voltammetry

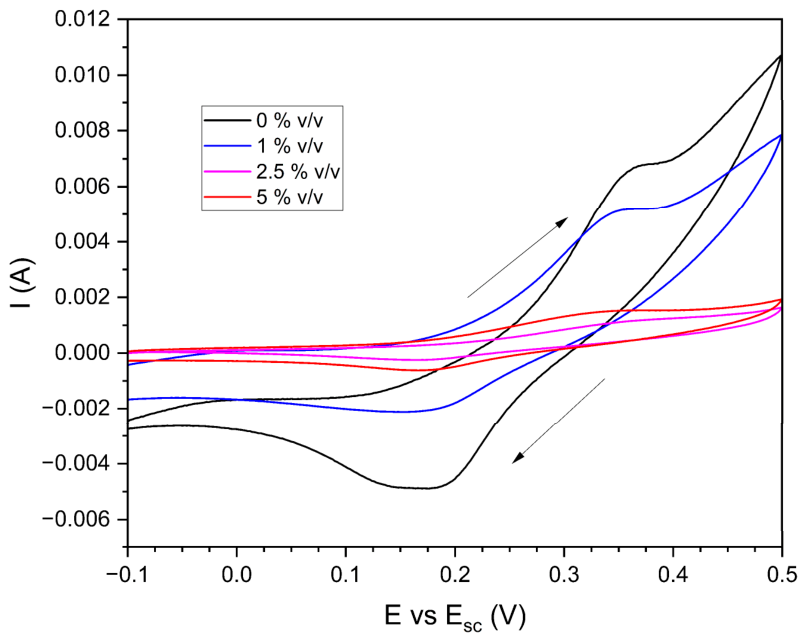
To characterize the medium, cyclic voltammetry was performed in a 0.5 M HCl solution without an inhibitor and then with inhibitors at 1, 2.5, and 5% v/v yerba mate extract at 298 K. The scan was performed in a three-electrode cell, from −0.1 V to 0.5 V vs. a calomel electrode and back, at a scan rate of 0.1 V s−1 [18], using a glassy carbon electrode as the working electrode and a platinum counter electrode, to identify the reactions occurring in the acidic medium with and without an inhibitor. The measurements were performed on a Gamry Reference 600 potentiostat/galvanostat (Gamry Instruments manufacturer, Warminster, PA, USA). It can be observed in Figure 1 that for the acidic medium, both with and without inhibitor, the peaks appearing in the anodic direction shift toward the cathodic direction; this indicates that the reaction occurring is not reversible, as the differences between the two potentials exceed 59 mV. As the concentration of the inhibitor in the acidic medium increases, the total charge decreases due to the adsorption of organic compounds onto the surface of the working electrode [19].

2.3. Preparation of Aluminum Samples and Solutions

The material used was a sheet of the commercial aluminum alloy 99.87% Al, balance with 0.06% Fe, 0.05% Si, and 0.01% Zn (supplied by AMEX® S.A., Ciudad de Buenos Aires, Argentina). Samples measuring approximately 6.5–7.5 cm2 were cut for the weight loss tests, and 1 cm2 samples were cut to assemble working electrodes for use in the electrochemical measurements. The samples were ground with SiC paper with grit sizes of #500, #600, #1000, and #1200, washed with distilled water, and finally air-dried. Analytical-grade 0.5 M HCl (supplied by Biopack, OneLab, Buenos Aries, Argentina) solutions were prepared, both with and without an inhibitor, at concentrations of 1%, 2.5%, and 5% v/v of yerba mate extract soluble in acid.

2.4. Weight Loss Tests

Due to the aggressiveness of the medium, the aluminum samples were placed in four sealed containers for 2 h at different temperatures, 298 K, 308 K, 315 K, and 323 K in a 200 mL volume of solution. This time was set because preliminary tests showed severe degradation of the sample without an inhibitor. Upon removal, the test tubes were washed with distilled water, placed in an ultrasonic bath, and air-dried. They were weighed before and after the test, and the weight loss was recorded on an analytical balance with a precision of 0.1 mg. The corrosion rate by weight loss was calculated using Equation (1):
C R = W A × t
where ΔW represents the weight loss, A the exposed surface area of the sample, and t the immersion time.
The inhibitor efficiency was calculated using Equation (2):
η w ( % ) = C R 0 C R i C R 0   ×   100
where C R 0 is the corrosion rate (g cm−2 h−1) of aluminum in the absence of the inhibitor, and C R i in its presence.

2.5. Potentiostatic Polarization Curves

A conventional three-electrode electrochemical cell was used, consisting of a working electrode, a platinum counter electrode, and a saturated calomel reference electrode (ECS = +0.244 V vs. ENH). Prior to the scan, the cell was left in open circuit for 30 min. Then, starting 200 mV below the open-circuit potential (Eop), the potential was increased in the anodic direction at a rate of 0.16 mV s−1 up to −0.6 V vs. ECS, in accordance with ASTM G5-87 [20]. From these measurements, the corrosion potential (Ecorr), polarization resistance (Rp), and corrosion current density (Icorr) were obtained via Tafel extrapolation. The inhibitor efficiency was calculated using the corrosion current values. The measurements were performed on a Gamry Reference 600 and Gamry Reference 1000 potentiostat/galvanostat.
Using these data, the inhibition efficiency (η%) was determined, calculated from the obtained Icorr values using Equation (3):
η I ( % ) = I c o r r 0 I c o r r i I c o r r 0 × 100
where I R 0 is the corrosion current density of aluminum in the absence of the inhibitor and I R i in its presence.

2.6. Electrochemical Impedance Spectroscopy (EIS) Tests

The EIS measurements were performed in a frequency range from 1 × 10⁵ Hz to 1 × 10⁻² Hz, with an amplitude of ±10 mV relative to the open-circuit potential, after leaving the system in an open-circuit state for 30 min, using a three-electrode cell. Based on the impedance measurements, the obtained values are fitted to an equivalent circuit model; this model explains the corrosion mechanism in the presence and absence of the inhibitor. The charge transfer resistance (Rct) was obtained from the fit. The efficiency of the inhibitor is calculated using Equation (4). The measurements were performed on a Gamry Reference 600 and Gamry Reference 1000 potentiostat/galvanostato (Gamry Instruments manufacturer, Warminster, PA, USA):
η R ( % ) = R c t i R c t 0 R c t i 100
where R c t 0 is the charge transfer resistance of aluminum in the absence of the inhibitor and R c t i in its presence.

2.7. Thermodynamic Adsorption Analysis

The adsorption isotherms, such as the Langmuir, Frumkin, El-Awady, and Temkin, were used to determine the inhibition property. To determine the most suitable adsorption isotherm, the calculated θ values for different concentrations of the inhibitors, according to the following:
θ = η w ( % ) 100
where nw (%) is the inhibition efficiency obtained from the weight loss tests.

2.8. Thermodynamic Parameters Obtention

The apparent activation energy for aluminum corrosion in acid, in the absence and presence of an inhibitor, was determined using the Arrhenius equation, Equation (6):
l o g C R = E a 2.303 R T + log A
where CR is the corrosion rate, Ea is the apparent activation energy, T is the absolute temperature, R is the ideal gas constant (8.314 J K−1 mol−1), and A is the frequency factor.
To calculate the enthalpy ( H a ) and activation entropy ( S a ) values, we use Equation (7):
l o g C R T = [ l o g k b h + ( S a 2.303 R ) ] ( H a 2.303 R T )
where kb is the Boltzmann constant, and h is Planck’s constant.

2.9. Fourier-Transform Infrared Spectroscopy (FTIR)

To identify the functional groups present in the yerba mate extract and on the surface of aluminum samples subjected to different conditions, Fourier transform infrared spectroscopy (FTIR) was performed using a Shimadzu IRSpirit FT-IR spectrometer (Shimadzu Corporation, Kyoto, Japan) with QATR-S AT (Kyoto, Japan) in the 3800–500 cm−1 region.

2.10. Surface Analysis

2.10.1. Scanning Electron Microscopy (SEM) and Energy Dispersive X-Ray Spectroscopy (EDXS)

The surface of the samples subjected to mass loss tests, both in the absence and presence of the inhibitor, was analyzed using scanning electron microscopy (SEM) with a ZEISS GeminiSEM 460 scanning electron microscope (ZEISS Group manufacturer, Oberkochen, Germany) equipped with an Energy Dispersive X-ray Spectroscopy system Oxford Instruments Ultim Max 65 EDS detector and operated via Aztec software version 6.3 (Oxford Instruments, High Wycombe, UK).

2.10.2. Water Contact Angle (WCA) Test

The contact angle was determined using the sessile drop method, in which microdroplets were deposited onto the solid surface using a micropipette. A goniometer, fabricated and calibrated at the Materials, Modeling, and Metrology Program (PMMM) Laboratory of the Misiones Institute of Materials (IMAM), was used for image acquisition and contact angle measurement.
Measurements were performed using droplets of 2 µL or 5 µL volume, depending on the droplet’s geometric stability on the surface, at a temperature of 295 ± 2 K and a relative humidity of 45 ± 10%. For each sample, 5 droplets were deposited in different regions of the surface to assess spatial variability.

2.10.3. X-Ray Diffraction (XRD)

XRD patterns were obtained from the aluminum surface before and after exposure to 0.5 M HCl solution, in the absence and presence of yerba mate extract with a SmartLab® X-ray (Rigaku Corporation, Tokyo, Japan) diffractometer (Cu Kα (λ = 1.5418 Å), 40 kV and 50 mA, 2θ from 30° to 80°, scan speed 4.00°/min).

3. Results and Discussion

3.1. Weight Loss Analysis

Table 1 shows the results of the weight loss measurements in the presence and absence of yerba mate extract at different concentrations and temperatures.
A reduction in the corrosion rate (CR) is observed with the use of the inhibitor; the higher the inhibitor concentration in the solution, the lower the corrosion rate. This is reflected in the efficiency (ηw%). The increase in efficiency can be attributed to the adsorption of the inhibitor’s organic compounds onto the aluminum surface. Likewise, an increase in the surface layer is closely linked to a decrease in the severity of corrosion [10].
As the temperature increases, corrosion rates increase in both the blank solution and the solutions containing the extract. On the other hand, it is observed that as the inhibitor concentration increases, the inhibition efficiency is higher, and that even at high temperatures, the protection efficiency also increases.

3.2. Adsorption Isotherm

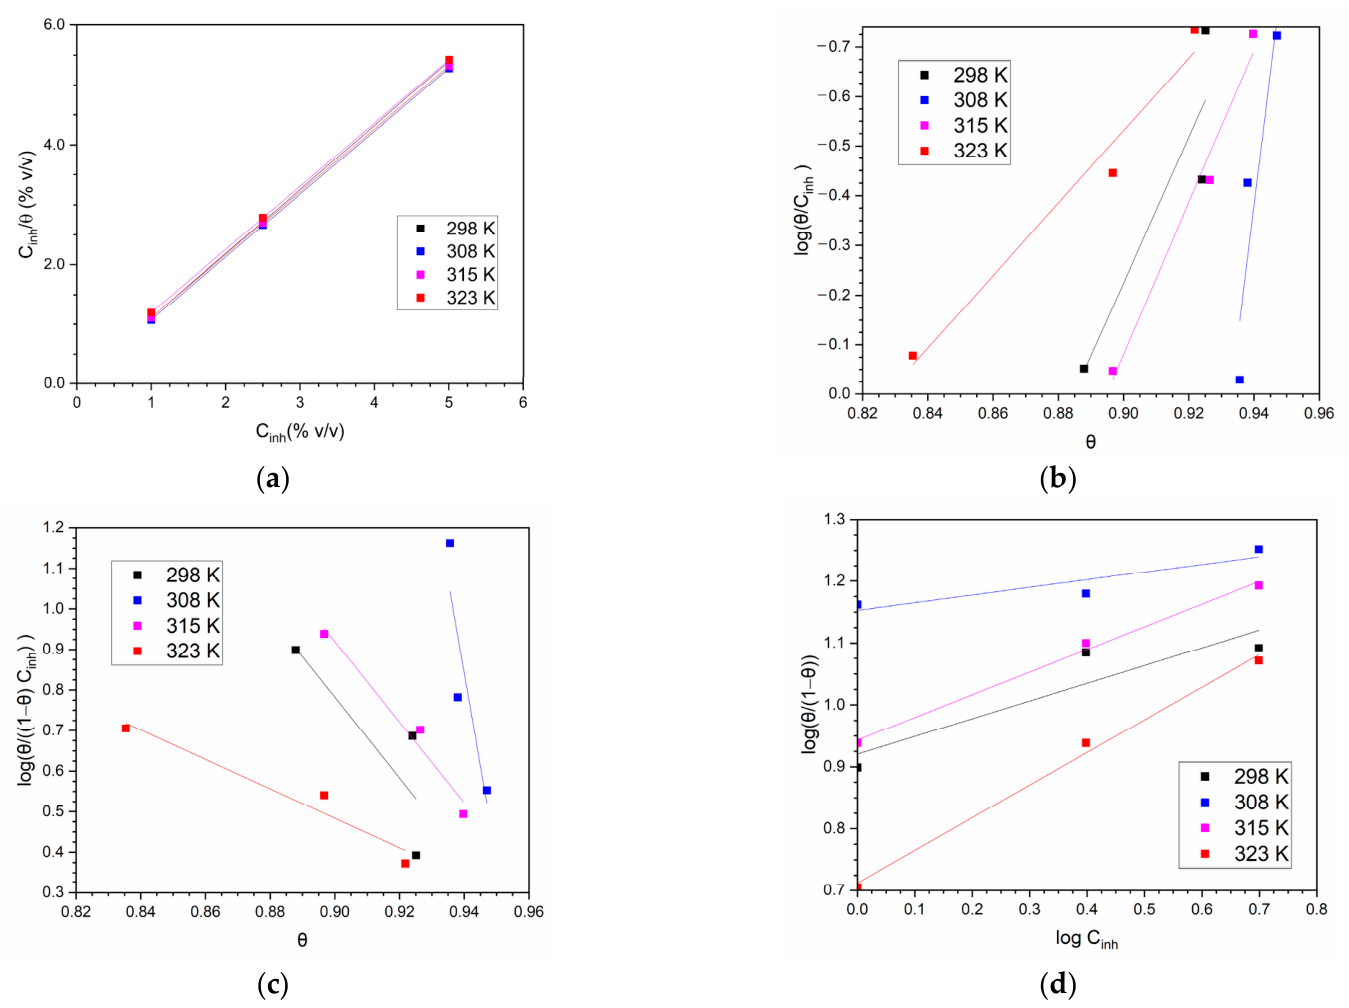
To understand the adsorption mechanism of yerba mate compounds on Al in HCl, the mass loss data from Table 1 were used to fit different adsorption isotherms, such as Langmuir, Temkin, Frumkin, and El-Awady, using the coefficient of determination (R2) for model evaluation.
The corresponding isotherms, equations, and values of the linear regression coefficients are shown in Table 2.
In Table 2, Cinh is the inhibitor concentration in % v/v, and Kads is the adsorption–desorption constant. Figure 2 presents the fits of the experimental data to the different adsorption isotherm models.
The Langmuir isotherm is the one that best fits since it has an R2 = 1. In Figure 2a, the mechanism describes a monolayer adsorption with fixed reaction sites, uniform energy, and the absence of interactions between adsorbed molecules. The Kads values are obtained from the inverse of the slope, being 22.08 (% v/v)−1 at 298 K, 42.02 (% v/v)−1 at 308 K, 15.02 (% v/v)−1 at 315 K, and 7.00 (% v/v)−1 at 323 K. The maximum value is found at 308 K, then as the temperature increases, Kads decreases, indicating that the adsorption capacity of the extract decreases, which is consistent with the mass loss tests [21]. Because the yerba mate extract contains several compounds in different proportions, the Gibbs free energy of adsorption, ΔGads, cannot be calculated [22].

3.3. Effect of Temperature

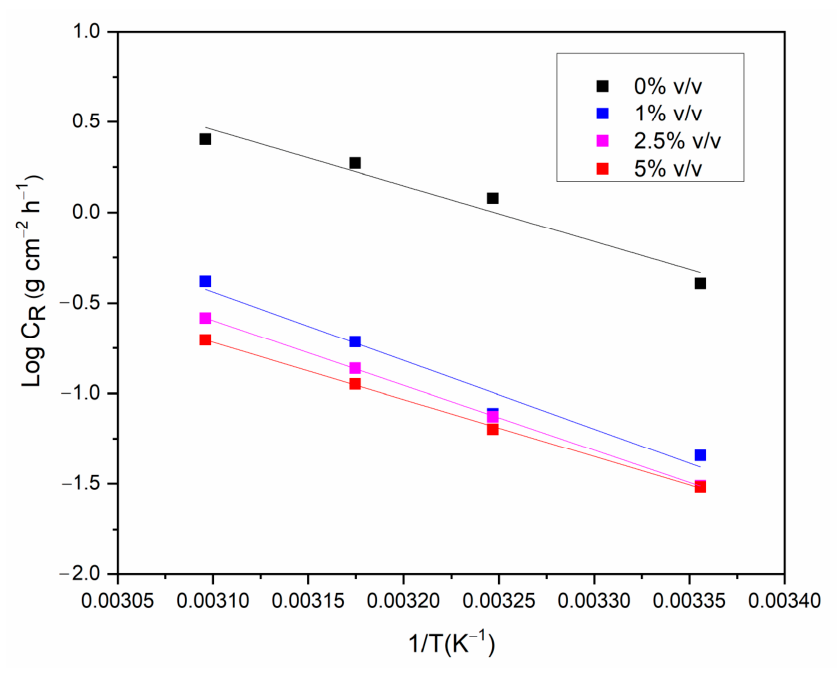
Plotting the corrosion rate against T−1 yields Figure 3, where regression analysis provides a line that gives information on the corresponding parameters (Table 3), according to Equation (6), including the slope values, intercept, and correlation coefficients; the closer the value is to 1, the better the fit, which would indicate that the corrosion rate could be explained by molecular kinetic theory [10].
The activation energy shown in Table 4 was determined from the regression parameters in Table 3.
The Ea value without inhibitor is 58.34 kJ mol−1. It increases with the addition of yerba mate extract, indicating that corrosion slows down in the presence of the inhibitor due to the formation of an energy barrier between mass transfer and charge transfer generated by the inhibitor adsorbed on the surface [23]. Ea decreased with increasing inhibitor concentration and, as observed in Table 4, the efficiency increased with temperature from 298 K to 308 K and then decreased slightly up to 323 K, maintaining a constant increase with extract concentration. Although the thermal stability of individual phenolic compounds was not directly evaluated in this study, the sustained inhibition performance suggests that any possible oxidation or degradation of the phytochemical constituents was not sufficient to significantly affect the protective action of the adsorbed layer on the metal surface. Previous studies on yerba mate extracts have reported the preservation of their phytochemical properties at temperatures up to 333 K [24], supporting the hypothesis that severe thermal degradation is unlikely under the conditions investigated herein. The increase in temperature can produce chemical changes in the inhibitor molecules, thereby increasing the electron density at the molecule’s adsorption sites, which enhances inhibition efficiency [10]. Values of Ea ≤ 20 kJ mol−1 are associated with physical adsorption, and Ea ≥ 80 kJ mol−1 suggests chemical adsorption; values between these indicate mixed adsorption [25,26].
The obtained thermodynamics parameters according to Equation (7) are presented in Table 4. The positive values for the activation enthalpy and the enthalpy change reflect the endothermic nature of the aluminum dissolution process. The Ea values are greater than those of ΔHa, which indicates that a gaseous reaction may be involved, associated with the release of hydrogen. The average difference between Ea − ΔHa is 2.58 kJ mol−1, indicating that the corrosion process is a unimolecular reaction [27]. Entropy values decrease with increasing inhibitor concentration, indicating that the process becomes more ordered as the metal surface is covered; furthermore, the adsorption process is quite slow, and the rate-determining step is adsorption rather than desorption [28].

3.4. Fourier-Transform Infrared Spectroscopy (FTIR) Analysis

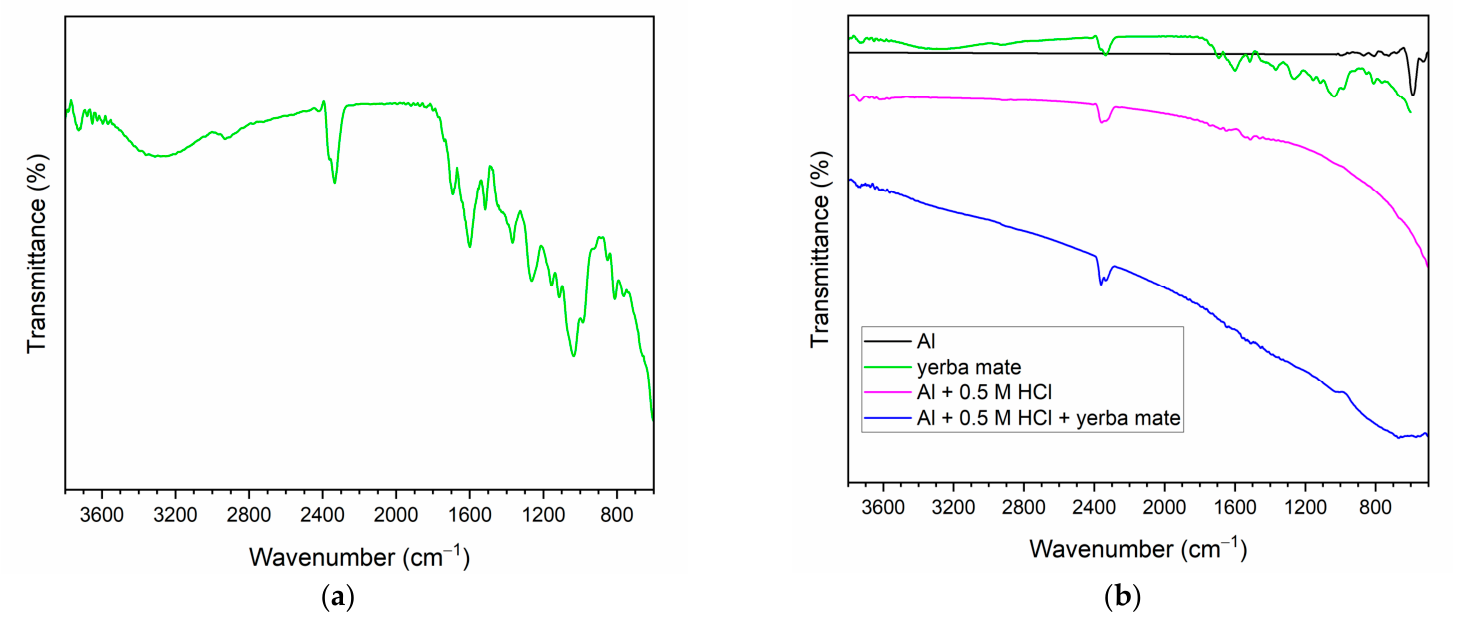
The functional groups present in the yerba mate extract were characterized; these are the groups that will adsorb onto the Al surface. Figure 4a shows the FTIR spectrum. The results show a peak for the –OH group at 3350–3250 cm−1, which is characteristic of phenolic compounds. Values between 3000 and 2800 cm−1 represent –CH3 and –CH2– groups, which may indicate the presence of caffeine. The bands between 1700 and 600 cm−1 are characteristic, with 1370 cm−1 assignable to C–H bonds representative of aliphatic hydrocarbons. At 1700 cm−1 is characteristic of C=O groups and 1600 cm−1 of C=C, which may represent antioxidant compound groups. At 1280 cm−1 the C–O bond and 1150 cm−1 correspond to C–O of ester groups and C–OH bonds. The 1040 cm−1 band may be due to C–N in aliphatic amines. The peak observed near 2350 cm−1 is attributed to atmospheric CO2 present in the optical path of the spectrophotometer and does not correspond to any component of the yerba mate extract [29]. In Figure 4b, FTIR spectra were acquired from the surface of polished Al prior to its immersion in the 0.5 M HCl solution, Al immersed in a 0.5 M HCl solution without an inhibitor, and in the presence of an inhibitor; changes in the spectra can be observed. The FTIR spectrum of polished Al exhibits a nearly flat baseline and high transmittance, with a band located near 600 cm−1, assigned to Al–O stretching vibrations [30]. The spectrum obtained from Al exposed to the acidic solution exhibits a decrease in transmittance below 1800 cm−1, indicating changes on the metal surface, either due to the presence of corrosion products or to an increase in surface roughness. In the case of Al exposed to the acidic solution in the presence of the inhibitor, weak absorption bands are observed that are absent or less evident on the surface without the inhibitor. The lower transmittance, compared with Al in the absence of the inhibitor, may support the adsorption of phytochemical components and the formation of an interfacial layer on the metal surface [31]. The presence of bands in the 1700–1500 cm−1 region, associated with C=O and C=C groups, suggests the presence of organic species derived from the yerba mate extract on the aluminum surface. In addition, a weak band observed at approximately 1050 cm−1 indicates the presence of γ-AlO4 species [32,33].

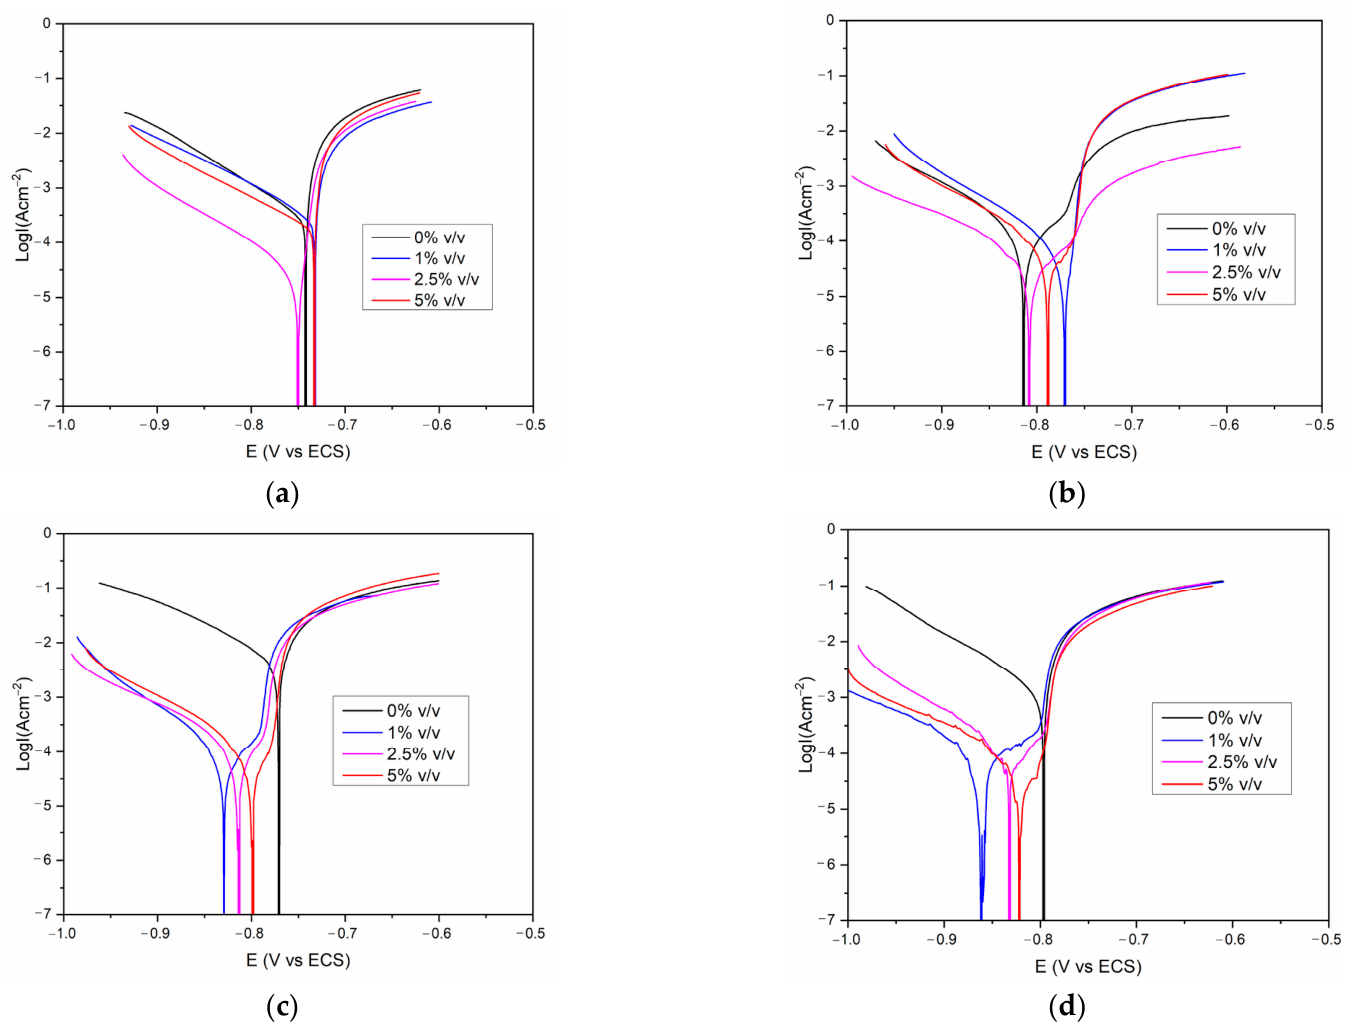
3.5. Potentiodynamic Polarization Curves

Potentiodynamic polarization curves of aluminum in 0.5 M HCl solution were obtained, both in the presence and absence of yerba mate extract as a corrosion inhibitor, at different temperatures and concentrations, as shown in Figure 5. From these curves and using Tafel’s linear extrapolation, the electrochemical parameters were determined and are summarized in Table 5. It was observed that the change in corrosion potential does not exceed ±85 mV across the different concentrations; therefore, it is considered that the yerba mate extract is acting as a mixed-type inhibitor, influencing both anodic and cathodic processes [10,34]. The measurements performed at 298 K (Figure 5a), and, in general, those corresponding to aluminum without inhibitor at the other temperatures, show that once Ecorr is reached, a continuous increase in current occurs along the anodic polarization curve, which is associated with the direct dissolution of the material. This characteristic feature of polarization curves for aluminum and its alloys is related to the presence of oxygen in the solution, indicating that aluminum in HCl undergoes localized corrosion upon reaching Ecorr. Therefore, under these conditions, Ecorr can be considered as the pitting potential, Epit [35,36].
In the potentiodynamic measurements carried out at 308, 315, and 323 K, a narrow potential range is observed in which the current remains nearly constant, with values of 50, 63.1, and 158.49 μA cm−2, respectively. This behavior suggests the formation of a poorly stable film on the aluminum surface [37]. At higher overpotentials, a limiting diffusion current appears in the anodic polarization curves, indicating that, at high current densities, the transport of ions toward the electrode surface becomes the rate-determining step (concentration polarization). Under these conditions, the anodic branch exhibits the smallest changes, suggesting that the inhibitor does not significantly affect the anodic reaction, except at 315 K [16].
The corrosion current density decreases with increasing extract concentration, reaching a maximum inhibition efficiency of 99% at 315 K and 323 K, respectively, indicating a reduction in corrosion rate due to the adsorption of the inhibitor on the aluminum surface [38]. The Tafel slopes (βa and βc) did not change significantly with increasing inhibitor concentration, indicating that the addition of the extract does not significantly alter the kinetics of the electrochemical reactions involved in the corrosion process. This behavior suggests that the inhibitor acts primarily through its adsorption onto the aluminum surface, blocking the active sites responsible for both the anodic dissolution of the metal and the cathodic hydrogen evolution reaction, without appreciably altering the fundamental mechanism of the corrosion process [39].
Most corrosion inhibitors work by adsorbing onto the metal surface and through coordination processes; the electrons in the π bonds of organic compounds and the non-bonding electron pairs can form strong bonds with Al (back-donation and chemisorption). Furthermore, Al3+ ions can associate with heterocyclic, hydroxyl, and carboxyl groups (physisorption) [32].

3.6. Electrochemical Impedance Spectroscopy (EIS)

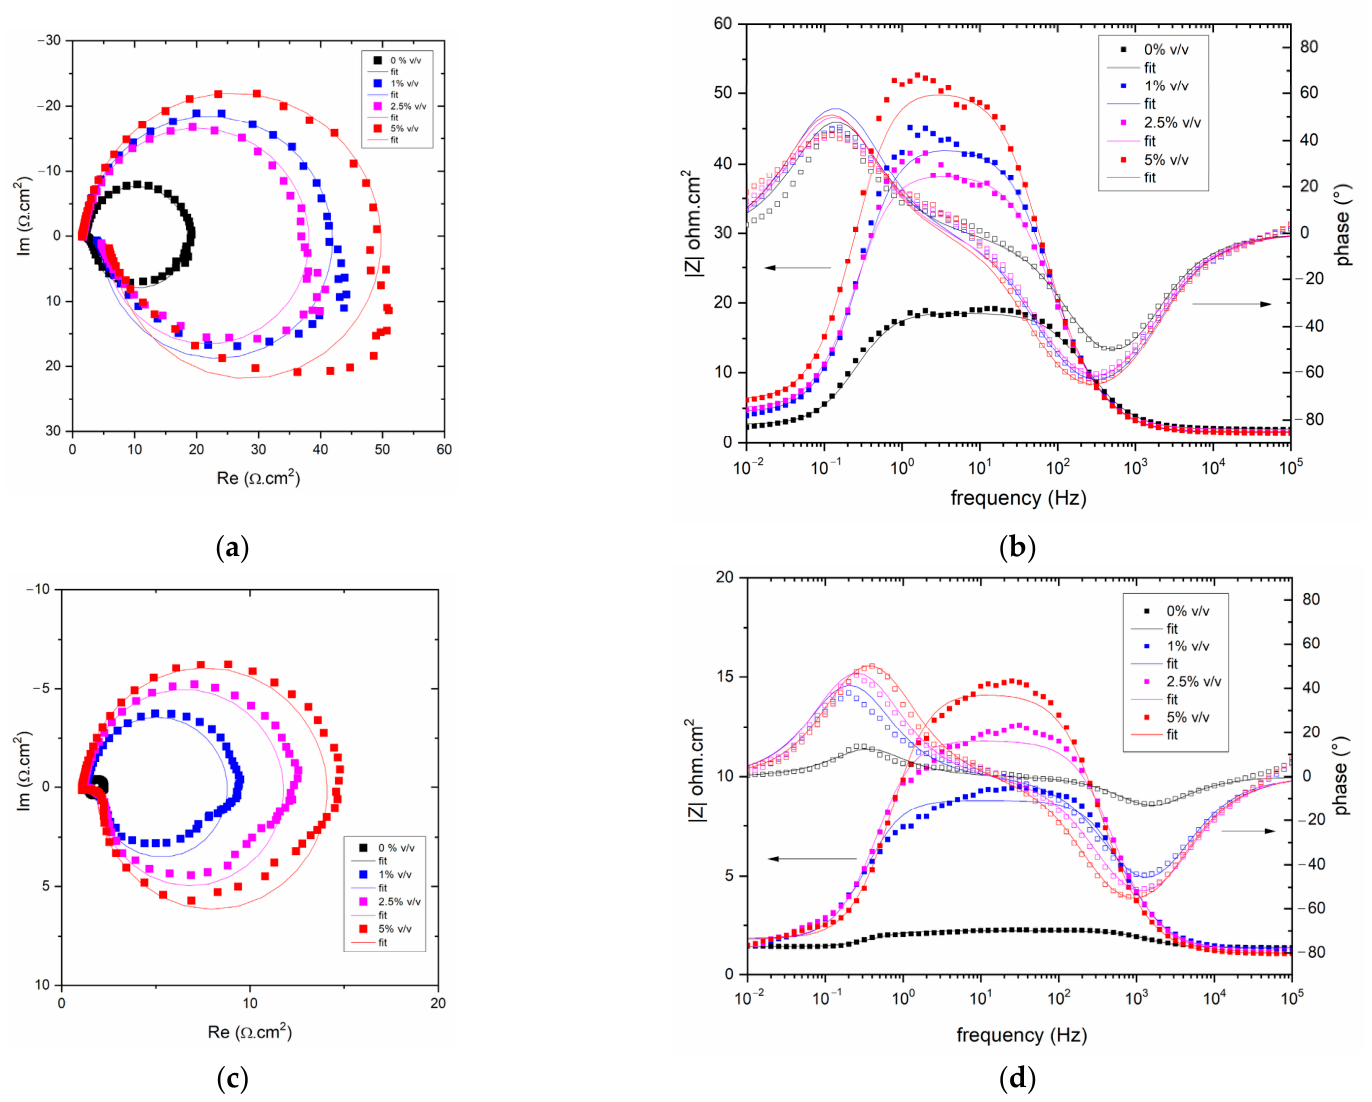
These measurements allow for the investigation of corrosion inhibition processes at the metal-solution interface, facilitating a better understanding of the inhibition mechanisms. Figure 6 shows the Nyquist and Bode plots obtained at different extract concentrations and temperatures of 298 K and 323 K, respectively. These plots exhibit two main characteristics: a capacitive loop in the high-frequency region and an inductive loop at low frequencies. The diameter of the inductive arc is slightly smaller than that of the capacitive arc. The capacitive behavior can be related to the relaxation processes associated with the natural oxide film present on the aluminum surface. On the other hand, the inductive response at low frequencies is generally attributed to adsorption and desorption phenomena of intermediate species on the electrode surface during the corrosion process [40]. A semicircular shape is observed in both measurements with and without the inhibitor, indicating that the corrosion mechanism is independent of the inhibitor, consistent with what was discussed when analyzing the results of the potentiodynamic measurements. The charge transfer resistance (Rct) increases slightly with the concentration of the inhibitor; therefore, the inhibitor appears to form a barrier on the metal surface, preventing the charge transfer reaction and thereby reducing the corrosion rate [41].
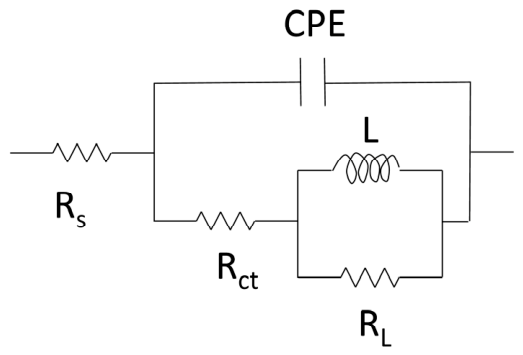
The EIS results are simulated by fitting an equivalent circuit of the form Rs(CPE(Rct(LRL))) as shown in Figure 7, where Rs is the solution resistance representing the ohmic resistance of the electrolyte between the working electrode and the reference electrode, CPE represents the constant-phase element, Rct is the charge transfer resistance describing the kinetics of the aluminum dissolution process, and L and RL represent the resistance and inductance of the impedance, respectively.
In the equivalent circuit model, the ideal double-layer capacitance (Cdl) was replaced by a constant-phase element (CPE) to describe the non-ideal behavior of the electrochemical interface. This behavior is generally attributed to surface heterogeneities present on the electrode, including roughness, grain boundaries, surface imperfections, and adsorption of species on the metal surface [42]. Equation (8) was used to calculate Cdl [43].
C d l = Y 0 1 / n · R c t ( 1 n ) / n
where Y0 is determined by the CPE, Rct is the load transfer resistance, and n represents the deviation from ideal behavior, which may indicate surface roughness or the presence of interfacial phenomena, and the values range from 0 to 1 [42].
Table 6 shows that Rct increases with inhibitor concentration, which could indicate the adsorption of organic molecules onto the aluminum surface [44]. It is also observed that the values of n decrease as the extract concentration increases, indicating that although the surface is fairly homogeneous, the adsorption of the inhibitor is not uniform, since in the absence of the inhibitor, the value of n is slightly higher [42]. In many inhibited systems, the decrease in Cdl with inhibitor concentration is attributed to the displacement of water molecules by less dielectric organic molecules and to the increase in the effective thickness of the adsorbed layer [39]. In this case, Cdl increases with increasing extract concentration, which may involve changes in the local dielectric environment and in the heterogeneity of the adsorbed film [40]. Therefore, the inhibition mechanism is not only related to the formation of a protective film on the metallic surface due to the enhanced adsorption capacity of organic compounds [45], but also to modifications in the charge-transfer kinetics, as evidenced by the increase in Rct. Furthermore, the inductive loop observed at low frequencies may be associated with adsorption–desorption processes or with the relaxation of adsorbed intermediate species on the electrode surface [33]. The EIS results are consistent with those obtained from weight-loss and potentiodynamic polarization tests.

3.7. Surface Characterization

3.7.1. Scanning Electron Microscopy (SEM) Analysis

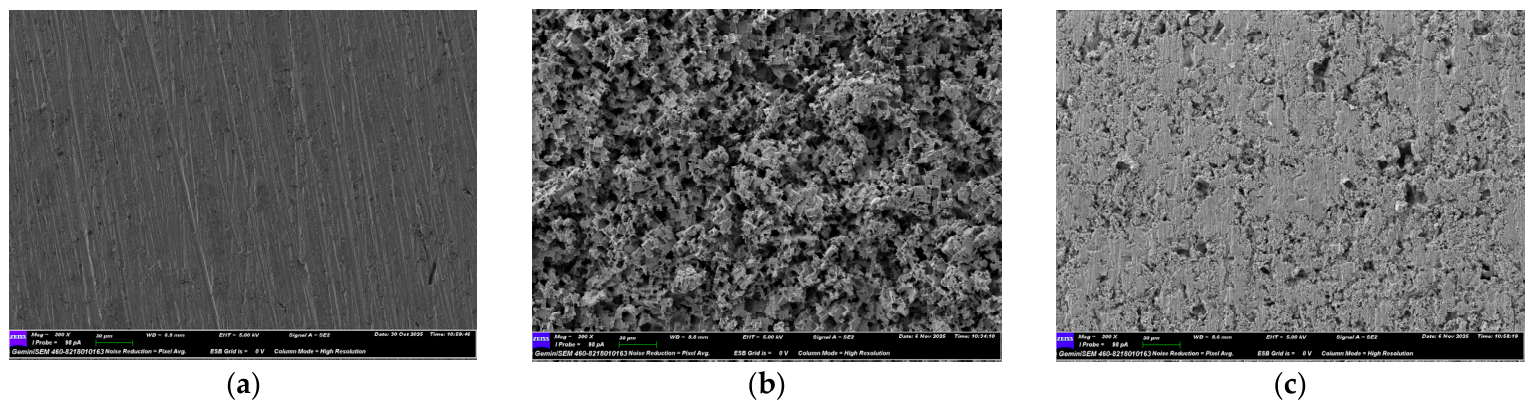
The SEM micrographs obtained for aluminum before and after exposure to 0.5 M HCl for 2 h are shown in Figure 8, respectively. Considerable differences in the morphology of the Al surfaces can be observed before and after immersion. Figure 8a shows the Al surface before exposure to the corrosive medium. Figure 8c shows that the material exhibited less corrosion due to the presence of the inhibitor, in contrast to the material that was not protected (see Figure 8b). This indicates the adsorption of the components of the yerba mate extract onto the Al surface, forming a film that protects the surface from corrosion, demonstrating its inhibitory efficiency [46].

3.7.2. Energy Dispersive X-Ray Spectroscopy (EDS)

Energy-dispersive X-ray spectroscopy (EDS) was used to examine the surface of polished aluminum without exposure to the corrosive medium, as well as aluminum exposed to the acidic solution in the absence and presence of yerba mate extract (Figure 9). No evidence of chloride accumulation on the aluminum surface was observed by EDS. The EDS spectrum of polished, unexposed aluminum (Figure 9a) shows a high Al content (88.5 wt.%) and 4.4 wt.% O, which is attributed to the naturally formed Al2O3 layer on the aluminum surface. The presence of C may be associated with contamination of samples exposed to air (Table 7).
Figure 9b,c shows the EDS spectra of aluminum after immersion in 0.5 M HCl in the absence and presence of the inhibitor at 298 K, respectively. The decrease in oxygen content from 4.4 to 2.0 wt.% (Table 7) when Al is exposed to 0.5 M HCl without an inhibitor indicates the destruction of the protective oxide film. The EDS spectra obtained for aluminum exposed to the acidic medium in the presence of yerba mate extract showed a slight increase in carbon (from 8.5 to 9.0 wt.%) and oxygen (from 2.0 to 3.3 wt.%) contents, accompanied by a decrease in the aluminum percentage. This behavior suggests the adsorption of organic compounds present in the extract onto the metallic surface and the formation of a protective film through the adsorption of functional groups rich in C and O.
These results are consistent with the proposed inhibition mechanism and the FTIR analyses, and support the efficiency values obtained from weight-loss and electrochemical measurements, indicating that the adsorbed layer limits the direct contact between aluminum and the corrosive medium [34].
Figure 9d,e shows the EDS spectra of the aluminum surface after immersion in 0.5 M HCl in the absence and presence of yerba mate extract at 323 K. For the sample without inhibitor, an Al content of 87.0 wt.% was obtained, whereas in the presence of the extract, this value decreased to 83.6 wt.%. In contrast, the carbon content increased from 8.2 to 12.1 wt.% (Table 7), while the oxygen content showed a slight decrease from 4.8 to 4.2 wt.%. The increase in carbon content and the relative decrease in aluminum are consistent with the adsorption of organic compounds present in the yerba mate extract onto the metallic surface, suggesting a greater surface coverage of aluminum.
Although EDS analysis alone cannot unequivocally confirm the formation of a protective film, these results, together with those obtained by SEM, weight-loss measurements, electrochemical impedance spectroscopy, and FTIR analyses, support the inhibition mechanism based on the adsorption of bioactive compounds from the extract, which act as a barrier against the corrosive medium.
Regarding the differences observed with temperature for Al in the presence of yerba mate extract, although the amount of adsorbed carbon at 298 K is lower than that at 323 K, SEM images reveal that the film adsorbed in situ at 298 K is thinner but more protective than that formed at 323 K, which is thicker yet less protective. This observation correlates with the Cdl values, which, for a 5% v/v inhibitor concentration, decrease from 71.94 μF cm−2 at 298 K to 49.72 μF cm−2 at 323 K.

3.7.3. Water Contact Angle (WCA) Results

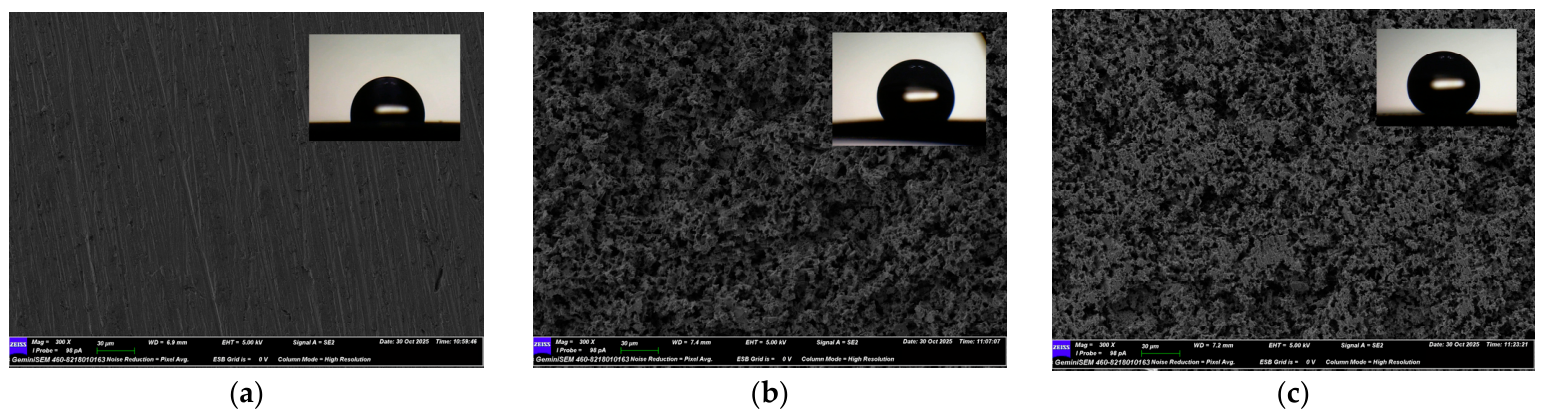
The corrosion resistance of materials can be influenced by their degree of surface wettability [47]. Therefore, in this study, water contact angle (WCA) measurements were performed to evaluate the wettability of the samples analyzed in Figure 10. The polished aluminum specimen (Figure 10a) exhibited an average WCA of 99°± 2.3°, indicating its hydrophobic nature, since water contact angles greater than 90° indicate hydrophobicity; this is due to the Al2O3 film that forms immediately [48]. However, for the specimen immersed in the acidic solution in the absence (Figure 10b) and presence (Figure 10c) of the inhibitor, the average WCAs were 137.7°± 9.8°, and 139.1°± 6.8°, respectively, making the surface even more hydrophobic. This indicates the adsorption of products on the surface that form air pockets, reducing the surface area in contact with water. The adsorption of the inhibitor to the Al surface or to the corrosion product generally occurs with the hydrophilic portion oriented toward the metal and the hydrophobic portion oriented toward the liquid phase [47]. On surfaces with high contact angles (greater than 100°), 5 µL droplets (n = 3) were used, due to the difficulty in the controlled deposition of small volumes on highly hydrophobic surfaces [49,50].

3.7.4. X-Ray Diffraction (XRD) Analysis

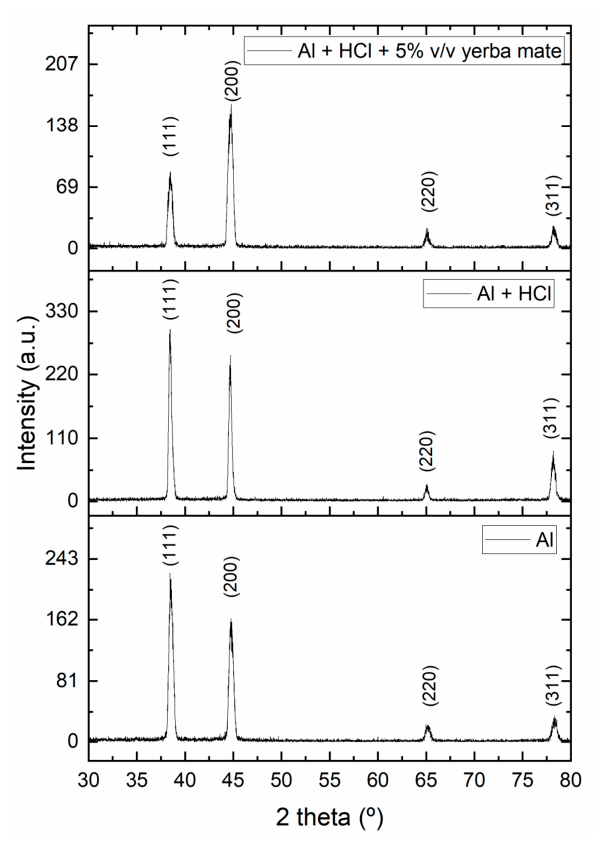
Figure 11 shows the XRD patterns of the freshly polished Al surface and of Al exposed to 0.5 M HCl in the absence and presence of the inhibitor. In all three measurements, four peaks are observed at 38.5°, 44.7°, 65.1°, and 78.2°, corresponding to the main diffraction peaks of face-centered cubic (fcc) aluminum, indexed to the (111), (200), (220), and (311) crystallographic planes [51]. This indicates that there is no evidence of new crystalline phases on the surface, either as a result of aluminum corrosion in the acidic solution without an inhibitor or due to its interaction with the yerba mate extract. If such phases are present, they are likely below the detection limit or exist in very low concentrations. However, differences in peak intensities can be observed. Al exposed to 0.5 M HCl without an inhibitor exhibits an increase in the intensity of all four peaks, which could be associated with the removal of the protective Al2O3 film, thereby exposing a greater number of underlying crystalline structures as the surface corrodes. This interpretation is supported by the SEM images shown in Figure 8b and Figure 9b.
On the other hand, the intensity of the four peaks decreases in the sample containing yerba mate extract. This behavior is likely due to the adsorption of organic compounds onto the aluminum surface, which attenuates the diffraction signal from the metal.

3.8. Suggested Mechanism

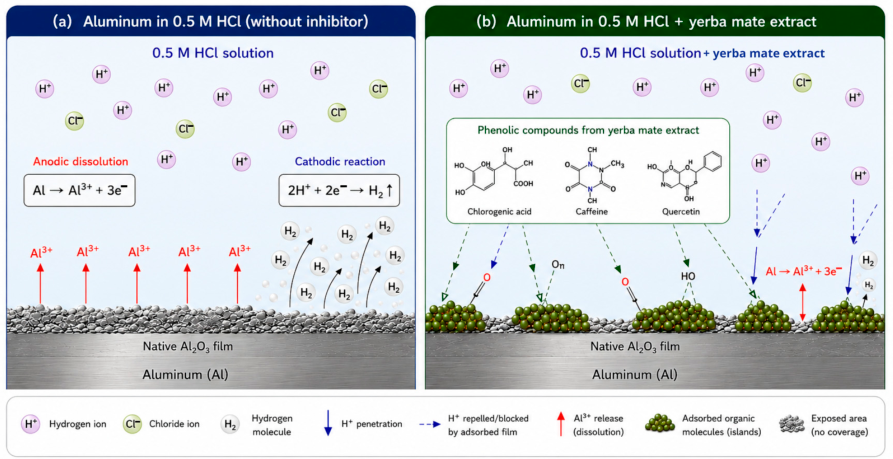
In the absence of an inhibitor, aluminum immersed in 0.5 M HCl undergoes severe corrosion because the acidic chloride medium destabilizes the native Al2O3 passive film, allowing chloride ions to promote localized film breakdown and anodic dissolution (Al → Al3+ + 3e), while the cathodic reaction proceeds through proton reduction (2H+ + 2e → H2). The high corrosion current density (icorr), high corrosion rate (CR), and charge transfer resistance (Rct) confirm rapid corrosion under these conditions (Figure 12a; this figure was created using generative AI tools).
Upon the addition of yerba mate extract, organic compounds, including polyphenols (e.g., chlorogenic acid) and xanthines (e.g., caffeine), adsorb onto the aluminum surface through a mixed physisorption and chemisorption mechanism involving electrostatic interactions and electron donation from oxygen-containing functional groups and π-electrons, Figure 12b.
The adsorption behavior was well described by the Langmuir isotherm, indicating predominant monolayer adsorption on energetically similar active sites, although electrochemical and surface analyses suggest that the adsorbed layer is heterogeneous and not perfectly uniform. This adsorbed layer acts as a mixed-type inhibitor, influencing both anodic and cathodic processes. The inhibitor mainly suppresses the cathodic hydrogen evolution reaction while only moderately affecting the anodic aluminum dissolution. The increase in activation energy (Ea) and charge-transfer resistance (Rct) further supports the formation of an effective energetic, physical, and heterogeneous barrier against the corrosive medium. Surface characterization corroborates this mechanism: contact-angle measurements revealed increased hydrophobicity (up to ~139°), FTIR spectra confirmed the presence of adsorbed organic functional groups (C=O and C=C), and XRD patterns showed a slight attenuation of the aluminum diffraction peaks, consistent with the formation of a protective organic layer that reduced the severity of the corrosion attack even at 323 K.

4. Conclusions

In this study, an aqueous extract of yerba mate (Ilex paraguariensis) was successfully evaluated as a green inhibitor of aluminum corrosion in 0.5 M HCl solution at different temperatures (298 K, 308 K, 315 K, and 323 K) and extract concentrations (1%, 2.5%, and 5% v/v).
The main conclusions are as follows:
  • Yerba mate extract is an effective green inhibitor of corrosion for aluminum in 0.5 M HCl. Weight loss tests reported a maximum efficiency of 94% at a temperature of 308 K and 5% v/v.
  • Thermodynamic analysis revealed an increase in the apparent activation energy in the presence of the yerba mate extract, indicating the formation of an energetic barrier associated with the adsorption of organic compounds on the metal. The activation energy values suggest a mixed adsorption mechanism.
  • Potentiodynamic polarization studies showed that the yerba mate extract behaves as a mixed type of inhibitor.
  • EIS results confirmed the inhibitory action of the yerba mate extract through an increase in charge transfer resistance and modification of the interfacial electrochemical behavior. The increase suggests the adsorption of organic species onto the aluminum surface.
  • Adsorption studies showed that the inhibition mechanism follows the Langmuir adsorption isotherm, suggesting monolayer adsorption of the extract components on energetically homogeneous active sites of the aluminum surface.
  • Surface analysis and droplet testing, before and after immersion, demonstrated the inhibitory efficiency of yerba mate extract. The inhibited surface exhibited lower corrosion damage and increased hydrophobicity, supporting the adsorption of yerba mate constituents and their role in reducing metal/solution interaction.
  • The results demonstrate the potential of valorizing yerba mate processing residues as a sustainable source of corrosion inhibitors, contributing to waste reduction and the development of environmentally friendly corrosion protection technologies.

Author Contributions

Conceptualization, C.M.M.; methodology, C.M.M.; formal analysis, A.A.P.A. and C.M.M.; investigation, A.A.P.A. and C.M.M.; resources, A.E.A.; data curation, A.E.A. and C.M.M.; writing—original draft preparation, A.A.P.A., A.E.A. and C.M.M.; writing—review and editing, A.E.A. and C.M.M.; visualization, A.E.A. and C.M.M.; supervision, A.E.A.; project administration, A.E.A. and C.M.M.; funding acquisition, A.E.A. All authors have read and agreed to the published version of the manuscript.

Funding

This research was funded by Universidad Nacional de Misiones (UNaM), grant numbers 16/Q2364-PI and 16/Q1111-PI.

Institutional Review Board Statement

Not applicable.

Informed Consent Statement

Not applicable.

Data Availability Statement

The data presented in this study are available on request from the corresponding author (due to privacy reasons).

Acknowledgments

All authors gratefully thank the National Scientific CONICET of Argentina (Consejo Nacional de Investigaciones Científicas y Técnicas (CONICET), Argentina). We also appreciate the support provided by the Facultad de Ciencias Exactas, Químicas y Naturales. Universidad Nacional de Misiones (UNaM). The authors gratefully acknowledge Emiliano Roberto Neis, Yerba Mate Laboratory (LYM), Instituto de Materiales de Misiones (IMAM), for the preparation of the yerba mate extracts. The authors also thank Jonathan Maximiliano Schuster, Materials, Modeling, and Metrology Program (PMMM) Laboratory of the Misiones Institute of Materials (IMAM), for technical assistance with the water contact angle measurements. The authors gratefully acknowledge Cecilia Magali Martin, Electron Microscopy Center of UNaM (CenMe-UNaM), for the SEM images and XDR spectra obtained.

Conflicts of Interest

The authors declare no conflicts of interest. The funders had no role in the design of the study; in the collection, analyses, or interpretation of data; in the writing of the manuscript, or in the decision to publish the results.

References

  1. Xia, D.-H.; Deng, C.-M.; Macdonald, D.; Jamali, S.; Mills, D.; Luo, J.-L.; Strebl, M.G.; Amiri, M.; Jin, W.; Song, S.; et al. Electrochemical Measurements Used for Assessment of Corrosion and Protection of Metallic Materials in the Field: A Critical Review. J. Mater. Sci. Technol. 2022, 112, 151–183. [Google Scholar] [CrossRef]
  2. Kamel, M.M.; Abdou, S.N.; Anwar, Z.M.; Sherif, M.A.; Mostafa, N.Y. Reusing the Expired Ceftazidime Drug as an Inhibiting Agent for Zinc Metal Corrosion in HCl Medium. RSC Adv. 2025, 15, 8506–8522. [Google Scholar] [CrossRef] [PubMed]
  3. Abdel-Gaber, A.M.; Abd-El-Nabey, B.A.; Sidahmed, I.M.; El-Zayady, A.M.; Saadawy, M. Inhibitive Action of Some Plant Extracts on the Corrosion of Steel in Acidic Media. Corros. Sci. 2006, 48, 2765–2779. [Google Scholar] [CrossRef]
  4. Chen, D.; Howe, K.J.; Dallman, J.; Letellier, B.C. Corrosion of Aluminium in the Aqueous Chemical Environment of a Loss-of-Coolant Accident at a Nuclear Power Plant. Corros. Sci. 2008, 50, 1046–1057. [Google Scholar] [CrossRef]
  5. Restrepo, C.E.; Simonoff, J.S.; Zimmerman, R. Causes, Cost Consequences, and Risk Implications of Accidents in US Hazardous Liquid Pipeline Infrastructure. Int. J. Crit. Infrastruct. Prot. 2009, 2, 38–50. [Google Scholar] [CrossRef]
  6. Reddy, M.S.B.; Ponnamma, D.; Sadasivuni, K.K.; Aich, S.; Kailasa, S.; Parangusan, H.; Ibrahim, M.; Eldeib, S.; Shehata, O.; Ismail, M.; et al. Sensors in Advancing the Capabilities of Corrosion Detection: A Review. Sens. Actuators A Phys. 2021, 332, 113086. [Google Scholar] [CrossRef]
  7. Alamiery, A.; Shaker, L.M. Smart and Green Corrosion Inhibitors: Mechanisms, Computational Tools, and Sustainable Protection Strategies. Mater. Chem. Phys. 2026, 348, 131639. [Google Scholar] [CrossRef]
  8. Raja, P.B.; Sethuraman, M.G. Natural Products as Corrosion Inhibitor for Metals in Corrosive Media—A Review. Mater. Lett. 2008, 62, 113–116. [Google Scholar] [CrossRef]
  9. Abdullah Dar, M. A Review: Plant Extracts and Oils as Corrosion Inhibitors in Aggressive Media. Ind. Lubr. Tribol. 2011, 63, 227–233. [Google Scholar] [CrossRef]
  10. Méndez, C.M.; Gervasi, C.A.; Pozzi, G.; Ares, A.E. Corrosion Inhibition of Aluminum in Acidic Solution by Ilex paraguariensis (Yerba Mate) Extract as a Green Inhibitor. Coatings 2023, 13, 434. [Google Scholar] [CrossRef]
  11. Khan, B.; Mobin, M.; Cial, K.; Zehra, S. Polypodium Leucotomos Extract as a Promising Corrosion Inhibitor for Mild Steel in 5% HCl: Insights from Gravimetric, Electrochemical and Surface and Studies. Surf. Interfaces 2025, 77, 107999. [Google Scholar] [CrossRef]
  12. Balera Brito, V.G.; Chaves-Neto, A.H.; Landim De Barros, T.; Penha Oliveira, S.H. Soluble Yerba Mate (Ilex paraguariensis) Extract Enhances In Vitro Osteoblastic Differentiation of Bone Marrow-Derived Mesenchymal Stromal Cells. J. Ethnopharmacol. 2019, 244, 112131. [Google Scholar] [CrossRef] [PubMed]
  13. Ribeiro, V.R.; Maciel, G.M.; Fachi, M.M.; Pontarolo, R.; Fernandes, I.D.A.A.; Stafussa, A.P.; Haminiuk, C.W.I. Improvement of Phenolic Compound Bioaccessibility from Yerba Mate (Ilex paraguariensis) Extracts after Biosorption on Saccharomyces Cerevisiae. Food Res. Int. 2019, 126, 108623. [Google Scholar] [CrossRef] [PubMed]
  14. Pomilio, A.B.; Trajtemberg, S.; Vitale, A.A. High-Performance Capillary Electrophoresis Analysis of Mate Infusions Prepared from Stems and Leaves of Ilex paraguariensis Using Automated Micellar Electrokinetic Capillary Chromatography. Phytochem. Anal. 2002, 13, 235–241. [Google Scholar] [CrossRef] [PubMed]
  15. Heck, C.I.; De Mejia, E.G. Yerba Mate Tea (Ilex paraguariensis): A Comprehensive Review on Chemistry, Health Implications, and Technological Considerations. J. Food Sci. 2007, 72, R138–R151. [Google Scholar] [CrossRef] [PubMed]
  16. Derna, A.M.; Méndez, C.M.; Gassa, L.M.; Ares, A.E. Green Extract of Mate Tea as Corrosion Inhibitor of Copper and Aluminum. In Proceedings of the 3rd Pan American Materials Congress; The Minerals, Metals & Materials Series; Springer International Publishing: Cham, Switzerland, 2017; pp. 135–144. ISBN 978-3-319-52131-2. [Google Scholar]
  17. Surkan, S.A.; Mendez, C.M.; Maiocchi, M.G. Characterization of activated carbon produced from industrial waste of yerba mate by chemical activation with ZnCl2. RECyT 2024, 42, 65–71. [Google Scholar] [CrossRef]
  18. Kilmartin, P. Characterisation of Polyphenols in Green, Oolong, and Black Teas, and in Coffee, Using Cyclic Voltammetry. Food Chem. 2003, 82, 501–512. [Google Scholar] [CrossRef]
  19. Nkunu, Z.N.; Kamau, G.N.; Kithure, J.C.; Muya, C.N. Electrochemical Studies of Potassium Ferricyanide in Acetonitrile-Water Media (1:1) Using Cyclic Voltammetry Method. Int. J. Sci. Res. Innov. Technol. 2017, 4, 52–58. [Google Scholar]
  20. ASTM G5-87; Standard Reference Test Method for Making Potentiostatic and Potentiodynamic Anodicpolarization Measurements. ASTM: West Conshohocken, PA, USA, 1987.
  21. Adamu, A.A.; Iyun, O.R.A.; Habila, J.D. Adsorption and Thermodynamic Studies of the Corrosion Inhibition Effect of Desmodium Adscendens (Swartz) Extract on Carbon Steel in 2 M HCl. BMC Chem. 2025, 19, 163. [Google Scholar] [CrossRef] [PubMed]
  22. Zhuo, K. Can the Langmuir Adsorption Coefficient Be Used to Derive the Adsorption Gibbs Energy? J. Mol. Liq. 2022, 367, 120442. [Google Scholar] [CrossRef]
  23. Chaubey, N.; Chauhan, D.S.; Singh, V.K.; Yadav, S.; Quraishi, M.A. Insights on the Adsorption and Corrosion Inhibition Behavior of Alstonia Scholaris Leaf Extract for Aluminium in Acidic and Basic Medium. Int. J. Corros. Scale Inhib. 2025, 14, 1268–1288. [Google Scholar] [CrossRef]
  24. Neis, E.R.; Thea, A.E.; Covinich, M.M.; Scipioni, G.P.; Schmalko, M.E. Multistage Extraction of Bioactives from Yerba Mate (Ilex paraguariensis) Leaf Residue: Modeling and Chemical Profiling. Chem. Eng. Process.-Process Intensif. 2026, 223, 110762. [Google Scholar] [CrossRef]
  25. Karki, N.; Neupane, S.; Gupta, D.K.; Das, A.K.; Singh, S.; Koju, G.M.; Chaudhary, Y.; Yadav, A.P. Berberine Isolated from Mahonia Nepalensis as an Eco-Friendly and Thermally Stable Corrosion Inhibitor for Mild Steel in Acid Medium. Arab. J. Chem. 2021, 14, 103423. [Google Scholar] [CrossRef]
  26. Koju, G.M.; Neupane, S.; Gupta, D.K.; Barik, R.C.; Karki, N.; Yadav, A.P. Alkaloids from Methanolic Extract of Berberis Asiatica as a Potential Corrosion Inhibitor for Active Metal. Results Chem. 2026, 20, 102982. [Google Scholar] [CrossRef]
  27. Ostovari, A.; Hoseinieh, S.M.; Peikari, M.; Shadizadeh, S.R.; Hashemi, S.J. Corrosion Inhibition of Mild Steel in 1M HCl Solution by Henna Extract: A Comparative Study of the Inhibition by Henna and Its Constituents (Lawsone, Gallic Acid, α-d-Glucose and Tannic Acid). Corros. Sci. 2009, 51, 1935–1949. [Google Scholar] [CrossRef]
  28. Usman, B. Adsorption and Characterization of Anisaldehyde As Corrosion Inhibitor for Aluminium Corrosion in Hydrochloric Acidic Environment. I-Manag. J. Chem. Sci. 2020, 1, 8–16. [Google Scholar] [CrossRef]
  29. Kindness, A.; Marr, I.L. Improved Infrared Spectroscopic Method for the Measurement of 13C: 12C Ratios. Appl. Spectrosc. 1997, 51, 17–21. [Google Scholar] [CrossRef]
  30. Maeland, A.J.; Rittenhouse, R.; Lahar, W.; Romano, P.V. Infrared Reflection-Absorption Spectra of Anodic Oxide Films on Aluminum. Thin Solid Film. 1974, 21, 67–72. [Google Scholar] [CrossRef]
  31. Feihrmann, A.C.; Coutinho, F.H.; Dos Santos, I.C.; De Marins, A.R.; De Campos, T.A.F.; Da Silva, N.M.; Duarte, V.A.; Matiucci, M.A.; De Souza, M.L.R.; Gomes, R.G. Effect of Replacing a Synthetic Antioxidant for Natural Extract of Yerba Mate (Ilex paraguariensis) on the Physicochemical Characteristics, Sensory Properties, and Gastrointestinal Digestion In Vitro of Burgers. Food Chem. Adv. 2022, 1, 100130. [Google Scholar] [CrossRef]
  32. Nesane, T.; Madala, N.E.; Kabanda, M.M.; Murulana, L.C. Experimental and Theoretical Studies on the Inhibitory Potential of Lippia javanica Leaf Extract for Aluminium Corrosion in 1M HCl Medium. J. Adhes. Sci. Technol. 2023, 37, 3517–3551. [Google Scholar] [CrossRef]
  33. Nesane, T.; Mnyakeni-Moleele, S.S.; Murulana, L.C. Exploration of Synthesized Quaternary Ammonium Ionic Liquids as Unharmful Anti-Corrosives for Aluminium Utilizing Hydrochloric Acid Medium. Heliyon 2020, 6, e04113. [Google Scholar] [CrossRef] [PubMed]
  34. Chaudhary, M.Y.; Gupta, M.; Bansal, P.; Sharma, Y.S.; Dheer, N.; Kant, A.; Singh, M.R.; Yadav, S. Allyl Triphenyl Phosphonium Bromide, an Ionic Liquid as an Eco-Friendly and Green Inhibitor for Corrosion of Aluminium in Hydrochloric Acid: Mechanistic Insights and Experimental Validation. Sustain. Chem. Environ. 2025, 9, 100206. [Google Scholar] [CrossRef]
  35. Araujo, J.V.d.S.; Gabbardo, A.D.; Fernandes, S.M.; Costa, I. Corrosão Localizada Do Alumínio Em Meios Aerados E Em Meios Com Baixo Teor Oxigênio: Estudo E Comparação Por Meio de Curvas de Polarização. Quim. Nova 2025, 48, e-20250067. [Google Scholar] [CrossRef]
  36. Branzoi, V.; Golgovici, F.; Branzoi, F. Aluminium Corrosion in Hydrochloric Acid Solutions and the Effect of Some Organic Inhibitors. Mater. Chem. Phys. 2003, 78, 122–131. [Google Scholar] [CrossRef]
  37. Liu, Y.; Tang, X.; Zeng, Q.; Liu, B.; Lai, J.; Jin, J.; Li, S. Experimental and Theoretical Study on Corrosion Mechanism of Aluminium Alloy in Different Corrosive Solutions. J. Mol. Liq. 2024, 412, 125894. [Google Scholar] [CrossRef]
  38. Mchihi, M.M.; Odozi, N.W.; Nwafor, C.; Okon-Okodi, E.M.; Ayuba, F.O. ZnO Nanoparticles Functionalized with Amoxicillin: Synthesis, Characterization and Assessment of Corrosion Inhibition Performance of Aluminum in Alkaline Medium. Next Nanotechnol. 2026, 9, 100438. [Google Scholar] [CrossRef]
  39. Motawea, M.M. Parsley Extract as a Green Corrosion Inhibitor for Aluminum in 1 M HCl Environment. Results Chem. 2025, 18, 102861. [Google Scholar] [CrossRef]
  40. Lu, J.; Li, J.; Yang, X.; Yang, J.; Guo, Y.; Zeng, X. Innovative Use of Cetyltrimethyl Ammonium Bromide (CTAB) Encapsulated Mesoporous Silicon Oxide (SiO2) Nanoparticles as Corrosion Inhibitor in Coolant for Corrosion Protection of Aluminium Alloy. J. Mater. Res. Technol. 2025, 38, 1169–1184. [Google Scholar] [CrossRef]
  41. Friedrich, M.S.; Ares, A.E.; Méndez, C.M. Corrosion Inhibition Effect of Aloe Saponaria Gel on the Corrosion Resistance of Aluminum. In Light Metals 2020; Tomsett, A., Ed.; The Minerals, Metals & Materials Series; Springer International Publishing: Cham, Switzerland, 2020; pp. 452–459. ISBN 978-3-030-36407-6. [Google Scholar]
  42. Gadow, H.S.; Abd El-Monem, N.M.; El-Settawy, R.M. Use of Swiss Chard Stems and Green Pea Peel Extracts as Anticorrosive Agents for Aluminum in 1 M HCl. RSC Adv. 2026, 16, 4959–4992. [Google Scholar] [CrossRef] [PubMed]
  43. Jović, V.D. Calculation of a Pure Double-Layer Capacitance from a Constant Phase Element in the Impedance Measurements. Zas. Mater. 2022, 63, 50–57. [Google Scholar] [CrossRef]
  44. Soltani, N.; Tavakkoli, N.; Khayatkashani, M.; Jalali, M.R.; Mosavizade, A. Green Approach to Corrosion Inhibition of 304 Stainless Steel in Hydrochloric Acid Solution by the Extract of Salvia officinalis Leaves. Corros. Sci. 2012, 62, 122–135. [Google Scholar] [CrossRef]
  45. Prajapati, K.G.; Desai, P.S.; Parmar, B.B.; Patel, A.M. Comprehensive Study on the Corrosion Inhibition of Aluminum in HCl by N1, N1’-(Ethane-1,2-Diyl)Di(Ethane-1,2-Diamine): Experimental and Theoretical Approaches. Results Surf. Interfaces 2024, 17, 100347. [Google Scholar] [CrossRef]
  46. Fouda, A.S.; Mohamed, O.A.; Elabbasy, H.M. Ferula hermonis Plant Extract as Safe Corrosion Inhibitor for Zinc in Hydrochloric Acid Solution. J. Bio. Tribo. Corros. 2021, 7, 135. [Google Scholar] [CrossRef]
  47. Mamgain, H.P.; Samanta, K.K.; Gupta, R.; Brajpuriya, R.; Pati, P.R.; Pandey, J.K.; Bhowmik, A.; AlHazaa, A. Polypropylene/Myristic Acid Assisted Electrodeposition of Eco-Friendly Micro-Engineered Copper Superhydrophobic Coating for Enhancing Hydrophobicity and Anti-Corrosion Efficiency of an Aluminium Substrate. J. Mater. Res. Technol. 2025, 35, 2011–2022. [Google Scholar] [CrossRef]
  48. Zhang, H.; Li, J.; Wang, Y.; Liu, H. Revealing the Interaction Between the Structural Characteristics of Anodized Nanopores and Their Surface Wettability and Lubricity. Nanomanuf. Metrol. 2025, 8, 7. [Google Scholar] [CrossRef]
  49. Schuster, J.M.; Schvezov, C.E.; Rosenberger, M.R. Construction and Calibration of a Goniometer to Measure Contact Angles and Calculate the Surface Free Energy in Solids with Uncertainty Analysis. Int. J. Adhes. Adhes. 2018, 87, 205–215. [Google Scholar] [CrossRef]
  50. Schuster, J.M.; Schvezov, C.E.; Rosenberger, M.R. Influence of Experimental Variables on the Measure of Contact Angle in Metals Using the Sessile Drop Method. Procedia Mater. Sci. 2015, 8, 742–751. [Google Scholar] [CrossRef]
  51. Motlagh, Z.J.; Azadi, M.; Bozorg, M.; Tavakoli, H. The Effect of Inhibiting Ferula asafoetida L. Extract Used in Anodized-Conversion Treatment to Improve Corrosion Protection of Aluminum Alloy: Experimental and Quantum Chemical Calculations. Results Eng. 2026, 31, 111622. [Google Scholar] [CrossRef]
Figure 1. Cyclic voltammograms at 0.1 V s−1 obtained in 0.5 M HCl solution without inhibitor and with 1, 2.5, and 5% v/v yerba mate extract at 298 K The arrows indicate the forward and reverse potential scan directions.
Coatings 16 00795 g001
Figure 2. Adsorption isotherm of yerba mate on Al surface in 0.5 M HCl at different studied temperatures, Langmuir (a), Temkin (b), Frumkin (c), and El-Awady (d).
Coatings 16 00795 g002
Figure 3. Arrhenius plot for the corrosion rate of aluminum in 0.5 M HCl solution, in the absence and presence of the inhibitor.
Coatings 16 00795 g003
Figure 4. FTIR spectrum of the yerba mate extract (a), polished Al, Al in 0.5 M HCl solution in the absence and in the presence of an inhibitor for 2 hs exposure at 298 K (b).
Coatings 16 00795 g004
Figure 5. Effect of inhibitor concentration on aluminum corrosion in a 0.5 M HCl solution with and without inhibitor at 298 K (a), 308 K (b), 315 K (c), and 323 K (d).
Coatings 16 00795 g005
Figure 6. Nyquist and Bode plots obtained for aluminum in 0.5 M HCl in the absence and presence of the inhibitor at 298 K (a,b) and 323 K (c,d). In the Bode plots, the left arrow indicates the impedance modulus (|Z|, left y-axis), and the right arrow indicates the phase angle (right y-axis).
Coatings 16 00795 g006
Figure 7. Equivalent circuit for adjusting EIS measurements.
Coatings 16 00795 g007
Figure 8. SEM images for aluminum in 0.5 M HCl in the absence and presence of the inhibitor at 298 K. Polished specimen (a), in the absence of inhibitor (b), and in the presence of 5% v/v inhibitor (c).
Coatings 16 00795 g008
Figure 9. EDS spectra of polished Al surface (a), Al surface in 0.5 M HCl (b), Al surface in 0.5 M HCl and 5% v/v yerba mate extract (c) at 298 K. Al surface in 0.5 M HCl (d), Al surface in 0.5 M HCl and 5% v/v yerba mate extract (e) at 323 K.
Coatings 16 00795 g009
Figure 10. SEM images and contact angle measurements for aluminum in 0.5 M HCl in the absence and presence of the inhibitor at 323 K. Polished specimen (a), in the absence of inhibitor (b), and in the presence of 5% v/v inhibitor (c).
Coatings 16 00795 g010
Figure 11. XRD patterns for polished Al, Al in the absence and the presence of 5% v/v inhibitor at 323 K.
Coatings 16 00795 g011
Figure 12. Suggested corrosion mechanism for Al without (a) and with inhibitor yerba mate extract (b) in 0.5 M HCl. This figure was created using generative AI tools.
Coatings 16 00795 g012
Table 1. Weight loss results for aluminum in 0.5 M HCl, with and without an inhibitor at different concentrations and temperatures after 2 h of immersion.
Temperature
(K)
Concentration
(% v/v)
CR
(g cm−2 h−1)
ηw (%)θ
29800.4050--
10.045488.790.89
2.50.030892.400.92
50.030392.510.93
30801.1997--
10.077293.560.94
2.50.074493.800.94
50.063594.700.95
31501.8690--
10.193089.670.90
2.50.137592.640.93
50.112693.970.94
32302.5269--
10.416083.540.84
2.50.261189.670.90
50.197792.180.92
Table 2. Equations and their evaluated regression coefficient values for various adsorption isotherms for yerba mate in 0.5 M HCl.
IsothermIsotherm EquationsTemperature (K)EquationR2
Langmuir C i n h θ = 1 K a d s + C i n h 298y = 1.0707x + 0.04530.99996
308y = 1.052x + 0.02380.99998
315y = 1.0512x + 0.06660.99999
323y = 1.0565x + 0.14280.99999
Temkin log ( θ C i n h ) = l o g K a d s g θ 298y = −14.66x + 12.9690.8264
308y = −53.214x + 49.640.8443
315y = −15.303x + 13.6920.9802
323y = −7.2947x + 6.03390.9718
Frumkin log ( θ ( 1 θ ) C i n h ) = l o g K a d s + g θ 298y = −9.9674x + 9.75310.6893
308y = −45.752x + 43.8490.7987
315y = −9.9466x + 9.87150.9679
323y = −3.6361x + 3.75620.9421
El-Awady log ( θ 1 θ ) = log K + y · log C i n h 298y = 0.2861x + 0.92050.8393
308y = 0.1242x + 1.15260.8355
315y = 0.3658x + 0.94330.9944
323y = 0.5268x + 0.71250.9941
In the linear regression equations, x represents the independent variable corresponding to each linearized adsorption isotherm.
Table 3. Linear regression parameters for Equation (6), set equal to y = ax + b, where a is the slope, b is the intercept, and R2 is the coefficient of determination.
Cinh (% v/v)abR2
0−3048.910.0180.9567
1−3788.511.3050.9637
2.5−3583.510.5110.9999
5−3153.89.0570.9991
Table 4. Calculated thermodynamic activation parameters for the corrosion rate of aluminum in 0.5 M HCl in the absence and presence of different concentrations of yerba mate extract.
Concentration
(% v/v)
Ea
(kJ mol−1)
ΔHa
(kJ mol−1)
ΔSa
(kJ mol−1 K−1)
Ea − ΔHa
(kJ mol−1)
058.3456.46−61.751.88
172.5069.92−37.122.58
2.568.5866.01−52.302.57
560.3557.78−80.122.57
Table 5. Results of potentiodynamic polarization measurements for aluminum in 0.5 M HCl, with and without an inhibitor.
Temperature (K)Concentration
(v/v)
Ecorr
(mV vs. SCE)
Icorr
(µA cm−2)
Epit
(mV vs. SCE)
βa
(mV dec−1)
−βc
(mV dec−1)
ηw (%)
2980−7423772.18−74250100-
1−7352643.63−735808030
2.5−7501345.90−7505010064
5−7331894.07−733304050
3080−814837.60−7715050-
1−771639.64−771501024
2.5−80839.07−776808095
5−78938.21−776703095
3150−7718531.02−77150130-
1−829174.28−77915012097
2.5−815162.99−77912010098
5−799116.34−778401099
3230−7964007.53−7964070-
1−86294.77−800809097
2.5−83377.79−800605098
5−82249.74−8001203099
Table 6. Results of the inhibitory efficiency of yerba mate extract in 0.5 M HCl, based on electrochemical impedance measurements at different temperatures and concentrations.
Temperature (K)Cinh
(v/v)
Rct
(Ω cm2)
nCPE
(Ω−1 sn)
L
(H cm−2)
Cdl
(µF cm−2)
ηR
(%)
298015.8260.9568.09 × 10−56.76059.40-
137.6880.9409.97 × 10−514.20069.7258.01
2.533.3060.9381.05 × 10−414.67171.8752.48
543.8730.9381.03 × 10−420.14471.9463.93
30806.9860.9646.83 × 10−51.07251.50-
139.4050.9421.01 × 10−416.38771.6382.27
2.521.6500.9408.79 × 10−54.43958.9367.73
546.1170.9576.15 × 10−520.85247.3984.85
31505.9450.9994.45 × 10−50.33844.18-
115.9190.9654.68 × 10−53.34535.9862.65
2.512.6010.9438.08 × 10−52.77353.3452.82
510.4880.9301.55 × 10−42.24495.6943.31
32300.7101.0001.52 × 10−40.273152.23-
16.9970.9705.38 × 10−52.44142.0389.86
2.59.9470.9585.70 × 10−52.50441.2792.87
512.3050.9527.07 × 10−51.92549.7294.23
Table 7. EDS data corresponding to the spectra shown in Figure 9.
ElementPolished Al Surface
(a) (%)
Al Surface in 0.5 HCl at 298 K
(b) (%)
Al Surface in 0.5 HCl and 5% v/v Yerba Mate at 298 K (c) (%)Al Surface in 0.5 HCl at 323 K
(d) (%)
Al Surface in 0.5 HCl and 5% v/v Yerba Mate at 323 K (e) (%)
Al88.589.587.787.083.6
C7.18.59.08.212.1
O4.42.03.34.84.2
Disclaimer/Publisher’s Note: The statements, opinions and data contained in all publications are solely those of the individual author(s) and contributor(s) and not of MDPI and/or the editor(s). MDPI and/or the editor(s) disclaim responsibility for any injury to people or property resulting from any ideas, methods, instructions or products referred to in the content.