4. Results and Discussion
4.1. Hysteresis-Loop Characteristics
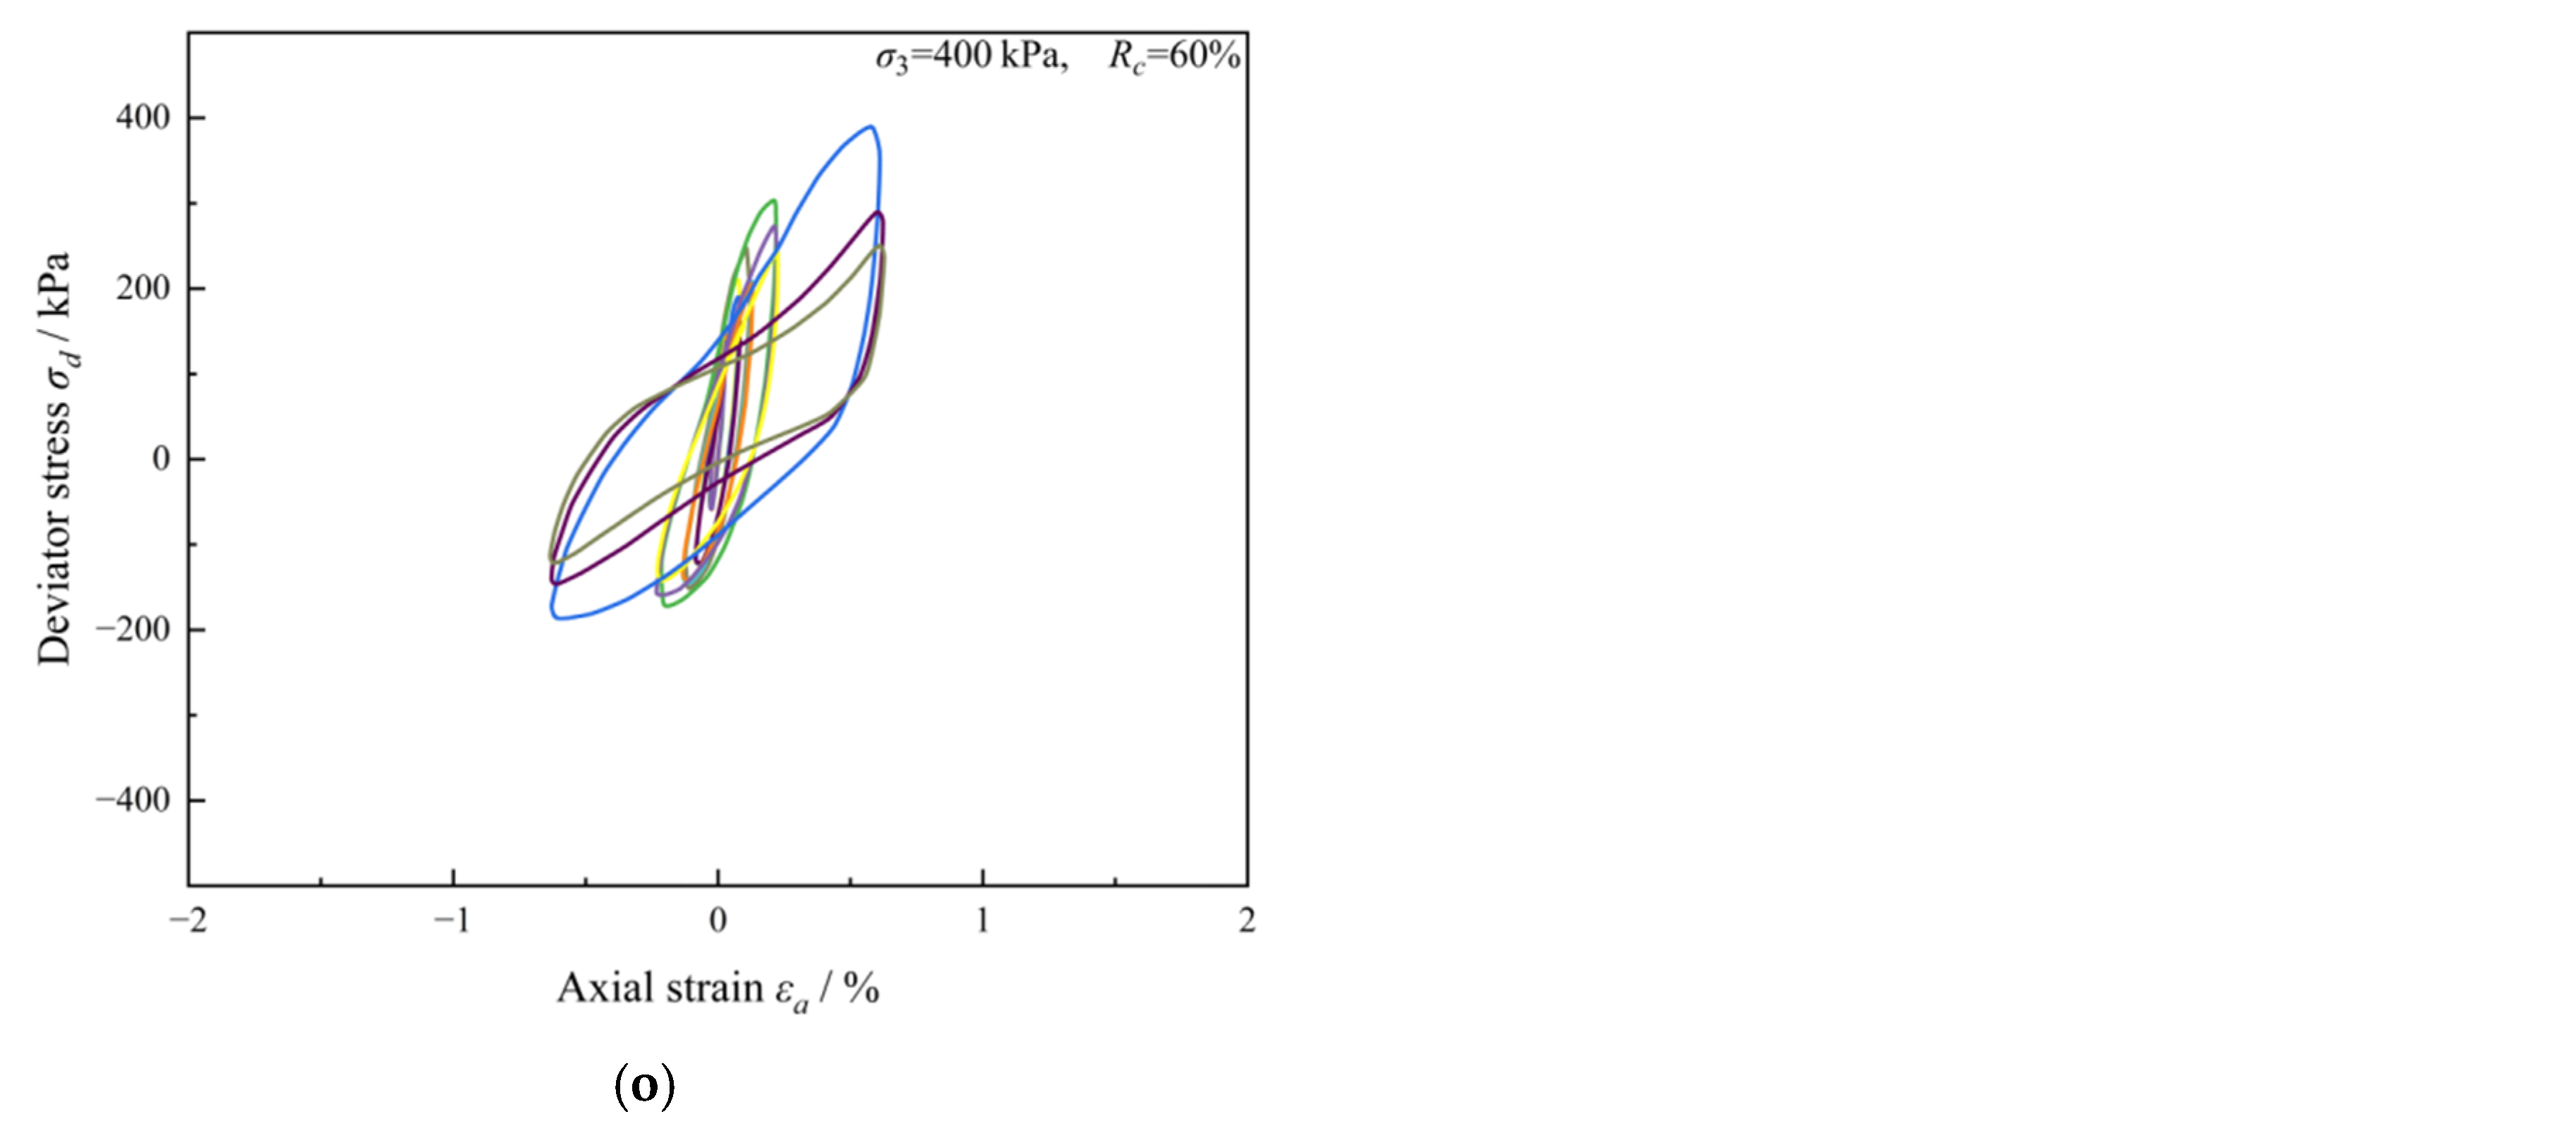
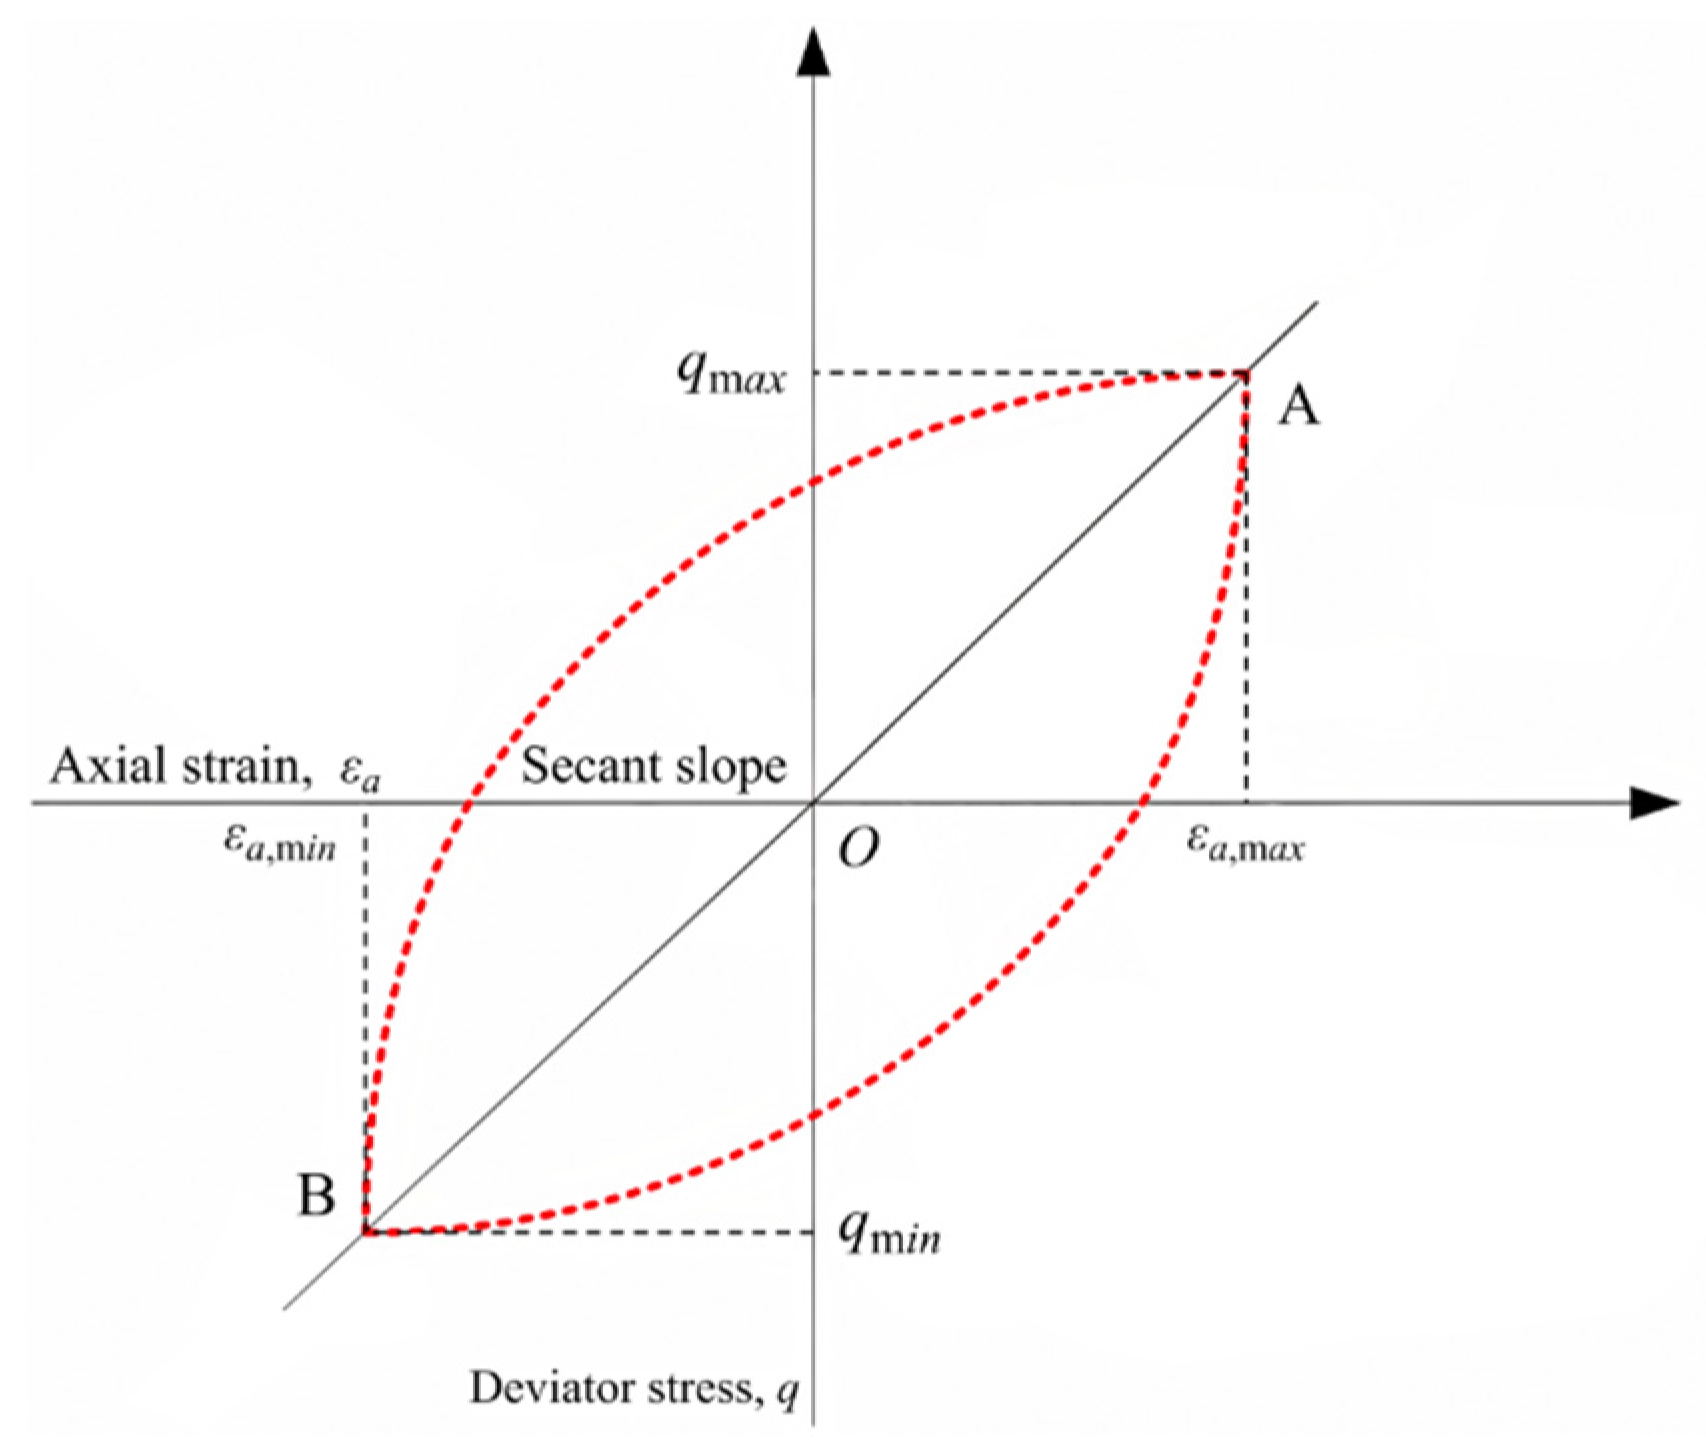
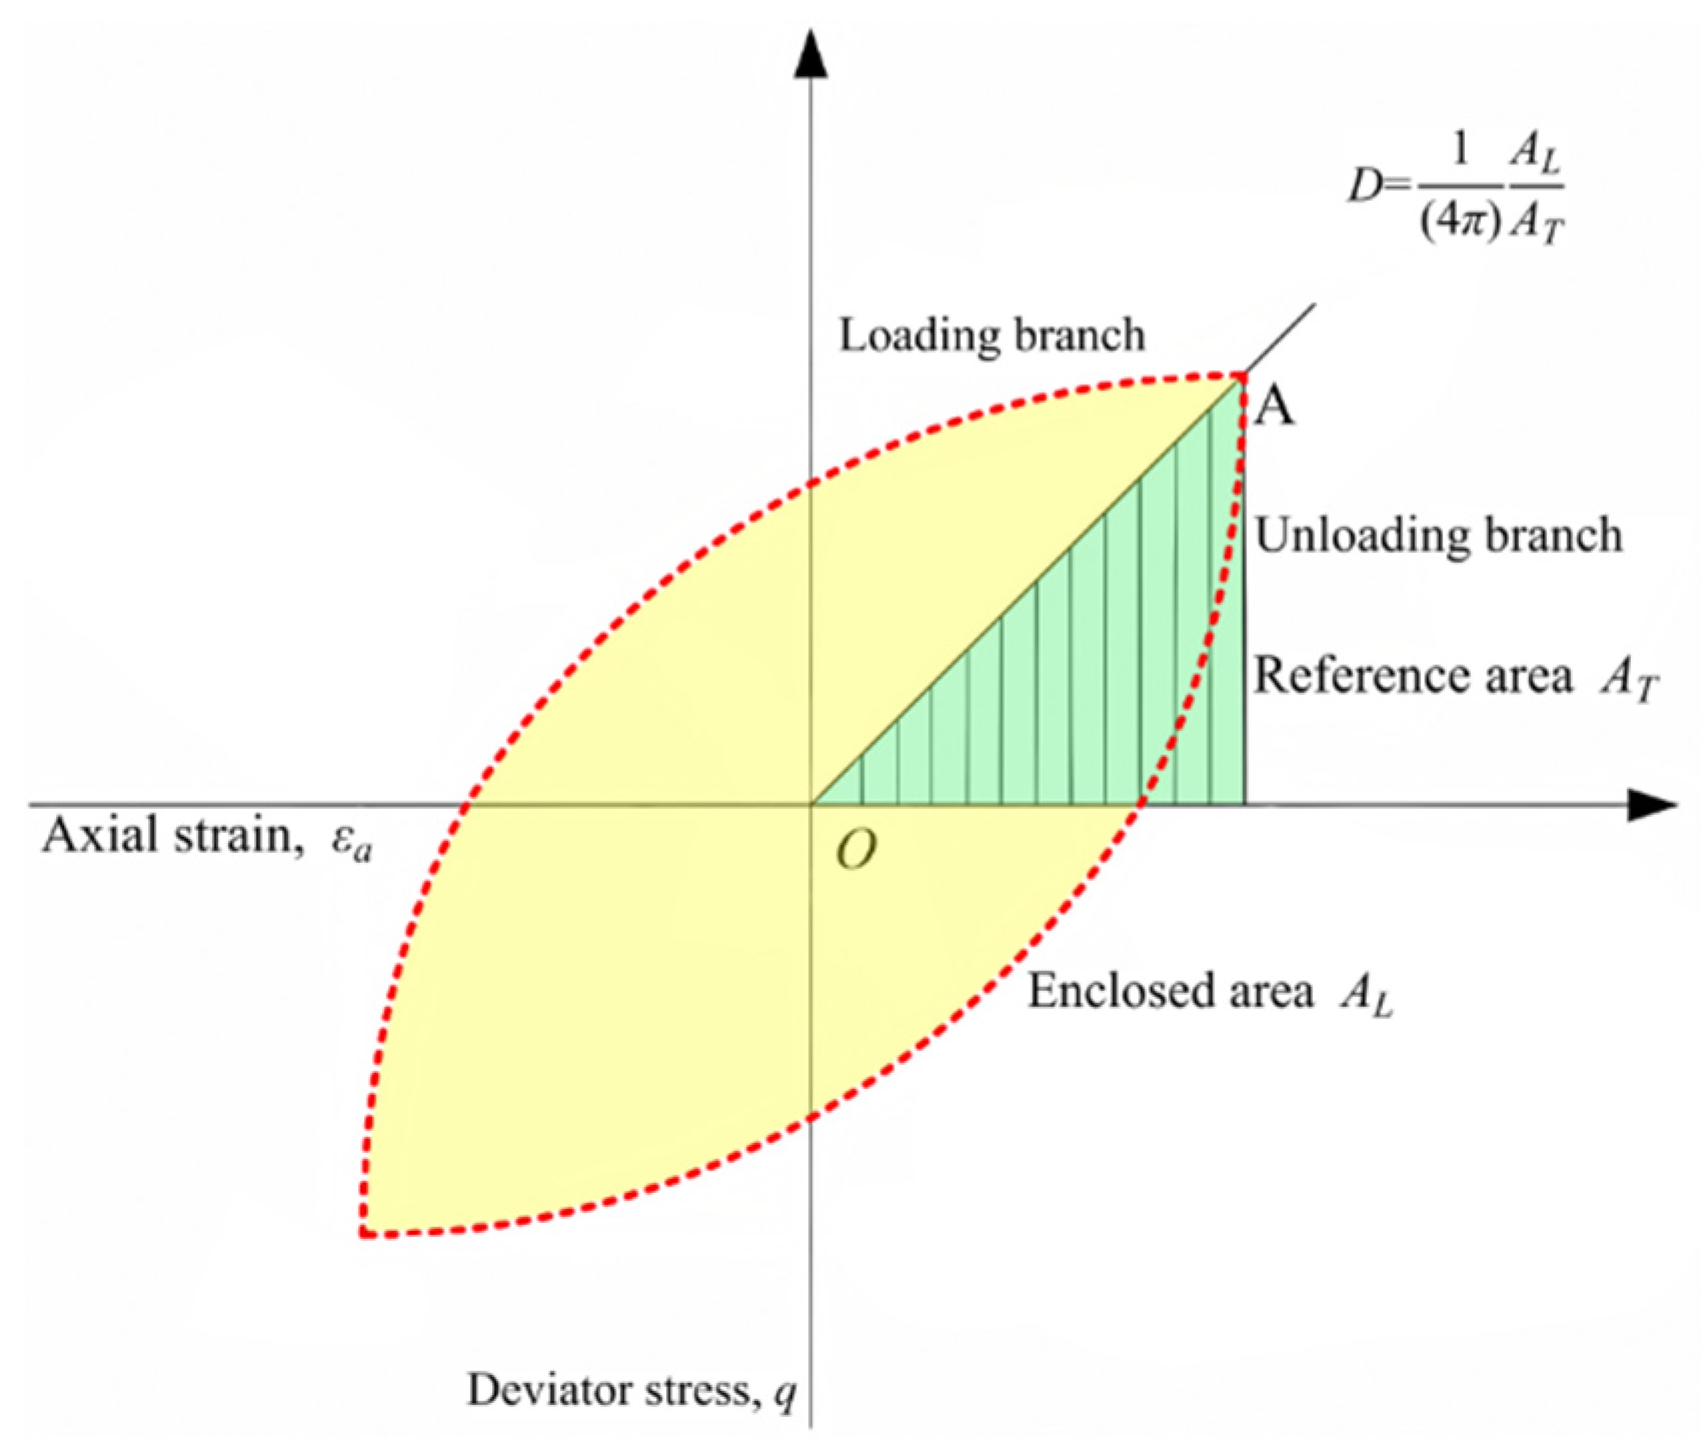
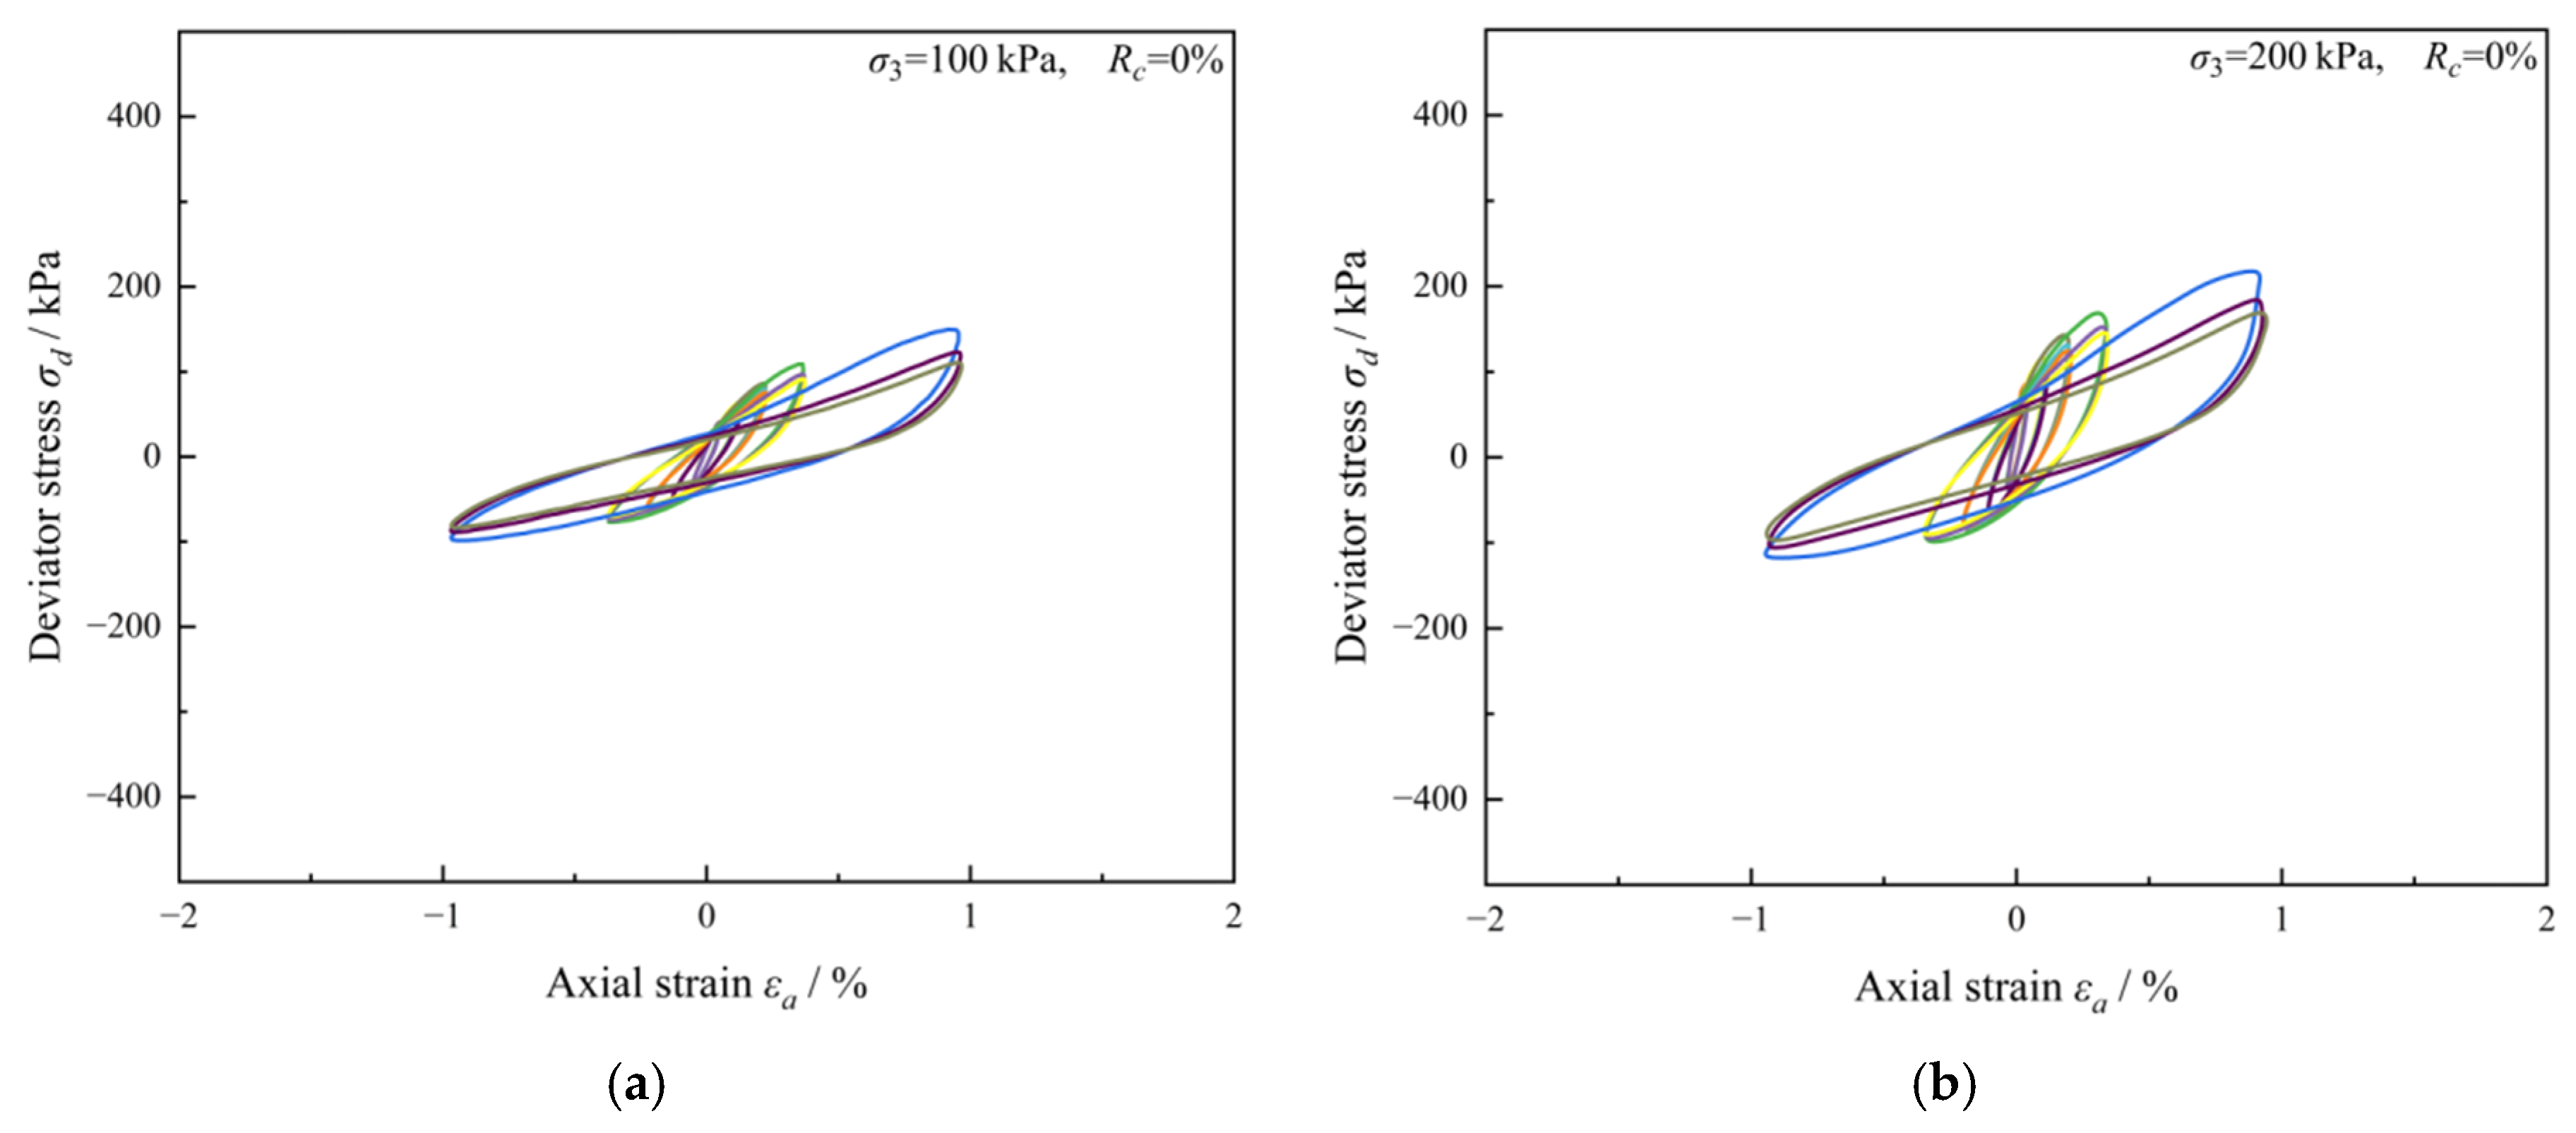
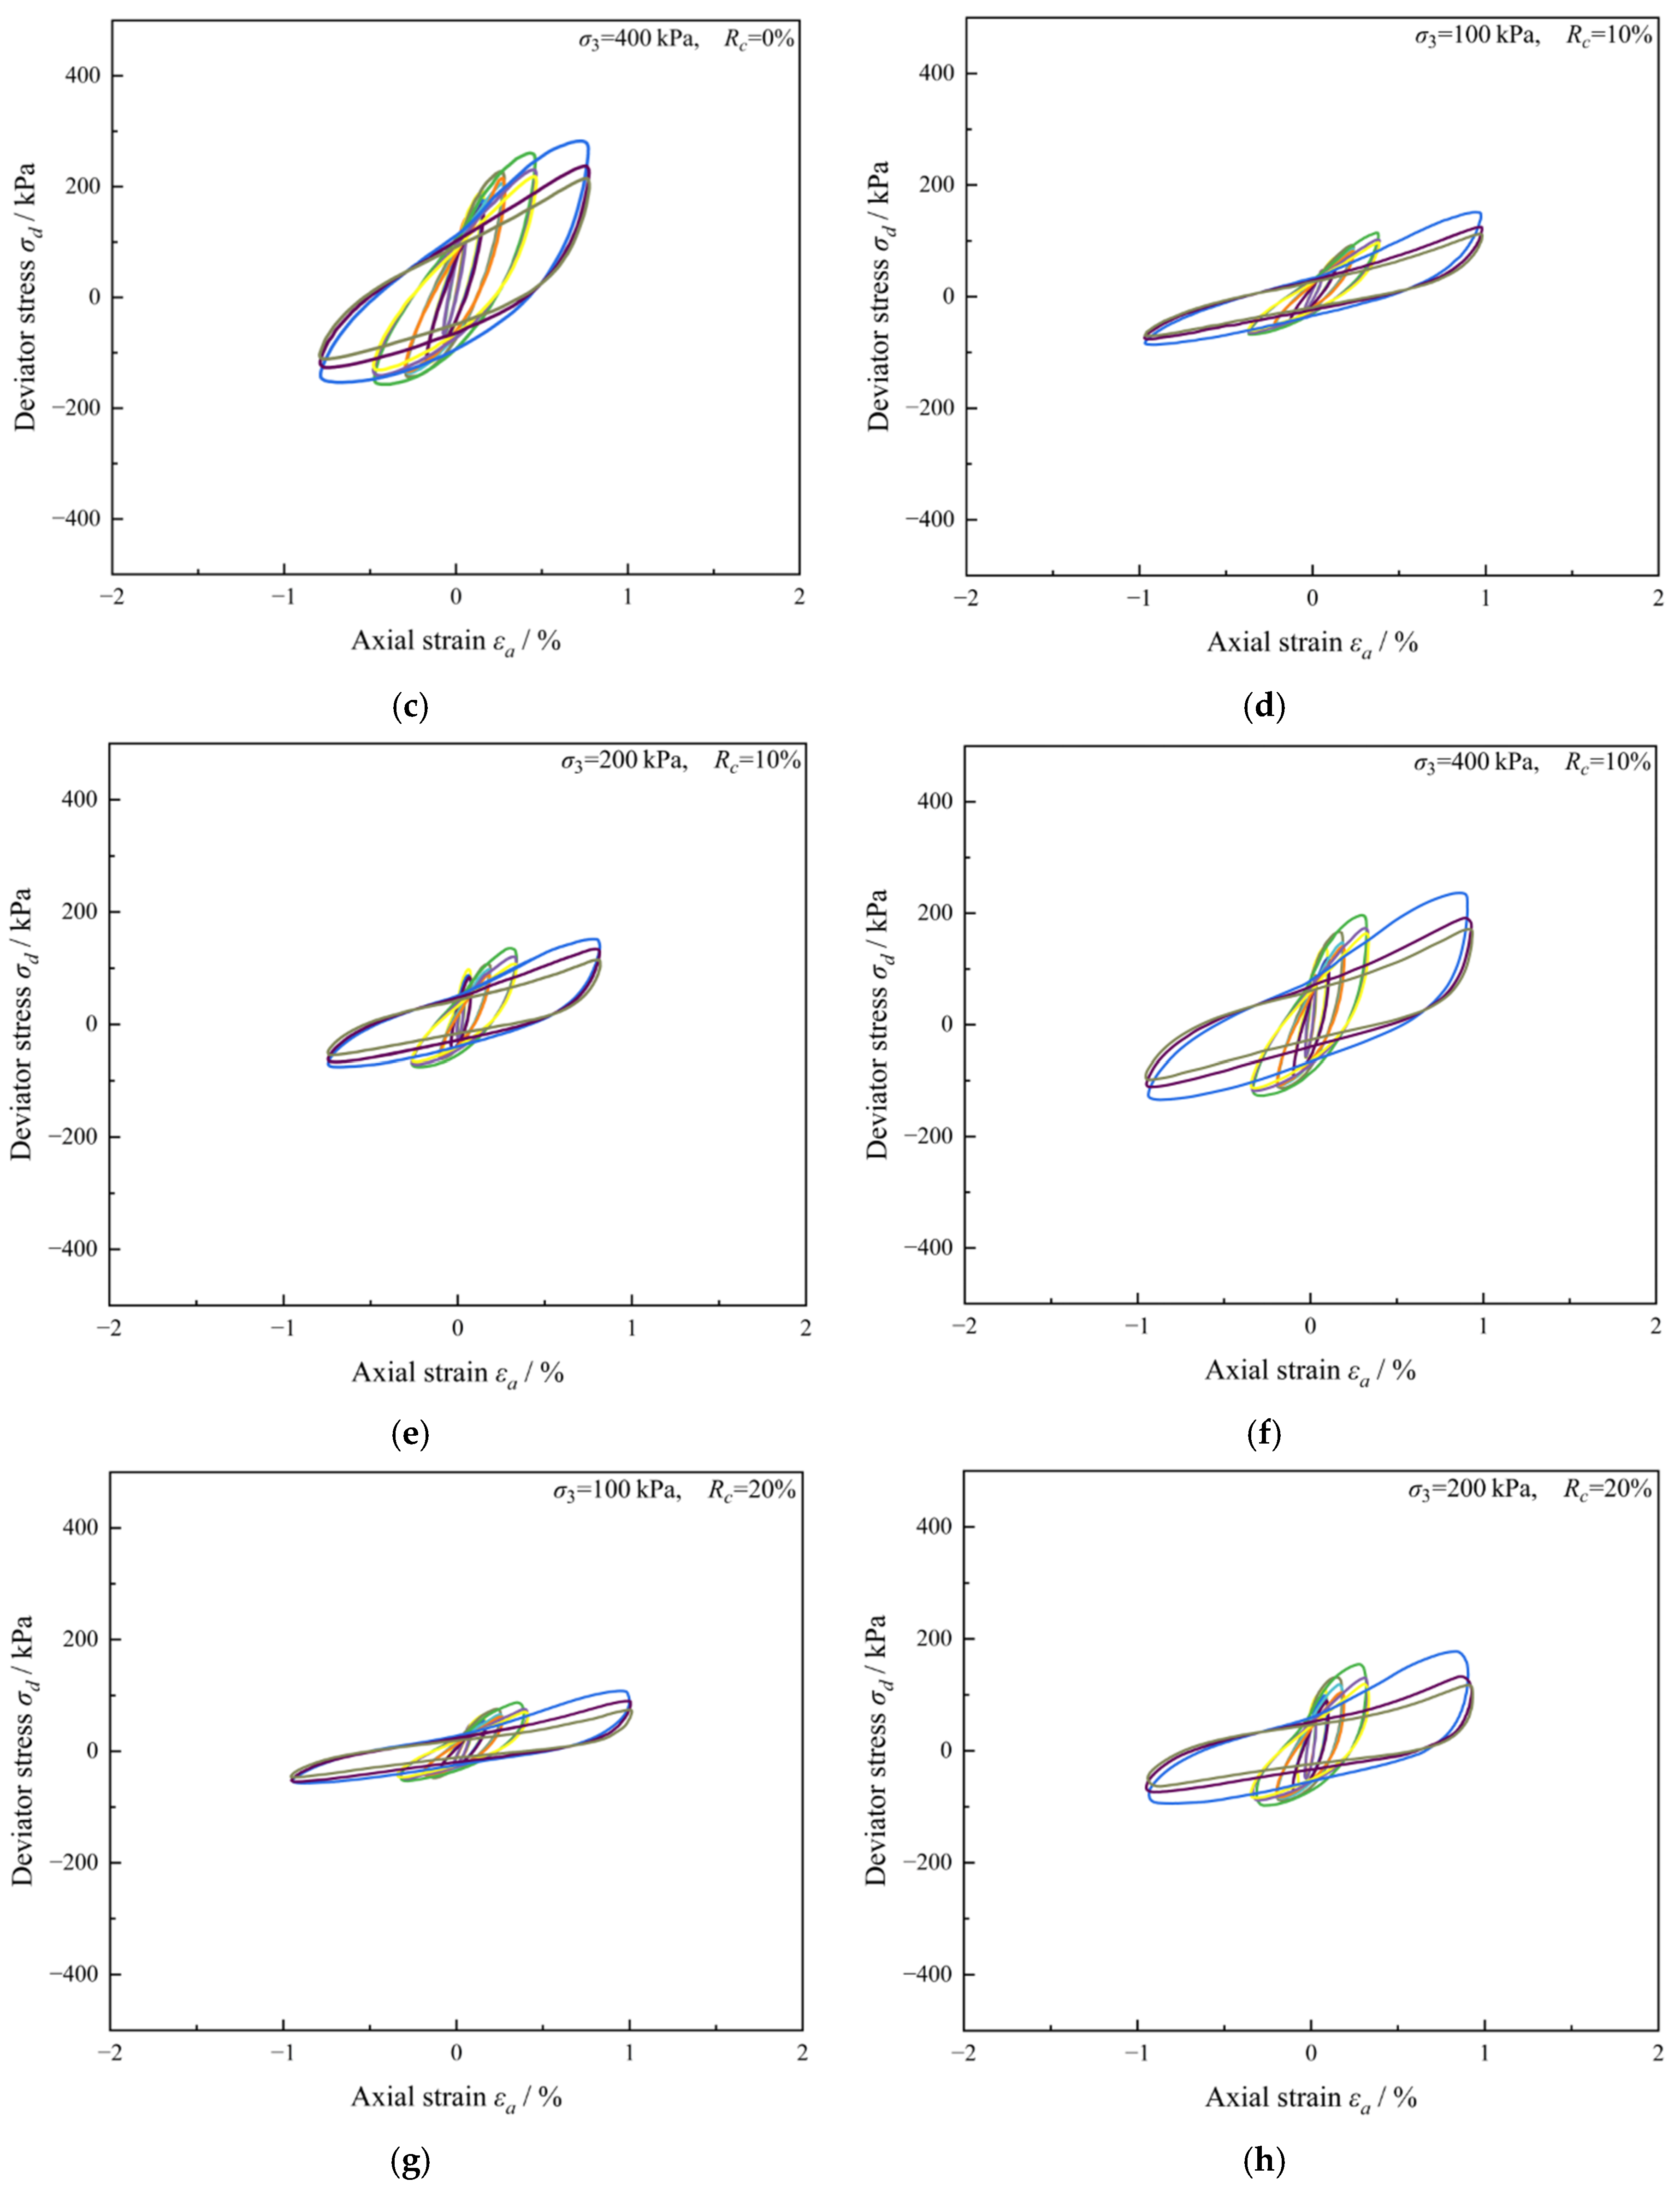
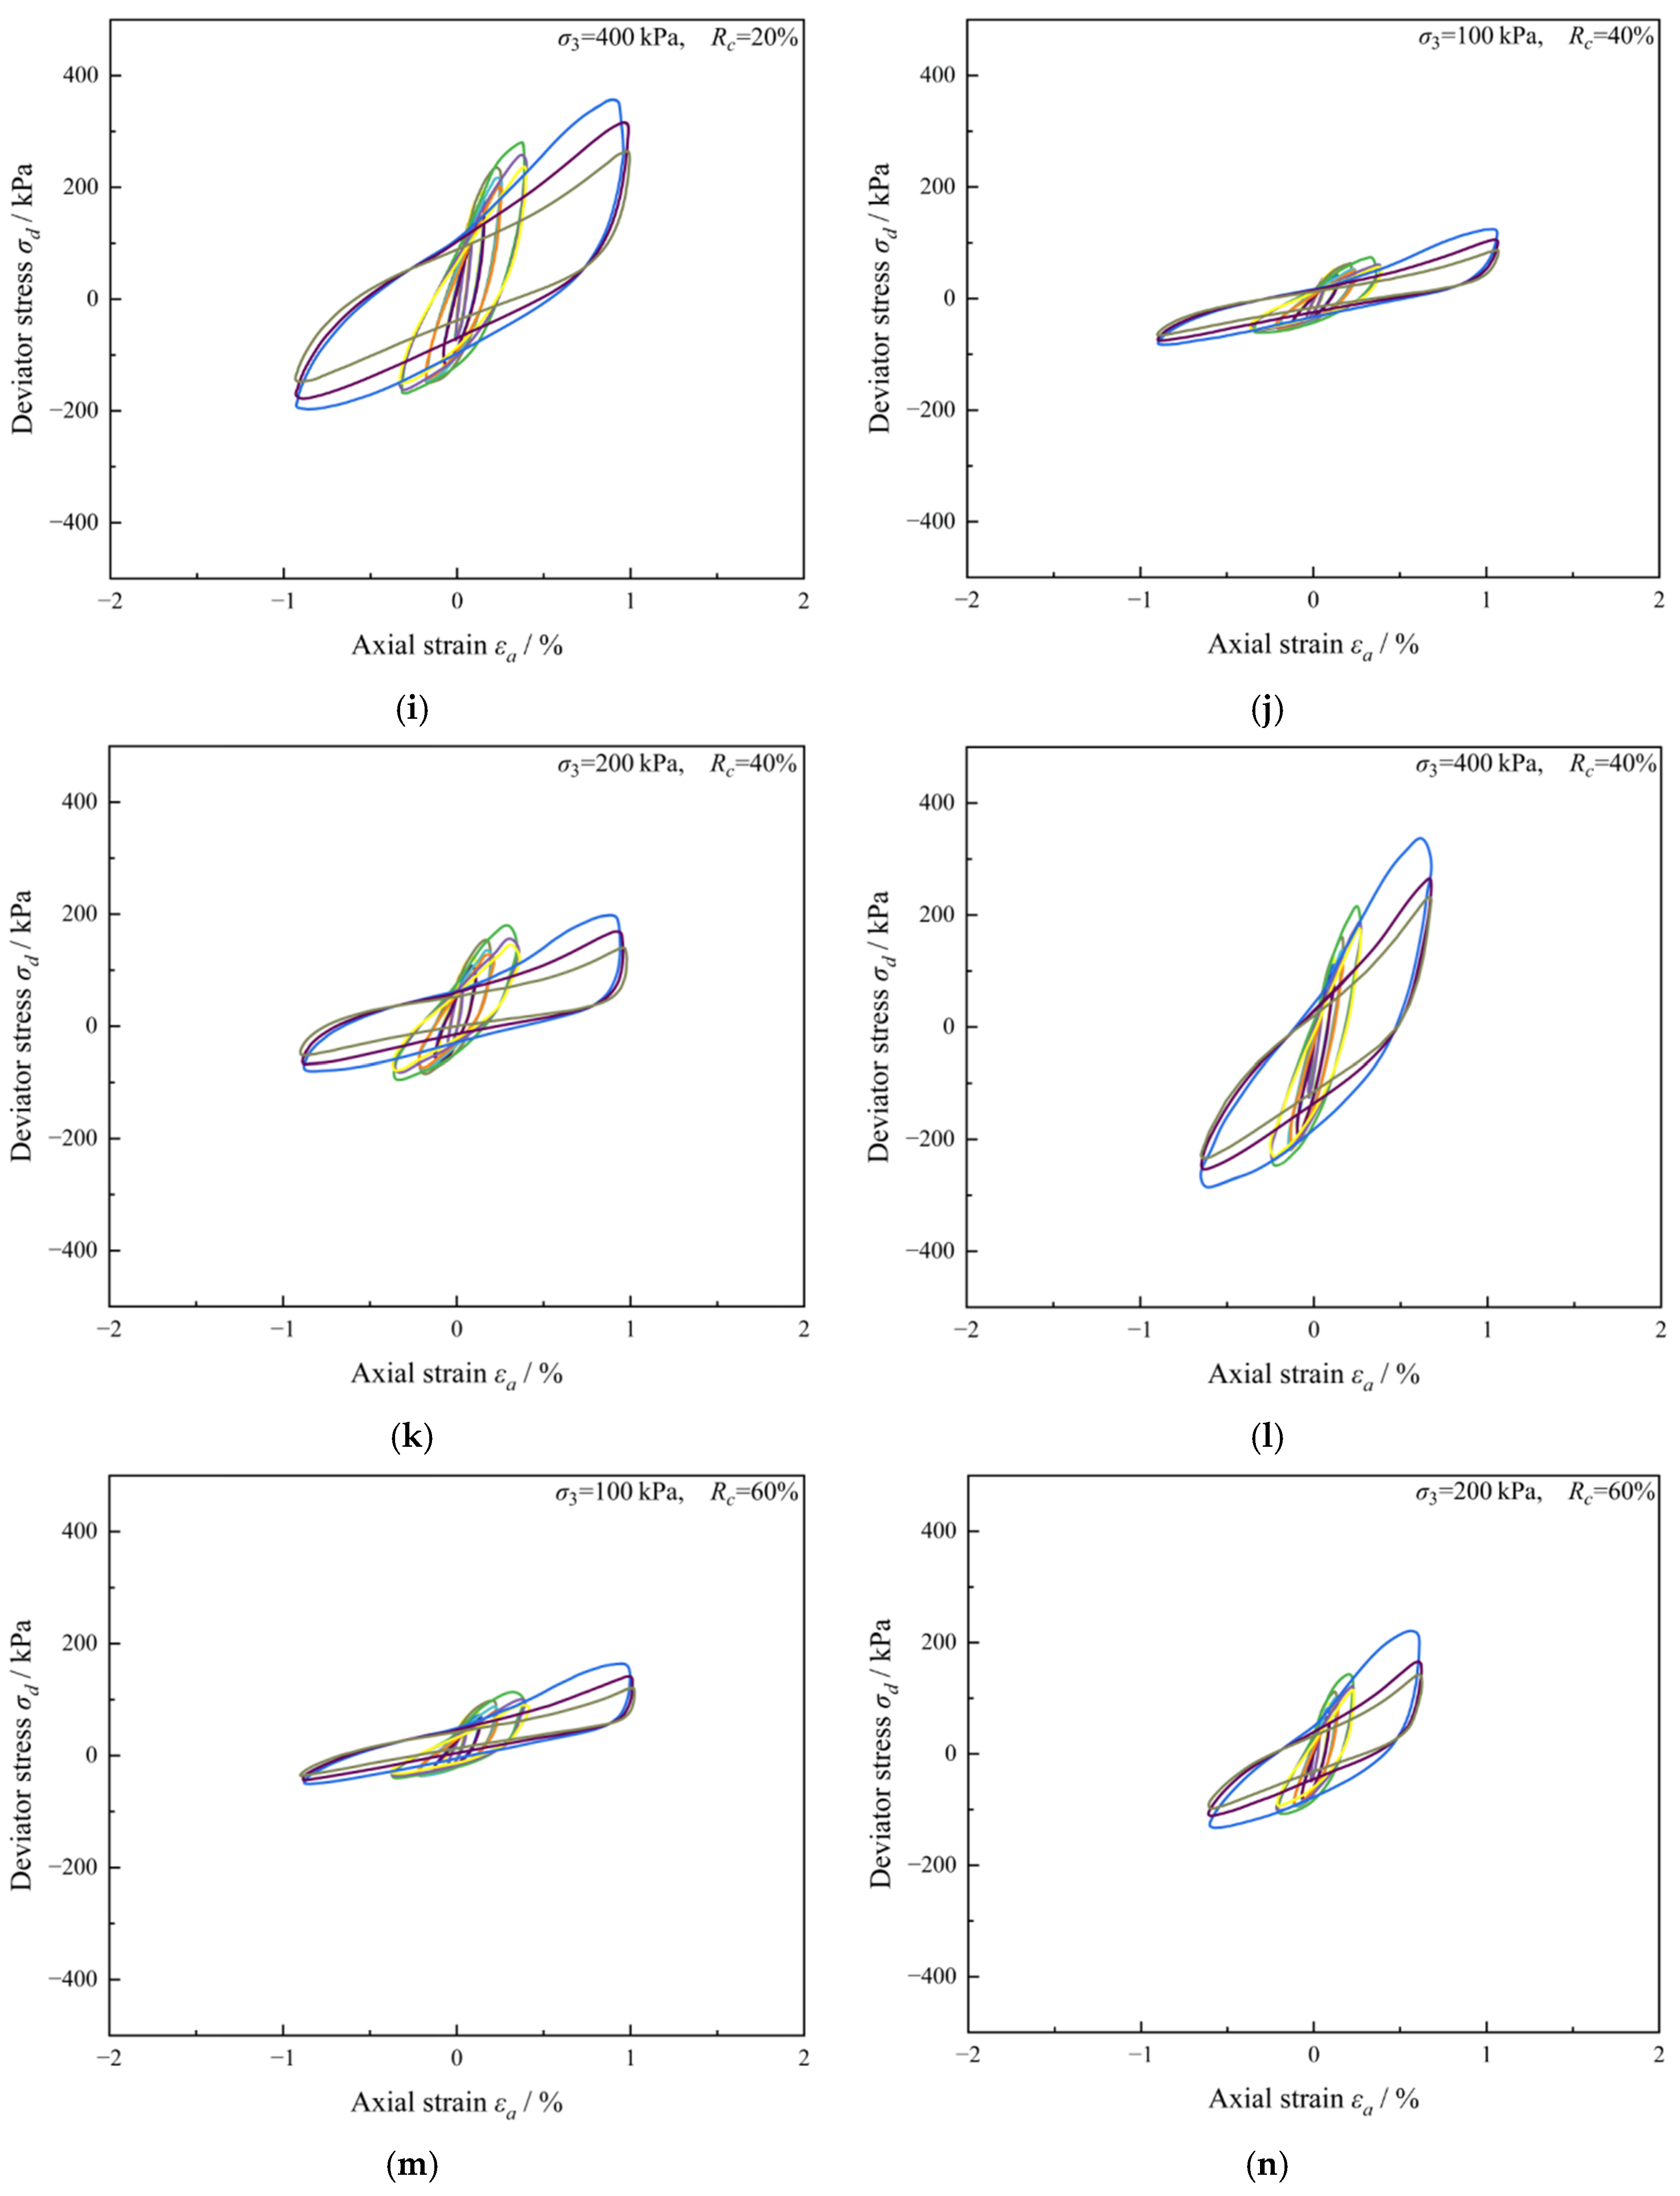
The hysteresis loops obtained from the cyclic triaxial tests exhibit clear nonlinear and structure-dependent features under different rock block contents and confining pressures. In general, all loops are closed and obliquely distributed, indicating that the reconstructed soil–rock mixtures maintained continuous cyclic resistance within the tested strain range and did not undergo abrupt structural collapse during a single loading stage. However, the loop morphology is distinctly different from the regular elliptical pattern commonly observed in relatively uniform geomaterials. Most loops in this study display a spindle-like to waist-constricted shape, with a relatively narrow middle part and outward expansion at both ends [
38]. This feature suggests that the stiffness of the material was not constant within one loading cycle, but evolved continuously with loading and unloading, reflecting the combined effects of soil matrix deformation, soil–rock interface adjustment, and rock block interaction.
At different strain levels, the hysteresis morphology shows a progressive evolution from a narrow and steep loop to a wider and fuller loop. At small strain amplitudes, the loops are relatively slender, the enclosed area is limited, and the loading and unloading branches remain close to each other. This indicates that the material response is still dominated by recoverable deformation, while irreversible energy dissipation is weak. As the strain amplitude increases, the hysteresis loops expand markedly, the spacing between the loading and unloading branches becomes larger, and the enclosed area increases significantly. Meanwhile, the loop inclination decreases gradually, indicating a reduction in secant stiffness. At larger strain amplitudes, the outer loops become much more open and nonlinear, which means that the contribution of inter-particle sliding, local rearrangement, and interface friction becomes increasingly important. Therefore, the effect of strain level in the present study is not merely reflected by loop enlargement, but also by a clear transition in deformation mechanism from relatively coordinated deformation to structure-adjustment-controlled cyclic deformation.
The influence of rock block content on hysteresis morphology is evident, but it is not expressed in a simple monotonic manner. More importantly, the effect of rock content is strongly dependent on confining pressure. Under the low confining pressure of 100 kPa, the hysteresis loops corresponding to different rock contents remain relatively similar in overall outline. Although some differences in loop width and local curvature can still be observed, the influence of rock blocks is not fully mobilized, and the cyclic response is still mainly governed by the soil matrix. This implies that, under weak confinement, rock blocks mainly act as dispersed inclusions embedded in the matrix, rather than as an effective stress-transferring skeleton.
When the confining pressure increases to 200 kPa, the effect of rock block content becomes more distinguishable. The loops of specimens with higher rock contents show steeper and more concentrated central branches, while the outer portions of the loops become more pronounced. This indicates that the internal load-transfer path begins to change with increasing rock block content. In this stage, the material no longer behaves as a matrix-dominated medium alone. Instead, the interaction between the matrix and the rock blocks becomes more active, and the cyclic response begins to reflect stronger structural constraint and frictional dissipation. Under 400 kPa, this tendency becomes much more obvious. Especially for the specimens with medium-to-high rock contents, the hysteresis loops become distinctly fuller and more upright, the stress range expands significantly, and the waist-constriction feature becomes more pronounced. These observations indicate that the role of rock blocks is substantially activated under high confinement, and that the cyclic resistance of the material is increasingly supported by enhanced block contact and matrix–block cooperation.
The effect of confining pressure is systematic and more direct. For a given rock block content, increasing confining pressure changes the hysteresis loops from relatively flat and elongated shapes to steeper, fuller, and more stress-expanded shapes. This means that higher confining pressure not only increases the stress level reached during cyclic loading, but also modifies the mode of deformation. Under low confining pressure, the specimens show relatively loose and flat loops, suggesting limited inter-particle constraint and relatively weak mobilization of structural resistance. As the confining pressure increases, particle contact becomes tighter, the matrix is compressed more effectively, and the contact state between rock blocks and soil matrix becomes more stable. As a result, the loops become more compact in geometric arrangement but larger in stress amplitude, which reflects the simultaneous enhancement of cyclic strength and hysteretic dissipation. In other words, higher confining pressure does not simply strengthen the material; it also promotes a more efficient internal stress-transfer mechanism.
A notable feature of the present results is that the combined influence of rock block content and confining pressure is clearly non-additive. The role of rock content is weak under low confinement, but becomes increasingly significant as confinement rises. This means that the effect of rock blocks should be understood as a confinement-activated structural effect rather than an isolated material-composition effect. In the present reconstructed soil–rock mixtures, the rock blocks do not contribute equally under all stress conditions. Their mechanical function depends strongly on whether the surrounding matrix and inter-particle contacts are sufficiently confined to mobilize block interaction. This point is important because it explains why the differences among rock contents are relatively limited at 100 kPa, but become much more evident at 400 kPa.
Another important observation is that the hysteresis loops in this study are characterized by obvious non-elliptic distortion and local curvature variation, especially under high confining pressure and high rock content. This reflects the intrinsic heterogeneity of the tested material. Unlike conventional soils, the reconstructed soil–rock mixture does not respond as a uniform continuum during cyclic loading. Instead, different components participate sequentially in deformation. At small-to-medium strain, deformation is mainly accommodated by the soil matrix and local closure of internal voids. With further loading, soil–rock interface sliding and contact adjustment become more significant. At larger strain levels, the interaction among rock blocks becomes increasingly involved in carrying and redistributing stress [
39]. Therefore, the hysteresis loops observed in this study record a multistage deformation process within a single cycle, which is a distinctive feature of the tested material system.
Overall, the hysteresis-loop analysis demonstrates that the cyclic response of the reconstructed soil–rock mixtures is governed by a coupled evolution of strain amplitude, confining pressure, and rock block content. Strain amplitude controls the degree of nonlinearity and energy dissipation, confining pressure determines the level of structural constraint, and rock block content regulates the internal load-sharing mode. The resulting hysteresis morphology therefore reflects not only the mechanical state of the material, but also the progressive activation of its internal structure. This provides the direct experimental basis for the subsequent analysis of shear modulus degradation and damping evolution. The hysteresis loops of the reconstructed soil–rock mixture specimens under different rock block contents and confining pressures are shown in
Figure 8.
4.2. Shear Modulus Degradation
The results show that all reconstructed soil–rock mixture specimens exhibited a pronounced shear modulus degradation behaviour under cyclic loading. In all test groups, the shear modulus
decreased continuously with increasing shear strain amplitude
, indicating a progressive loss of stiffness during cyclic deformation. Within the strain range considered in this study, as
increased from 0.015% to 1.50%, the shear modulus of all specimens decreased markedly. The reduction was strongly nonlinear rather than uniform over the whole strain range [
40].
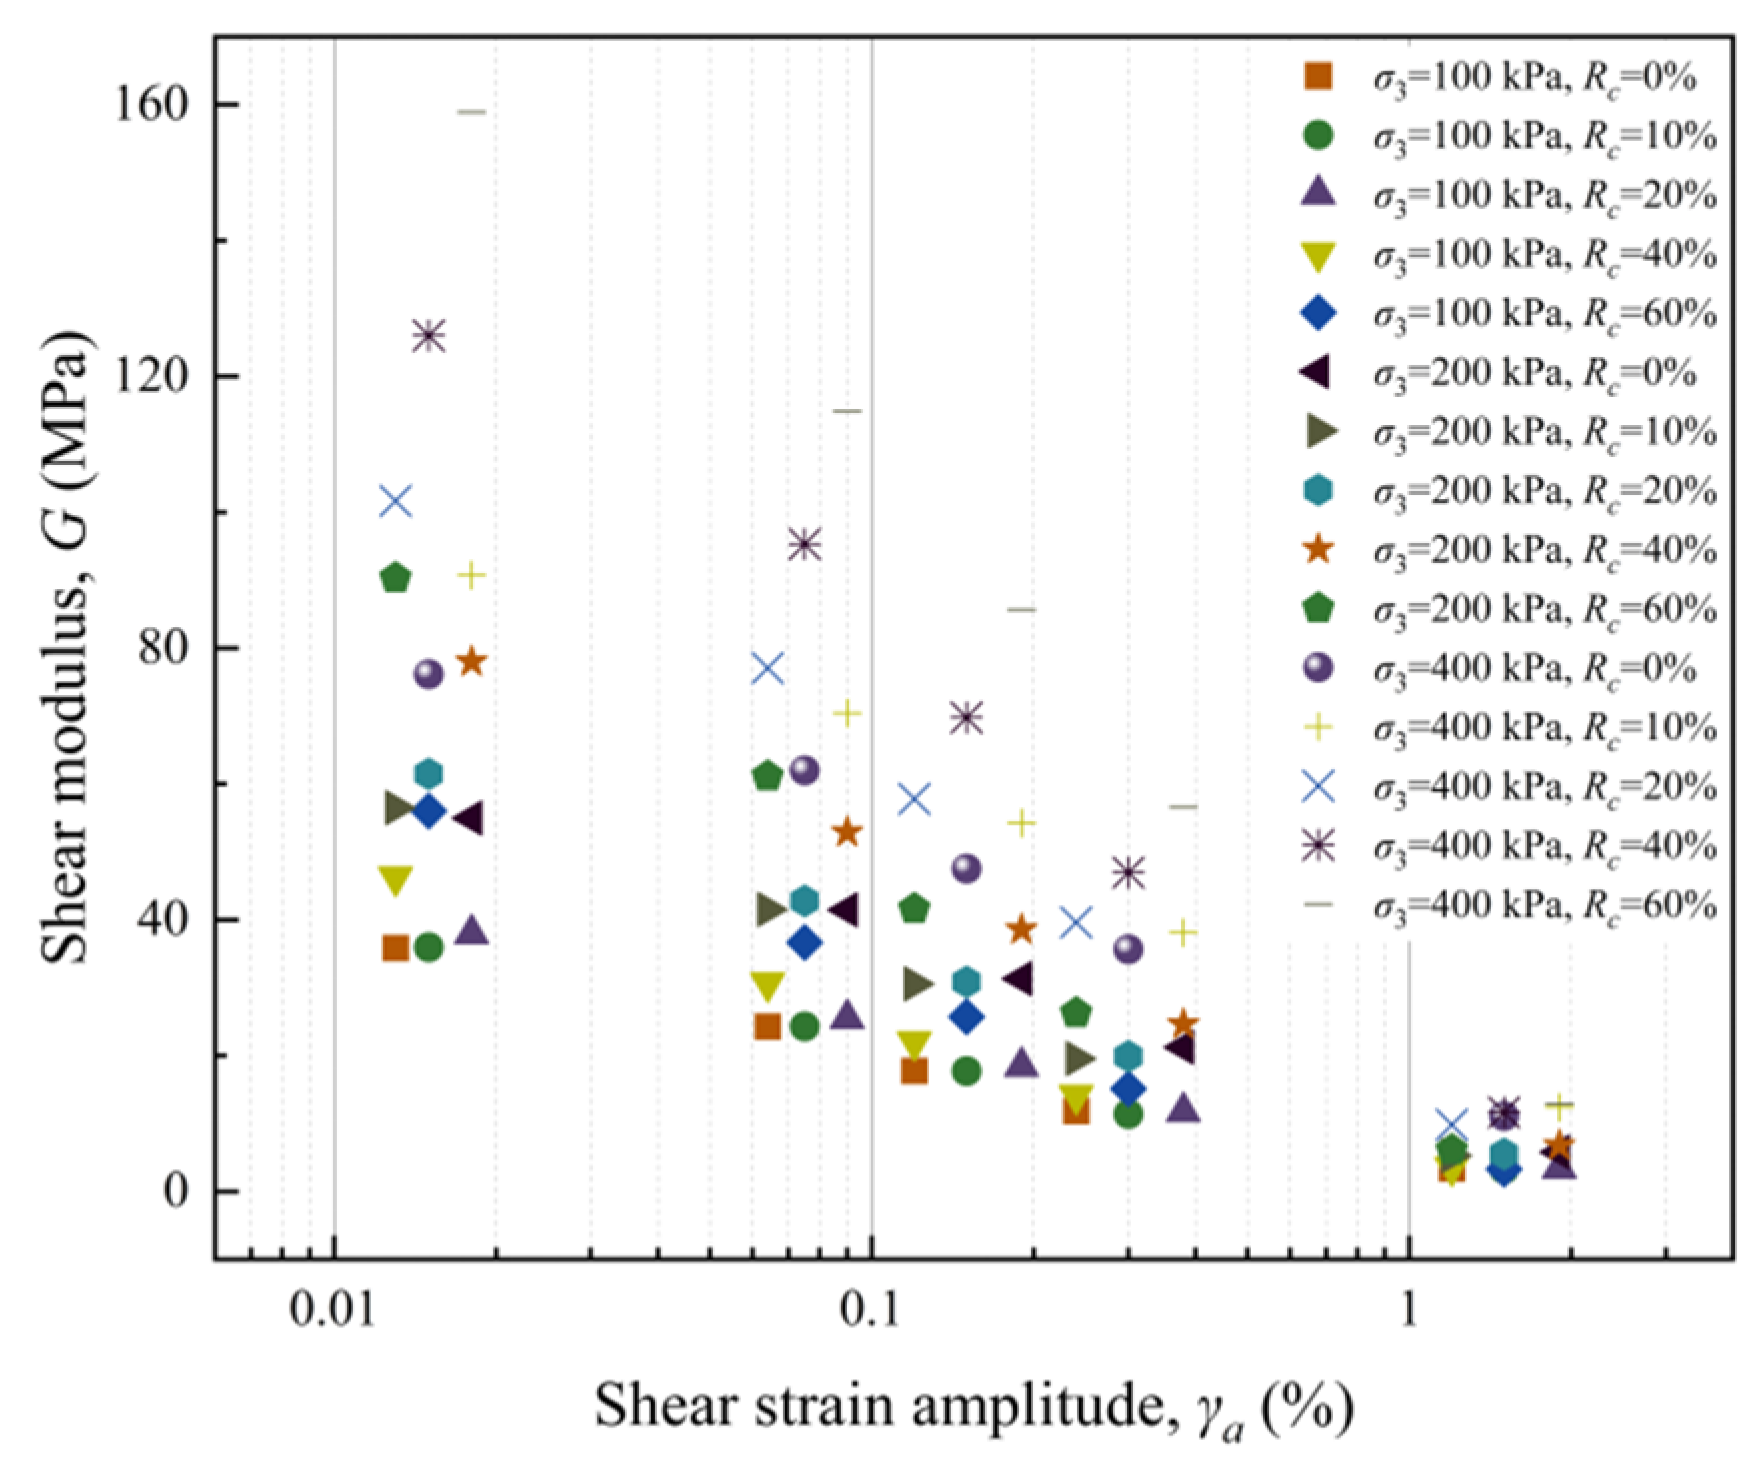
From the overall numerical distribution, the shear modulus remained relatively high at small strain levels but decreased substantially as the strain level increased. At , the measured values ranged from 35.835 to 158.871 MPa. When increased to 0.075%, the modulus range decreased to 24.264–114.826 MPa. At , it further decreased to 17.702–85.691 MPa. When , the corresponding range was 11.380–56.556 MPa. At the largest strain level, , the shear modulus dropped to only 3.296–12.854 MPa. These results indicate that the internal stiffness reserve of the material was continuously consumed as cyclic strain increased, and that the degradation of shear modulus developed in a clear stage-wise manner.
This degradation trend can be observed more clearly from representative specimen groups. For the pure-soil group (), under a confining pressure of 100 kPa, the shear modulus decreased from 35.835 MPa to 24.297, 17.772, 11.882, and 3.407 MPa as increased. Under 200 kPa, the corresponding values decreased from 54.964 MPa to 41.453, 31.344, 21.235, and 5.810 MPa. Under 400 kPa, the modulus decreased from 76.136 MPa to 61.991, 47.536, 35.652, and 11.092 MPa. A similar reduction pattern was observed in the high-rock-content group (). Under 100 kPa, the modulus decreased from 56.030 MPa to 36.650, 25.708, 15.095, and 3.296 MPa. Under 200 kPa, it decreased from 90.296 MPa to 61.101, 41.597, 26.277, and 6.087 MPa. Under 400 kPa, it decreased from 158.871 MPa to 114.826, 85.691, 56.556, and 12.854 MPa. These results confirm that the continuous reduction in shear modulus with increasing strain remained a stable and consistent feature regardless of changes in material composition and confining pressure.
In terms of degradation magnitude, the total reduction in shear modulus from the smallest to the largest strain level generally reached about 85%–94% for all test groups. For example, the total reductions for the group under 100, 200, and 400 kPa were approximately 90.5%, 89.4%, and 85.4%, respectively. For the group, the corresponding values were about 94.1%, 93.3%, and 91.9%. This indicates that although different specimen groups had different initial stiffness levels, all of them experienced substantial weakening of the internal load-bearing structure at large strain levels and gradually shifted from a relatively stable initial state to a more strongly nonlinear response state.
The effect of rock block content on the absolute shear modulus level was evident, especially at small and medium strain levels. Under the same confining pressure, generally increased with increasing , and this tendency became more pronounced as the confining pressure increased. At , the modulus under 100 kPa increased from 35.835 MPa at , while under 400 kPa it increased from 76.136 MPa to 158.871 MPa over the same rock-content range. This indicates that increasing rock block content significantly enhanced the initial stiffness level of the reconstructed soil–rock mixtures. However, at the largest strain level under low confining pressure, the differences among different rock-content groups became much smaller. For example, under 100 kPa and , the modulus values of all groups converged into a narrow range of 3.296–3.614 MPa. This suggests that the stiffness advantage associated with higher rock content was gradually weakened as cyclic deformation increased.
The influence of confining pressure was also systematic [
41]. For a fixed rock block content, increasing confining pressure always resulted in a higher shear modulus over the whole strain range. For example, for the
group, the modulus at
increased from 46.275 MPa at 100 kPa to 77.990 MPa at 200 kPa and further to 126.019 MPa at 400 kPa. Even at
, the corresponding values were still 3.614, 6.782, and 11.676 MPa, respectively. This indicates that confining pressure not only increased the initial stiffness but also helped maintain a higher residual stiffness at large strain. These results demonstrate that the shear modulus degradation of reconstructed soil–rock mixtures is characterized by strong nonlinearity, distinct stage dependence, and clear sensitivity to both rock block content and confining pressure.
It should be emphasized that the modulus degradation described here corresponds to the adopted multistage loading path. Therefore, the sharp reduction in stiffness at the medium- and large-strain stages should be understood as the combined outcome of the imposed strain amplitude and the structural state inherited from the previous loading stages. The increasing strain amplitude provides the direct driving condition for stiffness reduction, whereas earlier stages may contribute to fabric readjustment, local contact modification, and irreversible deformation accumulation. Since the same loading sequence was used for all specimen groups, the resulting curves remain suitable for comparative evaluation of rock block content and confining pressure, but they should not be interpreted as single-stage virgin degradation curves at each strain amplitude.
Overall, the reconstructed soil–rock mixtures investigated in this study exhibited a clear and continuous shear modulus degradation behaviour within the studied strain range. The shear modulus decreased continuously with increasing . The modulus remained relatively high at small strain levels, decreased steadily at intermediate strain levels, and dropped much more significantly at large strain levels. At the same time, higher rock block content and higher confining pressure generally produced higher absolute modulus levels, although the differences among different groups became less pronounced under large-strain and low-confining-pressure conditions. These results demonstrate that the stiffness loss of soil–rock mixtures under cyclic loading is characterized by strong nonlinearity and a clear stage-wise evolution.
To quantitatively illustrate the shear modulus degradation behaviour of the reconstructed soil–rock mixtures,
Figure 9 presents the variation in shear modulus with shear strain amplitude, and
Table 1 summarizes the extrapolated initial shear modulus
and the reference shear strain
under different rock block contents and confining pressures.
4.3. Normalized Shear Modulus Curves
4.3.1. Overall Distribution Characteristics of Normalized Shear Modulus Ratio
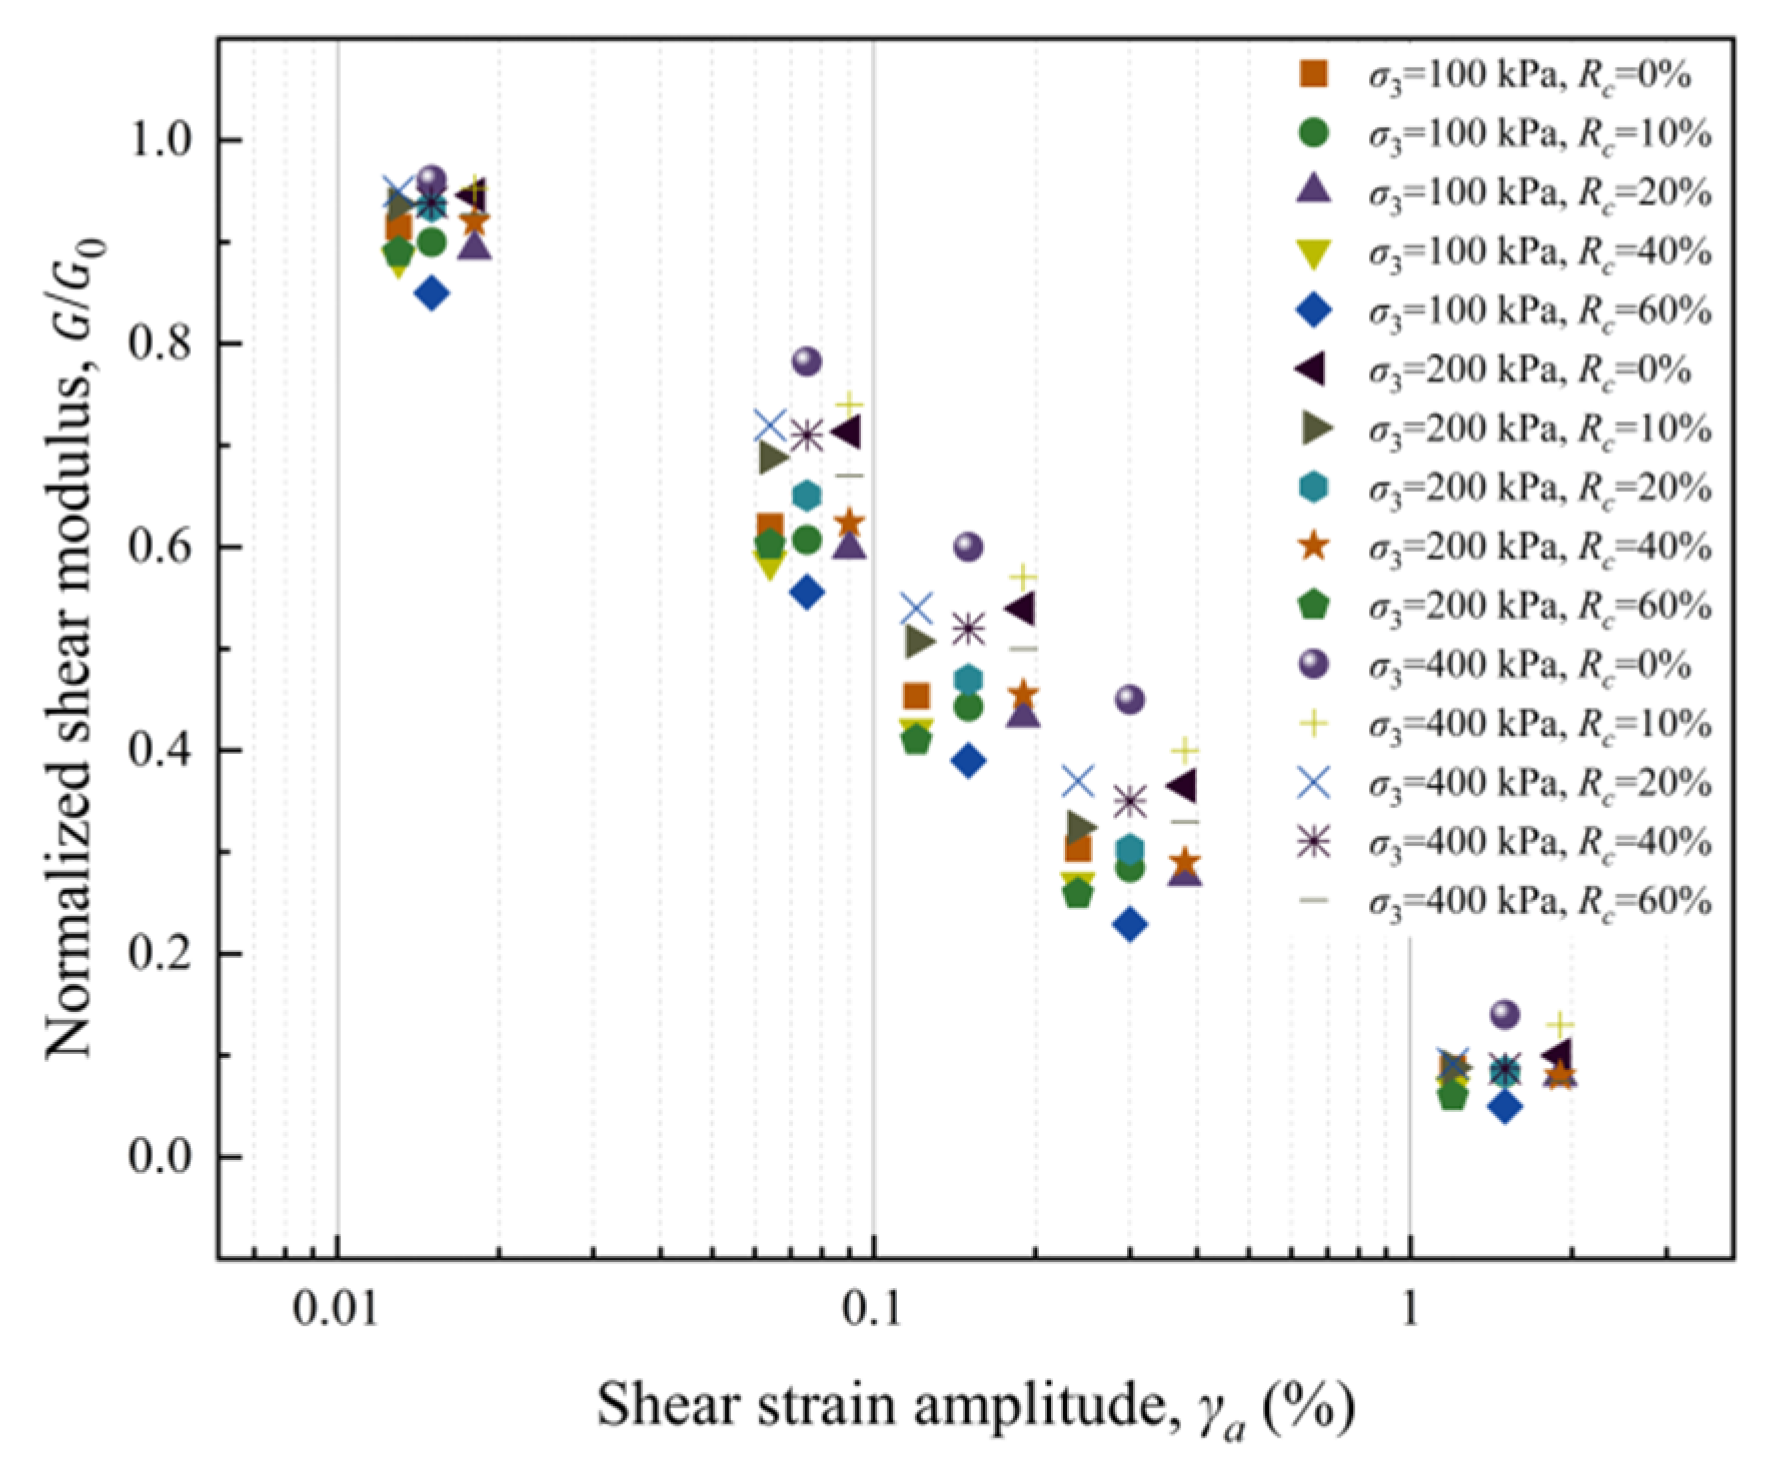
Figure 10 presents the overall distribution of the normalized shear modulus ratio of the reconstructed soil–rock mixtures under different rock block contents and confining pressures. A total of 15 specimen groups were included, corresponding to five rock block contents and three confining pressures, and each group was evaluated at five shear strain amplitudes. The normalized data points show a clear strain-dependent reduction trend and provide the basis for comparing the relative stiffness degradation behaviour among different test groups.
The distribution of the normalized data points shows a clear strain-dependent degradation tendency. On the whole, the values of decrease progressively with increasing shear strain amplitude, indicating that the proportion of retained stiffness relative to the initial state becomes smaller during cyclic loading. Although the absolute shear modulus level differed significantly among the test groups, the normalization treatment placed all data points into the same relative coordinate system, which made the intrinsic degradation pattern more directly observable.
From the overall distribution pattern, the normalized data points exhibit a distinctly nonlinear reduction form rather than a linear trend. At small strain levels, most data points remain in the upper part of the plot, indicating that the specimens still preserve a large proportion of their initial stiffness. As the strain amplitude increases into the intermediate range, the normalized modulus values decrease more rapidly, and the distribution band shifts downward more significantly. At large strain levels, the point distribution becomes concentrated in the lower part of the plot, while the overall rate of reduction tends to weaken compared with the intermediate-strain stage. This indicates that the stiffness degradation of the reconstructed soil–rock mixtures is characterized by a clear stage-dependent nonlinear evolution.
Another important feature is that, although the normalized data points do not fully overlap, they are distributed within a relatively consistent degradation band. The differences among groups are mainly reflected in the vertical position of the points and in the extent of scatter at the same strain level, rather than in any fundamental change in the overall reduction form. This suggests that rock block content and confining pressure still affect the detailed reduction path of normalized stiffness, but the normalized modulus ratio of all specimen groups follows a similar basic degradation trend after normalization.
Overall, the normalized shear modulus ratio data demonstrate that the extrapolated initial shear modulus
determined provides an effective reference for the comparison of relative stiffness degradation. After normalization by Equation (8), all specimen groups show a continuous nonlinear reduction trend of
with increasing shear strain amplitude, and the data points are distributed within a broadly similar degradation range. This provides the basis for the subsequent discussion on the effects of rock block content and confining pressure on the normalized modulus-reduction behaviour. To further illustrate the overall distribution characteristics of the normalized shear modulus ratio,
Figure 10 presents the
data points of the reconstructed soil–rock mixtures under different rock block contents and confining pressures.
4.3.2. Effect of Rock Block Content on Normalized Shear Modulus Ratio
Using the constrained fitting model presented in
Section 3.5, the effect of rock block content on the normalized shear modulus ratio was evaluated by comparing the fitted
evolution relationships under the same confining pressure. For each confining pressure level, namely 100, 200, and 400 kPa, five rock block contents (
) were considered in order to examine how the relative stiffness-retention behaviour changes with increasing rock inclusion.
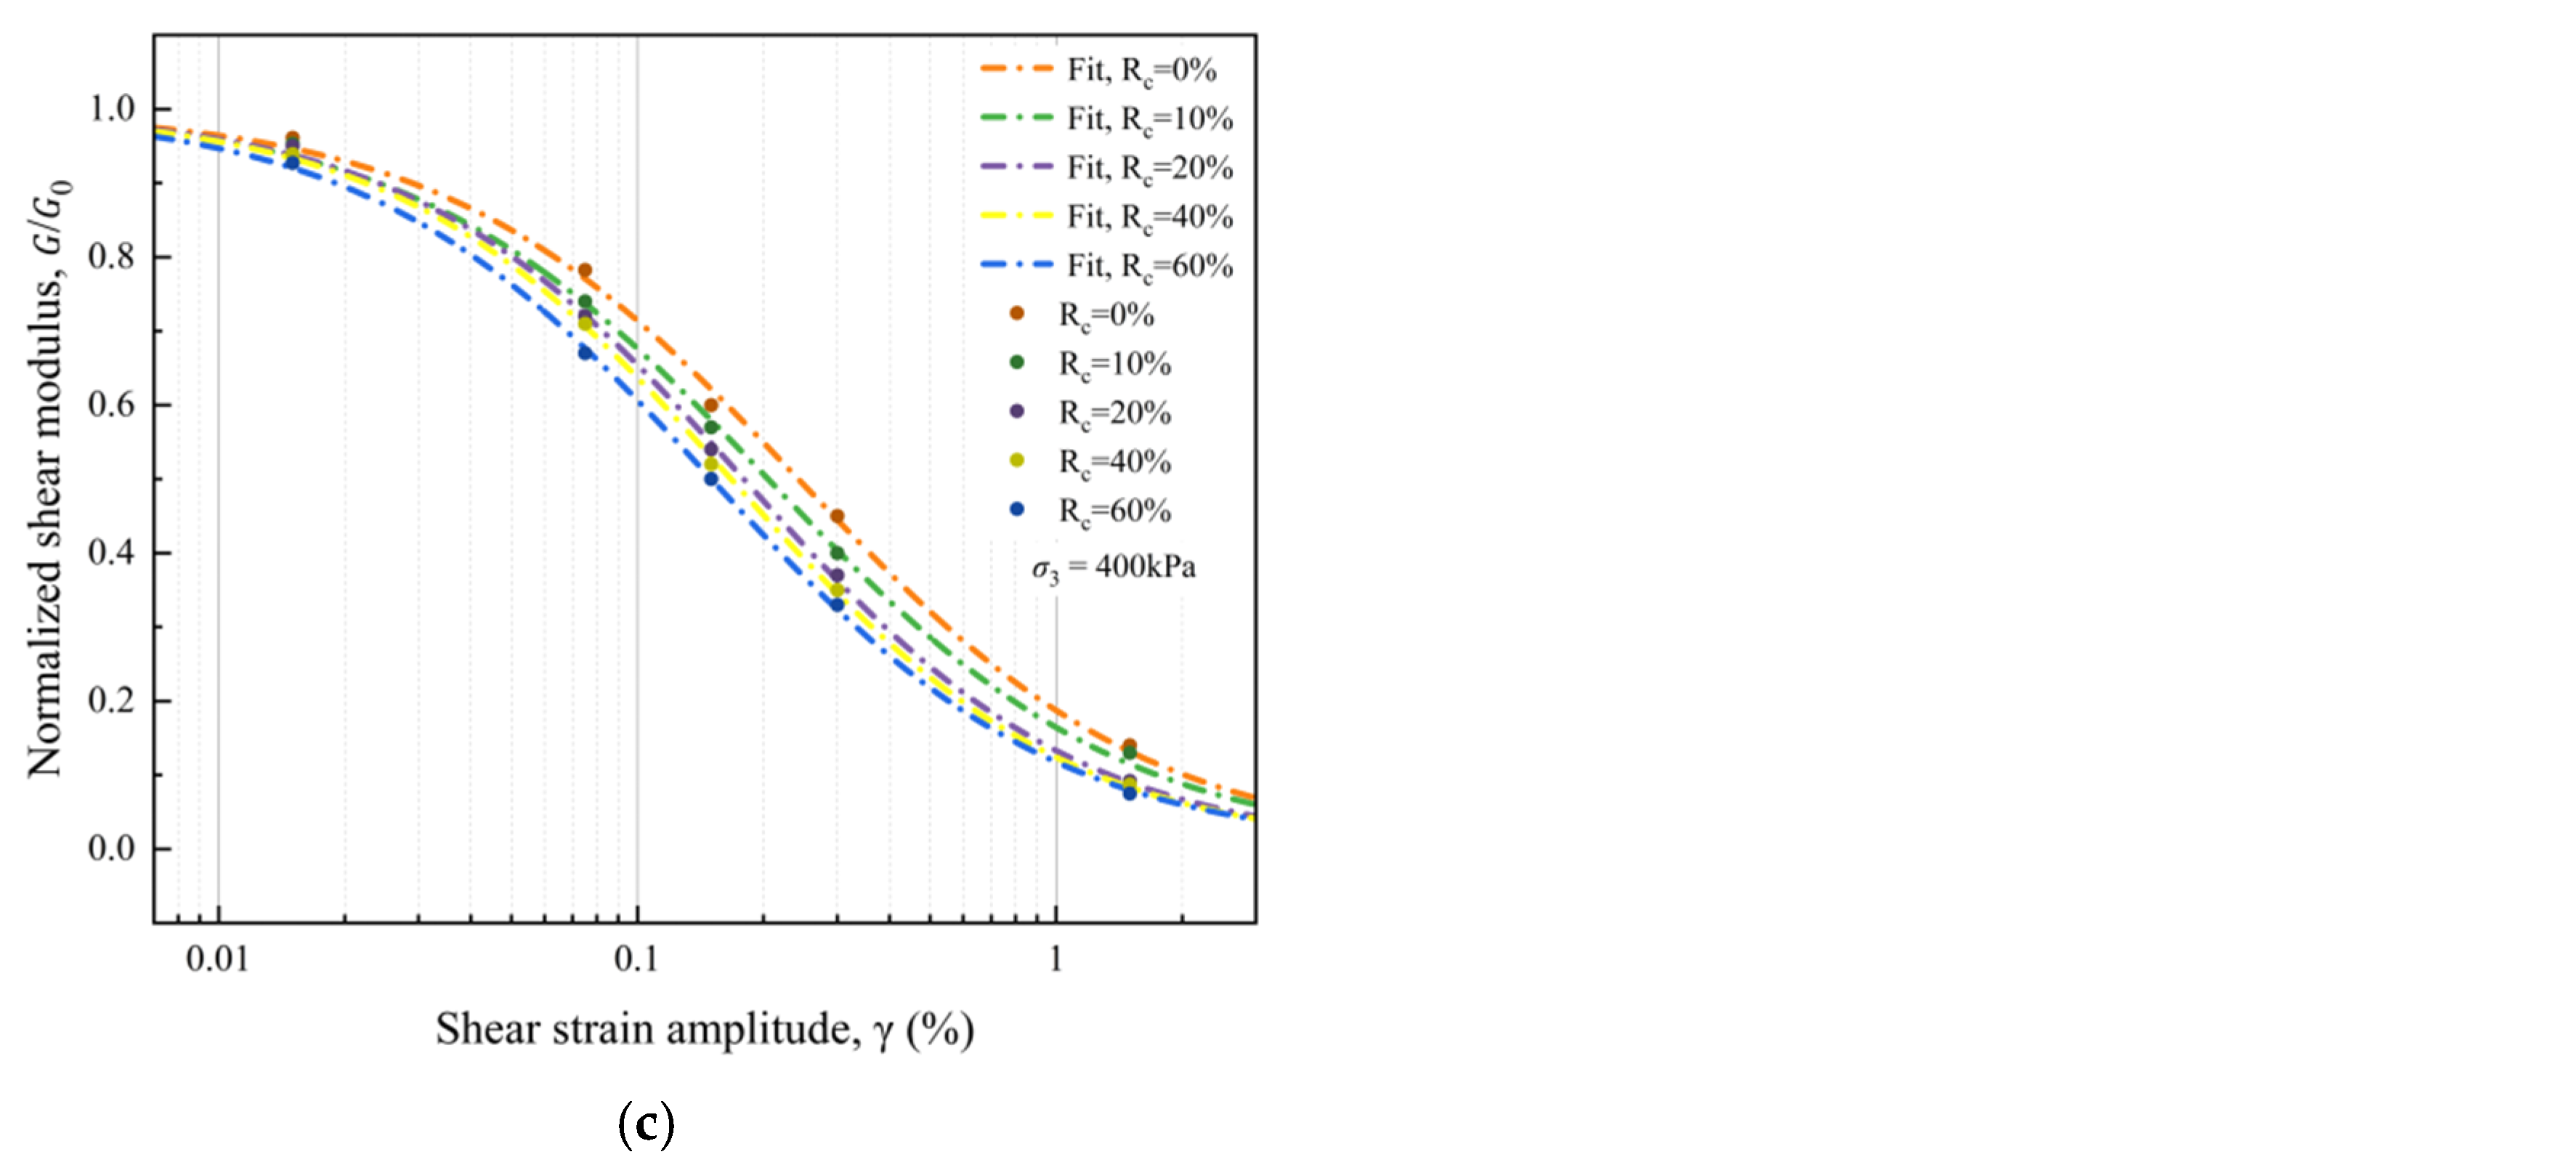
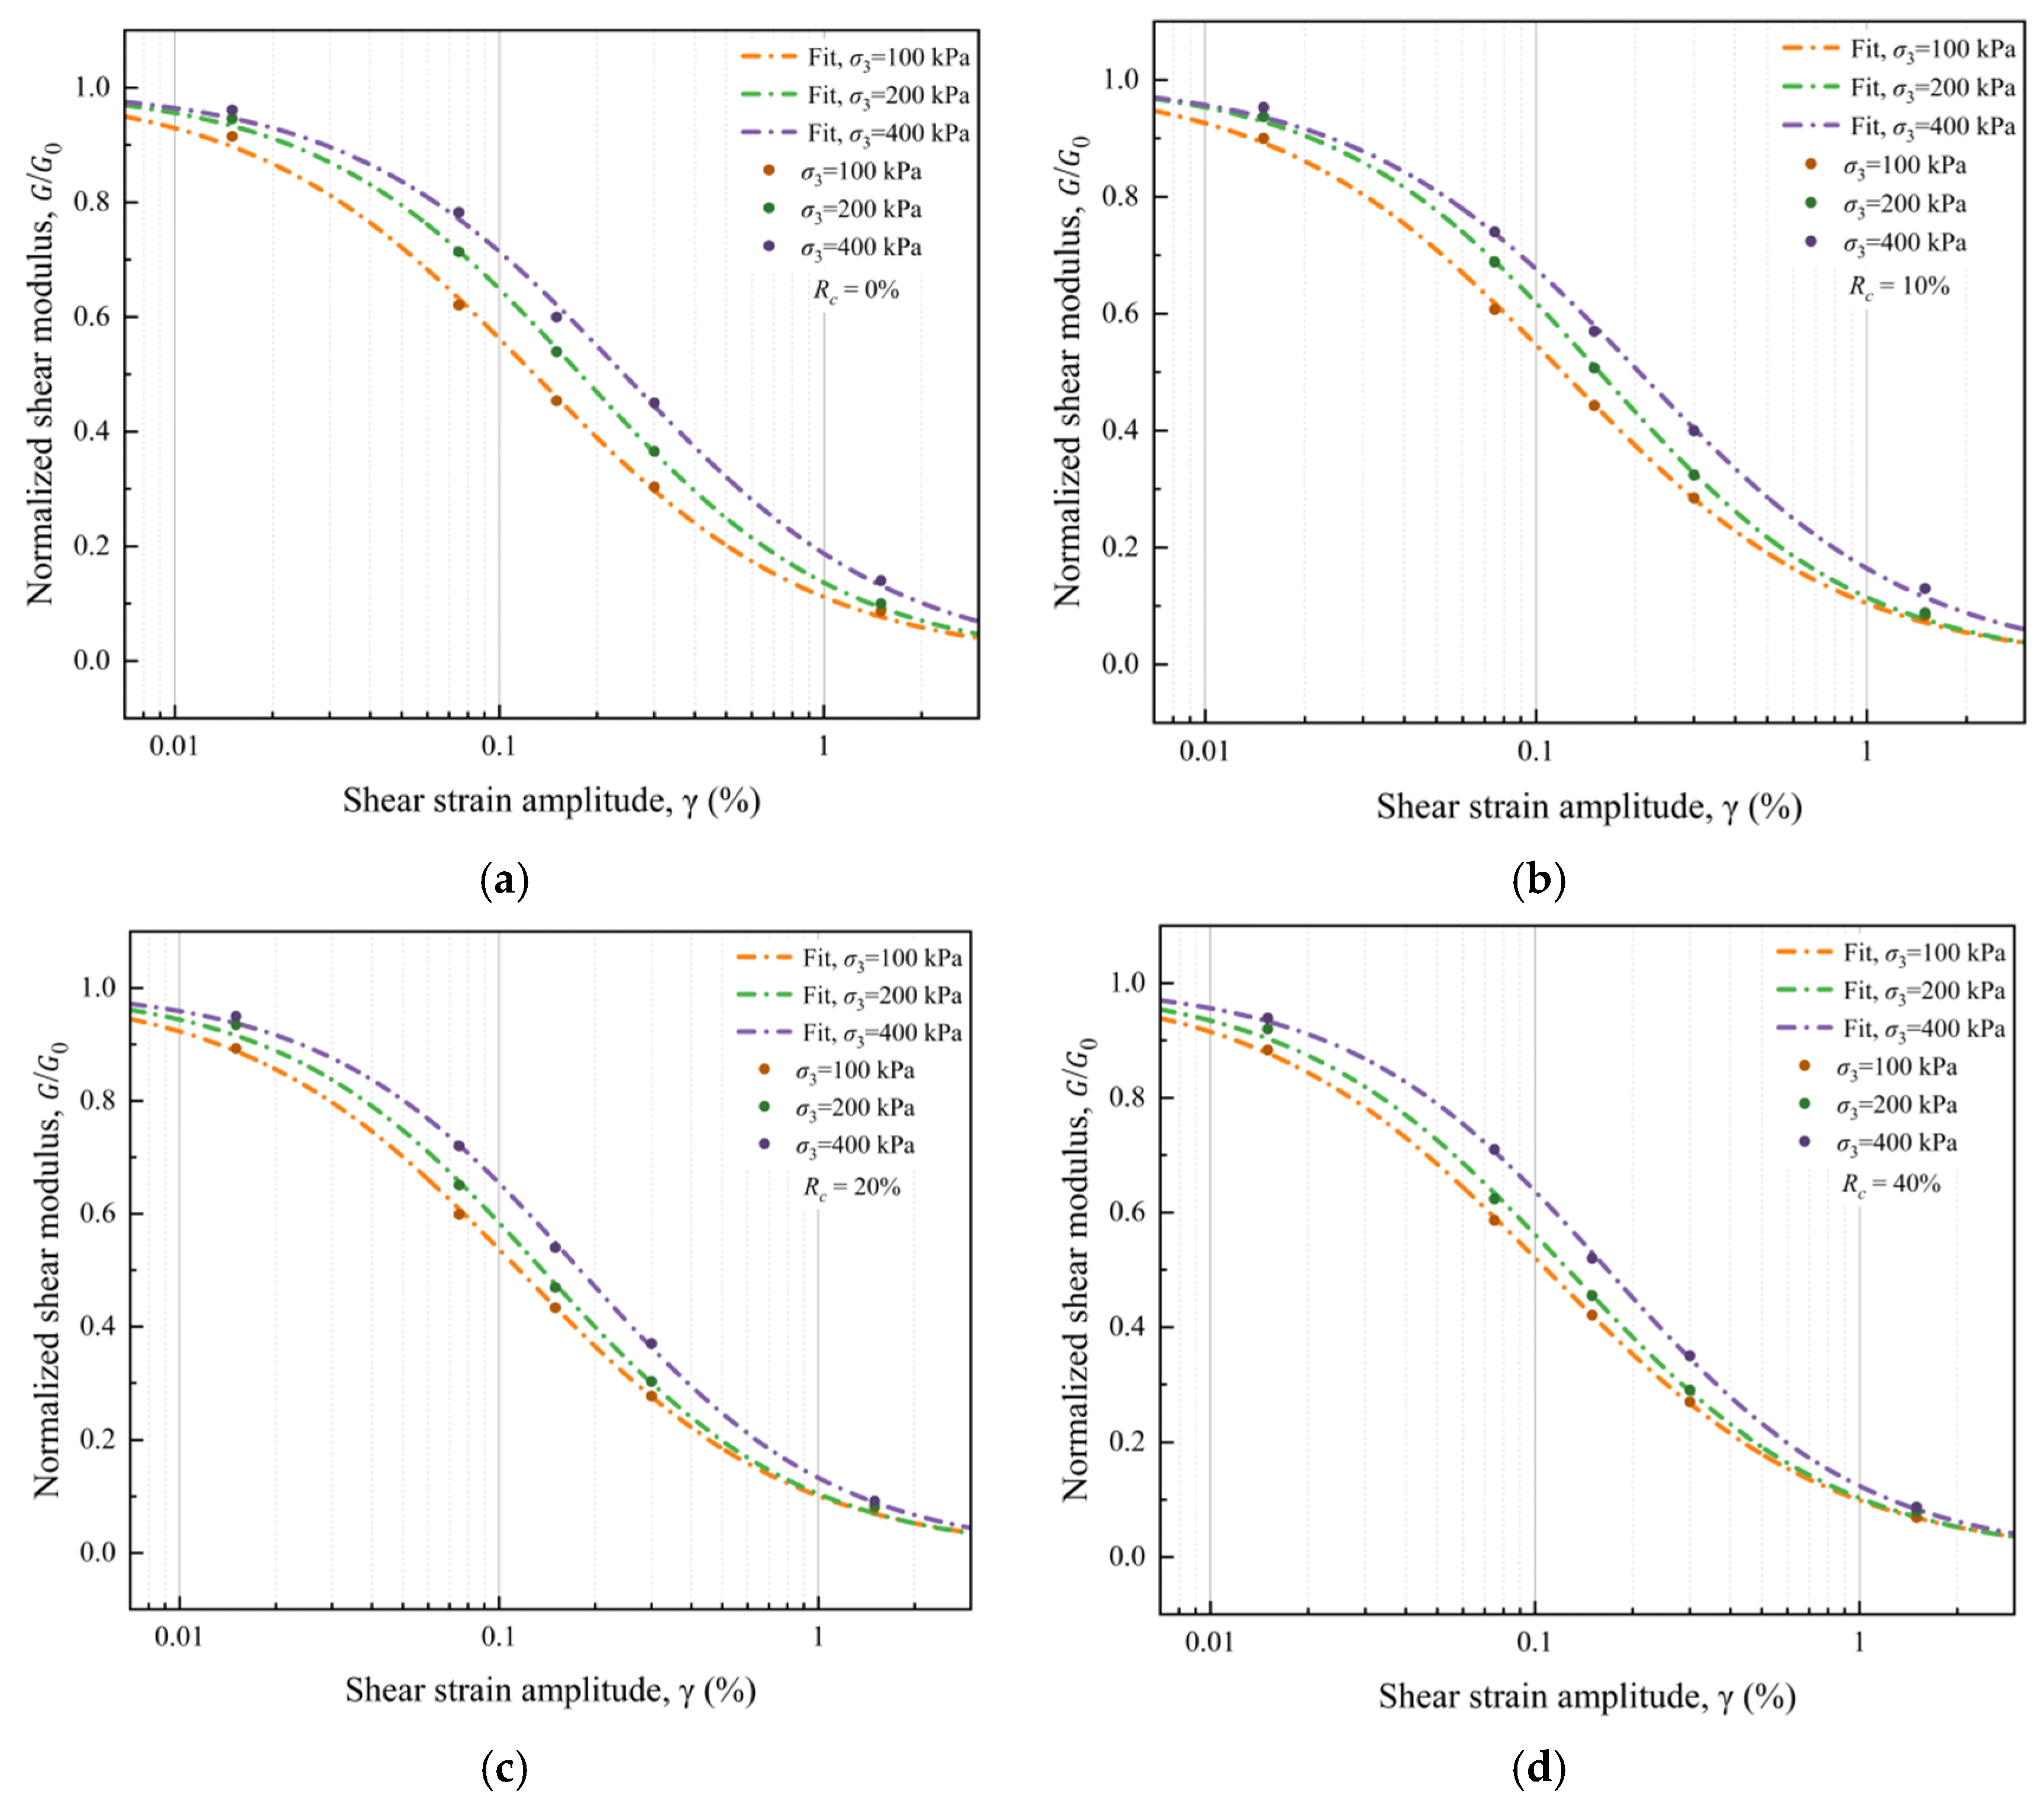
The results show that rock block content has a clear effect on the normalized modulus-reduction behaviour. Under the same confining pressure, the relationship generally shifts downward and toward the lower-strain side as increases. This indicates that, after normalization by the extrapolated initial shear modulus , the higher-rock-content groups tend to retain a smaller proportion of their initial stiffness at the same shear strain amplitude. This tendency is already identifiable at 100 kPa, becomes more distinct at 200 kPa, and is the most pronounced at 400 kPa, especially in the intermediate strain range where the reduction in normalized modulus is most sensitive. Therefore, the influence of rock block content on is not only significant, but also strongly dependent on confining pressure.
A more direct quantitative indication is provided by the variation in the reference shear strain . Under 100 kPa, decreases continuously from 0.128 to 0.120, 0.116, 0.109, and 0.092 as increases from 0% to 60%. Under 200 kPa, the corresponding values decrease from 0.178 to 0.155, 0.137, 0.127, and 0.109. Under 400 kPa, further decreases from 0.242 to 0.205, 0.179, 0.167, and 0.150. From to , the total reduction in is approximately 27.8%, 38.6%, and 38.0% under 100, 200, and 400 kPa, respectively. These results demonstrate that increasing rock block content systematically shifts the characteristic degradation position of the relationship toward a lower strain range. In other words, the higher-rock-content groups reach the state of at a smaller shear strain amplitude than the lower-rock-content groups.
In contrast, the fitted shape parameter remains within a relatively narrow range for all test groups. At 100 kPa, varies from 0.996 to 1.015; at 200 kPa, it ranges from 1.047 to 1.097; and at 400 kPa, it ranges from 1.026 to 1.094. The overall fluctuation interval is only 0.996–1.097, indicating that the basic nonlinear form of the normalized modulus-reduction relationship remains similar among different rock block contents. Therefore, the principal effect of is not to fundamentally change the reduction pattern itself, but to alter the characteristic-strain position and the relative degradation rate of the relationship.
The fitting accuracy further confirms the reliability of this interpretation. For all 15 test groups, the coefficient of determination ranges from 0.9977 to 0.9998, the RMSE ranges from 0.0037 to 0.0134, the MAE ranges from 0.0029 to 0.0122, and the MAPE ranges from 0.73% to 4.86%. These consistently high fitting qualities indicate that the modified hyperbolic model provides an excellent representation of the present normalized shear modulus data. More importantly, the systematic decrease in with increasing is observed together with very stable goodness-of-fit, which means that the rock block effect identified here is not caused by accidental scatter of individual data points, but reflects a robust trend in the normalized stiffness-degradation behaviour.
It should be emphasized that this result does not contradict the findings obtained from the absolute shear modulus in
Section 4.2. In
Section 4.2, increasing rock block content generally leads to higher absolute shear modulus values. However, the present section discusses
, which represents the stiffness retained relative to the extrapolated initial stiffness of the same specimen group. Since
itself increases significantly with rock block content, normalization removes the direct advantage associated with a higher initial stiffness level and instead reveals the difference in the relative degradation path. For example, under 100 kPa,
increases from 39.164 MPa at
to 65.918 MPa at
; under 200 kPa, it increases from 58.102 to 101.456 MPa; and under 400 kPa, it increases from 79.226 to 171.382 MPa. Therefore, the lower
values and smaller
values observed in the higher-rock-content groups do not mean that these specimens are absolutely weaker. Rather, they indicate that, relative to their own higher initial stiffness basis, their stiffness-retention ratio decreases more rapidly with increasing strain.
From a mechanical viewpoint, this behaviour reflects the structural role of rock blocks in the reconstructed soil–rock mixtures. As rock block content increases, the internal material system becomes more heterogeneous, and the cyclic response is increasingly influenced by block–matrix interaction, interfacial sliding, and contact rearrangement. Under low confining pressure, the rock blocks mainly act as dispersed inclusions in the soil matrix, and their influence on the normalized degradation path remains relatively limited. Under higher confining pressure, however, the contacts among rock blocks and between rock blocks and the soil matrix are mobilized more effectively, so the structural effect associated with rock block content becomes much stronger. As a result, the influence of on the normalized modulus-reduction behaviour becomes more evident with increasing confinement.
Overall, increasing rock block content does not change the basic nonlinear form of the
reduction relationship, but it significantly affects its relative position, characteristic-strain, and degradation rate. With increasing
, the normalized modulus relationship shifts toward lower
values and lower characteristic strain levels, while this influence becomes progressively more pronounced as confining pressure increases. These results indicate that rock block content is an important factor controlling the relative stiffness degradation behaviour of reconstructed soil–rock mixtures under cyclic loading. To further evaluate the applicability of the modified hyperbolic model to the present normalized shear modulus data, the fitted
curves for different rock block contents under each confining pressure are presented in
Figure 11, while the corresponding fitting parameters and error indices are summarized in
Table 2.
4.3.3. Effect of Confining Pressure on Normalized Shear Modulus Ratio
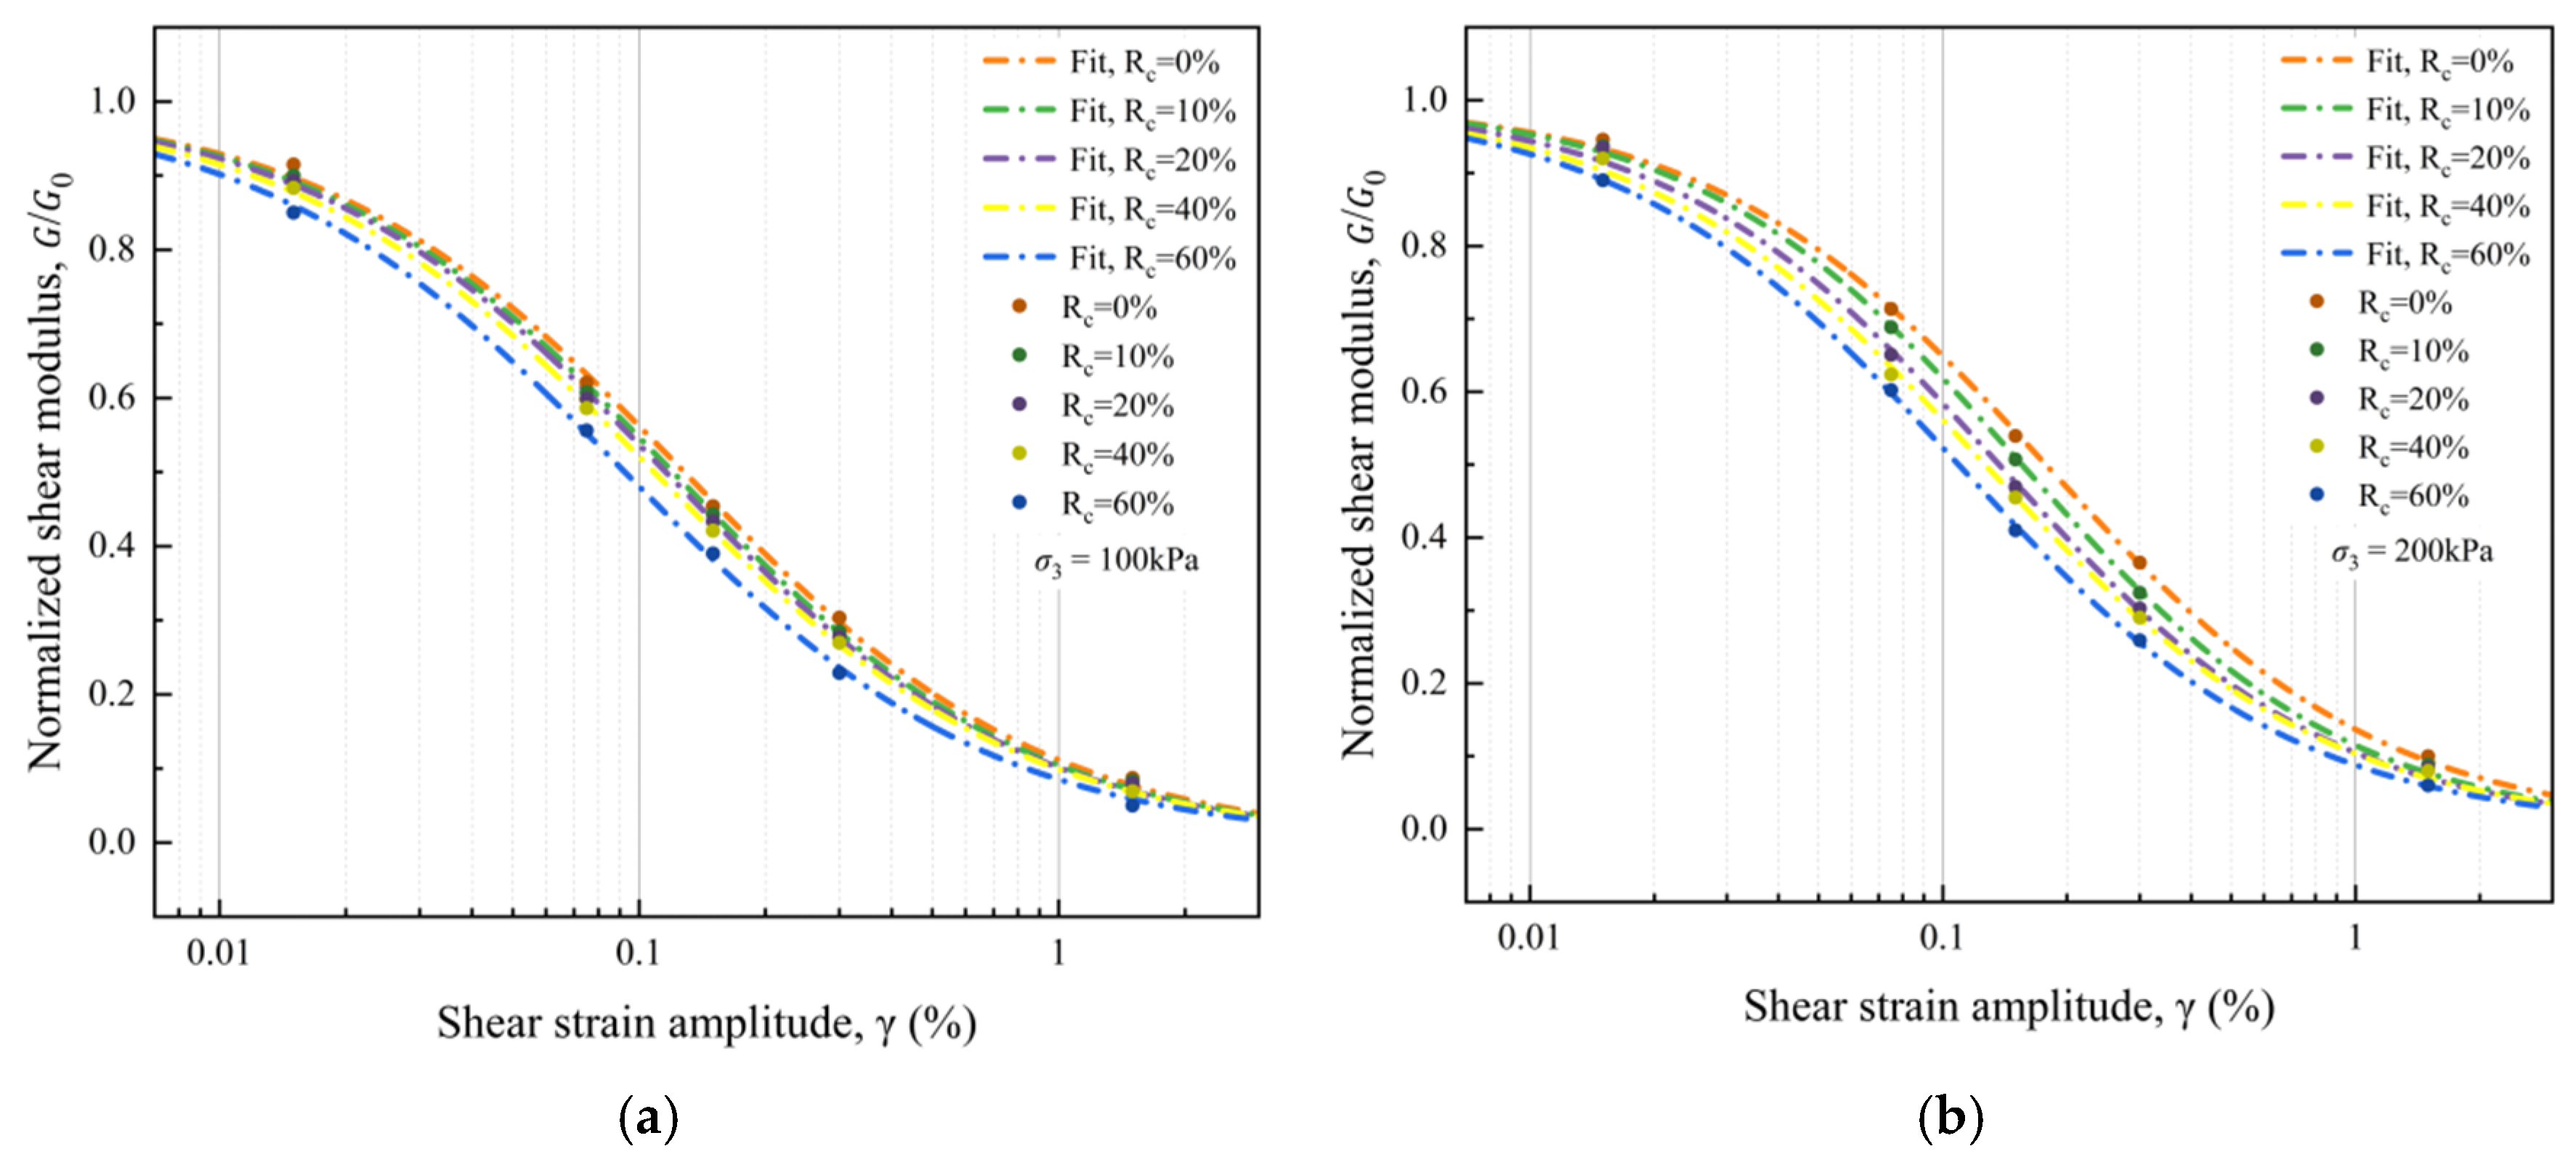
The effect of confining pressure on the normalized shear modulus ratio was examined by comparing the fitted
relationships under the same rock block content. Different from
Section 4.3.2, which focuses on the compositional effect of
, this section emphasizes the stress-state effect of confinement on the relative stiffness-retention path.
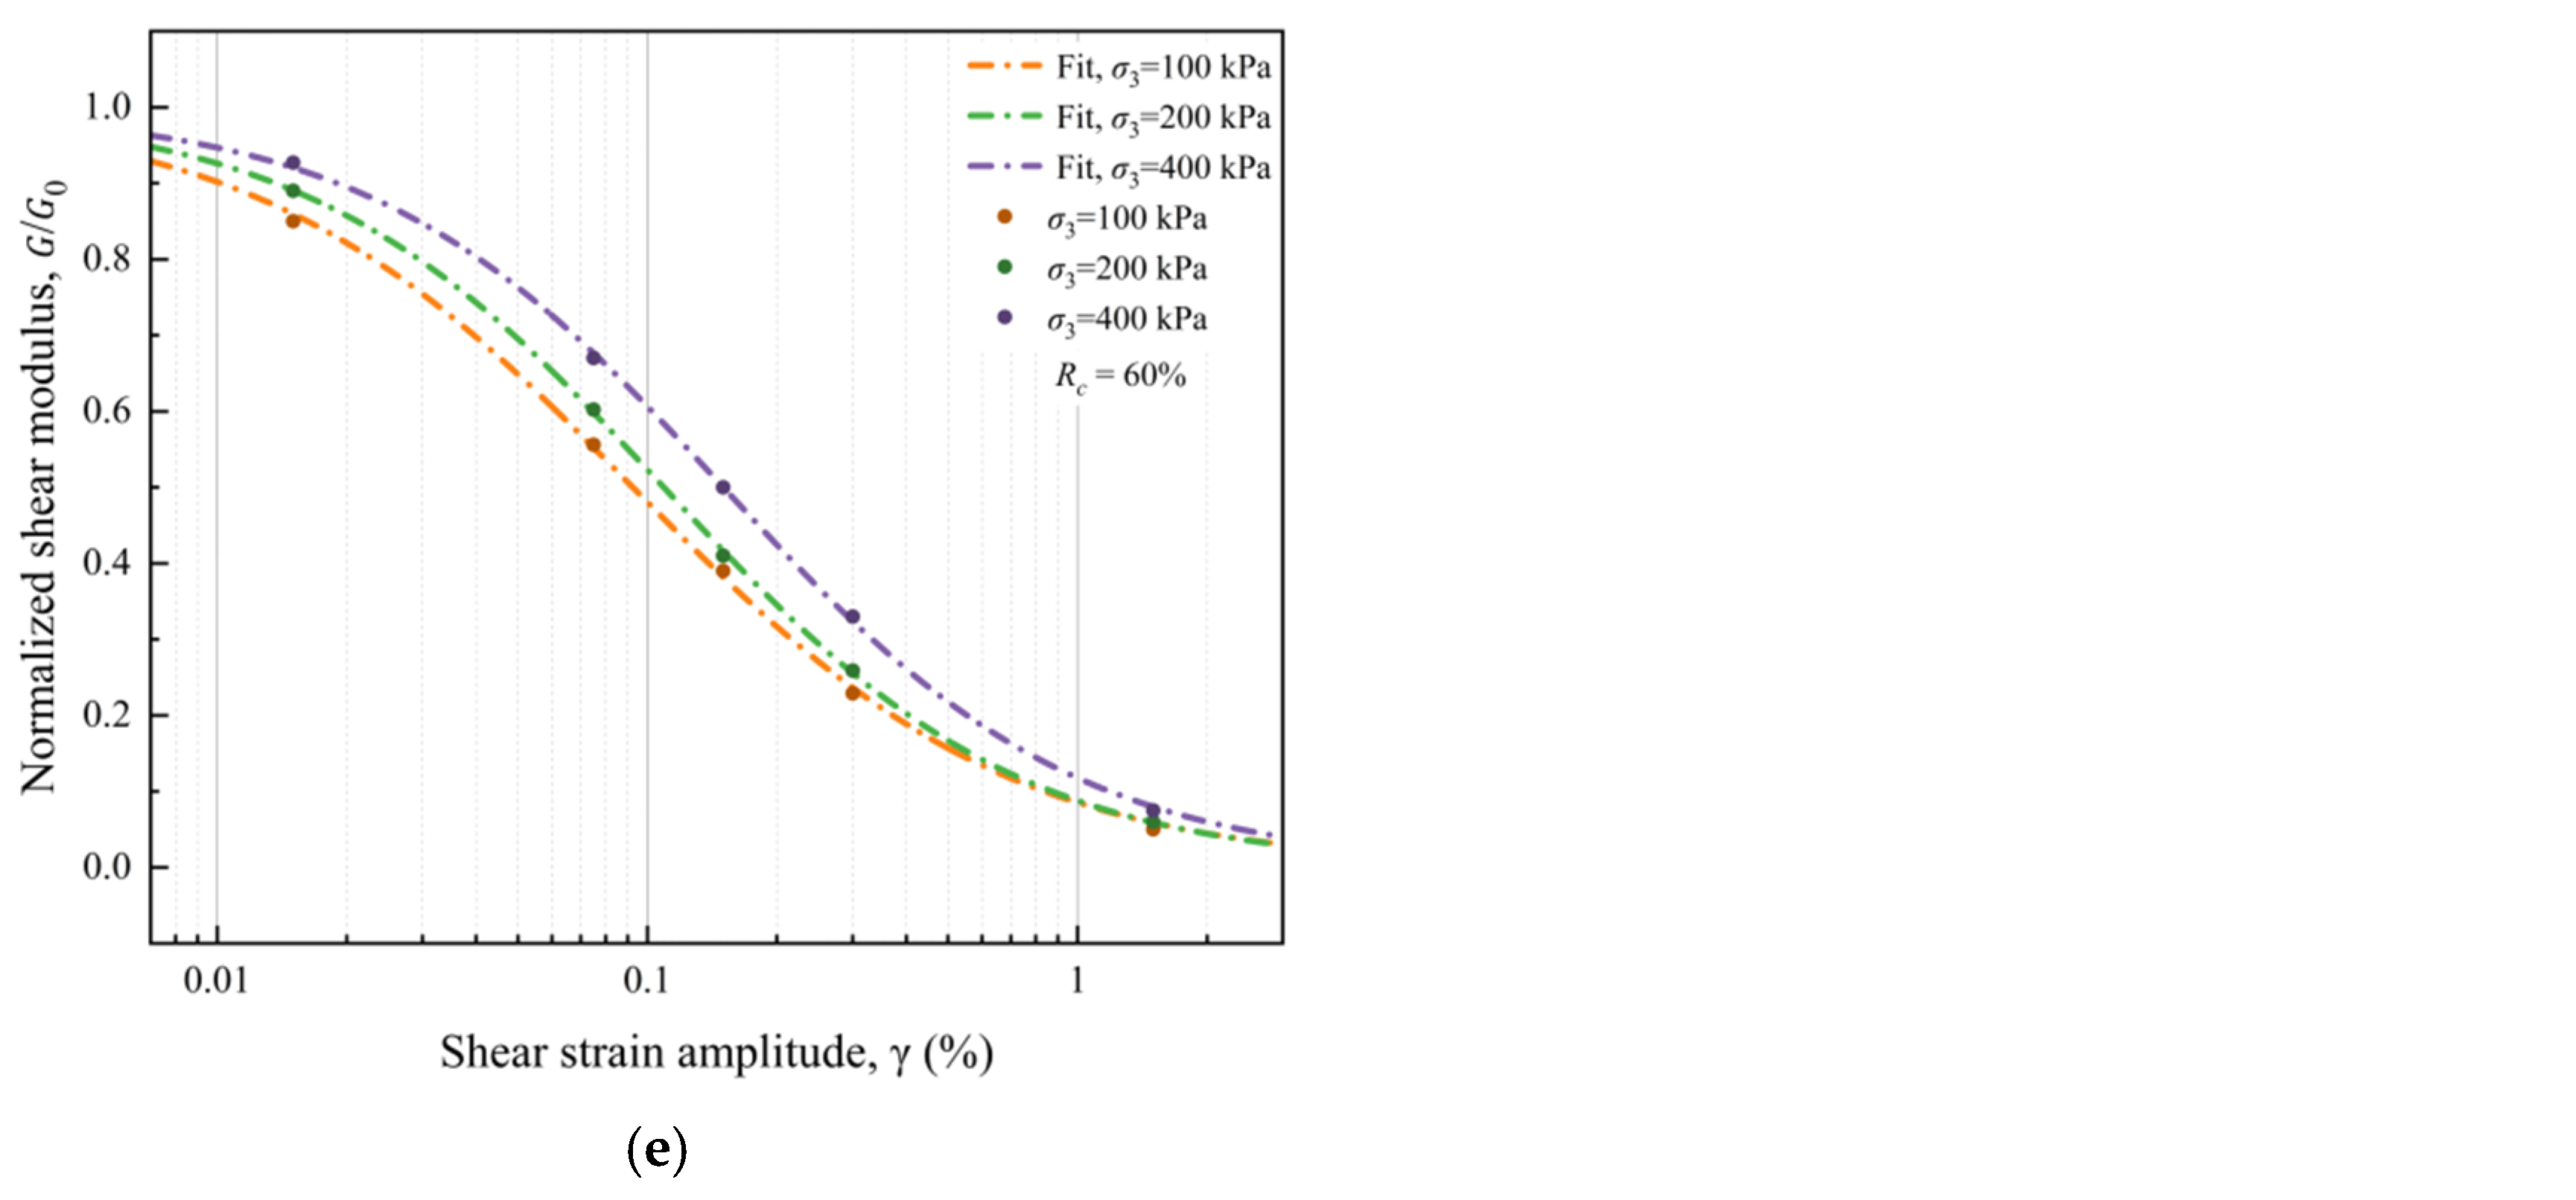
For all rock block contents, increasing confining pressure shifts the relationship upward and toward a higher strain range. This indicates that stronger confinement allows the specimen to retain a larger proportion of its initial stiffness at the same shear strain amplitude. The effect is weak at the smallest strain level, but becomes more evident in the intermediate strain range, where normalized modulus reduction develops most actively.
The variation in the reference shear strain provides a clear quantitative indication of this delay effect. For , increases from 0.128 at 100 kPa to 0.178 at 200 kPa and 0.242 at 400 kPa. Similar increases are observed for all other rock-content groups, with total increases from 100 to 400 kPa of approximately 89.1%, 70.4%, 55.0%, 53.9%, and 62.4% for , 10%, 20%, 40%, and 60%, respectively. These results show that stronger confinement systematically moves the characteristic degradation position toward a higher strain range.
The fitted shape parameter
remains within a relatively narrow range, indicating that confining pressure does not fundamentally change the basic nonlinear form of the normalized modulus-reduction curve. Instead, its main effect is to change the characteristic-strain position and delay the relative stiffness-degradation process. The fitting indices summarized in
Table 3 further confirm that the modified hyperbolic model provides a stable representation of the normalized modulus relationships under different confining pressures.
Overall, confining pressure does not change the basic nonlinear form of the
reduction relationship, but it significantly affects its relative position, characteristic-strain, and degradation rate. With increasing confining pressure, the normalized modulus relationship shifts toward higher
values and higher characteristic strain levels, indicating that the relative stiffness degradation of the reconstructed soil–rock mixtures is delayed under stronger confinement. These results demonstrate that confining pressure is one of the key factors controlling the normalized stiffness-retention behaviour of soil–rock mixtures under cyclic loading. To further illustrate the effect of confining pressure on the normalized shear modulus ratio,
Figure 12 presents the fitted
relationships of reconstructed soil–rock mixtures under different confining pressures for each rock block content, and
Table 3 summarizes the corresponding fitting parameters and error indices. These tabulated indices provide the basis for evaluating the fitting stability of the normalized shear modulus model under different confining pressures.
4.4. Damping Ratio Evolution
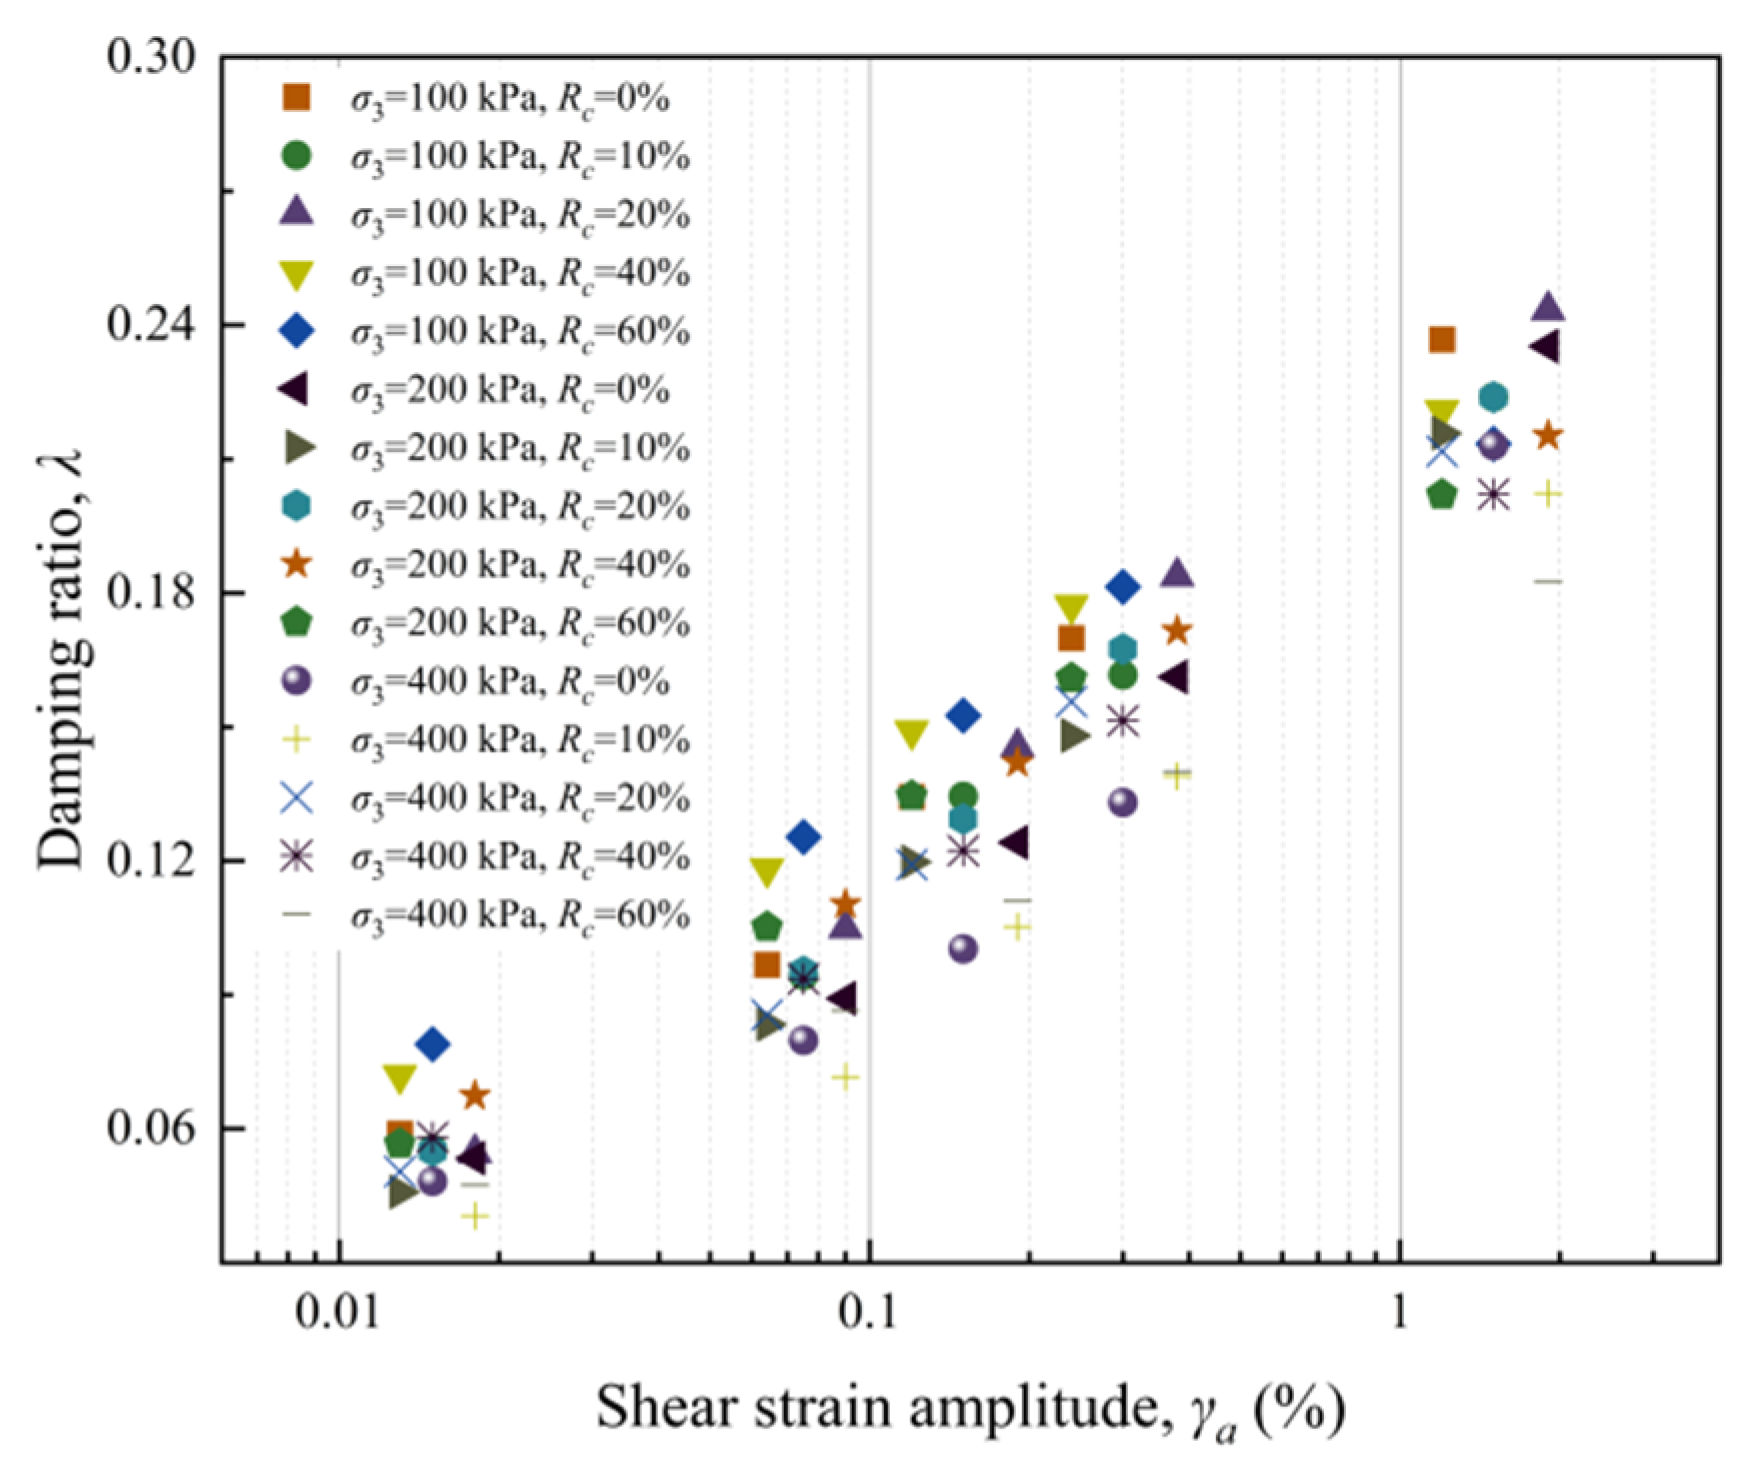
The results show that all reconstructed soil–rock mixture specimens exhibited a clear increase in damping ratio under cyclic loading. In all test groups, the damping ratio increased continuously with increasing shear strain amplitude , indicating that the energy dissipation capacity of the material was progressively enhanced during cyclic deformation. Within the strain range considered in this study, as increased from 0.015% to 1.50%, the damping ratio of all specimens rose markedly, and the increase was distinctly nonlinear rather than uniform over the whole strain range. On the whole, the damping-ratio data were distributed within a relatively narrow but clearly structured band, which indicates that the dissipation behaviour of the reconstructed soil–rock mixtures was controlled simultaneously by strain level, rock block content, and confining pressure. This overall feature is consistent with the general pattern reported for soil–rock mixtures in previous cyclic triaxial studies, in which the unnormalized damping ratio increases with shear strain and shows a zonal distribution as a whole.
From the overall numerical range, the damping ratio remained relatively low at the smallest strain level and increased progressively toward the large-strain stage. At the smallest loading level, the minimum damping ratios of all groups were distributed between 0.036 and 0.063, whereas the maximum damping ratios reached 0.195–0.268 at the largest loading stage. These results indicate that the cyclic response of the reconstructed soil–rock mixtures gradually shifted from a relatively low-dissipation state at small strain to a much more dissipative state at large strain. In other words, as the cyclic deformation developed, a larger portion of the external input energy was consumed by internal friction, interface adjustment, and irreversible structural rearrangement. The increase in damping ratio therefore provides direct evidence that the material response became progressively more hysteretic with strain growth.
The evolution of the damping ratio in the present study can be broadly divided into three successive stages. At the small-strain stage, the increase in was relatively limited, and most data points were concentrated near the lower part of the plot. This indicates that the material response was still dominated mainly by recoverable deformation, while the amount of energy dissipated during each loading cycle remained relatively low. As the shear strain entered the intermediate range, the growth rate of increased significantly, and the damping-ratio data shifted upward more rapidly. This stage represents the principal transition from a relatively stable deformation state to a more strongly nonlinear and dissipative response state. At larger strain levels, the damping ratio continued to increase, but the growth rate became less pronounced than that in the intermediate stage. This suggests that after considerable internal adjustment had already occurred, the material still dissipated more energy with further strain increase, but the rate of additional dissipation enhancement became relatively milder.
This stage-dependent increase can be observed more clearly from representative specimen groups. For the pure-soil group (Rc = 0%), the minimum damping ratio was 0.055, 0.050, and 0.047 under confining pressures of 100, 200, and 400 kPa, respectively, while the corresponding maximum damping ratios were 0.264, 0.268, and 0.252. For the high-rock-content group (Rc = 60%), the minimum damping ratio was 0.063, 0.043, and 0.038 under the same three confining pressures, whereas the corresponding maximum damping ratios were 0.223, 0.214, and 0.195. These results show that, regardless of the difference in material composition and confining pressure, the damping ratio always increased substantially from the beginning of cyclic loading to the final large-strain stage. However, the lower and upper bounds of damping evolution were not identical among the groups, which indicates that the dissipation response of the reconstructed soil–rock mixtures was not controlled by strain amplitude alone. Instead, it was significantly affected by the combined influence of internal composition and external confinement.
The effect of rock block content on the absolute damping-ratio level was evident, but it was not expressed as a simple monotonic increase or decrease over the entire strain range. Under the same confining pressure, the increase in rock block content changed both the lower bound and the upper bound of damping evolution. Under 100 kPa, changed from 0.055 at to 0.046, 0.042, 0.059, and 0.063 as increased to 10%, 20%, 40%, and 60%, while changed from 0.264 to 0.247, 0.267, 0.235, and 0.223. Under 200 and 400 kPa, the reduction in with increasing rock block content became more evident overall. These results indicate that rock block content did not merely raise or lower the damping ratio in a uniform manner. Instead, it modified the dissipation path by altering the interaction among the soil matrix, rock blocks, and their interfaces. Therefore, the influence of rock block content on damping ratio should be understood as a structure-dependent effect rather than a simple compositional effect.
The influence of confining pressure was also systematic, although its expression was slightly different from that observed for shear modulus. For a fixed rock block content, increasing confining pressure generally caused the lower bound of damping evolution to decrease, and in most block-bearing groups it also reduced the upper bound of damping evolution. For example, for , decreased from 0.046 to 0.039 and 0.036 as confining pressure increased from 100 to 200 and 400 kPa, while decreased from 0.247 to 0.241 and 0.234. For , the corresponding values of were 0.063, 0.043, and 0.038, and those of were 0.223, 0.214, and 0.195. This indicates that higher confining pressure generally suppresses the absolute damping level of the reconstructed soil–rock mixtures, especially when the rock block content is high. At the same time, the damping-ratio data under higher confining pressure tend to be distributed within a narrower band, implying that stronger confinement restrains the freedom of local sliding and structural looseness, and thereby reduces the extent of absolute energy dissipation at the same strain level.
From a mechanical viewpoint, the increase in damping ratio with shear strain reflects the gradual activation of internal energy dissipation mechanisms during cyclic loading. At small strain levels, the deformation of the soil–rock mixture is still relatively coordinated, and the dominant response is recoverable deformation of the soil matrix together with limited local contact adjustment. As strain increases, the contribution of soil–rock interface sliding, particle friction, and internal structural rearrangement becomes increasingly important, which leads to much greater hysteretic dissipation and hence a higher damping ratio. The role of rock block content in this process is to modify the internal heterogeneity and contact complexity of the material, whereas the role of confining pressure is to regulate the stability and compactness of the internal contact system. Therefore, the observed damping-ratio evolution is the combined result of strain growth, structural composition, and stress constraint.
Overall, the reconstructed soil–rock mixtures investigated in this study exhibited a clear and continuous increase in damping ratio within the studied strain range. The damping ratio increased continuously with increasing , with a relatively slow increase at small strain, a much more pronounced increase at intermediate strain, and a continued but moderated increase at large strain. At the same time, both rock block content and confining pressure had clear influences on the absolute damping level and the upper–lower bounds of damping evolution, although these influences were not expressed in a simple one-directional manner across all groups. These results indicate that the energy dissipation behaviour of soil–rock mixtures under cyclic loading is characterized by strong nonlinearity, clear stage dependence, and distinct sensitivity to both material composition and stress condition.
Similar to the modulus response, the damping evolution should also be interpreted within the same multistage loading path. The increase in damping ratio at later stages reflects both the higher imposed strain amplitude and the accumulated structural adjustment developed during preceding stages.
To quantitatively illustrate the evolution characteristics of damping ratio,
Figure 13 presents the variation in
with shear strain amplitude, and
Table 4 summarizes the corresponding minimum and maximum damping ratios under different rock block contents and confining pressures.
4.5. Normalized-Damping-Ratio Evolution
4.5.1. Overall Distribution Characteristics of Normalized Damping Ratio
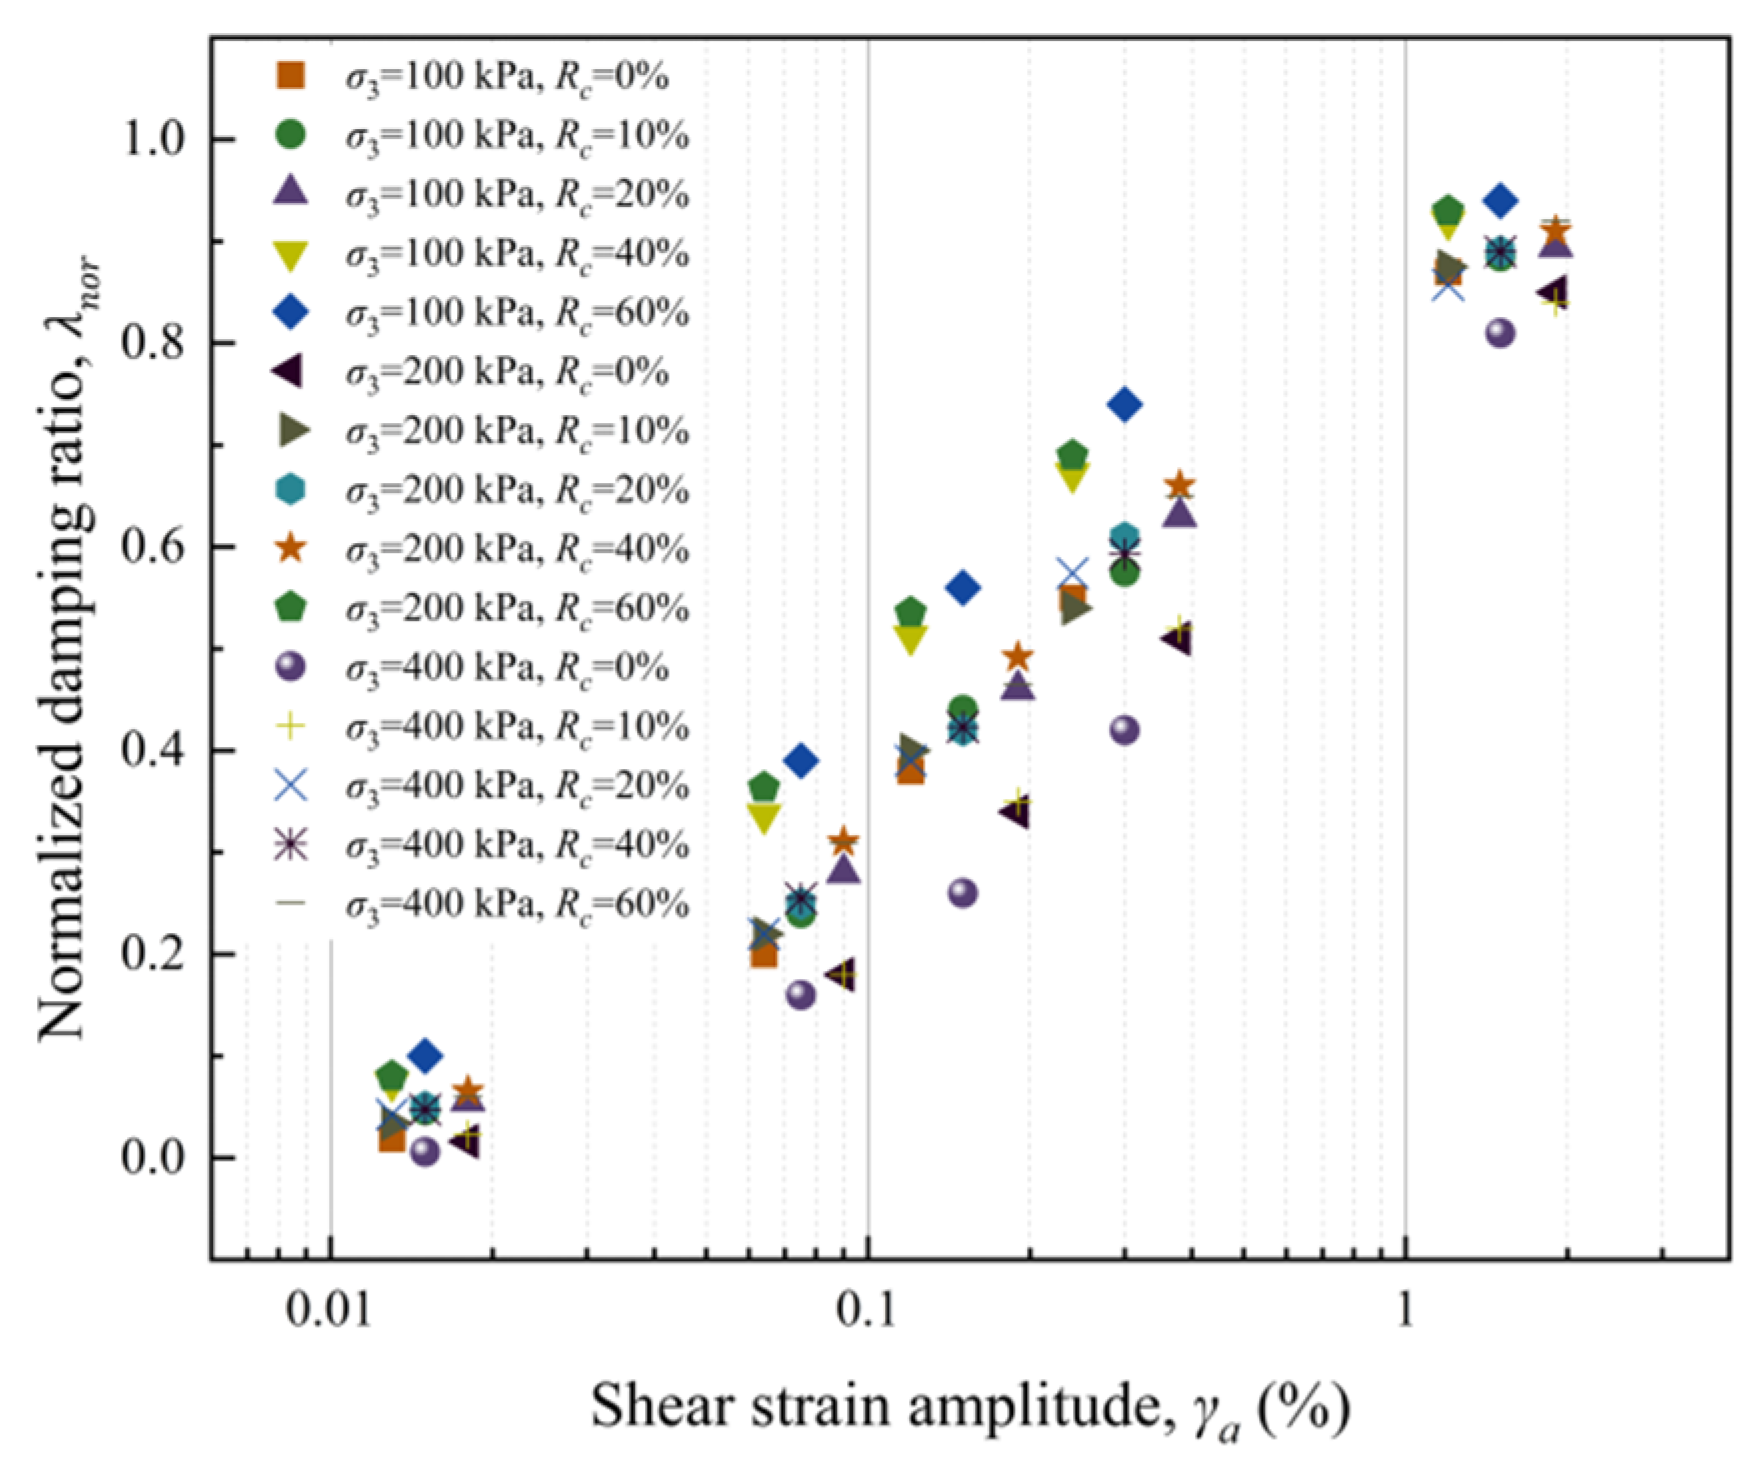
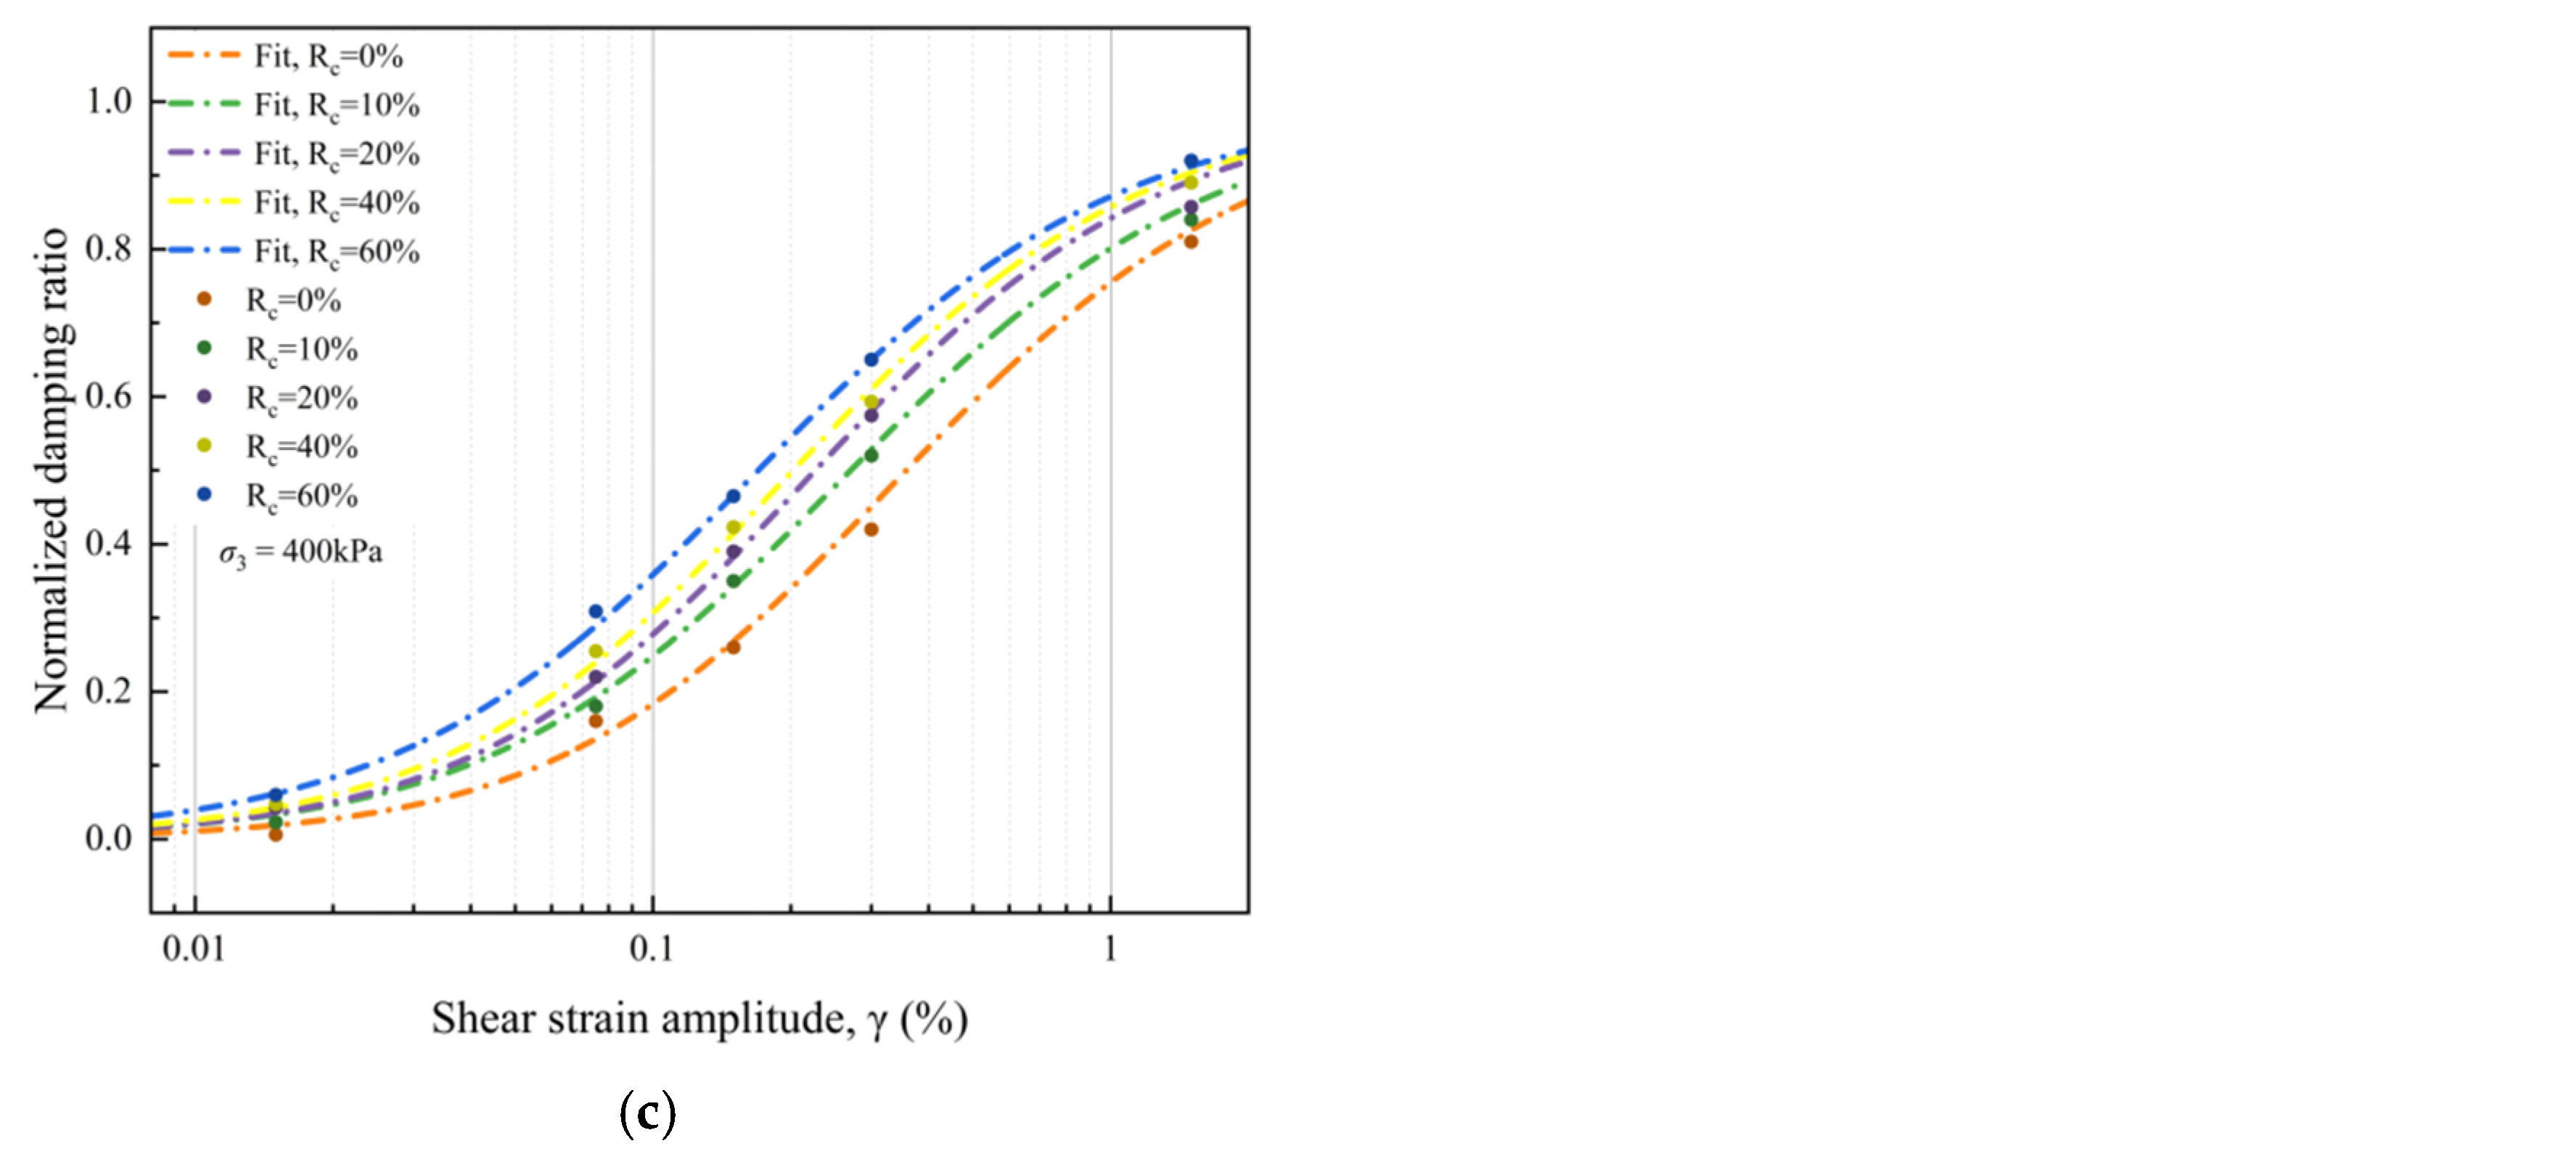
Figure 14 shows the overall distribution of the normalized damping ratio of the reconstructed soil–rock mixtures under different rock block contents and confining pressures. In this section, the normalized damping ratio is used primarily to describe the relative evolution path of cyclic energy dissipation within the damping range of each specimen group, whereas the original damping ratio remains the basic physical measure for evaluating absolute hysteretic energy dissipation. Therefore, the normalized damping ratio is interpreted as a supplementary evolution index, and the discussion of between-group damping differences is considered together with the original damping-ratio results presented in
Section 4.4. In general, all data points show a clear and continuous upward trend with increasing shear strain amplitude, indicating that the normalized damping ratio increases progressively as cyclic deformation develops. This overall pattern suggests that the energy dissipation capacity of the soil–rock mixture is gradually mobilized during the loading process, and that the normalized treatment can effectively highlight the relative evolution pattern of damping behaviour among different specimen groups. Although the absolute damping level varies among test conditions, the normalized damping ratio still exhibits a highly consistent distribution framework, which makes it suitable for comparative analysis of the effects of rock content and confining pressure [
42].
From the global distribution of the data, the normalized damping ratio remains at a relatively low level in the initial strain stage and then increases steadily as the strain amplitude grows from 0.015% to 1.5%. For all specimen groups, the increase is monotonic, and no crossover or abnormal reversal is observed. This indicates that the normalized damping ratio preserves a stable evolutionary order after data transformation. In particular, the values at the smallest strain amplitude are generally concentrated in the lower interval, whereas those at the largest strain amplitude are clustered in the upper interval, demonstrating that the normalized damping ratio can clearly distinguish the progressive enhancement of hysteretic dissipation with strain. In other words, the overall distribution of is characterized by a typical strain-dependent upward migration from the lower-left region to the upper-right region of the plot.
At the same confining pressure, the distribution of the normalized damping ratio shows a clear dependence on rock content. For each strain level, the values generally increase with increasing rock content, and the ordering relationship remains stable as . This trend can be identified under all three confining pressure levels. For example, under , the normalized damping ratio increases from 0.019 to 0.100 at when the rock content rises from 0% to 60%, and it further increases from 0.870 to 0.940 at . A similar distribution law is also observed under and 400 kPa. This indicates that, after normalization, specimens with higher rock content still maintain a stronger relative damping evolution tendency throughout the loading process. The result implies that the introduction of more rock blocks not only changes the absolute damping level, but also modifies the internal evolution path of cyclic energy dissipation. From a structural point of view, increasing rock content enhances block–block and block–matrix interactions, which promote frictional sliding, local rearrangement, and interfacial dissipation under cyclic loading, and this effect is still clearly reflected after normalization.
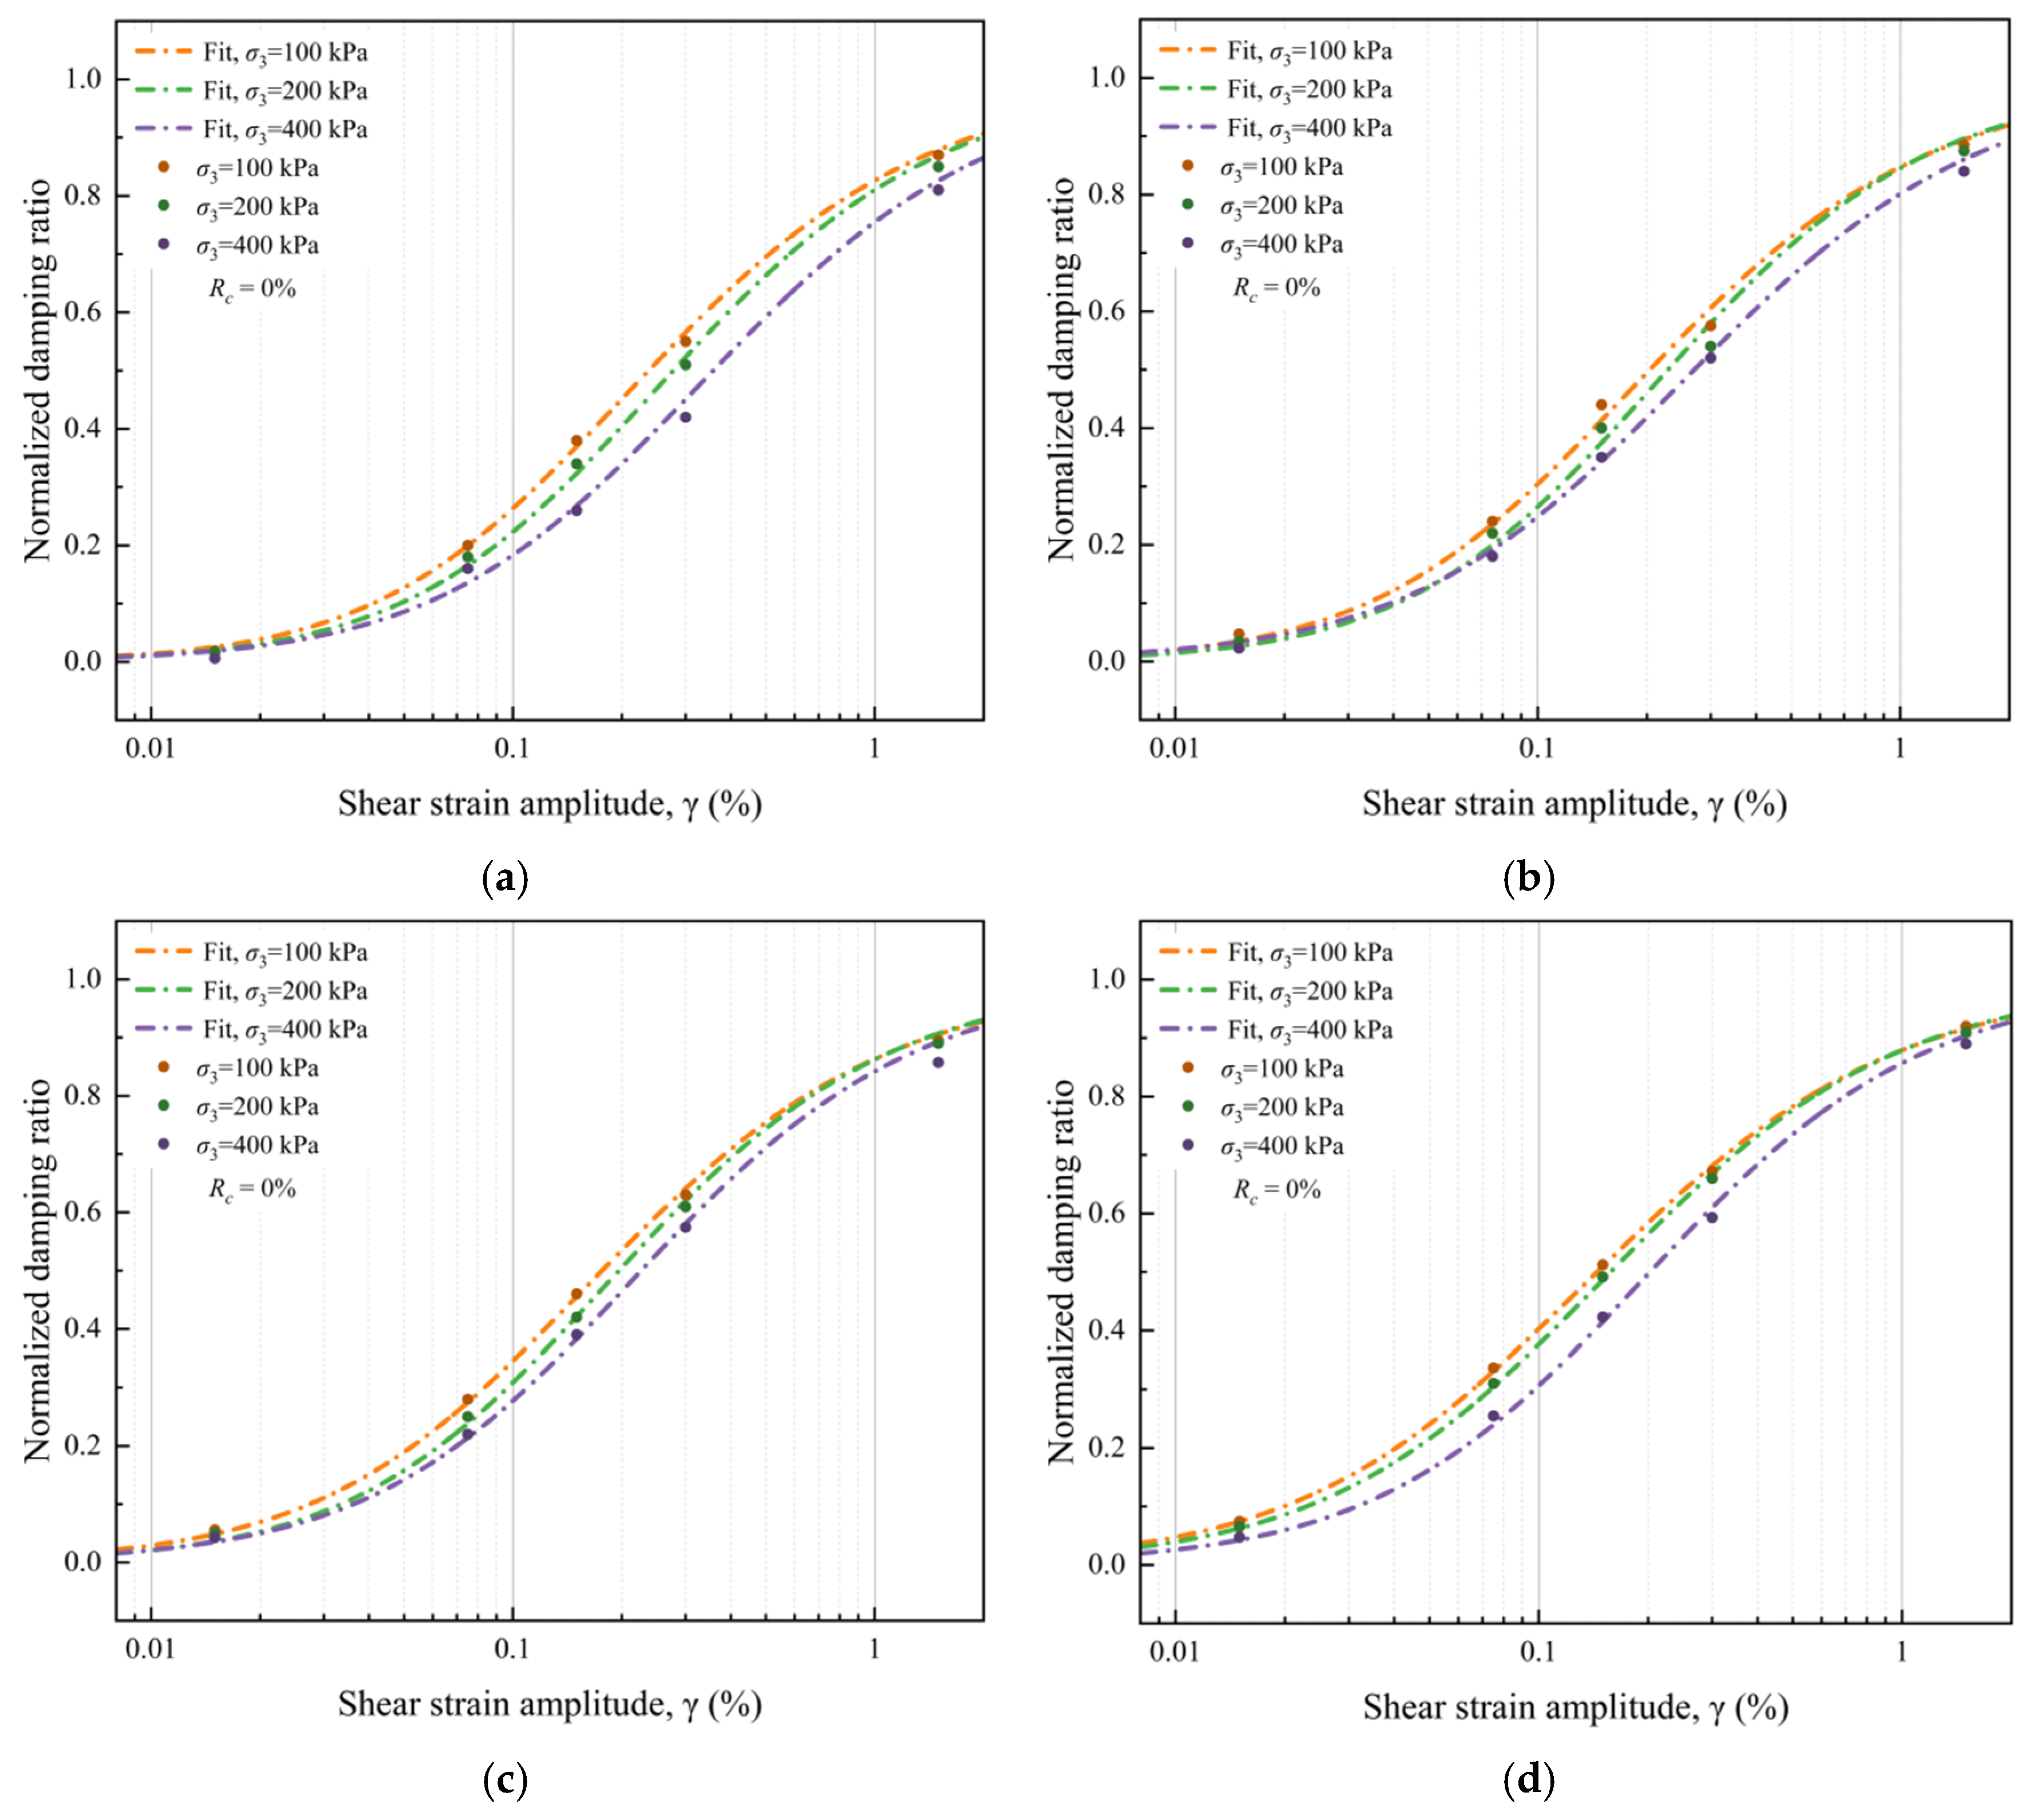
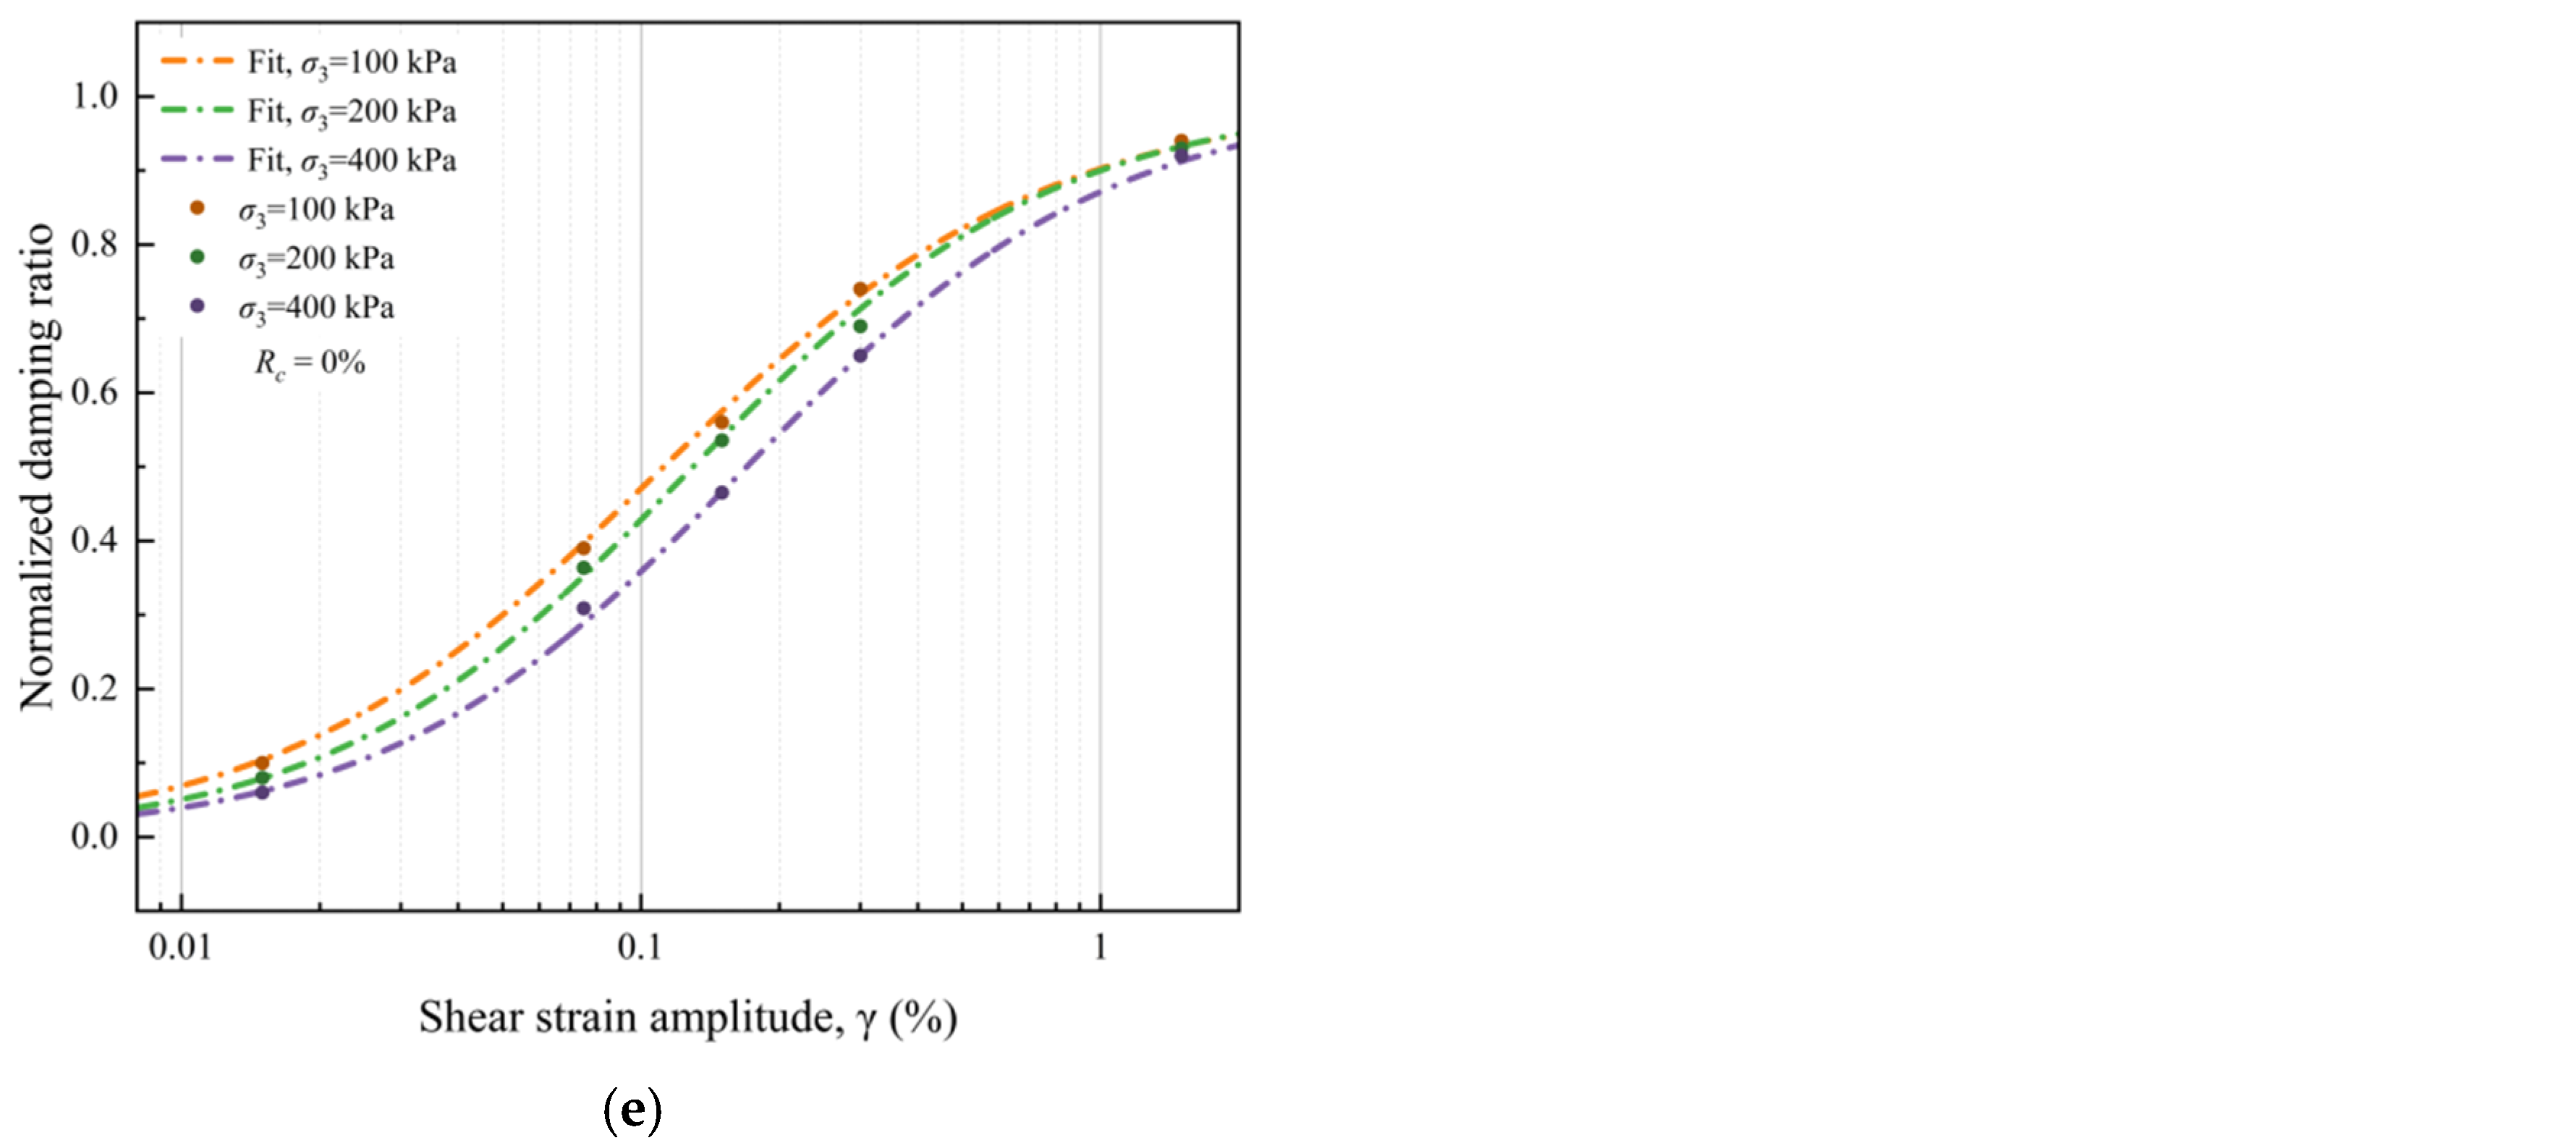
At the same rock content, the normalized damping ratio generally decreases with increasing confining pressure, showing an overall order of . This trend is particularly clear in the low- and medium-strain range. For instance, when , the normalized damping ratio at decreases from 0.380 under 100 kPa to 0.340 under 200 kPa and then to 0.260 under 400 kPa. When , the corresponding values are 0.560, 0.536, and 0.465, respectively. These results indicate that a higher confining pressure suppresses the relative development of damping behaviour to a certain extent. Mechanically, this is because increasing confining pressure strengthens the contact constraint among soil particles and rock blocks, reduces the freedom of local slip and rotation, and delays the rapid release of dissipative deformation. As a consequence, although damping still increases with strain under higher confining pressure, its normalized evolution intensity remains comparatively lower than that under lower confining pressure.
In terms of strain-stage characteristics, the overall distribution of the normalized damping ratio shows an evident nonlinear evolution pattern. In the low-strain range, the increase in is relatively gentle, indicating that the specimen is still mainly controlled by limited interparticle adjustment and small-scale interface friction. As the strain enters the medium range, the growth of the normalized damping ratio becomes more pronounced, suggesting that the internal structure begins to undergo more active rearrangement and that frictional dissipation becomes increasingly significant. In the high-strain range, continues to rise, but the curve growth tends to become more compact for some groups because the normalized parameter gradually approaches its upper interval. Therefore, the overall distribution can be understood as a progressive process from slow activation to rapid development and then to relative stabilization. This staged characteristic is important because it indicates that the normalized damping ratio not only reflects the final dissipation level, but also captures the full-path evolution feature of cyclic energy consumption.
It should also be noted that the separation among the different rock-content groups remains clear throughout the entire strain domain, while the spacing among the different confining-pressure groups is more obvious in the low-to-medium-strain region and becomes slightly compressed in the high-strain region. This means that rock content exerts a stronger control on the relative distribution pattern of normalized damping ratio, whereas confining pressure mainly modifies the rate and extent of its evolution. Therefore, from the perspective of overall distribution, the normalized damping ratio of the reconstructed soil–rock mixtures is governed by three main characteristics: first, a monotonic increase with strain amplitude; second, a positive correlation with rock content; and third, a negative correlation with confining pressure.
Overall, the normalized damping ratio exhibits a well-ordered and physically interpretable distribution law. The parameter successfully preserves the essential trend of damping evolution after normalization and enables direct comparison among different specimen groups. The results show that the cyclic dissipation behaviour of reconstructed soil–rock mixtures is not random after normalization, but still follows a distinct structural rule controlled jointly by strain amplitude, rock content, and confining pressure. This provides a clear basis for the subsequent discussion of the influence of rock content and confining pressure on the normalized damping ratio in more detail.
4.5.2. Effect of Rock Block Content on Normalized Damping Ratio
Using the fitting model presented in
Section 3.5, the effect of rock block content on the normalized damping ratio was evaluated by comparing the fitted
evolution relationships under the same confining pressure. For each confining pressure level, namely 100, 200, and 400 kPa, five rock block contents (
) were considered in order to clarify how the relative energy-dissipation evolution changes with increasing rock inclusion.
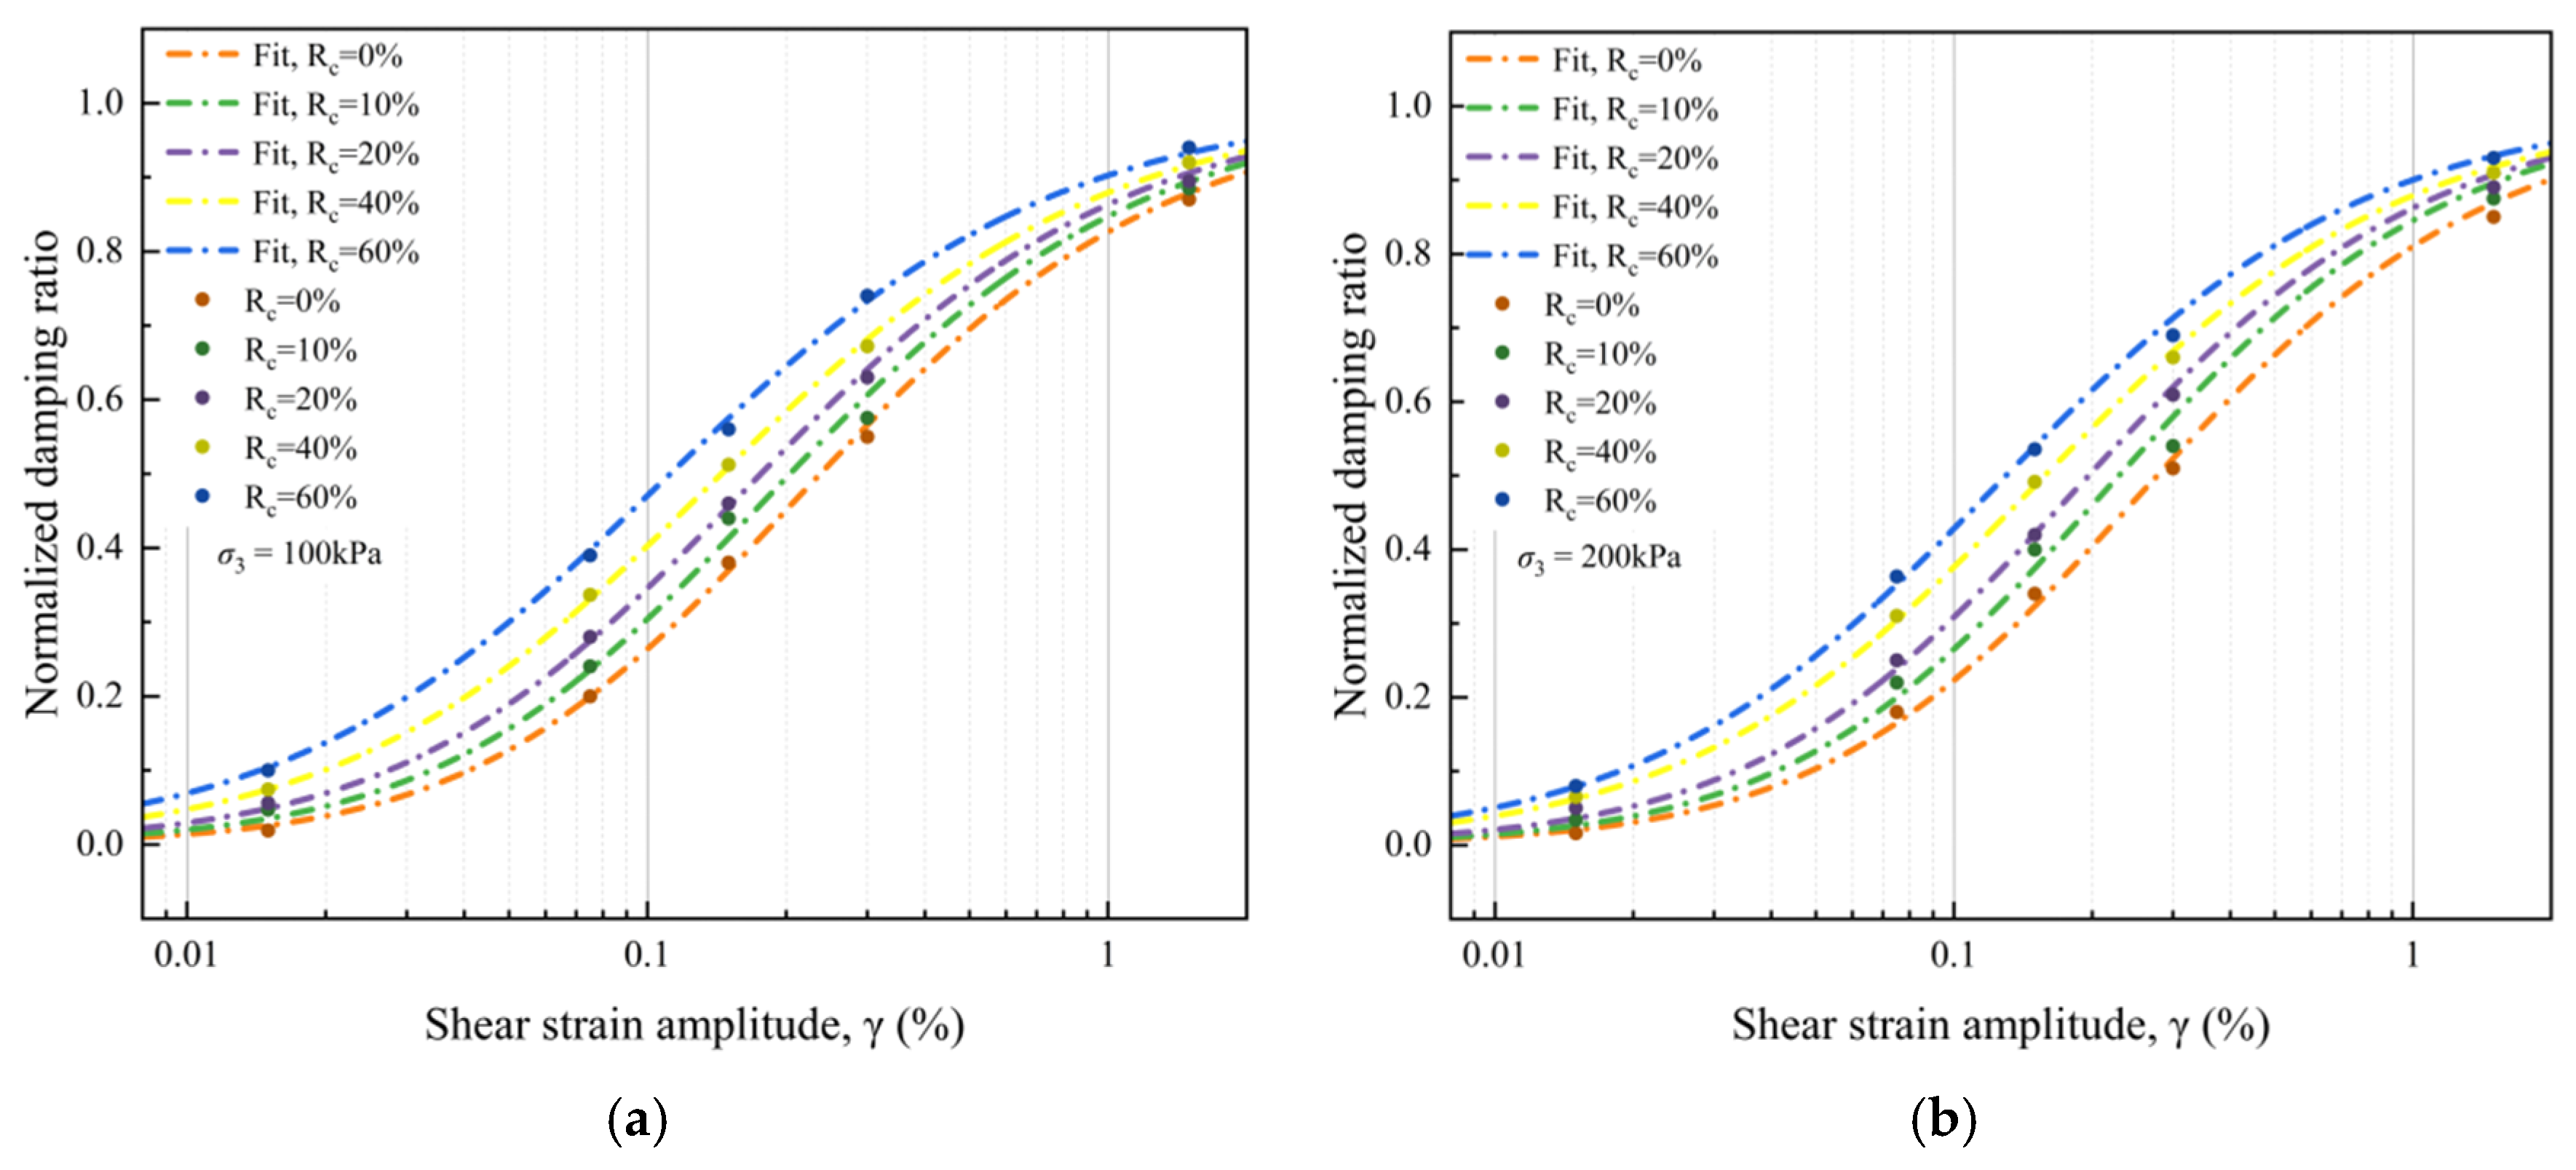
The results show that rock block content has a clear and systematic influence on the normalized-damping-ratio evolution. Under the same confining pressure, the relationship generally shifts upward and toward the lower-strain side as increases. This indicates that, after normalization, the higher-rock-content groups tend to develop a larger proportion of their total damping evolution at the same shear strain amplitude, and they reach the main dissipation-development stage earlier than the lower-rock-content groups. This tendency can be identified under all three confining pressures, and it is especially clear in the low- and medium-strain ranges, where the separation among different rock-content groups is most obvious.
A direct comparison of the normalized data points further confirms this trend. Under 100 kPa, the normalized damping ratio at increases from 0.019 for to 0.100 for , while at it increases from 0.380 to 0.560, and at it increases from 0.870 to 0.940. Under 200 kPa, the corresponding values increase from 0.016 to 0.080 at , from 0.340 to 0.536 at , and from 0.850 to 0.930 at . Under 400 kPa, the same monotonic trend is also maintained, with increasing from 0.006 to 0.060 at , from 0.260 to 0.465 at , and from 0.810 to 0.920 at as increases from 0% to 60%. These results demonstrate that increasing rock block content consistently accelerates the relative development of normalized damping behaviour over the entire strain domain.
The variation in the characteristic shear strain provides more direct quantitative evidence for this effect. Under 100 kPa, decreases continuously from 0.128 to 0.120, 0.116, 0.109, and 0.092 as increases from 0% to 60%. Under 200 kPa, the corresponding values decrease from 0.178 to 0.155, 0.137, 0.127, and 0.109. Under 400 kPa, further decreases from 0.242 to 0.205, 0.179, 0.167, and 0.150. From to , the total reduction in is about 27.8%, 38.6%, and 38.0% under 100, 200, and 400 kPa, respectively. This means that the characteristic position of the normalized-damping-ratio evolution shifts systematically toward the lower-strain side with increasing rock block content. In other words, the higher-rock-content groups require a smaller shear strain amplitude to reach the same characteristic development level of normalized damping evolution.
Compared with the clear reduction in , the fitted parameter varies only within a relatively narrow interval. At 100 kPa, ranges from 0.996 to 1.015. At 200 kPa, it ranges from 1.047 to 1.097. At 400 kPa, it ranges from 1.026 to 1.094. This indicates that the basic nonlinear form of the normalized-damping-ratio evolution remains generally stable for different rock block contents. Therefore, the primary effect of is not to fundamentally change the overall shape of the growth relationship, but to shift its characteristic-strain position and alter the rate at which damping evolution develops.
The parameter , however, shows a clearer systematic variation with rock block content. Under 100 kPa, decreases from 1.613 for to 1.151 for . Under 200 kPa, it decreases from 1.433 to 1.144. Under 400 kPa, it decreases from 1.354 to 1.100. The total reductions are approximately 28.7%, 20.1%, and 18.8%, respectively. Because and were fixed from the normalized modulus fitting, this decrease in indicates that, after the modulus-derived characteristic-strain position and curve shape are accounted for, the higher-rock-content groups still show an earlier and more active relative damping-development tendency. Thus, reflects the damping-specific residual adjustment within the shared stiffness–damping evolution framework, rather than an independently fitted damping parameter.
The fitting accuracy further confirms the reliability of this interpretation. For all 15 test groups, the coefficient of determination ranges from 0.9892 to 0.9996, the RMSE ranges from 0.0058 to 0.0292, the MAE ranges from 0.0049 to 0.0265, and the MAPE ranges from 0.92% to 9.91%. These fitting results indicate that the adopted model provides a good representation of the present normalized-damping-ratio data. More importantly, the systematic decrease in and with increasing is observed together with consistently high fitting quality, which means that the identified rock block effect is not caused by accidental scatter in a few data points, but reflects a stable feature of the normalized dissipation evolution of the reconstructed soil–rock mixtures.
It should be noted that this result is not exactly the same as the trend observed for the unnormalized damping ratio in
Section 4.4. In the absolute-damping-ratio analysis, the effect of rock block content is partly influenced by the initial damping level and the upper damping bound of each specimen group, and its variation is therefore not always strictly monotonic. After normalization, the focus shifts from the absolute damping level to the relative mobilization process within each specimen group. Therefore, the normalized damping ratio should be interpreted together with the original damping-ratio results, rather than as a substitute for absolute damping comparison. Under this unified framework, the higher-rock-content groups exhibit a more consistent and earlier development of damping evolution. Therefore, the normalized damping ratio reveals more directly the structural effect of rock block content on the relative mobilization of cyclic energy dissipation.
From a mechanical viewpoint, this behaviour can be attributed to the increasing structural complexity caused by the addition of rock blocks. As increases, the internal material system becomes more heterogeneous, and the cyclic response is increasingly governed by block–block contact, block–matrix interaction, interfacial sliding, and local rearrangement. Under cyclic loading, these mechanisms can be activated at relatively smaller strain levels in the block-rich groups, causing the normalized damping ratio to increase more rapidly in the early and intermediate stages. In this sense, increasing rock block content does not simply increase the dissipation level in an absolute sense; more importantly, it advances the onset and development of the relative dissipation process within the loading path.
Overall, increasing rock block content does not fundamentally alter the basic nonlinear form of the normalized-damping-ratio evolution relationship, but it significantly affects its characteristic-strain position, growth rate, and relative development path. With increasing
, the
relationship shifts toward higher normalized-damping-ratio values and lower characteristic-strain levels, indicating that the relative dissipation evolution of the reconstructed soil–rock mixtures is promoted by the presence of more rock blocks. These results demonstrate that rock block content is one of the key factors controlling the normalized-damping-ratio evolution of soil–rock mixtures under cyclic loading. To further illustrate the effect of rock block content on the normalized damping ratio, the fitted
relationships under different rock block contents are presented in
Figure 15, and the corresponding fitting parameters and error indices are summarized in
Table 5.
4.5.3. Effect of Confining Pressure on Normalized Damping Ratio
The effect of confining pressure on the normalized damping ratio was evaluated by comparing the fitted
relationships under the same rock block content. In contrast to
Section 4.5.2, which focuses on the acceleration of damping development caused by increasing rock block content, this section highlights the delay effect produced by stronger confinement.
For all rock-content groups, increasing confining pressure shifts the relationship downward and toward a higher strain range. This indicates that, after normalization, specimens under higher confinement develop a smaller proportion of their damping evolution at the same shear strain amplitude, especially in the low- and intermediate-strain ranges.
This tendency is reflected by the systematic increase in . For the group, increases from 0.128 at 100 kPa to 0.178 at 200 kPa and 0.242 at 400 kPa. Similar increases are observed for the other rock-content groups. From 100 to 400 kPa, the increase in reaches about 89.1%, 70.4%, 55.0%, 53.9%, and 62.4% for , 10%, 20%, 40%, and 60%, respectively. These results indicate that stronger confinement delays the relative development of normalized-damping evolution.
The parameters
and
should be interpreted within the constrained fitting framework described in
Section 3.5. The relatively stable range of
suggests that the basic curve form remains comparable among different confining pressures, while the variation in
reflects the remaining damping-growth adjustment after
and
have been inherited from the modulus-reduction fitting. Therefore, the main effect of confinement is expressed through the increase in
, whereas
provides supplementary information on the curve-growth shape.
Mechanically, stronger confinement stabilizes soil–rock contacts, restricts local sliding and rotation, and postpones the mobilization of relative dissipative deformation. Therefore, the normalized damping evolution under higher confinement develops more slowly, even though the material still exhibits increasing damping with strain.
Figure 16 presents the fitted
relationships under different confining pressures, and
Table 6 summarizes the corresponding fitting parameters and error indices.
4.6. Parameter-Based Interpretation of Cyclic Evolution in Reconstructed Soil–Rock Mixtures
4.6.1. Integrated Interpretation of Stiffness Degradation and Damping Development
The cyclic dynamic response of reconstructed soil–rock mixtures reflects the combined contribution of soil matrix deformation, rock block interaction, contact rearrangement, and soil–rock interfacial sliding. In the preceding sections, these processes were expressed through several mutually related parameters, including hysteresis-loop morphology, secant shear modulus, normalized shear modulus ratio, damping ratio, normalized damping ratio, and fitting parameters. Taken together, these results indicate that stiffness degradation and damping development are two coupled manifestations of the strain-dependent evolution of the internal block-in-matrix structure.
For clarity, the three interpretive concepts used in this section are defined as follows. The “strain-dependent staged response” refers to the progressive change from small-strain coordinated deformation to intermediate-strain structural adjustment and large-strain dissipation-dominated response. The “characteristic-strain migration” refers to the systematic shift in the reference shear strain with rock block content and confining pressure. The “confinement-related block–matrix coupling” refers to the stress-dependent mobilization of contact interaction between the soil matrix and rock blocks under cyclic loading. These concepts are not introduced as independent constitutive laws, but as interpretive descriptions supported by the measured hysteresis loops, modulus degradation curves, damping-ratio evolution, normalized parameter trends, and fitted characteristic strains.
At small strain levels, the cyclic response is mainly reflected by narrow hysteresis loops, relatively high secant stiffness, and low damping ratio, suggesting that deformation is still largely coordinated by the soil matrix and limited local contact adjustment. As strain amplitude increases, loop expansion, accelerated modulus reduction, and increased damping indicate more active block–matrix interaction, interfacial sliding, and frictional dissipation. At larger strain levels, the reduced stiffness and enlarged hysteretic area show that irreversible structural rearrangement and energy dissipation become more pronounced. This staged response provides a consistent explanation for the observed transition from stiffness-dominated behaviour to dissipation-enhanced cyclic behaviour.
The combined analysis of modulus and damping also helps explain why the two parameters should not be interpreted separately. The reduction in shear modulus represents the gradual loss of effective stiffness and load-transfer efficiency, whereas the increase in damping ratio reflects the growing contribution of frictional dissipation and irreversible adjustment. Therefore, hysteresis-loop expansion, modulus degradation, normalized stiffness reduction, damping-ratio growth, and normalized-damping development can be interpreted as interconnected indicators of the same strain-dependent cyclic response.
The above interpretation also indicates that the influence of rock blocks is conditional on both strain level and confining pressure. Under relatively low confinement, the block phase mainly behaves as dispersed inclusions embedded in the soil matrix, and its contribution to the overall cyclic response remains limited. Under stronger confinement, the contact state among rock blocks and between rock blocks and the soil matrix becomes more effectively mobilized, leading to higher stiffness, clearer differences among rock-content groups, and more distinct damping evolution. Therefore, the role of rock block content should be interpreted together with the stress condition rather than as an independent compositional factor.
This parameter-based interpretation also explains the coexistence of two response features observed in the present results. Higher rock block content and stronger confinement generally increase the absolute stiffness level of the material. However, higher rock block content tends to advance the normalized evolution of stiffness degradation and damping development, whereas stronger confinement delays these normalized responses. This means that the cyclic behaviour of reconstructed SRMs should be evaluated based on both the absolute response level and the relative evolution path. In this sense, hysteresis-loop evolution, modulus degradation, normalized stiffness reduction, damping growth, and fitting-parameter variation provide complementary evidence for understanding the strain-dependent cyclic response of the tested block-in-matrix material.
4.6.2. Strain-Dependent Staged Response
The test results show that the cyclic response of reconstructed soil–rock mixtures can be interpreted as a strain-dependent staged response. This staged interpretation is based on the observed widening of hysteresis loops in
Figure 8, the continuous reduction in secant shear modulus in
Figure 9 and
Table 1, and the increase in damping ratio shown in
Figure 13 and
Table 4. The stages described below are used as descriptive response regimes inferred from hysteresis morphology, modulus degradation, and damping evolution, rather than as fixed transition boundaries. Similar strain-dependent degradation and dissipation trends have been reported for SRMs under cyclic loading, whereas the present results further organize this behaviour through the coupled evolution of hysteresis morphology, shear modulus degradation, and damping development.
At the first stage, namely the small-strain coordination stage, the material response is dominated mainly by coordinated deformation of the soil matrix and relatively limited interface adjustment. In this stage, the hysteresis loops remain narrow and steep, the enclosed loop area is small, the secant shear modulus is still maintained at a comparatively high level, and the damping ratio remains low. Mechanically, most soil–rock interfaces are still in a constrained state, and the internal force-transfer network has not yet undergone substantial disturbance. The block phase mainly provides geometric constraint and local stiffening, while the matrix still plays the primary role in deformation accommodation. As a result, the material behaves as a relatively stable composite system with strong stiffness retention and weak hysteretic dissipation. The essential feature of this stage is that cyclic loading mainly induces recoverable deformation, whereas interface friction, local sliding, and irreversible rearrangement are still limited.
As the strain amplitude increases, the material enters the second stage, termed here the intermediate-strain structural-adjustment stage. This stage represents the principal transition zone of the cyclic response and corresponds to the most active evolution of internal interfaces. In this regime, the hysteresis loops expand more rapidly, the distance between loading and unloading branches becomes more obvious, the reduction in secant shear modulus accelerates, and the damping ratio rises more significantly. These changes indicate that the deformation mechanism is no longer controlled predominantly by matrix coordination alone. Instead, soil–rock interfaces begin to participate more actively through local sliding, contact readjustment, frictional dissipation, and redistribution of internal stresses. At the macroscopic scale, this stage is characterized by the most sensitive transition of dynamic properties. In particular, the normalized shear modulus ratio decreases more rapidly and the normalized damping ratio develops more obviously, showing that the material is moving from a relatively stable load-transfer state toward a more pronounced nonlinear evolution state. Therefore, this stage can be regarded as the critical interval in which block–matrix interaction, contact readjustment, and frictional dissipation become more evident in the macroscopic cyclic response.
With further increase in strain amplitude, the reconstructed soil–rock mixtures gradually enter the third stage, referred to here as the large-strain structure-rearrangement and dissipation-dominated stage. In this stage, the hysteresis loops become much fuller and more open, the secant shear modulus is reduced to a relatively low level, and the damping ratio reaches a high range. The internal interface system no longer serves only as a local-adjustment mechanism; instead, it becomes the main medium through which irreversible structural rearrangement, energy dissipation, and residual resistance development are expressed. The matrix continuity is weakened, local block–matrix coordination becomes more unstable, and block-related contact interaction and rearrangement play a more important role in governing the overall response. Although the growth rate of some normalized parameters may gradually weaken compared with the transition stage, this does not imply recovery of structural stability. Rather, it indicates that the material has already entered a high-dissipation regime in which a large proportion of the initial stiffness reserve has been consumed. The dominant feature of this stage is therefore not further initiation of nonlinearity, but the continued manifestation of a strongly evolved nonlinear state.
An important implication of this staged response pattern is that the cyclic behaviour of reconstructed SRMs should not be described only by a single monotonic trend, even though the overall variations in modulus and damping are continuous. The present results show that the continuous curves contain a clear transition sequence: matrix-dominated coordination at small strain, structural adjustment at intermediate strain, and dissipation-dominated response at large strain. This interpretation links the observed hysteresis morphology, stiffness degradation, and damping development to the progressive change in the internal block-in-matrix response.
This staged response pattern also explains why different specimen groups, despite having different rock block contents and confining pressures, still exhibit broadly similar normalized evolution forms. The detailed response position and evolution rate vary among groups, but the fundamental strain-dependent path remains similar: increasing strain first weakens recoverable deformation, then enhances contact readjustment and frictional dissipation, and finally drives the material into a strongly evolved high-dissipation state. Therefore, the staged interpretation is used here as an integrated reading of the measured dynamic parameters rather than as a rigid transition law.
4.6.3. Characteristic-Strain Migration and Dual-Path Response
The fitted normalized modulus and damping relationships indicate that the cyclic response of reconstructed SRMs can be interpreted through characteristic-strain migration and a dual-path response pattern. This interpretation is supported by the fitted
values summarized in
Table 2,
Table 3,
Table 5 and
Table 6, where
decreases with increasing rock block content but increases with increasing confining pressure. The reference shear strain
, derived from the normalized modulus relationship, provides a useful index for describing the strain position of relative stiffness degradation. In the present study, its systematic variation with rock block content and confining pressure further indicates that the transition position of relative dynamic response is not fixed, but depends on material composition and stress condition.
From this viewpoint, the cyclic response of reconstructed soil–rock mixtures is controlled by two interrelated but non-identical response paths. The first path is the absolute enhancement path, which describes the increase in the absolute stiffness level of the material. Along this path, increasing rock block content and increasing confining pressure both generally lead to higher shear modulus and higher extrapolated initial shear modulus, especially at small and intermediate strain levels. This indicates that both factors strengthen the internal load-bearing structure, improve the effectiveness of the block-in-matrix skeleton, and enhance the initial resistance of the material against cyclic deformation. In other words, this path characterizes how strong the material is in an absolute mechanical sense.
The second path is the relative evolution path, which describes the onset and progression of normalized degradation and normalized dissipation relative to the initial state of each specimen group. Along this path, the controlling factors no longer act in the same direction. Increasing rock block content shifts the normalized-shear–modulus-reduction relationship and the normalized-damping–growth relationship toward the lower-strain side, whereas increasing confining pressure shifts them toward the higher-strain side. This means that a block-rich mixture may possess a higher absolute stiffness level, but still enter the stage of relative stiffness loss and relative dissipation development at a smaller characteristic strain. By contrast, a specimen under stronger confinement not only starts from a higher stiffness level, but also requires a larger strain to reach the same relative degree of degradation or dissipation. Therefore, the cyclic dynamic response of reconstructed soil–rock mixtures cannot be adequately interpreted by a single monotonic criterion such as “higher stiffness implies slower evolution.” Instead, the material exhibits a dual-path response in which absolute resistance and relative evolution are coupled but directionally distinguishable.
The most direct evidence for this response pattern is provided by the systematic migration of the characteristic strain . Under a given confining pressure, decreases continuously with increasing rock block content. For example, under 100 kPa, decreases from 0.128 at to 0.092 at ; under 200 kPa, it decreases from 0.178 to 0.109; and under 400 kPa, it decreases from 0.242 to 0.150. This shows that increasing rock block content systematically shifts the characteristic response position toward a lower strain range. In physical terms, although the block-rich mixtures are stiffer in the absolute sense, their normalized response begins to evolve earlier once strain is measured relative to their own higher initial stiffness basis. Conversely, for a given rock block content, increases continuously with confining pressure. For example, for , increases from 0.128 at 100 kPa to 0.178 at 200 kPa and 0.242 at 400 kPa, and similar increases are observed for all other rock-content groups. This demonstrates that stronger confinement systematically pushes the characteristic response position toward a higher strain range and delays the relative evolution process.
The migration of characteristic strain has an important interpretive implication. It indicates that the material does not possess a fixed intrinsic threshold of nonlinear evolution independent of internal structure or stress condition. Instead, the position of the dynamic transition zone is itself movable and structurally conditional. Higher rock block content increases the density of interfaces, block–block contacts, and block–matrix interaction zones. As a result, once cyclic deformation reaches a sufficient level, structural readjustment and hysteretic activation can be mobilized at a relatively smaller normalized strain position. In contrast, higher confining pressure stabilizes contacts, strengthens constraint on local sliding and rotation, and makes it more difficult for the material to reach the same relative degree of structural transformation. Therefore, should be interpreted as a migration index of structural transition rather than as a purely mathematical parameter.
More importantly, the dual-path response pattern provides a unified explanation for the coexistence of two observations that may otherwise appear contradictory. On the one hand, higher rock block content generally increases the absolute stiffness level of reconstructed soil–rock mixtures. On the other hand, the same increase in rock block content also causes the normalized modulus-reduction relationship to move downward and the normalized damping-development relationship to start earlier. Thus, the material becomes stronger in the absolute sense but more responsive in the relative evolution sense. This does not imply instability of the block-rich structure. Rather, it indicates that the internal interface network, while enhancing stiffness, also creates a more active structural channel for relative degradation and dissipation once the evolution process is measured against its own initial state. In the same way, stronger confinement not only increases the absolute stiffness level, but also delays the normalized evolution of both stiffness degradation and damping. Therefore, confinement acts simultaneously as a strengthening factor and as a postponing factor of relative response evolution.
In this sense, this interpretation suggests that the cyclic dynamic behaviour of reconstructed soil–rock mixtures should be described in terms of both response level and response position. The former answers how strong or how dissipative the material is in absolute terms, whereas the latter answers when the material begins to enter a pronounced relative evolution state. The characteristic-strain migration captures the latter, and the dual-path interpretation links it to the former. As a result, the present study does not simply conclude that rock block content and confining pressure “affect” the dynamic response. Instead, the results indicate that these two factors influence the cyclic response through two distinct but coupled channels: an absolute mechanical-strengthening channel and a relative evolution-position channel.
Therefore, characteristic-strain migration and the dual-path response pattern provide an integrated interpretation of the normalized dynamic-parameter behaviour of reconstructed SRMs. It explains why specimen groups with higher absolute stiffness do not necessarily evolve more slowly in normalized terms, and why the transition of cyclic behaviour should be judged not only by the magnitude of dynamic parameters but also by the strain position at which their relative evolution accelerates. This response pattern links the empirical fitting results with the interpretation of strain-dependent cyclic evolution and provides the basis for understanding how confinement regulates the role of the block phase under cyclic loading.
4.6.4. Confinement-Related Block–Matrix Coupling
The influence of rock block content becomes more evident under higher confining pressure, indicating that the structural role of rock blocks is stress-dependent rather than purely compositional. Previous SRM cyclic studies have shown that rock content and confinement jointly affect stiffness, damping, and dynamic response. In the present results, this stress-dependent block effect is reflected by higher absolute stiffness, delayed normalized degradation under stronger confinement, and more distinct differences among rock-content groups at higher confining pressure.
The direct experimental observations are the higher absolute stiffness, delayed normalized degradation, reduced normalized-damping development, and clearer separation among rock-content groups under higher confinement. The block–matrix coupling described here is therefore an interpretation of these measured trends, rather than a directly observed microscale process.
Under relatively low confinement, the block phase mainly exists as a geometrically identifiable but mechanically weakly mobilized component. Although rock blocks are physically present in the mixture, the surrounding matrix still dominates deformation coordination and load redistribution, and the difference among specimens with different rock block contents remains comparatively limited. In this state, block–block contact is insufficiently activated, block–matrix interfaces are not yet fully stabilized, and the internal structure behaves more like a matrix-dominated heterogeneous medium than a true stress-transferring skeleton. Therefore, the rock phase under weak confinement should not be interpreted as a fully developed skeleton, but rather as a set of dispersed inclusions embedded in a deformable matrix. This explains why, under low confining pressure, the cyclic response remains relatively similar among different rock-content groups even though their material compositions are different.
As confining pressure increases, however, the mechanical role of the interface system changes fundamentally. Stronger confinement compresses the soil matrix more effectively, tightens particle contacts, improves the stability of block–matrix interfaces, and enhances the continuity of the internal force-transfer network. Under such conditions, rock blocks no longer participate passively in the response. Instead, they become increasingly integrated into a constrained structural framework through enhanced block–block interaction, stronger block–matrix cooperation, and more stable interfacial load transfer. The internal skeleton is therefore activated not only in the sense of stiffness contribution, but also in the sense of response organization: it begins to govern how stresses are transmitted, how deformation is partitioned, and how hysteretic dissipation is distributed within the mixture. This is why the hysteresis loops under higher confinement become steeper, fuller, and more stress-expanded, and why the differences among rock-content groups become much more evident as confinement rises.
The key point here is that interface activation and skeleton formation are not two separate mechanisms, but two coupled aspects of the same confinement-controlled structural evolution. Interfaces provide the local mechanical channels through which sliding, friction, stress transfer, and contact readjustment occur, whereas the skeleton represents the higher-level structural organization that emerges when those local channels become sufficiently constrained and interconnected. Without sufficient confinement, interface activity remains largely local and fragmented, and the block phase cannot develop into an effective skeleton. With increasing confinement, however, the same interface network becomes more stable and more coordinated, allowing local contact interactions to scale up into a macroscopic load-bearing framework. Therefore, the skeleton effect in reconstructed soil–rock mixtures should be interpreted as an emergent phenomenon of interface stabilization under confinement rather than as a simple direct consequence of adding more rock blocks.
This interpretation also explains why the combined influence of rock block content and confining pressure is clearly non-additive. If the block phase acted independently of confinement, the effect of increasing rock content would remain proportionally similar under all stress conditions. The present results do not support such a view. Instead, they show that the influence of rock block content is relatively weak at low confinement but becomes increasingly significant as confinement rises. This means that rock content alone determines only the potential complexity and density of the structural network, whereas confining pressure determines whether that potential can actually be mobilized into a mechanically effective skeleton. In other words, rock block content provides the structural resource, but confining pressure governs the degree of structural realization. The observed response is therefore the product of their coupling rather than the sum of their separate contributions.
From the viewpoint of cyclic evolution, the confinement-related block–matrix coupling interpretation also helps explain why stronger confinement simultaneously leads to higher absolute stiffness, delayed normalized degradation, and postponed normalized dissipation development. Once the interface network is stabilized and the skeleton is more effectively mobilized, the material can maintain a higher proportion of its internal load-bearing capacity over a wider strain range. At the same time, the initiation of relative structural transformation is postponed because local sliding, rotation, and contact disruption are more strongly restrained. Therefore, confinement does not merely strengthen the material in a static sense; it reorganizes the dynamic response by coupling interface stabilization with skeleton efficiency. This interpretation extends the conventional statement that “higher confining pressure increases stiffness” by further emphasizing how confinement regulates internal structural participation during cyclic loading. It suggests that confinement changes not only how much resistance the material possesses, but also how the internal structure participates in cyclic evolution.
Accordingly, the cyclic dynamic behaviour of reconstructed SRMs can be interpreted as the outcome of stress-dependent block–matrix coupling. At lower confinement, the rock blocks mainly act as dispersed inclusions and their contribution to load transfer is limited. As confinement increases, the contact condition between blocks and matrix becomes more stable, allowing the block phase to contribute more effectively to stiffness retention and cyclic resistance. This interpretation links the observed macroscopic response, including higher absolute stiffness, delayed normalized degradation, and reduced damping development under stronger confinement, to the stress-dependent participation of the block-in-matrix structure. It also completes the parameter-based interpretation developed in this section, in which strain amplitude controls the degree of nonlinear evolution, characteristic strain marks the relative response position, and confinement regulates the effectiveness of block–matrix interaction.
The above interpretation is intended as a parameter-based synthesis of the measured cyclic response. It summarizes the observed relationships between strain amplitude, rock block content, confining pressure, stiffness degradation, damping development, and characteristic-strain migration under the present testing conditions. It does not define a constitutive model, a universal transition criterion, or fixed quantitative boundaries for all SRMs. Instead, it provides an experimentally grounded interpretation of the response patterns observed in the reconstructed specimens tested in this study.
Therefore, the three concepts above should be understood as a parameter-based synthesis of the measured macroscopic cyclic response. They are used to organize the experimental evidence from hysteresis behaviour, modulus degradation, damping evolution, normalized parameter trends, and characteristic-strain migration.
4.7. Engineering Implications for Dynamic-Parameter Selection and Interface Stability Assessment
The experimental results presented above provide several practical implications for the treatment, construction control, and interface-related stability assessment of coastal nuclear power plants and other high-value, safety-sensitive infrastructures founded on soil–rock mixture ground. Although the present study was carried out at the material scale, the observed strain-dependent stiffness degradation and damping evolution reveal important features of how this heterogeneous geomaterial may behave when subjected to repeated environmental or operational disturbances. In particular, the results indicate that the dynamic response of soil–rock mixtures is controlled jointly by shear strain amplitude, rock block content, and confining pressure, and that these factors directly influence stiffness retention, energy dissipation, and the progressive activation of internal interfacial processes.
Within the tested material and stress range, several quantitative reference values can be extracted for engineering interpretation. The extrapolated initial shear modulus ranged from 39.164 to 171.382 MPa, while the reference shear strain ranged from 0.092 to 0.242. The measured secant shear modulus decreased from 35.835 to 158.871 MPa at the smallest strain level to 3.296–12.854 MPa at the largest strain level, corresponding to an overall stiffness reduction of approximately 85%–94%. The damping ratio increased from a lower-bound range of 0.036–0.063 to an upper-bound range of 0.195–0.268. These ranges are not proposed as direct design values, but they provide experimentally derived reference intervals for selecting stiffness-retention parameters, damping parameters, and characteristic-strain levels when reconstructed SRM foundations with similar material composition, particle-size range, and confining-pressure conditions are considered.
First, the strong effect of confining pressure on both shear modulus and normalized dynamic response suggests that sufficient confinement and densification should be regarded as primary objectives in foundation treatment and construction control. In the present study, increasing confining pressure consistently raised the absolute stiffness level and delayed the relative degradation of normalized shear modulus and normalized damping evolution. From an engineering perspective, this means that loose or weakly confined zones within soil–rock mixture foundations are more likely to experience premature stiffness loss and earlier activation of dissipative deformation under cyclic loading. For coastal nuclear power plants, where long-term stability and deformation control are critical, this finding implies that special attention should be given to improving compaction quality, reducing local looseness, and enhancing the continuity of stress transfer within the treated foundation. In practical terms, ground improvement measures that increase confinement, compactness, and contact stability may be more effective than approaches that rely only on static bearing-capacity enhancement. This implication is consistent with recent studies on lateritic geomaterials and sustainable construction materials, which have shown that chemical stabilization, geogrid reinforcement, and microstructural densification can improve stiffness, strength, durability, and deformation resistance under service-related conditions [
43,
44]. Although those studies focused on lateritic subgrades and laterite-rock aggregate concrete rather than cyclic SRM behaviour, they support the broader engineering view that material improvement, contact stability, and durability should be considered together in infrastructure foundation and construction-material assessment.
Second, the influence of rock block content indicates that the dynamic performance of soil–rock mixture foundations cannot be judged simply by assuming that a higher rock content always leads to a better foundation state. The present results show that increasing rock block content generally increases the absolute stiffness of the material, especially under moderate and high confinement. However, after normalization, the higher-rock-content groups exhibit faster relative stiffness degradation and earlier development of damping evolution. This means that block-rich mixtures may possess a higher initial stiffness, but they are also more structurally sensitive to cyclic disturbance because of stronger block–block interaction, soil–rock interfacial sliding, and local rearrangement. Therefore, for engineering applications such as coastal nuclear power plant foundations, the control of rock block content should not focus only on maximizing stiffness. Within the tested range, specimens with higher rock block content showed higher absolute stiffness, but the characteristic strain decreased as increased. For example, under 100 kPa, decreased from 0.128 at to 0.092 at ; under 400 kPa, it decreased from 0.242 to 0.150. This indicates that block-rich mixtures may enter the relative stiffness-degradation and damping-development stage at smaller strain levels. Therefore, for critical foundations, high-rock-content zones should be accompanied by stricter control of compaction quality, particle distribution, and transition continuity, rather than being judged only by their higher initial stiffness. Excessive heterogeneity or uncontrolled block concentration may increase the sensitivity of the foundation to cyclic disturbance and amplify local deformation incompatibility.
Third, the results highlight the importance of interface-related control in both design and construction. The hysteresis characteristics and damping evolution observed in this study indicate that soil–rock mixtures are not governed solely by matrix deformation, but also by the progressive mobilization of soil–rock interfacial sliding and internal structural rearrangement. This means that the engineering response of a soil–rock mixture foundation should be evaluated by considering both bulk material behaviour and interface-related deformation compatibility. For coastal nuclear power plants, this has direct implications for zones where dynamic load transfer is concentrated, such as the foundation–ground interface, replacement–treatment boundaries, cut-and-fill transitions, and contacts between improved and unimproved ground. In such locations, local discontinuity in stiffness or contact condition may promote stress concentration, deformation incompatibility, and earlier cyclic degradation. Accordingly, construction control should place emphasis not only on bulk material quality, but also on interfacial continuity, gradation transition, and the avoidance of abrupt stiffness contrast across adjacent zones.
Fourth, the strain-dependent characteristics identified in this study suggest that dynamic safety assessment of coastal nuclear power plant foundations should not rely exclusively on static or small-strain parameters. The observed transition from limited degradation at low strain to rapid stiffness loss and enhanced energy dissipation at medium and large strain indicates that the foundation response of soil–rock mixtures may change significantly once cyclic demand exceeds a certain level. Therefore, in engineering evaluation, parameters related to modulus degradation, damping development, and characteristic strain should be incorporated into the assessment of serviceability and cyclic stability, especially for sites where repeated vibration, seismic excitation, or long-term operational disturbance may occur. In this regard, the present results provide a useful experimental basis for selecting dynamic parameters in subsequent constitutive modelling, interface-response analysis, and performance-based foundation evaluation.
Because the present results were obtained from reconstructed small-scale specimens, the above numerical ranges should be used as experimental reference values for preliminary parameter selection and comparative assessment, rather than as universal design limits. Site-specific verification is still required before these values are adopted in engineering design.
Overall, the findings of this study suggest that the safe use of soil–rock mixture ground in coastal nuclear power plants and similar infrastructures requires an integrated strategy that combines adequate densification, reasonable control of rock block content, attention to interface continuity, and dynamic parameter-based evaluation of cyclic stability. These implications are particularly relevant to engineering scenarios in which long-term reliability depends not only on initial foundation stiffness, but also on the stability of stiffness retention, deformation compatibility, and interface response under repeated loading. Therefore, the present study provides not only material-level experimental evidence, but also a meaningful basis for interpreting and improving the dynamic behaviour of complex foundations serving coastal nuclear power plants and other high-value, safety-sensitive infrastructures.
6. Limitations and Future Work
Although this study provides a systematic experimental characterization of the cyclic dynamic behaviour of reconstructed SRMs, several limitations should be acknowledged. First, all specimens were prepared using a compaction-based reconstruction method. Therefore, the results mainly represent the behaviour of reconstructed SRMs under controlled rock block content, moisture condition, moulding state, and confining pressure, rather than the full in situ response of natural undisturbed SRM deposits. Natural SRM deposits may contain more complex fabric features, depositional anisotropy, cementation, weathering effects, and broader particle-size variability. Future work should further compare reconstructed specimens with undisturbed or field-representative SRM samples and field-measured dynamic parameters.
Second, the tests were conducted on small-scale cylindrical specimens with a diameter of 50 mm and a height of 100 mm, using rock particles in the range of 6–10 mm. This design allowed the block-in-matrix structure to be represented within the capacity of the cyclic triaxial apparatus, but the adopted particle-size-to-specimen-size ratio was close to the upper practical boundary for small-scale testing. In addition, for the high-rock-content groups, especially Rc = 40% and Rc = 60%, the arrangement of individual rock particles may have a greater influence than in larger specimens. Future studies should use larger specimens with a greater number of rock particles and image-based or CT-based spatial verification to further examine particle-size ratio effects and particle-arrangement effects.
Third, the cyclic loading programme adopted a multistage strain-controlled procedure with three cycles at each strain amplitude. This procedure was effective for comparing stage-level modulus and damping evolution under a consistent increasing-strain path. The reported dynamic parameters are therefore most appropriately understood as path-dependent stage-level responses obtained under the adopted loading sequence. Future single-stage tests and extended-cycle tests will be useful for further separating the effects of current strain amplitude, accumulated loading history, and cycle-by-cycle degradation.
Fourth, the loading frequency was fixed at 0.5 Hz throughout the testing programme. This setting helped maintain a consistent strain-controlled sinusoidal loading condition and allowed the comparative analysis to focus on rock block content, confining pressure, and strain amplitude. However, frequency-dependent behaviour was not independently evaluated. Future work should include multi-frequency cyclic tests to clarify the rate-dependent evolution of shear modulus, damping ratio, and normalized dynamic parameters.
Fifth, the repeatability check was conducted only on selected representative groups. Although the results provided a preliminary indication of preparation and testing consistency, they cannot fully quantify the statistical variability of all 15 combinations of rock block content and confining pressure. Future experimental programmes should increase the number of parallel specimens and extend repeatability verification to more rock-content and confining-pressure combinations. More detailed documentation of specimen preparation, including compaction-related control information, should also be considered in subsequent related tests to improve reproducibility and comparison with other studies.
Sixth, the present study focuses on total-stress cyclic parameters derived from measured stress–strain hysteresis loops under undrained boundary conditions. The reported modulus and damping indices therefore describe the macroscopic cyclic response of reconstructed SRMs within a loop-based parameter framework. Future work will extend the testing programme by incorporating more complete effective-stress-path measurements, so that the coupling between internal hydraulic response, stiffness degradation, and damping development can be examined in greater detail.
Despite these limitations, the present study provides a useful parameter-based experimental basis for understanding the cyclic dynamic behaviour of reconstructed SRMs. The findings can support subsequent constitutive fitting, mesoscopic modelling, and dynamic-parameter selection for complex SRM foundations, while the above limitations define the main directions for future improvement.