Article

Non-Invasive Multi-Analytical Insights into Renaissance Wall Paintings by Bernardino Luini

1
Centro Interdipartimentale di Studi e Ricerche per la Conservazione del Patrimonio Culturale, CISRiC, University of Pavia, Via Ferrata 1, 27100 Pavia, Italy
2
Arvedi Laboratory of Non-Invasive Diagnostics, Department of Musicology and Cultural Heritage, University of Pavia, Via Bell’Aspa 3, 26100 Cremona, Italy
3
Laboratorio di Diagnostica Applicata ai Beni Culturali, Scuola di Restauro Cr.Forma, C.so Matteotti 17, 26100 Cremona, Italy
4
Department of Chemistry, University of Pavia, Via Torquato Taramelli 12, 27100 Pavia, Italy
5
Department of Chemistry, University of Milano, Via Golgi 19, 20133 Milan, Italy
6
Dipartimento di Scienze dell’Antichità, Sapienza Università di Roma, Piazzale Aldo Moro 5, 00185 Roma, Italy
7
Independent Researcher, 20831 Seregno, Italy
8
Department of Physics, Politecnico di Milano, Piazza Leonardo da Vinci 32, 20133 Milan, Italy
9
NIREOS SRL, Via Giovanni Durando 39, 20158 Milan, Italy
*
Author to whom correspondence should be addressed.
Coatings 2025, 15(9), 1113; https://doi.org/10.3390/coatings15091113
Submission received: 31 July 2025 / Revised: 30 August 2025 / Accepted: 16 September 2025 / Published: 22 September 2025
(This article belongs to the Special Issue Surface and Interface Analysis of Cultural Heritage, 2nd Edition)

Abstract

The findings of non-invasive, multi-analytical research on two wall paintings located in the Santuario della Beata Vergine dei Miracoli in Saronno (Varese, Italy)—The Marriage of the Virgin and The Adoration of the Christ Child—are presented in this paper. The authorship of the latter is up for controversy, while the former is unquestionably attributed to Bernardino Luini. The objective was to assess the compatibility of their color palettes through material comparison. A complementary suite of non-invasive techniques, including X-ray fluorescence (XRF), external reflection FTIR, Raman, visible reflectance spectroscopy and hyperspectral imaging, were employed to characterize pigments and surface materials without sampling. Results confirm the use of historically consistent pigments such as calcium carbonate, ochres, Naples yellow, smalt, azurite and lapis lazuli. Differences in the application of blue pigments—lapis lazuli in The Marriage of the Virgin and azurite in The Adoration of the Christ Child—may reflect workshop variation rather than separate authorship. Spectral imaging revealed pigment mixing and layering strategies, especially in skin tones and shadow modeling. This study underscores the significance of diagnostics as an interpretive instrument, capable of contextualizing Luini’s paintings within the context of Renaissance creative practice, providing a framework relevant to analogous inquiries.

Graphical Abstract

1. Introduction

During the Italian Renaissance, wall paintings became central to artistic practice, serving aesthetic and symbolic functions within religious and secular architecture [1]. Bernardino Luini (c. Dumenza, 1481–Milano, 1532) was a prominent painter of the Lombard Renaissance, and he gained fame for his religious and mythological murals, especially around Milan and Varese [2]. Luini adopted many techniques from Leonardo da Vinci (c. Anchiano, 1452–Amboise, 1519), and although it remains uncertain whether he was a direct apprentice he is recognized as a principal figure among the Leonardeschi school [3]. A notable phase of his career was marked by his extensive work at the Santuario della Beata Vergine di Saronno (Varese, Italy). In 1525, he was commissioned to paint the frescoes in the main chapel and the ante-presbytery [4].
This study focuses on two mural paintings within the sanctuary, The Marriage of the Virgin (Figure 1), located inside the church (ante-presbytery), and The Adoration of the Christ Child (Figure 2), which is situated outside under the portico. While the former is securely attributed to Bernardino Luini, the authorship of the latter remains debated despite its apparent stylistic affinity to Luini’s workshop [5]. Addressing this attribution uncertainty is crucial for art historical scholarship and informs conservation strategies tailored to the artist’s material practices.
To explore this attribution question and gain a deeper understanding of the materials and techniques involved, a multidisciplinary non-invasive analytical approach was adopted. The Marriage of the Virgin served as a comparative material reference due to its confirmed authorship and stylistic parallels. Under this scenario, the aims of this study were both the characterization of pigments and binders and the contextualization of material choices within the broader framework of Luini’s artistic practice.
A suite of complementary spectroscopic and imaging techniques, widely used in the study of wall paintings and frescoes [6,7,8,9,10], was employed to examine the painted surfaces. X-ray fluorescence (XRF), external reflection Fourier-transform infrared spectroscopy (ER-FTIR), and Raman spectroscopy were used to identify elemental and molecular components, providing an overall material profile. Subsequently, to obtain specific pigment identification, visible reflectance spectroscopy was used to compare the measured spectra with reference standards. Hyperspectral imaging was used to map the spatial distribution of the pigments, offering insights into the painting technique. In addition, it enabled the extraction of spectral data directly from the images, supporting the identification of specific materials.
Recent studies affirm the value of such integrated workflows: for example, Dal Fovo et al. (2020) demonstrated how non-invasive mapping methods enable pigment characterization in Roman mural paintings [6]; Mollica Nardo et al. (2019) analyzed Sicilian wall paintings through XRF, FTIR, and FORS to characterize pigments and binders with no sampling [11]; Bonizzoni et al. (2017) combined FORS, XRF, Raman, and ER-FTIR to differentiate original pigments in layered mural contexts [12]; and De Queiroz Baddini et al. (2022) fused visible reflectance, XRF, and FTIR data for the classification of mixed pigments in heritage science [13]. These approaches demonstrate the effectiveness of non-invasive, multi-technique protocols in providing comprehensive material insights for wall paintings. The combination of complementary methods enables a thorough characterization of the pictorial materials, yielding insights that would not be possible with any single technique.

2. Materials and Methods

2.1. Selection of Analysis Points

The analytical campaign targeted representative color areas across both paintings to assess compatibility with Bernardino Luini’s palette and compare material composition between the two works. The selection of the analyzed areas was guided by two main factors: (i) the feasibility of performing analyses safely within the operational limits of each technique, and (ii) the presence of the same color regions in both frescoes, allowing direct comparison of pigment choices.
In The Marriage of the Virgin seventeen points were analyzed (Figure 1). These included pink (points 1, 8, 11, 12), red (4, 7, 10), blue (5, 9, 13, 16), white (2, 3), yellow (6, 15) and green (14, 17) tones. XRF was performed on most of the points, while complementary techniques were performed on key regions for cross-validation. Notably, the Virgin’s blue mantle was fully characterized and compared to Joseph’s blue robe. Other relevant areas included the distinct shades of yellow: the deep tone on Mary’s robe versus lighter tone of the belts of the figure on Joseph’s left.
Figure 1. Visible light image of The Marriage of the Virgin, showing analytical points and areas: XRF (red dots), FTIR (green dots), Raman (light blue dots), visible reflectance spectroscopy (dark blue dots) and the hyperspectral imaging area (dashed white rectangle).
Coatings 15 01113 g001
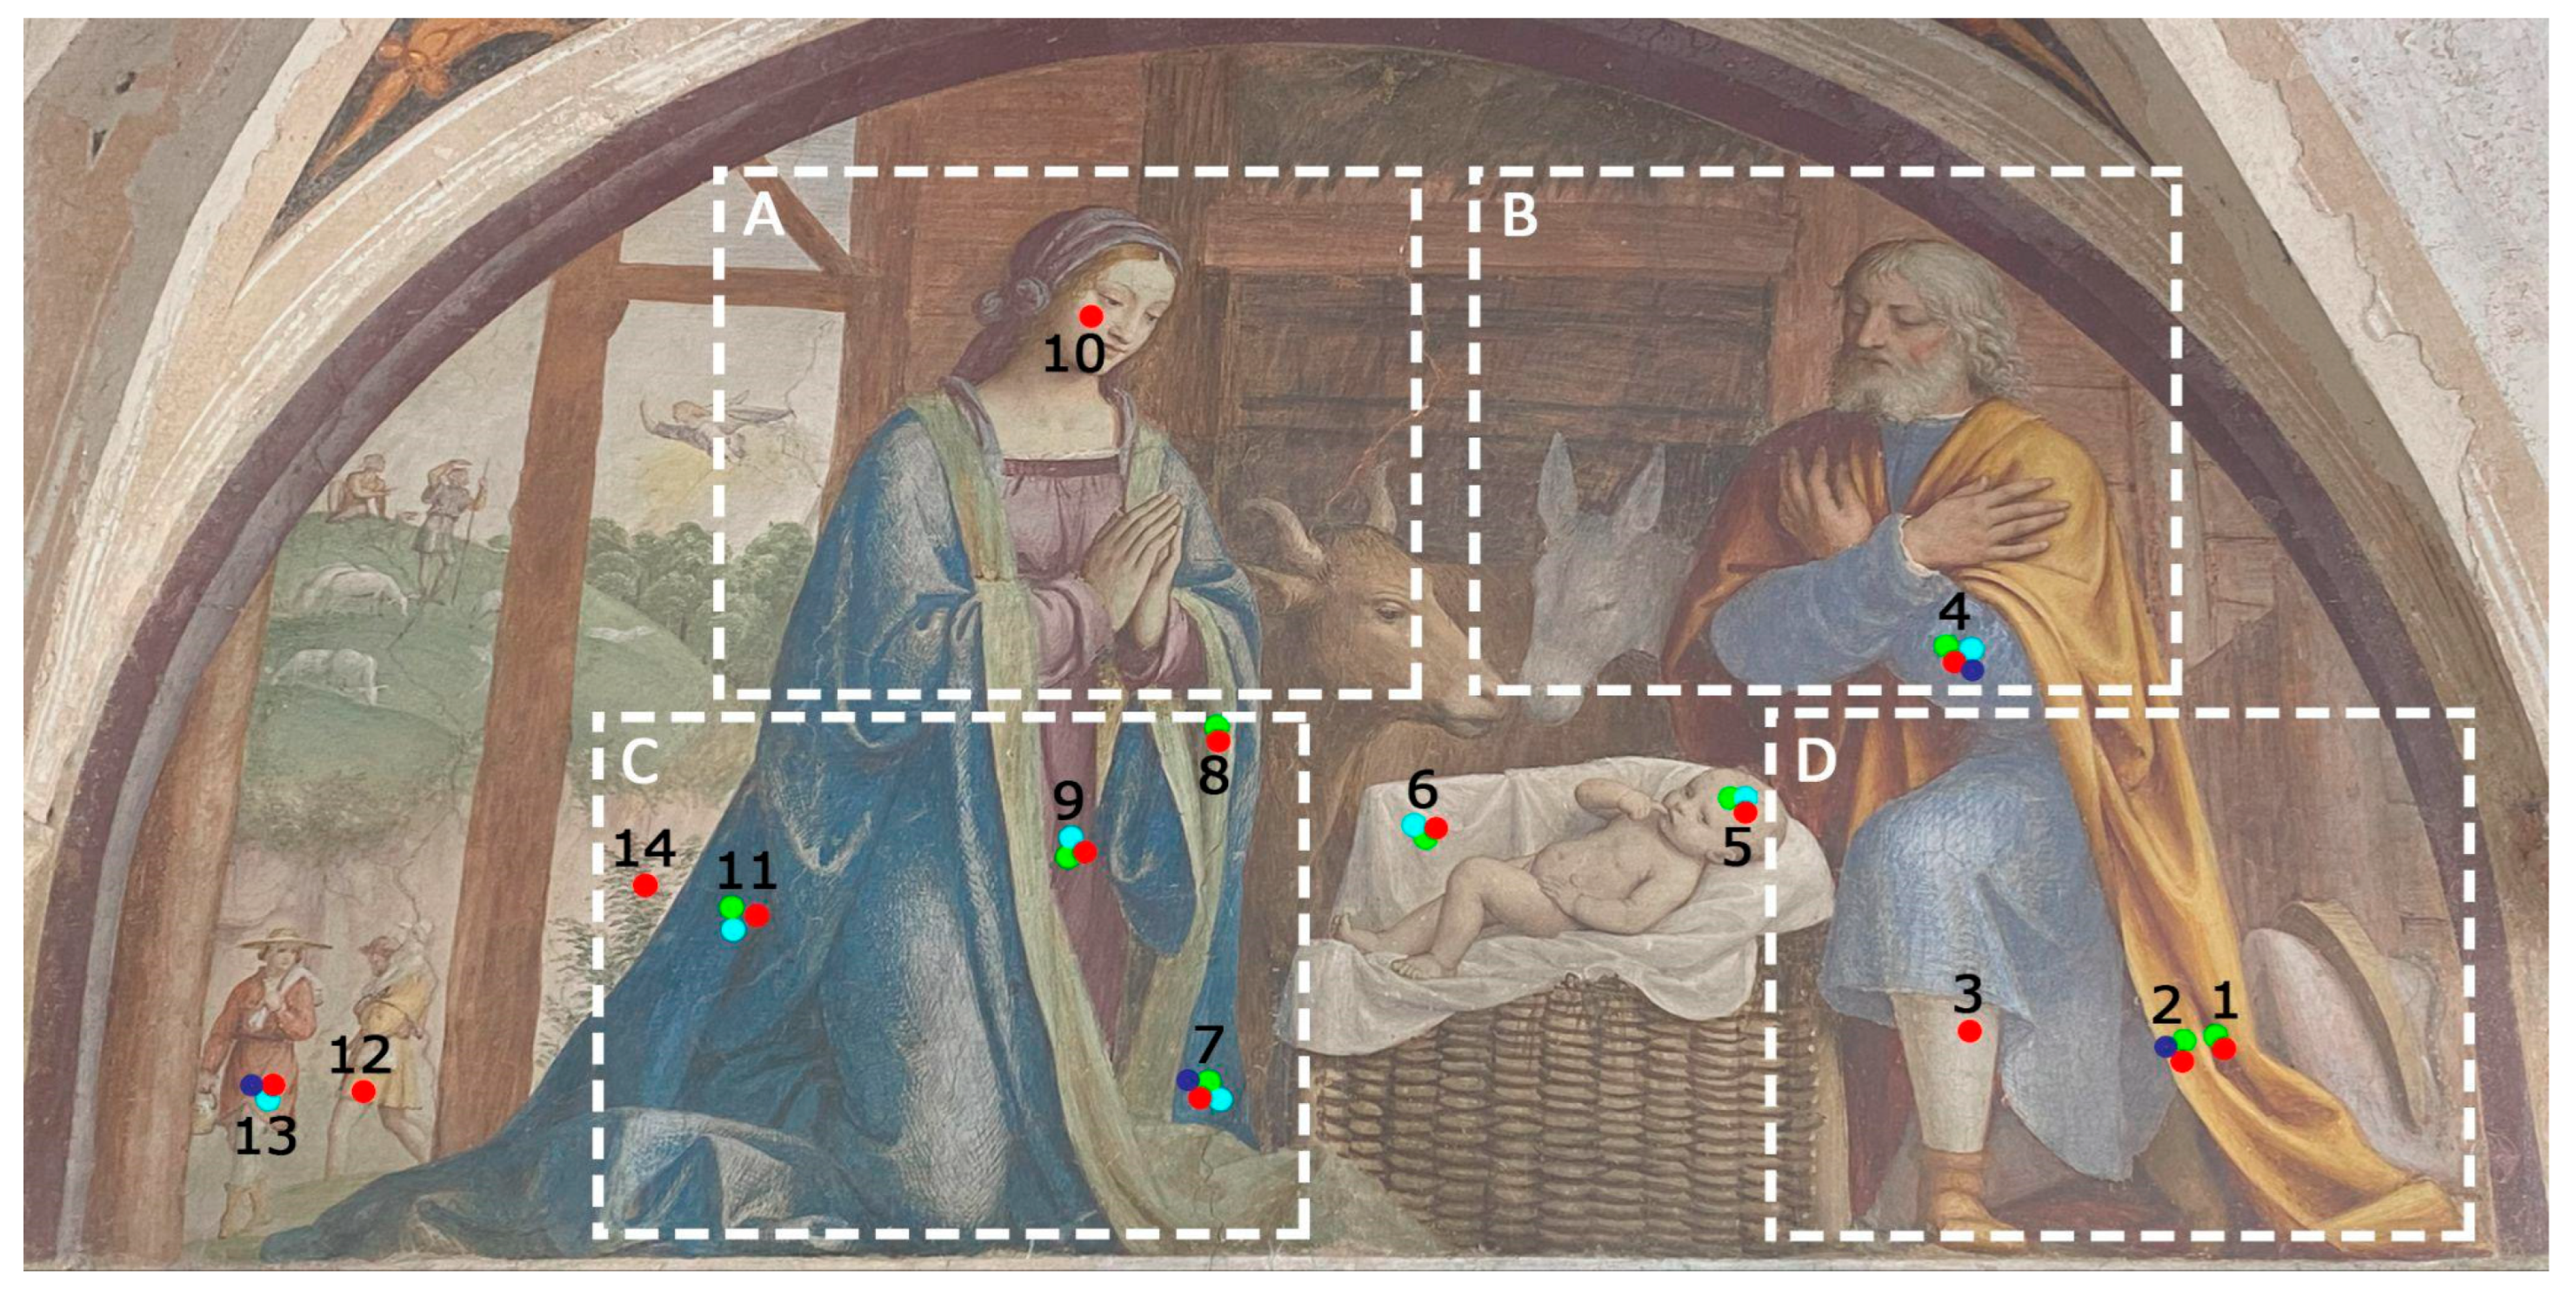
In The Adoration of the Christ Child, fourteen points were investigated, focusing on comparable colors for direct comparison with Luini’s work (Figure 2): blues (4, 7, 11), whites (3, 5, 6), pink (10), reds (9, 13), yellows (1, 2, 12) and greens (8, 14). As in the first painting, XRF was performed on all selected areas, while full multi-technical analysis was carried out on representative regions, such as the blue robes of Mary and Joseph and the yellow tones of Joseph’s mantle.
The strategy emphasized direct comparison of shared colors to identify material consistencies.
Figure 2. Visible light image of the Adoration of the Christ Child, showing analytical points and areas: XRF (red dots), FTIR (green dots), Raman (light blue dots), visible reflectance spectroscopy (dark blue dots) and the hyperspectral imaging areas (dashed white rectangles).
Coatings 15 01113 g002

2.2. X-Ray Fluorescence (XRF) Spectroscopy

X-Ray Fluorescence (XRF) measurements were performed with a portable XRF spectrometer XRS 38 (EIS S.r.l., Rome, Italy), equipped with a Silicon Drift Detector (SSD) and a low-power X-ray tube (W anode). The analytical spot diameter was 3 mm. The selected working conditions were measuring time 60 s, tube voltage 30 kV, tube current 30 μA, and acquisition channels 2048 [14]. Data were acquired and processed using the DPPMCA software (version 1.0.0.22.).

2.3. External Reflection Fourier Transform Infrared (ER-FTIR) Spectroscopy

External Reflection Fourier Transform Infrared (ER-FTIR) spectroscopy was performed using the Alpha portable spectrometer (Bruker Optics, Billerica, MA, USA) equipped with the R-Alpha external reflectance module that is composed of an optical layout of 23°/23°. The compact optical bench consists of a Globar, a permanently aligned RockSolid interferometer (with gold mirrors) and an uncooled DLaTGS detector. It was employed at a working distance of 15 mm, thus analyzing spots of about 5 mm in diameter. Pseudo-absorbance spectra [log(1/R); R = reflectance] were acquired in the range between 7500 and 375 cm−1, with 64 scans at a spectral resolution of 4 cm−1. Spectra from a gold flat mirror were used as background. For the study of derivative bands, reflection infrared spectra were transformed to absorbance spectra by applying the Kramers-Kronig transformation (KKT) [15] included in the OPUS software package (7.2 version, 2013, Bruker, Billerica, MA, USA) and a portion of the mid-IR spectral range (3600–400 cm−1) is considered.

2.4. Raman Spectroscopy

Raman analyses were performed using a BWTek i-Raman EX portable spectrometer. The instrument is equipped with a fiber optic probe with a diameter of 9.42 mm, delivering a laser spot of approximately 85 μm at the focal plane. The excitation source is a Nd-YAG laser source emitting at 1064 nm. The spectra were obtained as an average of 20–40 scans, with spectral resolution of 4 cm−1, and in the spectral range between 200–2500 cm−1. The time required for each measurement was about 20 s. All data were acquired and processed using BWSpec software (version 4.15_3), and identification was obtained by comparing the spectra recorded on the frescoes with those in a personal reference spectrum database and those found in the literature [16,17].

2.5. Visible Reflectance Spectroscopy

Visible reflectance analyses have been performed by means of a Konica Minolta CM 2300d portable spectrophotometer in the 360–740 nm range. The instrument employs a measurement spot with a diameter of 1 cm. All the measurements were conducted straight on the samples’ surfaces and data’s identification was obtained by comparing the spectra recorded on the artworks with those in a personal reference spectra database and those present in the literature.

2.6. Hyperspectral Imaging

Hyperspectral images were acquired using HERA VNIR hyperspectral camera (NIREOS srl, Milano, Italy). This device is based on Fourier Transform (FT) operation by means of an ultra-stable birefringent interferometer positioned in front of a CMOS sensor (spectral range: 400–1000 nm; best spectral resolution: 1.5 nm at 400 nm and 9 nm at 1000 nm; angular field of view: 16 degrees) [18]. The illumination system was composed of a combination of white LED and halogen lamps positioned in front of the fresco. The acquisition and analysis of the data was performed with NIREOS Acquisition App and NIREOS HyperLab software (NIREOS srl, Milano, Italy). Flat field correction was made with a white photographic backcloth and a 99% reflectance standard (Spectralon, Labsphere Inc., North Sutton, NH, USA) was employed for spectral calibration.
Data analysis was carried out using a spectral unmixing method. This approach decomposes each pixel, which may represent a mixture of different materials (so-called mixed pixels), into a set of pure spectral signatures, known as endmembers, and their corresponding abundance maps, which represent the portion of each endmember within the pixel. The unmixing process was implemented in MATLAB® (2024b) using a combination of PCA for data dimensionality reduction and the n-findr algorithm for endmember extraction. The resulting abundance maps were then used to visualize the spatial distribution of the identified components across the scene [19,20].

3. Results

3.1. The Marriage of the Virgin

3.1.1. Elemental and Molecular Spectroscopic Analyses

The results about the elemental and molecular composition are described below and organized according to the colour fields.
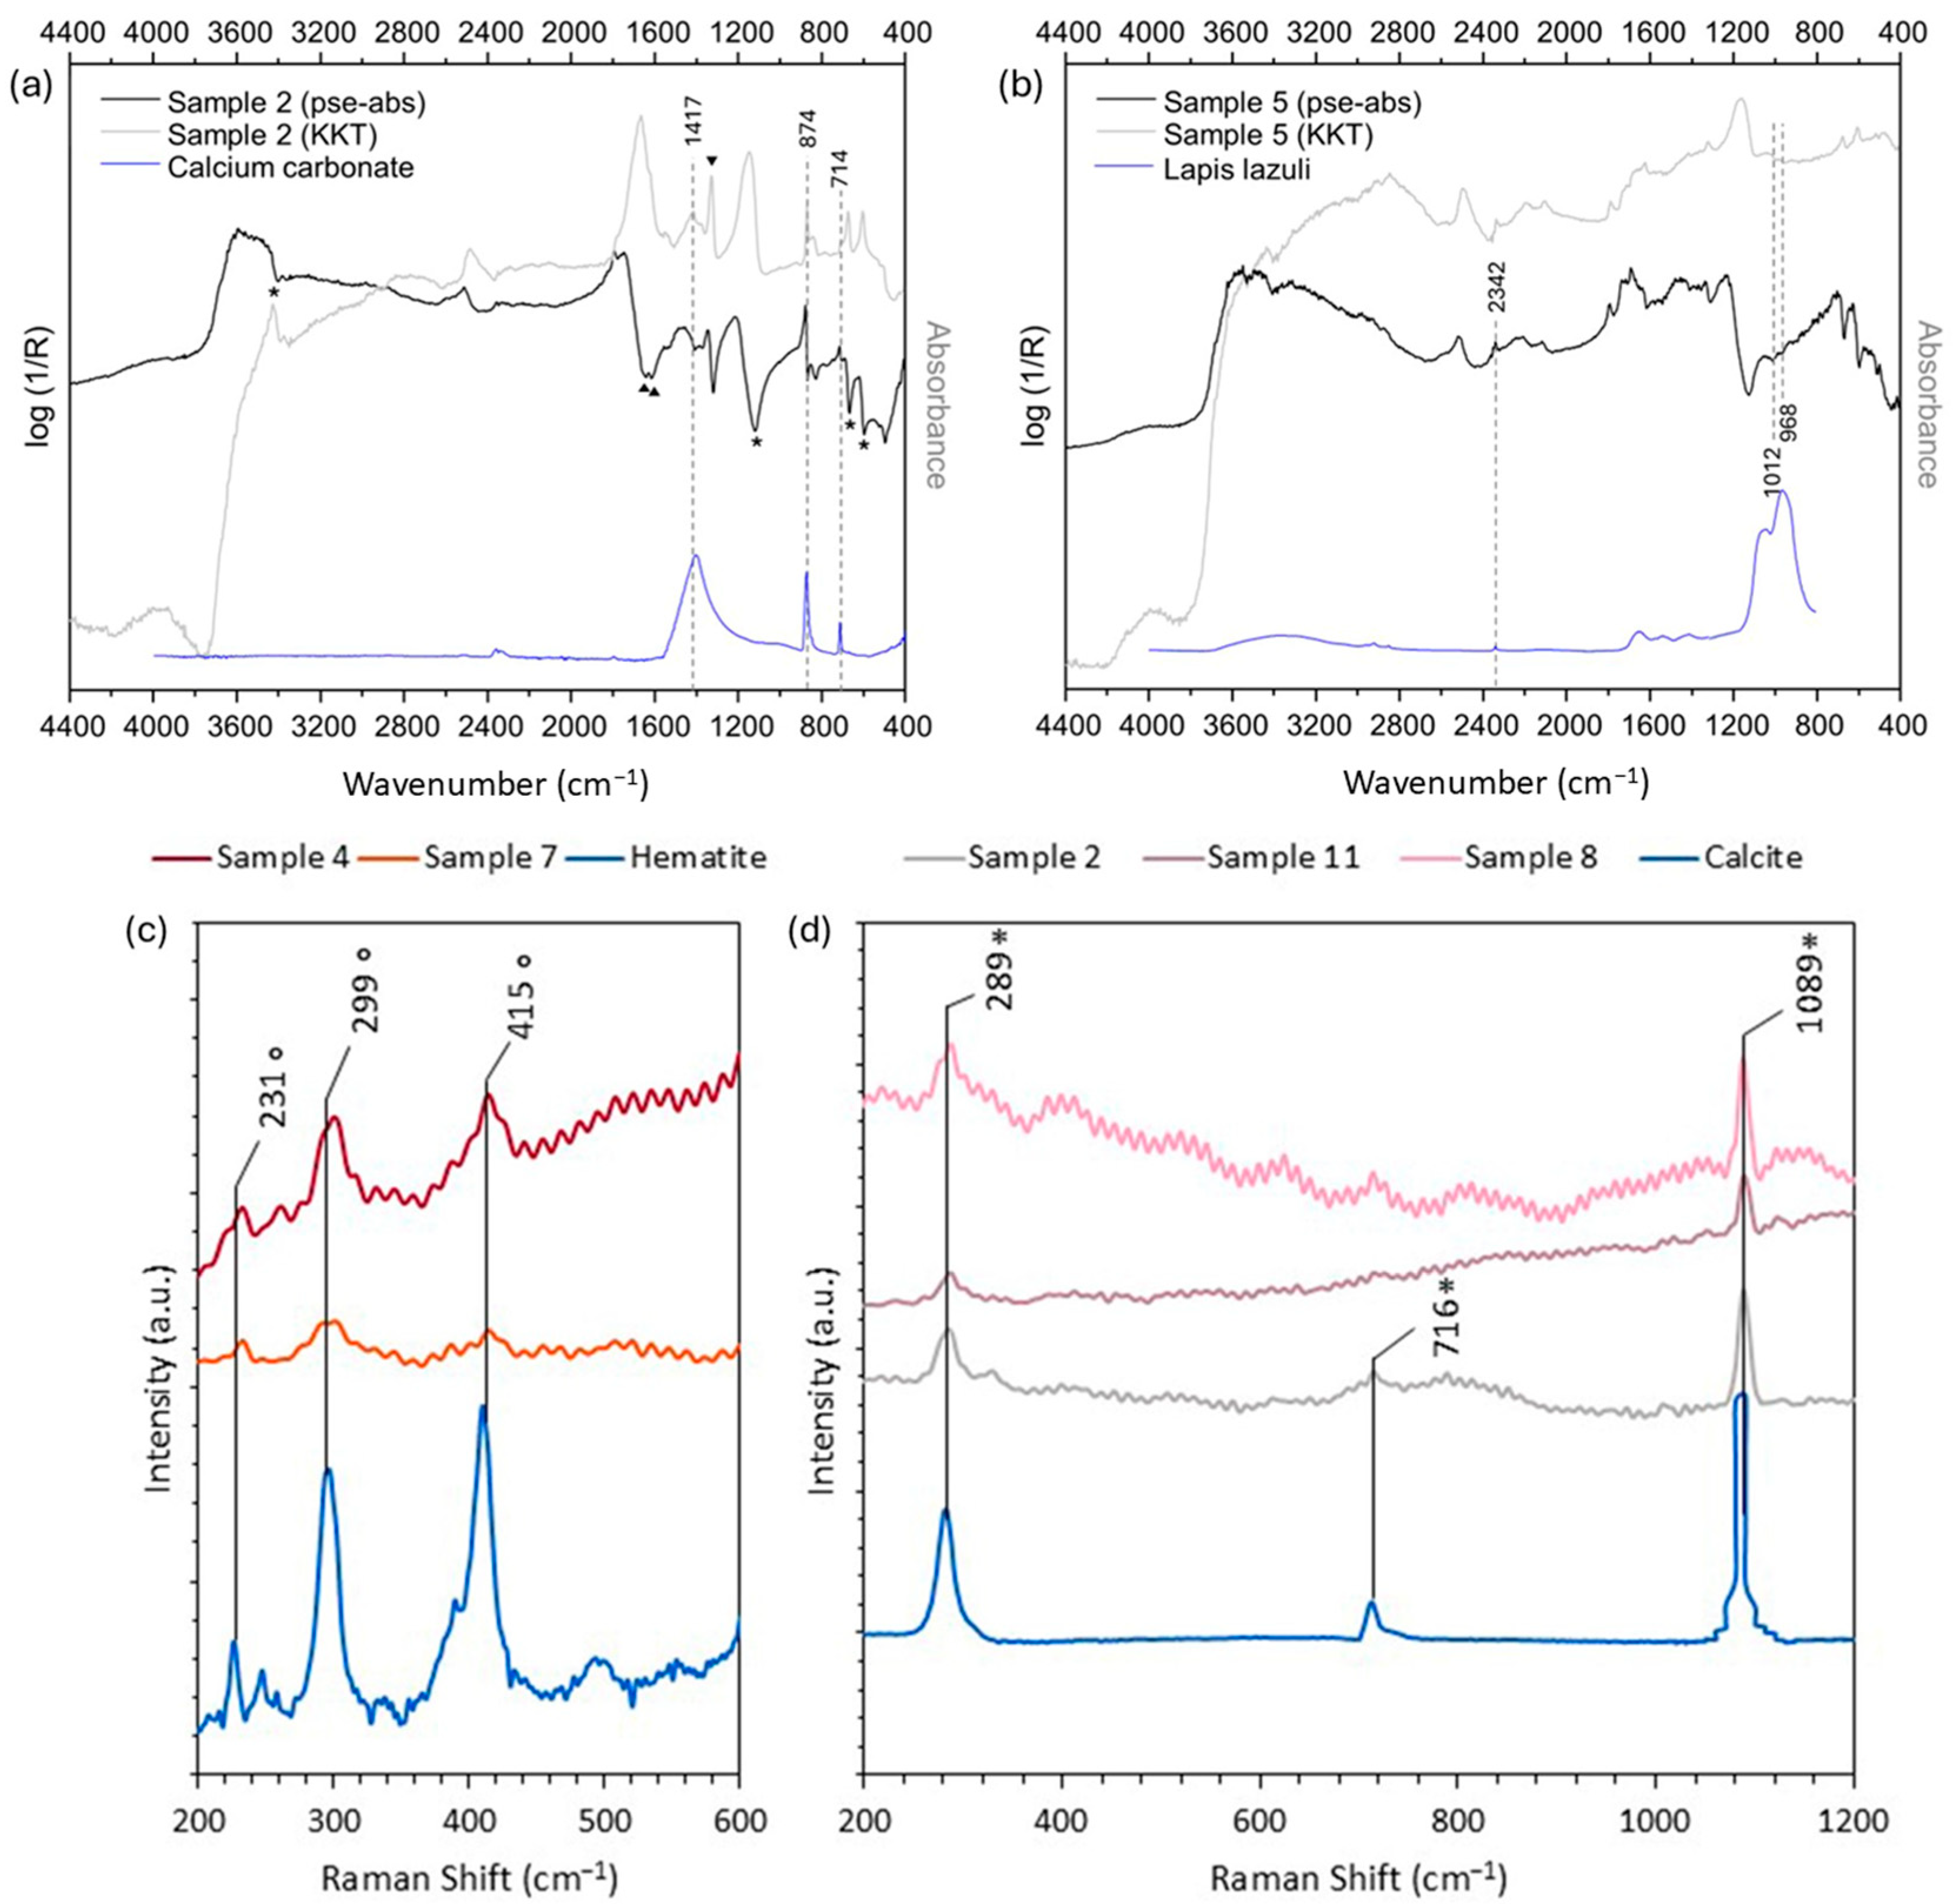
All analyzed points revealed high counts of calcium (Ca) (Figure 3a) due to calcium carbonate (CaCO3) [21]. Calcium carbonate presence is further confirmed by ER-FTIR and Raman analyses. ER-FTIR spectra displayed the characteristic absorption band of calcite at approximately 1420, 870, and 714 cm−1, corresponding, respectively, to the asymmetric stretching vibration, out-of-plane bending, and in-plane bending vibrations of the carbonate ion (CO32−) (Figure 4a) [22]. Raman spectra presented well-defined bands of calcite, centered at 287, 716 and 1089 cm−1 (Figure 4d) [23,24]. Additionally, ER-FTIR spectra exhibited characteristic bands of gypsum and oxalates (Figure 4a). Moreover, the presence of sulfur (S) ascribable to the gypsum can also be uniformly associated with the plaster’s sulfation process, induced by the reaction with reactive atmospheric contaminants, primarily sulphur dioxide and oxygen [25].
Consistently across the samples, phosphorus (P) was detected by XRF, suggesting the possible presence of a source of phosphoprotein, probably attributable to the binder used in some areas where dry application is used [26]. However, no corresponding vibrational markers were identified in the ER-FTIR or Raman spectra, likely due to low concentration and/or signal overlap with other components.
In flesh tones and light pink areas (samples 1, 3, 8, and 11), in addition to P, S and Ca, iron (Fe) counts were also detected, suggesting the use of red earths to obtain the desired tonal variations. In pink and red areas (samples 1, 4, 7 and 12), Raman spectroscopy revealed specifically the presence of hematite (Fe2O3), clearly visible through the bands centered at 231, 299, 415 cm−1 (Figure 4c) [17,23].
Looking at the yellow areas of Mary’s sleeves (sample 6), XRF analyses revealed high counts of Fe (Figure 3b), which is consistent with the presence of an iron-based yellow pigment such as yellow ochre, a natural pigment primarily consisting of goethite (FeOOH), hematite (Fe2O3) and clay minerals [21].
Yellow ochre was also observed on the belt of the figure to Joseph’s right (sample 15), alongside Naples yellow (Pb2Sb2O7), identified for the presence of lead (Pb) and antimony (Sb) in the spectra [21].
The light red in the priest’s cloak (sample 7) is dominated by calcium carbonate and Fe-based pigments, i.e., red earths, which, as for the yellow ochre, are natural iron-based red pigments mainly composed of iron oxides and hydroxides (Figure 3c).
In both the blue robes of Mary and Joseph (samples 5 and 13), the presence of potassium (K), cobalt (Co), and arsenic (As) revealed the use of smalt (Figure 3d), a cobalt-based glass pigment widely used from the Renaissance period onwards [21,27,28]. Performing ER-FTIR analysis on Mary’s robe, it was possible to additionally reveal the presence of lapis lazuli (Figure 4b), as evidenced by characteristic Reststrahlen bands, minima resulting from strong reflectance of infrared radiation at the lattice vibration frequencies, at 1012 and 968 cm−1. Specifically, they are attributed to the asymmetric stretching vibrations of the aluminosilicate (Si–O–Al) framework in lazurite, (Na,Ca)8[(S,Cl,SO4,OH)2|(Al6Si6O24)] [29]. The band observed at approximately 2340 cm−1, assigned to the antisymmetric stretching of CO2 molecules trapped within the crystal structure, further supports the identification of lapis lazuli as a pigment [30]. Therefore, while only smalt was used for Joseph’s robe, a mixture of smalt and lapis lazuli was used for Mary’s robe. A different blue region was also examined, in correspondence with the priest’s crown (sample 9). XRF analysis revealed the presence of elements characteristic of the use of smalt (Co and As), although with markedly lower intensity compared to sample 13. However, high counts of Cu were present, which can be attributed to the use of azurite (Figure 3d) [21]. This pigment was likely applied a secco, as azurite is traditionally unsuitable for true fresco and typically used only in dry applications [31].
The violet area on the left shoulder of the cloak of the man to Joseph’s right (sample 16) was obtained by combining smalt and azurite, identified through K, Co, and As and traces of copper (Cu), with iron-based pigments as red earths.
On the green areas of the jacket of this figure (sample 14), the high counts of Fe and Ca suggest the presence of a mixture of green earth pigment, whose composition derives from iron-rich aluminosilicate minerals, with calcium carbonate (Figure 3e) [21]. XRF analysis on the priest’s sleeve (sample 10) revealed elevated levels of Fe and gold (Au), suggesting the presence of gold leaf applied over a red bole, an iron-rich adhesive substrate. The detection of trace mercury (Hg) may indicate the use of an amalgam method for gold extraction, a method occasionally employed during the Renaissance (Figure 3f) [32].
It should be noted that ER-FTIR and Raman analyses are not consistently reported for all investigated areas. Operational constraints during in situ measurements hindered the acquisition of several areas and where spectra were obtained, they sometimes did not display diagnostic features. Consequently, pigment identification relied primarily on XRF results. All characteristic vibrational bands observed by ER-FTIR and Raman spectroscopy are reported in Table S1.

3.1.2. Visible Reflectance Spectroscopy

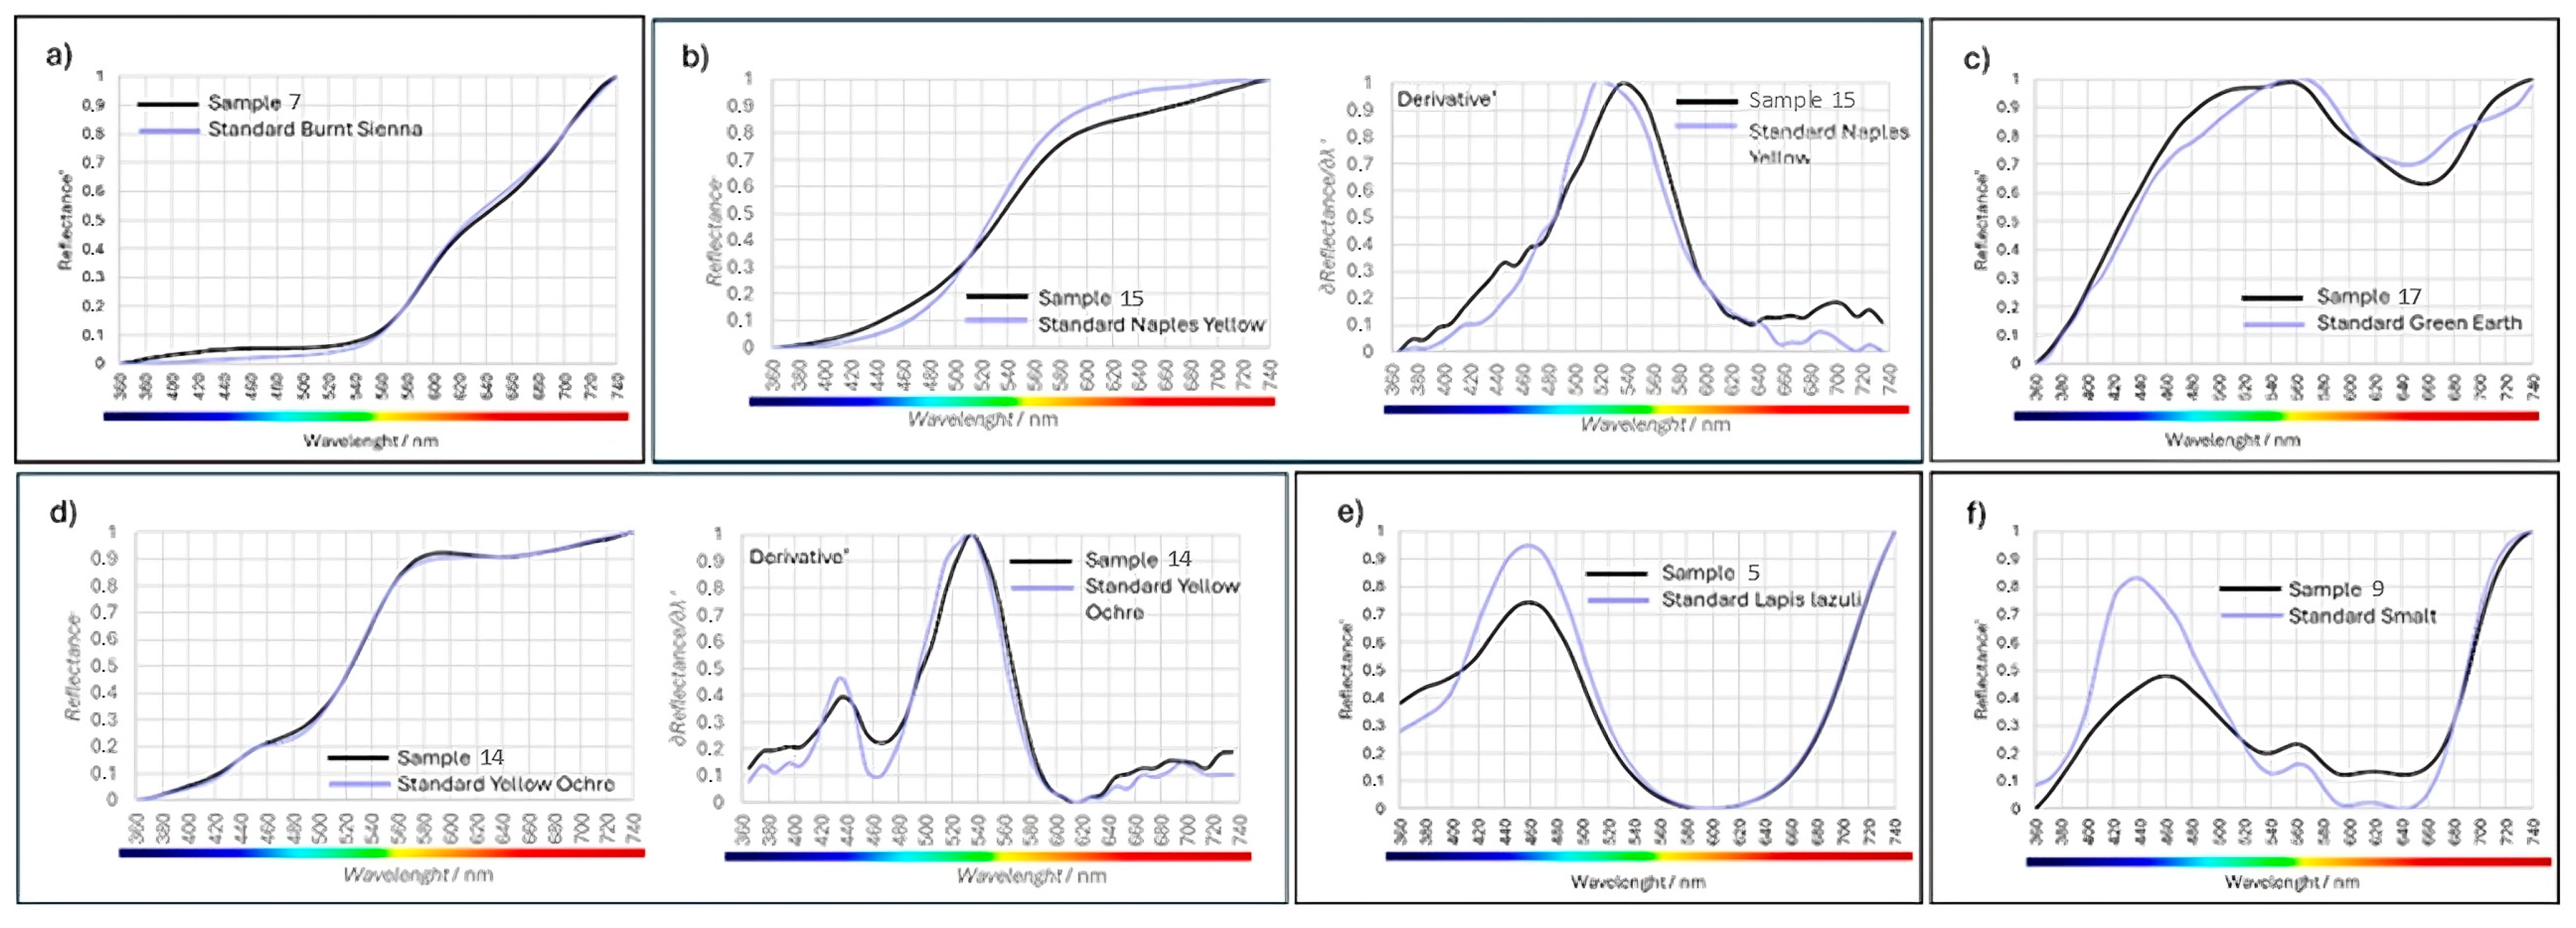
Visible reflectance analysis often proves helpful to other techniques, suggesting quickly and non-invasively (and at low cost) the nature of the applied pigments. This technique is certainly less powerful than fiber optics reflectance spectroscopy (FORS) or hyperspectral analysis, but it still provides important and interesting information that, as in this case, allows to confirm findings obtained with other techniques. In Figure 5, the spectra obtained at the different points are reported together with spectra acquired on reference standards.
It’s indeed possible to confirm the presence of red ochre, often associated with burnt red-brown earth (the so-called Siena earth) (Figure 5a) in samples 1, 4, 7 and 12. In the flesh-tone points (samples 8 and 11), the presence of yellow ochre was highlighted. As for the lighter points, such as samples 1, 8, 11 and 12, they consist of a mixture of red and/or yellow ochres with probably a white pigment, the latter isn’t particularly sensitive to being diagnosed using visible reflectance analysis, as is also the case with colors tending toward black. Particularly interesting is the area corresponding to sample 8, where the presence of Naples Yellow was recognized (Figure 5b). The shape of the spectrum, which shows a slight increase between 450 nm and 500 nm, followed by a strong reflectance increase starting at around 510 nm [33], cannot be confused with other yellow pigments, thanks to the confirmation given by the first derivative shape.
Samples 14 and 17, which correspond to green areas, provided two different spectra. In fact, for sample 17, the presence of green earth can be recognized, due to a broad peak around 560 nm (Figure 5c) together with a slight shoulder, which are characteristic of green earth. The wavelengths at which the maxima and the shoulder occur are not fixed because the absorption of light by green earth results from an interaction of the two valency states of iron, where the ratio of FeII/FeIII correlates with variations in the pigment colour [34]. In any case, the VIS spectrum of green earth is diagnostic, because it differs from spectrum of other brighter green pigments such as Malachite and Verdigris, which have sharp reflection peaks shifted further to the left, around 490–520 nm [35]. On the other hand, for sample 14, the presence of yellow ochre is recognized, probably used in mixture with green to obtain a lighter color (Figure 5d). This can be affirmed because the spectral trend is typical of a pigment based on iron hydroxides [35], with a rise starting at about 400 nm, followed by a shoulder around 460 nm and 580 nm.
Finally, as for the blue points, they provided well-distinguished information: sample 5, located on Mary’s mantle, allowed the recognition of lapis lazuli, as shown by its unmistakable spectrum in Figure 5e (characterized by a reflectance peak at 460 nm and a strong absorption at 600 nm); whereas in the darker area corresponding to sample 9, a cobalt-based blue was recognized, most likely smalt (Figure 5f). Its spectrum is easily recognizable, and it is characterized by a reflectance peak at 460 nm followed by three absorptions at 540 nm, 590 nm, and 650 nm [36].

3.1.3. Hyperspectral Imaging

The spectral endmembers obtained from the analysis of the fresco The Marriage of the Virgin, and the resulting abundance maps are reported in Figure 6. The red and yellow spectral endmembers are present in Mary’s clothing, such as sleeves and cloth belt, in the priest garb, and Joseph’s mantle. The abundance maps also highlight finer details like skin tones, cheeks, lips, hair shades, and architectural decorations on the background. The endmember spectra show similar absorption bands at around 500 nm and 900 nm, with a reflectance maximum at approximately 750 nm, which has been demonstrated to be correlated to iron oxide pigments, such as red and yellow ochres [36,37]. In detail, the red endmember displays a positive slope near 600 nm and a less pronounced inflection point at around 700 nm. In the yellow endmember, the positive slope is shifted to lower wavelengths, and the inflection point is more pronounced, with an additional reflection maximum localized at 600 nm.
The blue endmember spectrum, primarily found in Mary’s clothing and certain shadowed areas of Joseph’s mantle, shows a reflectance band at 450 nm and a broad minimum centered at 600 nm. There is a notable increase in reflectance in the red and near-infrared (NIR) regions, which supports the pigment attribution to lapis lazuli [36]. In Joseph’s clothing and the priest’s crown, lapis lazuli is combined with another pigment, as shown by the abundance map of the light blue endmember. The reflectance spectrum shows three minima at 485, 525, and 600 nm, resembling those identified for smalt [37]. These characteristic minima can shift depending on the paint mixtures used and the varying proportions of other pigments [38]. Therefore, it can be concluded that the light blue endmember is likely a smalt-based paint mixture.

3.2. The Adoration of the Christ Child

3.2.1. Elemental and Molecular Spectroscopic Analyses

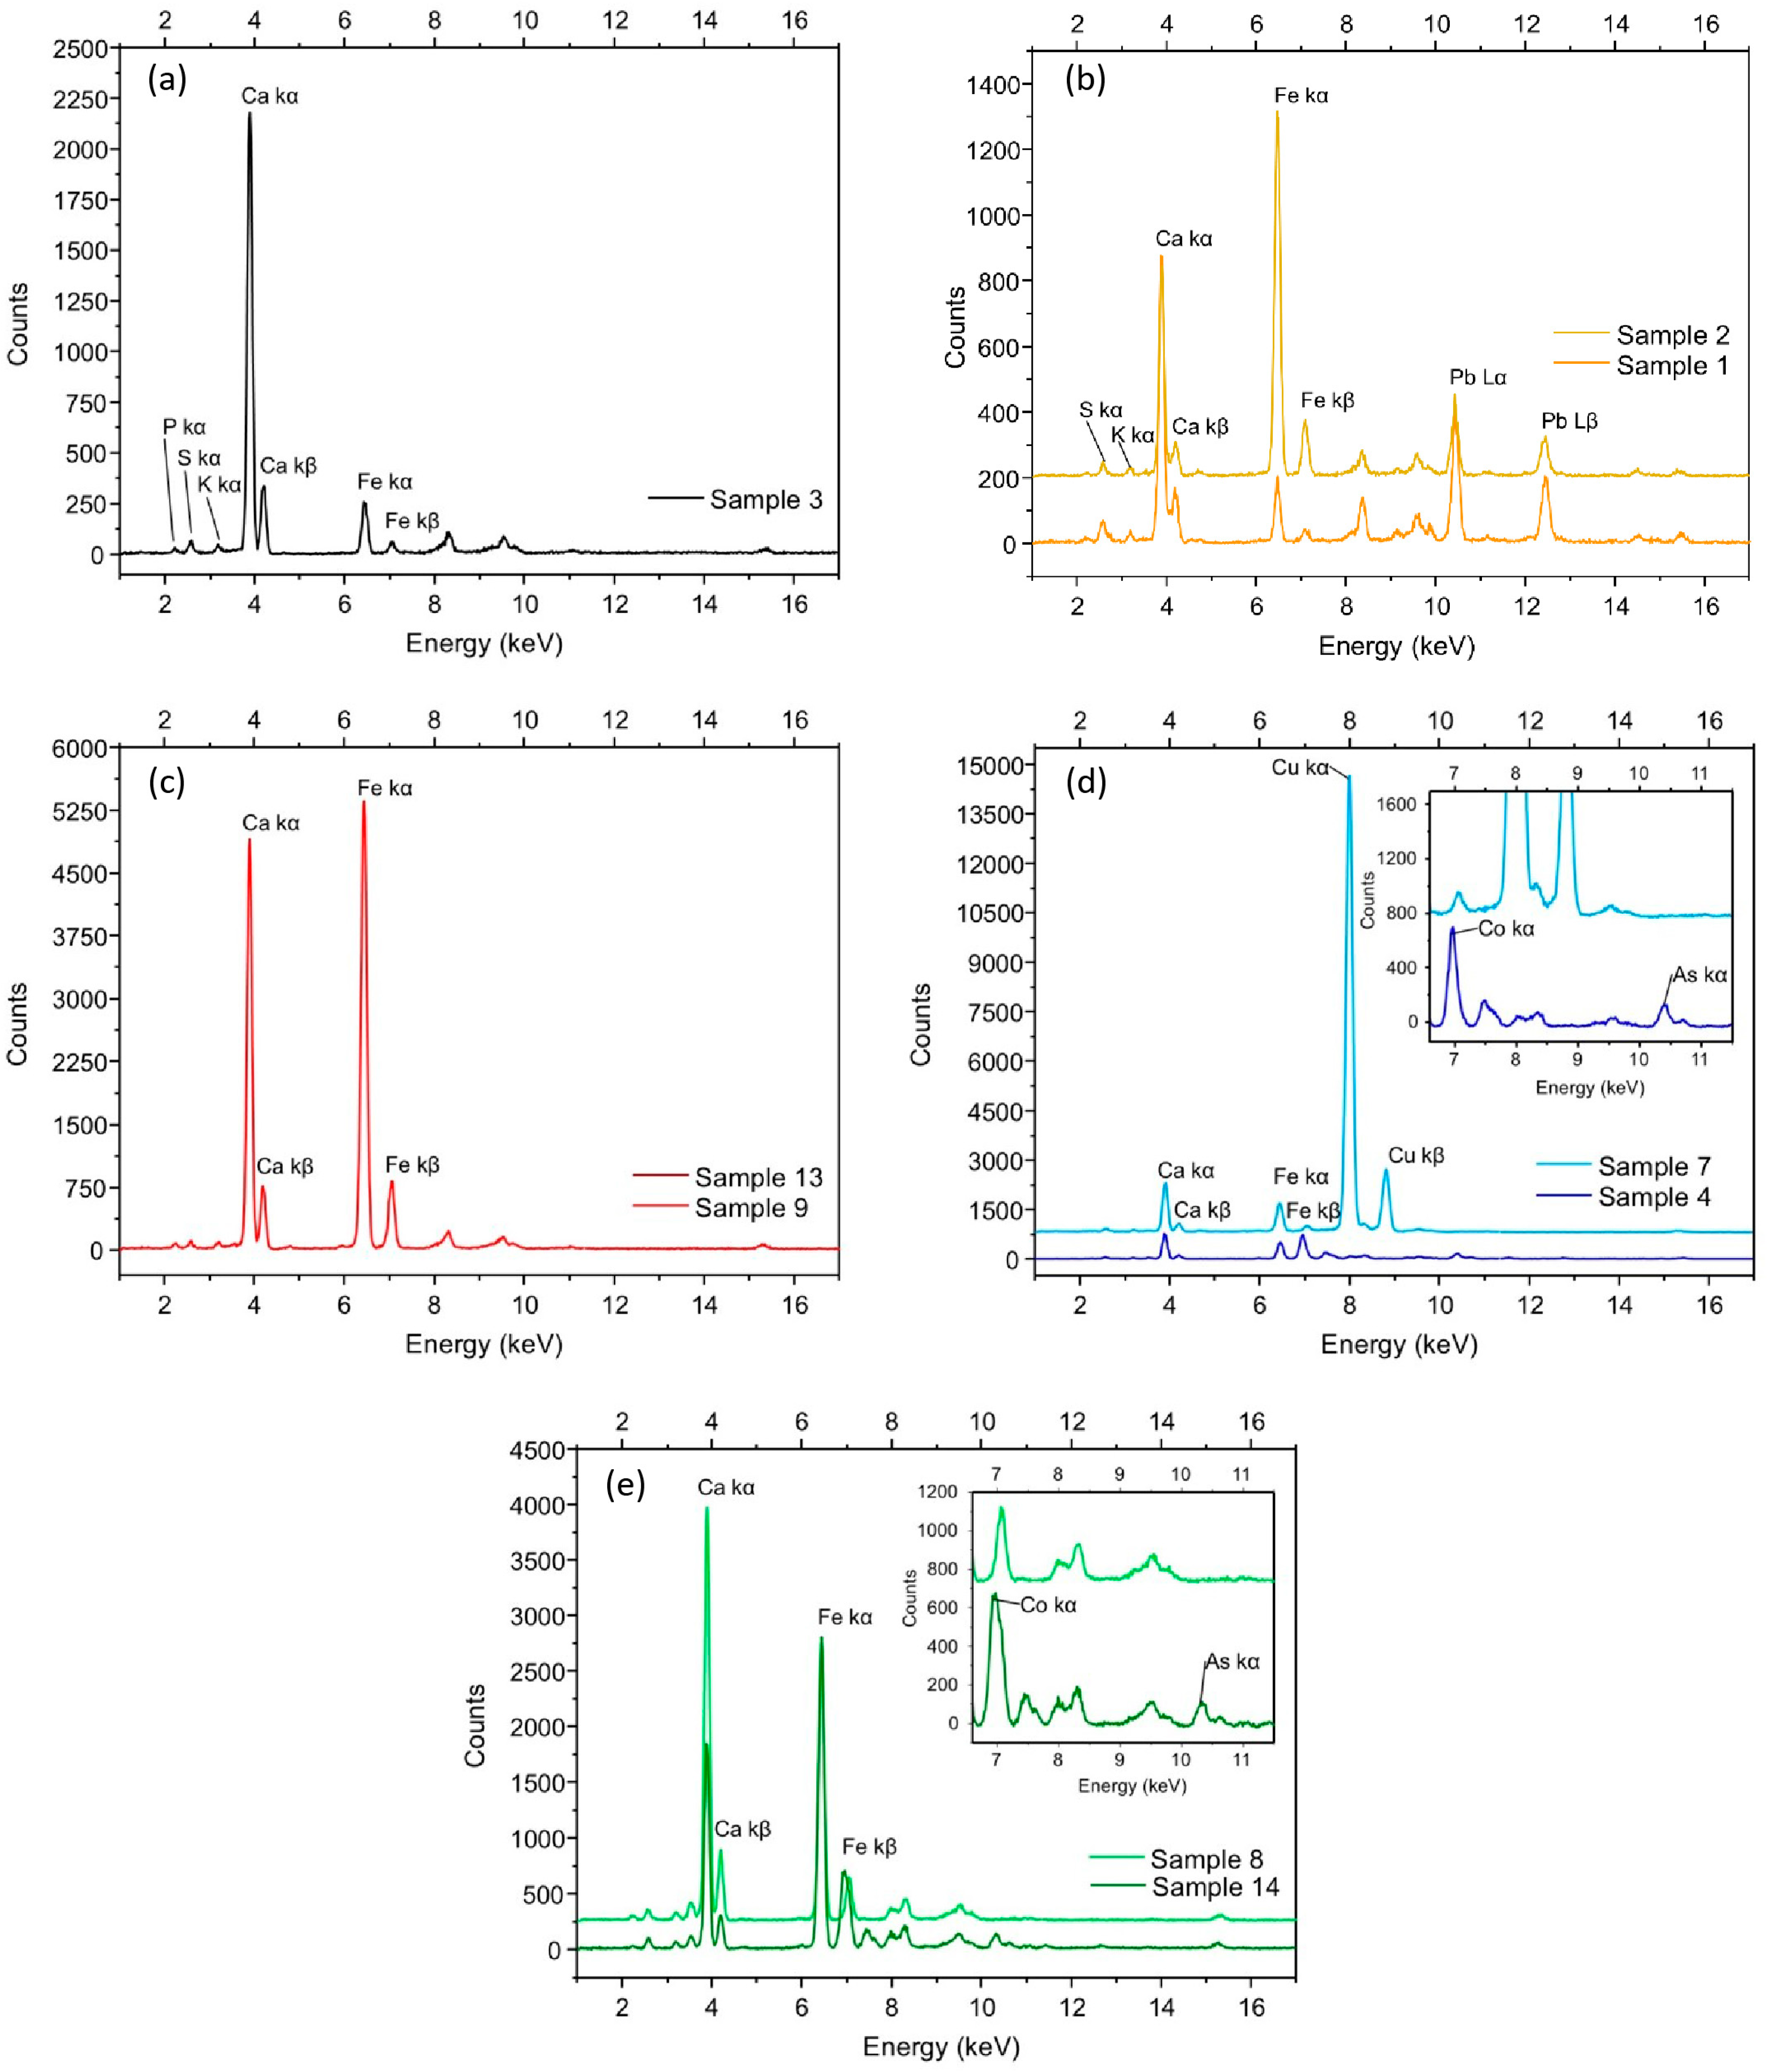
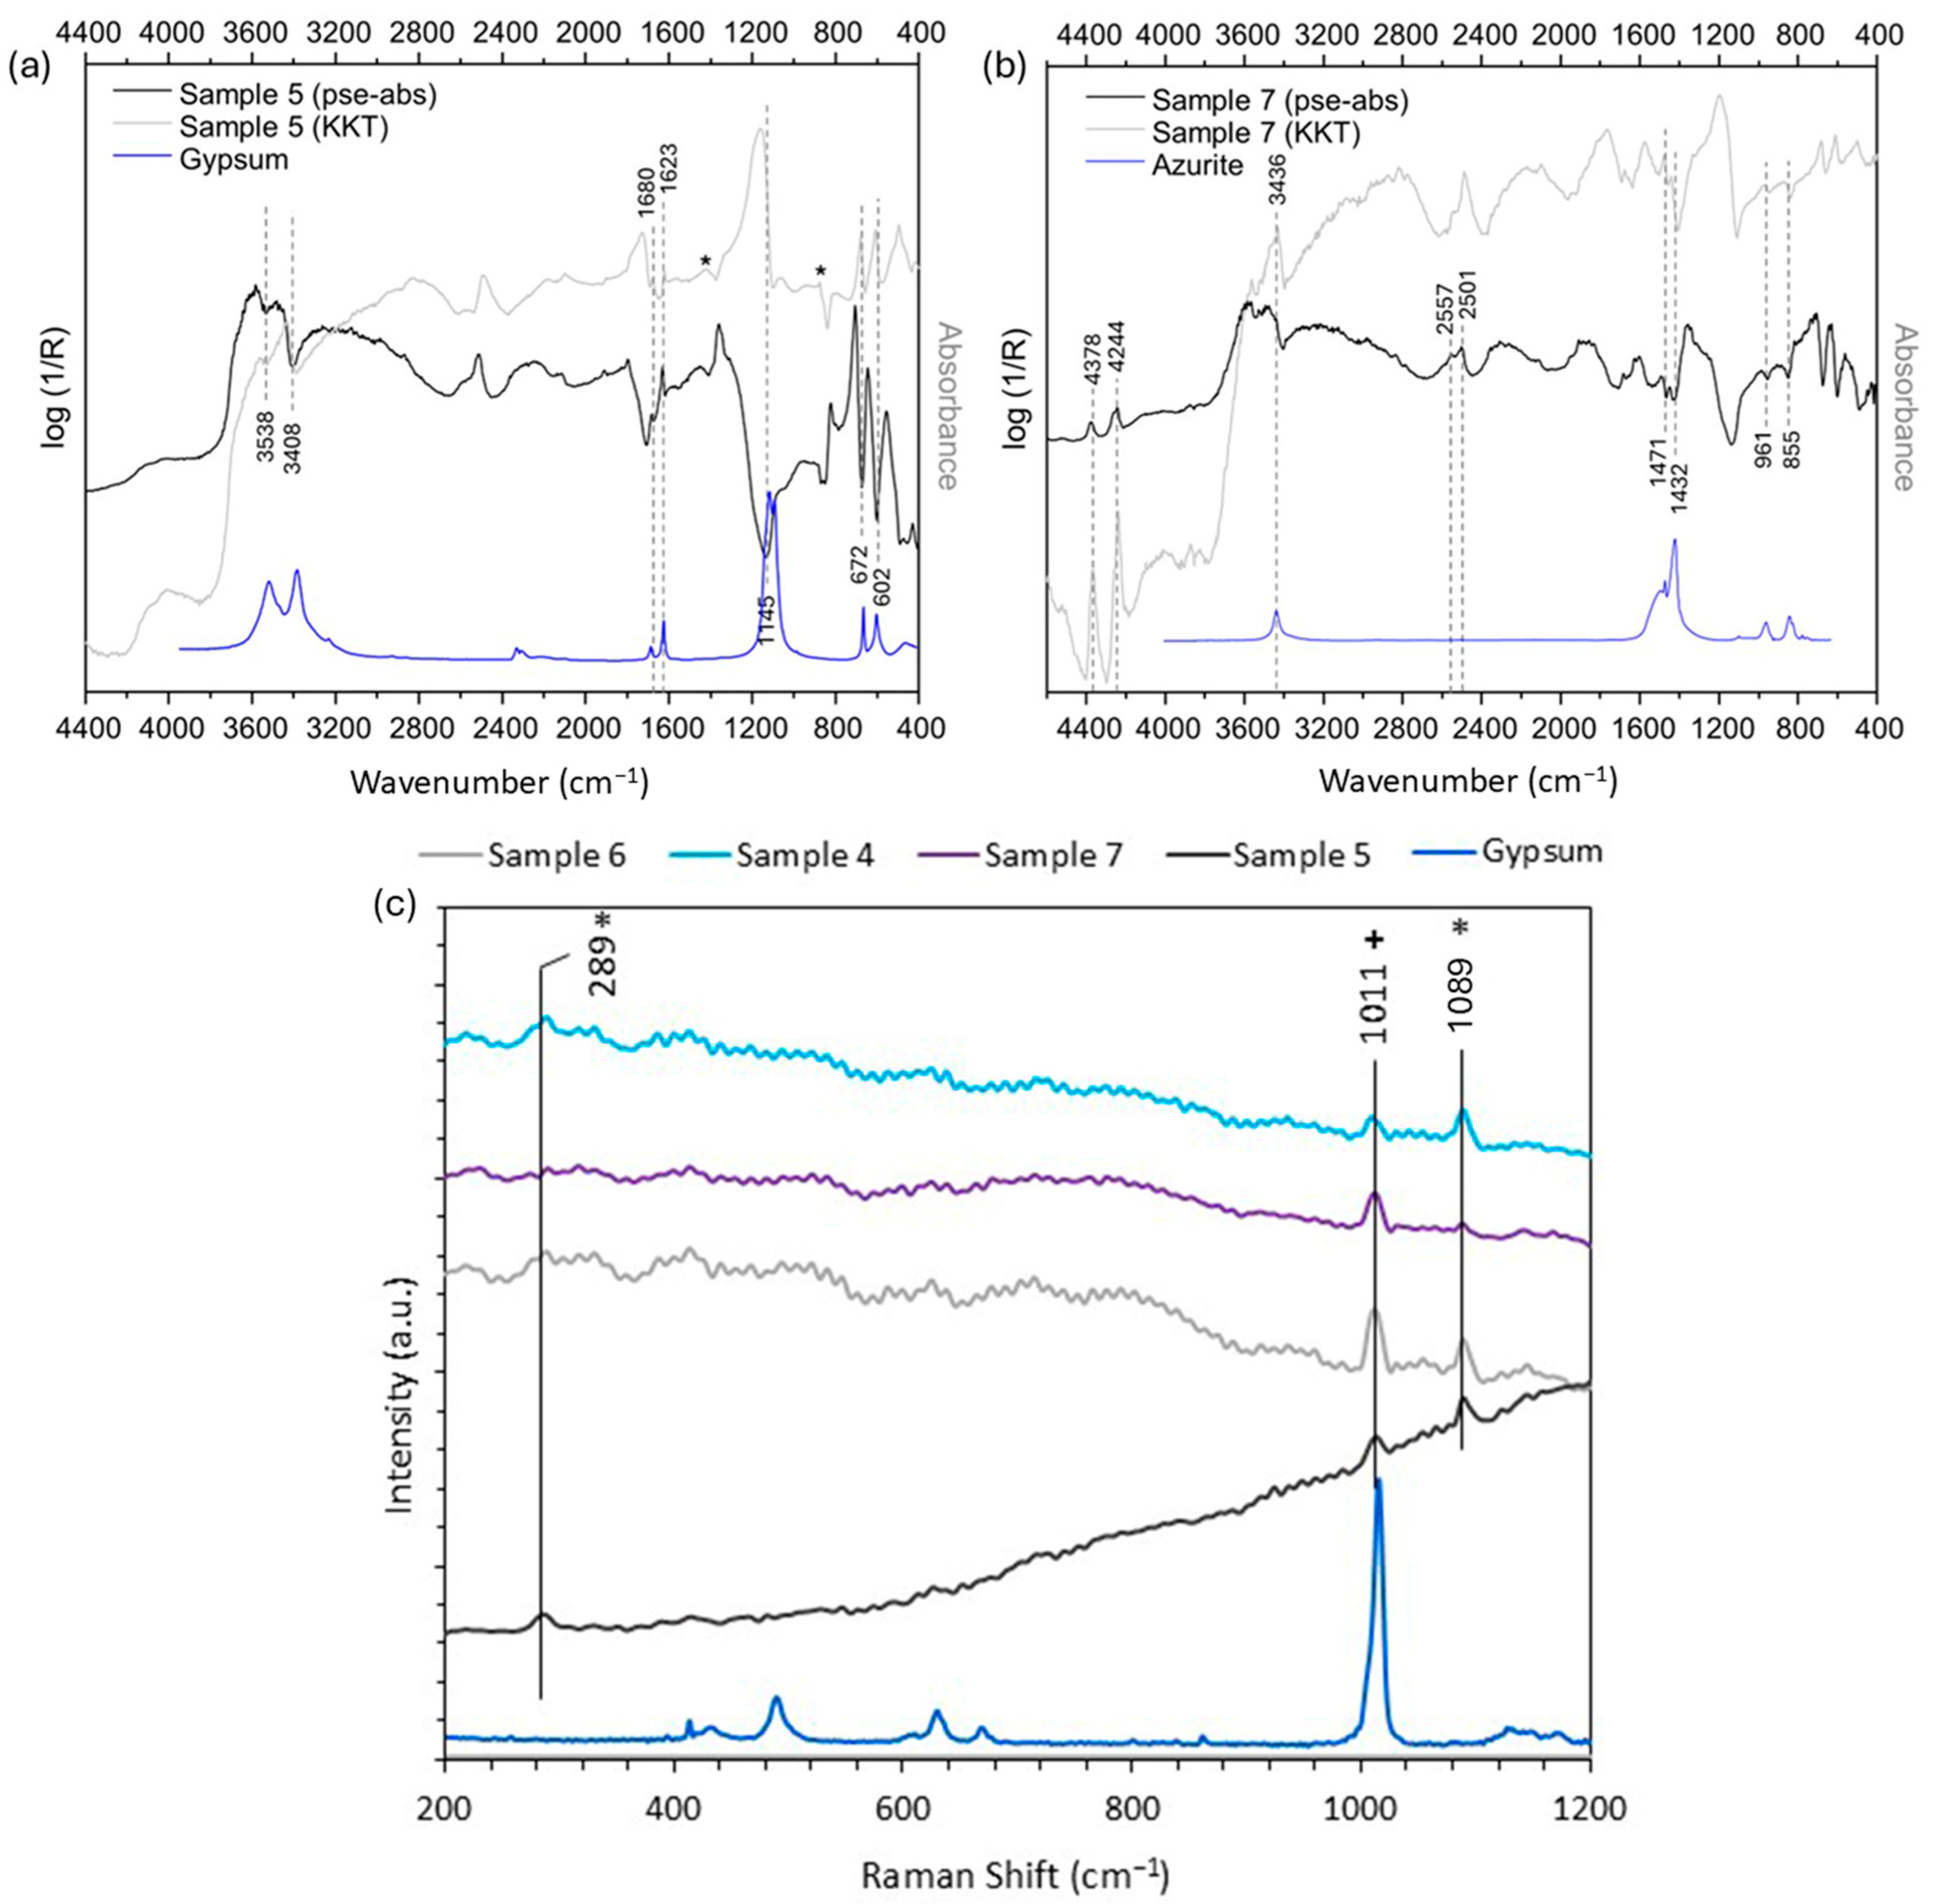
Similarly to The Marriage of the Virgin fresco, the analysis revealed predominant Ca signals with trace amounts of P and S from the plaster substrate in all samples (Figure 7). Complementary ER-FTIR and Raman spectroscopy analyses confirmed the widespread presence of calcium and gypsum (Figure 8a). Raman spectroscopy allowed to identify without any doubt the presence of calcite with its related bands centered at 289, 1089 cm−1 at every analyzed point [23], and also the significant presence of gypsum indicated by the characteristic band centered at 1011 cm−1 (Figure 8c) [16]. In the ER-FTIR spectra, it was possible to identify gypsum by characteristic bands at 3538 cm−1 and 3408 cm−1, corresponding to the O–H stretching vibrations of water molecules within its structure. Additionally, bands at 1680 cm−1 and 1623 cm−1 were assigned to the H–O–H bending vibrations of structural water molecules [30]. The asymmetric stretching vibration of the sulphate ion (SO42−) was observed at 1145 cm−1, while bands at 672 cm−1 and 602 cm−1 correspond to the bending vibrations of the sulphate ion [39]. The widespread presence of gypsum, regardless of the colour of the analysed area, suggests that gypsum formed at a later stage, as a degradation product, due to the transformation of calcium carbonate into calcium sulfate [25].
Analyses of white surfaces, such as flash tones and draperies (samples 3, 5, 6 and 10), revealed a composition dominated by calcium carbonate, with subordinate Fe signals likely resulting from a pink/red layer, possibly brown or red ochre (Figure 7a) [21]. Raman spectra revealed specifically the presence of hematite in this wall painting as well, especially in the area corresponding to sample 9, indicated by the bands centered at 231, 297, 413 cm−1 [17].
In the yellow regions (samples 1, 2 and 12), an intense Fe signal suggests the use of yellow ochre [21], both for Joseph’s mantle and in correspondence with the yellow dress of the figure in the lower left-hand part of the fresco. The decrease of Fe counts and the high amount of Pb and Sb confirm the application of Naples yellow on the lighter areas (sample 2) (Figure 7b) [21].
Red areas (samples 9 and 13) are characterized by elevated Fe counts, consistent with red earth use (Figure 7c).
Blue pigments, identified on Joseph’s robe and Mary’s mantle (samples 4, 7 and 11), primarily exhibit signals of Cu indicative of azurite (Cu3(CO3)2(OH)2) (Figure 7d). These findings were particularly evident in Mary’s mantle, where ER-FTIR analysis identified a band at 4378 cm−1 and 4244 cm−1, attributed to combination modes involving O–H stretching vibrations and overtones of hydroxyl asymmetric stretching vibrations [30]. The band at 3436 cm−1 corresponds to additional hydroxyl (O–H) stretching vibrations. Bands at 2557 cm−1 and 2501 cm−1 are associated with the combination of symmetric and asymmetric stretching modes of carbonate (CO32−) groups and hydroxyl units [40]. Further confirmation of azurite was provided by bands at 1471 cm−1 and 1432 cm−1, which correspond to the asymmetric stretching vibrations of the carbonate ions. Additionally, the band at 961 cm−1 was assigned to the O–H out-of-plane bending vibration, while the 855 cm−1 band was associated with the out-of-plane bending mode of the carbonate ions in azurite (Figure 8b) [29]. On Joseph’s robe and the black on blue on Mary’s mantle (samples 4 and 11), elements as K, Co, Ni, and As suggest smalt use (Figure 7d) [21].
Green tones on Mary’s mantle (sample 8) display high Fe and Ca counts, suggesting green earth’s use [21]. On the other end, the green tones of the tree (sample 14) display elements typical of smalt, i.e., K, Co and As were also detected, implying a possible mixture of blue smalt and yellow ochre.
Again, it should be noted that due to operational constraints, not all areas were analyzed by ER-FTIR and Raman. Where acquired, spectra lacked diagnostic features, so pigment identification was primarily based on XRF. All characteristic vibrational bands observed by ER-FTIR and Raman spectroscopy are reported in Table S1.

3.2.2. Visible Reflectance Spectroscopy

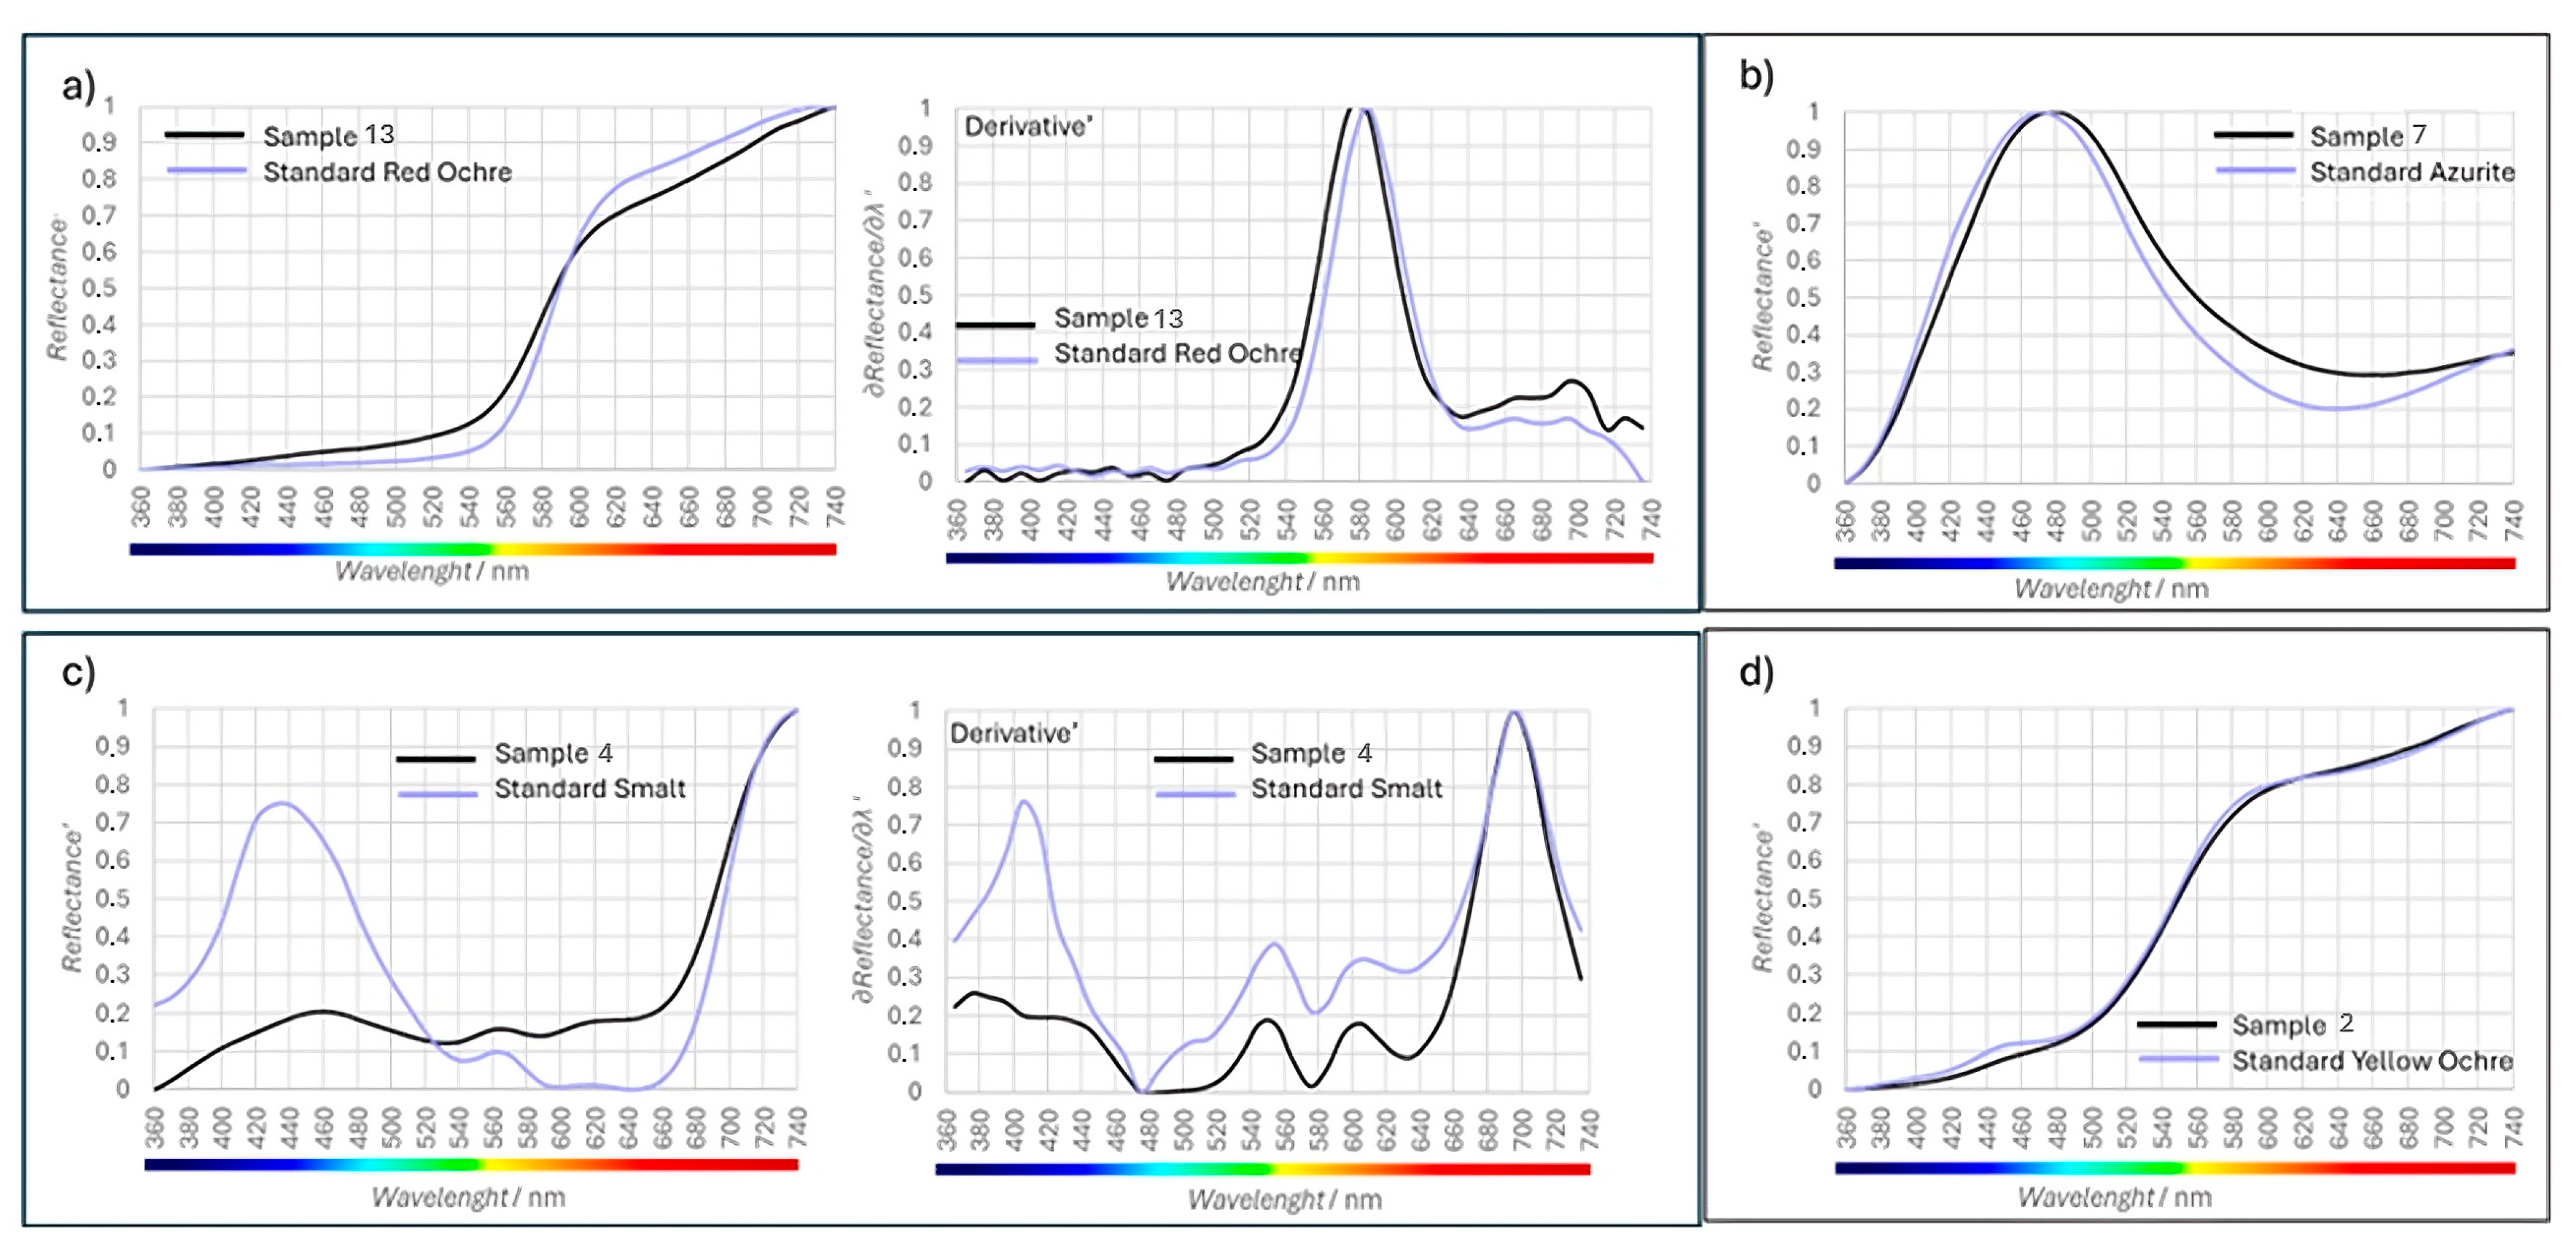
In this painting, as for the previous painting, the analyzed points have been divided into color groups. The red areas, corresponding to samples 9 and 13, show the presence of red ochre in sample 13 (Figure 9a), which is much brighter from the beginning compared to the other; red ochre mixed with a brown (or Siena earth) in sample 9.
In the blue samples, it’s possible to recognize the presence of azurite in the areas located on Mary’s mantle (samples 7 and 11) (Figure 9b). In these spectra, the typical reflectance peak at 480 nm and absorption at 640 nm can be observed [36]. As for the other blue area corresponding to sample 4, located on Saint Joseph’s arm (Figure 9c), the presence of smalt was detected. The spectrum shows, as in the previous fresco, a reflectance peak at 460 nm, followed by three absorptions at 540 nm, 590 nm, and 650 nm.
In sample 5, the flesh tone of the Child, the presence of red ochre mixed with yellow ochre is recognizable, and in sample 2 (Figure 9d), located on the yellow part of Joseph’s mantle, the presence of yellow ochre has been highlighted.

3.2.3. Hyperspectral Imaging

In The Adoration of the Child Christ, hyperspectral datacubes were acquired and analyzed from three zoomed areas of the fresco, representing Joseph, the bottom part of Joseph’s robe, Mary and the bottom part of Mary’s mantle. Results obtained from Joseph vest and Mary (rectangles A and D in Figure 2) are reported in Figure 8 and Figure 9, while other maps (rectangles B and C in Figure 2) are reported in Supplementary Materials (Figures S1 and S2).
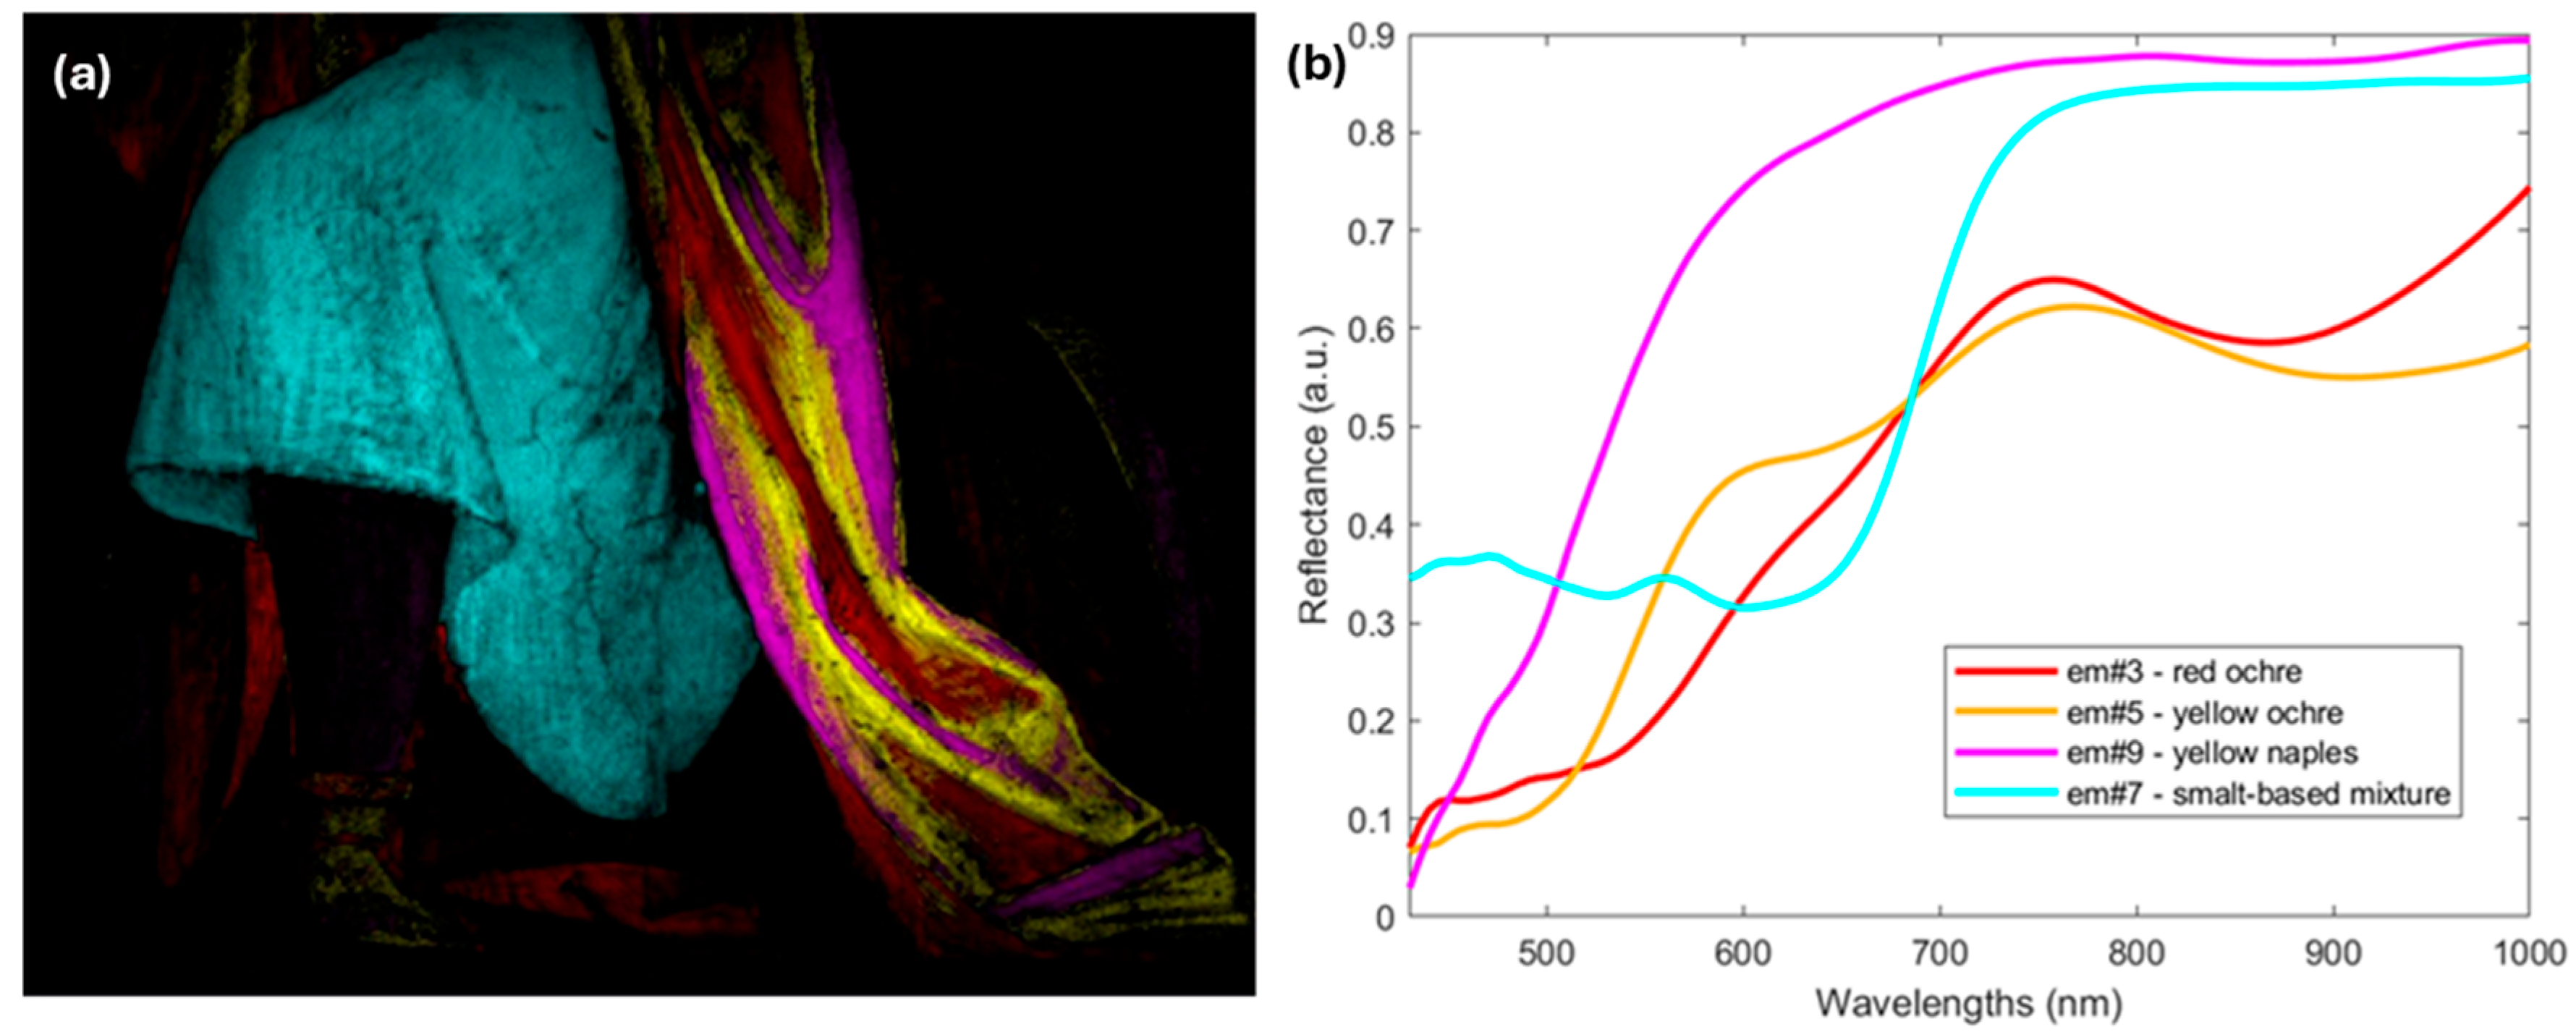
The use of hyperspectral imaging allowed to highlight the painting technique used by the artist, which employs three distinct pigments to create contrasting shadows and light areas. The darker areas are rendered with red ochre, while the lighter areas incorporate yellow ochre and yellow Naples to enhance brightness, as shown by the map in Figure 10a.
The spectra of the red and yellow endmembers reported in Figure 10b and Figure 11b can be related to ochre pigments, consistent with the red and yellow pigments previously found in The Marriage of the Virgin. In addition, a different endmember (em#9) is found in lighter areas of Joseph’s mantle along with yellow ochre, as shown in the distribution map of Figure 10a. The reflectance spectrum in the visible-to-near-infrared (VIS-NIR) region is different from that of yellow ochre, displaying fewer spectral features. Unlike yellow ochre, this spectrum is characterized solely by a steep absorption edge around 510 nm (Figure 10b). Consequently, the identification based on the VIS-NIR spectral range remains challenging, although the presence of Pb and Sb detected by XRF suggests the presence of a Pb-Sb yellow, such as Naples yellow [41].
The endmember related to the green pigment is found in the border of Mary’s mantle and for her skin tones. The extracted green spectrum displays a double absorption band at 710 and 920 nm, along with an absorption feature at shorter wavelengths and a reflection maximum of around 570 nm. In combination with the detection of Fe by XRF, the results suggest the possible presence of a green earth pigment.
In this fresco, similarly to The Marriage of the Virgin, a difference in the blues used for Mary’s and Joseph’s mantles can be observed. The light blue endmember suggests the presence of a smalt-based paint mixture in lighter areas, as previously reported for the other fresco. In Mary’s mantle, a second blue spectrum reported in Figure 11b exhibits a different spectral response, characterized by a reflection minimum at 640 nm and a lower reflectance in the red and near-infrared, which is indicative of azurite pigment rather than lapis lazuli [36,42], as shown in the spectra in Figure 11b.

4. Discussion

The identification of pigments used in the analyzed frescoes must be considered within the historical context of materials available during the Renaissance period. Comparing the findings of this study with the reference literature, a strong correlation was found between the pigments identified and historically documented pigments commonly used by Italian artists in the 15th and 16th centuries in Lombardy, in both fresco and dry painting techniques [43,44]. Iron oxide-based ochres, lead-based whites, and copper-based blues are consistent with traditional recipes recorded in manuals of the time, such as those by Cennino Cennini [31].
When comparing the two frescoes under investigation, a notable characteristic of The Adoration of the Christ Child, located outside the sanctuary, is the abundant presence of gypsum. This finding aligns with well-documented degradation mechanisms in outdoor frescoes, where atmospheric sulfur dioxide (SO2) reacts with calcium carbonate (CaCO3) in the plaster to produce gypsum (CaSO4·2H2O) [45]. Specifically, SO2 is oxidized and hydrated to form sulfuric acid, which then converts calcite into gypsum, degrading the surface integrity of the fresco [46]. Such sulfatation processes are intensified in outdoor environments due to higher pollutant exposure and weathering cycles.
To determine whether the two palettes resemble each other enough to suggest a common authorship or workshop, different areas in the frescoes were analyzed. Table 1 provides a comprehensive overview of the pigments identified. Spectroscopic analysis confirmed a similar use of pigments in both cases; they recognised the presence of the same carbonates, silicates, oxides and hydroxides-based pigments with some differences between the two paintings for blue areas. Lapis lazuli is found through ER-FTIR and visible reflectance spectroscopy only in The Marriage of the Virgin. On the other hand, azurite is more widely found in The Adoration of the Christ Child. Hyperspectral imaging highlighted pigment layering and spectral reflectance variations, particularly in shading techniques. In The Marriage of the Virgin, lapis lazuli is notably employed in the darker, shadowed regions, suggesting an intentional use aimed at creating shadows. While, in The Adoration of the Christ Child, azurite is used in shadowed regions, while the smalt-based pigment appears in brighter areas, including on an angel depicted in the background (see Figure S3). This variation likely reflects both artistic intent, aimed at achieving specific tonal contrasts, and environmental considerations. In particular, precious and light-sensitive pigments such as lapis lazuli were typically avoided in external frescoes, where exposure to sunlight and pollutants would have rapidly compromised their stability.
Additionally, in The Adoration of the Christ Child, the spatial distribution analysis provided insight into the technique used to achieve skin tones, which were rendered with red and green pigments [12], contributing to overall color harmony (see Figure S4).
These subtle differences in layering techniques could arise from variations in material sourcing, evolving workshop practices, or even later restorations. The stylistic approach to color mixing and shading, particularly in flesh tones and drapery, suggests at least a shared artistic lineage.

5. Conclusions

This diagnostic study on Bernardino Luini’s frescoes in the Santuario della Beata Vergine dei Miracoli at Saronno demonstrates the value of an integrated, non-invasive analytical approach, which allowed for a detailed characterization of the original materials and pigments present in wall paintings pictorial layers. The combined use of XRF, ER-FTIR, Raman, visible reflectance spectroscopies and Hyperspectral imaging enabled a detailed characterization of pigments and materials, while ensuring full preservation of the artworks.
The analysis confirmed the use of historically consistent pigments, such as calcium carbonate, ochres, Naples yellow, red and green earths, smalt, azurite and lapis lazuli, aligning with established Renaissance palettes. Notably, the results reveal nuanced aspects of Luini’s artistic practice: the deliberate use of mixed pigments to obtain subtle tonal transitions, the distinction between azurite and smalt in different contexts, and the strategic avoidance of costly and light-sensitive pigments, such as lapis lazuli, in exterior frescoes. These findings illustrate both technical mastery and practical adaptation to environmental conditions.
Comparison between the indoor (The Marriage of the Virgin) and outdoor (The Adoration of the Christ Child) wall paintings highlights significant differences in pigment choice and application strategies. However, these differences remain within the Renaissance context and may simply reflect artistic intent or the influence of environmental exposure. For this reason, a multidisciplinary and comprehensive study would be required to determine whether or not the painting The Adoration of the Christ Child can be attributed to the artist.
Beyond the material findings, this study highlights the importance of diagnostics as both a scientific and interpretive tool which is able to situate Luini’s paintings within the broader framework of Renaissance artistic practice, offering implications for art-historical interpretation. The meaningful variation in pigment choices can contribute to discussions on workshop practice and contextual adaptation.
Finally, this study provides a model applicable to similar investigations of mural cycles across Europe and in the world.

Supplementary Materials

The following supporting information can be downloaded at: https://www.mdpi.com/article/10.3390/coatings15091113/s1, Table S1: Characteristic vibrational bands of pigments and materials identified by ER-FTIR and Raman spectroscopy; Figure S1: Hyperspectral investigation of area B in The Adoration of the Christ Child; Figure S2: Hyperspectral investigation of area C in The Adoration of the Christ Child; Figure S3: Hyperspectral investigation of area A_1 in The Adoration of the Christ Child; Figure S4: Hyperspectral investigation of area A_2 in The Adoration of the Christ Child.

Author Contributions

Conceptualization, G.F., C.M. (Carlo Mariani), V.C., P.F. and M.M.; methodology, G.F., T.R., M.A., V.C. and V.G.; validation, G.F., V.C., C.M. (Curzio Merlo) and F.V.; investigation, M.A., T.R., C.M. (Curzio Merlo), F.V., C.L., C.A.L., A.B., M.B., M.G. and L.V.; data curation, E.V., C.A.L., S.S., L.V., G.F., V.G. and A.B.; writing—original draft preparation, E.V., S.S. and C.A.L.; writing—review and editing, M.A., C.M. (Curzio Merlo), F.V., C.L., V.C., P.F., A.B., V.G., M.B., C.M. (Carlo Mariani), L.V., M.G., T.R., M.M. and G.F.; visualization, E.V., S.S. and C.A.L.; supervision, G.F. and V.C. All authors have read and agreed to the published version of the manuscript.

Funding

This research received no external funding.

Institutional Review Board Statement

Not applicable.

Informed Consent Statement

Not applicable.

Data Availability Statement

The raw data supporting the conclusions of this article will be made available by the authors on request.

Acknowledgments

The authors wish to thank the Parish of the Sanctuary of the Beata Vergine dei Miracoli in Saronno for kindly providing access to their facilities and artworks.

Conflicts of Interest

Authors Lorenzo Vinco and Marta Ghirardello is employed by the NIREOS SRL Company. The remaining authors declare that the research was conducted in the absence of any commercial or financial relationships that could be construed as a potential conflict of interest.

References

  1. Ward, J. Fresco Painting, Its Art and Technique, with Special Reference to the Buono and Spirit Fresco Methods; Chapman and Hall, Ltd.: London, UK, 1909; Available online: http://archive.org/details/frescopaintingit00wardiala (accessed on 11 July 2025).
  2. Pini, V.; Sironi, G. Bernardino Luini: Nuovi Documenti per la Sua Biografia; NED: Milano, Italy, 1993. [Google Scholar]
  3. Agosti, G.; Stoppa, J. Bernardino Luini e i Suoi Figli; Officina Libraria: Milano, Italy, 2014. [Google Scholar]
  4. Perer, M.L.G. Il Santuario della Beata Vergine dei Miracoli di Saronno; ISAL: Cinisello Balsamo, Italy, 1996. [Google Scholar]
  5. Repishti, F. Il santuario della Beata Vergine dei Miracoli di Saronno. In Il Giovane Borromini. Dagli Esordi a San Carlo Alle Quattro Fontane; Skira: Milan, Italy, 1999; pp. 166–167. [Google Scholar]
  6. Fovo, A.D.; Mazzinghi, A.; Omarini, S.; Pampaloni, E.; Ruberto, C.; Striova, J.; Fontana, R. Non-invasive mapping methods for pigments analysis of Roman mural paintings’. J. Cult. Heritage 2020, 43, 311–318. [Google Scholar] [CrossRef]
  7. Fioretti, G.; Tempesta, G.; Capotorto, S.; Eramo, G. Non-Invasive Characterisation of the Wall Paintings in the Byzantine Church of Palazzo Simi (Bari, Italy) and Digital Photogrammetric Survey for a Pigment Mapping. Coatings 2023, 13, 996. [Google Scholar] [CrossRef]
  8. Picollo, M.; Cucci, C.; Casini, A.; Stefani, L. Hyper-Spectral Imaging Technique in the Cultural Heritage Field: New Possible Scenarios. Sensors 2020, 20, 2843. [Google Scholar] [CrossRef] [PubMed]
  9. Rousaki, A.; Vandenabeele, P. In situ Raman spectroscopy for cultural heritage studies. J. Raman Spectrosc. 2021, 52, 2178–2189. [Google Scholar] [CrossRef]
  10. Volpi, F.; Vagnini, M.; Vivani, R.; Malagodi, M.; Fiocco, G. Non-invasive identification of red and yellow oxide and sulfide pigments in wall-paintings with portable ER-FTIR spectroscopy. J. Cult. Herit. 2023, 63, 158–168. [Google Scholar] [CrossRef]
  11. Nardo, V.M.; Renda, V.; Bonanno, S.; Parrotta, F.; Anastasio, G.; Caponetti, E.; Saladino, M.L.; Vasi, C.S.; Ponterio, R.C. Non-invasive investigation of pigments of wall painting in S. Maria Delle Palate di Tusa (Messina, Italy). Heritage 2019, 2, 2398–2407. [Google Scholar] [CrossRef]
  12. Bonizzoni, L.; Gargano, M.; Ludwig, N.; Martini, M.; Galli, A. Looking for Common Fingerprints in Leonardo’s Pupils Using Nondestructive Pigment Characterization. Appl. Spectrosc. 2017, 71, 1915–1926. [Google Scholar] [CrossRef]
  13. de Queiroz Baddini, A.L.; de Paula Santos, J.L.V.; Tavares, R.R.; de Paula, L.S.; da Costa Araújo Filho, H.; Freitas, R.P. PLS-DA and data fusion of visible Reflectance, XRF and FTIR spectroscopy in the classification of mixed historical pigments. Spectrochim. Acta Part A Mol. Biomol. Spectrosc. 2022, 265, 120384. [Google Scholar]
  14. Volpi, F.; Fiocco, G.; Gargano, M.; Albano, M.; Calvia, A.; Saviotti, F.; Delledonne, C.; Lee, C.; Rovetta, T.; Malagodi, M. Unveiling materials and origin of reused medieval music parchments by portable XRF and ER-FTIR’. Microchem. J. 2024, 205, 111224. [Google Scholar] [CrossRef]
  15. Grassi, S.; Fiocco, G.; Invernizzi, C.; Rovetta, T.; Albano, M.; Davit, P.; Gulmini, M.; Stani, C.; Vaccari, L.; Licchelli, M.; et al. Managing complex Synchrotron radiation FTIR micro-spectra from historic bowed musical instruments by chemometrics. In Proceedings of the 2019 IMEKO TC-4 International Conference on Metrology for Archaeology and Cultural Heritage (MetroArchaeo 2019), Florence, Italy, 4–6 December 2019. [Google Scholar]
  16. Bell, I.M.; Clark, R.J.H.; Gibbs, P.J. Raman spectroscopic library of natural and synthetic pigments (pre- ≈ 1850 AD). Spectrochim. Acta Part A Mol. Biomol. Spectrosc. 1997, 53, 2159–2179. [Google Scholar] [CrossRef]
  17. Burgio, L.; Clark, R.J.H. Library of FT-Raman spectra of pigments, minerals, pigment media and varnishes, and supplement to existing library of Raman spectra of pigments with visible excitation. Spectrochim. Acta Part A Mol. Biomol. Spectrosc. 2001, 57, 1491–1521. [Google Scholar] [CrossRef]
  18. Perri, A.; de Faria, B.E.N.; Ferreira, D.C.T.; Comelli, D.; Valentini, G.; Preda, F.; Polli, D.; de Paula, A.M.; Cerullo, G.; Manzoni, C. Hyperspectral imaging with a TWINS birefringent interferometer. Opt. Express 2019, 27, 15956–15967. [Google Scholar] [CrossRef]
  19. Keshava, N.; Mustard, J.F. Spectral unmixing. IEEE Signal Process. Mag. 2002, 19, 44–57. [Google Scholar] [CrossRef]
  20. Winter, M.E. N-FINDR: An algorithm for fast autonomous spectral end-member determination in hyperspectral data. In Proceedings of the SPIE’s International Symposium on Optical Science, Engineering, and Instrumentation, Denver, CO, USA, 18–23 July 1999; pp. 266–275. [Google Scholar] [CrossRef]
  21. Bevilacqua, N.; Borgioli, L.; Gracia, I.A. I Pigmenti Nell’arte: Dalla Preistoria alla Rivoluzione Industrial; Il Prato: Veneto, Italy, 2010. [Google Scholar]
  22. Derrick, M.R.; Stulik, D.C.; Landry, J.M. (Eds.) Infrared spectroscopy in conservation science. In Scientific Tools for Conservation; Getty Conservation Institute: Los Angeles, CA, USA, 1999. [Google Scholar]
  23. Guglielmi, V.; Comite, V.; Andreoli, M.; Demartin, F.; Lombardi, C.A.; Fermo, P. Pigments on Roman Wall Painting and Stucco Fragments from the Monte d’Oro Area (Rome): A Multi-Technique Approach. Appl. Sci. 2020, 10, 7121. [Google Scholar] [CrossRef]
  24. Lombardi, C.A.; Comite, V.; Fermo, P.; Bergomi, A.; Trombino, L.; Guglielmi, V. A Multi-Analytical Approach for the Characterisation of Pigments from an Egyptian Sarcophagus Cover of the Late Dynastic Period: A Case Study. Sustainability 2023, 15, 2002. [Google Scholar] [CrossRef]
  25. Škapin, A.S.; Ropret, P.; Bukovec, P. Determination of pigments in colour layers on walls of some selected historical buildings using optical and scanning electron microscopy. Mater. Charact. 2007, 58, 1138–1147. [Google Scholar] [CrossRef]
  26. Piqué, F.; Verri, G. Organic Materials in Wall Paintings; Getty Conservation Institute: Los Angeles, CA, USA, 2015. [Google Scholar]
  27. Colomban, P.; Kırmızı, B.; Franci, G.S. Cobalt and Associated Impurities in Blue (and Green) Glass, Glaze and Enamel: Relationships between Raw Materials, Processing, Composition, Phases and International Trade. Minerals 2021, 11, 633. [Google Scholar] [CrossRef]
  28. Seldes, A.M.; Burucúa, J.E.; Maier, M.S.; Abad, G.; Jáuregui, A.; Siracusano, G. Blue pigments in South American painting (1610–1780). J. Am. Inst. Conserv. 1999, 38, 100. [Google Scholar] [CrossRef]
  29. Bruni, S.; Cariati, F.; Casadio, F.; Toniolo, L. Spectrochemical characterization by micro-FTIR spectroscopy of blue pigments in different polychrome works of art. Vib. Spectrosc. 1999, 20, 15–25. [Google Scholar] [CrossRef]
  30. Miliani, C.; Rosi, F.; Daveri, A.; Brunetti, B. Reflection infrared spectroscopy for the non-invasive in situ study of artists’ pigments. Appl. Phys. A 2011, 106, 295–307. [Google Scholar] [CrossRef]
  31. Cennini, C. Il Libro Dell’arte; F. Le Monnier: Firenze, Italy, 1859. [Google Scholar]
  32. Sandu, I.; Paba, F.; Murta, E.; Pereira, M.; Ribeiro, C. Travelling Beneath the Gold Surface—Part I: Study and Characterization of Laboratory Reconstructions of Portuguese Seventeenth and Eighteenth Centuries Ground and Bole Layers. e-Conserv. J. 2014, 2, 95–115. [Google Scholar] [CrossRef]
  33. Izzo, F.C.; Capogrosso, V.; Gironda, M.; Alberti, R.; Mazzei, C.; Nodari, L.; Gambirasi, A.; Zendri, E.; Nevin, A. Multi-analytical non-invasive study of modern yellow paints from postwar Italian paintings from the International Gallery of Modern Art Cà Pesaro, Venice. X-Ray Spectrom. 2015, 44, 296–304. [Google Scholar] [CrossRef]
  34. Grissom, C.A. Green Earth. In Artists’ Pigments: A Handbook of Their History and Characteristics; Archetype Publications: London, UK, 1986; Volume 1, pp. 141–168. [Google Scholar]
  35. Knuutinen, U.; Mannerheimo, H.; Hornytzkyj, S. Project Report of Pigment Analyses of the Fourth Style Wall Paintings in the Casa di Marco Lucrezio (IX 3, 5.24) in Pompeii; EVTEK University of Applied Sciences: Helsinki, Finland, 2007. [Google Scholar]
  36. Aceto, M.; Agostino, A.; Fenoglio, G.; Idone, A.; Gulmini, M.; Picollo, M.; Ricciardi, P.; Delaney, J.K. Characterisation of colourants on illuminated manuscripts by portable fibre optic UV-visible-NIR reflectance spectrophotometry. Anal. Methods 2014, 6, 1488–1500. [Google Scholar] [CrossRef]
  37. Appolonia, L.; Vaudan, D.; Chatel, V.; Aceto, M.; Mirti, P. Combined use of FORS, XRF and Raman spectroscopy in the study of mural paintings in the Aosta Valley (Italy). Anal. Bioanal. Chem. 2009, 395, 2005–2013. [Google Scholar] [CrossRef] [PubMed]
  38. Cavaleri, T.; Giovagnoli, A.; Nervo, M. Pigments and Mixtures Identification by Visible Reflectance Spectroscopy. Procedia Chem. 2013, 8, 45–54. [Google Scholar] [CrossRef]
  39. Anbalagan, G.; Mukundakumari, S.; Murugesan, K.S.; Gunasekaran, S. Infrared, optical absorption, and EPR spectroscopic studies on natural gypsum. Vib. Spectrosc. 2009, 50, 226–230. [Google Scholar] [CrossRef]
  40. Ricci, C.; Miliani, C.; Brunetti, B.G.; Sgamellotti, A. Non-invasive identification of surface materials on marble artifacts with fiber optic mid-FTIR reflectance spectroscopy. Talanta 2006, 69, 1221–1226. [Google Scholar] [CrossRef]
  41. Cloutis, E.; Norman, L.; Cuddy, M.; Mann, P. Spectral Reflectance (350–2500 nm) Properties of Historic Artists’ Pigments. II. Red–Orange–Yellow Chromates, Jarosites, Organics, Lead(–Tin) Oxides, Sulphides, Nitrites and Antimonates. J. Near Infrared Spectrosc. 2016, 24, 119–140. [Google Scholar] [CrossRef]
  42. Wu, T.; Yuan, B.; Wang, S.; Li, G.; Lei, Y. A Normalized Difference Spectral Recognition Index for Azurite Pigment. Appl. Spectrosc. 2020, 74, 571–582. [Google Scholar] [CrossRef]
  43. Fiocco, G.; Albano, M.; Merlo, C.; Rovetta, T.; Lee, C.; Volpi, F.; Bergomi, A.; Pini, C.A.; Lombardi, C.A.; Mariani, C.; et al. Non-invasive characterization of Bernardino Luini’s color palette: A spectroscopic campaign on the frescos of Santuario della Beata Vergine dei Miracoli in Saronno (Italy). In Proceedings of the 2022 IMEKO TC-4, International Measurement Confederation on Metrology for Archaeology and Cultural Heritage (IMEKO), Calabria, Italy, 19–21 October 2022; pp. 111–115. [Google Scholar]
  44. Merrifield, M.P. The Art of Fresco Painting: As Practised by the Old Italian and Spanish Masters, with a Preliminary Inquiry into the Nature of the Colours Used in Fresco Painting, with Observation and Notes; C. Gilpin: London, UK, 1846. [Google Scholar]
  45. Malin, M.J. The Chemistry and Mechanism of Art Materials: Unsuspected Properties and Outcomes; CRC Press: Boca Raton, FL, USA, 2021. [Google Scholar]
  46. Yan, Y.; Wang, Y. A Review of Atmospheric Deterioration and Sustainable Conservation of Calcareous Stone in Historical Buildings and Monuments. Sustainability 2024, 16, 10751. [Google Scholar] [CrossRef]
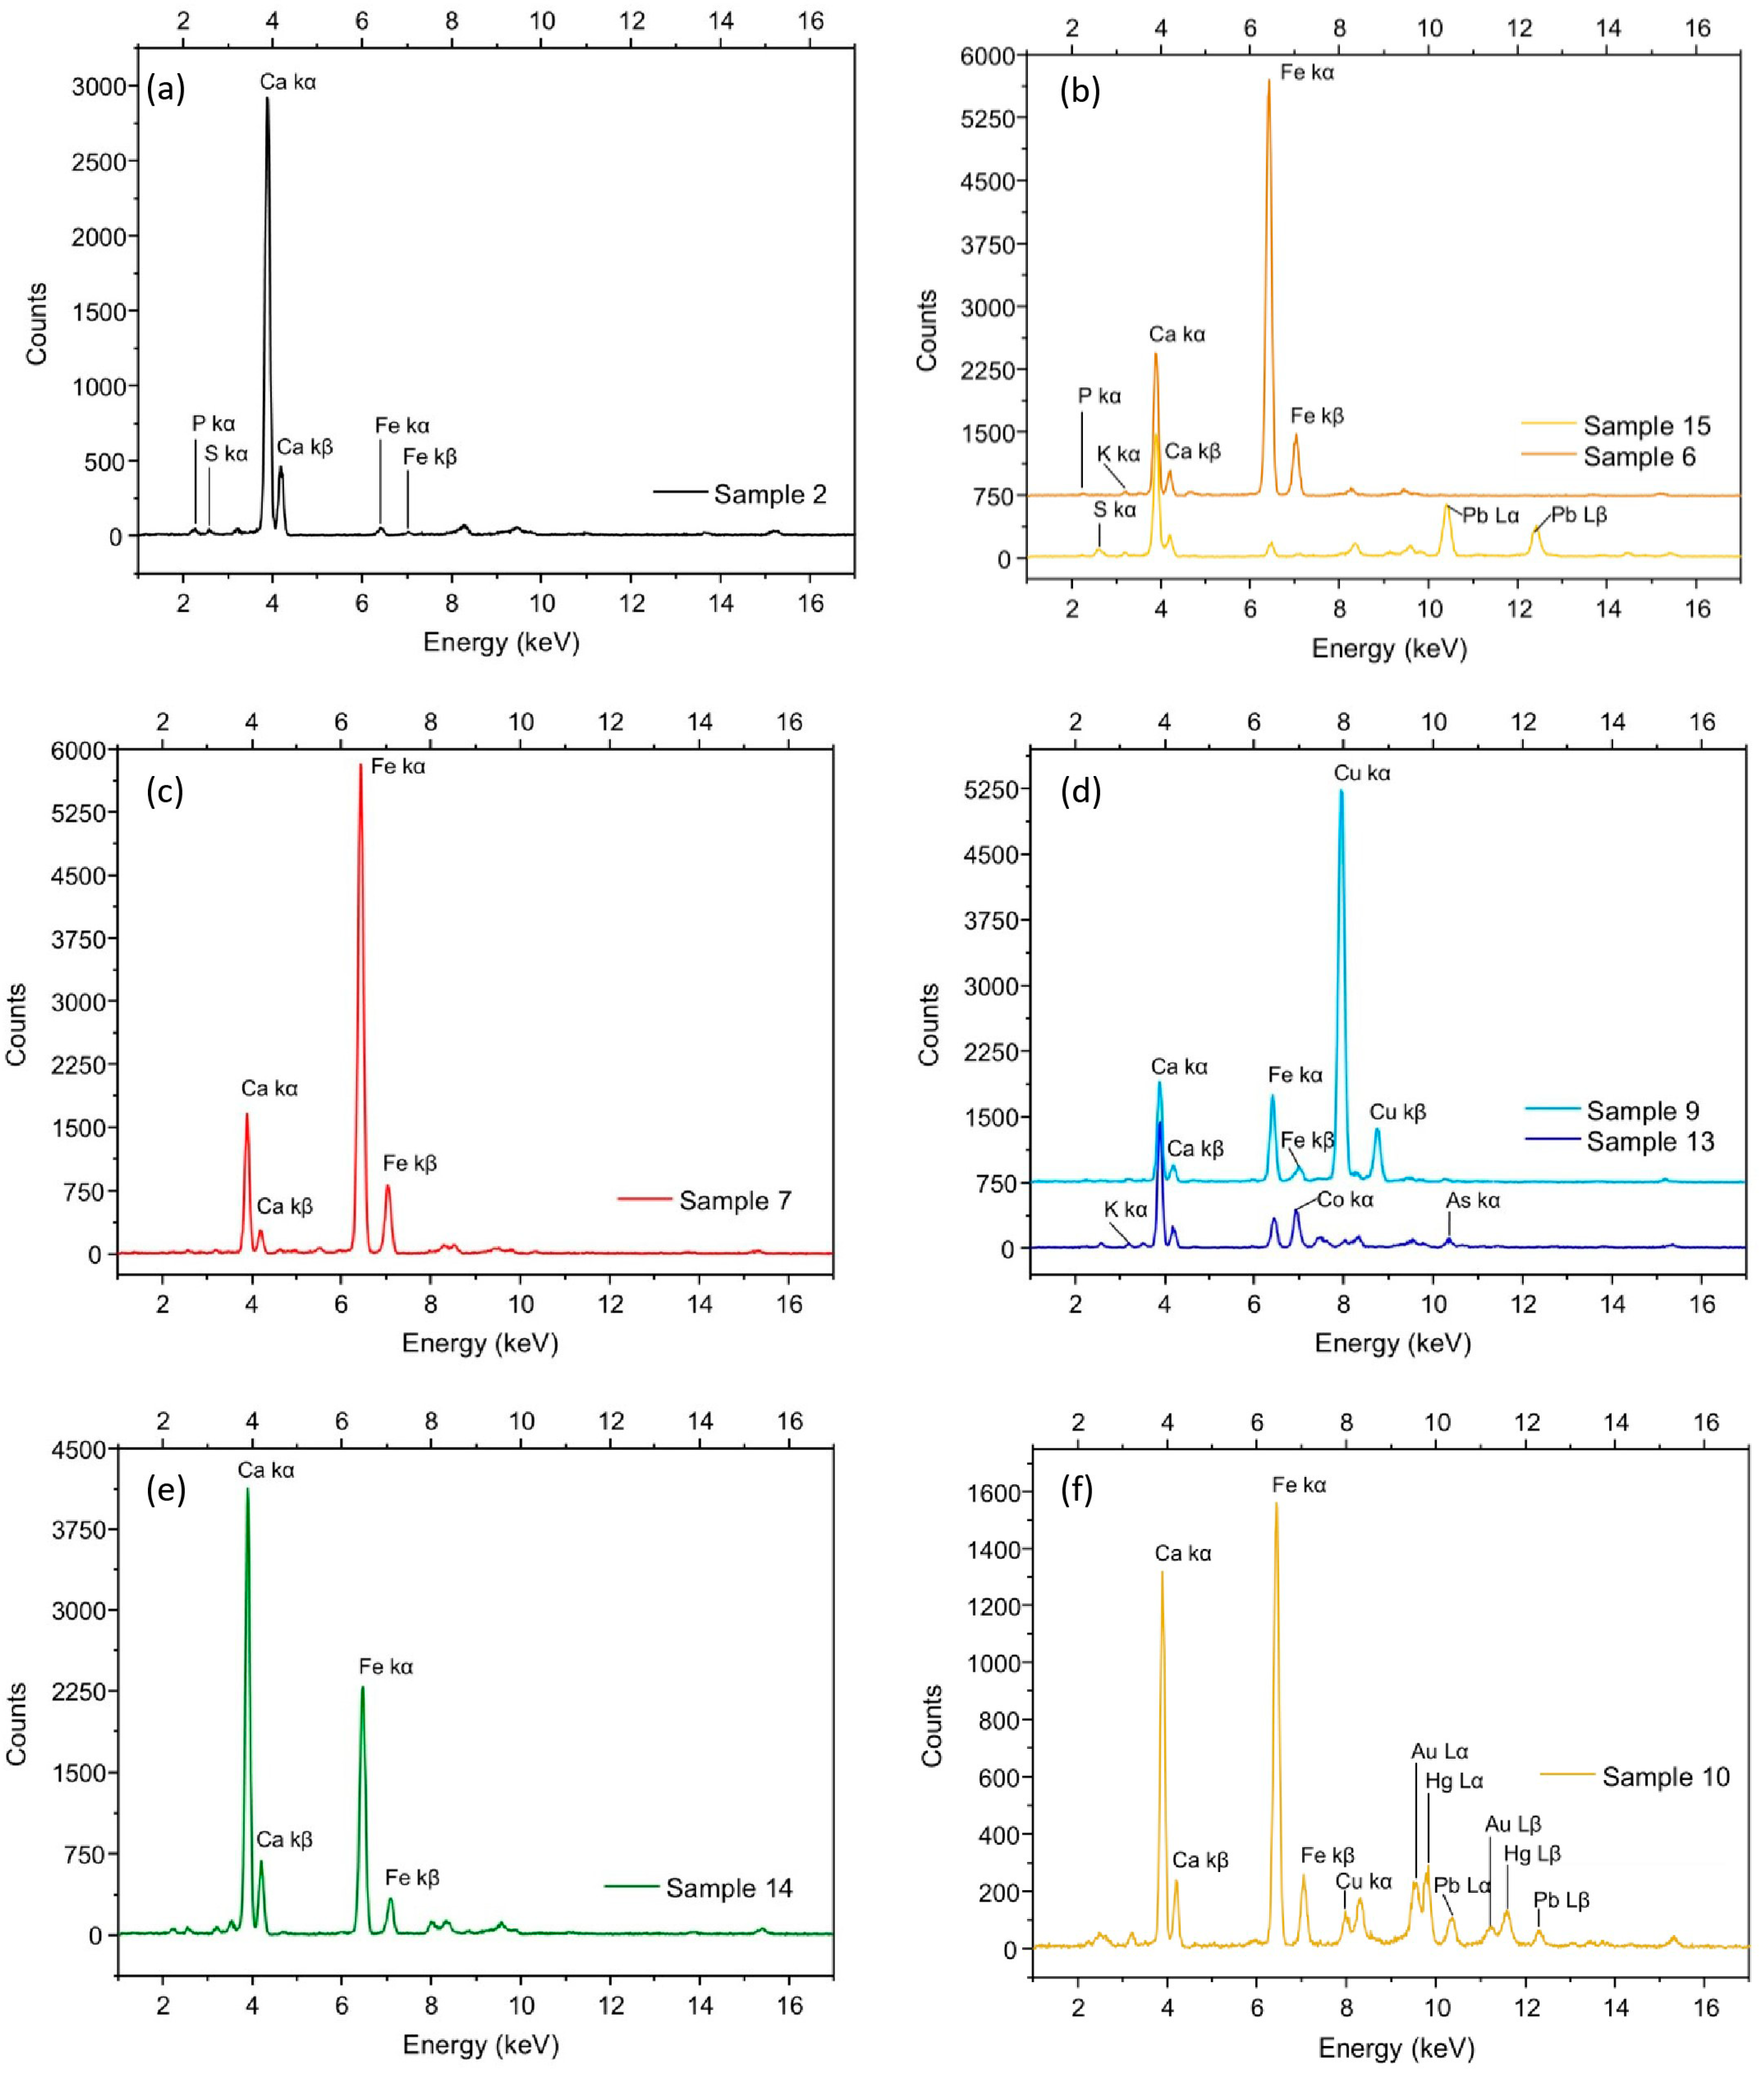
Figure 3. XRF spectra acquired on The Marriage of the Virgin: (a) the white area corresponding to sample 2, (b) the yellow areas corresponding to samples 6 and 15, (c) the red area corresponding to sample 7, (d) the blue areas corresponding to samples 9 and 13, (e) the green area corresponding to sample 14 and (f) the golden area corresponding to sample 10.
Coatings 15 01113 g003
Figure 4. ER-FTIR spectra in external reflection mode (black) and after KKT correction (grey) acquired on The Marriage of the Virgin for: (a) the white area corresponding to sample 2, with marker bands for calcium carbonate (dotted lines), for gypsum (asterisks) and for oxalates (triangles), reference spectrum of calcite (blue) is shown for comparison; (b) the blue area corresponding to sample 5, with marker bands for lapis lazuli (dotted lines), reference spectrum of lapis lazuli (blue) is shown for comparison. Raman spectra of (c) samples 4 and 7 showing the presence of hematite (open circles) and of (d) samples 2, 8 and 11 showing the presence of calcite (asterisks), reference spectra of hematite and calcite are shown for comparison. The reference spectra displayed in each graph are taken from the laboratory’s internal database.
Coatings 15 01113 g004
Figure 5. Spectra obtained by visible reflectance analyses of The Marriage of the Virgin fresco, compared to the respective normalised spectra of the standard pigments of the following analyzed points: (a) sample 7 localized on a red area, (b) sample 15 localized on a yellow area, (c) sample 17 localized on a green area, (d) sample 14 localized on a green area, (e) sample 5 localized on a blue area and (f) sample 9 localized on a blue area.
Coatings 15 01113 g005
Figure 6. (a) RGB reconstructed image of the investigated area in The Marriage of the Virgin fresco. (b) Map displaying the abundance of endmembers. (c) Spectra of the endmembers extracted using the applied spectral unmixing method.
Coatings 15 01113 g006
Figure 7. XRF spectra acquired on The Adoration of the Christ Child corresponding to: (a) the white area corresponding to sample 3, (b) the yellow areas corresponding to samples 1 and 2, (c) the red area corresponding to sample 9, (d) the blue areas corresponding to samples 4 and 7 and (e) the green areas corresponding to samples 8 and 14. Insets in (d, e) show the 6.5–11.5 keV range enlarged to highlight characteristic elemental peaks.
Coatings 15 01113 g007
Figure 8. ER-FTIR spectra in external reflection mode (black) and after KKT correction (grey) acquired on The Adoration of the Christ Child for: (a) the white area corresponding to sample 5, with marker bands for gypsum (dotted lines) and for calcium carbonate (asterisks), reference spectrum of gypsum (blue) is shown for comparison; (b) the blue area corresponding to sample 7, with marker bands for azurite (dotted lines), reference spectrum of azurite (blue) is shown for comparison. (c) Raman spectra of samples 4, 5, 6 and 7 showing the presence of calcite (*) and gypsum (+), reference spectrum of gypsum (blue) is shown for comparison. The reference spectra displayed in each graph are taken from the laboratory’s internal database.
Coatings 15 01113 g008
Figure 9. Visible reflectance spectra acquired on selected areas of The Adoration of the Christ Child, compared to the respective normalised spectra of the standard pigments: (a) sample 13, red on the small figure on the left, (b) sample 7, blue on Mary’s mantle, (c) sample 4, blue on Joseph’s robe and (d) sample 2, yellow on Joseph’s mantle.
Coatings 15 01113 g009
Figure 10. (a) Map displaying the abundance of red, yellow and blue endmembers. (b) Spectra of the endmembers extracted using the applied spectral unmixing method.
Coatings 15 01113 g010
Figure 11. (a) Map displaying the abundance of blue, green and red endmembers. (b) Spectra of the endmembers extracted using the applied spectral unmixing method.
Coatings 15 01113 g011
Table 1. Summary of pigments identified in Bernardino Luini’s frescoes, The Marriage of the Virgin and The Adoration of the Christ Child, with corresponding detection by analytical techniques.
ColorMarriage of the VirginAdoration of the Christ ChildXRFRamanER-FTIRVisible
Reflectance
HyperspectralPigment
Identified
White Calcium Carbonate
Yellow Yellow Ochre
Naples Yellow
Red Red Ochre
Blue Smalt
Azurite
Lapis Lazuli
Green Green Earth
Smalt + Yellow Ochre *
Purple Smalt + Red Ochre *
Gold Gold Leaf
* Mixed pigments were identified based on combined spectral features.
Disclaimer/Publisher’s Note: The statements, opinions and data contained in all publications are solely those of the individual author(s) and contributor(s) and not of MDPI and/or the editor(s). MDPI and/or the editor(s) disclaim responsibility for any injury to people or property resulting from any ideas, methods, instructions or products referred to in the content.