Article

Quantifying Moisture Susceptibility in Asphalt Mixtures Using Dynamic Mechanical Analysis

1
Shandong Transportation Institute, Jinan 250102, China
2
China Railway 14th Bureau Group Corporation Limited, Jinan 250101, China
3
Research Institute of Highway Ministry of Transport, Beijing 100088, China
*
Author to whom correspondence should be addressed.
Coatings 2025, 15(9), 1109; https://doi.org/10.3390/coatings15091109
Submission received: 4 September 2025 / Revised: 18 September 2025 / Accepted: 19 September 2025 / Published: 21 September 2025

Abstract

Moisture damage remains a primary distress mechanism in asphalt pavements, leading to reduced service life and viscoelastic property loss due to weakened asphalt–aggregate adhesion. This study evaluated moisture susceptibility in eight asphalt mixtures combining two aggregates (limestone/granite) and four binders (two neat, two SBS-modified) using dynamic mechanical analysis (DMA). Thin-section specimens underwent DMA temperature sweeps under dry and water-immersed conditions to characterize shifts in viscoelastic properties. Results demonstrated that moisture exposure significantly reduced complex modulus values and shifted characteristic temperatures (T0, T1, T2, Tg) toward lower ranges, indicating compromised performance. Specifically, granite mixtures showed average reductions in T0, T1, and Tg of 2.9 °C, 1.8 °C, and 3.7 °C, respectively, compared to 2.1 °C, 1.5 °C, and 1.7 °C for limestone mixtures. The magnitude of these changes—quantified by residual modulus (RM) ratios and characteristic temperature differentials—effectively ranked mixture susceptibility, with granite mixtures and specific binders (A1, B1) showing higher sensitivity. Notably, minimum residual modulus (RMmin) values ranged from 28.2% to 65.8%, and its critical temperature (TRM) identified the most severe moisture damage conditions (approximately 40 °C for neat asphalt; 60 °C for modified asphalt). The DMA-derived indices correlated with surface free energy-based adhesion work, confirming the method’s reliability for rapid moisture sensitivity assessment. This approach provides an efficient basis for selecting moisture-resistant materials tailored to operational temperature environments.

1. Introduction

Moisture damage in asphalt mixtures significantly affects the performance of asphalt pavement, attracting considerable attention from scholars globally. As a critical coating material that binds aggregates together, asphalt forms a viscoelastic film around mineral surfaces, playing a vital role in the durability and integrity of the pavement structure. Moisture damage is recognized as a primary cause of distress in asphalt pavements, leading to reduced service life and various failures, such as alligator cracking, raveling, potholing, and rutting [1,2]. The penetration of water disrupts the asphalt–aggregate interface, weakening the adhesive bond and accelerating pavement deterioration. Extensive research has been conducted to understand the moisture damage mechanism and susceptibility of asphalt mixtures. The objective is to establish input criteria for material selection and design to effectively mitigate moisture damage in the field [3,4,5].
According to Caro et al., the moisture damage mechanism of asphalt mixtures involves the penetration of moisture in the liquid or vapor state, which reaches the asphalt binder–aggregate interface and causes changes in the internal structure. This ultimately leads to a loss of load carrying capacity [6,7]. The evaluation of stripping in asphalt mixtures focuses on two main streams of study: micro- and macro-mechanisms. At the molecular scale, the failure of adhesion and cohesion between asphalt and aggregates can be explained by various theories. In recent years, the use of surface free energy as a means to explain the moisture damage mechanism of asphalt mixtures has gained widespread recognition [8,9,10]. Elphingstone et al. found that surface free energy can effectively predict the resistance to moisture damage in asphalt mixtures. They also emphasized the significance of the surface energy properties of aggregates in the adhesion process, while the surface energy properties of asphalt have relatively minimal influence [11]. Cheng quantified the adhesion performance of asphalt and mineral aggregates by measuring the surface energy parameters of both components. This enabled the evaluation of adhesion work and cohesion work under dry and wet conditions, facilitating the selection of compatible asphalt and aggregate materials [12]. Subsequently, other scholars have also utilized the surface free energy theory to assess the adhesion between asphalt and minerals and predict the moisture damage resistance of asphalt mixtures [13,14,15].
On the other hand, efforts have been made to develop laboratory-based performance tests aimed at optimizing testing techniques and material selection criteria to address the susceptibility of moisture damage in asphalt mixtures [16,17]. Currently, there are numerous conventional and simple laboratory testing methods available to assess moisture damage susceptibility, including indirect tensile strength, tensile strength ratio, Marshall stability ratio, freeze-thaw cycles, Hamburg wheel-tracking devices, the semicircular bending test, and the dynamic modulus test [18,19,20,21]. However, none of these laboratory testing procedures can accurately estimate moisture damage based on design and selection criteria for asphalt materials. Nevertheless, some studies suggest that the dynamic modulus method is more sensitive to slight performance changes caused by moisture damage [22,23,24]. Dynamic mechanical analysis (DMA) is one method used to obtain the dynamic modulus and viscoelastic parameters. Kim et al. utilized dynamic mechanical analysis to assess the effects of moisture susceptibility on the fatigue damage and viscoelastic properties of sand mastic asphalt. The results indicated a strong dependence of moisture damage on the characteristics of the mixture constituents, suggesting that DMA testing combined with surface energy principles could address the issue of moisture damage resistance [25]. Currently, researchers have successfully measured and evaluated the viscoelastic properties of asphalt mortars or mixtures within a wide temperature range using the DMA method with thin section specimens [26,27]. The simplicity, effectiveness, and wide applicability of the DMA method are further exemplified.
Building upon the successful application of the DMA method, this paper aims to achieve the following objectives:
1. A simple and effective method using dynamic mechanical analysis was developed to evaluate the susceptibility of moisture damage in asphalt mixtures based on thin section specimens.
2. The influence of moisture damage on the characteristic temperature and dynamic modulus index of asphalt mixtures within a wide temperature range was evaluated.
3. This study explored how this method can be used to validate predictions of moisture damage sensitivity in asphalt mixtures based on the surface free energy properties of asphalt and aggregates.

2. Materials and Methods

2.1. Materials and Mix Design

This study employed two types of neat asphalt, A1 and A2, with a penetration of 70 mm (0.1 mm), as well as two types of SBS (Styrene-Butadiene-Styrene) modified asphalt, B1 and B2, from various oil sources and manufacturers. Table 1 presents the basic technical specifications of the asphalt binders. The two types of mineral materials used were limestone and granite, denoted by the letters “L” and “G”, respectively. The aggregates were sourced from Hainan Province, China. All the technical indicators met the requirements specified for asphalt pavement construction. Standard Marshall specimens were prepared using a mould with standard dimensions of approximately Ø101.6 mm × 63.5 mm. The specimens were compacted with 75 blows on each side. The aggregate gradation distribution is shown in Table 2, which was designed within the specification range for AC-13C mixtures according to the Chinese industry standard “Technical Specifications for Construction of Highway Asphalt Pavements” (JTG F40-2004).The asphalt–aggregate ratio is 4.8%. A total of eight mixtures were created by combining four types of asphalt with two types of aggregates. The naming convention for the mixtures is created by combining the abbreviations for the asphalt and aggregate; for example, the resulting mixture from asphalt “A1” and aggregate “L” is named “A1L”.

2.2. Experimental Methods

2.2.1. Test Procedures to Estimate the Work of Adhesion

According to the theory proposed by van Oss et al. [28], which builds upon the fundamental concepts of surface energy components [29,30], the total surface free energy (SFE) can be divided into two components: the nonpolar Lifshitz–van der Waals (LW) component and the polar Lewis acid–base (AB) component. The methods for applying this theory have been further discussed in the literature [31,32],
γ = γ d + γ p
where γ is the surface free energy of the solid material, γ d is the dispersive component of the surface free energy, and γ p is the polarity component of the surface free energy.
The individual surface energy components of the asphalt binder (subscript “A”) and aggregate (subscript “S”) can be utilized to calculate the energy required when the asphalt binder is separated from the surface of the mineral aggregate. This energy is known as the work of adhesion. A higher magnitude of the adhesion work, indicated by the absolute value, implies a stronger adhesion between the asphalt and aggregate. It is computed as follows [13,33]:
W A S = γ A + γ S γ A S = 2 γ A d γ S d + 2 γ A p γ S p
To determine the surface energy components of the asphalt binder and aggregate, it is necessary to measure the contact angle of a probe liquid with known surface energy parameters on the asphalt surface. In this research, the contact angle was measured using the sessile drop method on a drop shape analysis instrument. The sessile drop method allows for simultaneous measurement of the contact angle of the asphalt binder and aggregate. Detailed information about these tests can be found elsewhere and is not presented here for the sake of brevity [14,34,35].

2.2.2. DMA Test Procedures

(1)
Test Principle
An asphalt mixture is a commonly encountered viscoelastic material, and its dynamic mechanical behavior refers to its response to strain (or stress) when subjected to alternating stress (or strain). Dynamic mechanical analysis is used to investigate the relationship between the dynamic modulus and damping coefficient of viscoelastic materials under controlled temperature and dynamic load conditions [36,37]. Asphalt mixtures behave as viscoelastic materials, with the strain lagging behind the stress by a phase angle δ. The relationship between the stress, strain, and phase angle can be defined as follows [26,38]:
ε = ε 0 sin ( ω t )
σ = σ 0 sin ( ω t + δ )
where ω is the angular frequency, δ is the phase angle of the strain lagging behind the stress, and ε 0 and σ 0 are the peak values of strain and stress, respectively. Then, the complex modulus E is defined as follows:
E = σ ε
The relationship between the stress and strain with the phase angle is expanded by a trigonometric function. The storage modulus E , which represents the elastic property, and the loss modulus E , which represents the viscous property, are defined as follows:
E = E cos ( δ )
E = E sin ( δ )
Due to the existence of the phase angle δ, the viscoelastic material suffers energy loss when subjected to an external load, and the expression of the loss factor is as follows:
tan ( δ ) = E E
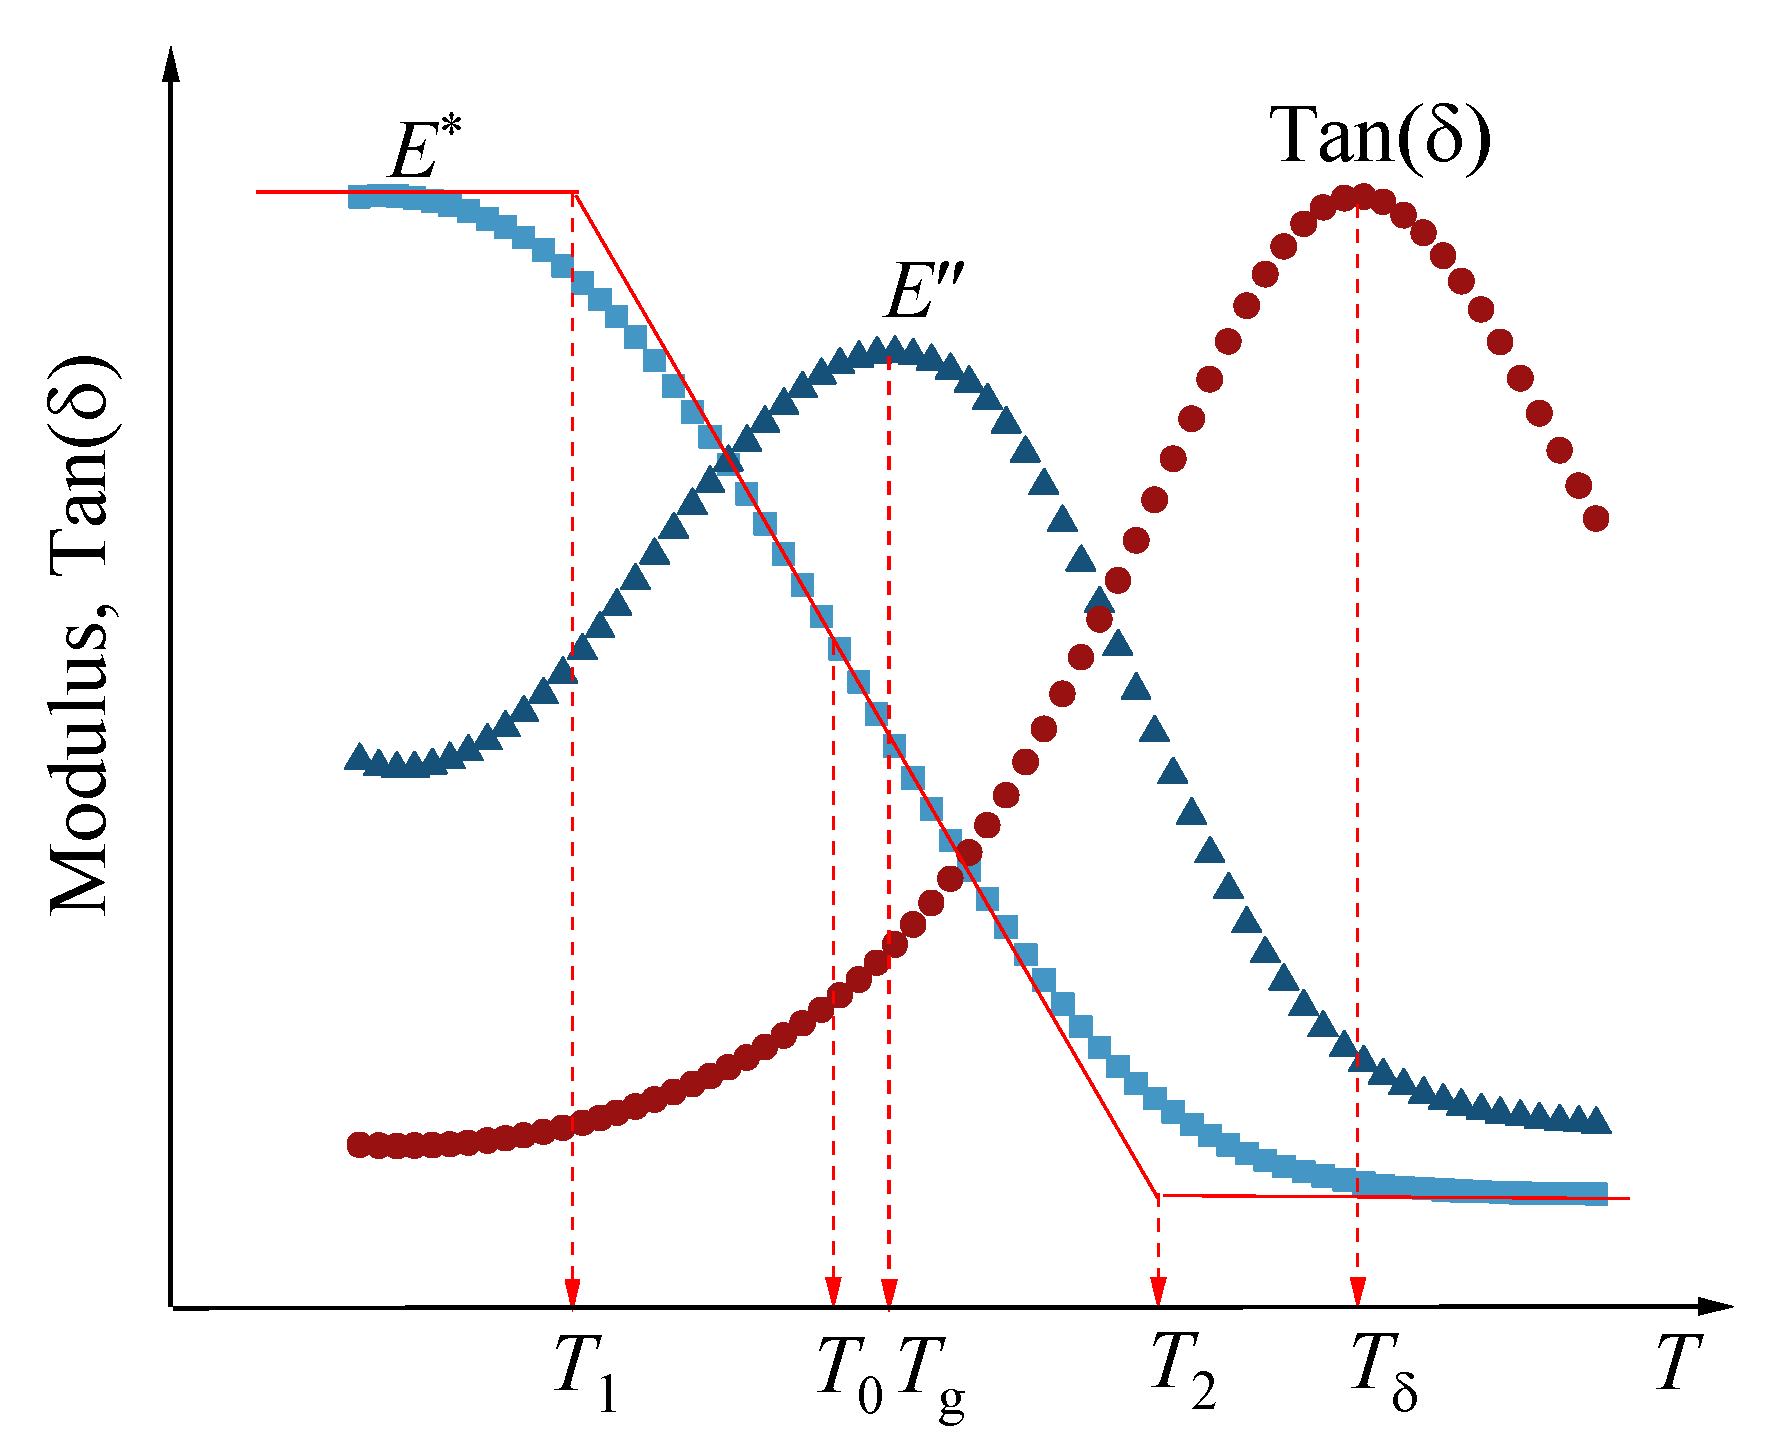
The relationships between these mechanical parameters are schematically illustrated in Figure 1.
(2)
Experimental Equipment and Methods
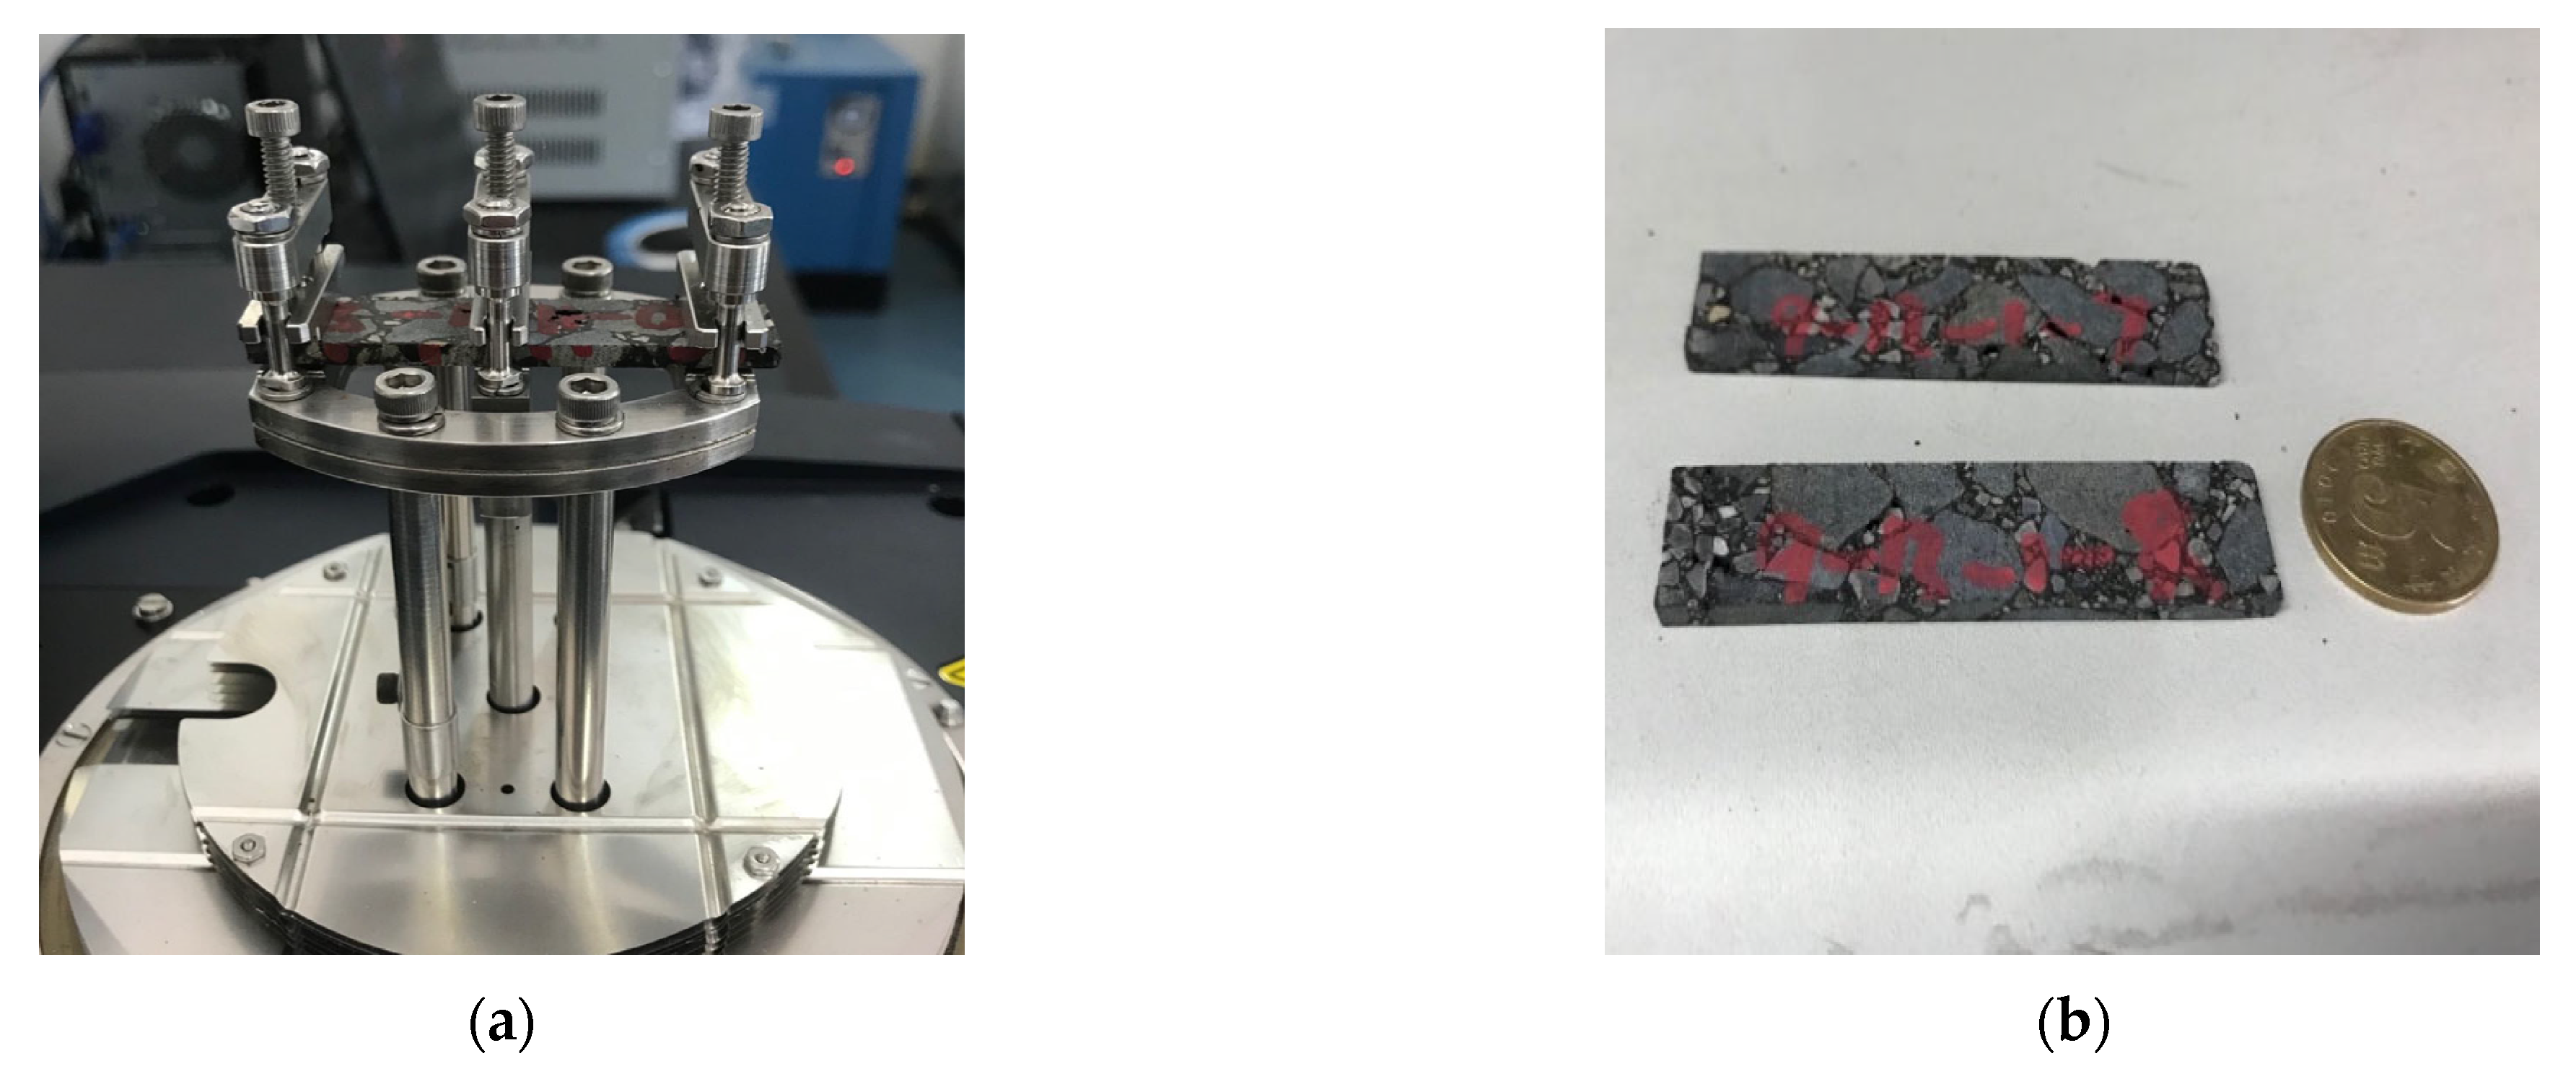
DMA was conducted using a DMA Q-800 apparatus (New Castle, DE, USA) equipped with a dual cantilever loading clamp, as shown in Figure 2a. The DMA method requires thin specimens, so the Marshall specimens were cut to dimensions of 60 mm in length, 13 mm in width, and 3 mm in height, as depicted in Figure 2b. To investigate the moisture susceptibility of the asphalt mixture, the thin specimens were divided into two groups. One group was directly subjected to the DMA test, while the other group was immersed in a water tank at a constant temperature of 60 °C for 48 h. After removing the specimens from the water and wiping off the surface moisture, they were cooled to room temperature before being tested using DMA.
The DMA test methods for the immersed (wet) and non-immersed (dry) specimens were the same. In this study, the temperature-sweep mode was employed with a fixed frequency of 1 Hz and a strain of 50 με. The choice of a strain of 50 με was based on ensuring that the materials remained in the linear viscoelastic zone and avoiding the influence of noise caused by too little strain on the test accuracy [39]. The test was conducted over a temperature range of −35 to 75 °C with a heating rate of 2 °C/min. The temperature scanning test conditions are shown in Table 3. Liquid nitrogen was used for temperature control during the test. The test procedures are as follows:
  • Mounting: Each specimen was securely fixed onto a dual cantilever clamp using a specified torque.
  • Equilibration: The furnace was switched off, and the temperature was reduced to −35 °C and held at this temperature for 10 min.
  • Temperature Ramp: The temperature was then increased at a constant rate of 2 °C per minute.
  • Dynamic Loading: Simultaneously during the temperature increase, a dynamic load was applied to the specimen.
  • Data Acquisition: Various parameters, including the complex modulus, storage modulus, loss modulus, and phase angle, were continuously recorded.
  • Replication: Four parallel specimens were tested for each asphalt mixture type to ensure result reliability.
(3)
Analysis Method
The DMA method can be used to obtain the temperature-dependent dynamic mechanical response parameters of asphalt mixtures across a wide temperature range [39,40], Figure 3 shows the curves of the complex modulus, loss modulus, and tan(δ) obtained from a temperature sweep test. The complex modulus curve, which varies with temperature, exhibits an inverse S-shape. In this study, the modulus curve was fitted using the Boltzmann function within the temperature range of −30 to 70 °C, as shown in Equation (9) [27,39]:
y = A 1 A 2 1 + e x x 0 d x + A 2
where A 1 and A 2 are the maximum and minimum moduli, respectively; x0 and dx are the shape parameters of the curve. x0 is the parameter that represents the inflection point temperature of the sigmoidal curve; dx is the parameter that controls the steepness (slope) of the viscoelastic states.
Based on the characteristics of the complex modulus curve and the fitting parameters of the Boltzmann function, three characteristic temperature points can be determined to describe the viscoelastic properties of the asphalt mixture. These three characteristic temperatures are as follows:
  • The temperature corresponding to the midpoint ( x 0 , y 0 ) of the complex modulus curve is defined as T 0 , T 0 = x 0 . This is also the temperature point where the complex modulus decreases the fastest with increasing temperature;
  • The temperature corresponding to the intersection of the midpoint tangent of the complex modulus curve and the asymptote in the low-temperature zone is defined as T 1 , T 1 = x 0 2 d x . T 1 is the temperature corresponding to the change in the asphalt mixture from a glassy to a rubbery state, which can be considered the glass transition temperature of the asphalt mixture;
  • The temperature corresponding to the intersection of the midpoint tangent of the complex modulus curve and the asymptote in the high-temperature zone is defined as T 2 , T 2 = x 0 + 2 d x . This temperature reflects the characteristics of the asphalt mixture in the high-temperature zone.
The loss modulus and tan(δ) curves have distinct peak points, and the temperatures corresponding to the peak points are denoted as Tg and T δ , respectively, which can be referred to as the phase transition temperature [40,41]. By utilizing the DMA method, the temperature spectrum of dynamic mechanical performance and characteristic temperatures can be obtained, enabling the evaluation of viscoelastic properties of asphalt mixtures over a wide temperature range.
The complex modulus versus temperature data for each individual specimen (both dry and conditioned) was fitted independently using the Boltzmann function (Equation (9)) to obtain a unique set of parameters for each curve. The characteristic temperatures T1, T0, and T2 were then calculated for each specimen based on its own fitted parameters according to the geometric definitions provided. The glass transition temperature Tg and the phase angle peak temperature Tδ were determined directly as the peak values from the loss modulus and tan(δ) curves, respectively, for each specimen. The final values reported for each mixture and condition are the averages calculated from the four parallel specimens.

3. Results and Discussion

3.1. Adhesion Property

3.1.1. Surface Energy of the Asphalt Binder and Aggregate

Table 4 presents the SFE results for the aggregate and asphalt binder. Asphalt, which is primarily composed of nonpolar alkanes, is a weakly polar material. The SFE experimental results confirm that the dispersion component of the surface free energy of the asphalt is dominant, while the proportion of the polar component is relatively small. Additionally, there are significant differences in the surface energy components of asphalts sourced from different oil sources. Specifically, the total SFE and dispersion components of A1 and B1 are smaller than those of A2 and B2, but the polar components of A1 and B1 are relatively larger.
Aggregates are materials with high SFE. In this study, the sessile drop method was used to determine that the total SFE of the aggregates was greater than 50 mJ·m−2. The SFEs of limestone and basalt are relatively similar, but their proportions of dispersion and polarity components are notably different. Limestone is categorized as a basic aggregate, with its surface energy dispersion component accounting for 63.1% and its polarity component accounting for 36.9%. On the other hand, granite is an acidic aggregate, with its surface energy dispersion component accounting for 29.5% and its polarity component accounting for 70.5%. It is generally accepted that acidic aggregates, such as granite, exhibit weaker adhesion strength with asphalt, which is acidic in nature, resulting in a greater potential for moisture-induced damage [42,43].

3.1.2. Adhesion Work of the Asphalt Binder-Aggregate Combination

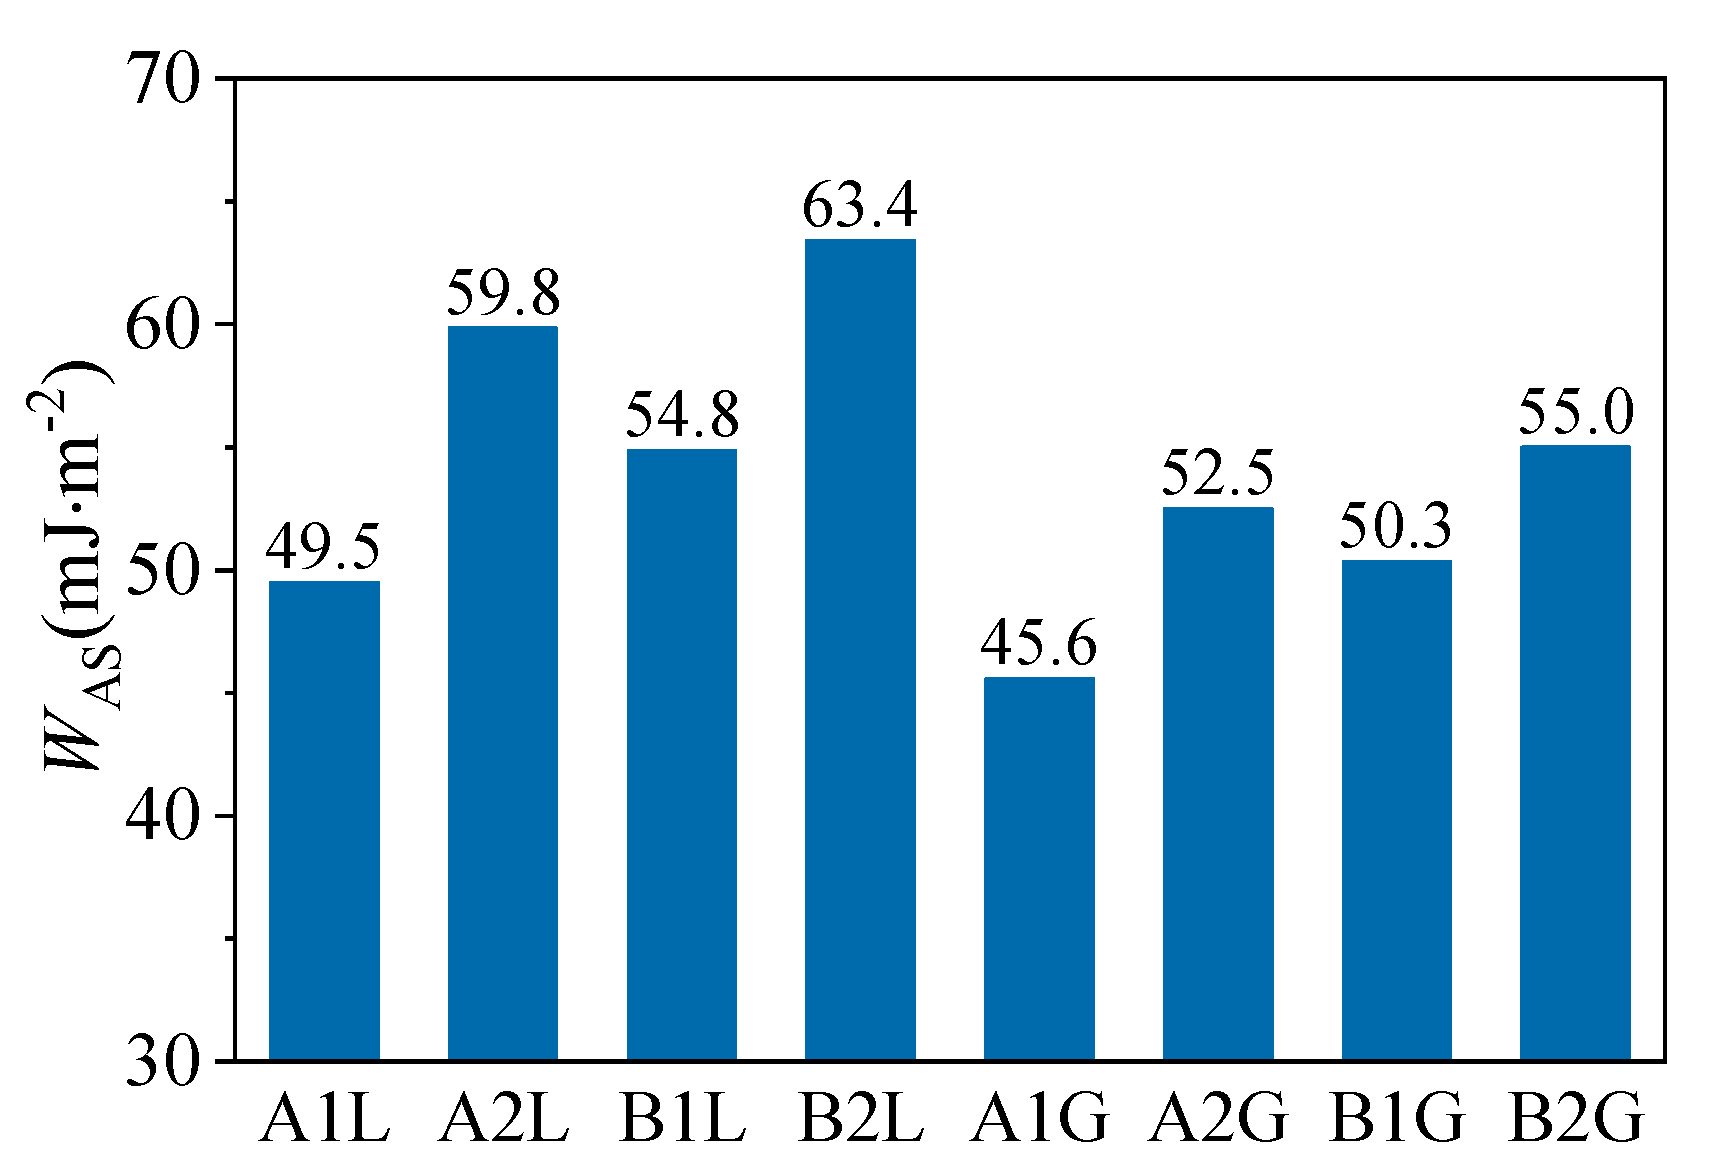
Based on the SFE parameter values of the asphalt binder and aggregate, the adhesion work for the asphalt binder-aggregate interfaces can be calculated using Equation (2). Figure 4 illustrates the comparison of the adhesive work ( W A S ) for the combination of four types of asphalts and two types of aggregates. W A S is defined as the work required to separate the asphalt binder from the aggregate interface. A higher W A S indicates a stronger bond between the asphalt mix components, leading to a more durable and less moisture-susceptible mixture. Among the eight combinations, B2L (SBS-modified asphalt B2 with limestone) had the largest W A S , and A1G (neat asphalt A1 with granite) had the smallest. The adhesion work of neat asphalt A2 is greater than that of A1, that of modified asphalt B2 is greater than that of B1, and that of limestone is greater than that of granite.
The observed differences in adhesion work can be justified by analyzing the surface energy components presented in Table 4. The superior adhesion work for limestone mixtures stems from the fundamental chemical compatibility between the basic limestone aggregate and the acidic asphalt binders. Limestone has a higher proportion of dispersive surface energy component (32.2 mJ·m−2, 63.1% of total SFE), which promotes better wetting and interaction with the primarily nonpolar asphalt binders (whose surface energy is also dominated by the dispersive component). In contrast, granite is an acidic aggregate with a very high polar component (40.4 mJ·m−2, 70.5% of total SFE). This strong polarity creates a thermodynamic mismatch with the less polar asphalt binders, resulting in weaker adhesion and consequently lower adhesion work values. This phenomenon is well-established in the literature [42,43] and explains why granite aggregates are generally considered more moisture-susceptible. Furthermore, the higher adhesion work for A2 compared to A1, and for B2 compared to B1, correlates with their higher total surface free energy (Table 4), which generally promotes stronger interfacial bonding.

3.2. Moisture Susceptibility

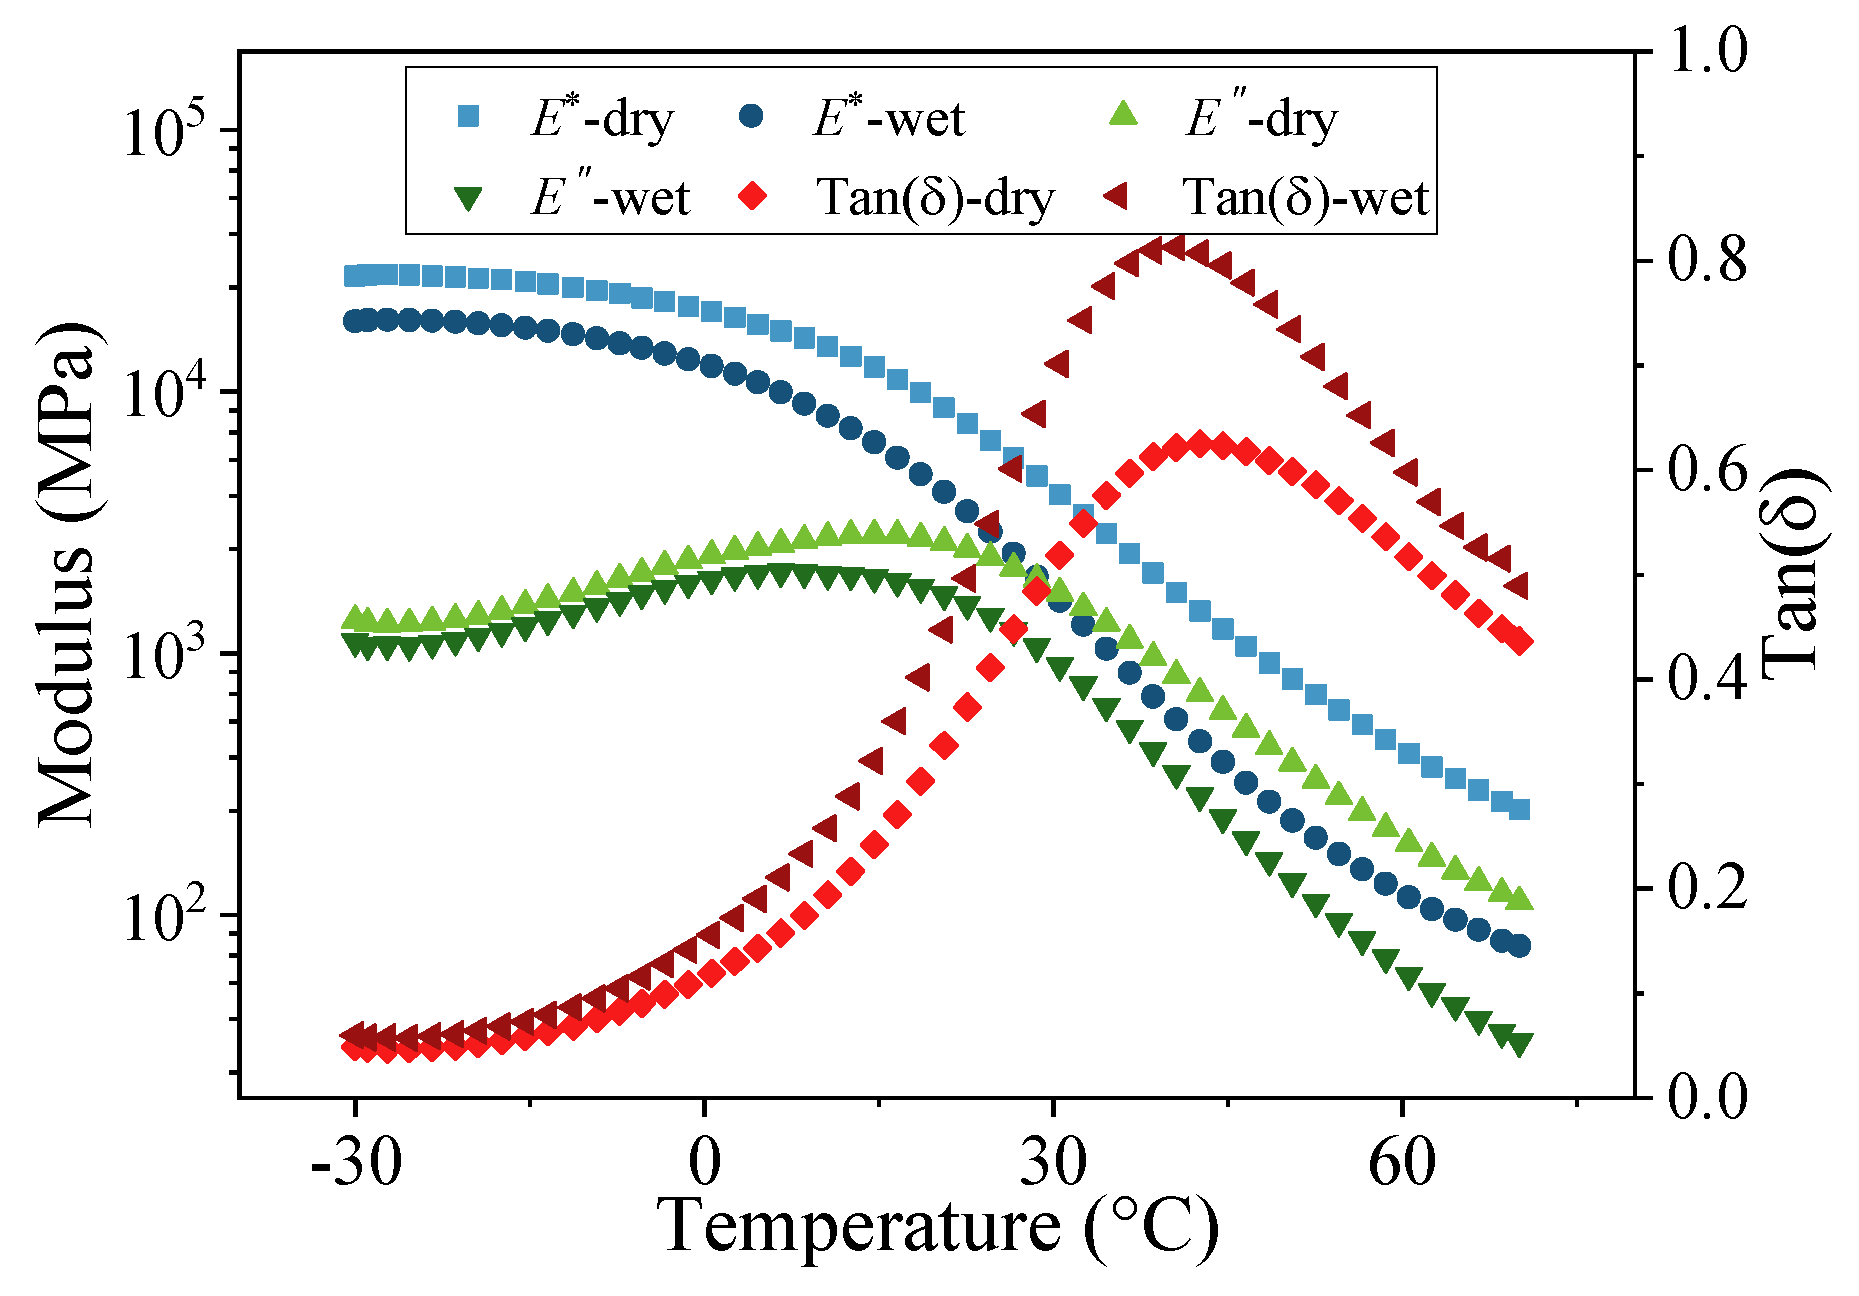
Figure 5 presents a comparison of the temperature spectra for the dynamic mechanical properties obtained through temperature scanning of wet and dry asphalt mixtures, using the asphalt mixture B1G (SBS-modified asphalt B1 with granite) as an example. After immersion in water, the complex modulus and loss modulus of the asphalt mixture decreased, indicating a downward shift in the modulus curve toward lower temperatures. Concurrently, there was an increase in the tan(δ) value, with an increase in the tan(δ) curve. This can be attributed to the exposure of the adhesion interface between the asphalt and aggregate when the asphalt mixture is cut into thin specimens. During immersion, water infiltrates this interface, weakening the bonding effect and reducing the overall strength of the mixture. It should be noted that the deterioration of mixture performance is more prominent in the high-temperature range than in the low-temperature range. Additionally, the increase in the tan(δ) value indicates an increase in the viscosity component of the asphalt mixture, as well as an enhanced ability to undergo unrecoverable deformation under external forces.
The weakened adhesion strength between the asphalt and minerals due to water immersion leads to a decrease in the service performance of the asphalt mixture. This phenomenon is reflected in the changes observed in the temperature spectra of the dynamic mechanical properties. In this study, the extent of damage to the viscoelastic properties of the asphalt mixture caused by water immersion was quantified using the characteristic temperature and modulus as indicators. This analysis aimed to investigate the influence of different combinations of asphalt and aggregate on the moisture susceptibility of the mixture.

3.2.1. Characteristic Temperature

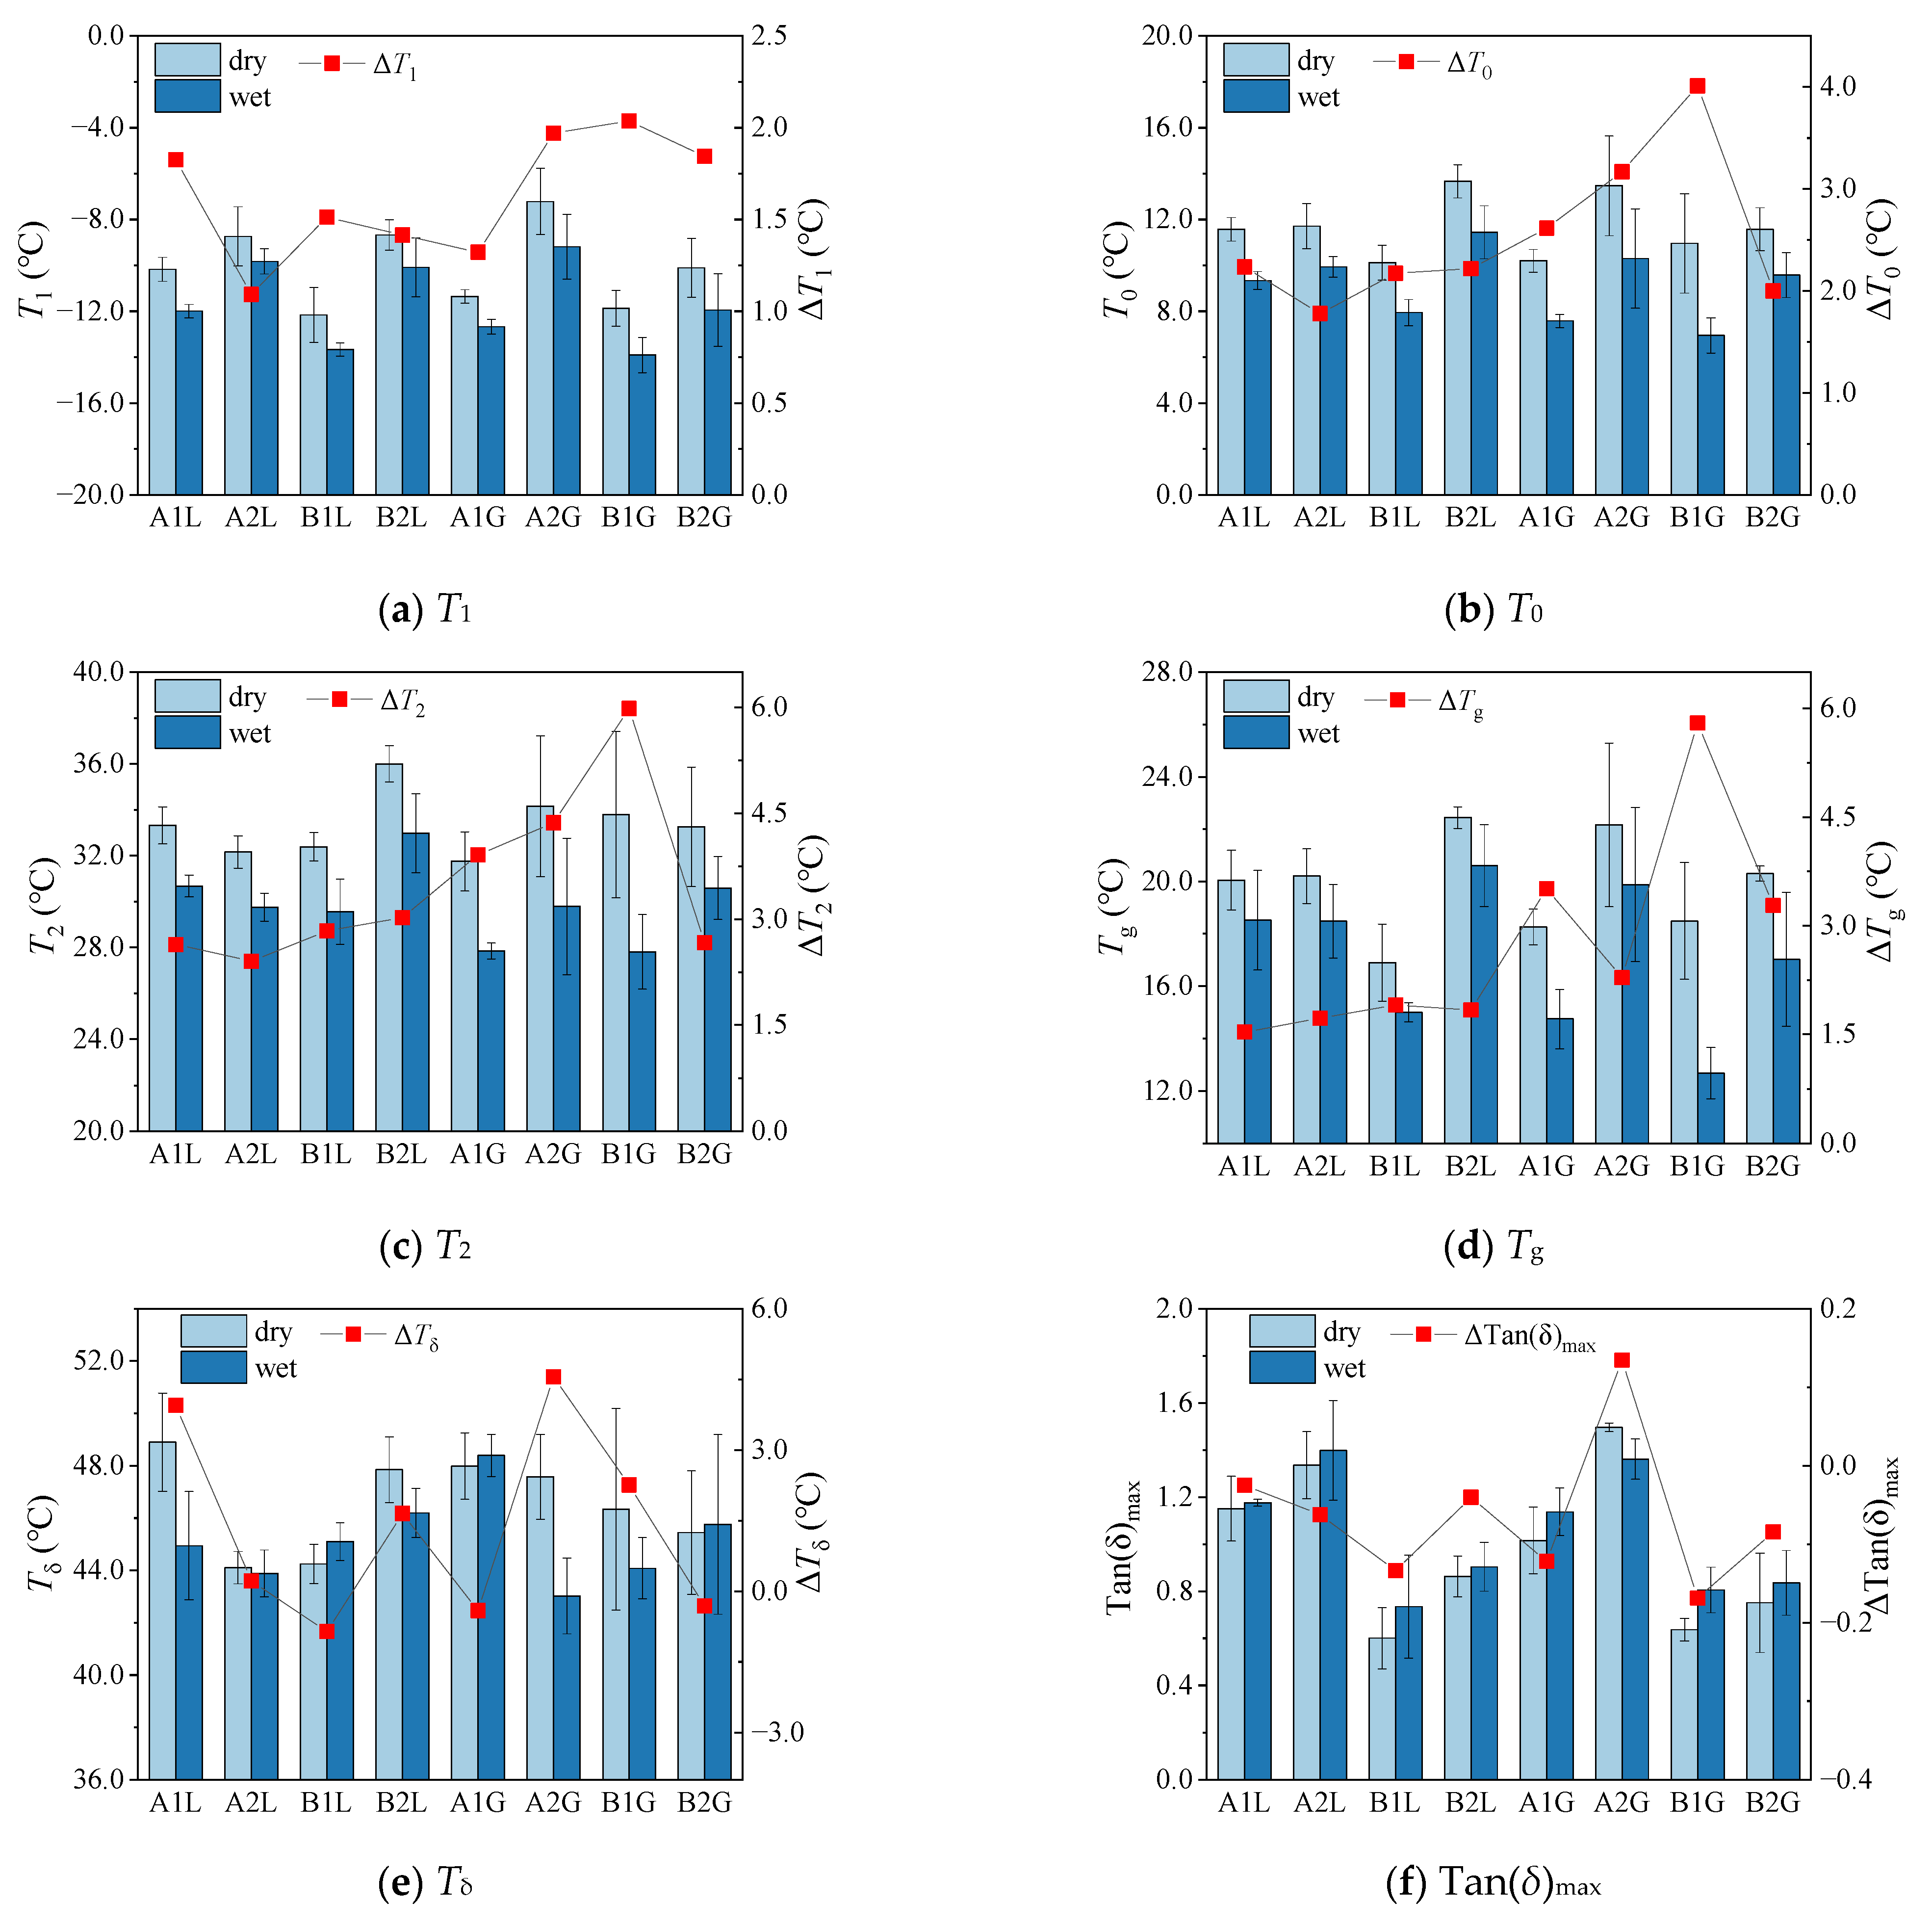
Based on the temperature spectrum of dynamic mechanical properties, the characteristic temperatures of immersed (wet) and non-immersed (dry) asphalt mixtures can be determined. A comparison of the characteristic temperatures and their differences between wet and dry asphalt mixtures is presented in Figure 6. The box chart of the mean variation in characteristic temperature for the same type of materials is shown in Figure 7.
Figure 6a,b,d present a comparison of the characteristic temperatures T1, T0, and Tg obtained from the modulus curves. Based on the theory of dynamic mechanics analysis, these characteristic temperatures can be regarded as the glass transition temperatures of viscoelastic materials, and they also appear in the low-temperature range of the asphalt mixture temperature spectrum. When comparing the four types of asphalt mixtures with limestone and granite, it was observed that:
  • Mixtures A1L (neat asphalt A1 with limestone), A2L (neat asphalt A2 with limestone), B1L (SBS-modified asphalt B1 with limestone), and B2L (SBS-modified asphalt B2 with limestone) decreased the characteristic temperatures T1, T0 and Tg by an average of 1.5 °C, 2.1 °C, and 1.7 °C after immersion, respectively, while the granite mixtures decreased by 1.8 °C, 2.9 °C, and 3.7 °C, respectively.
  • The average reduction in T1 and T0 for the A1L and A1G mixtures formed by two types of aggregates and neat asphalt A1 after immersion is similar to that of asphalt A2.
  • The Tg of the A1L and A1G mixtures decreases by an average of 2.5 °C, which is greater than the decrease of 2.0 °C observed for the A2L and A2G mixtures.
  • The mixtures formed by modified asphalt B1 (i.e., B1L and B1G) exhibited average decreases of 1.8 °C, 3.1 °C, and 3.9 °C for T1, T0 and Tg, respectively, while the decreases for asphalt B2 (i.e., B2L and B2G) were 1.6 °C, 2.1 °C, and 2.6 °C, respectively.
Comparatively, it is evident that the characteristic temperature decrease is more significant for mixtures formed by A1 asphalt than for those formed by A2 asphalt, for B1 asphalt than for B2 asphalt, and for granite mixtures than for limestone mixtures.
Figure 6c illustrates the change in the characteristic temperature T2. After immersion, T2 for the limestone mixtures decreased by an average of 2.7 °C, while for the granite mixtures, it decreased by an average of 4.2 °C. The changes in T2 for the two types of neat asphalt mixtures are relatively similar at approximately 3.3 °C. The mixtures with modified asphalt B1 experienced an average decrease of 4.4 °C, which is greater than the decrease of 2.8 °C observed for the B2 mixtures. The characteristic temperature T2 corresponds to the higher temperature range of the mixture and can be considered the temperature at which the material transitions from a viscoelastic state to a viscous flow state. A decrease in T2 after immersion indicates a deterioration in the high-temperature performance of the mixture. The decrease in T2 for the water-immersed mixture is greater than that observed for T1, T0, and Tg in the low-temperature range, indicating that water damage has a greater impact on the high-temperature performance of the mixture than on its low-temperature performance. This pattern can also be clearly observed in Figure 7.
Figure 6e depicts the peak temperature (Tδ) of the tan(δ) curve. Upon examination, it is evident that the change in Tδ differs among different materials after immersion. The Tδ of mixtures B1L, A1G, and B2G increases after immersion, albeit by less than 1 °C, compared to that of the non-immersed samples. On the other hand, the Tδ of the other mixtures decreases after immersion, with that of granite showing a greater decrease than that of limestone. Figure 6f shows a comparison of the peak values of tan(δ). The tan(δ)max of immersed mixture A2G is 0.13 lower than that of the non-immersed mixture, while the tan(δ)max of the other immersed mixtures is greater. The tan(δ)max of limestone mixtures, on average, increases by 0.07, whereas for granite (excluding A2G), there is an average increase of 0.12. An increase in Tan(δ) is the generally expected outcome after moisture damage, as it typically indicates a relative increase in the viscous component of the mixture’s behavior, signifying a loss of elastic restitution and a greater propensity for permanent deformation. The anomalous decrease in Tan(δ)max observed for the immersed A2G mixture may be attributed to an extensive loss of adhesion and cohesion, which shifted the mixture’s behavior from being predominantly viscoelastic to being primarily governed by frictional interactions between the degraded, poorly coated granite aggregates, which exhibit a lower loss factor.
Based on the aforementioned analysis, it is apparent that immersion of the mixture weakens the bond strength between asphalt and minerals, resulting in a decline in the performance of the mixture at various temperatures, as evidenced by the shift in the characteristic temperature toward lower values. The variation in characteristic temperature between immersed and non-immersed mixtures can provide a quantitative assessment of water sensitivity. The characteristic temperature of the asphalt mixtures formed with less adhesive work between the asphalt and mineral materials decreases significantly, i.e., neat asphalt A1 > A2, modified asphalt B1 > B2, and granite > limestone, which aligns with the adhesion evaluation results shown in Figure 4.
The observed downward shifts in characteristic temperatures (1–4 °C) after moisture conditioning, though numerically modest, have considerable practical significance for pavement performance. A decrease in the glass transition-related temperatures (T0, T1, Tg) does not indicate improved low-temperature performance; rather, it is caused by the loss of relaxation capacity in the mixture due to damage at the asphalt–aggregate interface. This implies a potential increase in low-temperature cracking susceptibility. Conversely, a decrease in the high-temperature transition point T2 signifies that the mixture loses its stiffness and enters a viscous state more readily. This translates to a reduced resistance to permanent deformation (rutting) under traffic loading at high in-service temperatures. Therefore, these shifts quantitatively reflect the mechanistic weakening of the mixture’s structure due to moisture damage, predicting a compromised service life with an elevated risk of both cracking and rutting failures in the field.

3.2.2. Residual Modulus

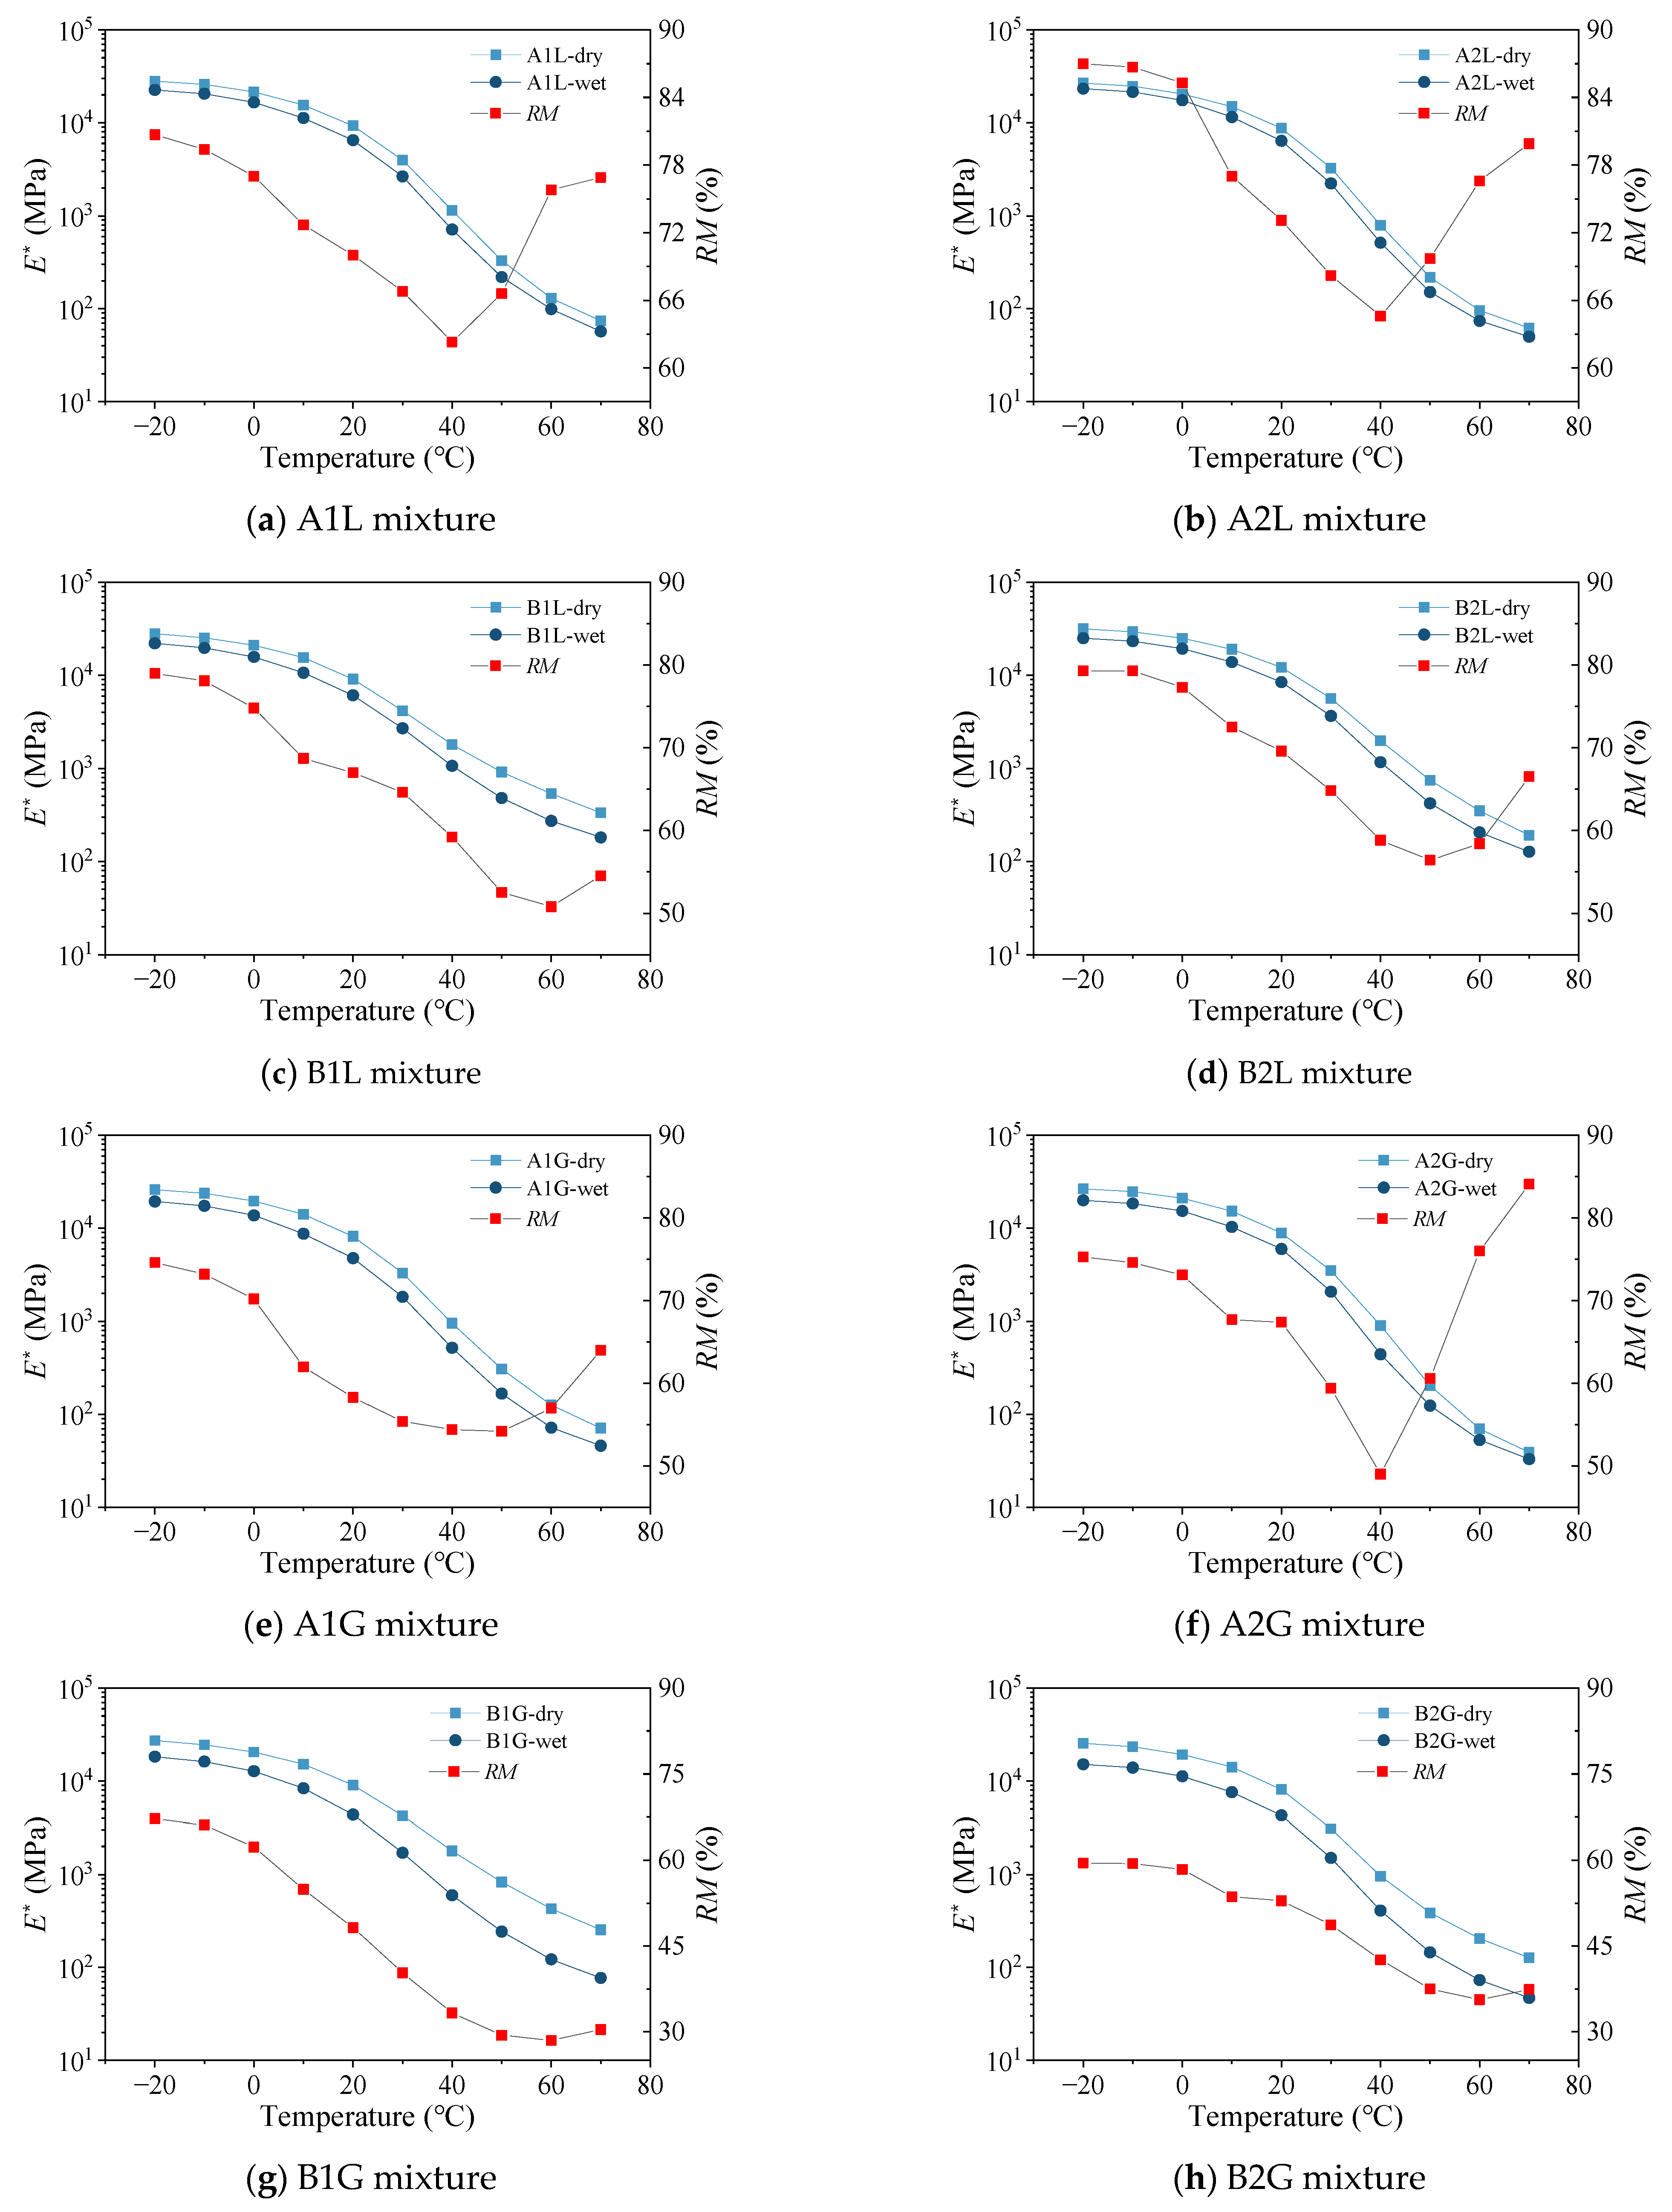
Figure 8 presents the complex modulus of the immersed and non-immersed asphalt mixtures. Clearly, the modulus decreases after immersion. To compare the degree of modulus damage following immersion, the residual modulus (RM) ratio was utilized as an evaluative index. The RM is defined in Equation (10) below. A smaller value of RM indicates a greater loss of modulus in the immersed asphalt mixture, indicating poorer resistance to moisture damage.
R M = E w e t E d r y × 100 %
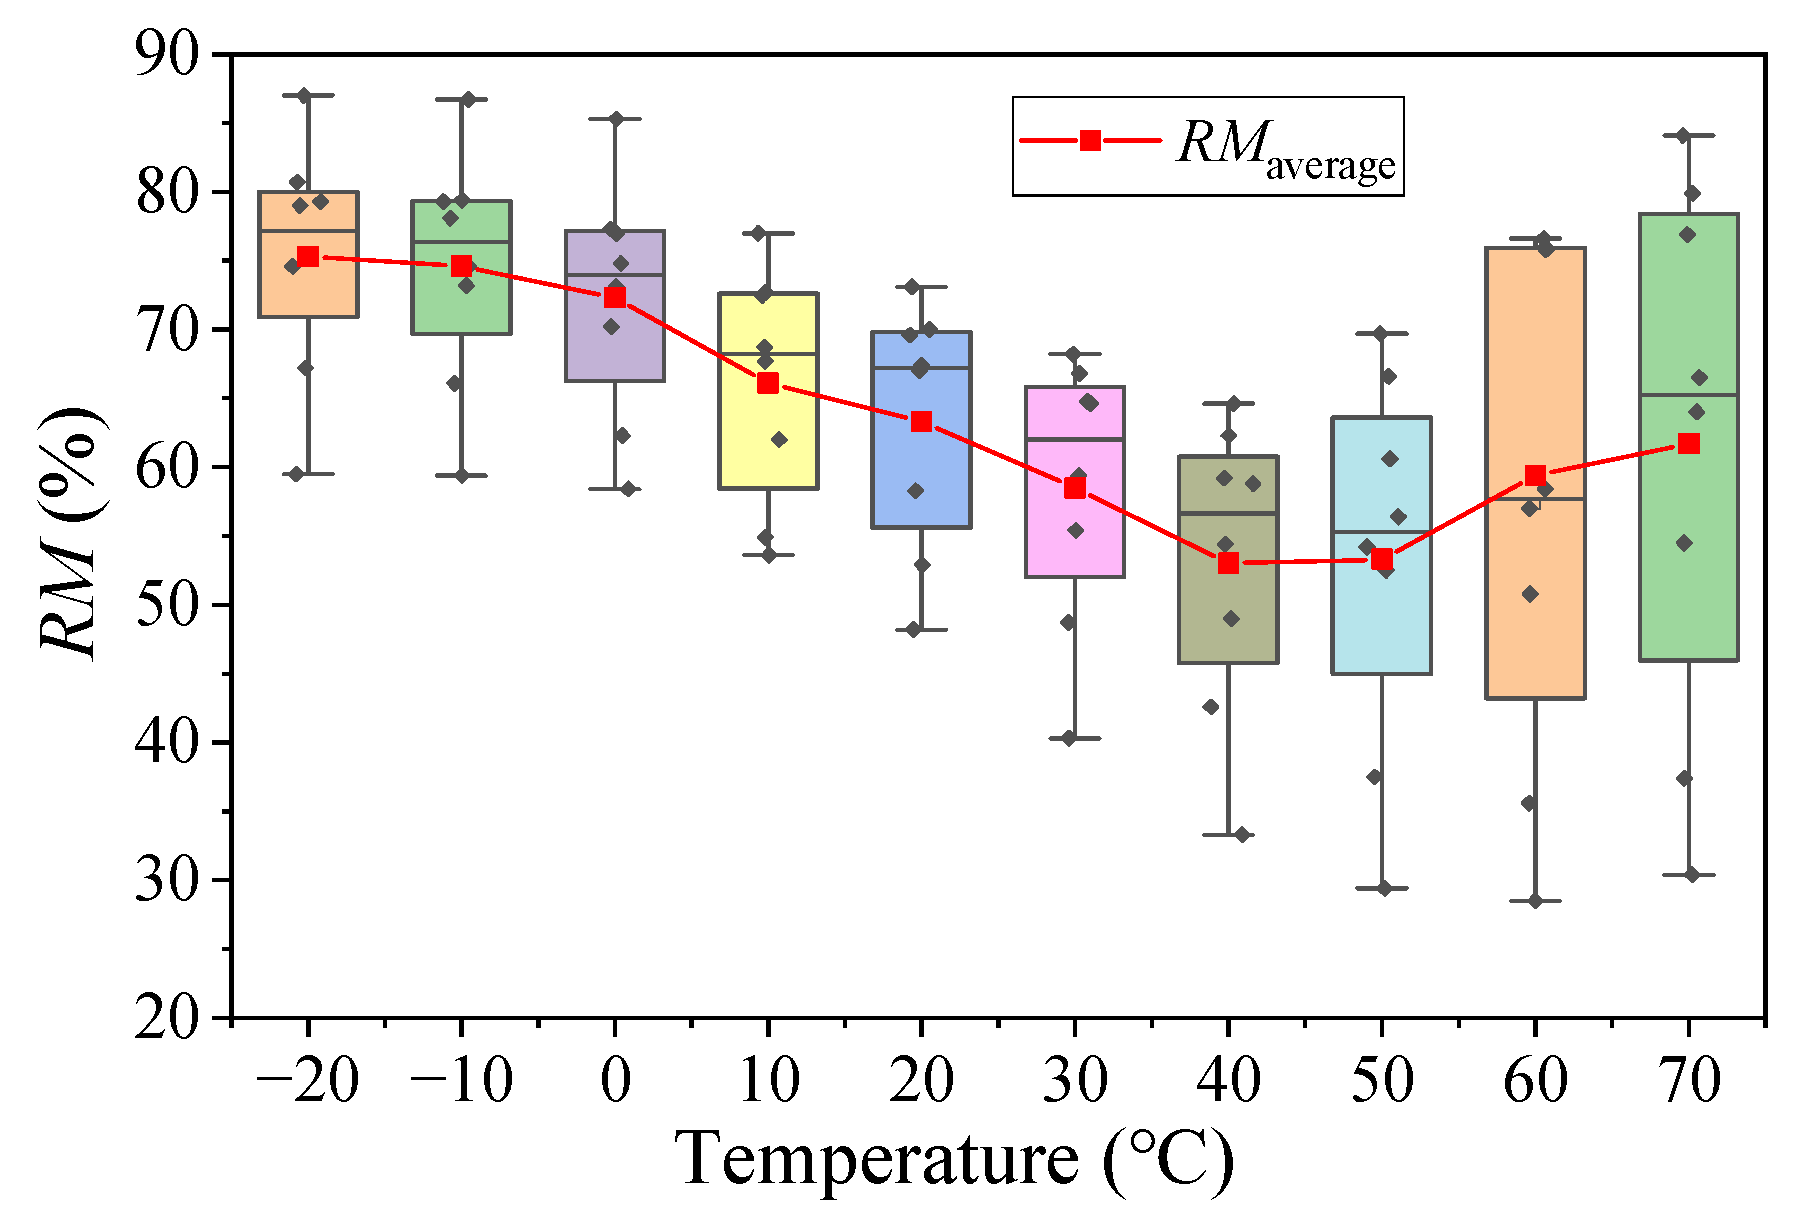
The RM values of eight asphalt mixtures in the temperature range from −20 to 70 °C with an interval of 10 °C are shown in Figure 8.
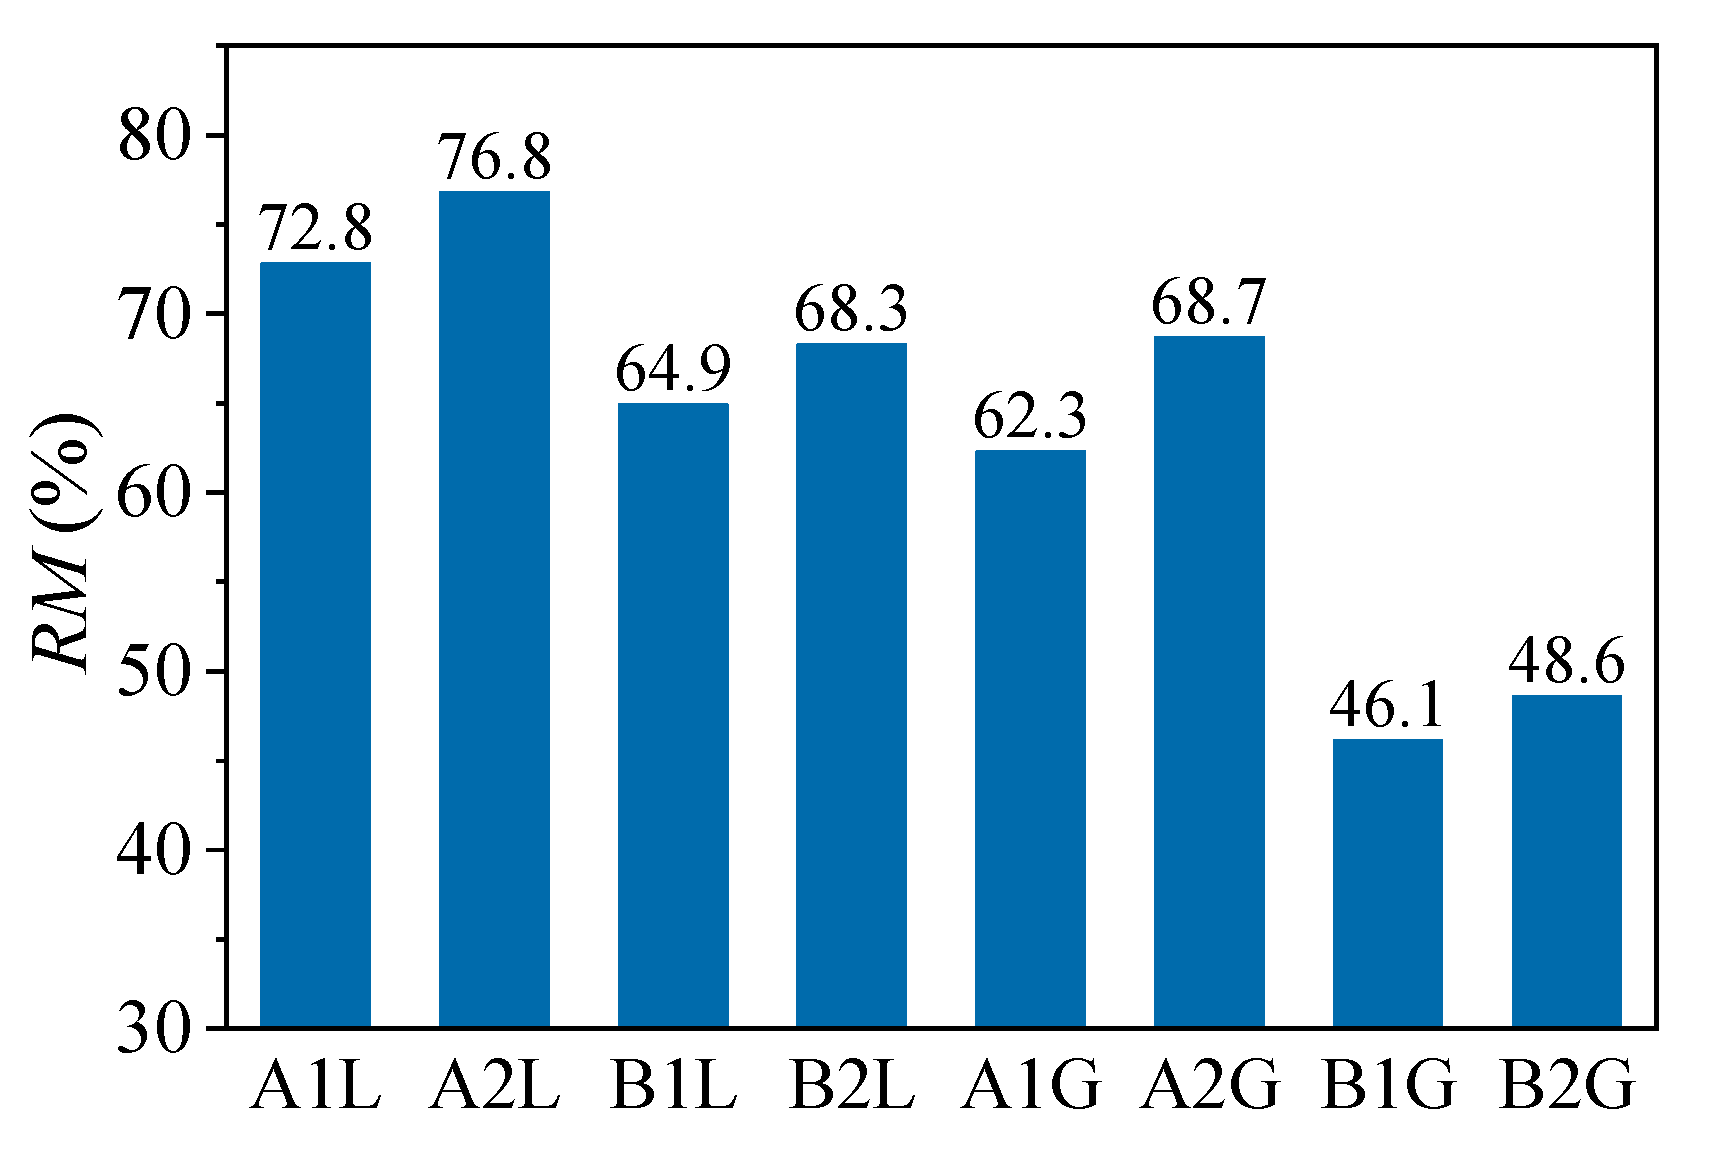
To compare the differences in residual modulus between different materials, the average RM value of the same mixture at different temperatures is used for comparative evaluation, the result is shown in Figure 9. The RM values of the mixture formed by neat asphalt A2 with limestone (A2L) and granite (A2G) were 76.8% and 68.7%, respectively, and those of asphalt A1 with limestone (A1L) and granite (A1G) were 72.8% and 62.3%, respectively. The order of the RM values of the four neat asphalt mixtures was A2L > A1L > A2G > A1G. The RM values of the mixture formed by modified asphalt B2 with limestone (B2L) and granite (B2G) were 68.3% and 48.6%, respectively, and those of asphalt B1 with limestone (B1L) and granite (B1G) were 64.9% and 46.1%, respectively. The order of the RM values of the four modified asphalt mixtures was B2L > B1L > B2G > B1G.
The complex modulus values of the modified asphalt and neat asphalt are comparable in the low temperature range. However, the modulus of modified asphalt is significantly greater than that of neat asphalt in the high-temperature range, regardless of whether the modified asphalt is immersed in water. This indicates that the modified asphalt mixture exhibits excellent high-temperature performance. However, the RM value of the modified asphalt mixtures (B1L, B1G, B2L, B2G) is consistently lower than that of the neat asphalt mixtures (A1L, A1G, A2L, A2G) throughout the temperature range, as shown in Figure 8. This suggests that the modified asphalt mixture has poor resistance to water damage, despite having relatively high adhesion. The factors influencing the moisture sensitivity of asphalt mixtures are complex. If the adhesion work is used as an indicator for predicting the moisture damage resistance of asphalt mixtures, it is essential to separately analyze neat asphalt and modified asphalt. In this study, the evaluation of both the adhesion work and residual modulus indices leads to the same conclusion: the moisture damage resistance of the mixtures containing asphalt A2 is greater than that of those containing A1, that of mixtures containing B2 is greater than that of those containing B1, and that of mixtures with limestone is greater than that of those with granite.
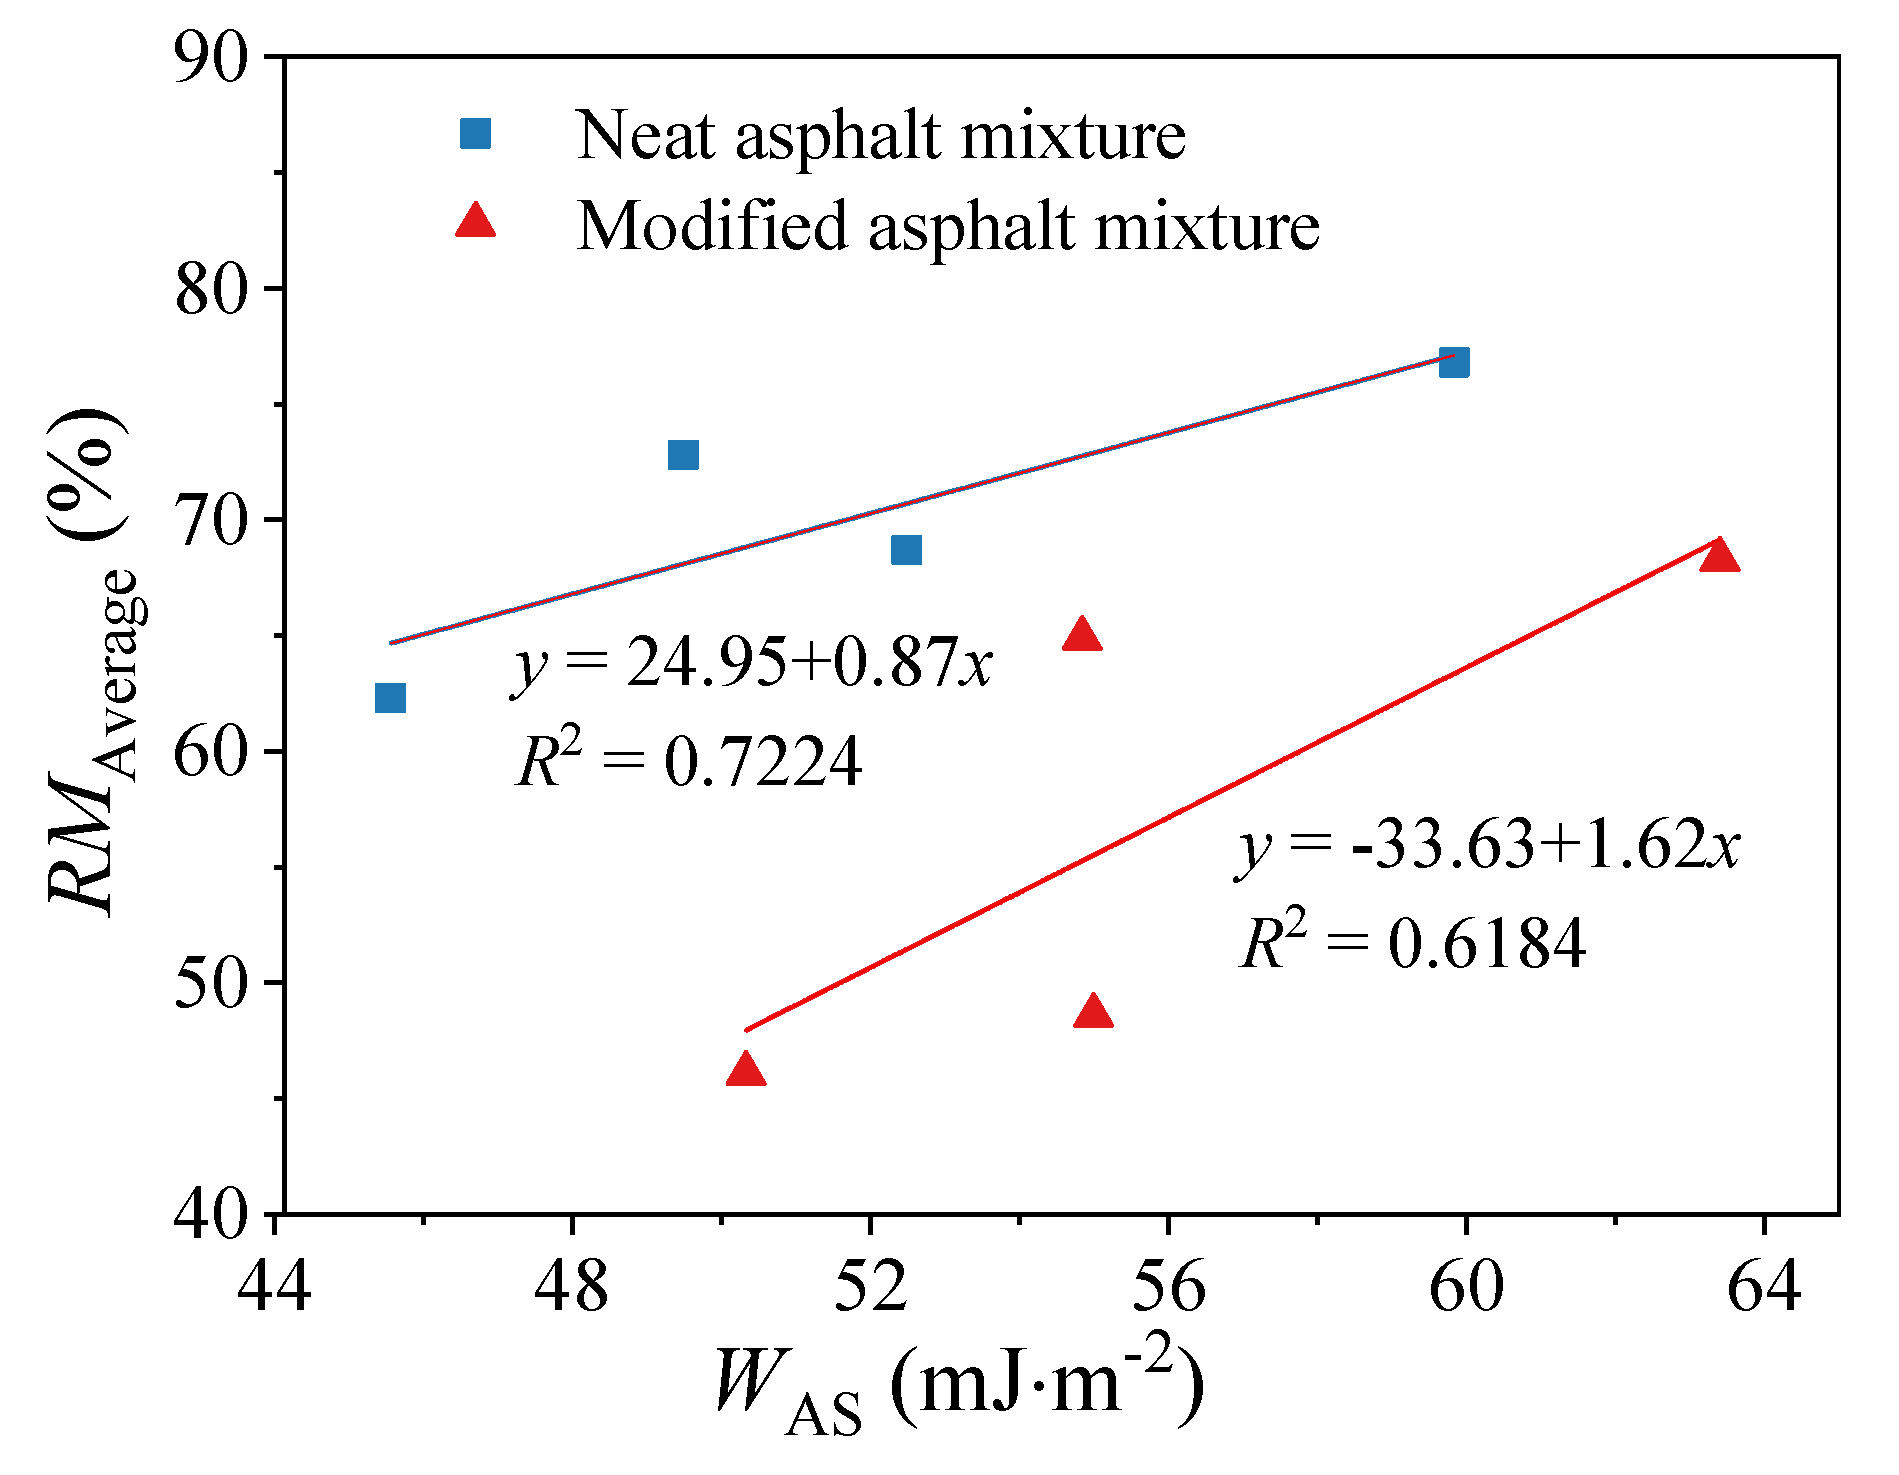
However, when it comes to predicting the moisture damage resistance of a specific combination of asphalt and aggregate based solely on adhesion work, there are certain limitations. After all, the factors influencing the moisture sensitivity of asphalt mixtures are multifaceted. Figure 10 illustrates the relationship between the average RM value at different temperatures for the same mixture and the adhesion work, which also demonstrates this point. The linear fitting coefficient between adhesion work and residual modulus is greater than 0.6, indicating a tendency for a larger adhesion work to correspond to a larger residual modulus, but this is not an absolute rule.
Additionally, by comparing the range of RM values for eight different types of asphalt mixtures at identical temperature points, the variation trend of the resilient modulus (RM) across a broad temperature range can be analyzed, as shown in Figure 11. It is evident from the data that the average RM is greater than 70% in the temperature region below 0 °C, 60%–70% in the temperature region between 0 °C and 20 °C, 50%–60% in the temperature range between 30 °C and 60 °C, and greater than 60% in the temperature range above 60 °C. The findings reveal that water immersion has a significant impact on the high-temperature performance of the mixture, with a substantial modulus damage of close to 50% in the temperature range of 30~60 °C. Conversely, the modulus damage in the medium- and low-temperature regions is relatively small after immersion. These results align with the evaluation results of the characteristic temperature index.
As shown in Figure 8, the RM value of the mixture decreases first and then increases, and there are minimum points: the minimum point of the neat asphalt mixture is approximately 40 °C, while the minimum point of the modified asphalt is approximately 60 °C. Temperature is a vital factor influencing the modulus loss of an asphalt mixture. The minimum value of RM corresponds to the maximum degradation degree of the mixture after moisture damage, indicating the most unfavorable temperature for the operation of the water-immersed mixture. As a result, determining the lowest residual modulus and its corresponding temperature within a wide temperature range is highly important for evaluating the moisture damage resistance of asphalt mixtures.
To obtain the minimum residual modulus (RMmin) and its corresponding temperature, the GaussAmp function model was utilized to fit and solve the RM curve [39]. The functional equation of the model is presented as:
y = y 0 + A e ( x x c ) 2 2 w 2
where xc, y0, A and w are fitting parameters, and the fitting results are shown in Table 5. The GaussAmp function model can well fit the relationship between the residual modulus of the asphalt mixture and temperature. The fitting coefficient of the A2G mixture is 0.8238, while the fitting coefficients of the other mixtures are greater than 0.93.
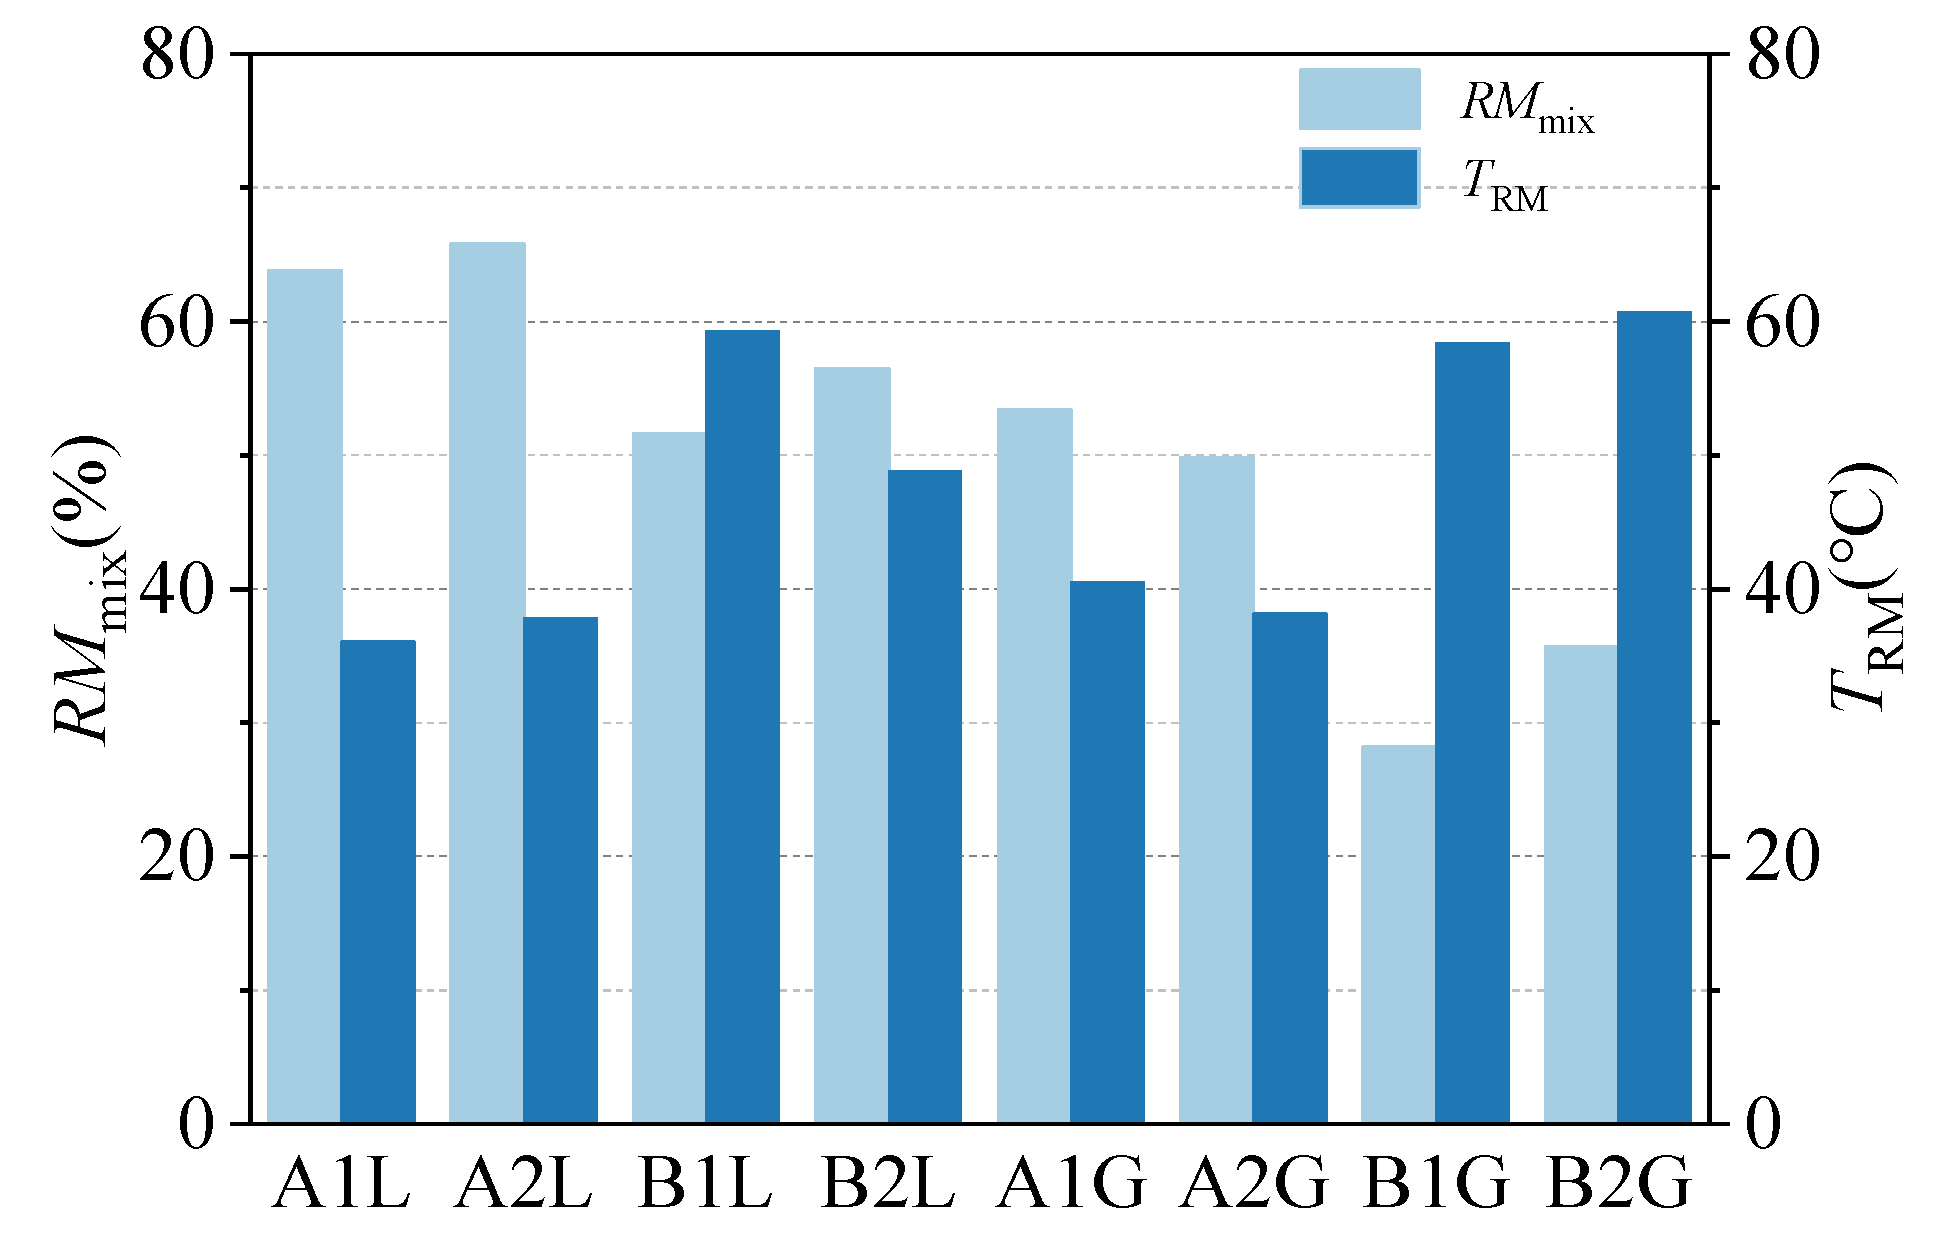
According to the characteristics of the GaussAmp model, y 0 + A is the peak point of the fitting curve, namely, the minimum residual modulus value, which is expressed as RMmin. x c is the abscissa value corresponding to the peak point of the fitted curve, that is, the temperature corresponding to the minimum residual modulus, expressed as TRM. The RMmin of the asphalt mixture and its corresponding temperature TRM can be obtained according to the fitting parameters in Table 5, as shown in Figure 12.
As depicted in Table 5 and Figure 12, there is a significant difference in the minimum residual modulus of the eight asphalt mixtures, with values ranging from 28.2% to 65.8%. The RMmin values of asphalt mixtures A1L, A2L, B1L, and B2L, which are composed of four types of asphalt and limestone, are 63.8%, 65.8%, 51.6%, and 56.5%, respectively. These values are 10.5%, 16.0%, 23.4%, and 20.8% higher than those of the granite mixture. From the perspective of asphalt, the RMmin of neat asphalt is notably greater than that of modified asphalt, while the difference between two asphalts of the same type is relatively small. Hence, the adhesion between aggregates is the primary factor that affects the residual modulus of the mixture, whereas the adhesion of asphalt has a relatively minimal impact. RMmin can serve as an index for evaluating the moisture sensitivity of asphalt mixtures, with larger RMmin values indicating stronger resistance to water damage.
TRM is the temperature corresponding to the minimum residual modulus. At this temperature, the modulus loss of the immersed asphalt mixture is the largest, which is the most unfavorable service temperature environment. As shown in Figure 12, the TRM values of the mixtures formed by neat asphalt and modified asphalt are significantly different. The TRM values of the four neat asphalt mixtures are close to approximately 40 °C, while the TRM value of the B2L mixture is 48.8 °C, and the TRM value of the other modified asphalt mixtures is approximately 60 °C. This indicates that the most unfavorable service temperature of the modified asphalt mixture is higher than that of neat asphalt. Therefore, through the investigation of the RMmin and TRM of asphalt mixtures, the moisture susceptibility of these mixtures under different temperature environments can be evaluated, leading to informed material selection for road engineering construction under different service conditions.
A direct comparison between limestone and granite mixtures, based on the combined evidence from surface energy and DMA analysis, reveals an unequivocally superior moisture resistance of limestone-based mixtures. The thermodynamic foundation for this is established by the consistently higher adhesion work (WAS) for all asphalt binders when combined with limestone compared to granite (Figure 4), a result of the more favorable interaction between the asphalt binders and the basic limestone aggregate versus the acidic granite. This thermodynamic predisposition translates directly into superior mechanical performance after moisture damage. The DMA results demonstrate that granite mixtures suffer more severe deterioration, evidenced by: (1) significantly larger reductions in characteristic temperatures (T0, T1, T2, Tg), particularly in the high-temperature range (Figure 7a); (2) a lower average Residual Modulus (RM) across the entire temperature spectrum (Figure 9); and (3) a critically lower minimum Residual Modulus (RMmin) value (Figure 12), indicating the depth of strength loss. While a general positive correlation exists between WAS and RM (Figure 10), the dramatic difference between the two aggregates underscores that the aggregate type is a primary governing factor in moisture susceptibility, often outweighing the differences between asphalt binders of the same type. Consequently, for projects in moisture-prone environments, selecting a limestone aggregate provides an inherently more resistant mixture, a conclusion reliably quantified by the DMA method.

4. Conclusions

This study employed Dynamic Mechanical Analysis (DMA) to evaluate the moisture susceptibility of asphalt mixtures by quantifying changes in their viscoelastic properties after water immersion. The following key conclusions were drawn:
  • The DMA method, utilizing thin-section specimens, proved to be an effective and efficient technique for assessing moisture-induced damage. It successfully captured the deterioration in performance through measurable decreases in the complex modulus and significant shifts in characteristic temperatures (T0, T1, T2, Tg) towards lower values after moisture conditioning.
  • The derived indices, namely the residual modulus ratio (RM) and the characteristic temperature differentials, provided a reliable quantitative ranking of mixture susceptibility. Mixtures prepared with granite aggregate consistently demonstrated higher moisture sensitivity compared to those with limestone. Furthermore, among the binders tested, mixtures containing A1 (neat) and B1 (SBS-modified) asphalt exhibited greater performance loss than those with A2 and B2, respectively.
  • A critical finding was the identification of the minimum residual modulus (RMmin) and its corresponding critical temperature (TRM). These parameters pinpointed the most severe conditions of moisture damage, with RMmin values which ranged from 28.2% to 65.8% and occurred at TRM values of approximately 40 °C for neat asphalt mixtures and 60 °C for SBS-modified asphalt mixtures. This indicates that the most unfavorable in-service temperature environment is higher for modified binders.
  • The DMA-based evaluation of moisture susceptibility showed a correlative trend with the thermodynamic adhesion work (WAS) calculated from surface free energy components. However, the relationship was not absolute. While modified asphalts generally exhibited higher adhesion work, they showed inferior resistance to moisture damage compared to neat asphalts in the DMA tests. This highlights the complexity of moisture damage mechanisms and indicates that predictions based solely on surface energy theory should be approached with caution and require separate consideration for modified and neat binders.
  • The comprehensive analysis underscores that the aggregate type is a primary governing factor in moisture susceptibility. The superior performance of limestone-based mixtures, quantified by all DMA indices, is attributed to its more favorable chemical interaction with asphalt binders, leading to stronger adhesion as evidenced by higher WAS values.
In summary, the DMA method offers a rapid and practical tool for evaluating moisture sensitivity, and the indices RMmin and TRM provide crucial criteria for selecting appropriate asphalt materials tailored to specific climatic service conditions. Future work should expand this approach to include a wider variety of mixture designs and incorporate cyclic freeze–thaw conditioning to better simulate field performance.

Author Contributions

Conceptualization, Y.W., J.W. and X.W.; methodology, Y.W. and X.W.; formal analysis, Y.W., J.W. and Y.X.; investigation, W.Z. and Y.X.; resources, W.Z. and Y.Q.; data curation, Y.X. and Y.Q.; writing—original draft, Y.W., J.W. and X.W.; writing—review and editing, Y.W. and X.W. All authors have read and agreed to the published version of the manuscript.

Funding

This research was funded by the Shandong Provincial Natural Science Foundation, grant number: ZR2024QE425, and the Special Fund of Chinese Central Government for Basic Scientific Research Operations in Commonweal Research Institutes, grant number: 2025-9009A.

Institutional Review Board Statement

Not applicable.

Informed Consent Statement

Not applicable.

Data Availability Statement

Data are contained within the article.

Conflicts of Interest

Authors Wanguo Zhang, Yuanshun Xiong, Yuanhui Qiao were employed by the company China Railway 14th Bureau Group Corporation Limited. The remaining authors declare that the research was conducted in the absence of any commercial or financial relationships that could be construed as a potential conflict of interest.

References

  1. Huang, B.; Shu, X.; Dong, Q.; Shen, J. Laboratory Evaluation of Moisture Susceptibility of Hot-Mix Asphalt Containing Cementitious Fillers. J. Mater. Civ. Eng. 2010, 22, 667–673. [Google Scholar] [CrossRef]
  2. Kok, B.V.; Yilmaz, M. The effects of using lime and styrene–butadiene–styrene on moisture sensitivity resistance of hot mix asphalt. Constr. Build. Mater. 2009, 23, 1999–2006. [Google Scholar] [CrossRef]
  3. Kakar, M.R.; Hamzah, M.O.; Valentin, J. A review on moisture damages of hot and warm mix asphalt and related investigations. J. Clean. Prod. 2015, 99, 39–58. [Google Scholar] [CrossRef]
  4. Das, B.P.; Siddagangaiah, A.K. Moisture damage analysis based on adhesive failure in asphalt mixtures. Int. J. Pavement Eng. 2022, 23, 2554–2564. [Google Scholar] [CrossRef]
  5. El-Hakim, R.T.A.; Epps, J.; Martin, A.E.; Arámbula-Mercado, E. Laboratory and field investigation of moisture susceptibility of hot and warm mix asphalts. Int. J. Pavement Eng. 2021, 22, 1389–1398. [Google Scholar] [CrossRef]
  6. Caro, S.; Masad, E.; Bhasin, A.; Little, D.N. Moisture susceptibility of asphalt mixtures, Part 2: Characterisation and modelling. Int. J. Pavement Eng. 2008, 9, 99–114. [Google Scholar] [CrossRef]
  7. Caro, S.; Masad, E.; Bhasin, A.; Little, D.N. Moisture susceptibility of asphalt mixtures, Part 1: Mechanisms. Int. J. Pavement Eng. 2008, 9, 81–98. [Google Scholar] [CrossRef]
  8. Mehrara, A.; Khodaii, A. A review of state of the art on stripping phenomenon in asphalt concrete. Constr. Build. Mater. 2013, 38, 423–442. [Google Scholar] [CrossRef]
  9. Usanga, I.N.; Okafor, F.O.; Ikeagwuani, C.C. Analysis of performance parameters based on surface free energy to evaluate moisture susceptibility of asphalt mixtures modified with calcined marl dust. Int. J. Pavement Eng. 2024, 25. [Google Scholar] [CrossRef]
  10. Hamedi, G.H.; Esmaeeli, M.R.; Gilani, V.N.M.; Hosseinian, S.M.; Lampropoulos, A. The Effect of Aggregate-Forming Minerals on Thermodynamic Parameters Using Surface Free Energy Concept and Its Relationship with the Moisture Susceptibility of Asphalt Mixtures. Adv. Civ. Eng. 2021, 2021, 8818681. [Google Scholar] [CrossRef]
  11. Elphingstone, G.M., Jr. Adhesion and Cohesion in Asphalt-Aggregate Systems; Texas A&M University: College Station, TX, USA, 1997. [Google Scholar]
  12. Cheng, D.; Little, D.; Lytton, R.; Holste, J. Surface energy measurement of asphalt and its application to predicting fatigue and healing in asphalt mixtures. Transp. Res. Rec. 2002, 1810, 44–53. [Google Scholar] [CrossRef]
  13. Hefer, A.W.; Bhasin, A.; Little, D.N. Bitumen Surface Energy Characterization Using a Contact Angle Approach. J. Mater. Civ. Eng. 2006, 18, 759–767. [Google Scholar] [CrossRef]
  14. Koc, M.; Bulut, R. Assessment of a Sessile Drop Device and a New Testing Approach Measuring Contact Angles on Aggregates and Asphalt Binders. J. Mater. Civ. Eng. 2014, 26, 391–398. [Google Scholar] [CrossRef]
  15. Tanzadeh, R.; Shafabakhsh, G. Surface free energy and adhesion energy evaluation of modified bitumen with recycled carbon black (micro-nano) from gases and petrochemical waste. Constr. Build. Mater. 2020, 245, 118361. [Google Scholar] [CrossRef]
  16. Liu, L.; Huang, W.; Liu, L.; Ye, F.; Chen, S.; Yang, R. Moisture susceptibility evaluation of asphalt mixture with account of horizontal loads: A novel test method. Constr. Build. Mater. 2024, 417, 135301. [Google Scholar] [CrossRef]
  17. Oldham, D.J.; Hajikarimi, P.; Fini, E.H. Introducing a New Test to Examine Moisture Susceptibility at the Interface of Bitumen and Stones. J. Transp. Eng. Part B Pavements 2022, 148, 4022029. [Google Scholar] [CrossRef]
  18. Aksoy, A.; Şamlioglu, K.; Tayfur, S.; Özen, H. Effects of various additives on the moisture damage sensitivity of asphalt mixtures. Constr. Build. Mater. 2005, 19, 11–18. [Google Scholar] [CrossRef]
  19. Rad, S.M.; Olagunju, M.; Elkashef, M. Impact of Binder and Aggregate Type on the Cracking, Rutting, and Moisture Susceptibility of Asphalt Mixes in Oklahoma: A BMD Approach. J. Mater. Civ. Eng. 2025, 37, 4024530. [Google Scholar] [CrossRef]
  20. Zhang, Y.; Ling, M.; Kaseer, F.; Arambula, E.; Lytton, R.L.; Martin, A.E. Prediction and evaluation of rutting and moisture susceptibility in rejuvenated asphalt mixtures. J. Clean. Prod. 2022, 333, 129980. [Google Scholar] [CrossRef]
  21. Akentuna, M.; Mohammad, L.N.; Sachdeva, S.; Cooper, S.B.; Cooper, S.B. Effectiveness of Loaded Wheel Tracking Test to Ascertain Moisture Susceptibility of Asphalt Mixtures. Transp. Res. Rec. 2022, 2676, 421–434. [Google Scholar] [CrossRef]
  22. Breakah, T.M.; Bausano, J.P.; Williams, R.C. Integration of Moisture Sensitivity Testing with Gyratory Mix Design and Mechanistic-Empirical Pavement Design. J. Transp. Eng. 2009, 135, 852–857. [Google Scholar] [CrossRef]
  23. Bausano, J.; Williams, R.C. Transitioning from AASHTO T283 to the Simple Performance Test Using Moisture Conditioning. J. Mater. Civ. Eng. 2009, 21, 73–82. [Google Scholar] [CrossRef]
  24. Brondani, C.; Vestena, P.M.; Faccin, C.; Schuster, S.L.; Specht, L.P.; Da Silva Pereira, D. Moisture susceptibility of asphalt mixtures: 2S2P1D rheological model approach and new index based on dynamic modulus master curve changes. Constr. Build. Mater. 2022, 331, 127316. [Google Scholar] [CrossRef]
  25. Kim, Y.; Little, D.N.; Lytton, R.L. Effect of moisture damage on material properties and fatigue resistance of asphalt mixtures. Transp. Res. Rec. J. Transp. Res. Board 2004, 1891, 48–54. [Google Scholar] [CrossRef]
  26. Ma, Z.; Wang, X.; Wang, Y.; Zhou, X.; Wu, Y. Long-Term Performance Evolution of RIOHTrack Pavement Surface Layer Based on DMA Method. Materials 2022, 15, 6461. [Google Scholar] [CrossRef]
  27. Wang, Y.; Wang, X.; Ma, Z.; Shan, L.; Zhang, C. Evaluation of the High- and Low-Temperature Performance of Asphalt Mortar Based on the DMA Method. Materials 2022, 15, 3341. [Google Scholar] [CrossRef] [PubMed]
  28. van Oss, C.J.; Chaudhury, M.K.; Good, R.J. Monopolar surfaces. Adv. Colloid. Interface. Sci. 1987, 28, 35–64. [Google Scholar] [CrossRef] [PubMed]
  29. Fowkes, F.M. Additivity of intermolecular forces at interfaces. I. Determination of the contribution to surface and interfacial tensions of dispersion forces in various liquids. J. Phys. Chem. 1963, 67, 2538–2541. [Google Scholar] [CrossRef]
  30. Owens, D.K.; Wendt, R.C. Estimation of the surface free energy of polymers. J. Appl. Polym. Sci. 1969, 13, 1741–1747. [Google Scholar] [CrossRef]
  31. Kwok, D.Y.; Neumann, A.W. Contact angle measurement and contact angle interpretation. Adv. Colloid Interface Sci. 1999, 81, 167–249. [Google Scholar] [CrossRef]
  32. van Oss, C.J. Use of the combined Lifshitz-van der Waals and Lewis acid-base approaches in determining the apolar and polar contributions to surface and interfacial tensions and free energies. J. Adhes. Sci. Technol. 2002, 16, 669–677. [Google Scholar] [CrossRef]
  33. Tan, Y.; Guo, M. Using surface free energy method to study the cohesion and adhesion of asphalt mastic. Constr. Build. Mater. 2013, 47, 254–260. [Google Scholar] [CrossRef]
  34. Habal, A.; Singh, D. Comparison of Wilhelmy plate and Sessile drop methods to rank moisture damage susceptibility of asphalt—Aggregates combinations. Constr. Build. Mater. 2016, 113, 351–358. [Google Scholar] [CrossRef]
  35. Ameri, M.; Ziari, H.; Yousefi, A.; Behnood, A. Moisture Susceptibility of Asphalt Mixtures: Thermodynamic Evaluation of the Effects of Antistripping Additives. J. Mater. Civ. Eng. 2021, 33, 4020457. [Google Scholar] [CrossRef]
  36. Zhang, J.; Bao, L. Determination of asphalt mixture’s viscoelastic constitutive parameters for pavement response analysis using dynamic modulus transformation. Constr. Build. Mater. 2022, 315, 125729. [Google Scholar] [CrossRef]
  37. Bi, Y.; Guo, F.; Zhang, J.; Pei, J.; Li, R. Correlation analysis between asphalt binder/asphalt mastic properties and dynamic modulus of asphalt mixture. Constr. Build. Mater. 2021, 276, 122256. [Google Scholar] [CrossRef]
  38. Fu, Q.; Xie, Y.; Long, G.; Niu, D.; Song, H. Dynamic mechanical thermo-analysis of cement and asphalt mortar. Powder Technol 2017, 313, 36–43. [Google Scholar] [CrossRef]
  39. Yang, G.; Wang, X.; Zhou, X.; Wang, Y. Experimental Study on the Phase Transition Characteristics of Asphalt Mixture for Stress Absorbing Membrane Interlayer. Materials 2020, 13, 474. [Google Scholar] [CrossRef] [PubMed]
  40. Soliman, H.; Shalaby, A. Characterizing the Low-Temperature Performance of Hot-Pour Bituminous Sealants Using Glass Transition Temperature and Dynamic Stiffness Modulus. J. Mater. Civ. Eng. 2009, 21, 688–693. [Google Scholar] [CrossRef]
  41. Tan, Y.; Guo, M. Study on the phase behavior of asphalt mastic. Constr. Build. Mater. 2013, 47, 311–317. [Google Scholar] [CrossRef]
  42. Arabani, M.; Hamedi, G.H. Using the Surface Free Energy Method to Evaluate the Effects of Polymeric Aggregate Treatment on Moisture Damage in Hot-Mix Asphalt. J. Mater. Civ. Eng. 2011, 23, 802–811. [Google Scholar] [CrossRef]
  43. Ghabchi, R.; Singh, D.; Zaman, M.; Tian, Q. Application of Asphalt-aggregates Interfacial Energies to Evaluate Moisture-induced Damage of Warm Mix Asphalt. Procedia Soc. Behav. Sci. 2013, 104, 29–38. [Google Scholar] [CrossRef]
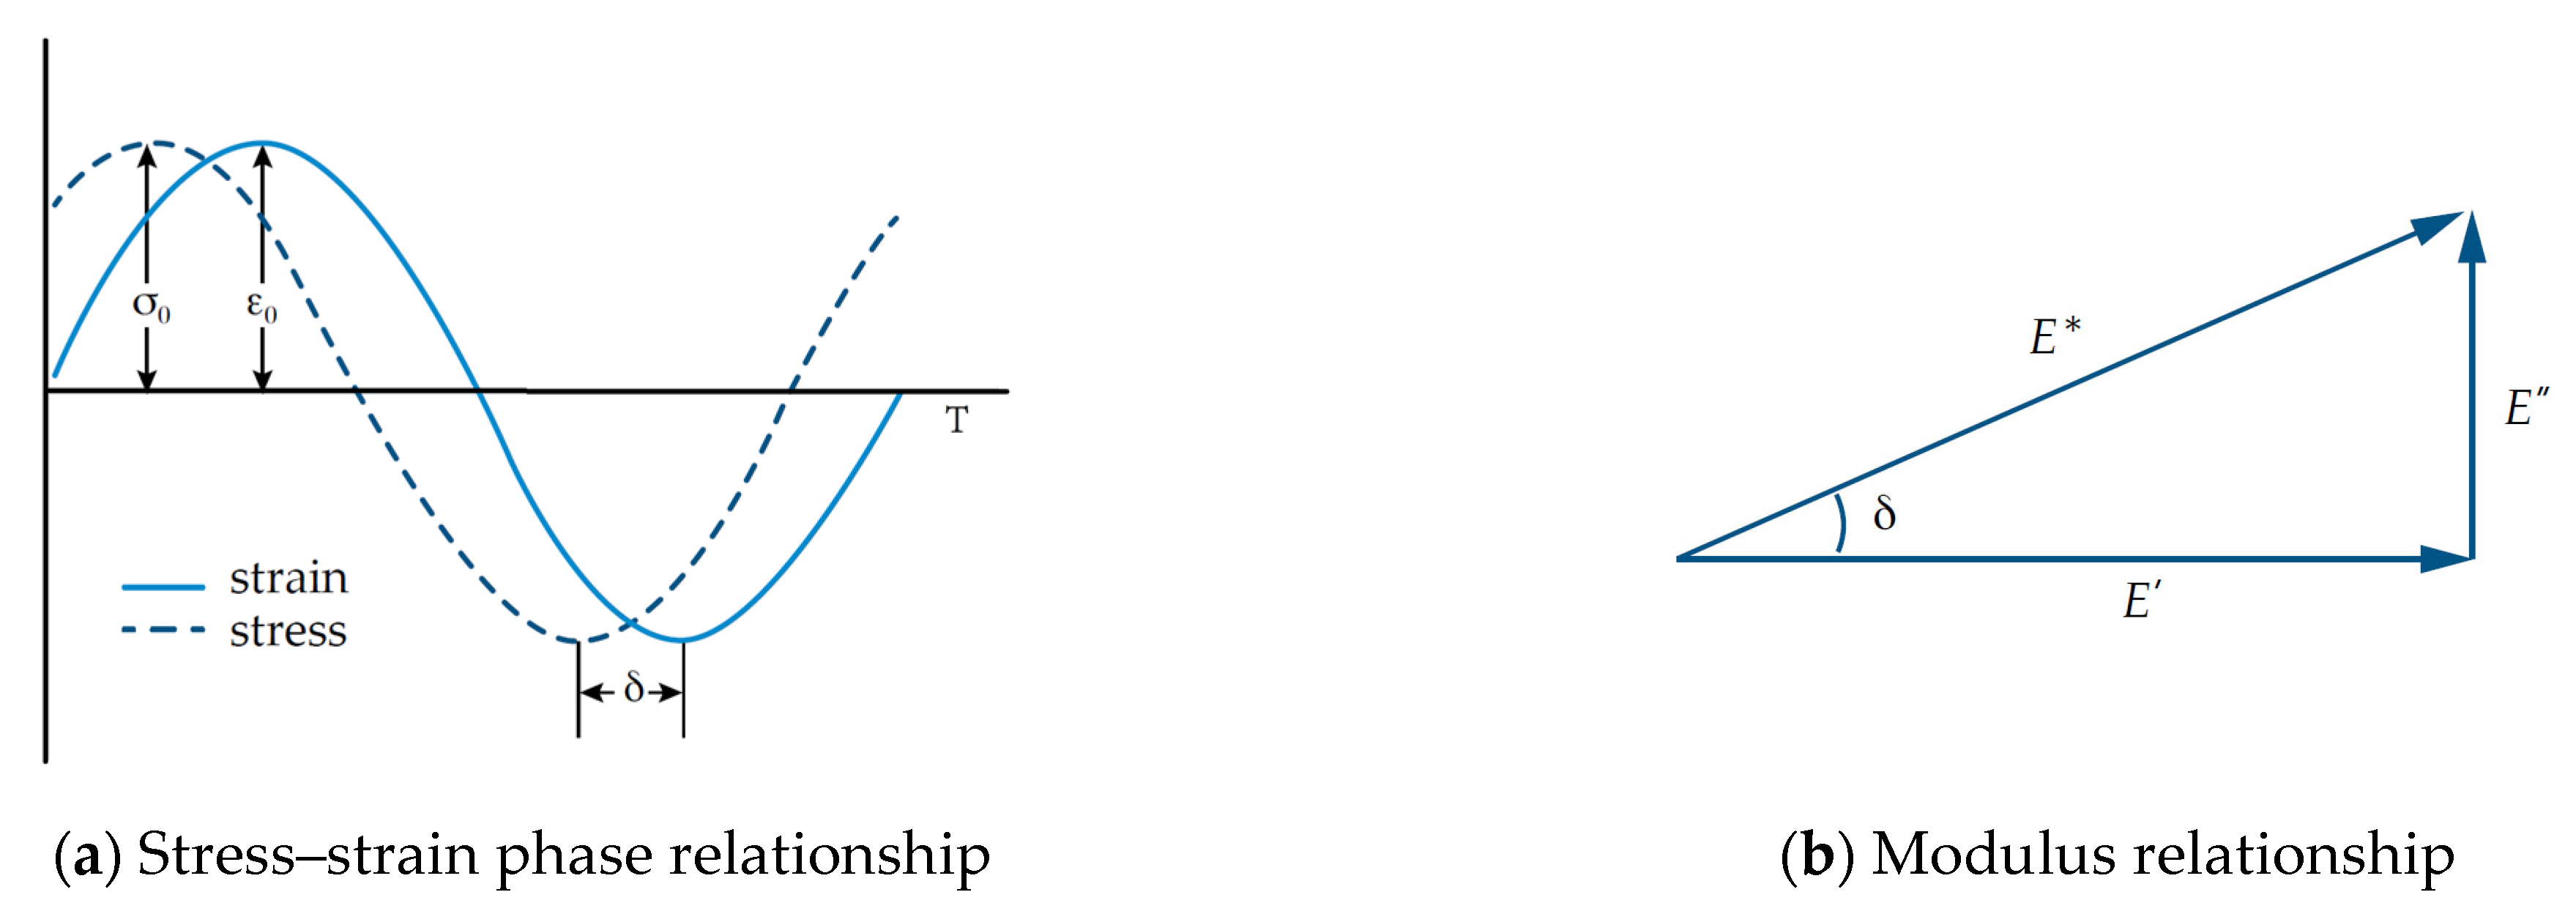
Figure 1. Schematic representation of the mechanical parameter relationship.
Coatings 15 01109 g001
Figure 2. Dual cantilever clamp (a) and DMA specimens (b).
Coatings 15 01109 g002
Figure 3. Temperature spectrum of the dynamic mechanical property parameters.
Coatings 15 01109 g003
Figure 4. Adhesion work of asphalt binders with aggregate.
Coatings 15 01109 g004
Figure 5. Temperature spectra of the dynamic mechanical properties of the asphalt mixtures.
Coatings 15 01109 g005
Figure 6. Comparison of the characteristic temperatures.
Coatings 15 01109 g006
Figure 7. Comparison of the average T range of asphalt mixtures made of different materials.
Coatings 15 01109 g007
Figure 8. The complex modulus and residual modulus of asphalt mixtures.
Coatings 15 01109 g008
Figure 9. Comparison of the average values of RM for different mixtures.
Coatings 15 01109 g009
Figure 10. Relationship between RM and WAS.
Coatings 15 01109 g010
Figure 11. The range of RM values at identical temperature points.
Coatings 15 01109 g011
Figure 12. RMmin and TRM values of the asphalt mixtures.
Coatings 15 01109 g012
Table 1. Basic technical indices of asphalt.
AsphaltsPenetration
(25 °C)
/0.1 mm
Softening
Point
/°C
Ductility
(10 °C)
/cm
Viscosity
(60 °C)
/Pa·s
PG Grade
A16946.988258PG64-22
A27146.7>100194PG64-22
B15176.75814339PG76-22
B24964.4683107PG70-22
Table 2. Aggregate gradation.
Sieve Size (mm)13.29.54.752.361.180.6 0.3 0.150.075
Passing rate (%)97.958.130.321.215.312.09.48.57.0
Table 3. Temperature scanning test setup.
Strain AmplitudeFrequencyHeating RateTemperature Range
50 με1 Hz2 °C/min−35 °C to 75 °C
Table 4. SFE components for aggregate and asphalt binders.
Materials SFE (mJ·m−2)γd (mJ·m−2)γp (mJ·m−2)
AsphaltA112.510.22.3
A219.517.52.0
B115.512.72.7
B222.320.32.0
AggregateL51.032.218.8
G57.316.940.4
Table 5. Fitting results of residual modulus.
Asphalt Mixturey0xcwAR2RMmin/%TRM/°C
A1L80.236.118.2−16.30.938363.836.1
A2L87.937.820.8−22.00.977665.837.8
B1L73.559.323.4−21.90.967351.659.3
B2L77.248.819.9−20.70.981856.548.8
A1G78.540.529.6−25.20.980953.440.5
A2G75.538.210.5−25.60.823849.838.2
B1G77.358.438.1−49.10.999428.258.4
B2G58.160.724.2−22.40.988535.760.7
Disclaimer/Publisher’s Note: The statements, opinions and data contained in all publications are solely those of the individual author(s) and contributor(s) and not of MDPI and/or the editor(s). MDPI and/or the editor(s) disclaim responsibility for any injury to people or property resulting from any ideas, methods, instructions or products referred to in the content.