1. Introduction
Shape memory alloys (SMAs) are functional materials capable of recovering their original shape after plastic deformation when subjected to thermal stimuli [
1,
2,
3,
4,
5]. Among them, NiTi and Cu-based alloys are the most widely used due to their ability to exhibit the shape memory effect and superelasticity (also known as pseudoelasticity).
Copper-based SMAs are particularly attractive because of their lower cost, high thermal and electrical conductivity, and ease of casting and forming [
1,
6]. However, a coarse-grain structure often limits their mechanical performance, which promotes brittleness at grain boundaries and facilitates crack initiation, propagation, and eventual intergranular fracture [
1,
7]. These limitations can be addressed by adding alloying elements such as boron (B), titanium (Ti), and zirconium (Zr), which act as grain refiners by inhibiting grain growth during heat treatment [
8,
9,
10,
11]. Additionally, due to their strong sensitivity to compositional changes, the functional behavior of these alloys—including transformation temperatures, shape memory performance, thermal stability, and mechanical strength—can be finely tuned.
Although most studies on the tribological behavior of SMAs have focused on the NiTi system, copper-based SMAs have also received increasing attention. These materials demonstrate excellent wear resistance, with NiTi alloys outperforming steels and other metals despite their relatively low hardness [
1,
4,
5,
12,
13,
14]. Dry sliding wear tests have confirmed the outstanding tribological performance of SMAs [
12,
15]. For instance, Lin et al. [
13] attributed the high wear resistance of NiTi in its austenitic condition to intrinsic pseudoelasticity and identified adhesion, abrasion, fatigue, and embrittlement as the dominant wear mechanisms. Similarly, Liang et al. [
14] highlighted the combined effect of pseudoelasticity and pseudoplasticity—termed total elastic recovery capacity—as critical to wear performance.
One of the earliest investigations of wear mechanisms in copper-based SMAs was conducted by Wang et al. [
16] using a Cu-26Zn-4Al alloy. Their results showed that the martensitic phase exhibited superior wear resistance compared to the austenitic phase. This behavior was attributed to the reorientation of martensitic twin variants under load (pseudoplasticity). Conversely, the austenitic phase benefited from load-induced martensitic transformation (pseudoelasticity), contributing to wear resistance. In both cases, reversible deformation increased the contact area, reduced contact stress, and minimized material loss.
Therefore, establishing a clear correlation between wear resistance and shape memory behavior is essential, as SMAs differ significantly from conventional materials. While wear resistance in traditional metals is primarily governed by hardness, ductility, and thermomechanical processing, SMAs are strongly influenced by their transformation characteristics. Despite their relatively low hardness, shape memory alloys frequently exhibit exceptional tribological performance, largely due to the superelastic effect and the reorientation of martensitic variants (pseudoplasticity) [
17].
In recent years, research on copper-based SMAs has increasingly focused on systems such as Cu–Al–Ni and Cu–Al–Be, as the addition of nickel (Ni) and beryllium (Be) has been shown to enhance the stability of the high-temperature β phase [
18]. However, most studies have investigated the effects of Ni and Be individually [
19,
20,
21,
22,
23,
24,
25,
26]. Zhu et al. [
27] were among the few to examine the simultaneous addition of both elements, developing a Cu11.5Al3.8Ni0.4Be alloy and assessing its transformation temperatures. Nonetheless, their study did not address key properties such as hardness, corrosion resistance, or wear behavior as a function of Be content.
The present study evaluates the effect of partially substituting Ni with Be in Cu–Al–Ni shape memory alloys. The main objective is to establish correlations between Be content and critical material characteristics, including hardness, transformation temperatures, microstructure, corrosion susceptibility, and wear resistance.
2. Materials and Methods
Cu-Al-Ni shape memory alloys were prepared by arc melting under an argon atmosphere. Beryllium (Be) was added in concentrations ranging from 0.2 to 1.5 wt.% by partially substituting nickel (Ni). The resulting compositions of the Cu-Al-Ni-Be alloys are listed in
Table 1. To ensure chemical homogeneity, each alloy was melted and cast at least three times. The molten alloys were poured into iron molds to form plates with dimensions of 15 × 12 × 1 cm
3. A subsequent heat treatment was performed by heating the samples to 800 °C for 15 min, followed by water quenching at room temperature to promote the formation of a martensitic microstructure.
Transformation temperatures were determined using dilatometry. The samples were heated to 700 °C with a holding time of 5 min. Heating and cooling rates were set at 20 °C/min under an inert argon atmosphere using a LINSEIS L75 Platinum Series dilatometer.
The samples were superficially prepared using 600, 1000, and 1500 grit SiC abrasive papers and polished with 1 μm and 0.1 μm alumina suspensions. The microstructure was revealed by etching with a ferric chloride solution (95 mL ethanol, 2 g FeCl3, 2 mL HCl) and analyzed using an LEXT confocal microscope (Olympus, Hachioji, Japan).
X-ray diffraction (XRD) analysis was performed using a diffractometer (Siemens/Bruker, Billerica, MA, USA) operating at 30 kV and 20 mA, with CuKα radiation. Scans were conducted over a 2θ range of 20°–90° at a step size of 0.02°/s.
Vickers microhardness testing was conducted using a FM800 microindenter (Future-Tech Corp., Kanawana, Japan) with a 100 g load and a dwell time of 15 s. Ten indentations were performed per sample to ensure statistical reliability.
Electrochemical corrosion behavior was evaluated using potentiodynamic polarization tests in a standard three-electrode cell. A saturated calomel electrode (SCE) served as the reference electrode, platinum foil as the counter electrode, and the alloy sample as the working electrode (exposed area ≈ 0.57 cm2). All tests were performed at 25 °C in 0.1 M NaCl solution using a Reference 600 potentiostat (Gamry Instruments Inc., Warminister, PA, USA).
The open circuit potential (OCP) was measured over 3600 s, followed by polarization scans from −100 to +1500 mV vs. OCP at 1 mV/s. Corrosion parameters were extracted using Tafel extrapolation following ASTM G3 [
28,
29].
Wear resistance was assessed using a UMT-2 microtribometer (CETR/Bruker, Karlsruhe, Germany) in a pin-on-flat configuration. Tests were conducted in polished samples (70 nm Ra) with a 10 mm AISI 52100 steel ball as the counter body, under a 5 N normal load and a reciprocating frequency of 3 Hz, for a total sliding distance of 100 m and a contact pressure of 256 MPa. Post-test surface analysis was performed using a Mira 3 (Tescan, Brno, Czeck Republic) scanning electron microscope.
3. Results and Discussion
3.1. Microstructural Analysis
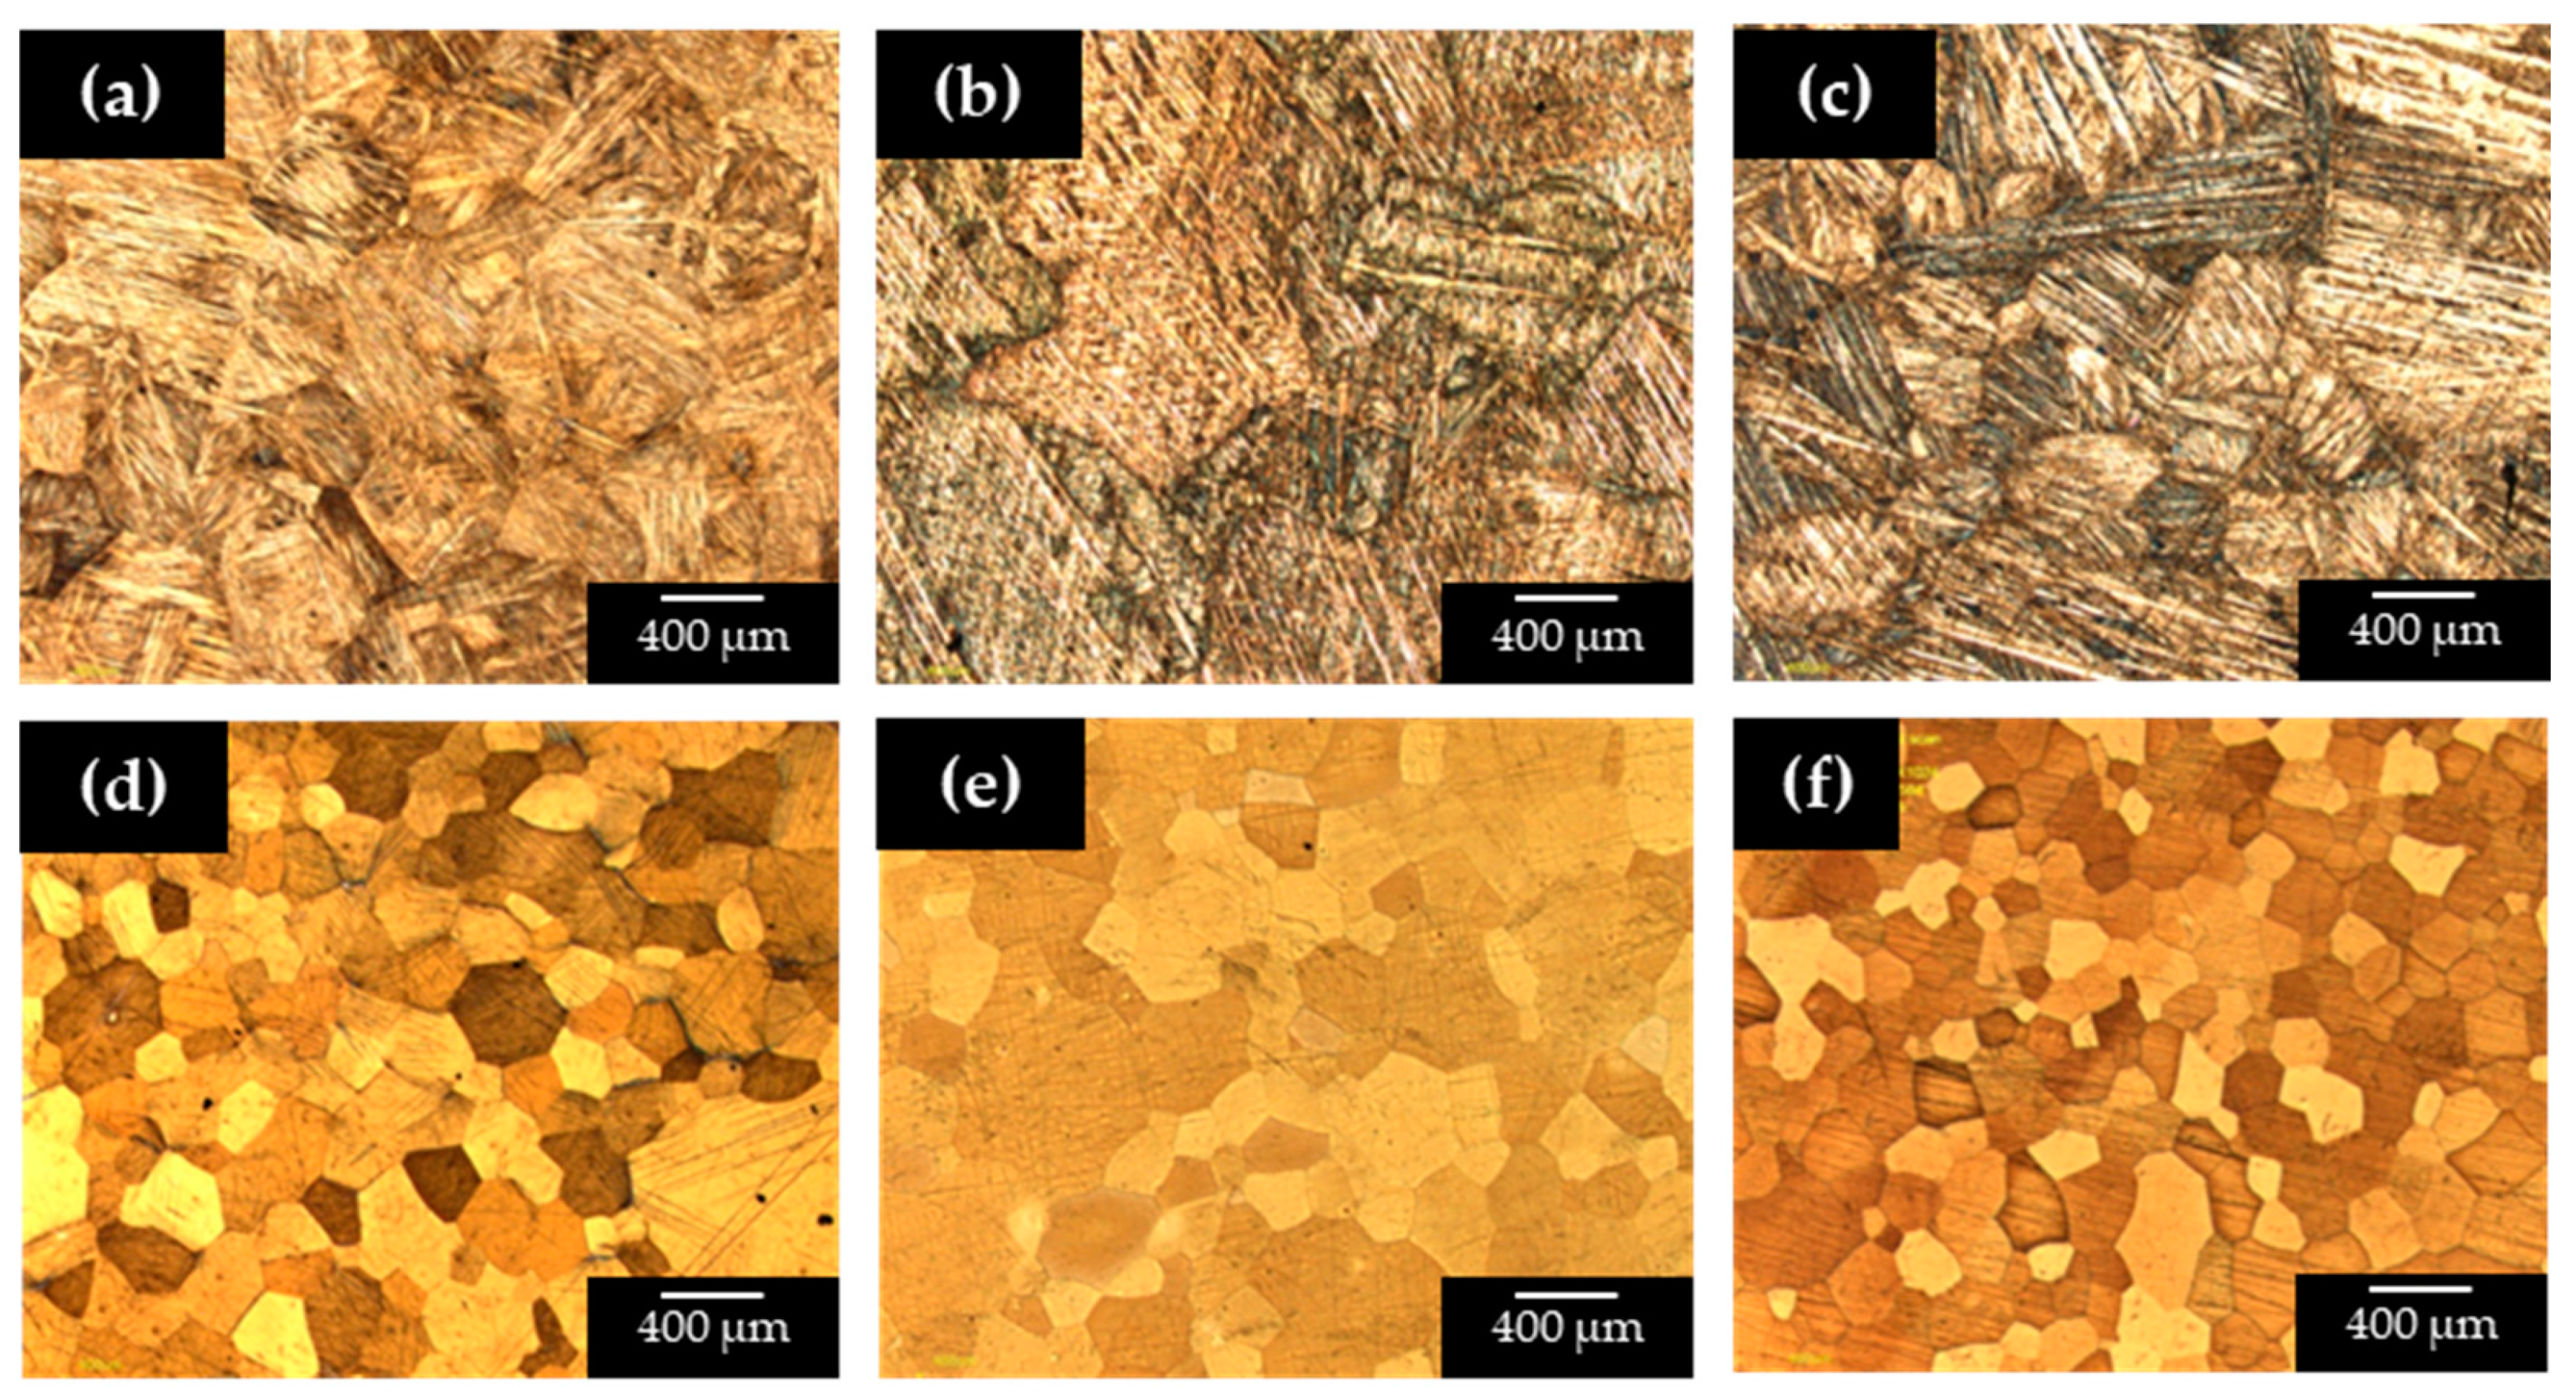
The microstructural analysis revealed that alloys with low Be content (0.0 to 0.4 wt.%) predominantly exhibited a martensitic structure, as shown in
Figure 1a–c. These microstructures consisted mainly of acicular martensite with a needle-like morphology, accompanied by some retained austenite. The martensite observed in these alloys is likely the β′ phase, which appeared finer and more abundant in the sample containing 0.2 wt.% Be (
Figure 1b).
Additionally, plate-like β′ martensite precipitates were observed in
Figure 1a–c, commonly associated with Cu–Al–Ni alloys containing ~14 wt.% Al [
30]. Similar acicular and plate-like features have also been reported in Cu–Al–Be systems, where Be promotes variant refinement and suppresses abnormal grain growth [
22,
23]. In contrast, increasing Be content (≥0.6 wt.%) stabilized the high temperature β austenite phase with a body-centered cubic (BCC) structure (
Figure 1d–f). The stabilization of this phase is in agreement with findings by Canbay et al. [
23] and Xu et al. [
22], who showed that Be additions shift the β ↔ β′ equilibrium towards the β phase. A notable grain refinement effect was also observed with increasing Be content (
Figure 1d–f). This refinement is significant because it enhances hardness and mechanical stability, as reported in similar Cu–Al–Ni-based alloys alloyed with Ti or Zr [
9,
10]. Overall, the combined effects of Be—stabilization of the β phase and refinement of grains—support its dual role as both a structural modifier and functional stabilizer in Cu-based SMAs.
3.2. Dilatometry Study
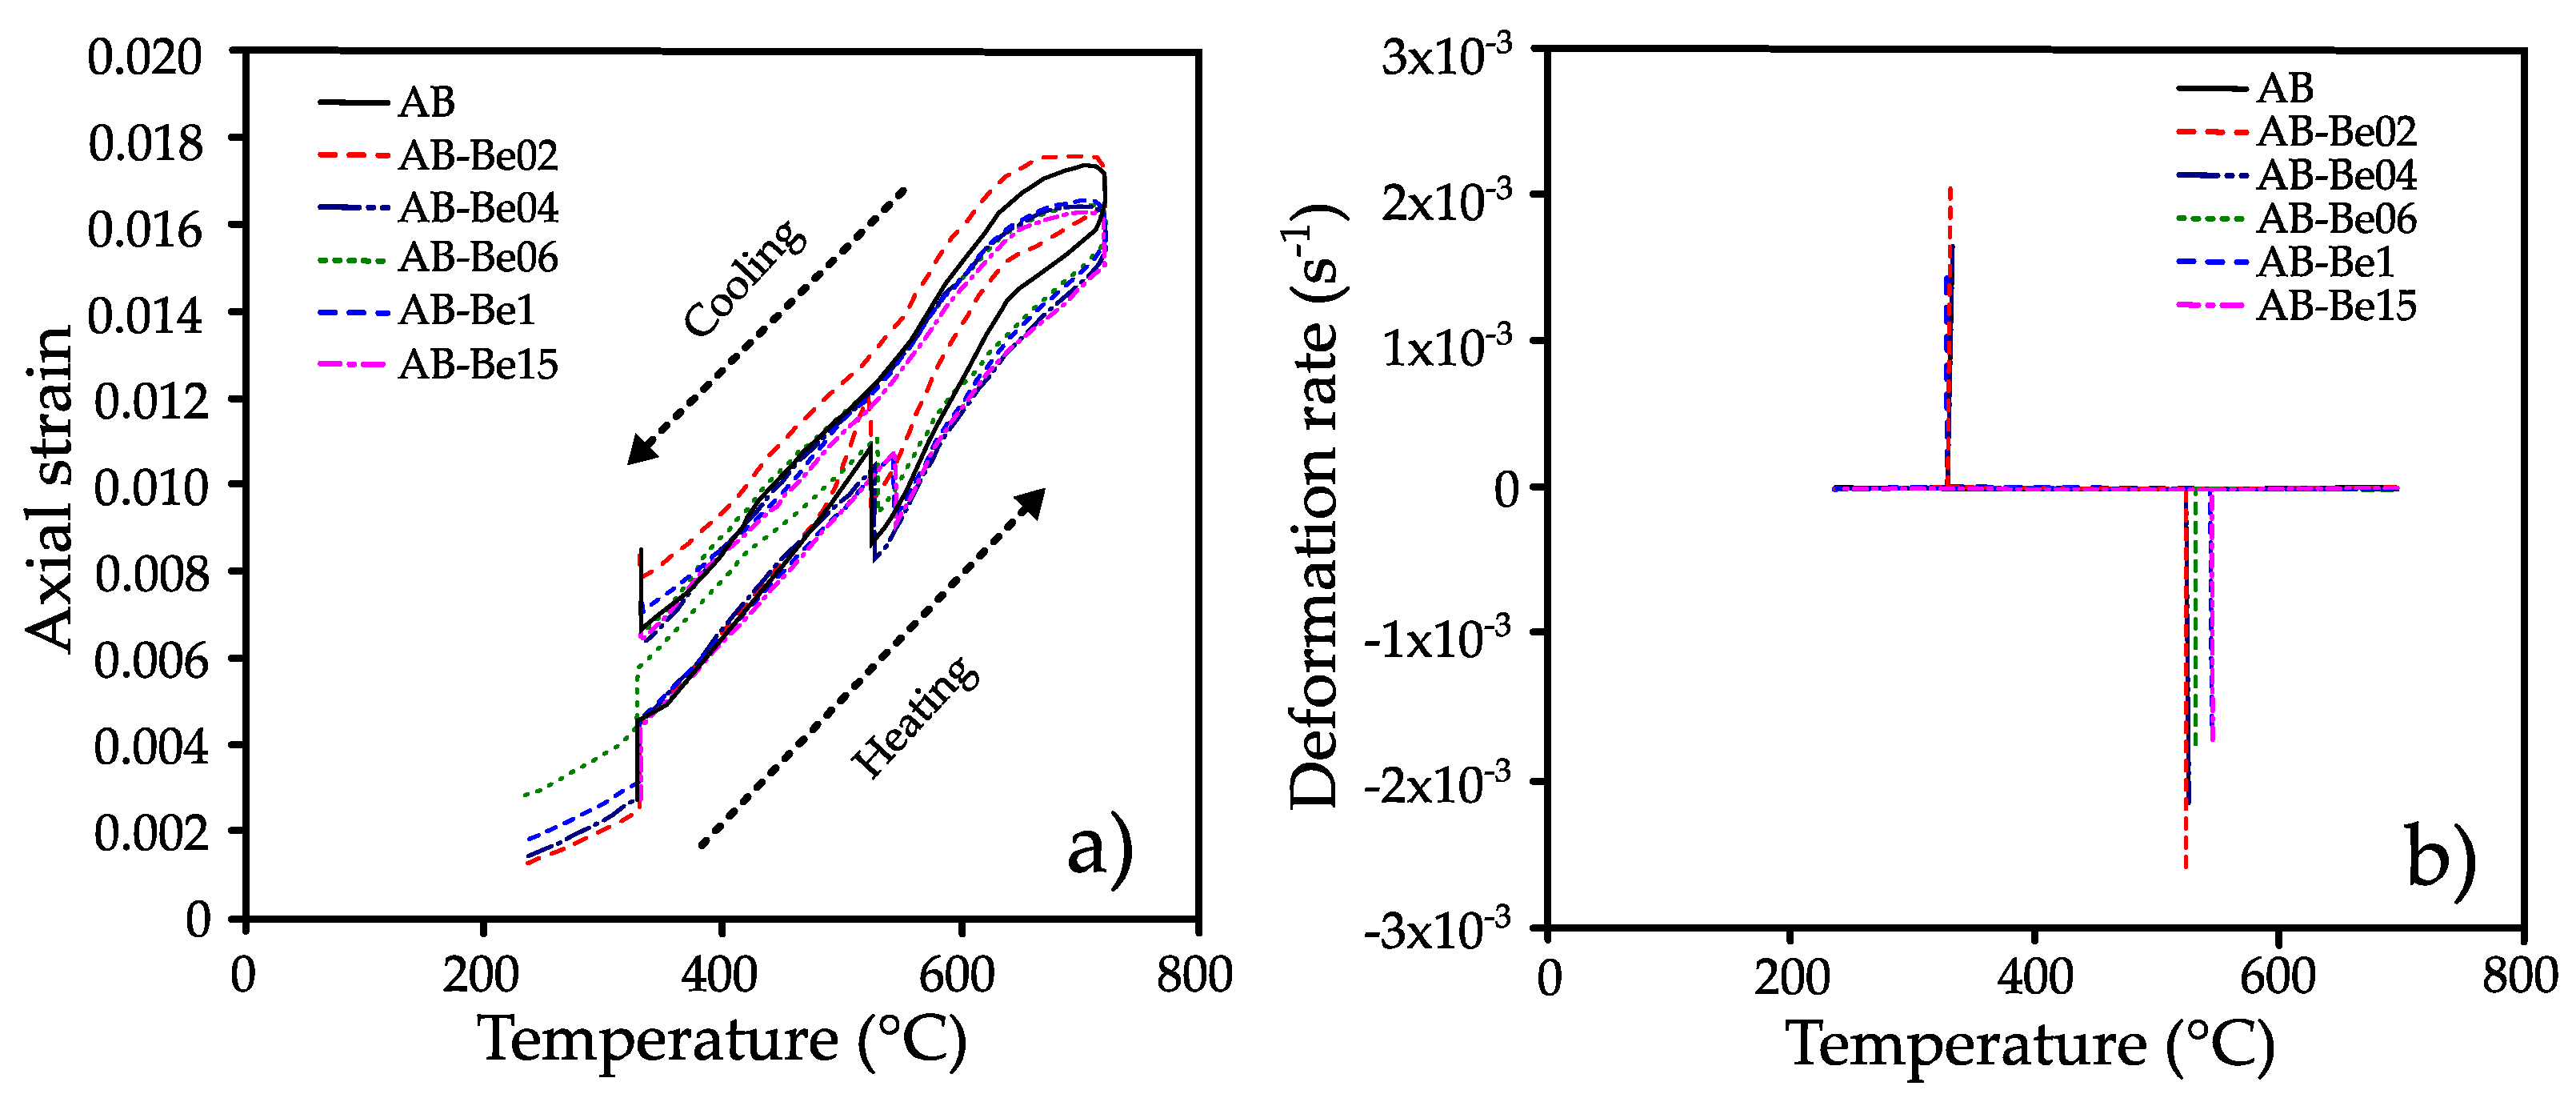
Figure 2a shows the axial deformation of the alloys and the corresponding phase transitions during continuous heating. All samples exhibited similar thermal behavior. An initial expansion was observed around 330 °C, followed by increased deformation attributed to the decomposition of the β′ and γ′ martensitic phases. Continued heating led to a marked contraction near 520 °C, indicating the reverse transformation to the β austenite phase.
Upon cooling, a noticeable change in deformation was again observed at ~330 °C, suggesting the reformation of martensitic phases from the β austenite [
31].
Figure 2b presents the deformation rate as a function of temperature, highlighting two distinct transitions: a positive peak around 330 °C and a negative peak between 520 and 550 °C, consistent with the observed transformations.
As shown in
Figure 3a, the transformation near 330 °C remained largely unaffected by Be content, with all alloys displaying similar strain rate behavior at that temperature. In contrast,
Figure 3b reveals that Be content significantly influenced the transformation to austenite: while additions up to 0.4 wt.% caused minimal variation, higher concentrations (≥0.6 wt.%) shifted the transformation temperature upward by as much as 20 °C, with the 1.5 wt.% Be alloy showing the highest value.
According to the literature, the phase transformations occurring within the 300–600 °C range in Cu–Al–Ni shape memory alloys are primarily associated with the reverse martensitic transformation (β′ → β). This transition involves the reversion of the low-temperature β′ (18R) martensite to the high-temperature austenitic β phase, which has a body-centered cubic (BCC) structure [
18,
32]. In this study, the thermal dilatometry results reveal a marked expansion beginning near 330 °C and a distinct contraction between 520 °C and 550 °C, which are characteristic signatures of this transformation pathway.
3.3. Microhardness of CuAlNiBe Alloys
The Vickers microhardness results of the Cu–Al–Ni–Be alloys are shown in
Figure 4. A slight decrease in hardness was observed with Be additions up to 0.4 wt.% compared to the base alloy (0 wt.% Be). This behavior can be attributed to the predominance of the martensitic β′ phase, which has an acicular morphology and is characterized by high twin-boundary mobility that facilitates pseudoelastic deformation under stress [
33,
34,
35].
At Be contents equal to or greater than 0.6 wt.% there was a progressive increase in hardness, as indicated by the percentage. This threshold effect is associated with the stabilization of the high-temperature austenitic β phase (BCC structure) at room temperature. Evidence for the β phase is provided by the XRD patterns (
Section 3.4,
Figure 5), where peaks corresponding to the β-BCC structure become detectable for Be ≥ 0.6 wt.%. This observation is consistent with previous reports showing that Be additions promote β stabilization in Cu–Al–Ni alloys [
36,
37]. The presence of the β phase limits deformation by martensitic reorientation, leading to higher hardness, while the grain refinement observed at higher Be contents (
Figure 1d–f) further impedes dislocation motion and enhances resistance to plastic deformation. The magnitude of the increase becomes particularly significant at 1.0 wt.% Be, where analysis confirms a clear difference compared to both the base alloy and the low-Be compositions. Overall, the hardness evolution in Cu–Al–Ni–Be alloys reflects the combined influence of phase composition and grain size: alloys dominated by the martensitic β′ phase show lower hardness but greater pseudoplasticity, while those containing stabilized austenitic β exhibit higher hardness but reduced reorientation capability. These findings highlight how Be additions can be tuned to tailor the mechanical behavior of Cu-based SMAs.
3.4. Structure Analysis
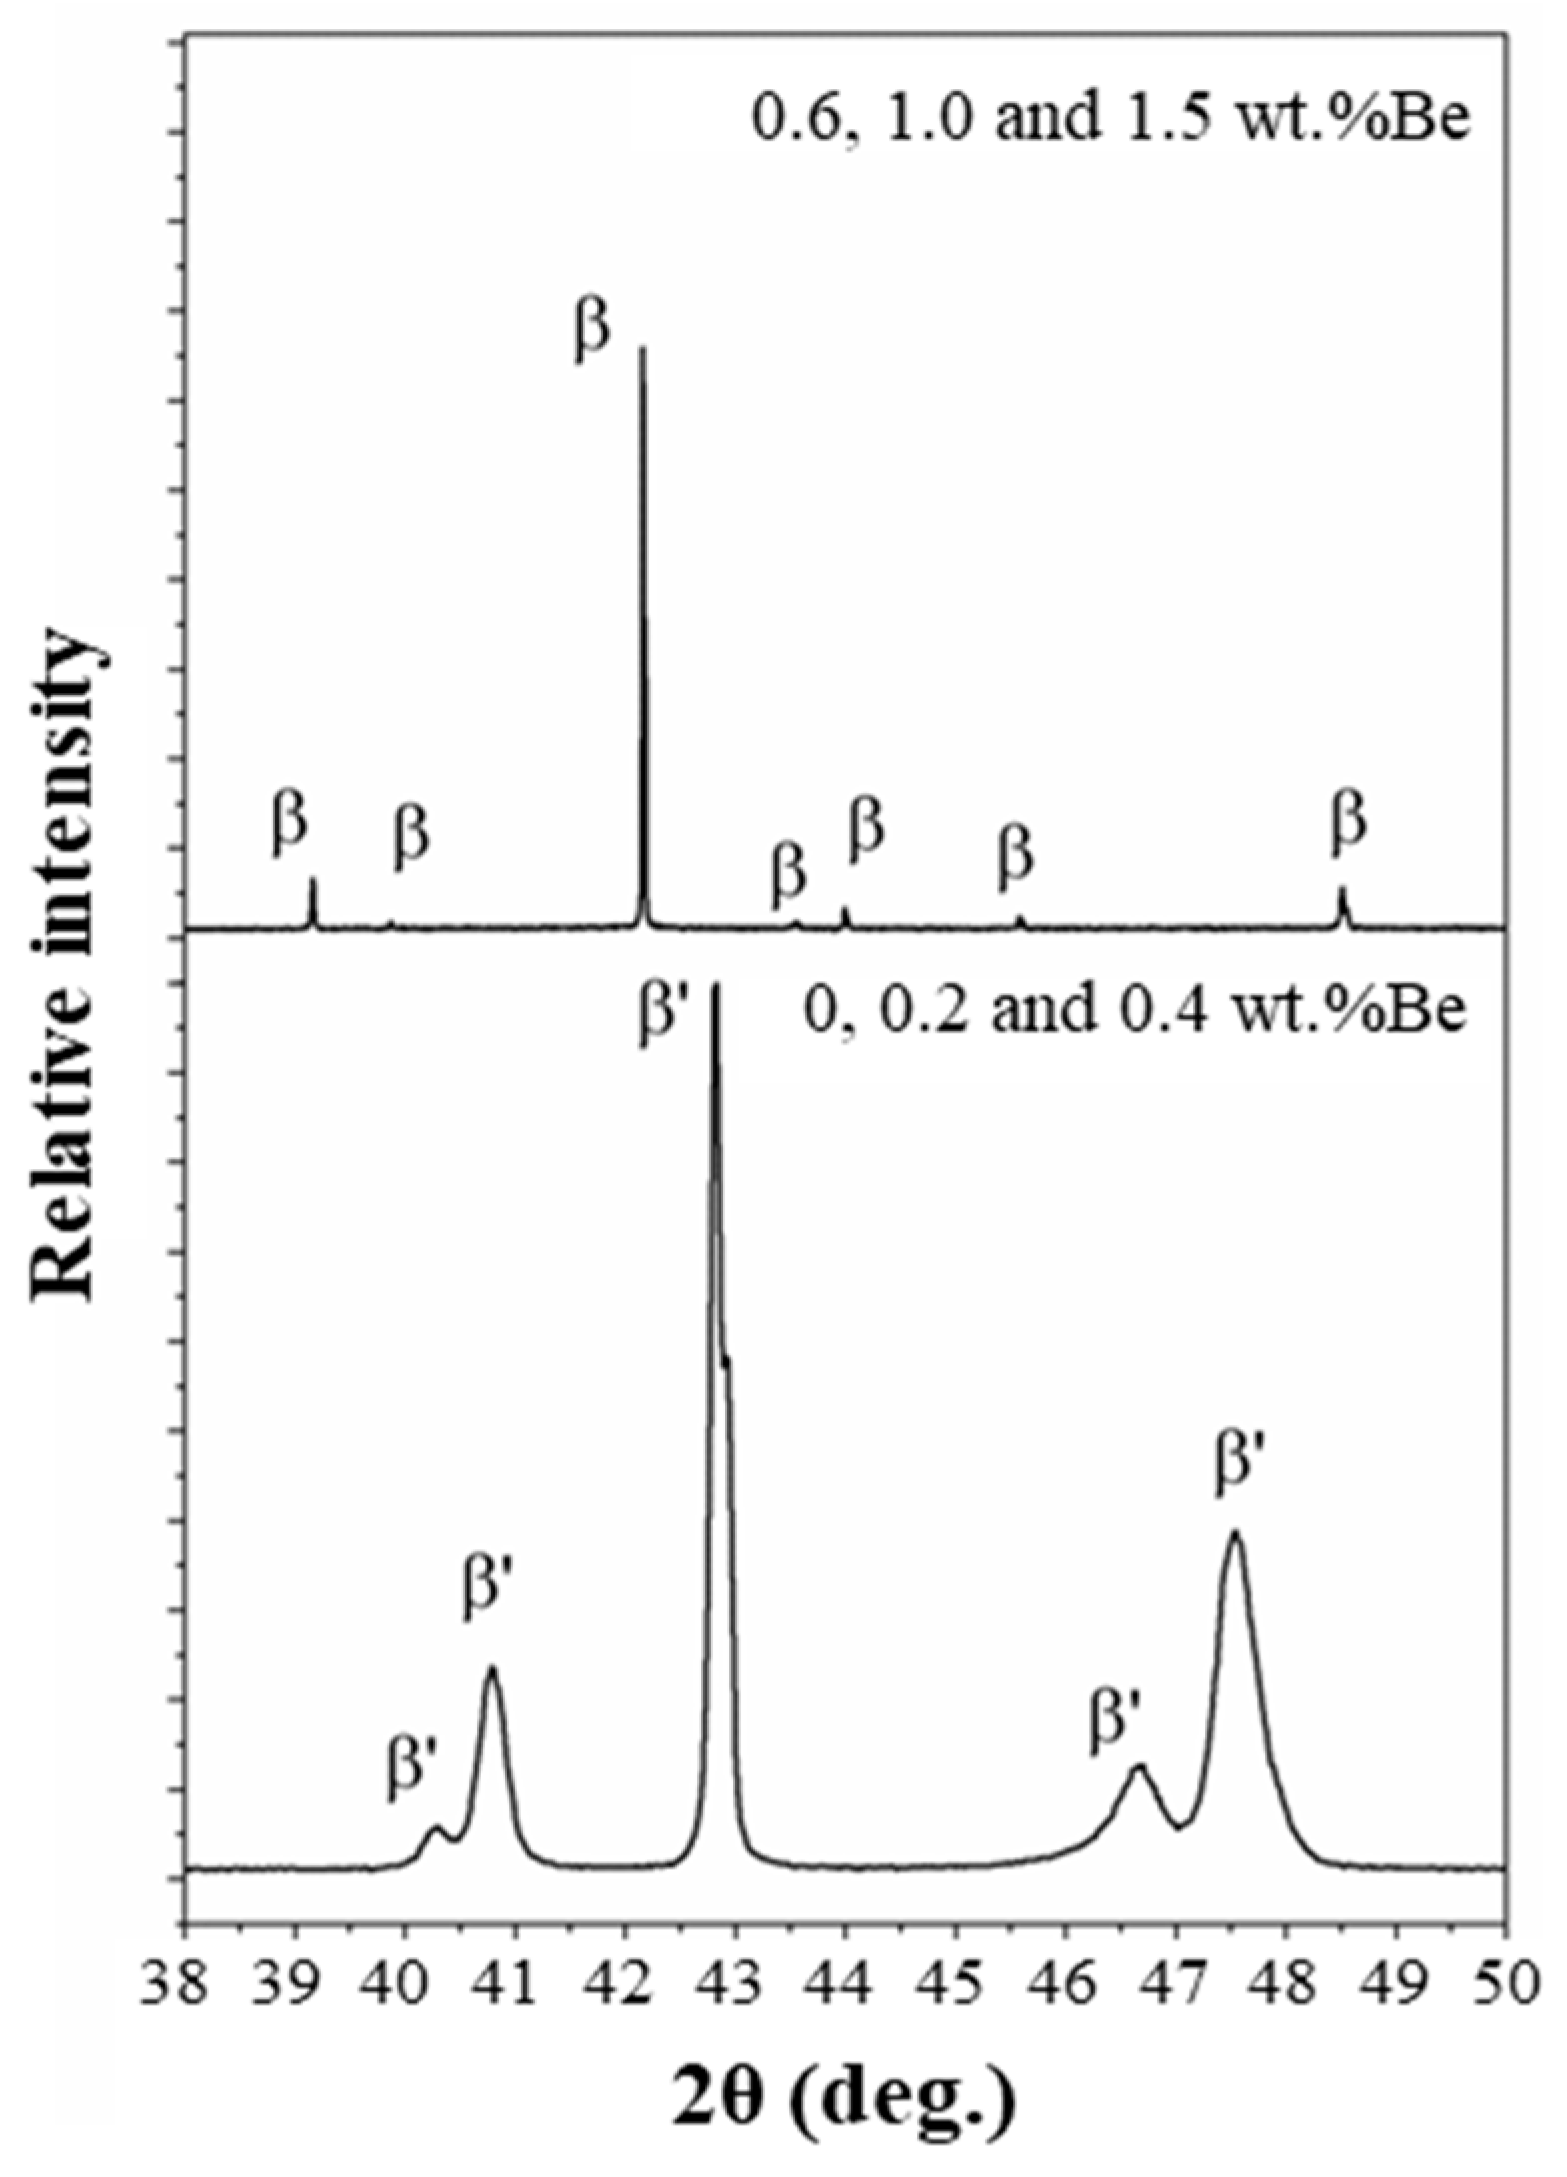
The X-ray diffraction (XRD) patterns presented in
Figure 5 confirm the presence of different phases depending on the Be content in the alloys. For Be contents of 0.0, 0.2, and 0.4 wt.%, the diffraction peaks correspond predominantly to the martensitic β′ phase, characterized by the 18R stacking sequence and a rhombohedral structure. These results are consistent with the microstructures shown in
Figure 1a–c, where the acicular martensite morphology is dominant.
In contrast, samples with Be contents equal to or greater than 0.6 wt.% exhibit diffraction peaks corresponding to the austenitic β phase, which crystallizes in a body-centered cubic (BCC) structure. This indicates that at higher Be concentrations, the stabilization of the β phase extends to room temperature, effectively suppressing the martensitic transformation. Such behavior aligns with previous studies that have shown that Be additions can significantly influence phase stability and transformation temperatures in Cu–Al–Ni-based shape memory alloys [
23].
Furthermore, the shift in peak positions observed in the XRD patterns suggests that the addition of Be induces lattice distortions and modifies the unit cell parameters. This structural modification may also contribute to the increased hardness observed in these samples (
Section 3.3), as the BCC structure offers higher resistance to plastic deformation compared to the martensitic phase.
Overall, the XRD results corroborate the microstructural and mechanical findings, demonstrating the dual role of Be in stabilizing the austenitic phase and influencing the mechanical properties of Cu–Al–Ni–Be shape memory alloys.
3.5. Corrosion Behavior
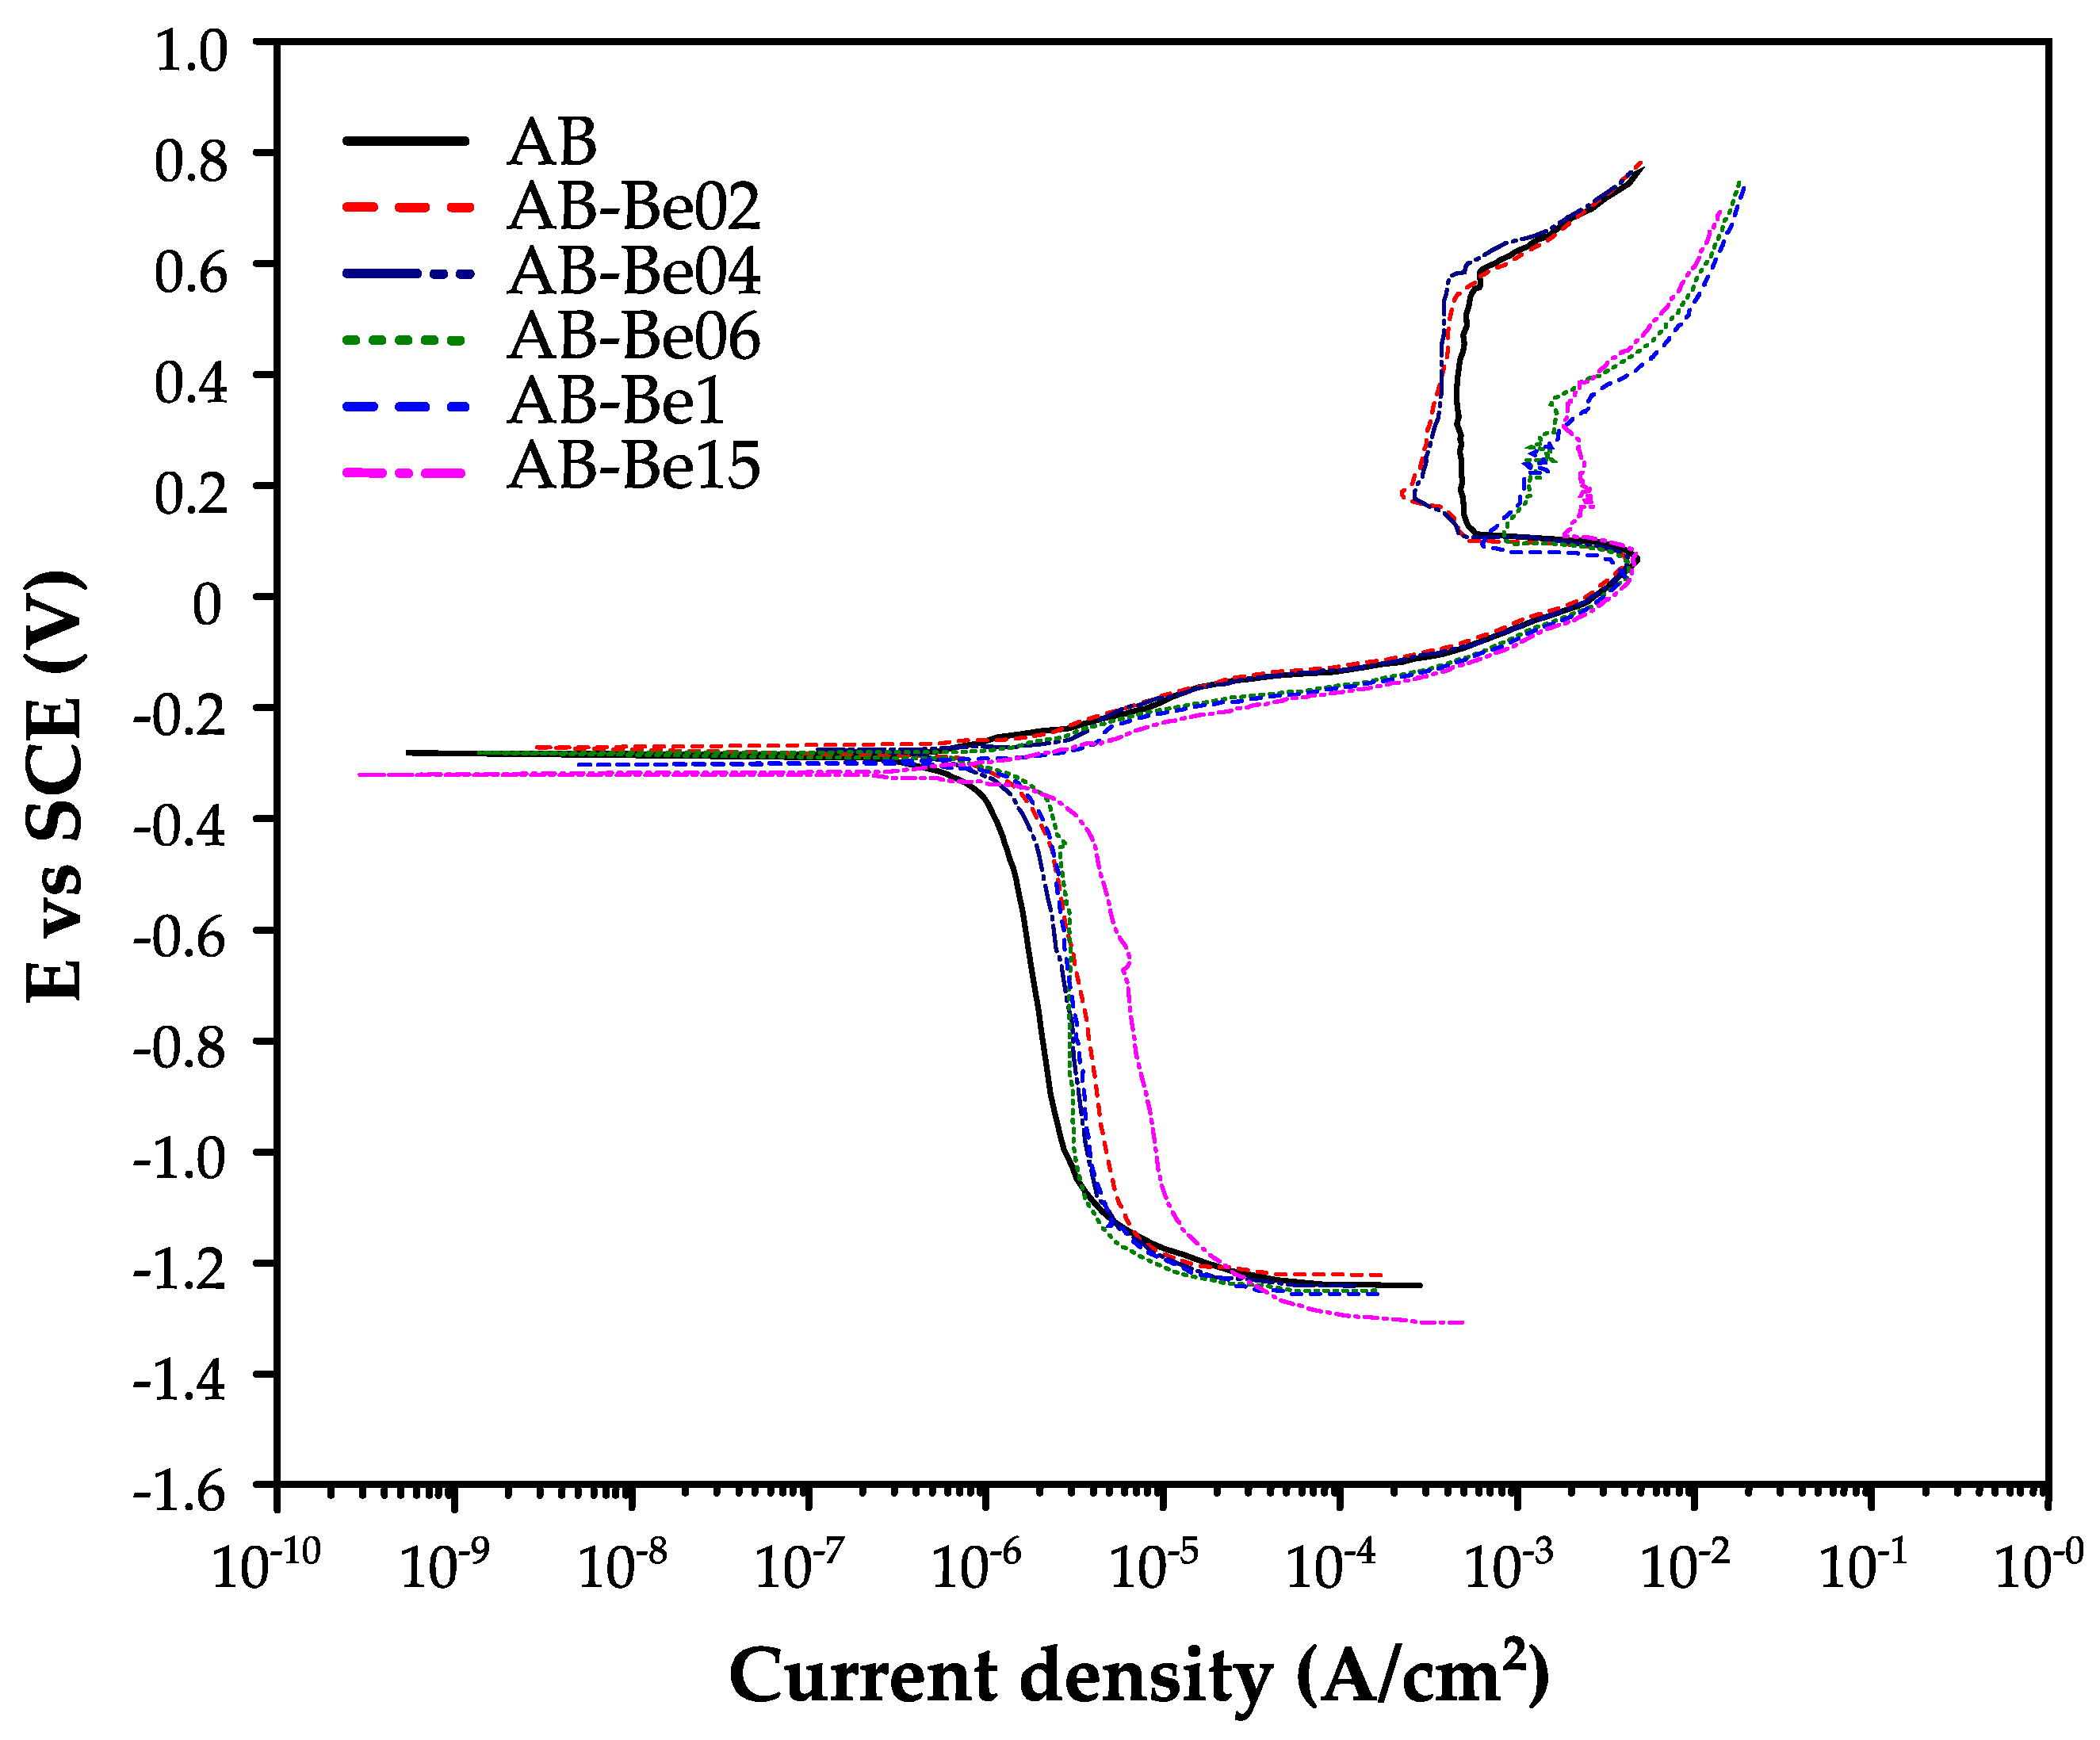
Figure 6 shows the potentiodynamic polarization curves of the Cu–Al–Ni–Be alloys as a function of Be content in a 3.5 wt.% NaCl solution. The cathodic branch of each curve corresponds to the oxygen reduction reaction, while the linear portion of the anodic branch indicates Tafel behavior, typically associated with uniform corrosion. At more positive potentials, a sudden increase in current density is observed, indicating the onset of pitting corrosion.
The results indicate that the corrosion potential (E
corr) and the corrosion current density (i
corr) vary significantly with Be content, as shown in
Table 2. The alloy with 0.2 wt.% Be exhibited the most noble E
corr value (−271 mV) but also a relatively high i
corr (1.74 μA/cm
2), resulting in a corrosion rate of 1.16 mpy, which is slightly higher than that of the Be-free base alloy. Overall, alloys with Be contents between 0.0 and 0.4 wt.% displayed similar corrosion behavior, while samples containing 0.6 wt.% or higher Be exhibited increased corrosion susceptibility. This is likely due to the stabilization of the austenitic β phase at room temperature, which is known to be more susceptible to localized corrosion phenomena such as pitting and crevice corrosion [
23].
Although the 0.2 wt.% Be sample exhibits a slightly more noble E
corr (−271 mV) compared to the base alloy (−287 mV), its corrosion current density (1.74 μA/cm
2) is higher than that of the base (1.02 μA cm
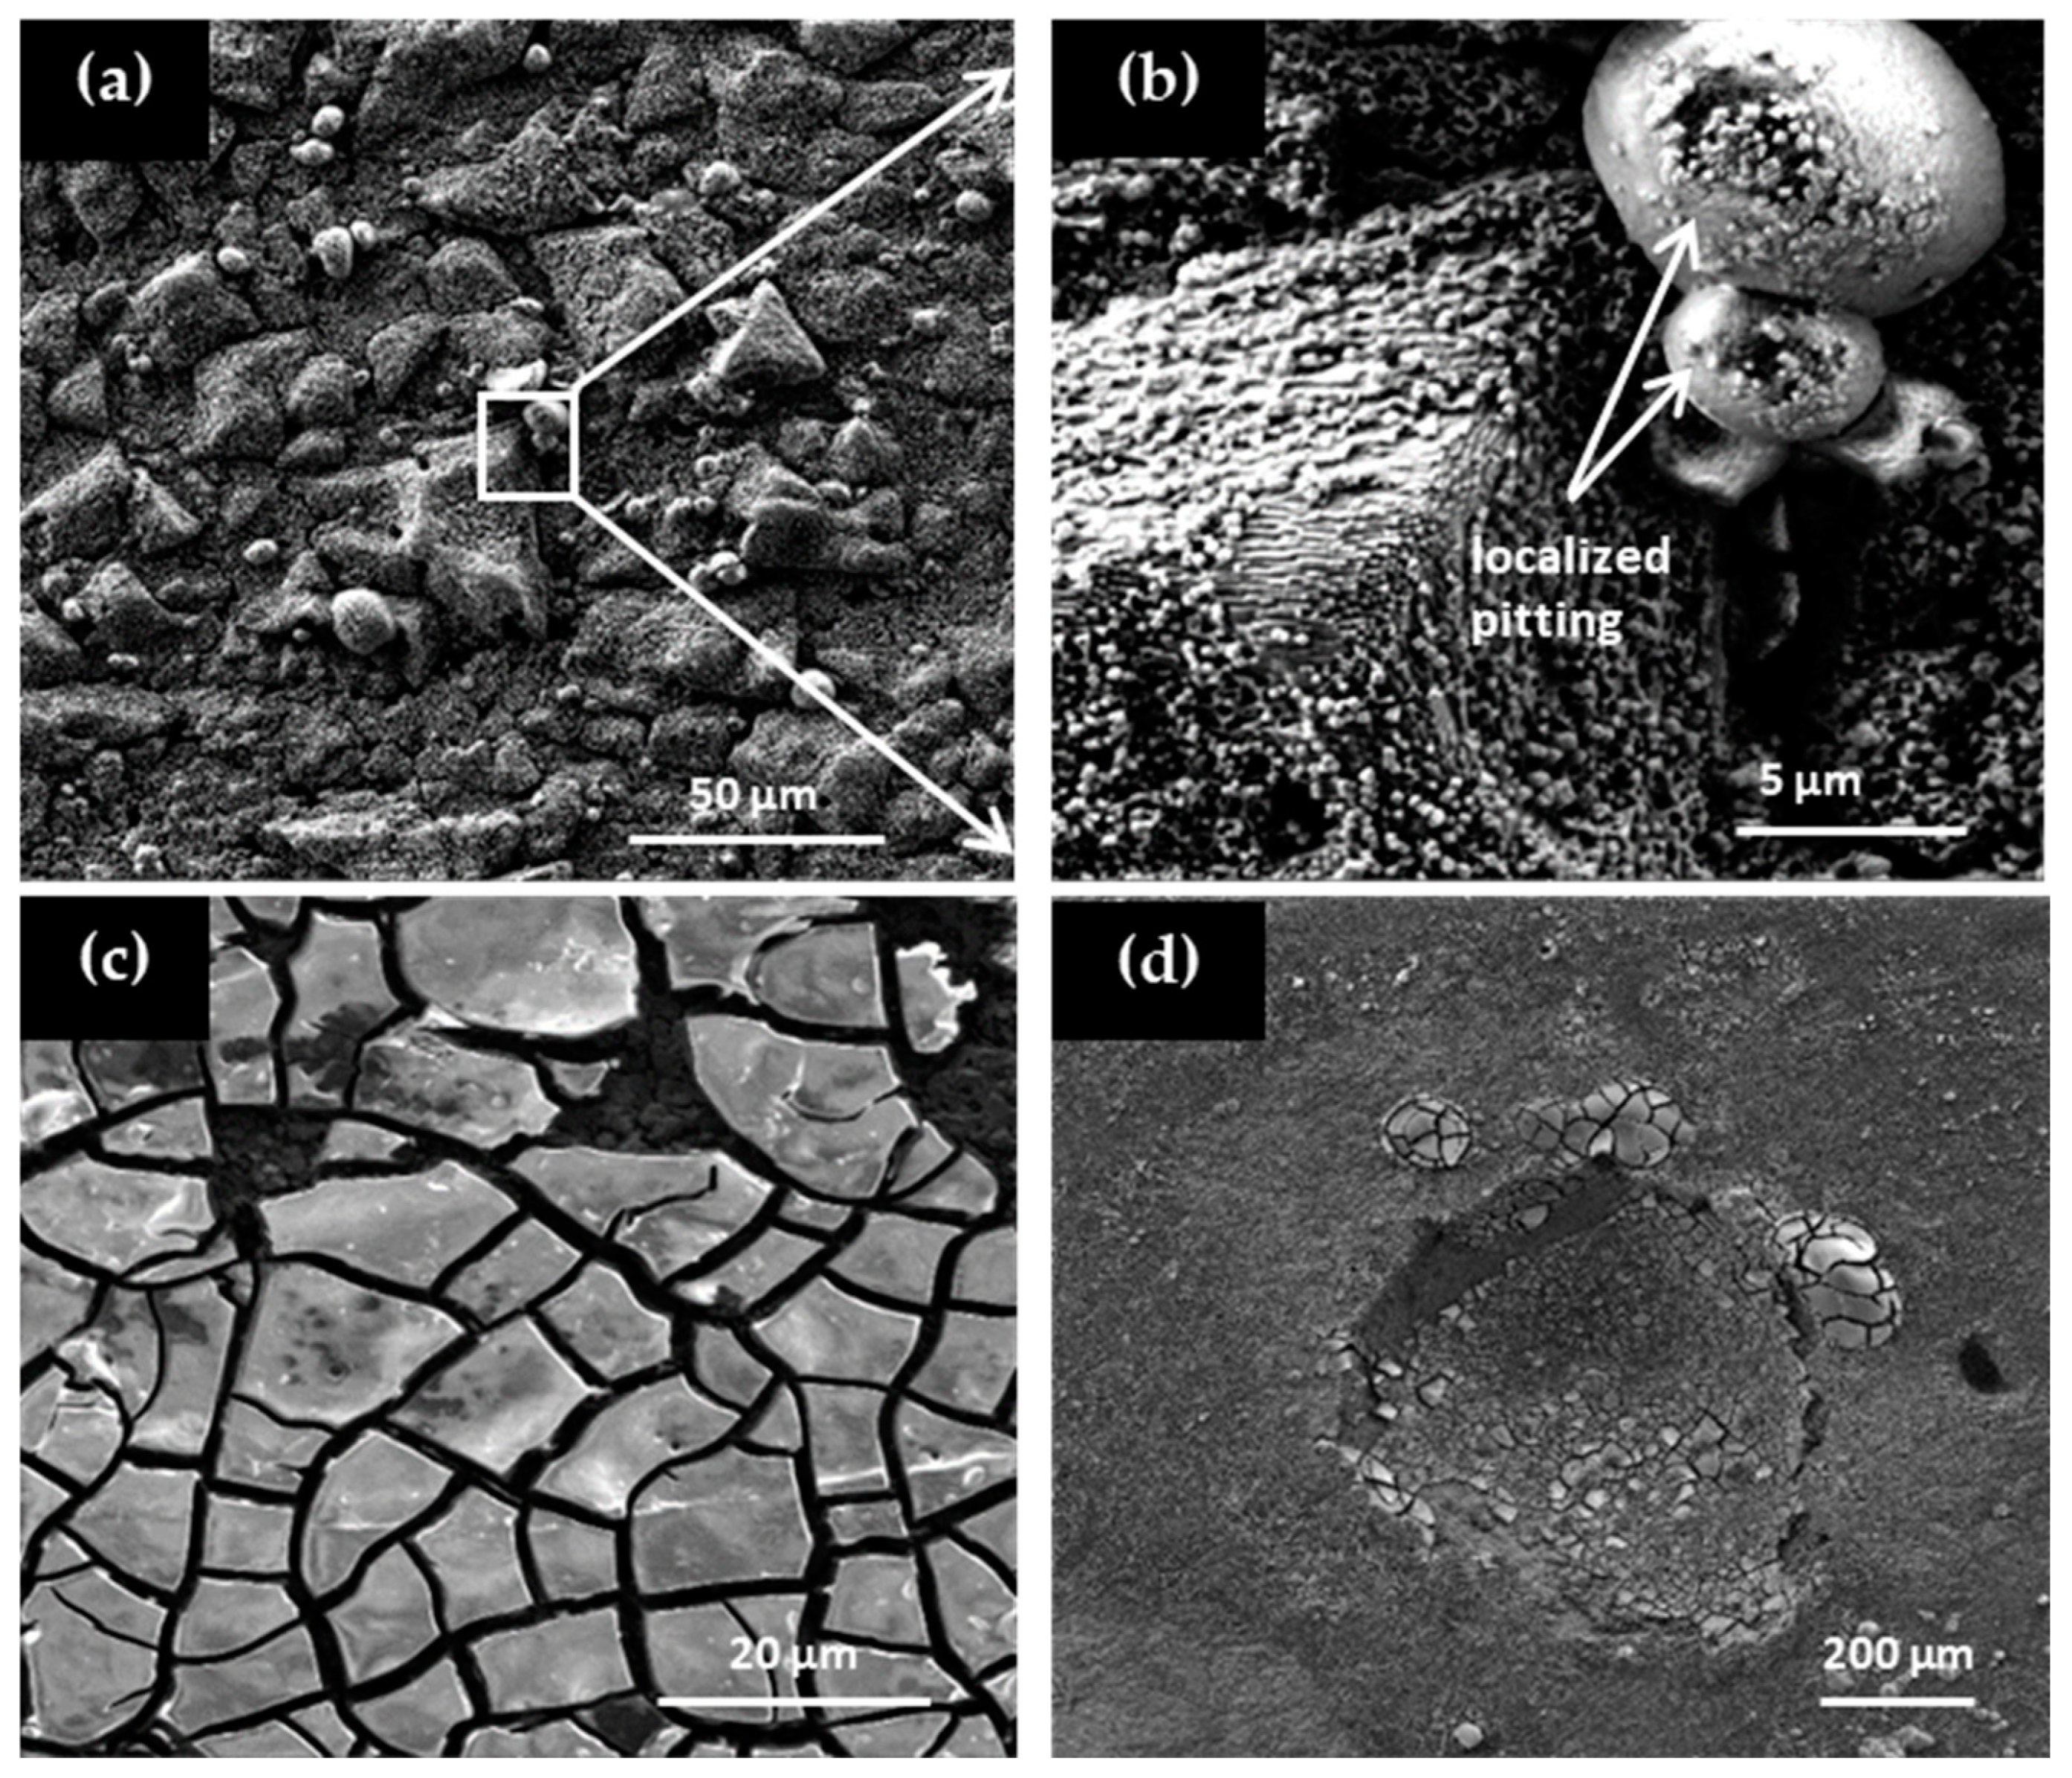
−2). This indicates that a more positive Ecorr does not necessarily imply improved corrosion resistance, as confirmed by localized pitting observed in SEM (
Figure 7b). For Be ≥ 0.6 wt.%, both Ecorr becomes progressively more negative and icorr increases monotonically, clearly demonstrating a loss of electrochemical stability and reduced corrosion resistance with increasing Be content.
SEM micrographs of the corroded surfaces are shown in
Figure 7, highlighting the presence of pitting and crevice corrosion mechanisms.
Figure 7a corresponds to the sample with 0.2 wt.% Be, which exhibits an initial martensitic microstructure.
Figure 7b is a magnified view of the same sample, revealing localized pitting corrosion.
Figure 7c,d correspond to samples with higher Be contents (≥0.6 wt.% Be), which predominantly exhibit an austenitic microstructure. These samples show clear evidence of both pitting and crevice corrosion. The observed differences in corrosion morphology confirm that Be content—and the resulting microstructure—significantly influence the type of localized corrosion mechanisms that develop on the alloy surface.
In summary, the corrosion performance of Cu–Al–Ni–Be alloys is strongly dependent on Be content, with low concentrations (0.0–0.4 wt.%) offering relatively better resistance compared to higher Be concentrations (≥0.6 wt.%), where the stabilization of the β phase promotes localized corrosion mechanisms.
3.6. Behavior of CoF and Wear Coefficient
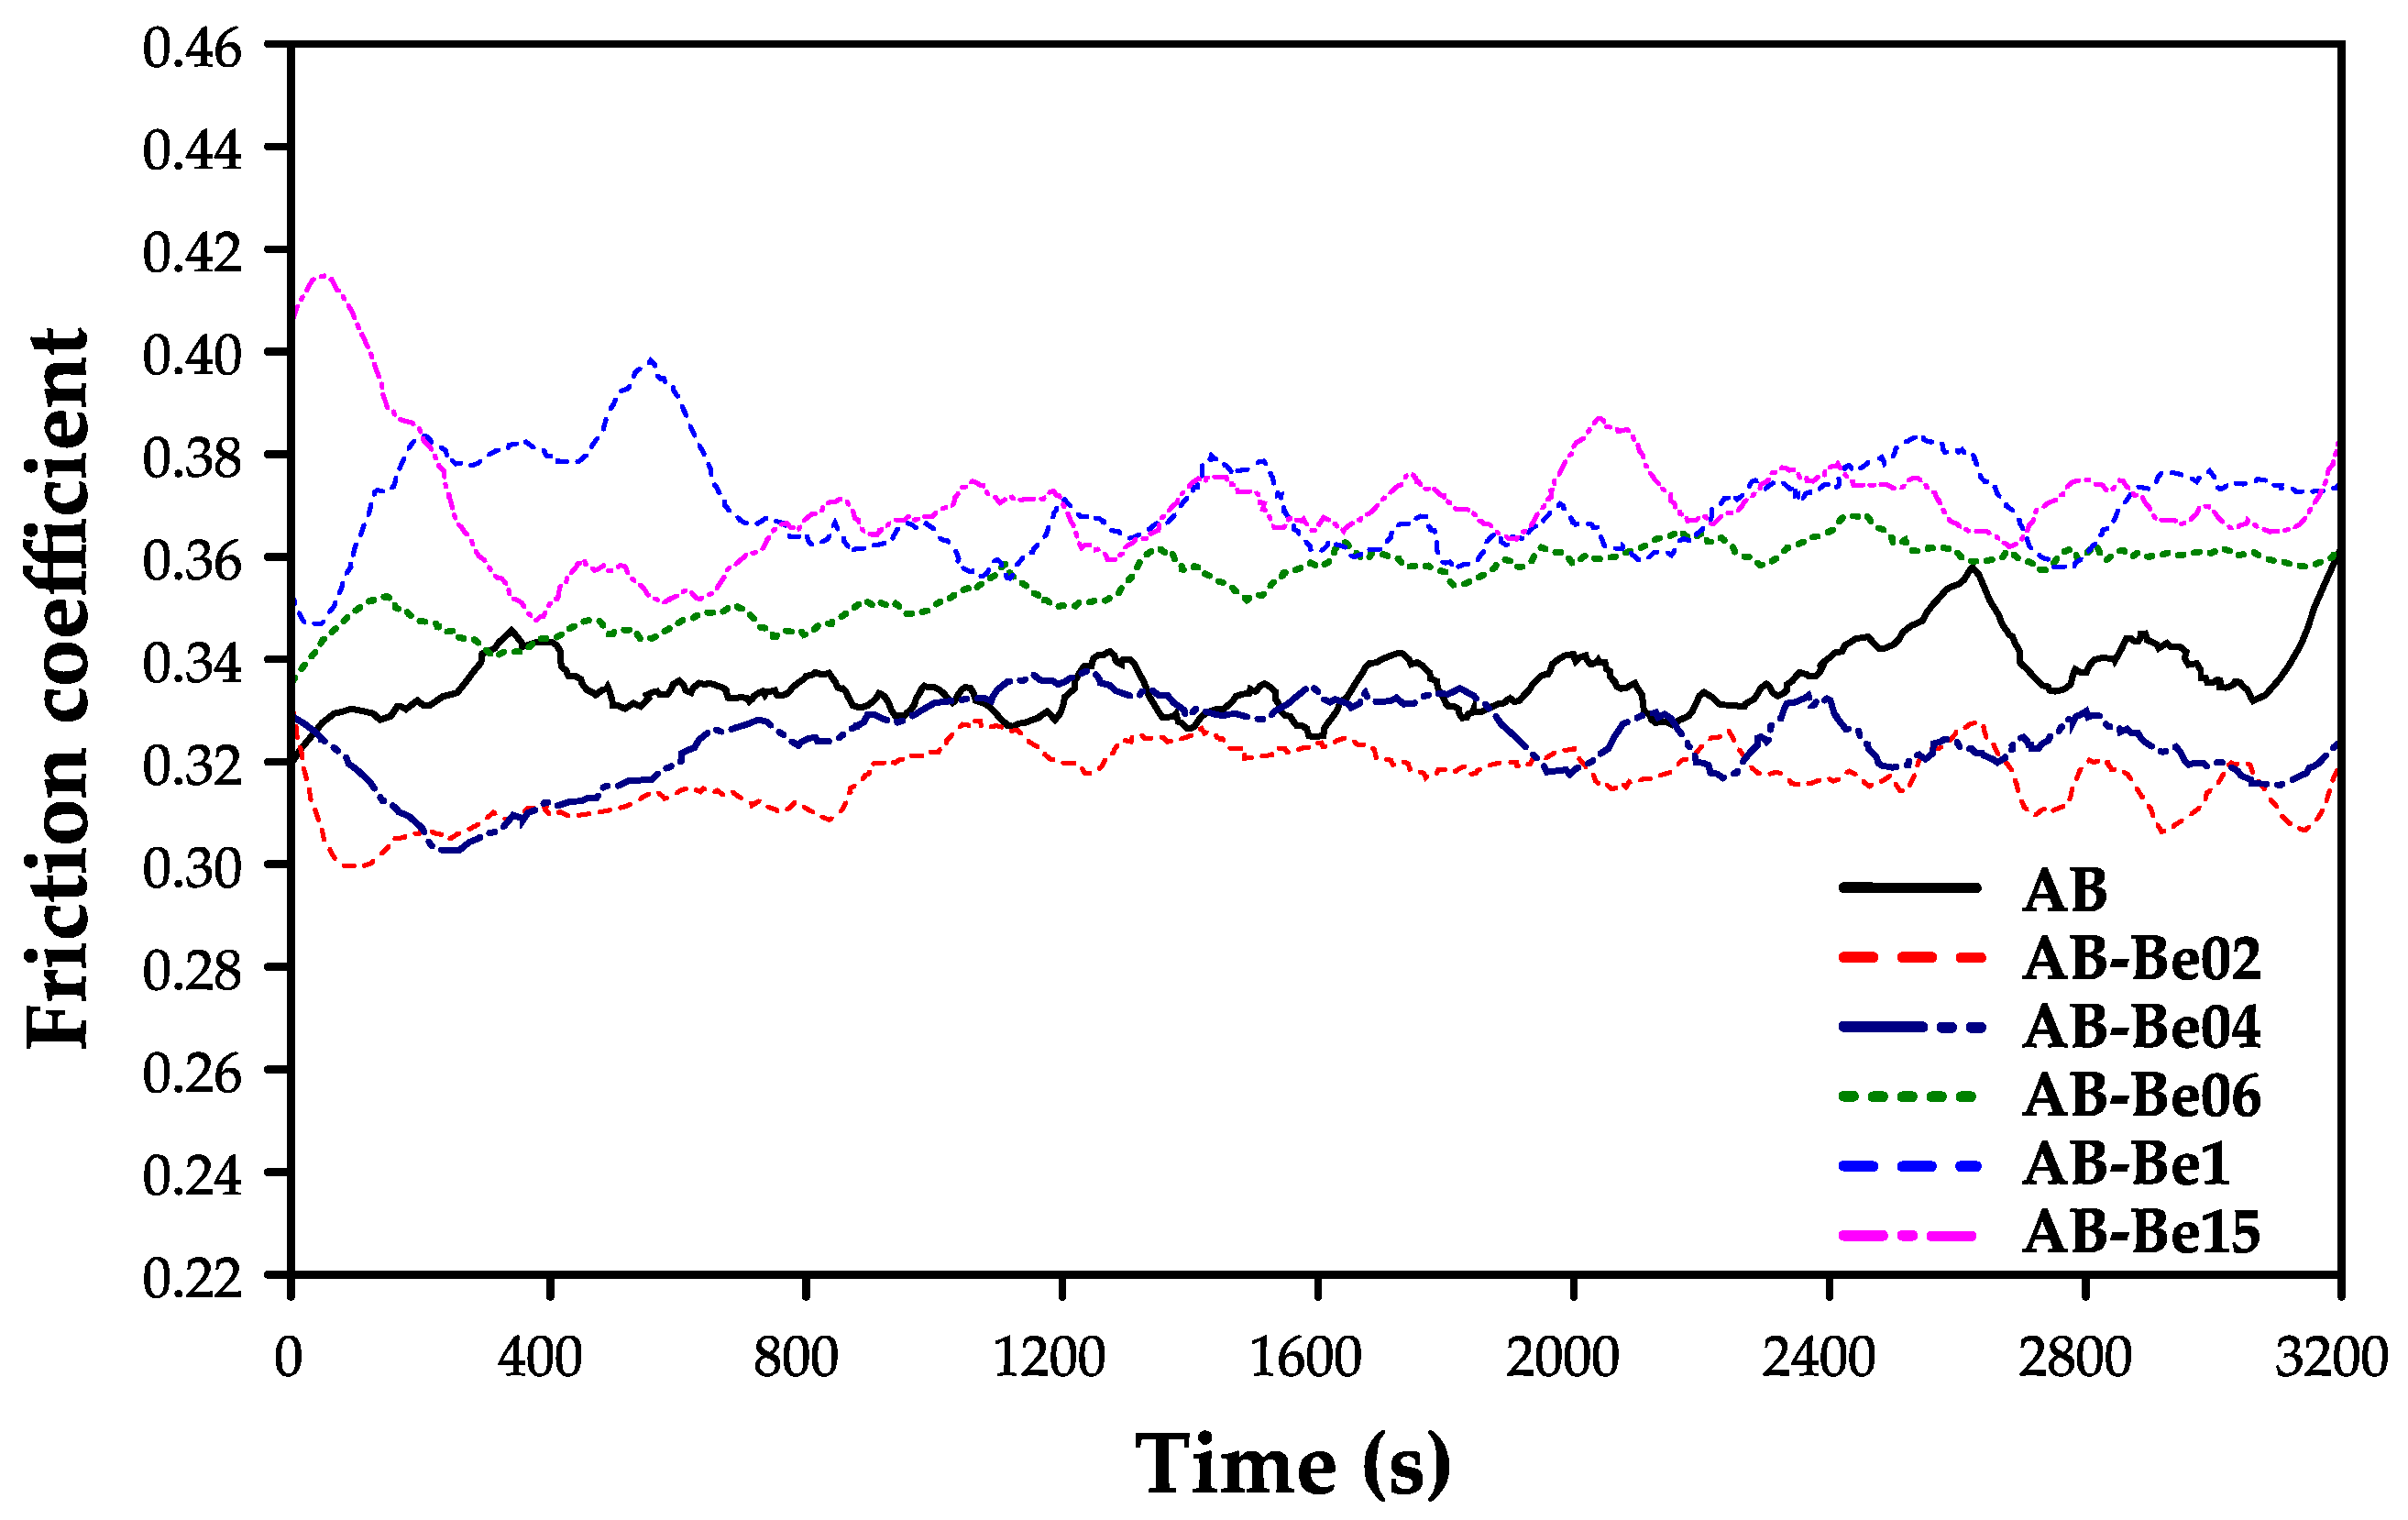
The friction and wear behavior of the Cu–Al–Ni–Be alloys was evaluated under dry sliding conditions using a pin-on-flat configuration. As shown in
Figure 8, alloys with 0.0–0.4 wt.% Be display consistently lower coefficients of friction (CoF) compared to those with ≥0.6 wt.% Be. The CoF values of the 0.0–0.4 wt.% alloys remain statistically indistinguishable from the Be-free baseline, and only at concentrations ≥0.6 wt.% a clear and progressive increase in friction emerge is seen.
This trend is directly linked to the underlaying microstructure: low Be contents stabilize the martensitic β′ phase, which accommodates stress efficiency via twin boundary movement and pseudoplastic deformation leading to reduced friction [
13,
14].
In contrast, higher Be concentrations promote the stabilization of the austenitic β phase, a structure with limited capacity for variant reorientation or reversible martensitic transformation, leading to higher friction during sliding contact [
15,
17].
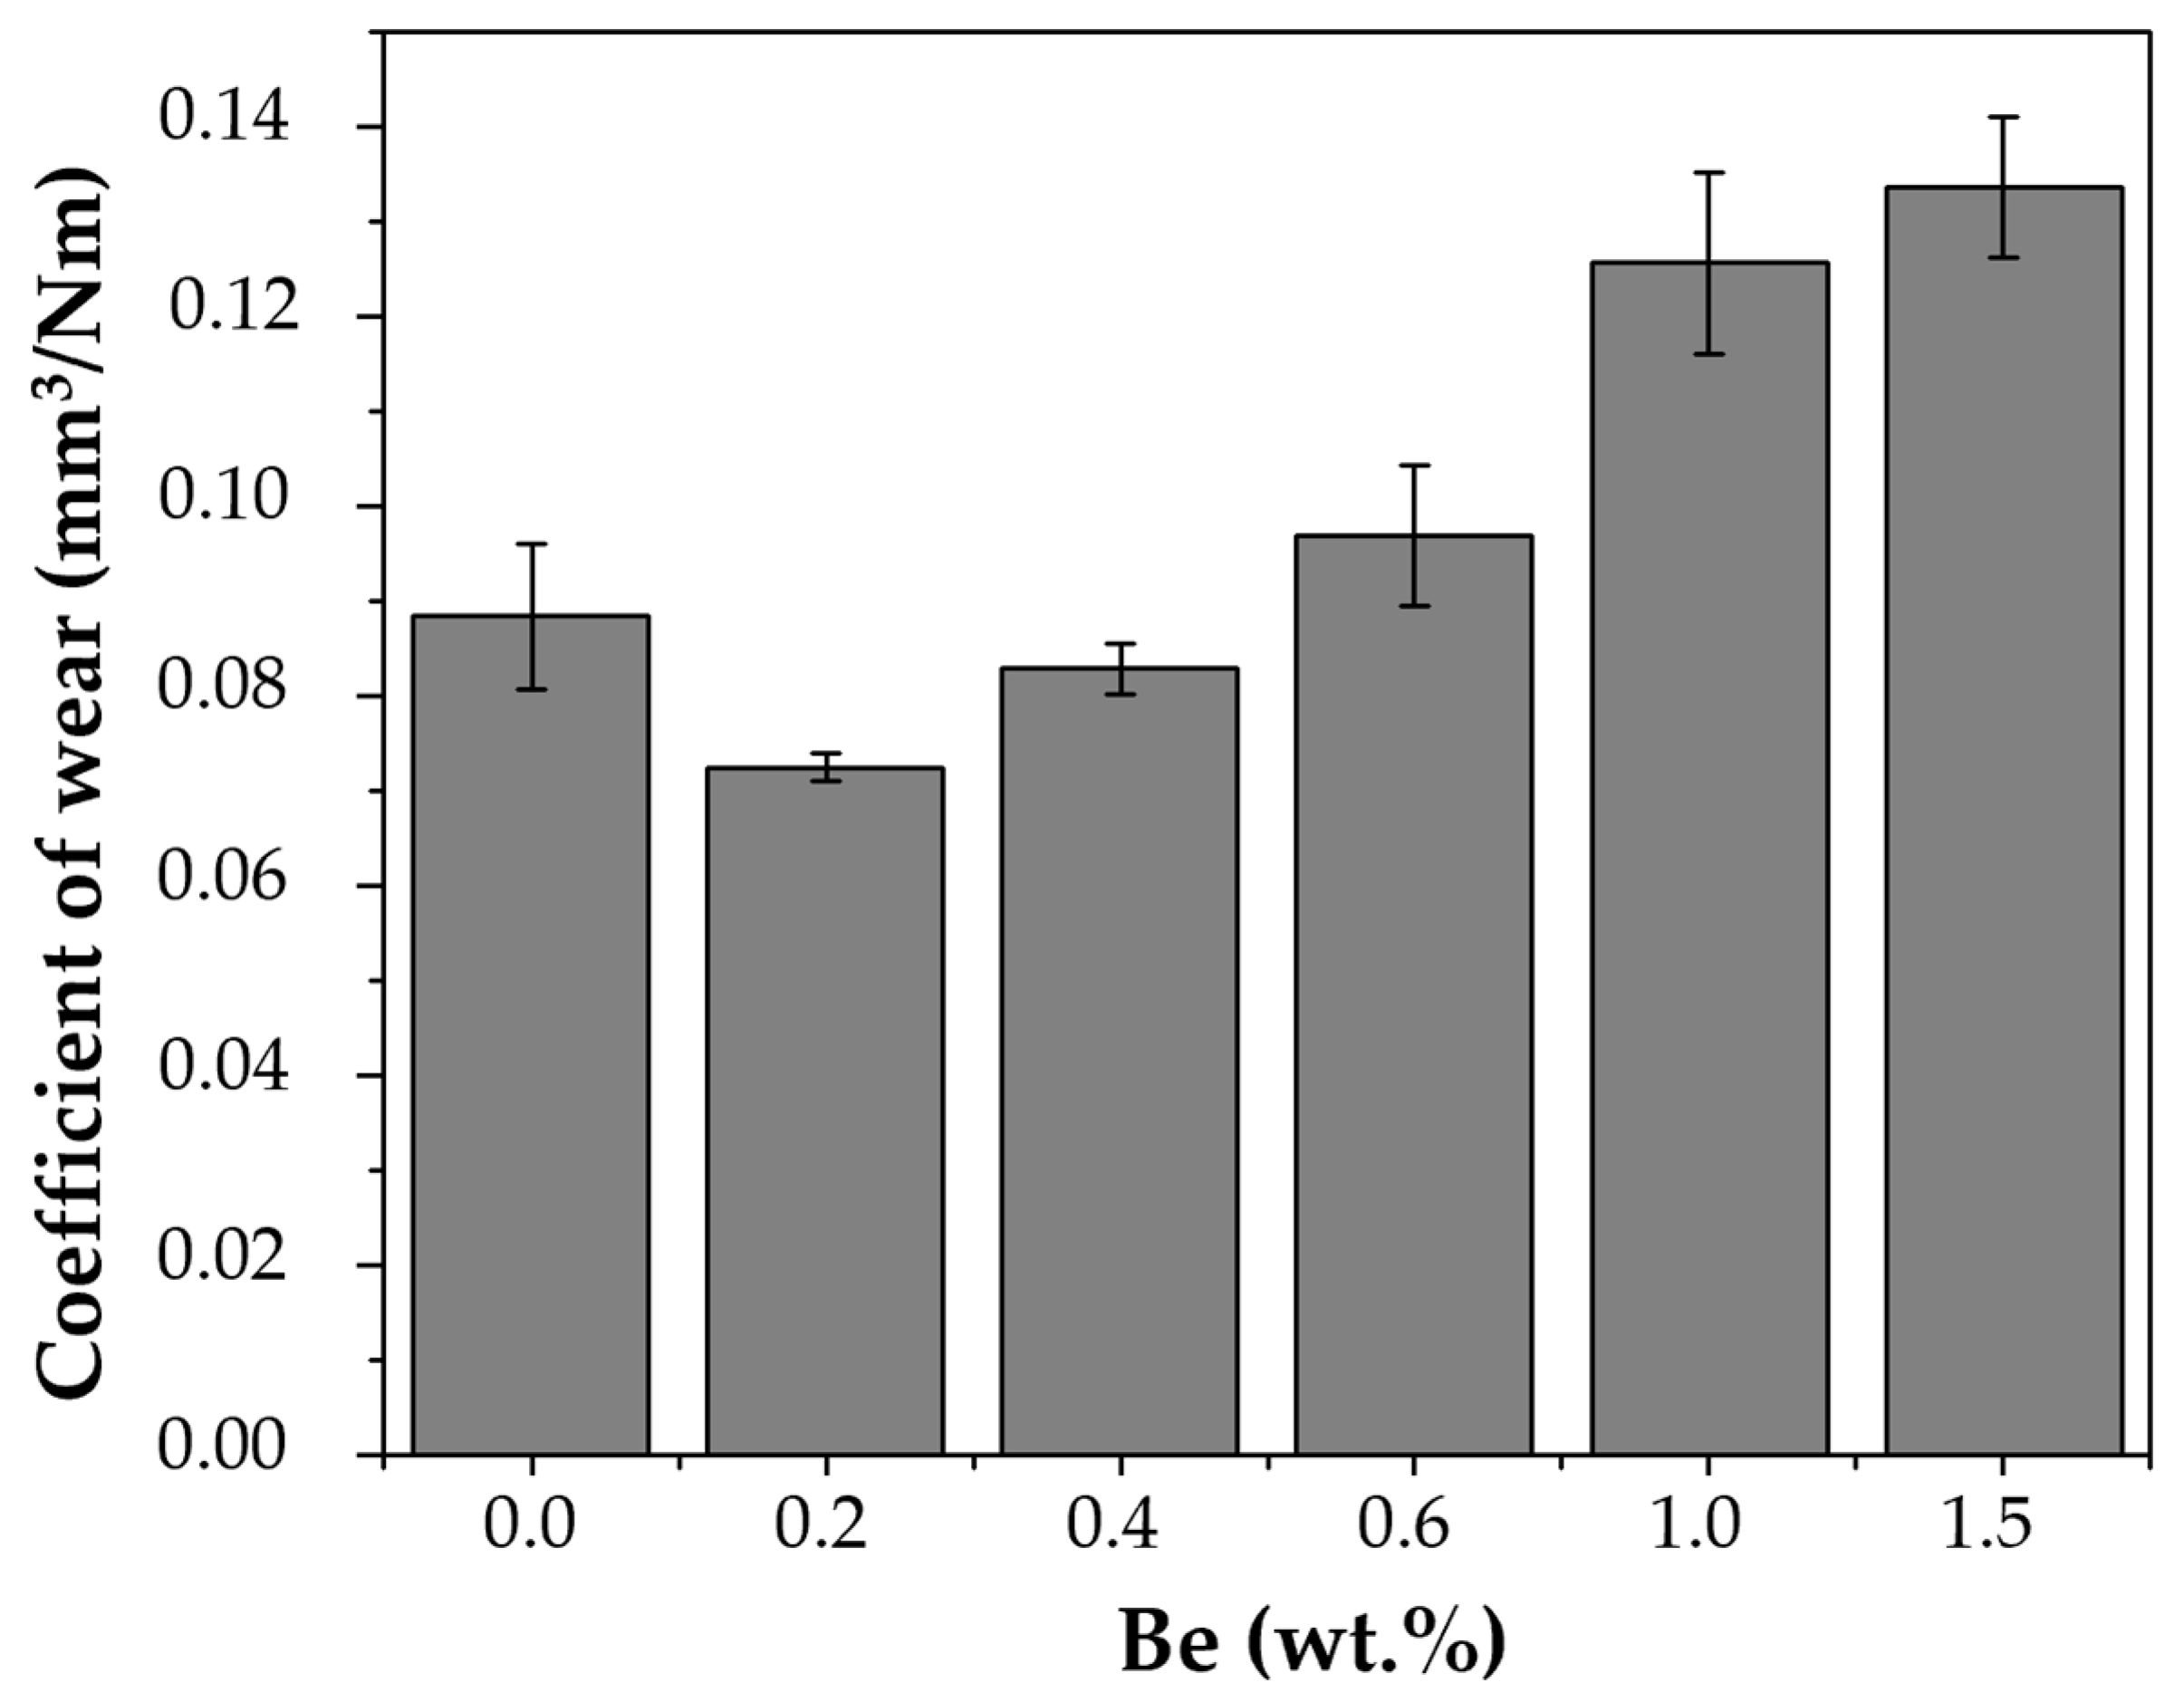
Figure 9 shows the wear rate as a function of Be content. Alloys with lower Be concentrations (0.0–0.4 wt.%) exhibited lower wear rates, consistent with their lower coefficient of friction (COF) values and enhanced pseudoplastic deformation. Samples with higher Be concentrations (≥0.6 wt.%) exhibited higher wear rates, indicating a lower resistance to material loss under dry sliding conditions.
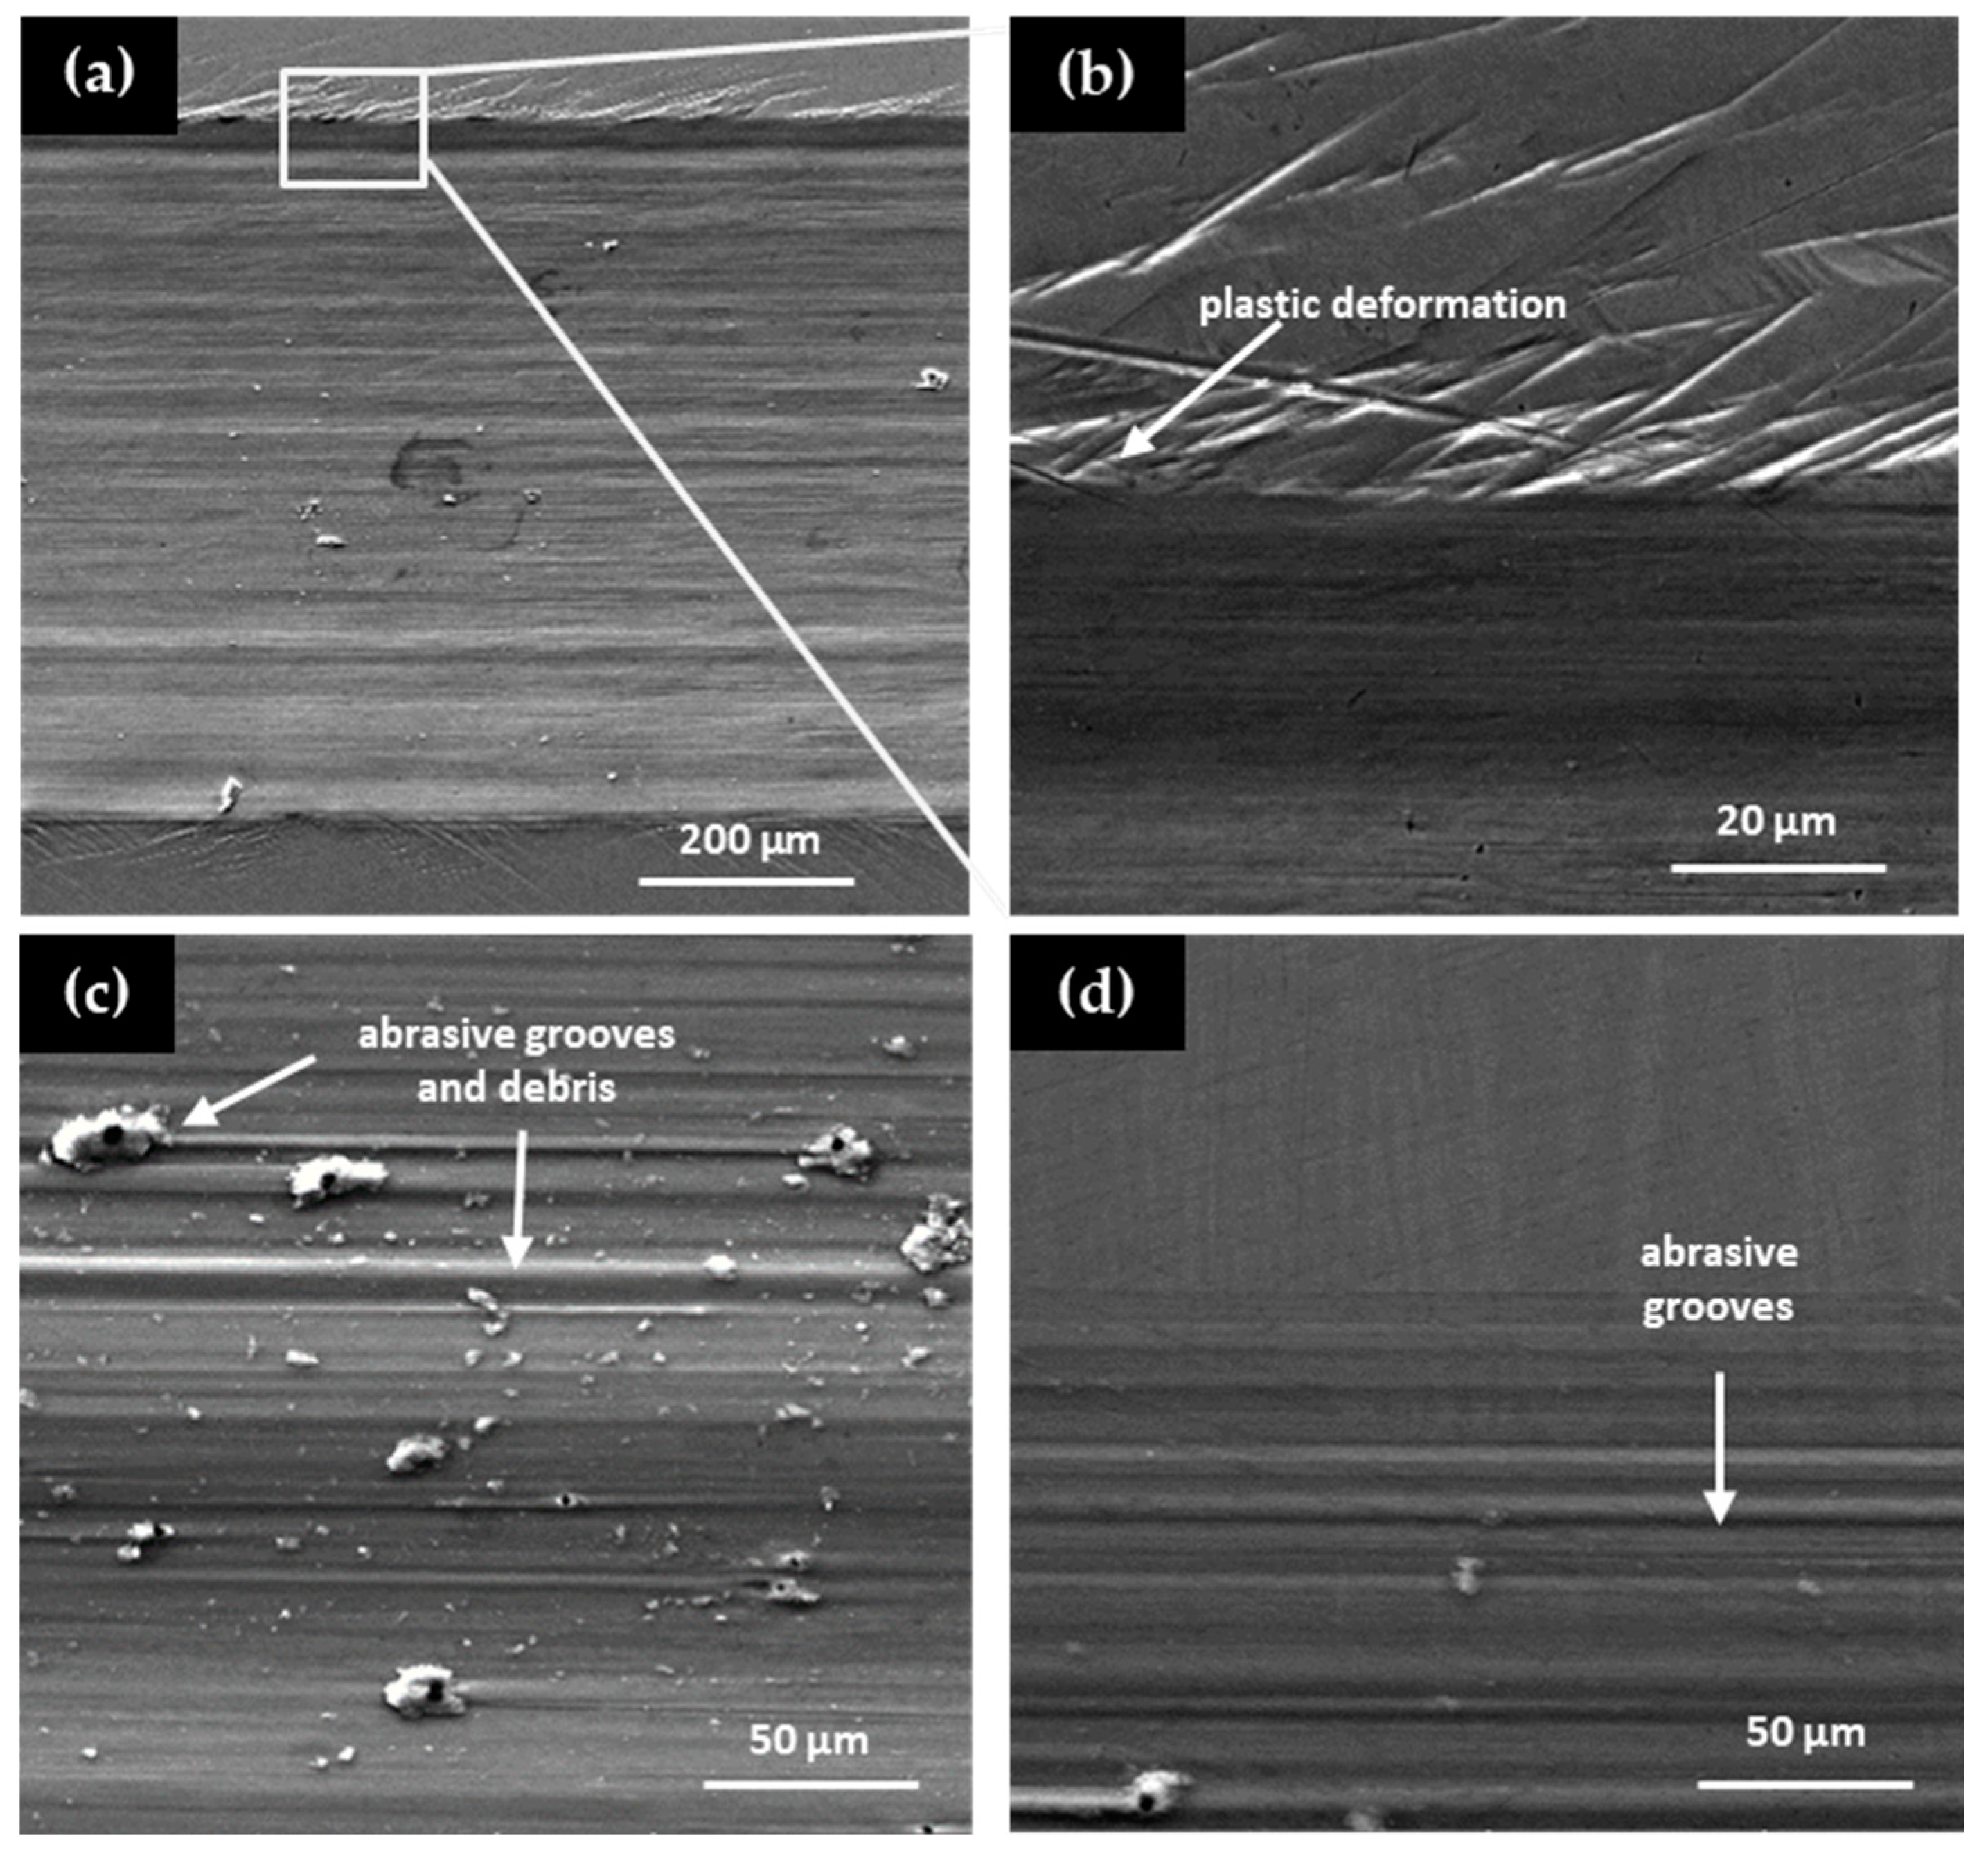
SEM micrographs of worn surfaces (
Figure 9) corroborate these findings: martensitic alloys display smoother tracks and evidence of plastic flow, while austenitic alloys show severe grooves and debris, characteristic of abrasive and adhesive wear. This aligns with prior reports highlighting the inferior wear resistance of the austenitic phase in Cu-based SMAs relative to martensitic structures. [
14].
In summary, the tribological behavior of Cu–Al–Ni–Be alloys is closely related to Be-induced phase stability. Low Be contents (≤0.4 wt.%) foster a martensitic microstructure that minimizes both friction and wear, while higher Be additions (≥0.6 wt.%) stabilize the austenitic phase, resulting in progressively higher friction and wear rates. Thus, the tribological optimization of these alloys depends critically on controlling Be addition to maintain the beneficial martensitic β′ phase.
3.7. Failure Mechanisms
The failure mechanisms of the Cu–Al–Ni–Be alloys were investigated using scanning electron microscope (SEM) micrographs of worn surfaces (
Figure 10). Alloys with Be contents up to 0.4 wt.% (
Figure 10a,b) displayed failure modes characterized primarily by plastic deformation. These features are typical of the martensitic β′ phase, which accommodates stress through the movement of twin boundaries and variant reorientation under load [
13].
In contrast, alloys with higher Be contents (≥0.6 wt.%) exhibited severe wear features, including deep grooves and abrasive debris (
Figure 10c,d). These characteristics are indicative of abrasive and adhesive wear mechanisms, commonly observed in materials dominated by the austenitic β phase. The suppression of martensitic transformation in these samples reduces the material’s ability to absorb and dissipate stress through pseudoplastic deformation, leading to increased surface damage and eventual failure [
14].
Furthermore, the presence of oxide debris observed in some samples suggests that tribo-oxidation may also contribute to the overall wear process. This is particularly relevant for samples with higher Be content, where the combination of increased frictional heating and the reduced transformation capability promotes oxide layer formation and subsequent spallation [
15].
Therefore, the failure mechanisms of Cu–Al–Ni–Be alloys are closely related to the microstructural phase composition. Martensitic alloys exhibit predominantly ductile failure mechanisms, characterized by enhanced resistance to wear. In contrast, austenitic alloys show a combination of abrasive and oxidative wear processes that compromise their mechanical integrity under sliding conditions.
4. Conclusions
This study investigated the influence of beryllium (Be) addition on the microstructure, transformation behavior, hardness, corrosion resistance, and wear performance of Cu–Al–Ni shape memory alloys. The main findings are summarized as follows:
1. Microstructural evolution:
Alloys with Be contents ≤ 0.4 wt.% exhibited a predominantly martensitic (β′) microstructure with acicular morphology, while higher Be additions (≥0.6 wt.%) promoted the stabilization of the austenitic β phase with a BCC structure. Grain refinement was also observed with increasing Be content.
2. Phase transformation behavior:
The alloys underwent reversible phase transitions, starting at ~330 °C and concluding near 520 °C. Be additions up to 0.4 wt.% had minimal effect on transformation temperatures; however, contents above this threshold caused an upward shift of up to 20 °C, delaying the martensitic-to-austenitic transformation.
3. Mechanical hardness:
Vicker’s hardness initially decreased for Be content < 0.6 wt.% and increased with higher Be concentrations. This trend was associated with the transition from martensitic to austenitic microstructures and grain refinement.
4. Corrosion performance:
Corrosion tests revealed that the 0.2 wt.% Be alloy exhibited the most positive Ecorr value and a relatively high corrosion rate. Overall, corrosion resistance declined with increasing Be content, particularly in alloys containing ≥0.6 wt.% Be, where pitting and crevice corrosion were observed.
5. Wear resistance:
Alloys with martensitic structures (≤0.4 wt.% Be) demonstrated superior wear resistance and lower friction coefficients than austenitic alloys. This was attributed to the pseudoplastic deformation of martensite, which absorbs stress and improves contact conditions.
In conclusion, adding Be to Cu–Al–Ni SMAs significantly alters their phase stability and functional properties. While low concentrations of Be (≤0.4 wt.%) enhance wear resistance without severely compromising corrosion behavior, higher additions lead to reduced electrochemical stability and increased hardness due to the stabilization of the austenitic phase. These findings provide valuable insight for tailoring the performance of copper-based SMAs in structural or functional applications.
Author Contributions
Conceptualization, O.J. and L.O.; methodology, M.F.-J., J.C. and I.A.; project administration, O.J.; supervision, L.O., M.F. and F.A.-H.; writing—original draft, formal analysis, L.O., I.A. and J.C.; investigation, O.J., I.A., J.C. and D.I.B.-B.; writing—review and editing, O.J., M.F. and I.A.; validation, M.F.-J., O.J., B.A.O., F.A.-H. and D.I.B.-B.; visualization; image processing, O.J. and I.A. All authors have read and agreed to the published version of the manuscript.
Funding
This research was supported by the Secretariat of Science, Humanities, Technology e Innovation SECIHTI during the postdoctoral stage of I. Alanis; grant number CVU 737815. The research was also supported by the scientific research coordination (CIC) of the UMSNH.
Institutional Review Board Statement
Not applicable.
Informed Consent Statement
Not applicable.
Data Availability Statement
Data is contained within the article.
Acknowledgments
The authors acknowledge financial aid from CONACYT through fellowship NO. 338063.
Conflicts of Interest
The authors declare no conflicts of interest.
References
- Kumar, P.K.; Lagoudas, D.C. Introduction to shape memory alloys. In Shape Memory Alloys: Modeling and Engineering Applications; Springer: Boston, MA, USA, 2008; pp. 1–51. [Google Scholar] [CrossRef]
- Wu, M.H.; Schetky, L.M. Industrial applications for shape memory alloys. In Proceedings of the International Conference on Shape Memory and Superelastic Technologies, Pacific Grove, CA, USA, 30 April–4 May 2000; Volume 171. [Google Scholar]
- Lobo, P.S.; Almeida, J.; Guerreiro, L. Shape memory alloys behaviour: A review. Procedia Eng. 2015, 114, 776–783. [Google Scholar] [CrossRef]
- Van Humbeeck, J. Shape memory alloys: A material and a technology. Adv. Eng. Mater. 2001, 3, 837–850. [Google Scholar] [CrossRef]
- Naresh, C.; Bose, P.S.C.; Rao, C.S.P. Shape memory alloys: A state of art review. IOP Conf. Ser. Mater. Sci. Eng. 2016, 149, 012054. [Google Scholar] [CrossRef]
- ASM Handbook Committee. Properties and selection: Nonferrous alloys and special-purpose materials. In ASM Metals Handbook; ASM International: Novelty, OH, USA, 1990. [Google Scholar] [CrossRef]
- Saud, S.N.; Hamzah, E.; Abubakar, T.; Bakhsheshi-Rad, H.R.; Zamri, M.; Tanemura, M. Effects of Mn additions on the structure, mechanical properties, and corrosion behavior of Cu-Al-Ni shape memory alloys. J. Mater. Eng. Perform. 2014, 23, 3620–3629. [Google Scholar] [CrossRef]
- Saud, S.N.; Hamzah, E.; Abu Bakar, T.A. A review on influence of alloying elements on the microstructure and mechanical properties of Cu-Al-Ni shape memory alloys. J. Teknol. Sci. Eng. 2013, 64, 51–56. [Google Scholar] [CrossRef]
- Saud, S.N.; Hamzah, E.; Abubakar, T.; Zamri, M.; Tanemura, M. Influence of Ti additions on the martensitic phase transformation and mechanical properties of Cu–Al–Ni shape memory alloys. J. Therm. Anal. Calorim. 2014, 118, 111–122. [Google Scholar] [CrossRef]
- Wayman, C.M. Grain refinement of a Cu–Al–Ni shape memory alloy by Ti and Zr additions. Trans. Jpn. Inst. Met. 1986, 27, 584–591. [Google Scholar] [CrossRef]
- Lee, J.S.; Wayman, C.M. Grain refinement of Cu-Zn-Al shape memory alloys. Metallography 1986, 19, 401–419. [Google Scholar] [CrossRef]
- Clayton, P. Tribological behavior of a titanium-nickel alloy. Wear 1993, 162, 202–210. [Google Scholar] [CrossRef]
- Lin, H.C.; He, J.L.; Chen, K.C.; Liao, H.M.; Lin, K.M. Wear characteristics of TiNi shape memory alloys. Metall. Mater. Trans. A 1997, 28, 1871–1877. [Google Scholar] [CrossRef]
- Liang, Y.N.; Li, S.Z.; Jin, Y.B.; Jin, W.; Li, S. Wear behavior of a TiNi alloy. Wear 1996, 198, 236–241. [Google Scholar] [CrossRef]
- Singh, J.; Alpas, A.T. Dry sliding wear mechanisms in a Ti50Ni47Fe3 intermetallic alloy. Wear 1995, 181, 302–311. [Google Scholar] [CrossRef]
- Wang, F. Dry sliding wear of Cu-based shape memory alloy. Acta Metall Sin. 1992, 5, 193–198. [Google Scholar]
- Janke, L.; Czaderski, C.; Motavalli, M.; Ruth, J. Applications of shape memory alloys in civil engineering structures—Overview, limits and new ideas. Mater. Struct. 2005, 38, 578–592. [Google Scholar] [CrossRef]
- Dasgupta, R. A look into Cu-based shape memory alloys: Present scenario and future prospects. J. Mater. Res. 2014, 29, 1681–1698. [Google Scholar] [CrossRef]
- Suresh, N.; Ramamurty, U. Aging response and its effect on the functional properties of Cu–Al–Ni shape memory alloys. J. Alloys Compd. 2008, 449, 113–118. [Google Scholar] [CrossRef]
- Vrsalović, L.; Ivanić, I.; Kožuh, S.; Gudić, S.; Kosec, B.; Gojić, M. Effect of heat treatment on corrosion properties of CuAlNi shape memory alloy. Trans. Nonferr. Met. Soc. China 2018, 28, 1149–1156. [Google Scholar] [CrossRef]
- Karagoz, Z.; Canbay, C.A. Relationship between transformation temperatures and alloying elements in Cu–Al–Ni shape memory alloys. J. Therm. Anal. Calorim. 2013, 114, 1069–1074. [Google Scholar] [CrossRef]
- Xu, H.P.; Song, G.F.; Mao, X.M. Influence of Be and Ni to Cu-Al alloy shape memory performance. Adv. Mater. Res. 2011, 197, 1258–1262. [Google Scholar] [CrossRef]
- Canbay, C.A.; Karaduman, O.; Ünlü, N.; Özkul, I. Study on basic characteristics of CuAlBe shape memory alloy. Braz. J. Phys. 2021, 51, 13–18. [Google Scholar] [CrossRef]
- Montecinos, S.; Cuniberti, A. Thermomechanical behavior of a CuAlBe shape memory alloy. J. Alloys Compd. 2008, 457, 332–336. [Google Scholar] [CrossRef]
- de Albuquerque, V.H.C.; Melo, T.A.d.A.; Gomes, R.M.; de Lima, S.J.G.; Tavares, J.M.R. Grain size and temperature influence on the toughness of a CuAlBe shape memory alloy. Mater. Sci. Eng. A 2010, 528, 459–466. [Google Scholar] [CrossRef]
- Sure, G.N.; Brown, L.C. The mechanical properties of grain refined β-cuaini strain-memory alloys. Metall. Mater. Trans. A 1984, 15, 1613–1621. [Google Scholar] [CrossRef]
- Zhu, M.; Ye, X.; Li, C.; Song, G.; Zhai, Q. Preparation of single crystal CuAlNiBe SMA and its performances. J. Alloys Compd. 2009, 478, 404–410. [Google Scholar] [CrossRef]
- ASTM E112-24; Standard Test Methods for Determining Average Grain Size. ASTM International: West Conshohocken, PA, USA, 2012. [CrossRef]
- McCafferty, E. Validation of corrosion rates measured by the Tafel extrapolation method. Corr. Sci. 2005, 47, 3202–3215. [Google Scholar] [CrossRef]
- Agafonov, V.; Naudot, P.; Dubertret, A.; Dubois, B. Influence of the aluminium content on the appearance and stability of martensites in the Cu-Al-Ni system. Scr. Metall. 1998, 22, 489–494. [Google Scholar] [CrossRef]
- Svirid, A.E.; Pushin, V.G.; Kuranova, N.N.; Makarov, V.V.; Uksusnikov, A.N. The effect of heat treatment on the structure and mechanical properties of nanocrystalline Cu–14Al–3Ni alloy subjected to high-pressure torsion. Phys. Met. Metallogr. 2021, 122, 883–890. [Google Scholar] [CrossRef]
- Agrawal, A.; Dube, R.K. Methods of fabricating Cu-Al-Ni shape memory alloys. J. Alloys Compd. 2018, 750, 235–247. [Google Scholar] [CrossRef]
- Otsuka, K.; Ohba, T.; Tokonami, M.; Wayman, C.M. New description of long period stacking order structures of martensites in {beta}-phase alloys. Scr. Metall. Mater. 1993, 29, 1359–1364. [Google Scholar] [CrossRef]
- Svirid, A.E.; Afanasiev, S.V.; Davydov, D.I.; Kuranova, N.N.; Makarov, V.V.; Pushin, V.G.; Ustyugov, Y.M. Microstructure and mechanical behavior of Cu-Al-Ni-B alloys with thermoelastic martensitic transformation. Metals 1993, 13, 967. [Google Scholar] [CrossRef]
- Braga, F.D.O.; Matlakhov, A.N.; Matlakhova, L.A.; Monteiro, S.N.; Araújo, C.J.D. Martensitic transformation under compression of a plasma processed polycrystalline shape memory CuAlNi alloy. Mater. Res. 2017, 20, 1579–1592. [Google Scholar] [CrossRef]
- Castro, M.L.; Romero, R. Transformations during continuous cooling of a β-Cu-22.72Al-3.55Be (at.%) alloy. Scr. Mater. 1999, 42, 157–161. [Google Scholar] [CrossRef]
- Flores Zúñiga, H.; Rios-Jara, D.; Lovey, F.C.; Guénin, G. Thermal Stability of Beta Phase in a Cu-Al-Be Shape Memory Alloy. J. De Phys. IV 1995, 5, 171–174. [Google Scholar] [CrossRef]
| Disclaimer/Publisher’s Note: The statements, opinions and data contained in all publications are solely those of the individual author(s) and contributor(s) and not of MDPI and/or the editor(s). MDPI and/or the editor(s) disclaim responsibility for any injury to people or property resulting from any ideas, methods, instructions or products referred to in the content. |
© 2025 by the authors. Licensee MDPI, Basel, Switzerland. This article is an open access article distributed under the terms and conditions of the Creative Commons Attribution (CC BY) license (https://creativecommons.org/licenses/by/4.0/).
