Article

The Effect of LaPO4 Crystal Morphology on Gas-Phase Catalytic Synthesis of Anisole

1
Key Laboratory of Advanced Molecular Engineering Materials, College of Chemistry and Materials Engineering, Baoji University of Arts and Sciences, Baoji 721013, China
2
School of Chemical Engineering, Northwest University, Xi’an 710069, China
*
Author to whom correspondence should be addressed.
Coatings 2025, 15(9), 1093; https://doi.org/10.3390/coatings15091093
Submission received: 16 August 2025 / Revised: 12 September 2025 / Accepted: 16 September 2025 / Published: 18 September 2025

Abstract

The gas-phase synthesis of anisole from methanol and phenol is currently recognized as the process with the most theoretical research value and industrial application prospect. LaPO4 has attracted widespread attention due to its excellent catalytic activity, robust water resistance, and high-temperature performance. In this work, rod-like monoclinic, mixed phase, and hexagonal LaPO4 were synthesized using the hydrothermal method, and their catalytic activity was evaluated. The results showed that the catalytic activity of the hexagonal phase is higher than that of the monoclinic phase. By combining relevant characterization methods and DFT theoretical calculations, it is clarified that the higher acidity and stronger alkalinity of the exposed surface of hexagonal LaPO4 are the main reasons for its higher activity. Further research has revealed that the main cause of LaPO4 deactivation is carbon deposition on the catalyst surface.

Graphical Abstract

1. Introduction

Anisole is an important chemical intermediate and has been widely used in industries such as gasoline and diesel additives [1,2], fragrance additives [3], pharmaceutical synthesis [4], and fluorescent tracers [5]. In the traditional synthesis of anisole, dimethyl sulfate or halogenated hydrocarbons are often used as methylation agents [6] to react with phenol. However, dimethyl sulfate has high toxicity, and halogenated hydrocarbons could destroy the ozone layer and cause a greenhouse effect [7], so both are facing elimination. Instead, dimethyl carbonate [8,9] and methanol [10,11] have been used as methylation agents by a large number of researchers to synthesize anisole and have achieved good results. Because the price of methanol is much lower than that of dimethyl carbonate, the preparation of anisole using methanol and phenol as raw materials has more theoretical research and industrial application value.
In previous studies on the preparation of anisole by the gas-phase methanol method, commonly used catalysts include molecular sieves [11,12,13,14], metal oxides [15,16], phosphates [17,18,19], hydrotalcite [20], etc. However, water is generated during this reaction, and catalysts such as molecular sieves, metal oxides, and hydrotalcites are unstable in high-temperature, aqueous systems, so the industrial application of such catalysts will bring huge challenges. Phosphate exhibits excellent hydrothermal stability and demonstrates remarkable catalytic effects in high-temperature, aqueous reactions such as the synthesis of anisole, dehydration of sorbitol [21], electrocatalytic oxidation of formaldehyde [22], and alkylation of toluene [23]. Devi et al. [17] investigated the use of phosphates of Sm, La, Sb, and Ce in the synthesis of anisole from phenol and methanol. They found that LaPO4 exhibited the highest phenol conversion rate (82%), while SmPO4 demonstrated the highest selectivity for anisole (85%). Lanthanum phosphate showed the best bulk catalytic activity. Burri et al. [18] prepared LaPO4 using three methods, simple co-precipitation, hydrothermal treatment after co-precipitation, and pH variation method, and measured their catalytic activities. They found that the preparation method had a significant impact on the catalytic activity of LaPO4. LaPO4, prepared by the pH variation method, exhibited the best catalytic activity in catalytic reactions, especially when prepared at a pH of 2, where the catalytic activity of LaPO4 was the highest, with a phenol conversion rate of 58.0% and an anisole selectivity of 60.5%. As a catalyst with promising industrialization potential, it is necessary to conduct a systematic study on the intrinsic catalytic activity of LaPO4. There are multiple factors that could influence the activity, performance, and lifespan of catalysts, including not only the preparation method, but also the crystalline morphology, texture, and the surface acid-base properties. However, to date, there have been no reports on the impact of the crystal morphology, texture, surface acidity, and alkalinity of LaPO4 on the synthesis of anisole [24,25,26].
In our previous work [13], ZSM-5 (a microporous zeolite) and ZSM-5/MCM-41 (a hierarchical zeolitic composite material), hierarchical porous materials, were used as catalysts to study the synthesis of anisole by methanol. It was found that the existence of a large number of micropores would lead to the diffusion restriction of materials, the reduction in conversion frequency, the extension of residence time of reaction intermediates and products in micropores, and the increase in by-products. Similar experimental phenomena were also reported in other reactions [14,27,28,29]. Therefore, in order to accurately obtain the influence law of LaPO4 crystal morphology, texture, surface acidity, and alkalinity on the synthesis of anisole, the existence of a large number of micropores should be avoided to eliminate its impact on the reaction. It is necessary to prepare mesoporous or macroporous LaPO4 materials with open pore structures. Synthesis of rod-shaped LaPO4 with a regular structure is an effective way to solve the above problems [30].
Fang [31] and Lucas [32] conducted a detailed study on the hydrothermal synthesis of nanorod rare earth phosphates. Their findings revealed that parameters such as the P/La ratio, pH, and temperature exert a significant and interconnected influence on the resulting crystal phase of LaPO4. Specifically, higher P/La ratios, elevated reaction temperatures, and lower pH values were found to favor the formation of the monoclinic phase, whereas conditions opposite to these tend to promote the hexagonal phase. These factors do not operate in isolation but exhibit strong synergistic effects; for instance, the monoclinic phase can be obtained under conditions of pH 1–2 and a temperature of 150 °C. Furthermore, the phase transformation is also accessible through post-synthetic treatment, as the hexagonal phase can be converted to the monoclinic phase upon calcination at 800 °C. The above research results provide useful insights for our study [31,32,33,34].
Based on the above understanding, in this study, we used the hydrothermal synthesis method to prepare a series of rod-shaped LaPO4 materials at different crystallization temperatures and crystallization times and explored the influence of crystal morphology on catalytic reactions under similar specific surface area conditions. We also used the density functional theory (DFT) to calculate the adsorption energy and hydrogen bond length of phenol and methanol on the LaPO4 surface, and further clarified the influence of LaPO4 texture, surface acid, and alkali properties on catalyst activity and the reasons for catalyst deactivation.

2. Experimental Section

2.1. Materials and Synthesis

Lanthanum nitrate hexahydrate (La(NO3)3·6H2O, analytical reagent) and ammonium dihydrogen phosphate (NH4H2PO4, analytical reagent) were purchased from Aladdin Biochemical Technology Co., Shanghai, China and used without further purification.
A series of lanthanum phosphate (LaPO4) samples were synthesized via a hydrothermal method by carefully controlling the crystallization temperature and time. The typical procedure for the synthesis of monoclinic LaPO4 (denoted as LaPO4-1) is described as follows: Aqueous solutions of lanthanum nitrate and ammonium dihydrogen phosphate (both 0.5 mol/L) were prepared, and an ammonium dihydrogen phosphate solution was added dropwise into the lanthanum nitrate solution at a constant rate of 1 mL/min. The mixture was vigorously stirred at 50 °C for 30 min and subsequently subjected to ultrasonication for 5 min to ensure homogeneity. The resulting mixture was then transferred into a stainless steel autoclave, and deionized water was added to adjust the total volume to 80 mL. Hydrothermal treatment was carried out at 160 °C for 12 h. After the autoclave was cooled naturally to room temperature, the solid product was collected by filtration, thoroughly washed with deionized water and ethanol, dried at 100 °C overnight, and finally ground into a fine powder.
To investigate the effect of synthesis parameters on the crystal structure and properties, a suite of catalysts was prepared by varying the hydrothermal conditions. Specifically, samples LaPO4-2, LaPO4-3, and LaPO4-4 were prepared using the same protocol as LaPO4-1, with modifications only to the crystallization temperature and duration: LaPO4-2 was treated at 140 °C for 10 h, LaPO4-3 at 120 °C for 10 h, and LaPO4-4 at 100 °C for 12 h. A summary of all synthesis conditions is provided in Table 1.
In addition, two samples were synthesized via a precipitation route without hydrothermal treatment. Specifically, LaPO4-5 was prepared by mixing the precursor solutions at 90 °C under vigorous stirring, after which the resulting suspension was maintained under stirring at the same temperature for 1 h. The solid product was then collected by filtration, washed thoroughly, and dried. Similarly, LaPO4-6 was obtained following an identical procedure, except that the stirring and aging process was carried out at 50 °C for 1 h.

2.2. Evaluation of Catalytic Performance

The catalytic performance was evaluated in a fixed-bed reactor system. The setup consisted of a three-zone temperature-controlled furnace (Tianjin Tongyuan Technology Co., Ltd., Tianjin, China), a syringe pump for feedstock injection, and an online gas chromatograph for product analysis.
A detailed description of the setup is provided below. Typically, 6.20 g of the LaPO4 catalyst (sieved to 0.25–0.5 mm particles) was loaded into the center of a 304 stainless steel reactor tube (10 mm inner diameter, 500 mm length). The remaining volume of the tube was packed with quartz sand to minimize dead volume. Prior to the reaction, the catalyst was pretreated in situ under a N2 flow (30 mL/min) by heating from room temperature to 310 °C at a ramp rate of 5 °C/min and held at this temperature for 1 h. After stabilization, the N2 flow was stopped, and a feedstock mixture of phenol and methanol (molar ratio = 1:5) was introduced into the reactor via a syringe pump at a liquid flow rate of 0.05 mL/min. The reaction was carried out at 310 °C and atmospheric pressure for 10 h.
Liquid products were collected at 1 h intervals and analyzed using an online gas chromatograph (GC-2014C, Shimadzu, Kyoto, Japan) equipped with a flame ionization detector (FID) and an HP-5 capillary column (30 m × 0.32 mm × 0.25 μm). The temperatures of the injector and detector were both set at 260 °C. The oven temperature program was as follows: held at 80 °C for 2 min, ramped to 220 °C at a rate of 15 °C/min, and then held for 5 min. High-purity N2 was used as the carrier gas at a flow rate of 1.0 mL/min.
Phenol conversion and anisole selectivity were calculated based on the area normalization method using the following equations:
Phenol conversion (%) = [(moles of phenol fed − moles of phenol unreacted)/moles of phenol fed] × 100%
Anisole selectivity (%) = [moles of anisole formed/total moles of all products] × 100%

2.3. Characterization

X-ray diffraction (XRD) patterns were recorded on a Bruker D8 Advance diffractometer using Cu Kα radiation (λ = 1.5418 Å). Data were collected in the 2θ range of 5° to 80° with a scanning speed of 1° min−1. The morphologies of the catalysts were examined by cold field emission scanning electron microscopy (SEM, Hitachi SU8010) and transmission electron microscopy (TEM, FEI TF20). The elemental compositions (P and La) were determined by inductively coupled plasma optical emission spectrometry (ICP-OES, Agilent 5800). Prior to analysis, the samples were completely dissolved in diluted nitric acid (0.1 mol/L). The textural properties, including specific surface area, pore volume, and average pore size, were determined by N2 physisorption at −196 °C (77 K) using a Micromeritics ASAP 2460 analyzer. Before measurement, each sample was degassed under vacuum at 200 °C for 6 h. The specific surface area was calculated by applying the Brunauer–Emmett–Teller (BET) method. The total pore volume was estimated from the amount of N2 adsorbed at a relative pressure (P/P0) of 0.99. The pore size distribution was derived from the adsorption branch of the isotherm using the Barrett–Joyner–Halenda (BJH) model. Surface acidity and basicity were characterized by NH3-temperature-programmed desorption (NH3-TPD) and CO2-temperature-programmed desorption (CO2-TPD), respectively, on a Micromeritics AutoChem II 2920 instrument. Typically, 100 mg of catalyst was pretreated at 300 °C under a He flow for 1 h. After cooling to their respective adsorption temperatures, the sample was saturated with a stream of 5% NH3/He or 5% CO2/He for 1 h. Subsequently, physically adsorbed molecules were purged with He at the adsorption temperature for 2 h. The TPD profile was recorded by heating the sample to 400 °C at a ramp rate of 10 °C min−1 under a He flow (30 mL/min). The amounts of desorbed NH3 or CO2 were quantified using a calibrated TCD detector. Fourier transform infrared (FT-IR) spectra were collected on a PerkinElmer Frontier spectrometer in the range of 4000–400 cm−1 using the KBr pellet technique. X-ray photoelectron spectroscopy (XPS) measurements were performed on a Thermo Fisher Scientific Escalab Xi+ spectrometer using Al Kα monochromatic radiation. The binding energies were calibrated by referencing the C 1s peak to 284.8 eV. Thermogravimetric analysis (TGA) was conducted on a Netzsch STA449 F3 instrument. Approximately 10 mg of sample was heated from room temperature to 800 °C at a rate of 10 °C min−1 under a N2 atmosphere with a flow rate of 50 mL/min.

2.4. Calculation of Adsorption Energy and Bond Length

We have employed the Vienna ab initio simulation package (VASP) to perform all density functional theory (DFT) calculations within the generalized gradient approximation (GGA) using the Perdew–Burke–Ernzerhof (PBE) formulation [35,36]. The ionic cores were represented by projector augmented wave (PAW) pseudopotentials, while valence electrons were treated with a plane-wave basis set employing a kinetic energy cutoff of 450 eV [37,38]. The Gaussian smearing method with a width of 0.05 eV was applied to permit partial occupancies of the Kohn–Sham orbitals. Self-consistency in electronic energy was achieved when successive iterations differed by less than 10−5 eV. Geometry optimization was considered convergent when the force change was smaller than 0.05 eV/Å. Grimme’s DFT-D3 methodology was used to describe the dispersion interactions [39]. We sampled the Brillouin zone using a gamma-centered 1 × 1 × 1 k mesh across the entire computational procedure [40]. Periodic boundary conditions were used in all directions and a vacuum layer of 15 Å was used in the z-direction to separate the slabs. After optimizing the adsorption model, calculate the bond lengths of the hydrogen bonds formed between phenol, methanol, and oxygen atoms on the surface of LaPO4 in the adsorption model.
The adsorption energy (Eads) of adsorbate molecule was defined as follows:
Eads = Emol/surf − Esurf − Emol
where Emol/surf, Esurf, and Emol are the energy of adsorbate molecules adsorbed on the surface, the energy of clean surface, and the energy of molecules, respectively.

3. Results and Discussion

The molar ratio of P to La elements in the prepared LaPO4 sample was determined using ICP-OES. The measurement results are as follows: LaPO4-1 (n P/La = 1.02), LaPO4-2 (n P/La = 1.03), LaPO4-3 (n P/La = 1.03), LaPO4-4 (n P/La = 1.03), LaPO4-5 (n P/La = 1.03), and LaPO4-6 (n P/La = 1.02). The P/La molar ratio close to the theoretical value of 1 for all samples indicates that the LaPO4 samples synthesized under these conditions are all orthophosphate lanthanum. The main reason for the high P content may be due to the trace amount of phosphoric acid adsorbed on the surface [32].

3.1. Structural Properties of LaPO4 Samples

Figure 1 shows the XRD patterns of LaPO4 materials prepared under different conditions, LaPO4-1 shows strong characteristic diffraction peaks at the positions with 2θ of 21.12°, 26.78°, 28.52°, 30.89°, and 41.91°, which is consistent with the standard spectrum (JCPDS File 032-0493), indicating that the crystal morphology of the prepared LaPO4 sample is monoclinic. Samples LaPO4-3- and LaPO4-6 show strong characteristic diffraction peaks at the positions of 2θ of 14.47°, 19.89°, 25.09°, 29.04°, and 31.16°, which are consistent with the standard spectrum (JCPDS File 046-1439), indicating that the crystal morphology of the prepared LaPO4 sample is hexagonal. In addition to the standard diffraction peaks of the hexagonal phase, LaPO4-2 has obvious monoclinic phase characteristic diffraction peaks at 2θ of 21.12° and 26.78°, which include the (101) and (200) planes corresponding to monoclinic crystal morphologies, respectively [25]. It indicates that the LaPO4-2 sample is a mixed phase sample, and the hexagonal phase is the main crystal phase mixed with the monoclinic phase.
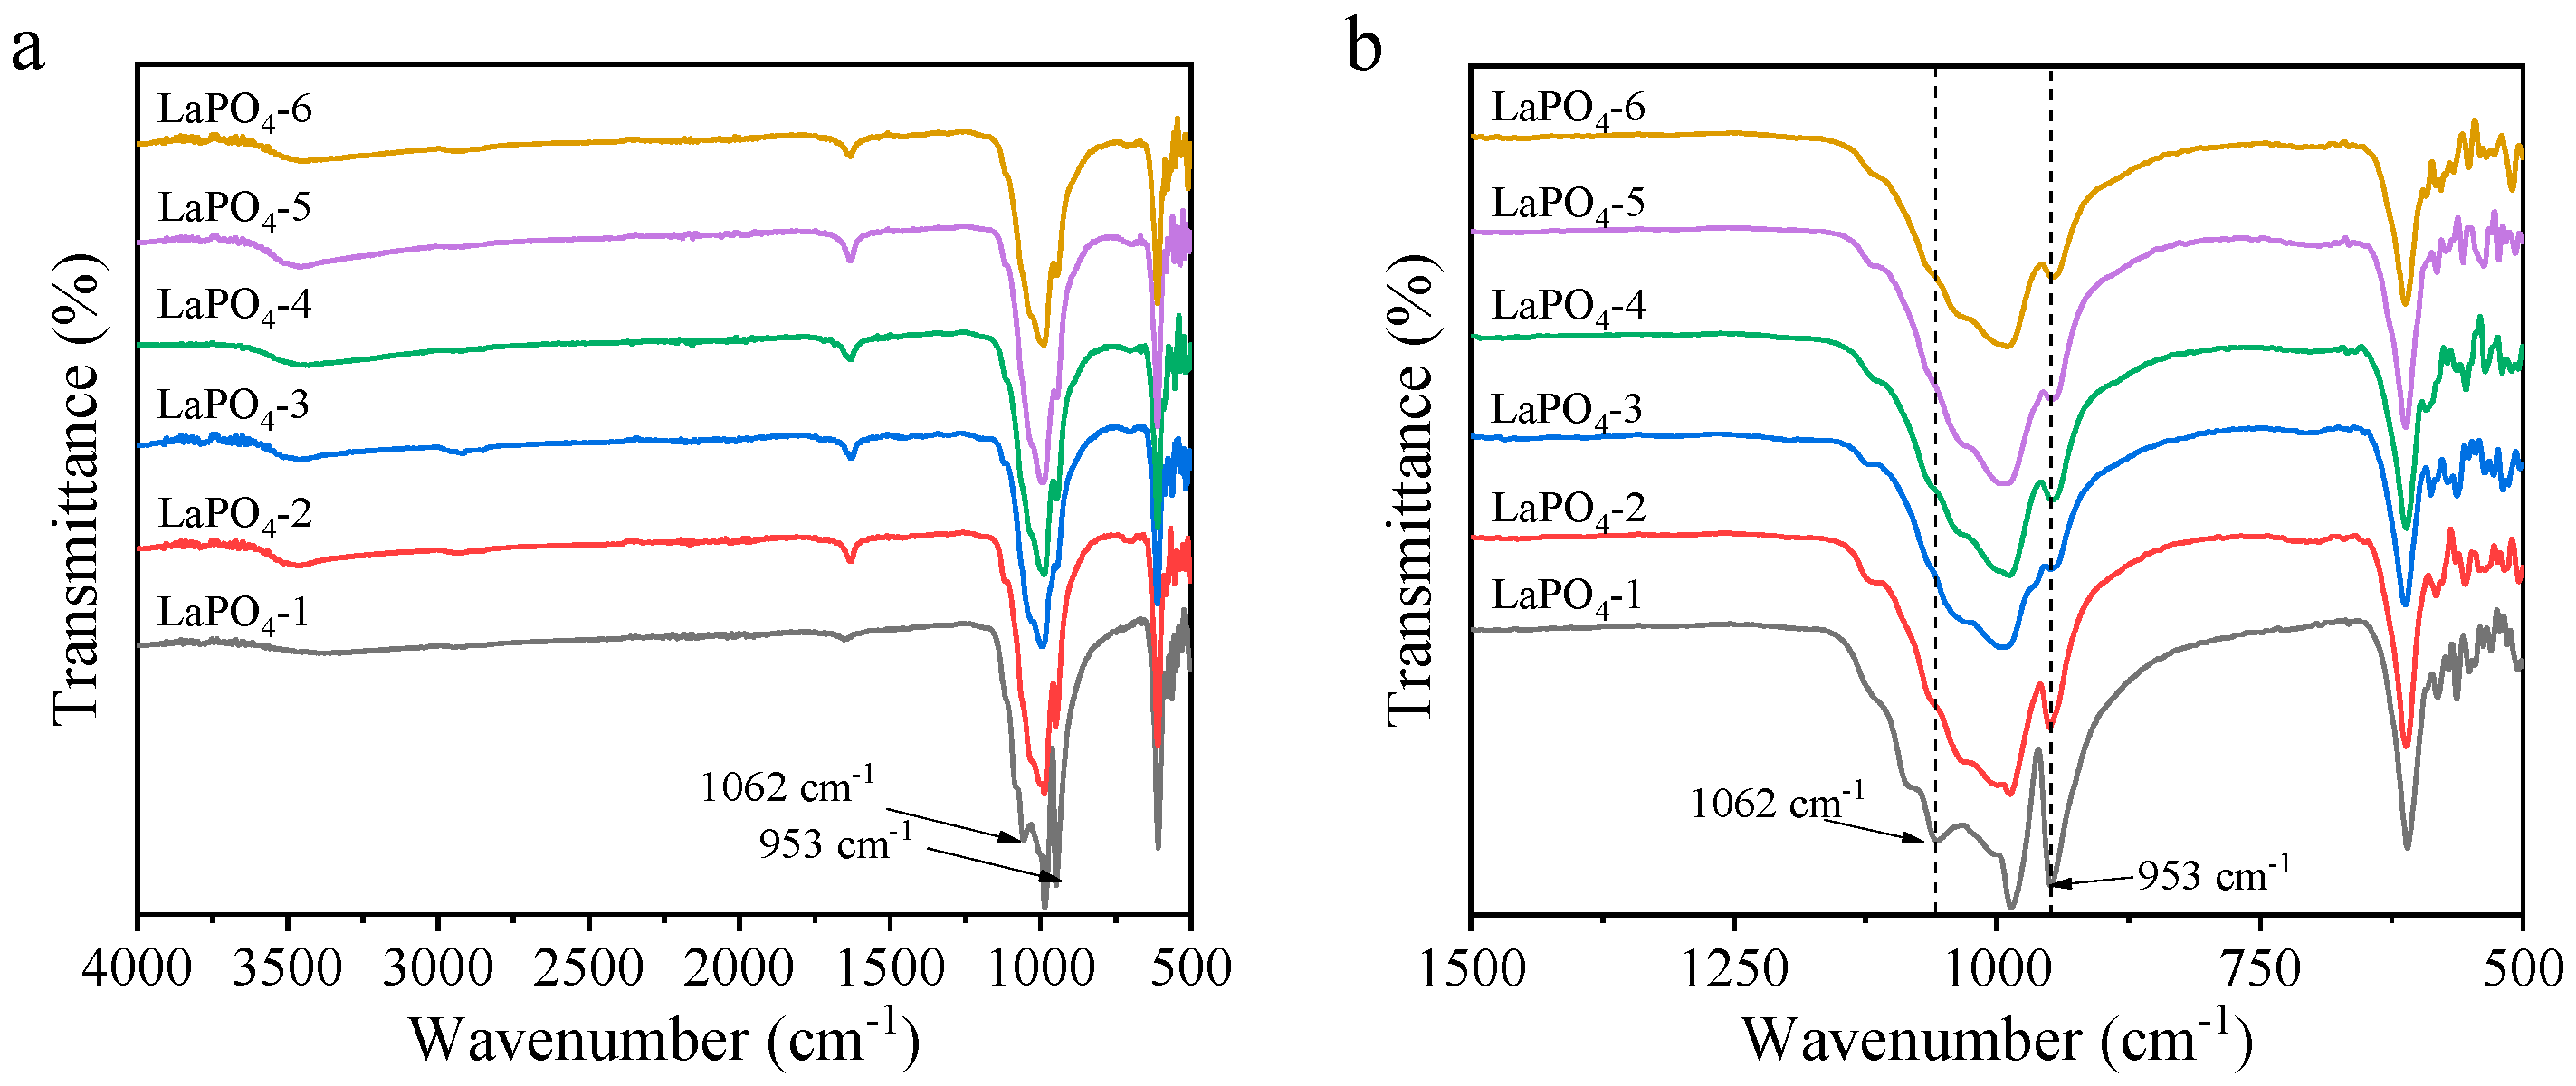
Figure 2 shows the FT-IR spectra of the LaPO4 samples. The peak at 3500 cm−1 is attributed to the stretching vibration of O-H, while the peak at 1635 cm−1 is attributed to the bending vibration of the O-H bond, which indicates the adsorption of moisture in the air by the samples during the test. The peak at 1000 cm−1 was caused by the stretching vibration peak of the P=O bond and P-O bond, and the corresponding bending vibration peak appeared at 630 cm−1. It is worth noting that the absorption peak of LaPO4-1 at 1000 cm−1 splits into an obvious triple peak, with the bands at 953 cm−1 and 1062 cm−1 becoming more prominent [26]. This is because the La in LaPO4 monoclinic phase crystal is 9 coordinated, while the La in hexagonal phase is 8 coordinated [41]. The force of La ion attraction on the P-O bond in the monoclinic phase decreases, so its stretching vibration peak and bending vibration peak are stronger than those in the hexagonal phase. The peak of LaPO4-2 at about 1060 cm−1 shifts to the low wavenumber direction and the intensity of the absorption peak at 953 cm−1 increases, indicating that it contains the monoclinic phase, which also confirms the characterization results of XRD.

3.2. Crystal Morphology of LaPO4 Samples

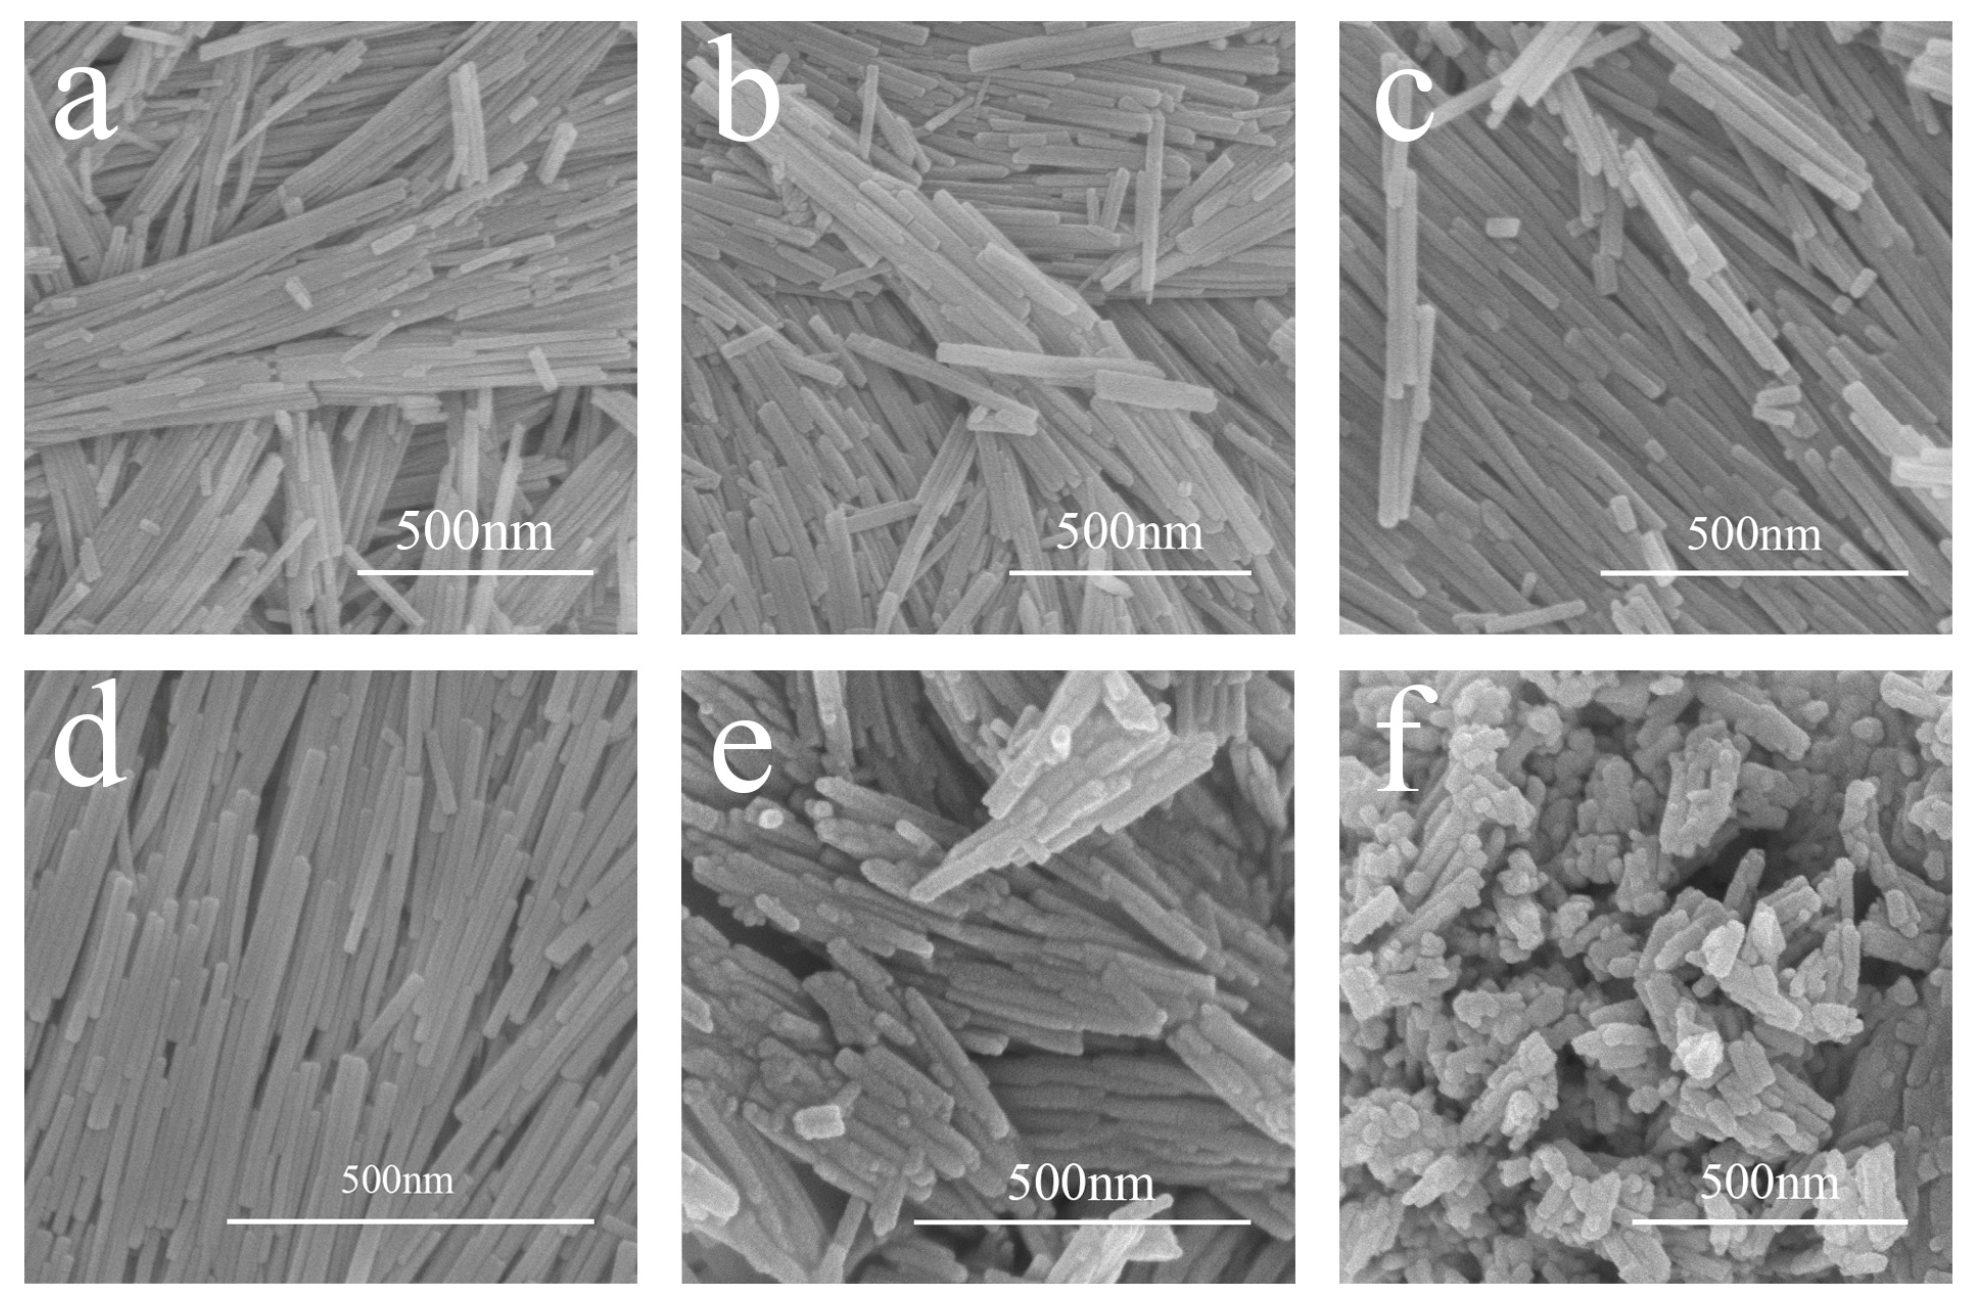
Figure 3 shows the SEM images of different LaPO4 samples. LaPO4-1–LaPO4-6 are all obvious rod-shaped stacking structures, but the degree of uniformity is different. The length and thickness of the rods formed by LaPO4 in LaPO4-1–LaPO4-4 samples are relatively consistent, and only a small number of short rods appear on the surface. Compared with LaPO4-3 and LaPO4-4, the rod distribution of LaPO4-1 and LaPO4-2 is less uniform, which can be attributed to the rapid crystallization and large irregular growth rate of LaPO4 under higher temperatures (160 °C, 140 °C). LaPO4-5 and LaPO4-6 show relatively short rods on the surface, which can be attributed to the slow growth rate and short crystallization time of LaPO4 rods under the synthesis conditions of low temperature (90 °C, 50 °C) and short time (both 1 h) [42].

3.3. Textural Properties of LaPO4 Samples

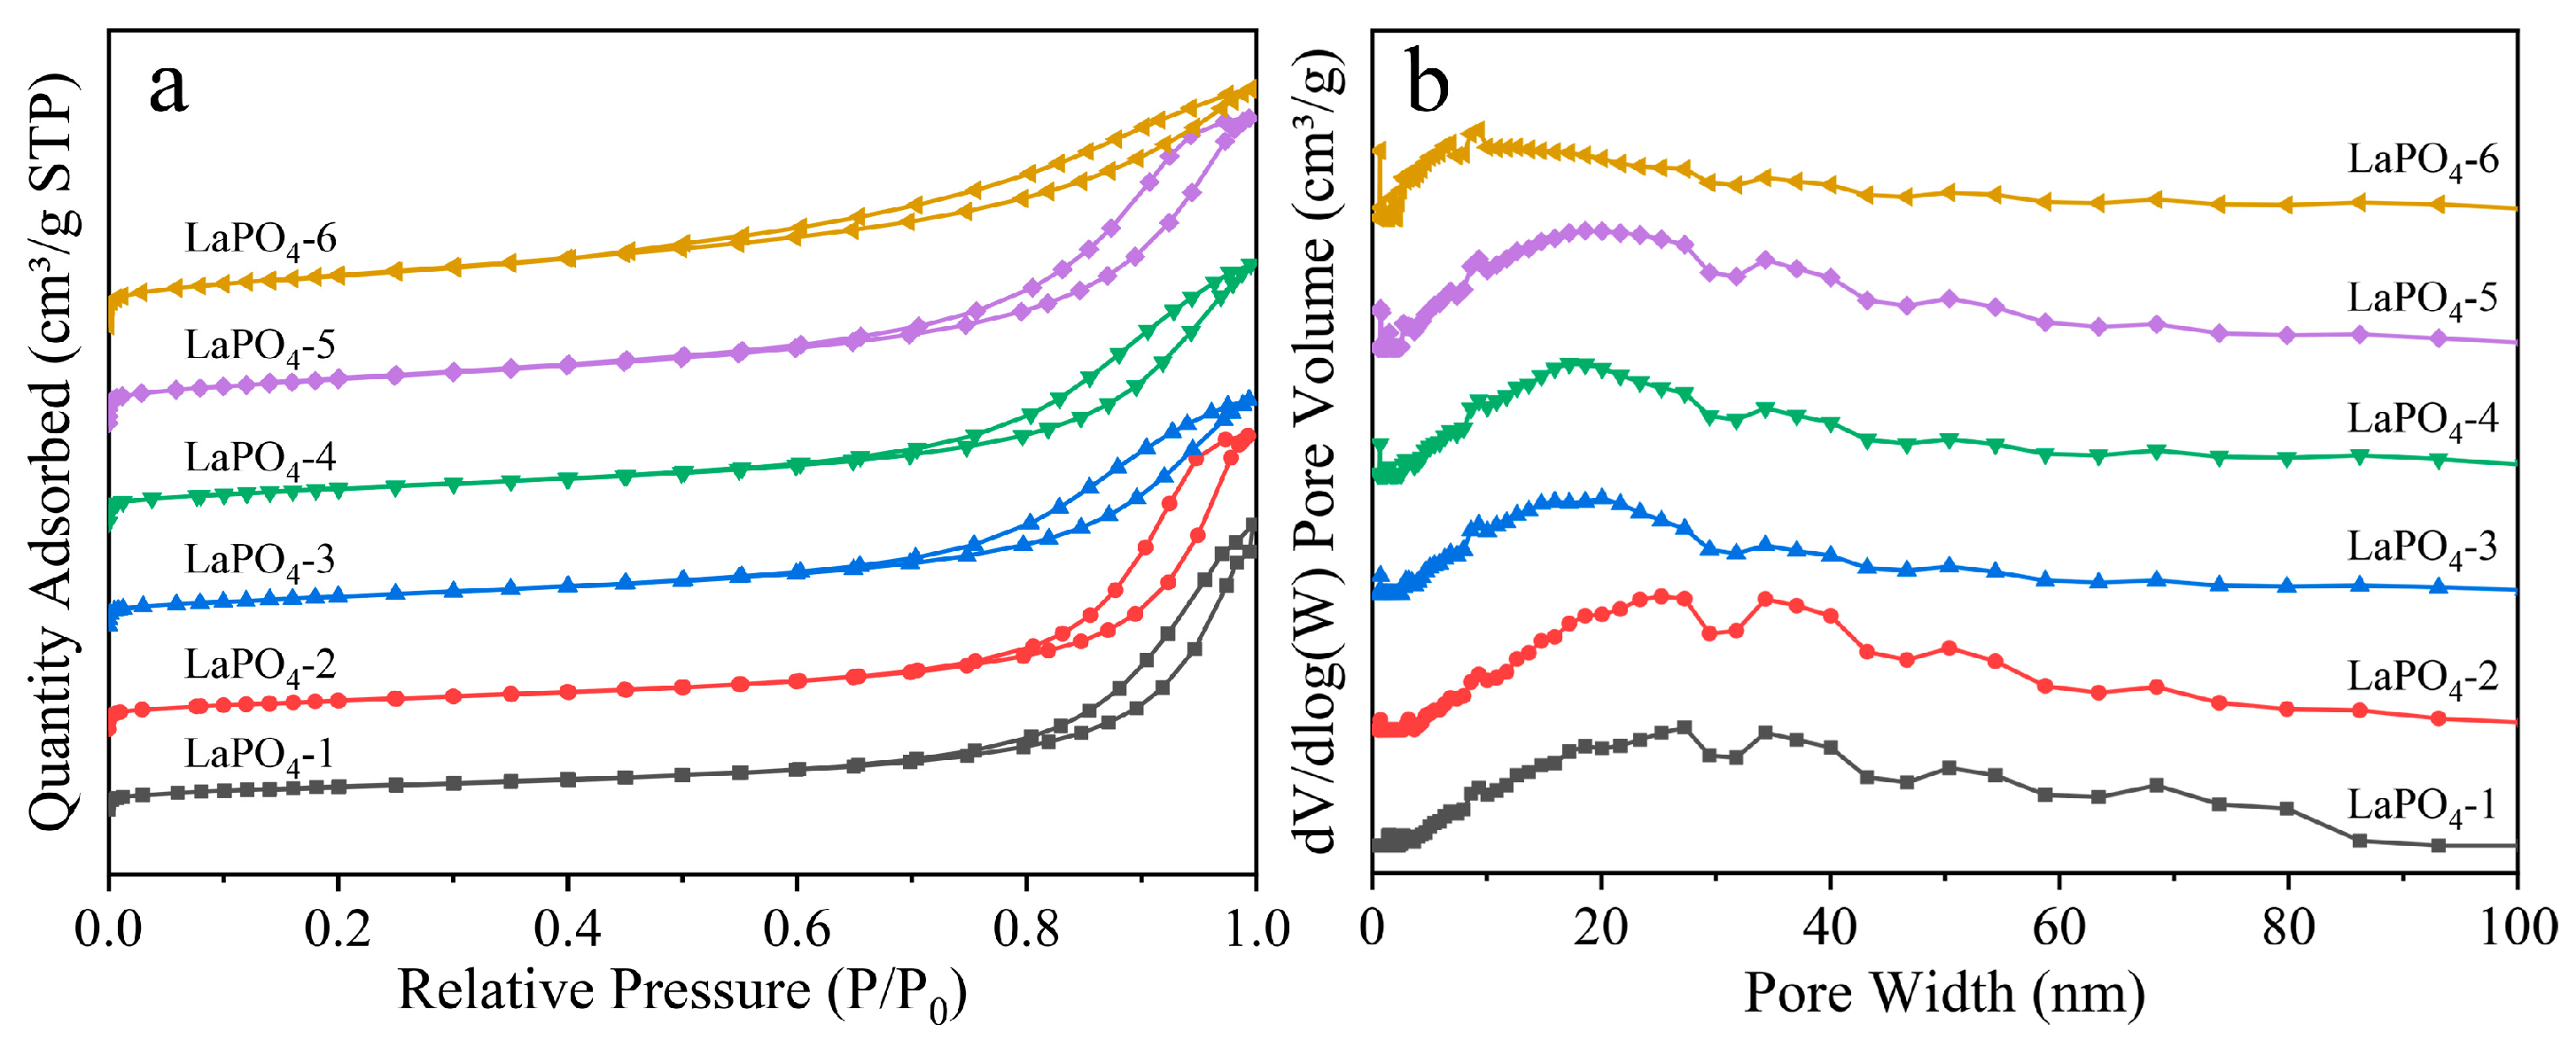
Figure 4 and Table 2 present the textural properties of samples LaPO4-1 to LaPO4-6. As shown in Figure 4a, all samples exhibit Type IV isotherms with H3-type hysteresis loops, which are characteristic of mesoporous materials. The differences in the adsorption capacity and the subtle variations in the hysteresis loops among the samples are directly attributed to their textural properties, as provided in Table 2. The increase in specific surface area (SBET) and total pore volume (Vt) from sample LaPO4-1 to LaPO4-6 correlates with the increased nitrogen uptake observed in the isotherms. These differences in textural properties primarily originate from variations in crystal nucleation and growth rates under hydrothermal conditions. This leads to differences in the ultimate size, stacking density, and arrangement of the generated nanorods, consequently resulting in the formation of distinct porous structures.
Figure 4b shows the pore size distribution of the samples. The pore sizes of all samples are mainly distributed in the mesoporous and macroporous regions. Table 2 presents the average pore size data of the samples. With the weakening of the preparation conditions, the average pore size decreased from 7.77 nm to 5.44 nm, showing an overall downward trend, which proves that we have prepared LaPO4 material with regular structure and large pore size. The monoclinic sample LaPO4-1 has the lowest specific surface area. The mixed phase LaPO4-2 exhibits a specific surface area comparable to that of hexagonal LaPO4-3, while the hexagonal samples (LaPO4-3 to LaPO4-6) show a sequential increase in specific surface area, consistent with slower crystallization under milder preparation conditions. LaPO4-1 and LaPO4-2 have similar pore size distribution, and the pore size is mainly concentrated in the range of 5–85 nm, with a wide distribution. Except for a small amount of micropores, most of the pore sizes of LaPO4-3, LaPO4-4, and LaPO4-5 are concentrated in the range of 5–60 nm. Compared with LaPO4-1, the pore size distribution is narrower. This can be attributed to the synthesis conditions at lower temperatures (120 °C, 100 °C, 90 °C), which result in slower rod formation rate of LaPO4, more regular material stacking, and narrower pore size distribution. Except for a small number of micropores, the vast majority of pore sizes in LaPO4-6 are concentrated in the mesoporous region, which can be attributed to the slow rod formation rate of LaPO4 under low-temperature (50 °C) synthesis conditions, the relatively regular material stacking, resulting in the narrowest pore size distribution.

3.4. Acidity and Alkalinity Characterization of Samples

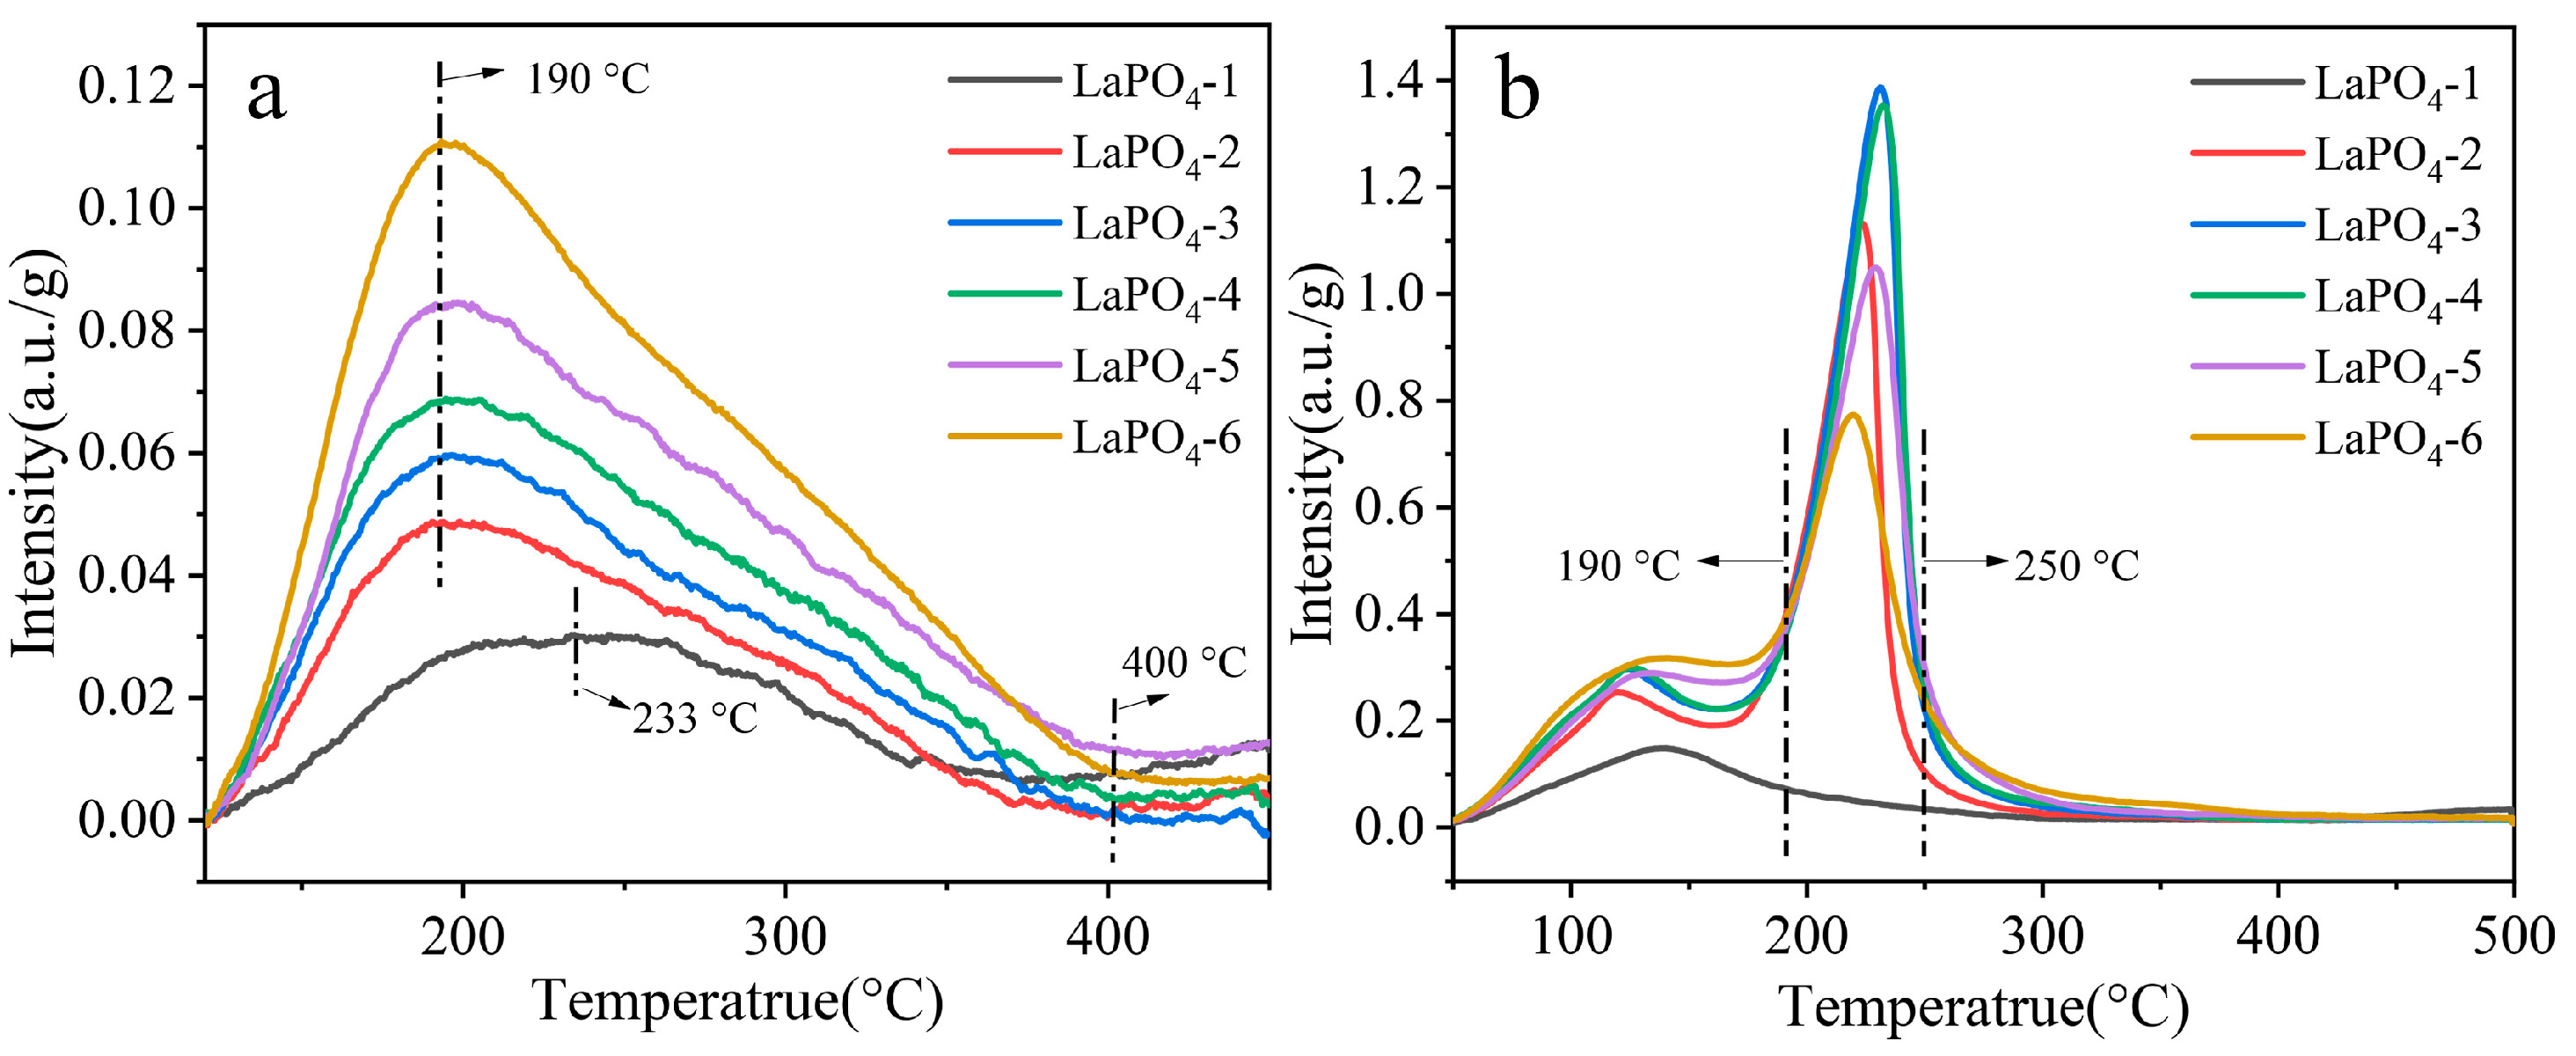
Figure 5 shows the distribution of surface acid and alkali properties of different LaPO4 samples, and Table 3 shows the total amount of surface acid and alkali of different LaPO4 samples. Figure 5a shows the distribution of surface acid properties of LaPO4 samples, in which the highest point of the NH3 desorption peak of LaPO4-2–LaPO4-6 is basically the same (near 190 °C), while the highest point of the NH3 desorption peak of LaPO4-1 is near 233 °C, indicating that the relative content of weak acid and medium-strong acid changes when the hexagonal phase transition is monoclinic (for the convenience of discussion, we define the desorption temperature below 190 °C as weak acid, and above 190 °C but below 400 °C as medium-strong acid). The sample LaPO4-1 of monoclinic phase has the lowest acid content, and the total acid content is only 0.154 mmol·g−1, which is mainly weak acid and medium-strong acid. The mixed phase sample LaPO4-2 and hexagonal phase samples (LaPO4-3–6) had similar distributions of medium-strong acid and weak acid, and the amount of acid increased in turn, up to 0.494 mmol·g−1. Figure 5b shows the surface alkali properties of different samples (for the convenience of discussion, we define desorption temperature below 190 °C as weak base, higher than 190 °C but below 250 °C as medium-strong base, and higher than 250 °C as strong base). Monoclinic sample LaPO4-1 has the lowest alkali content and is dominated by weak alkali sites, with a total alkali content of 0.242 mmol·g−1. Mixed phase sample LaPO4-2 and hexagonal phase sample (LaPO4-3–6) have similar distribution of medium-strong alkali sites and weak alkali sites, and both of them have obvious bimodal distribution. The alkali content of weak bases presents LaPO4-2 < LaPO4-3 < LaPO4-4 < LaPO4-5 < LaPO4-6, while the alkali content of medium strong base showed the change rule of LaPO4-6 < LaPO4-5 < LaPO4-4 < LaPO4-3 < LaPO4-2, and the alkali content of strong base showed the change rule of LaPO4-2 < LaPO4-3 < LaPO4-4 < LaPO4-5 < LaPO4-6, indicating that with the increase of specific surface areas, the content of weak base sites increased, and the content of medium-strong base sites decreased; the content of strong alkaline sites increased. Under the premise of similar specific surface areas, the total acid content and total alkali content of hexagonal sample LaPO4-3 are 1.94 times and 4.73 times that of monoclinic sample LaPO4-1, respectively, indicating higher acid and alkali density for the hexagonal sample. For the hexagonal samples LaPO4-3 to LaPO4-6 (based on the sample data of LaPO4-3), the specific surface area of LaPO4-4, LaPO4-5, and LaPO4-6 increased by 10.4%, 40.1%, and 60.6%, respectively, the total acid content increased by 14.4%, 28.8%, and 65.2%, respectively, and the total alkali content decreased by 1.7%, 3.5%, and 10.9%, respectively. It can be seen that the change of specific surface areas is not directly proportional to the total acid content and total alkali content. The variation in total acid and total alkali content of different LaPO4 can be attributed to the different number of exposed crystal surfaces and active sites caused by different crystal morphologies and specific surface areas of LaPO4.

3.5. Catalytic Performance

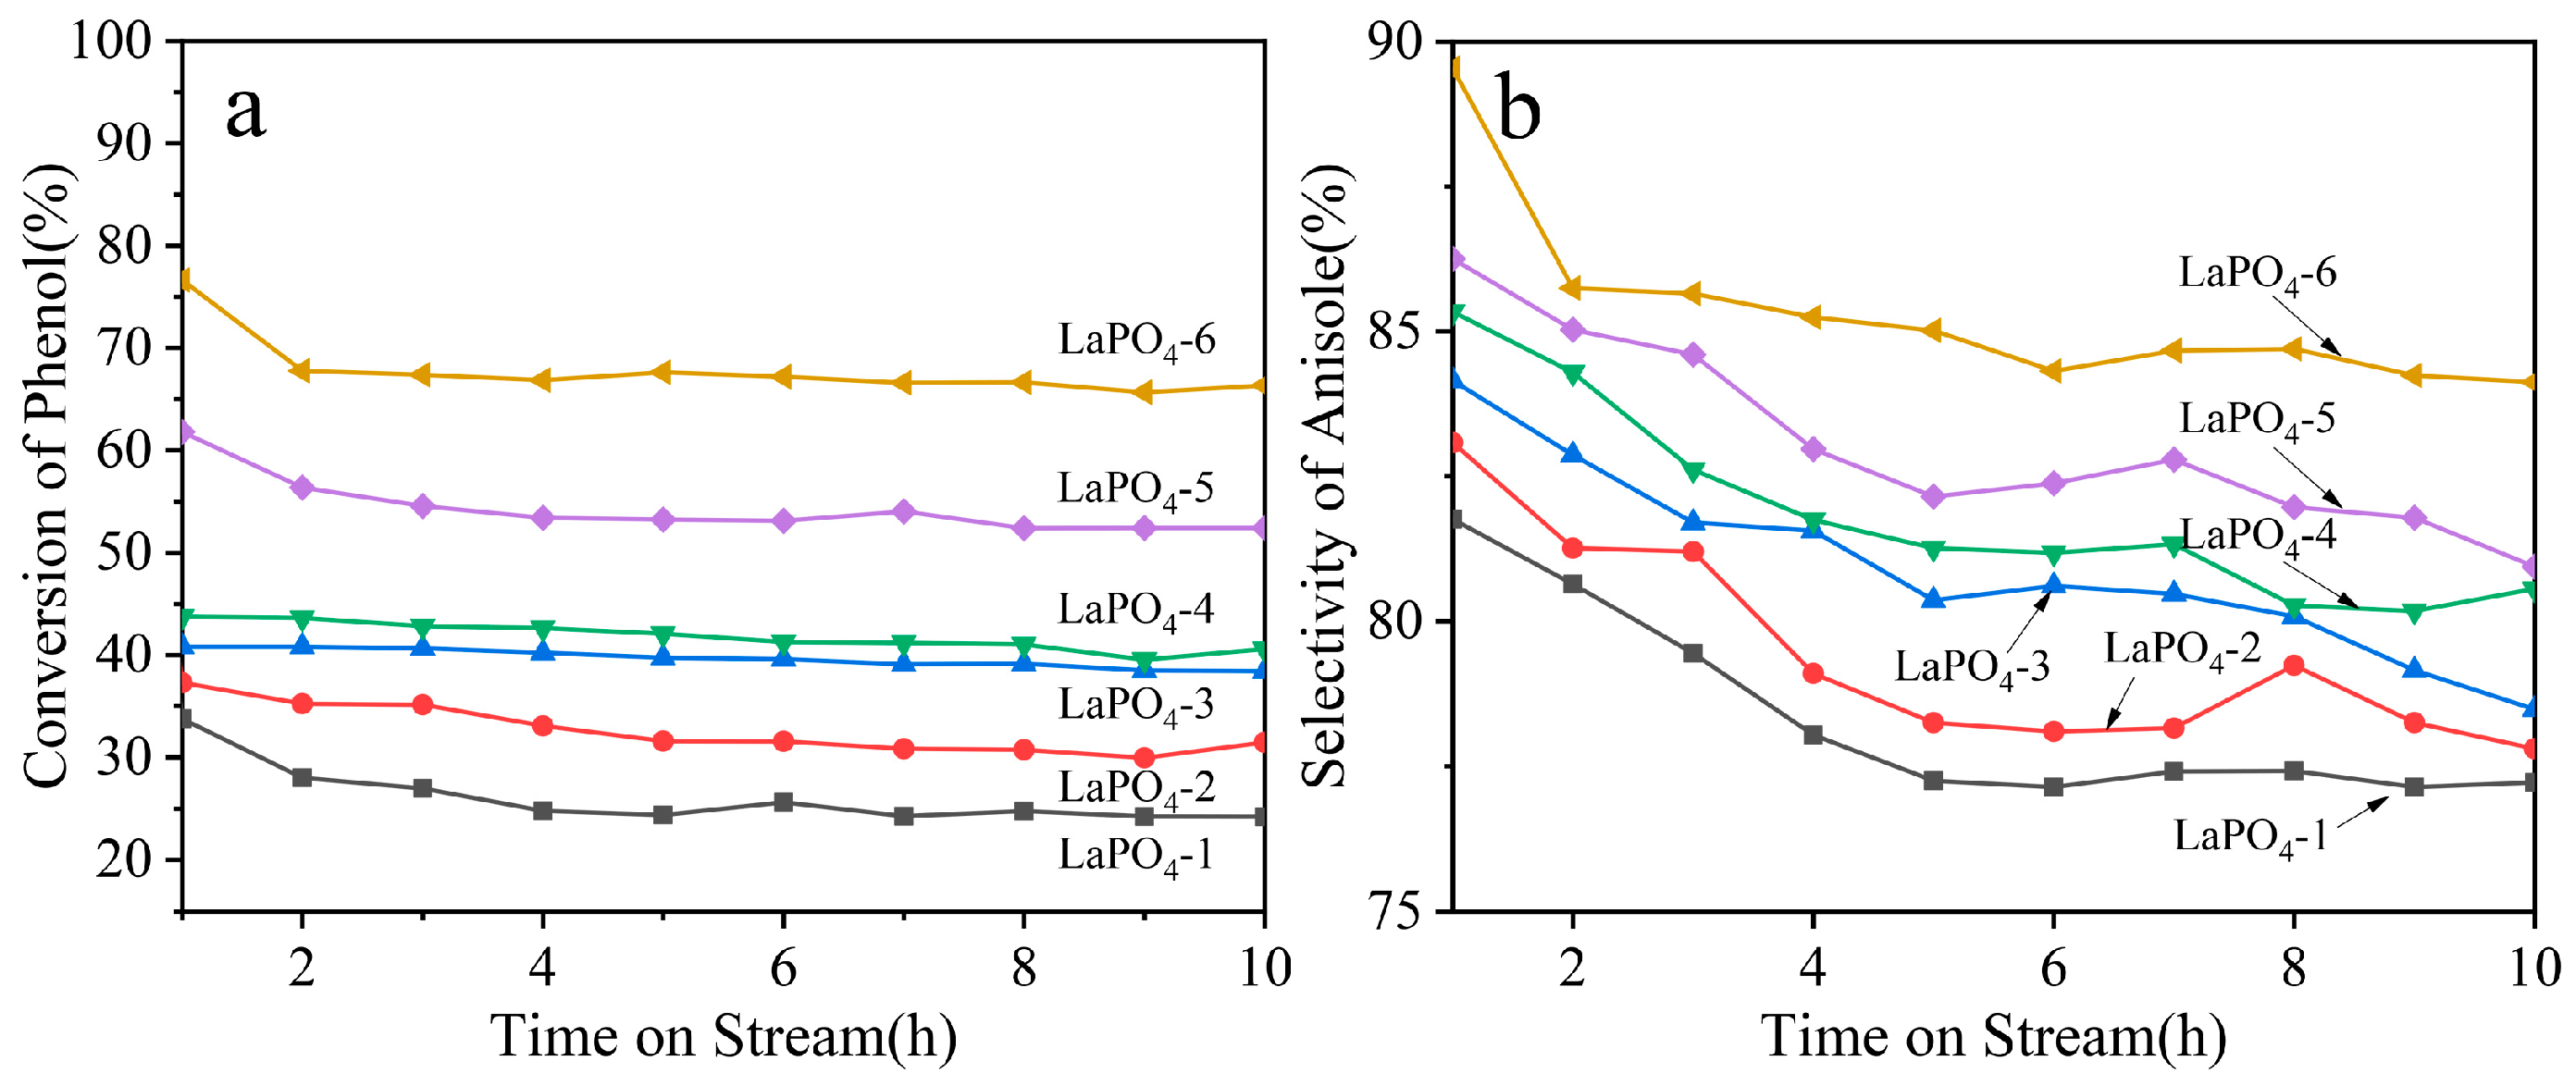
Figure 6 shows the phenol conversion and anisole selectivity of different LaPO4 samples. The LaPO4 samples obtained under different preparation conditions all show catalytic activity. The phenol conversion and anisole selectivity show the change rule of LaPO4-1 < LaPO4-2 < LaPO4-3 < LaPO4-4 < LaPO4-5 < LaPO4-6. The phenol conversion is between 28.0% and 67.8%, and the anisole selectivity is between 80.6% and 85.7%. LaPO4-6 has the highest phenol conversion of 67.8% and anisole selectivity (85.7%). The activity of the catalysts decreased gradually with the progress of the reaction.
Previous research reports have confirmed that the reaction of synthesizing anisole from phenol and methanol is catalyzed by both acidic and basic active sites. An increase in relatively strong acidic sites is beneficial for improving the conversion rate of raw materials and reducing the selectivity of anisole, while an increase in “strong” basic sites is beneficial for improving the selectivity of anisole [20,43]. Based on the characterization results of N2-physisorption-desorption, NH3-TPD, and CO2-TPD, it is observed that from LaPO4-1 to LaPO4-6, the acid amount on the surface of LaPO4 gradually increases with the increase in specific surface area. Therefore, the gradual increase in the phenol conversion rate can be attributed to the increase in acid amount caused by the increase in specific surface area. Although the acid density on the surface of LaPO4 increases from LaPO4-1 to LaPO4-6 and the total base density decreases, the content of relatively strong basic sites gradually increases. These relatively strong basic sites can inhibit the occurrence of side reactions, ultimately leading to a gradual increase in the selectivity of anisole.
It is noteworthy that, under the condition of being the same rod-like material with similar pore structures, the catalytic activity of the monoclinic phase sample LaPO4-1, the mixed phase sample LaPO4-2, and the hexagonal phase sample LaPO4-3, both in terms of phenol conversion rate and anisole selectivity, follow the order of LaPO4-1 < LaPO4-2 < LaPO4-3. It is particularly noteworthy that the aforementioned experimental results were observed for both LaPO4-2 and LaPO4-3 under the condition of similar specific surface areas, thus proving that the catalytic activity of hexagonal phase LaPO4 is higher than that of monoclinic phase LaPO4.
To explore the deactivation reasons of different crystal morphologies of LaPO4, representative samples LaPO4-1 and LaPO4-6 were selected for XPS, XRD, and TG analysis to compare the changes in LaPO4 before and after the reaction. The results are shown in Figure 7.
Figure 7 displays the XRD, XPS spectra, and TG graphs of fresh and used catalysts. From Figure 7a, it is clear that the peak position and relative peak height of LaPO4 remain unchanged before and after the reaction, indicating that the structure of LaPO4 is not the primary cause of catalyst deactivation. After calibrating the C peak, the XPS spectrum of the catalyst revealed that the peaks of La 3d, O 1s, and P 2p did not exhibit relative shifts, and their peak shapes were nearly identical. All tested samples exhibited a quadruple peak splitting for La 3d. The twin peaks located at 855.34 eV and 852.04 eV were attributed to La 3d3/2, with a difference of 3.3 eV between the two peaks. The twin peaks at 838.50 eV and 835.30 eV were caused by La 3d5/2, with a difference of 3.2 eV between the two peaks. All test samples exhibited single peaks at 531.10 eV and 133.25 eV for O1s and P2p, indicating that the chemical environments of La, P, and O elements on the surface of LaPO4 remained unchanged before and after the reaction [44]. Figure 7f shows the TG diagram of the used catalysts. After 310 °C, there is a significant weight loss in the catalysts, with a weight loss rate of 1.25% for LaPO4-1 and 1.59% for LaPO4-6. This indicates the presence of a small amount of organic matter on the catalyst surface. Furthermore, as the acid content increases, the rate of carbon deposition on the surface also increases. Based on the above analysis, it can be concluded that the main reason for the deactivation of the reaction is the carbon deposition on the catalyst surface, covering the active sites.

3.6. Calculation of Adsorption Energy and Hydrogen Bond Length

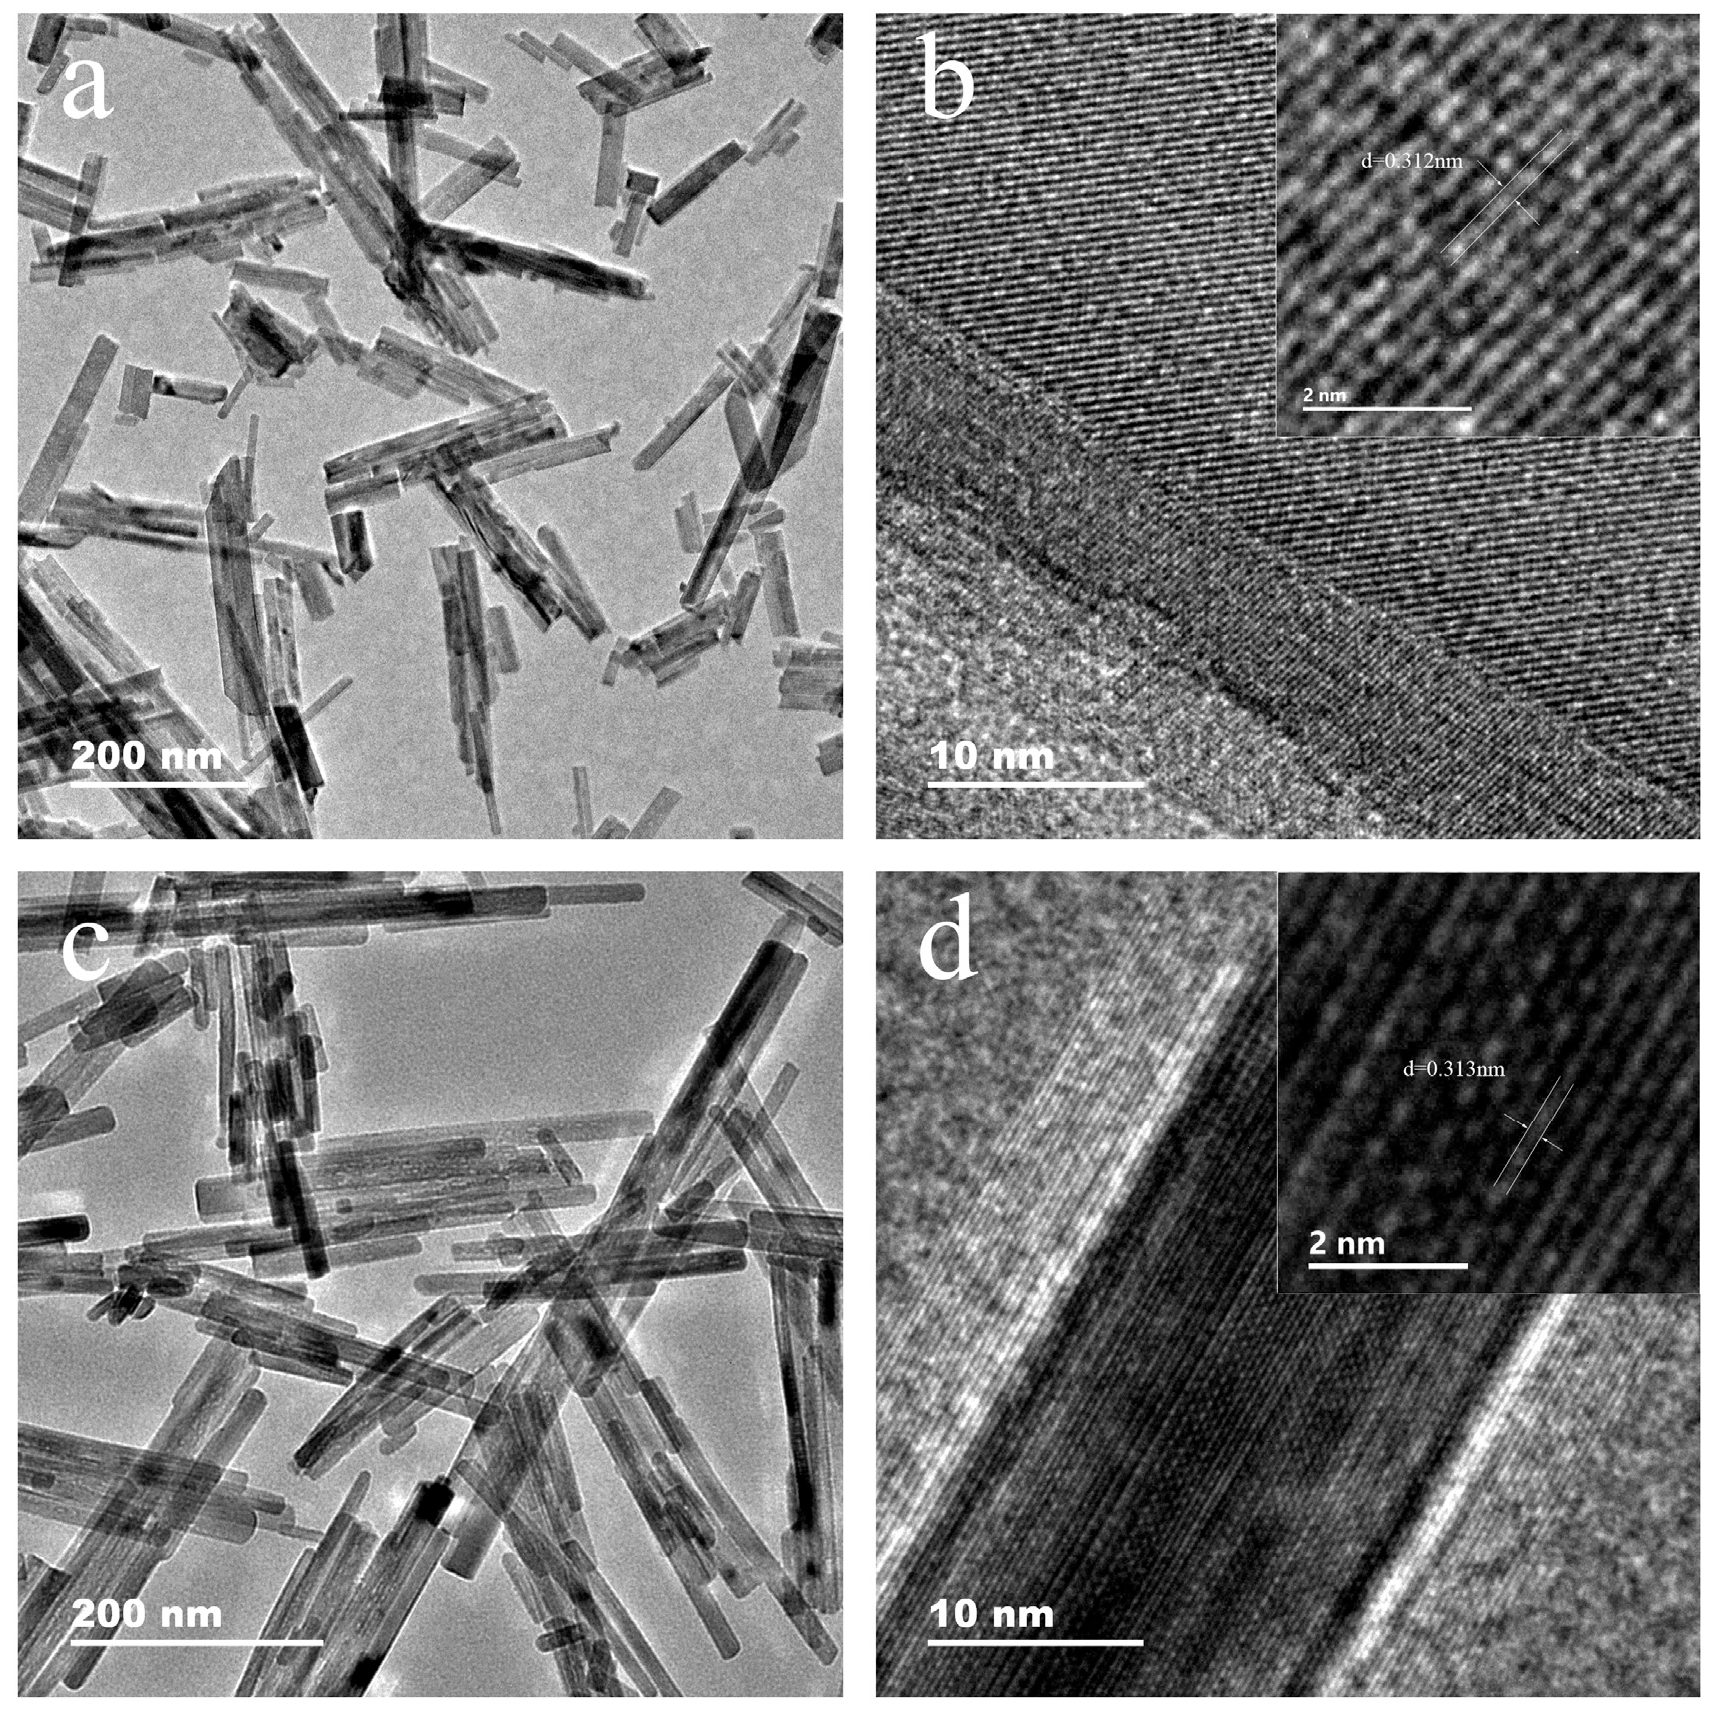
To better understand the mechanism of how crystal morphologies could influence catalytic reactions, it is imperative to conduct theoretical calculations on the adsorption energies of phenol and methanol on the surfaces of LaPO4 with different crystal morphologies, as well as the lengths of the formed hydrogen bonds. We selected the monoclinic phase sample LaPO4-1 and the hexagonal phase sample LaPO4-3 with similar specific surface areas for TEM characterization in order to determine the exposed crystal faces of LaPO4 with different crystal morphologies. The results are presented in Figure 8.
Figure 8 presents the TEM and HR-TEM images of LaPO4 samples LaPO4-1 and LaPO4-3. As clearly visible in the figures (Figure 8a,c), the prepared LaPO4 exhibits a rod-like structure. HR-TEM images (Figure 8b,d) reveal the interplanar spacings of 0.313 nm and 0.312 nm, respectively, corresponding to d120 of the (120) plane in the monoclinic phase and d200 of the (200) plane in the hexagonal phase. This suggests that the exposed crystal faces of samples LaPO4-1 and LaPO4-3 are the (120) plane and the (200) plane [45], respectively. The adsorption energies of phenol and methanol on these two crystal faces, as well as the bond lengths of the formed hydrogen bonds, were calculated using the DFT method. The results are presented in Figure 9 and Table 4.
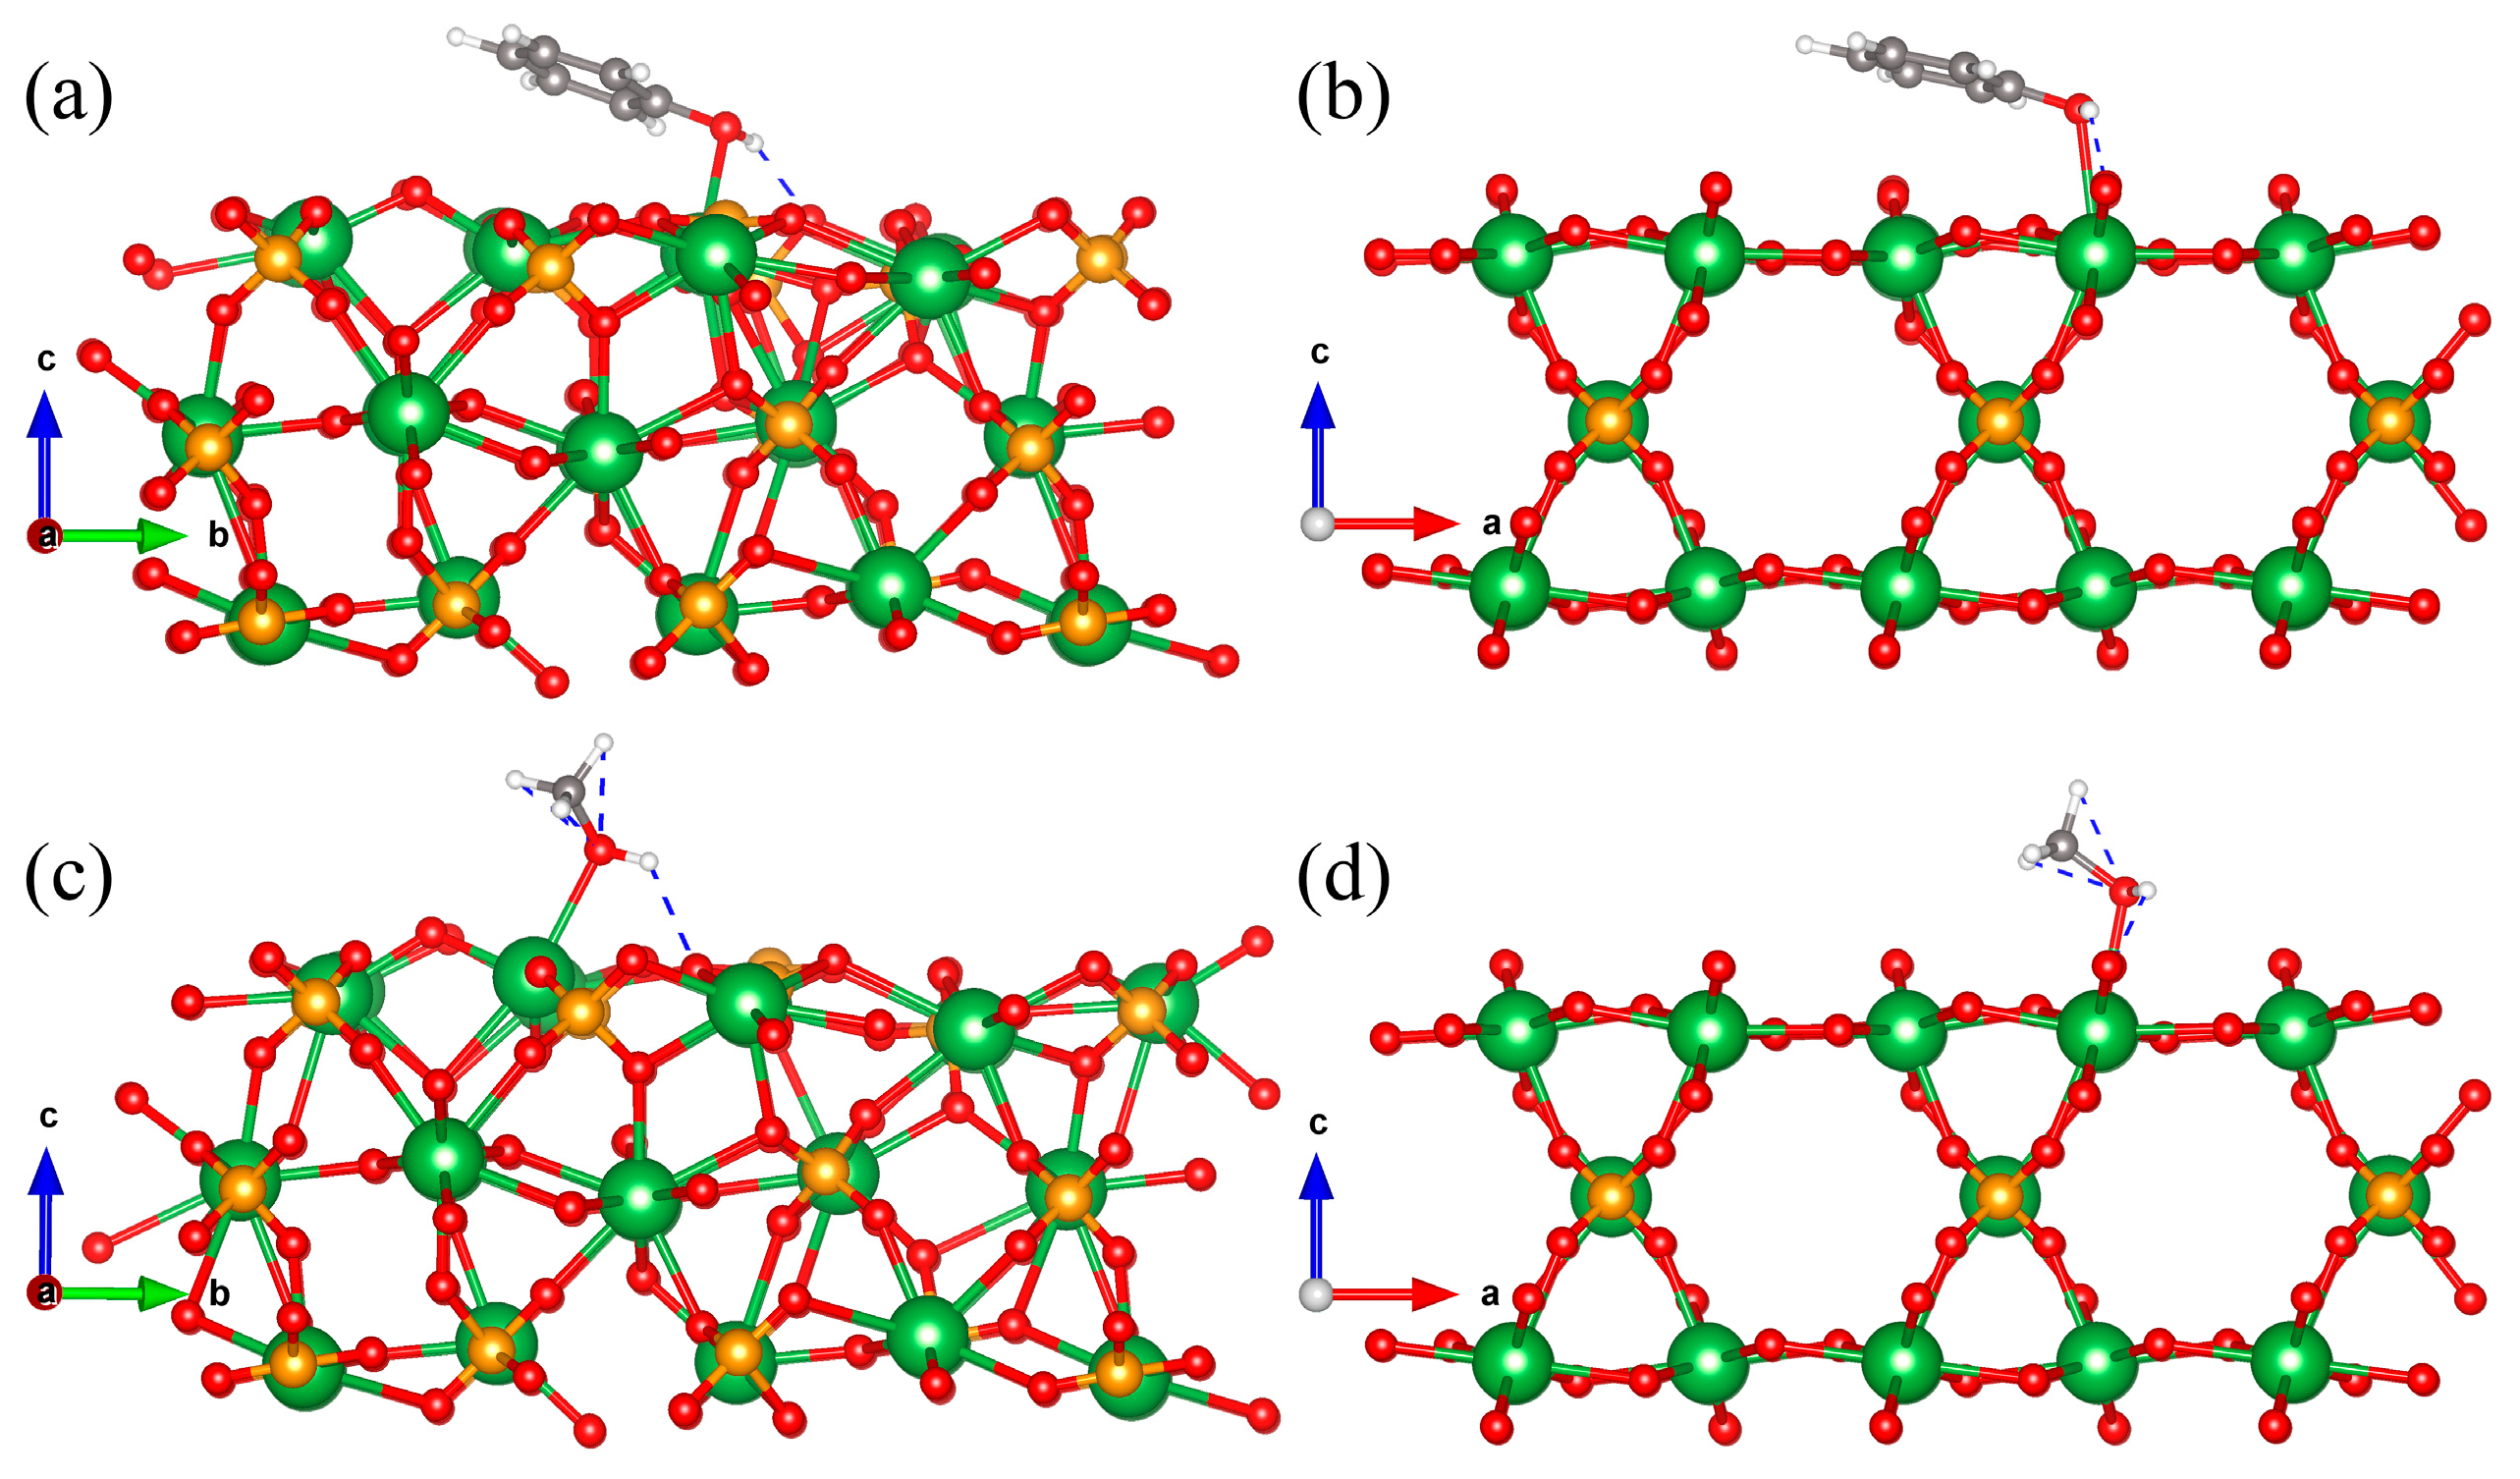
Figure 9 shows the adsorption diagram of the (200) crystal plane of the hexagonal phase, (120) crystal plane of the monoclinic phase, and phenol and methanol on the surface, respectively. Table 4 shows the adsorption energy data and hydrogen bond length data generated after adsorption equilibrium. On the surface of the (200) crystal plane (Figure 9a,b) of the hexagonal phase, methanol was adsorbed on the La10 (0.71921, 0.41492, 0.43947) site with an adsorption energy of −0.942 eV. The hydrogen bond between the H4 (0.78158, 0.35538, 0.54882) atom in methanol and the O30 (0.73564, 0.24797, 0.48911) atom on the surface of LaPO4 was formed with a bond length of 2.086 Å; phenol was adsorbed on La10 (0.71736, 0.41657, 0.43845) with an adsorption energy of −1.261 eV. The hydrogen bond between the H6 (0.70848, 0.34590, 0.55174) atom in the phenol molecule and the O30 (0.72938, 0.25182, 0.49247) atom on the LaPO4 surface was formed, and the bond length was 1.877 Å. In the monoclinic (120) crystal plane model (Figure 9c,d), methanol was adsorbed on the La23 (0.70555, 0.33674, 0.46808) site, and the adsorption energy was −0.686 eV. The hydrogen bond between the H4 (0.77670, 0.47482, 0.55690) atom in methanol and the O54 (0.80862, 0.53447, 0.47483) atom on LaPO4 surface was formed, and the bond length was 2.181 Å. Phenol was adsorbed on the La3 (0.52606, 0.59015, 0.45277) site with an adsorption energy of −1.704 eV. A hydrogen bond was formed between the H6 (0.38575, 0.65561, 0.53708) atom in phenol and the O3 (0.35215, 0.72403, 0.47846) atom on the surface of LaPO4 with a bond length of 1.865 Å.
The data in Table 4 reveals that the adsorption energy and hydrogen bond length of methanol and phenol on the LaPO4 surface vary significantly due to the different surface atomic arrangements caused by different crystal morphologies. The adsorption energy of phenol on the two crystal faces (−1.261 eV, −1.704 eV) is much lower than that of methanol (−0.904 eV, −0.686 eV). Meanwhile, the hydrogen bond length formed by the H on the phenolic hydroxyl group (1.877 Å, 1.865 Å) is shorter than that formed by the H on the alcohol hydroxyl group (2.086 Å, 2.181 Å). It can be concluded that phenol is more easily adsorbed on the LaPO4 surface than methanol, both on the (120) and (200) crystal faces, indicating that phenol is more easily adsorbed and activated by LaPO4 than methanol. Therefore, the rate of reaction between phenol and methanol to form anisole is mainly influenced by the activation status of methanol, which is consistent with the experimental results reported by Sanghamitra [46]. The hydrogen bond length formed by methanol on the two exposed crystal faces is nearly identical, while the adsorption energy of methanol on the (200) crystal face is much lower than that on the (120) crystal face (difference of −0.256 eV), indicating that methanol is more easily adsorbed and activated on the (200) crystal face. Therefore, it can be concluded that under consistent experimental conditions, methanol is more easily adsorbed and activated on the hexagonal LaPO4 surface, thus exhibiting higher catalytic activity than the monoclinic LaPO4 on a macroscopic scale.

4. Conclusions

In summary, a series of rod-shaped LaPO4 materials were synthesized using the hydrothermal method. Characterization revealed that under comparable specific surface area conditions, the hexagonal phase LaPO4 possesses total acid and base amounts that are 1.94 times and 4.73 times higher, respectively, than those of the monoclinic phase. This indicates a significantly higher acid and base site density on the surface of the hexagonal phase, which is identified as the primary reason for its superior catalytic activity. Furthermore, as the specific surface area of the hexagonal LaPO4 increases, the surface acidity and basicity also increase, leading to a phenol conversion of up to 67.8% and an anisole selectivity of up to 85.7%. DFT theoretical calculations confirmed that phenol is more readily adsorbed and activated on the hexagonal surface. Finally, investigation into the deactivation mechanism revealed that carbon deposition on the catalyst surface is the main cause of deactivation for both phases, with the used monoclinic LaPO4 exhibiting a higher carbon deposition content than its hexagonal counterpart.

Author Contributions

Conceptualization, W.W., Q.-Q.H. and M.Y.; Methodology, F.Z. (Fan Zhang), Q.Z., X.L. and Y.L. (Yajun Li); Software, F.Z. (Feng Zhang), K.W. and Y.L. (Ying Liu); Validation, F.Z. (Feng Zhang), H.L. and Y.Z.; Investigation, Q.Z.; Data Curation, F.Z. (Fan Zhang), Q.Z., S.Y. and M.Y.; Writing—Original Draft, F.Z. (Fan Zhang); Writing—Review and Editing, W.W. and M.Y.; Funding Acquisition, W.W. and Q.-Q.H. All authors have read and agreed to the published version of the manuscript.

Funding

This work was supported by the National Natural Science Foundation of China (No. 22378325), Natural Science Foundation of Shaanxi Province (Nos. 2019JLM-15, 2021GY-159).

Institutional Review Board Statement

Not applicable.

Informed Consent Statement

Not applicable.

Data Availability Statement

The original contributions presented in this study are included in the article. Further inquiries can be directed to the corresponding author.

Conflicts of Interest

The authors declare no conflicts of interest.

References

  1. Cruz, J.J.; Escudero, F.; Verdugo, I.; Rivera, P.; Gutiérrez-Cáceres, N.; Yon, J.; Fuentes, A. Sooting propensity and maturity of gasoline/anisole blends in a laminar coflow diffusion flame. Fuel 2023, 345, 128091. [Google Scholar] [CrossRef]
  2. Shrabanti, R.; Omid, A. Detailed kinetics for anisole oxidation under various range of operating conditions. Fuel 2022, 325, 124907. [Google Scholar] [CrossRef]
  3. De Oliveira, M.P.; Delolo, F.G.; Villarreal, J.A.A.; dos Santos, E.N.; Gusevskaya, E.V. Hydroformylation and one-pot hydroformylation/epoxy ring cleavage of limonene oxide: A sustainable access to biomass-based multi-functional fragrances. Appl. Catal. A-Gen. 2021, 616, 118082. [Google Scholar] [CrossRef]
  4. Sreedhar, I.; Kantamneni, H.; Suresh Kumar Reddy, K.; Raghavan, K.V. Optimal process conditions for zeolite catalyzed acylation of anisole. Kinet. Catal. 2014, 55, 229–232. [Google Scholar] [CrossRef]
  5. Shahbaz, M.A.; Jahangir, S.; Kaiser, S.A. Imaging of flame propagation and temperature distribution in an all-metal gasoline engine with endoscopic access via anisole fluorescence. Exp. Fluids 2023, 64, 196. [Google Scholar] [CrossRef]
  6. Lewis, H.F.; Shaffer, S.; Trieschmann, W.; Cogan, H. Methylation of phenol by dimethyl sulfate. Ind. Eng. Chem. 1930, 22, 397–398. [Google Scholar] [CrossRef]
  7. Shiori, M.; Tatsuya, M.; Kotaro, M.; Yuko, N.; Yosinao, K. Three Cases of Chemical Burns Caused Due to Dimethyl Sulfate Poisoning. Cureus 2024, 16, e57060. [Google Scholar] [CrossRef]
  8. Memoli, S.; Selva, M.; Tundo, P. Dimethylcarbonate for eco-friendly methylation reactions. Chemosphere 2001, 43, 115–121. [Google Scholar] [CrossRef]
  9. Zhang, Z.; Xu, Z.; Li, S.; Chen, S.; Tang, Y. Selective O-methylation of phenol with dimethyl carbonate over catalysts supported on CaO. Kinet. Catal. 2021, 62, 496–506. [Google Scholar] [CrossRef]
  10. Huang, F.; Li, L.; Guan, M.; Hong, Z.; Miao, L.; Zhao, G.; Zhu, Z. A review of the process on vapor phase methylation of phenol with methanol. Catal. Lett. 2023, 153, 754–769. [Google Scholar] [CrossRef]
  11. Liu, N.; Mao, J.; Wu, Y.; Meng, X.; Shi, L. Alkylation of Phenol with Methanol over ZSM-5 Zeolite. Chem. Eng. Technol. 2024, 47, 984–993. [Google Scholar] [CrossRef]
  12. Lee, S.C.; Lee, S.W.; Kim, K.S.; Lee, T.J.; Kim, D.H.; Kim, J.C. O-alkylation of phenol derivatives over basic zeolites. Catal. Today 1998, 44, 253–258. [Google Scholar] [CrossRef]
  13. Wang, W.; Zhang, F.; Chang, P.; Luo, X.; Miao, K.; Feng, G. One-step microwave synthesis of micron-sized ZSM-5/MCM-41 hierarchical porous materials for phenol hydroxyl alkylation. Inorg. Chem. Commun. 2022, 143, 109738. [Google Scholar] [CrossRef]
  14. Durgakumari, V.; Narayanan, S.; Guczi, L. Alkylation of phenol with methanol over AlPO and SAPO molecular sieves. Catal. Lett. 1990, 5, 377–384. [Google Scholar] [CrossRef]
  15. Samolada, M.C.; Grigoriadou, E.; Kiparissides, Z.; Vasalos, I.A. Selective O-alkylation of phenol with methanol over sulfates supported on γ-Al2O3. J. Catal. 1995, 152, 52–62. [Google Scholar] [CrossRef]
  16. Dang, D.; Wang, Z.; Lin, W.; Song, W. Synthesis of anisole by vapor phase methylation of phenol with methanol over catalysts supported on activated alumina. Chin. J. Catal. 2016, 37, 720–726. [Google Scholar] [CrossRef]
  17. Devi, G.S.; Giridhar, D.; Reddy, B.M. Vapour phase O-alkylation of phenol over alkali promoted rare earth metal phosphates. J. Mol. Catal. A Chem. 2002, 181, 173–178. [Google Scholar] [CrossRef]
  18. Chada, R.R.; Ketike, T.; Boilla, A.R.; Gangadharam, S.D.; Kamaraju, S.R.R.; Burri, D.R. Preparation and characterization of lanthanum phosphate catalysts for O-methylation of phenol to anisole in gas phase. Mol. Catal. 2017, 438, 224–229. [Google Scholar] [CrossRef]
  19. Nozaki, F.; Kimura, I. A study of catalysis by metal phosphates. IV. the alkylation of phenol with methanol over metal phosphate catalysts. Bull. Chem. Soc. Jpn. 1977, 50, 614–619. [Google Scholar] [CrossRef]
  20. Velu, S.; Swamy, C.S. Effect of substitution of Fe3+/Cr3+ on the alkylation of phenol with methanol over magnesium-aluminium calcined hydrotalcite. Appl. Catal. A-Gen. 1997, 162, 81–91. [Google Scholar] [CrossRef]
  21. Rusu, O.A.; Hoelderich, W.F.; Wyart, H.; Ibert, M. Metal phosphate catalyzed dehydration of sorbitol under hydrothermal conditions. Appl. Catal. B Environ. 2015, 176–177, 139–149. [Google Scholar] [CrossRef]
  22. Touny, A.H.; Tammam, R.H.; Saleh, M.M. Electrocatalytic oxidation of formaldehyde on nanoporous nickel phosphate modified electrode. Appl. Catal. B Environ. 2018, 224, 1017–1026. [Google Scholar] [CrossRef]
  23. Sodesawa, T.; Kimura, I.; Nozaki, F. A study of catalysis by metal phosphates. V. The alkylation of toluene with methanol over metal phosphate catalysts. Bull. Chem. Soc. Jpn. 1979, 52, 2431–2432. [Google Scholar] [CrossRef]
  24. Subramaniam, T.; Balarabe Idris, M.; Harshini Sai, G.; Devaraj, S. The effect of the crystallographic form of MnO2 on the kinetics of oxygen reduction and evolution reaction. Mater. Chem. Phys. 2023, 303, 127845. [Google Scholar] [CrossRef]
  25. Wang, X.; Zhao, J.; Sun, W.; Pei, Y.; An, J.; Li, Z.; Ren, J. A DFT study of dimethyl carbonate synthesis from methanol and CO2 on zirconia: Effect of crystalline phases. Comput. Mater. Sci. 2019, 159, 210–221. [Google Scholar] [CrossRef]
  26. Rahmat, N.; Yaakob, Z.; Pudukudy, M.; Rahman, N.A.; Jahaya, S.S. Single step solid-state fusion for MgAl2O4 spinel synthesis and its influence on the structural and textural properties. Powder Technol. 2018, 329, 409–419. [Google Scholar] [CrossRef]
  27. Su, Y.; Tang, Z.; Han, W.; Zhang, P.; Song, Y.; Lu, G. Influence of the pore structure of CeO2 supports on the surface texture and catalytic activity for CO oxidation. CrystEngComm 2014, 16, 5189–5197. [Google Scholar] [CrossRef]
  28. Shvets, O.V.; Konysheva, K.M.; Shamzhy, M.V.; Opanasenko, M.V.; Yaremov, P.S.; Xiao, C.; Zou, X.; Čejka, J. Mordenite nanorods and nanosheets prepared in presence of gemini type surfactants. Catal. Today 2019, 324, 115–122. [Google Scholar] [CrossRef]
  29. Zhou, P.; Liu, M.N.; Luo, Q.X.; Zhang, J.; Chen, H.; Ma, X.; Hao, Q.Q. Synthesis of hierarchical nanocrystalline β zeolite as efficient catalyst for alkylation of benzene with benzyl alcohol. RSC Adv. 2022, 12, 4865–4873. [Google Scholar] [CrossRef]
  30. Nguyen, T.T.N.; Ruaux, V.; Massina, L.; Lorentz, C.; Afanasiev, P.; Maugé, F.; Bellière-Baca, V.; Rey, P.; Millet, J.M.M. Synthesis, characterization and study of lanthanum phosphates as light alcohols dehydration catalysts. Appl. Catal. B Environ. 2015, 166–167, 432–444. [Google Scholar] [CrossRef]
  31. Fang, Y.P.; Xu, A.W.; Song, R.Q.; Zhang, H.X.; You, L.P.; Yu, J.C.; Liu, H.Q. Systematic synthesis and characterization of single-crystal lanthanide orthophosphate nanowires. J. Am. Chem. Soc. 2003, 125, 16025–16034. [Google Scholar] [CrossRef]
  32. Lucas, S.; Champion, E.; Bregiroux, D.; Bernache-Assollant, D.; Audubert, F. Rare earth phosphate powders RePO4·nH2O(Re=La, Ce or Y)—Part I. synthesis and characterization. J. Solid State Chem. 2004, 177, 1302–1311. [Google Scholar] [CrossRef]
  33. Sankar, S.; Warrier, K.G. Aqueous sol–gel synthesis of lanthanum phosphate nano rods starting from lanthanum chloride precursor. J. Sol-Gel Sci. Technol. 2011, 58, 195–200. [Google Scholar] [CrossRef]
  34. Onoda, H.; Ishima, Y.; Takenaka, A.; Tanaka, I. Preparation of porous lanthanum phosphate with templates. Mater. Res. Bull. 2009, 44, 1712–1716. [Google Scholar] [CrossRef]
  35. Kresse, G.; Furthmüller, J. Efficiency of ab-initio total energy calculations for metals and semiconductors using a plane-wave basis set. Comput. Mater. Sci. 1996, 6, 15–50. [Google Scholar] [CrossRef]
  36. Kresse, G.; Furthmüller, J. Efficient iterative schemes for ab initio total-energy calculations using a plane-wave basis set. Phys. Rev. B Condens. Matter 1996, 54, 11169–11186. [Google Scholar] [CrossRef] [PubMed]
  37. Kresse, G.; Joubert, D. From ultrasoft pseudopotentials to the projector augmented-wave method. Phys. Rev. B Condens. Matter 1999, 59, 1758–1775. [Google Scholar] [CrossRef]
  38. Blöchl, P.E. Projector augmented-wave method. Phys. Rev. B Condens. Matter 1994, 50, 17953–17979. [Google Scholar] [CrossRef]
  39. Grimme, S.; Antony, J.; Ehrlich, S.; Krieg, H. A consistent and accurate ab initio parametrization of density functional dispersion correction (DFT-D) for the 94 elements H-Pu. J. Chem. Phys. 2010, 132, 154104. [Google Scholar] [CrossRef]
  40. Monkhorst, H.J.; Pack, J.D. Special points for Brillouin-zone integrations. Phys. Rev. B Condens. Matter 1976, 13, 5188–5192. [Google Scholar] [CrossRef]
  41. Neupane, M.R.; Garrett, G.A.; Rudin, S.; Andzelm, J.W. Phase dependent structural and electronic properties of lanthanum orthophosphate (LaPO4). J. Phys.-Condens. Matter 2016, 28, 205501. [Google Scholar] [CrossRef] [PubMed]
  42. Ahmadzadeh, M.A.; Chini, S.F.; Sadeghi, A. Size and shape tailored sol-gel synthesis and characterization of lanthanum phosphate LaPO4 nanoparticles. Mater. Des. 2019, 181, 108058. [Google Scholar] [CrossRef]
  43. Bezouhanova, C.; Al-Zihari, M.A. Alkylation of phenol with methanol over Mn3O4. Appl. Catal. A-Gen. 1992, 83, 45–49. [Google Scholar] [CrossRef]
  44. Berthou, H.; Jørgensen, C.K.; Bonnelle, C. Influence of the ligands on 3d photoelectron spectra of the first four lanthanides. Chem. Phys. Lett. 1976, 38, 199–206. [Google Scholar] [CrossRef]
  45. Wu, A.-P.; Bai, H.; Bao, J.-R.; Yang, K.-S.; Feng, L.-N.; Ma, Y.-Y.; Qiao, Y.; Li, W.-X.; Liu, Y.; Zhu, X.-W. Influence of citrate on phase transformation and photoluminescence properties in LaPO4 and LaPO4: Eu. RSC Adv. 2018, 8, 35813–35818. [Google Scholar] [CrossRef]
  46. Barman, S.; Pradhan, N.C.; Basu, J.K. Kinetics of alkylation of phenol with methanol over Ce-exchanged NaX zeolite. Catal. Lett. 2006, 111, 67–73. [Google Scholar] [CrossRef]
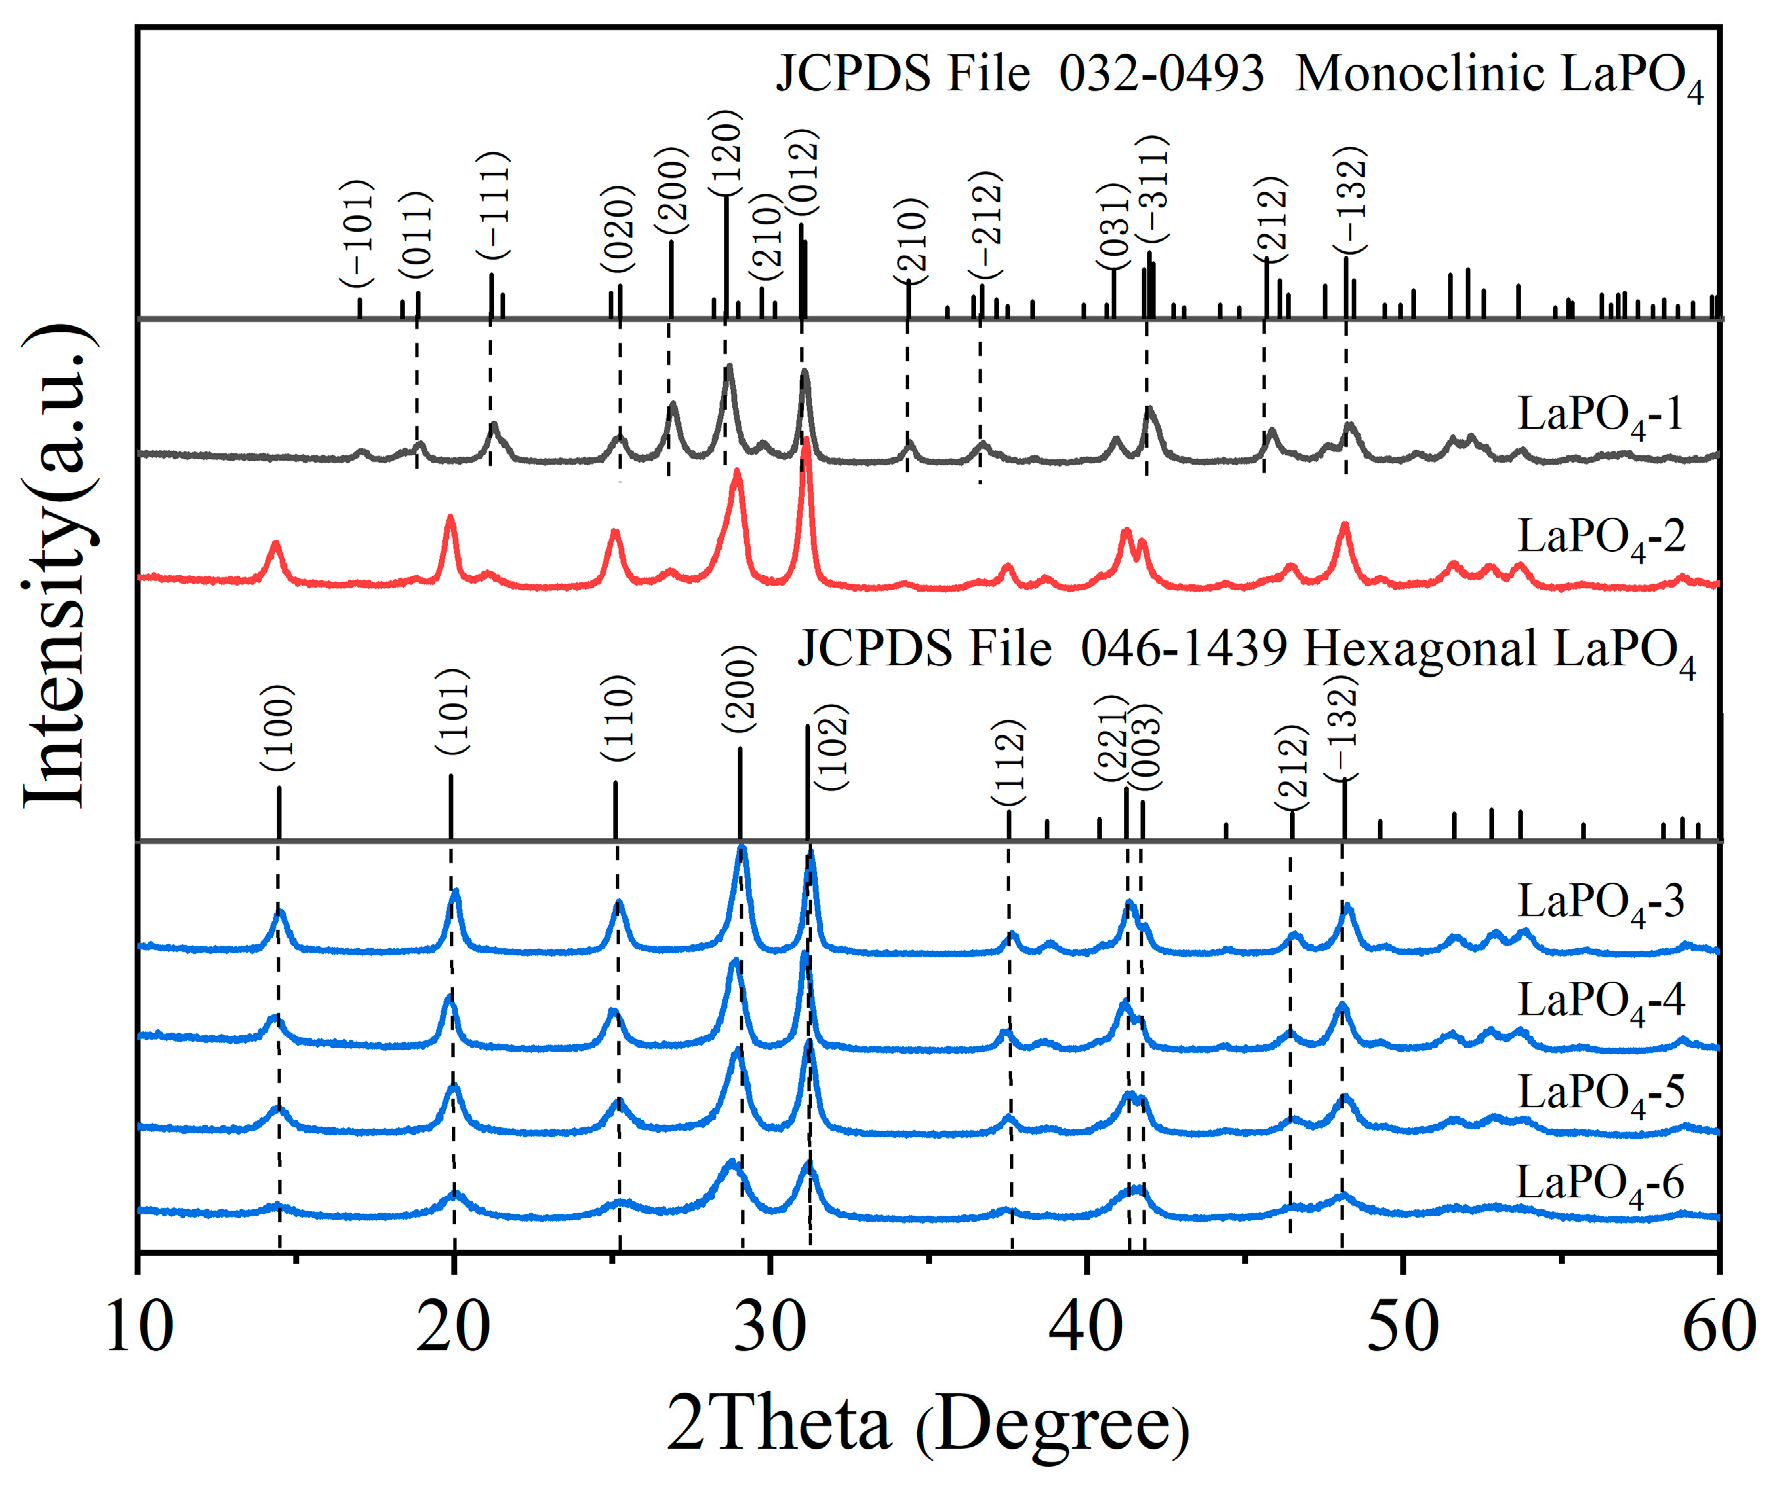
Figure 1. XRD patterns of different LaPO4 samples.
Coatings 15 01093 g001
Figure 2. FT-IR spectra of LaPO4 with different crystalline phases. (a) Full-range spectra. (b) Magnified view of the characteristic region.
Coatings 15 01093 g002
Figure 3. SEM images of LaPO4 with different crystalline phases. (af) LaPO4-1, LaPO4-2, LaPO4-3, LaPO4-4, LaPO4-5, LaPO4-6.
Coatings 15 01093 g003
Figure 4. (a) N2 adsorption–desorption isotherms. (b) BJH pore size distribution of LaPO4.
Coatings 15 01093 g004
Figure 5. NH3-TPD (a) and CO2-TPD (b) diagrams of LaPO4 material.
Coatings 15 01093 g005
Figure 6. Catalytic activity of LaPO4 material. (a) Conversion of phenol; (b) selectivity of anisole.
Coatings 15 01093 g006
Figure 7. Characterization of fresh and used catalysts. (a) XRD, (f) TG, (be) XPS spectra of LaPO4 catalyst. (b) The full survey of catalyst, (c) La 3d, (d) O 1s, (e) P 1s.
Coatings 15 01093 g007
Figure 8. TEM and HRTEM images of LaPO4 catalysts. (a,b) LaPO4-1, (c,d) LaPO4-3.
Coatings 15 01093 g008
Figure 9. Adsorption of phenol (a,b) and methanol (b,d) on LaPO4 surface. (a,c) Monoclinic phase, (b,d) hexagonal phase. The blue dashed line represents the formed hydrogen bond.
Coatings 15 01093 g009
Table 1. Hydrothermal synthesis conditions for the LaPO4 catalysts.
SamplesStirring
Temperature (°C)
Stirring Time (h)Crystallization Temperature (°C)Crystallization Time (h)
LaPO4-1500.516012
LaPO4-2500.514010
LaPO4-3500.512010
LaPO4-4500.510012
LaPO4-5901//
LaPO4-6501//
Table 2. Textural properties of different LaPO4 material. (SBET) Specific surface area, (Vt) total pore volume, (Da) average pore size.
SamplesLaPO4-1LaPO4-2LaPO4-3LaPO4-4LaPO4-5LaPO4-6
SBET (m2·g−1)46.053.755.661.477.989.3
Vt (cm3·g−1)0.0880.1000.1130.1210.1390.134
Da (nm)7.777.767.567.686.895.44
Table 3. Basicity and acid properties of different LaPO4 material.
SamplesLaPO4-1LaPO4-2LaPO4-3LaPO4-4LaPO4-5LaPO4-6
Total acid sites
(mmol g−1)
0.1540.2310.2990.3420.3850.494
Total base sites
(mmol g−1)
0.2420.9001.1441.1421.1041.019
Table 4. Calculation results of the binding energy and hydrogen bond length of reaction materials on different LaPO4 surfaces.
SamplesMethanolPhenol
Adsorption Energy (eV)H a Bond Length (Å)Adsorption Energy (eV)H b Bond Length (Å)
Monoclinic−0.6862.181−1.7041.865
Hexagonal−0.9422.086−1.2611.877
a The hydrogen bond formed by the hydroxyl group H of methanol, b the hydrogen bond formed by the hydroxyl group H of phenol.
Disclaimer/Publisher’s Note: The statements, opinions and data contained in all publications are solely those of the individual author(s) and contributor(s) and not of MDPI and/or the editor(s). MDPI and/or the editor(s) disclaim responsibility for any injury to people or property resulting from any ideas, methods, instructions or products referred to in the content.