Article

The Effect of Laser Cleaning on the Cr Coating on the Surface of Steel Tyre Moulds

1
Key Laboratory High Efficiency & Clean Mech Manufacture, School of Mechanical Engineering, Shandong University, Ministry of Education, 17923 Jingshi Rd., Jinan 250061, China
2
Laser Institute, Qilu University of Technology (Shandong Academy of Sciences), Jinan 250104, China
3
Shandong Qiangyuan Laser of SDIIT Ltd., Liaocheng 252000, China
4
Shandong Key Laboratory of Surface Engineering and Intelligent Equipment for Key Metal Components, University of Jinan, Jinan 250022, China
*
Authors to whom correspondence should be addressed.
Coatings 2025, 15(8), 978; https://doi.org/10.3390/coatings15080978
Submission received: 25 July 2025 / Revised: 11 August 2025 / Accepted: 20 August 2025 / Published: 21 August 2025
(This article belongs to the Section Laser Coatings)

Abstract

To investigate the effect of laser cleaning on the chromium plating of steel tyre moulds, a solid-state laser with an average power of 500 W was used as the cleaning light source. By varying the energy density and the number of pulses applied to the exact location, the changes in the macro- and micro-morphology of the mould surface, surface element content, and chromium plating thickness before and after laser cleaning were studied. The results show that as the laser energy density increases, the cleaning effect improves significantly. However, when the energy density exceeds 1.02 × 10 4 mJ/cm2, cracks appear in the chrome-plated layer. By changing the number of pulses applied to a specific location, it was found that cracks also appear in the chrome-plated layer when the number of pulses exceeds three. These results provide a reference for the practical application of laser cleaning in the cleaning of chrome-plated steel tyre moulds.

1. Introduction

Moulds are essential tools used in the vulcanisation process of tyre production. During use, tyre moulds are subject to combined deposits and contamination from rubber, additives, and release agents, inevitably leading to problems such as carbon build-up, adhesive residue, and difficulty in demoulding, which affect the production quality of tyres [1,2]. Moulds are essential tools used in the vulcanisation process of tyre production. During use, tyre moulds are subjected to combined deposits and contamination from rubber, additives, and release agents, inevitably leading to problems such as carbon build-up, adhesive residue, and difficulty in demoulding, which affect the production quality of tyres [3]. To increase the service life of moulds, a layer of Cr is plated on the surface of steel tyre moulds to prevent the base material from oxidising or corroding during high-temperature vulcanisation. In traditional tyre mould cleaning methods, prolonged manual grinding, shot blasting, and dry ice cleaning can damage the Cr plating layer [4,5,6].
Laser cleaning technology is a new green cleaning technology that has emerged in recent years. In terms of its mechanism for cleaning moulds, it utilises the significant difference in energy absorption between the mould base and surface deposits for a specific laser wavelength. Most of the laser energy radiated onto the surface is absorbed by the surface deposits, causing them to heat up, vaporise, or expand instantly, and then be carried away from the object surface by the steam flow formed on the surface, thereby achieving the cleaning objective [7,8,9]. The advantages of laser cleaning over traditional cleaning methods include the fact that the cleaning process causes minimal damage to the substrate, can remove contaminants of various thicknesses and compositions, is easy to automate and control remotely, and involves no secondary waste, resulting in low operating costs [10,11].
Currently, researchers worldwide have conducted extensive studies on laser cleaning of tyre moulds. Kong et al. analysed the cleaning parameters and mechanisms of CO2 lasers on the rubber layer of rubber vulcanisation moulds. The experimental results showed that the damage threshold was 5 × 10 3 mJ/cm2. When the laser energy density was 2.75 × 10 4 mJ/cm2, the cleaning rate reached 100%, and the H13 substrate surface remained undamaged. At this energy density, with a scanning speed of 350 mm/s, the laser cleaning parameters for the vulcanisation moulds were repeated, and the moulds were thoroughly cleaned without damage [12]. Ye et al. conducted experiments on tyre mould cleaning using both single-pulse and multi-pulse modes, comparing the energy threshold characteristics under different pulse conditions. The results showed that in the single-pulse mode, the initial cleaning threshold for tyre moulds was 50.9 mJ, while the threshold required for complete cleaning was 180.9 mJ; in the multi-pulse mode, the initial cleaning threshold decreased to 48 mJ, and the threshold for complete cleaning decreased to 118.7 mJ, with this threshold remaining stable as the number of pulses varied [13]. The Jia team developed a single-scan cleaning process utilising positive-defocused lasers for the efficient removal of uneven rubber residue from the surface of grooved, chrome-plated moulds. This method uses laser parameters with a single-pulse energy density of 970 mJ/cm2. It is supplemented by argon gas assistance to achieve simultaneous cleaning of both the flat surface and grooved areas of the mould. Experimental results indicate that under conditions that do not cause thermal damage to the substrate, this process not only completely removes surface contaminants but also eliminates residual impurities within the chromium layer’s network cracks [14]. Cai et al. derived a model for the spatiotemporal distribution of laser energy, analysed the impact of this distribution on cleaning quality, and conducted experimental verification. The results showed that when the laser energy density was 1.5 × 10 4 mJ/cm2 and the overlap rates of the beam in the x and y directions were 52% and 61%, respectively, the oxide layer could be efficiently removed, completely exposing the metal substrate [15]. Jiang et al. used standard samples to study cracking behaviour under tensile stress. When the tensile or expansion strain along the thickness of the coating reached approximately 0.00409, the first through-crack formed inside the coating and began to propagate [16].
This study investigates the cleaning mechanism of sulphur-containing contaminants on the surface of chrome-plated steel tyre moulds under conditions of energy density ranging from 8.5 to 15.3 J/cm2 and one to six pulses. The cleaning process relies on thermomechanical coupling effects, where contaminants expand, vaporise, and peel off under the thermal action of the laser. The study focused on steel tyre moulds with chromium-plated surfaces. By comparing the macro- and microstructural changes, surface element composition, and chromium layer thickness before and after laser cleaning, the mechanism of laser-assisted cleaning of sulphur compounds on steel tyre mould surfaces was investigated. A cleaning model was established using COMSOL Multiphysics 6.2 to analyse the effects of different energy densities and pulse repetition rates on the stress field and ablation depth. The results of this study provide a theoretical and experimental foundation for the application of laser cleaning in the field of tyre mould cleaning.

2. Experimental Procedure

2.1. Experimental Materials

The experimental materials used were Q235 steel moulds (GB/T 700) [17], with their surface chemical compositions as shown in Table 1. During use, the moulds come into prolonged contact with rubber materials and vulcanisation release agents, leading to the gradual formation of deposits primarily composed of carbides and oxides on their surfaces. A CNC wire cutting machine (DK7735, Raygo Inc., Suzhou, China) was used to cut the moulds into 10 mm × 10 mm × 10 mm sample blocks for cleaning experiments. The microstructure of the moulds was analysed using a scanning electron microscope (JSM-7610F, JEOL Inc., Tokyo, Japan), and the surface elemental composition is shown in Figure 1. Cracks and wear were observed on the surface of the unwashed samples, which were covered with deposits. After embedding the original samples, the cross-sections were ground and polished. Using a metallographic microscope (AE2000 MET, Motic Inc., Barcelona, Spain), it was observed that the substrate surface was coated with a layer of Cr, approximately 5–8 μm thick.

2.2. Test Methods

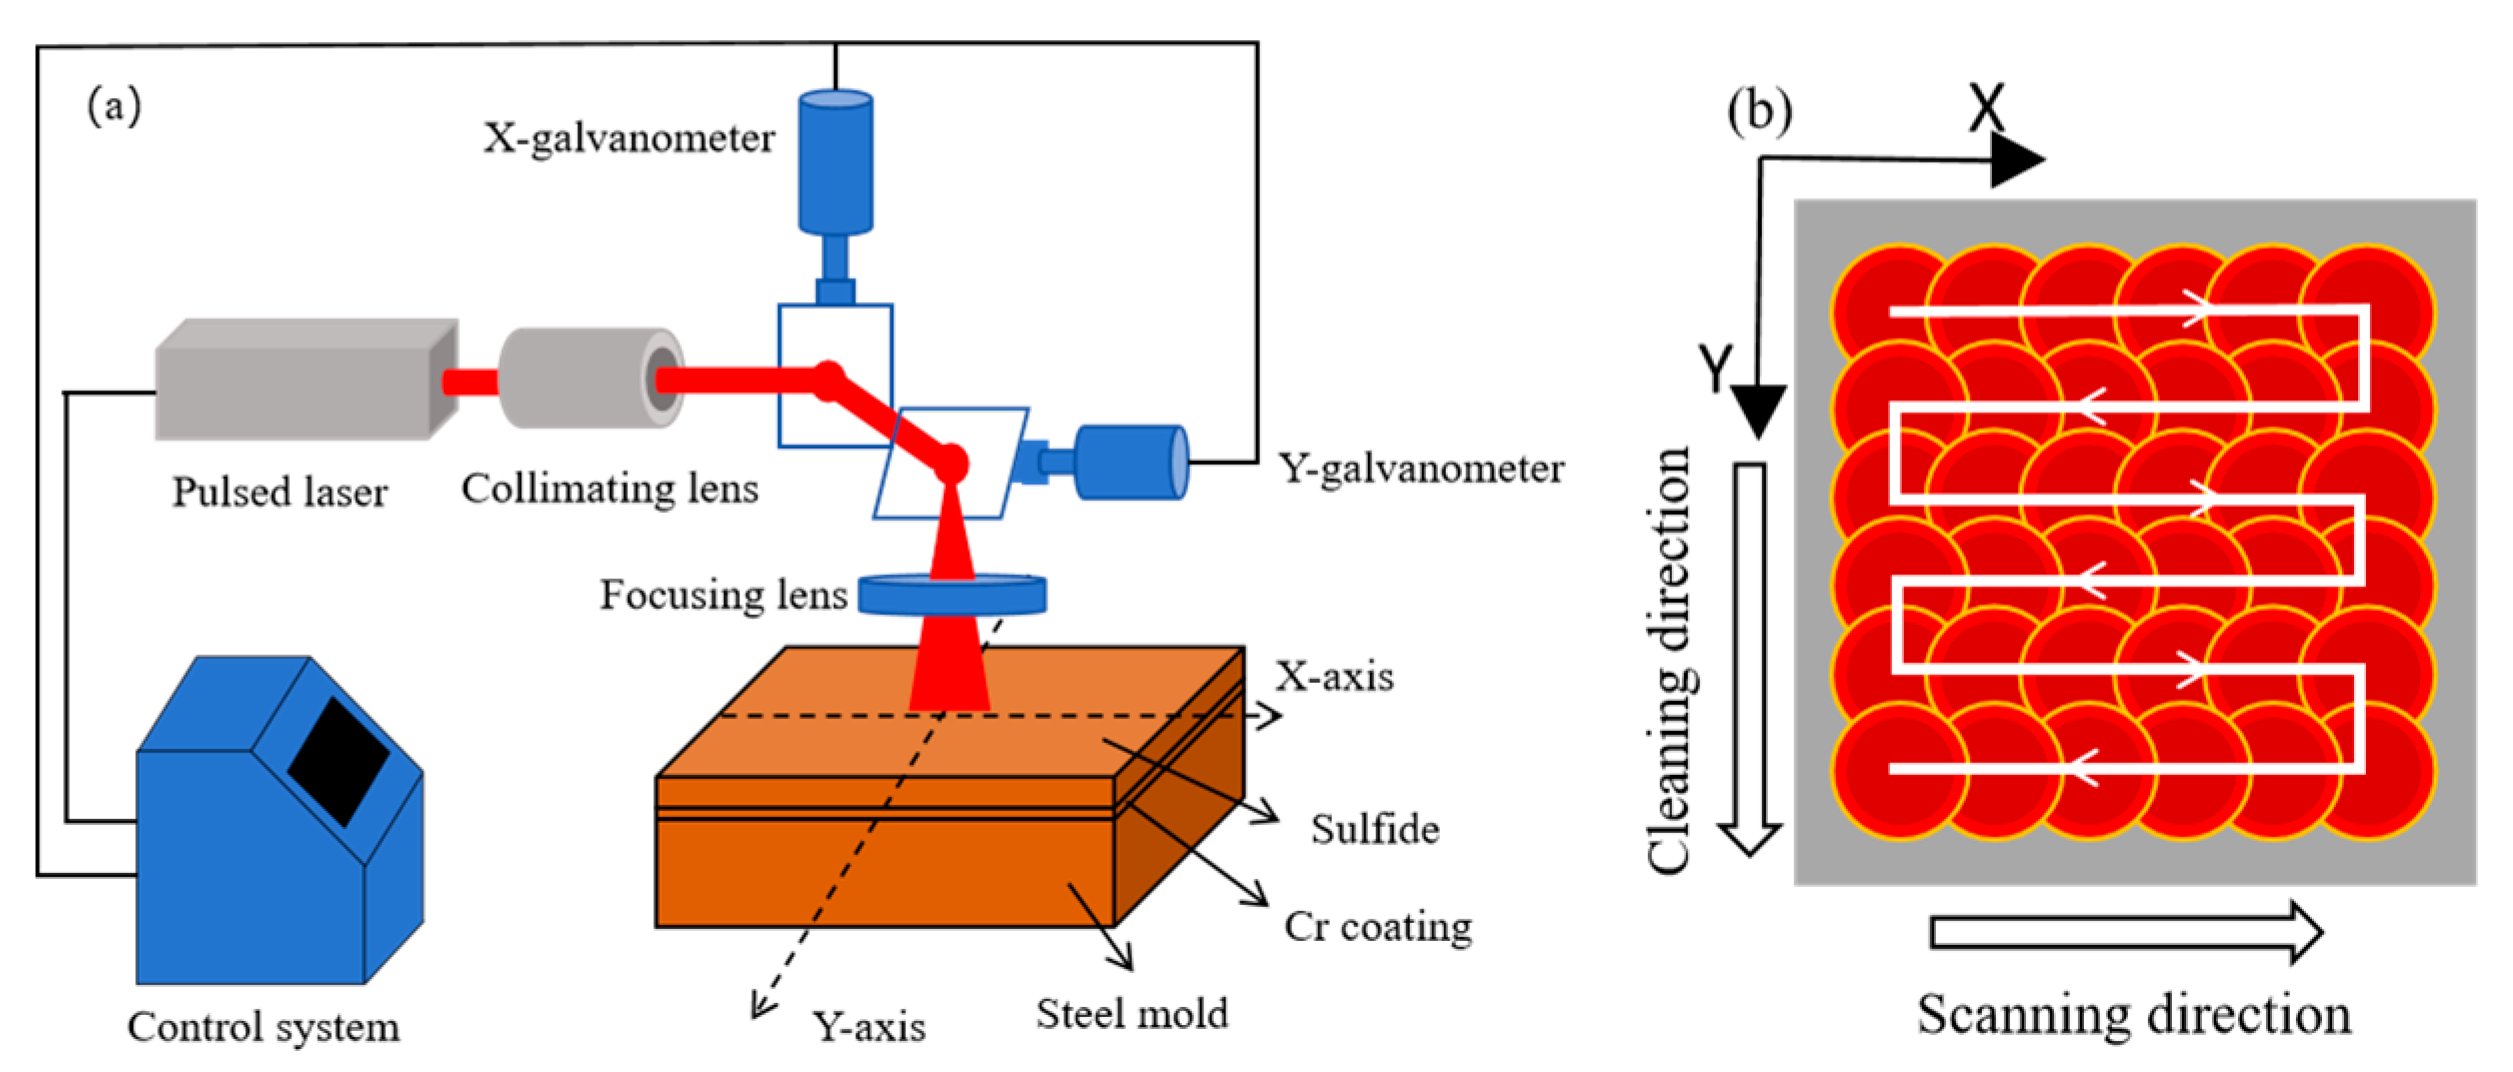
The experiment employed a diode-pumped pulsed solid-state laser as the light source, with an output wavelength of 1064 nm, an average power of 500 W, a maximum peak power of 800 kW, a minimum pulse width of 90 ns, and a maximum pulse frequency of 10 kHz. The laser beam is transmitted via fibre optic coupling, collimated, and rapidly output through a high-frequency galvanometer. After focusing through a field lens, it forms a line spot with an adjustable scanning width of 1–10 cm. A robotic arm moves the cleaning head to ensure uniform cleaning, thereby completing the laser cleaning process. The energy fibre core diameter of the laser cleaning output system is 400 μm, with a numerical aperture of 0.22. A focusing field lens with a focal length of 160 mm is used. After calculation, the spot diameter is 0.9 mm, and the energy density is 8.5 × 10 3 mJ/cm2. During the cleaning process, 99.9% argon gas is used as a protective gas to prevent secondary oxidation, with a gas flow rate of 15 L/min (see Figure 2 and Table 2).
Table 2 lists the main laser parameters of the flat-top pulsed laser (MFPT-500CLS, MAX Inc., Liaocheng, China) used in the experiment.
Cleaning effectiveness and efficiency are two important factors in evaluating the practicality of laser cleaning. To achieve optimal efficiency while ensuring thorough cleaning, two sets of experiments were designed: one involving changes in energy density under a single pulse, and the other involving changes in the number of pulses at the same energy density. These experiments were conducted to verify the effect of the laser cleaning process on the Cr coating on the surface of steel tyre moulds. The laser process parameters are shown in Table 3.
The optimal energy density for complete cleaning is achieved at maximum efficiency.
Energy density E is related to laser power P, laser frequency f1, and spot area S. The calculation is as follows [18]:
E = P f 1 × S
The number of cleaning cycles n is related to the cleaning speed V, spot overlap rate a, laser frequency f1, galvanometer frequency f2, scan line width L, and spot diameter D. The spot overlap rate a is related to the galvanometer frequency f2, scan line width L, laser frequency f1, and spot diameter D. The following formula can be derived:
a = D × f 1 2 × L × f 2 D × f 1 2 × D × f 2
n = 2 × D × f 2 V
When the cleaning efficiency is at its highest, a = 0, and D V 1 2 × f 2 , the calculated value of n is 1.
The optimal scanning speed for cleaning is V = D 2 × f 1 L , and cleaning efficiency is proportional to the laser frequency.
The fastest scanning speed is at the optimal energy density.
When the condition for the highest cleaning efficiency is met, with the light spot overlap rate a = 0, E, P, and f1 can be determined.
From Formulas (1)–(3), we can deduce that n = D 2 × f 1 L × V , i.e., V = D 2 × f 1 L × n , the number of scans is inversely proportional to the scanning speed.
The scanning speed can be determined by setting the number of scans.
After setting the energy densities to 8.5 × 10 3 mJ/cm2, 10.2 × 10 3 mJ/cm2, 11.9 × 10 3 mJ/cm2, 13.6 × 10 3 mJ/cm2, and 10.2 × 10 3 mJ/cm2, the cleaned samples were analysed using SEM and EDS (JSM-7610F, JEOL, Tokyo, Japan) to study the cleaning effect.

2.3. Numerical Simulation

Using COMSOL Multiphysics 6.2 software, a layered model of steel substrate, chromium coating, and rubber layer was established to form a composite structure. A pulsed laser was applied to the multi-layer structure, with the upper layer being the rubber layer, whose thermal, physical, and mechanical properties differ significantly from those of the metal. The intermediate Cr layer has high strength but poor thermal conductivity. The differences between these materials result in significant stress and relative deformation between the layers, leading to thermal expansion deformation of the layered structure. To accurately simulate changes in the temperature field and stress field, we selected ‘User-Controlled Mesh’ in the mesh module. We combined it with swept meshing to more precisely describe the physical properties of the contamination layer and chromium plating layer, as shown in Figure 3. The number of elements is 11,598, with 3434 mesh vertices, a maximum element size of 80 μm, a minimum element mass of 0.1498, and an average element mass of 0.6052. The thermal parameters of the rubber layer are shown in Table 4. Since laser cleaning involves complex physical processes such as light, heat, and force, the finite element model must be simplified as follows:
(1)
Ideal heat conduction is achieved at the interface between the substrate and the material being cleaned;
(2)
Before laser cleaning begins, the initial temperature of the model and the ambient temperature are both 293.15 K;
(3)
The material is isotropic, with physical properties that are the same in all directions.
The heat conduction process during laser cleaning follows the heat conduction equation based on Fourier’s law and the conservation of energy. The transient three-dimensional heat conduction control equation in the rectangular coordinate system is [19]
K ( 2 T x 2 + 2 T y 2 + 2 T z 2 ) = ρ c T ( x , y , z , t ) t
In the formula, K is the thermal conductivity coefficient of the material; T is the instantaneous temperature of the material; t is the heat conduction time; ρ and c are the density and specific heat capacity of the material, respectively.
The following boundary conditions and initial conditions are used in numerical simulation calculations.
The model exchanges heat with the external environment, and its boundary conditions are as follows [20,21,22]:
κ T n Γ = h ( T 0 T )
For each interface of the model, apply convective heat transfer boundary conditions:
κ T n Γ = σ ε ( T 0 4 T 4 )
The bottom is thermally insulated, with the following boundary conditions:
κ T n Γ = 0
Under the irradiation of laser energy, the thermal radiation conditions at all boundaries of the model are as follows:
κ T n Γ = Q h ( T 0 T ) σ ε ( T 0 4 T 4 )
In the above formulas: T is the instantaneous temperature of the material; t is the heat conduction time; ρ is the density of the material; c is the specific heat capacity of the material; κ is the heat conduction coefficient; h is the convective heat transfer coefficient; ε is the surface radiation coefficient; σ is the Boltzmann coefficient.
When pulsed laser irradiation is applied to the surface of a steel tyre mould, the mould absorbs heat, thereby generating a temperature gradient and thermal expansion. Due to the temperature gradient, thermal expansion is uneven, resulting in the generation of thermal stress. The thermal strain equation is [23,24,25]
ρ R 2 u R ( x , y , z , t ) t 2 = E R 2 u R ( x , y , z , t ) z 2 E R 2 δ z 2 lim δ x 0
In the formula, u R ( x , y , z , t ) is the displacement distribution function; ρ R is the density of the rubber layer; E R is the elastic modulus of the rubber layer; and δ is the thermal strain.
Similarly, we can derive the thermoelastic vibration equation for the interface layer:
ρ C 2 u C ( x , y , z , t ) t 2 = E C 2 u C ( x , y , z , t ) z 2 E C 2 δ z 2
In the formula, u C ( x , y , z , t ) is the displacement distribution function; ρ C is the density of the chromium plating layer; and E C is the elastic modulus of the chromium plating layer.
According to the thermal elastic expansion formula,
δ = γ ( T T 0 )
In the equation, γ is the thermal expansion coefficient of the rubber layer, and T 0 is the initial temperature. Solving the two equations together, we get
ρ 2 u ( x , y , z , t ) t 2 = E R 2 u ( x , y , z , t ) z 2 E R γ 2 T ( x , y , z , t ) z 2
The formula for thermal stress is
τ = E γ Δ T ( x , y , z , t )
Laser cleaning utilises the light energy absorption effect triggered by the interaction between the laser and the material to overcome the adhesive force between contaminants and the substrate, thereby removing contaminants. Given that pollutants adhere to the substrate surface through various forms of adhesive force, if we assume that the chrome plating layer and sulphide are parallel planes with a particular area, the van der Waals force between them can be expressed as follows [26]:
f = H 12 8 π 2 Z 3
Z is the distance between the chrome layer and the sulphide layer, typically 4 × 10⁻¹⁰ m. Parameter H is the Chevalier–Schitz–Van der Waals constant, which describes the properties of materials in contact with each other and depends on the surface properties of the materials:
H 12 = 4 3 π A 12
A 12 = A 11 A 22 is the Hamek coefficient between the sulphide and the chrome plating layer, which can be obtained through calculation. The Hamek coefficient between rubber vulcanisates is A 11 = 9.3 × 10 20   J ; the Hamek coefficient between the chromium-plated layers in contact with each other is A 22 = 3.39 × 10 19   J ; calculate A 12 = 1.78 × 10 19   J [27].
Substituting into Equation (14), the adsorption force between the rubber vulcanisate and the chrome-plated layer can be calculated to be approximately 1.47 × 10 8   N / m 2 .
When the cleaning conditions are τ 1 = τ R τ C > f , the surface contamination layer will peel off. The temperature field boundary conditions are shown in Figure 4.
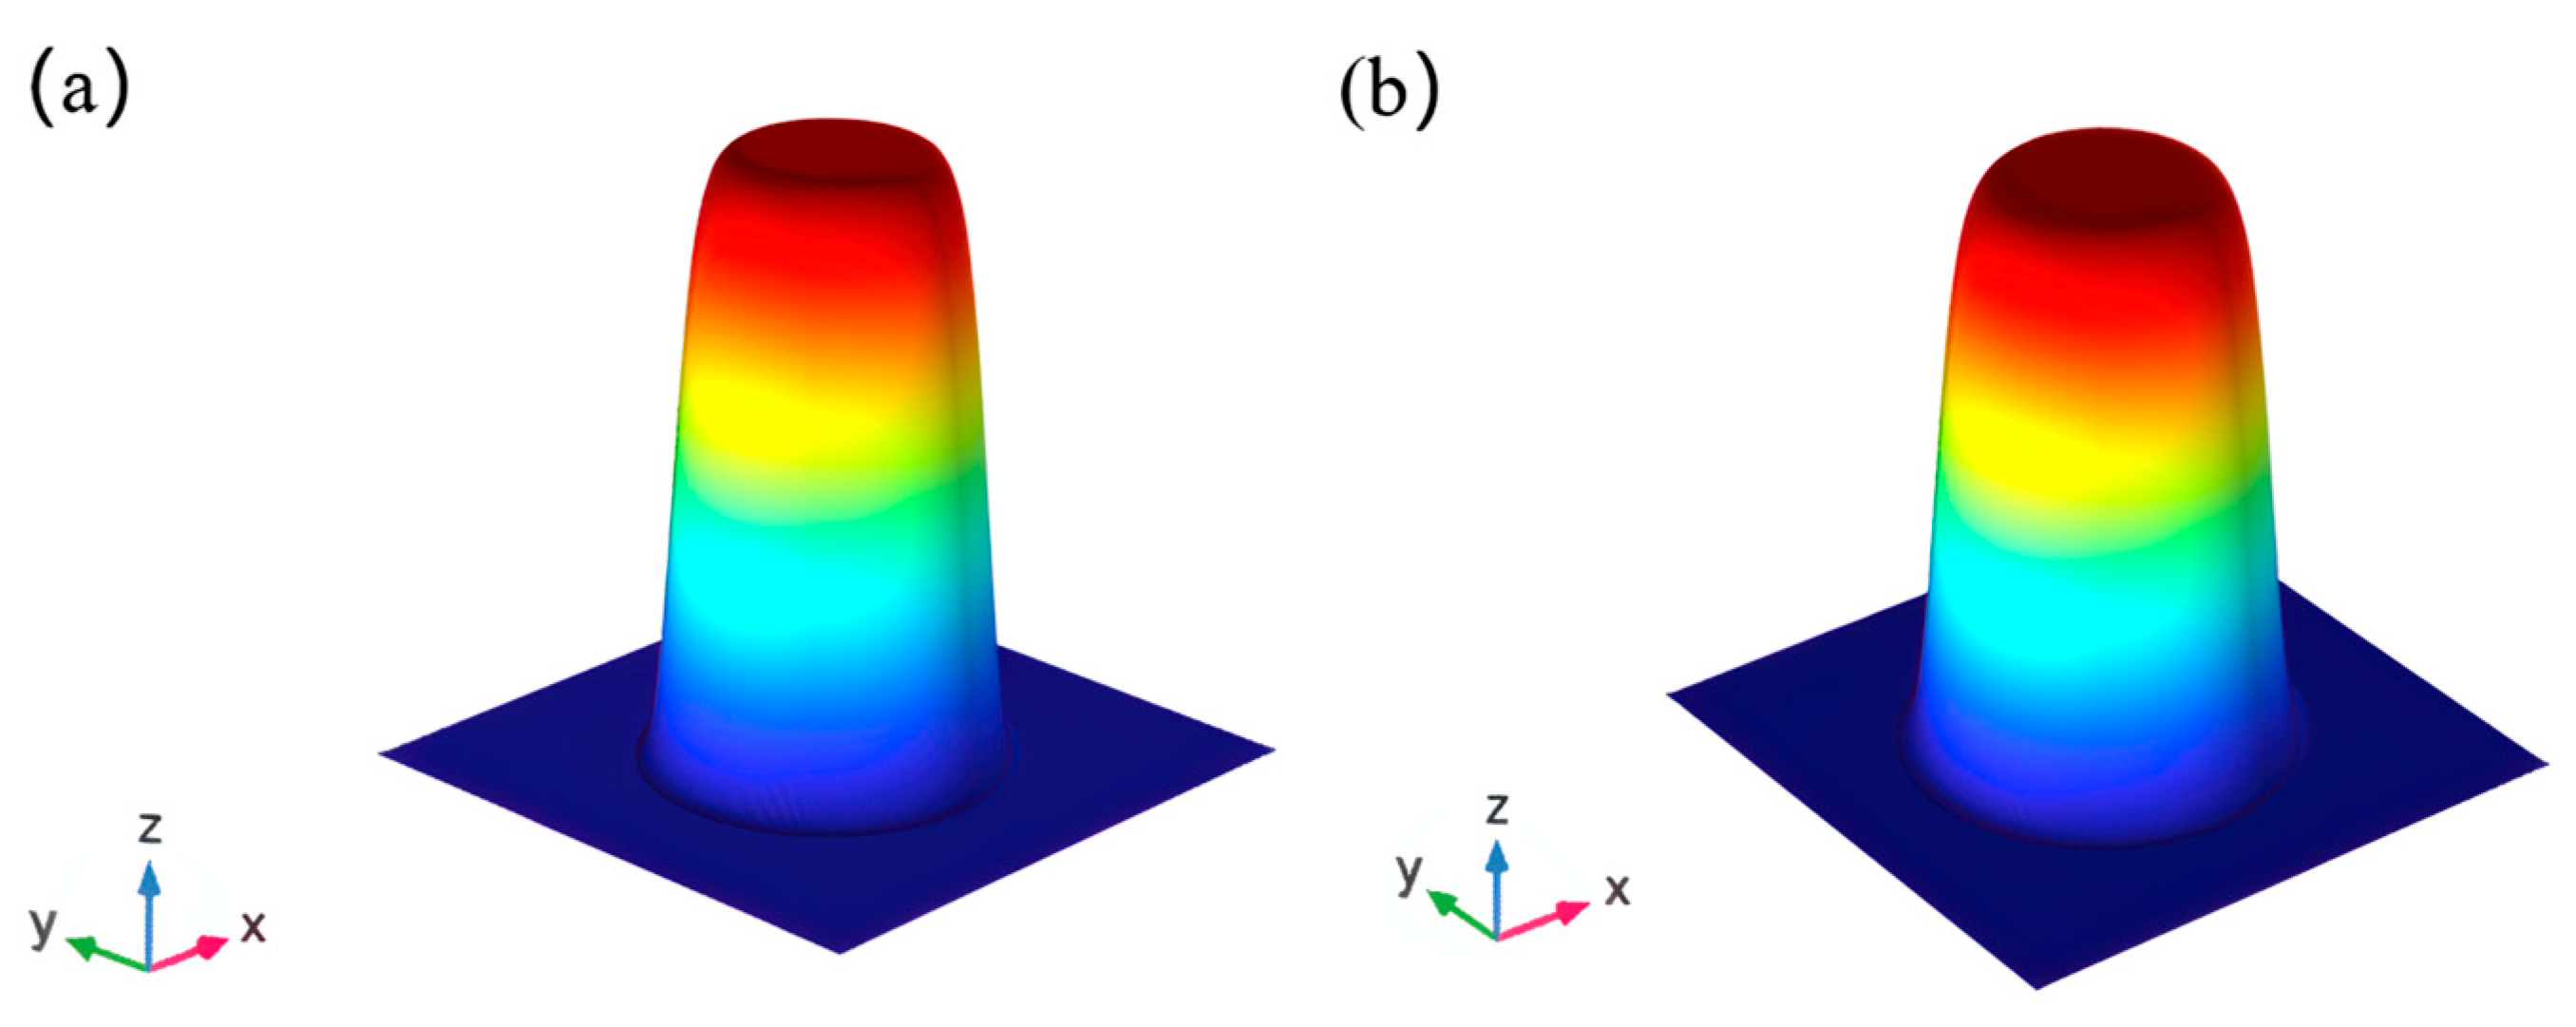
The energy distribution pattern of the nanosecond pulse laser is a flat-top distribution. Figure 5 shows its energy distribution in space. The laser energy distribution expressions are shown in Equations (16) and (17) [28]:
P 1 = A [ E d P w ] exp ( 2 × x 2 + y 2 10 r 10 ) φ ( t )
Based on R. Fabbro et al.’s assumption that the laser energy is uniformly distributed in space, the plasma is an ideal gas, and the shock wave propagates only along the axial direction, an estimation formula for the peak pressure of the laser shock wave was established as follows [29]:
P max = 0.1 α 2 α + 3 1 2 Z 1 2 g / c m 2 s × P g 1 2 G W / c m 2
Therefore, the spatial distribution intensity function of the shock wave applied by this model is as follows:
P 2 = P max exp 2 × x 2 + y 2 10 r 10 ϕ t
In the formula, r is the laser spot radius, A is the laser absorption rate of the rubber layer, E d is the laser energy density, P w is the laser pulse width, x is the coordinate of any point on the mould surface, and φ ( t ) represents the pulse function.
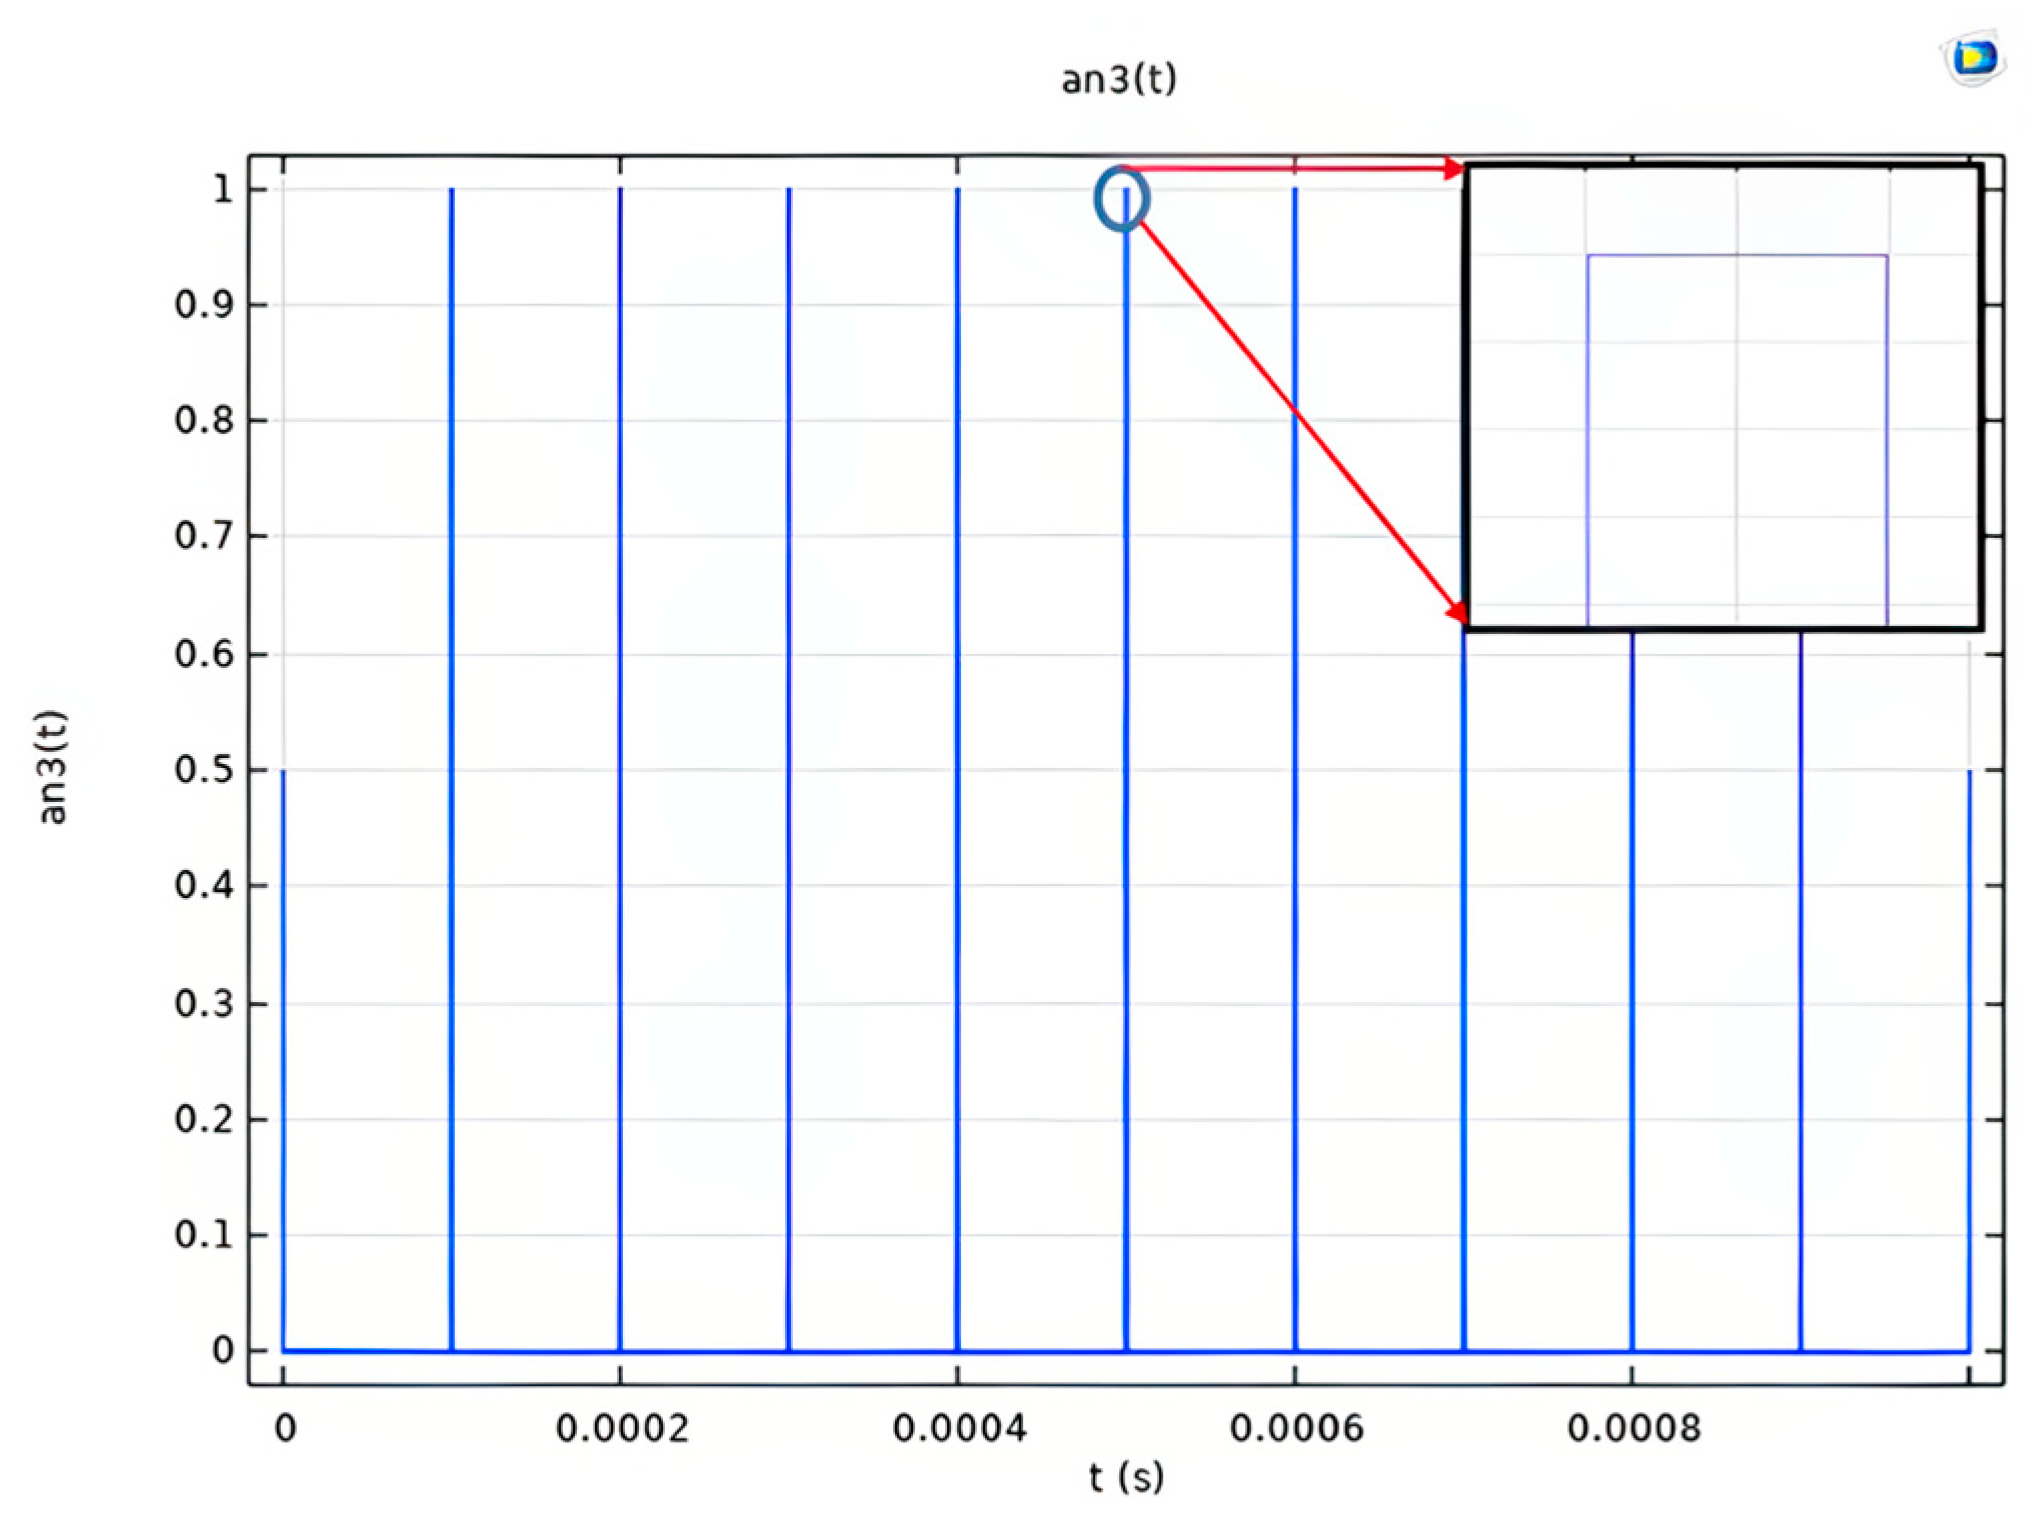
The temporal distribution of nanosecond pulse lasers is set with a pulse width of 100 ns and a pulse frequency of 10 kHz. Due to the ratio of the pulse width to the period time, i.e., the duty cycle being less than 1%, the solver will only calculate the first pulse, and subsequent pulses will be ignored. The solution is to use a tiny step size for calculation, but this increases the number of computational events. Therefore, this model uses the ‘Event’ interface in COMSOL to apply the pulse function, as shown in Figure 6.

3. Experimental Results and Analysis

3.1. Simulation Results

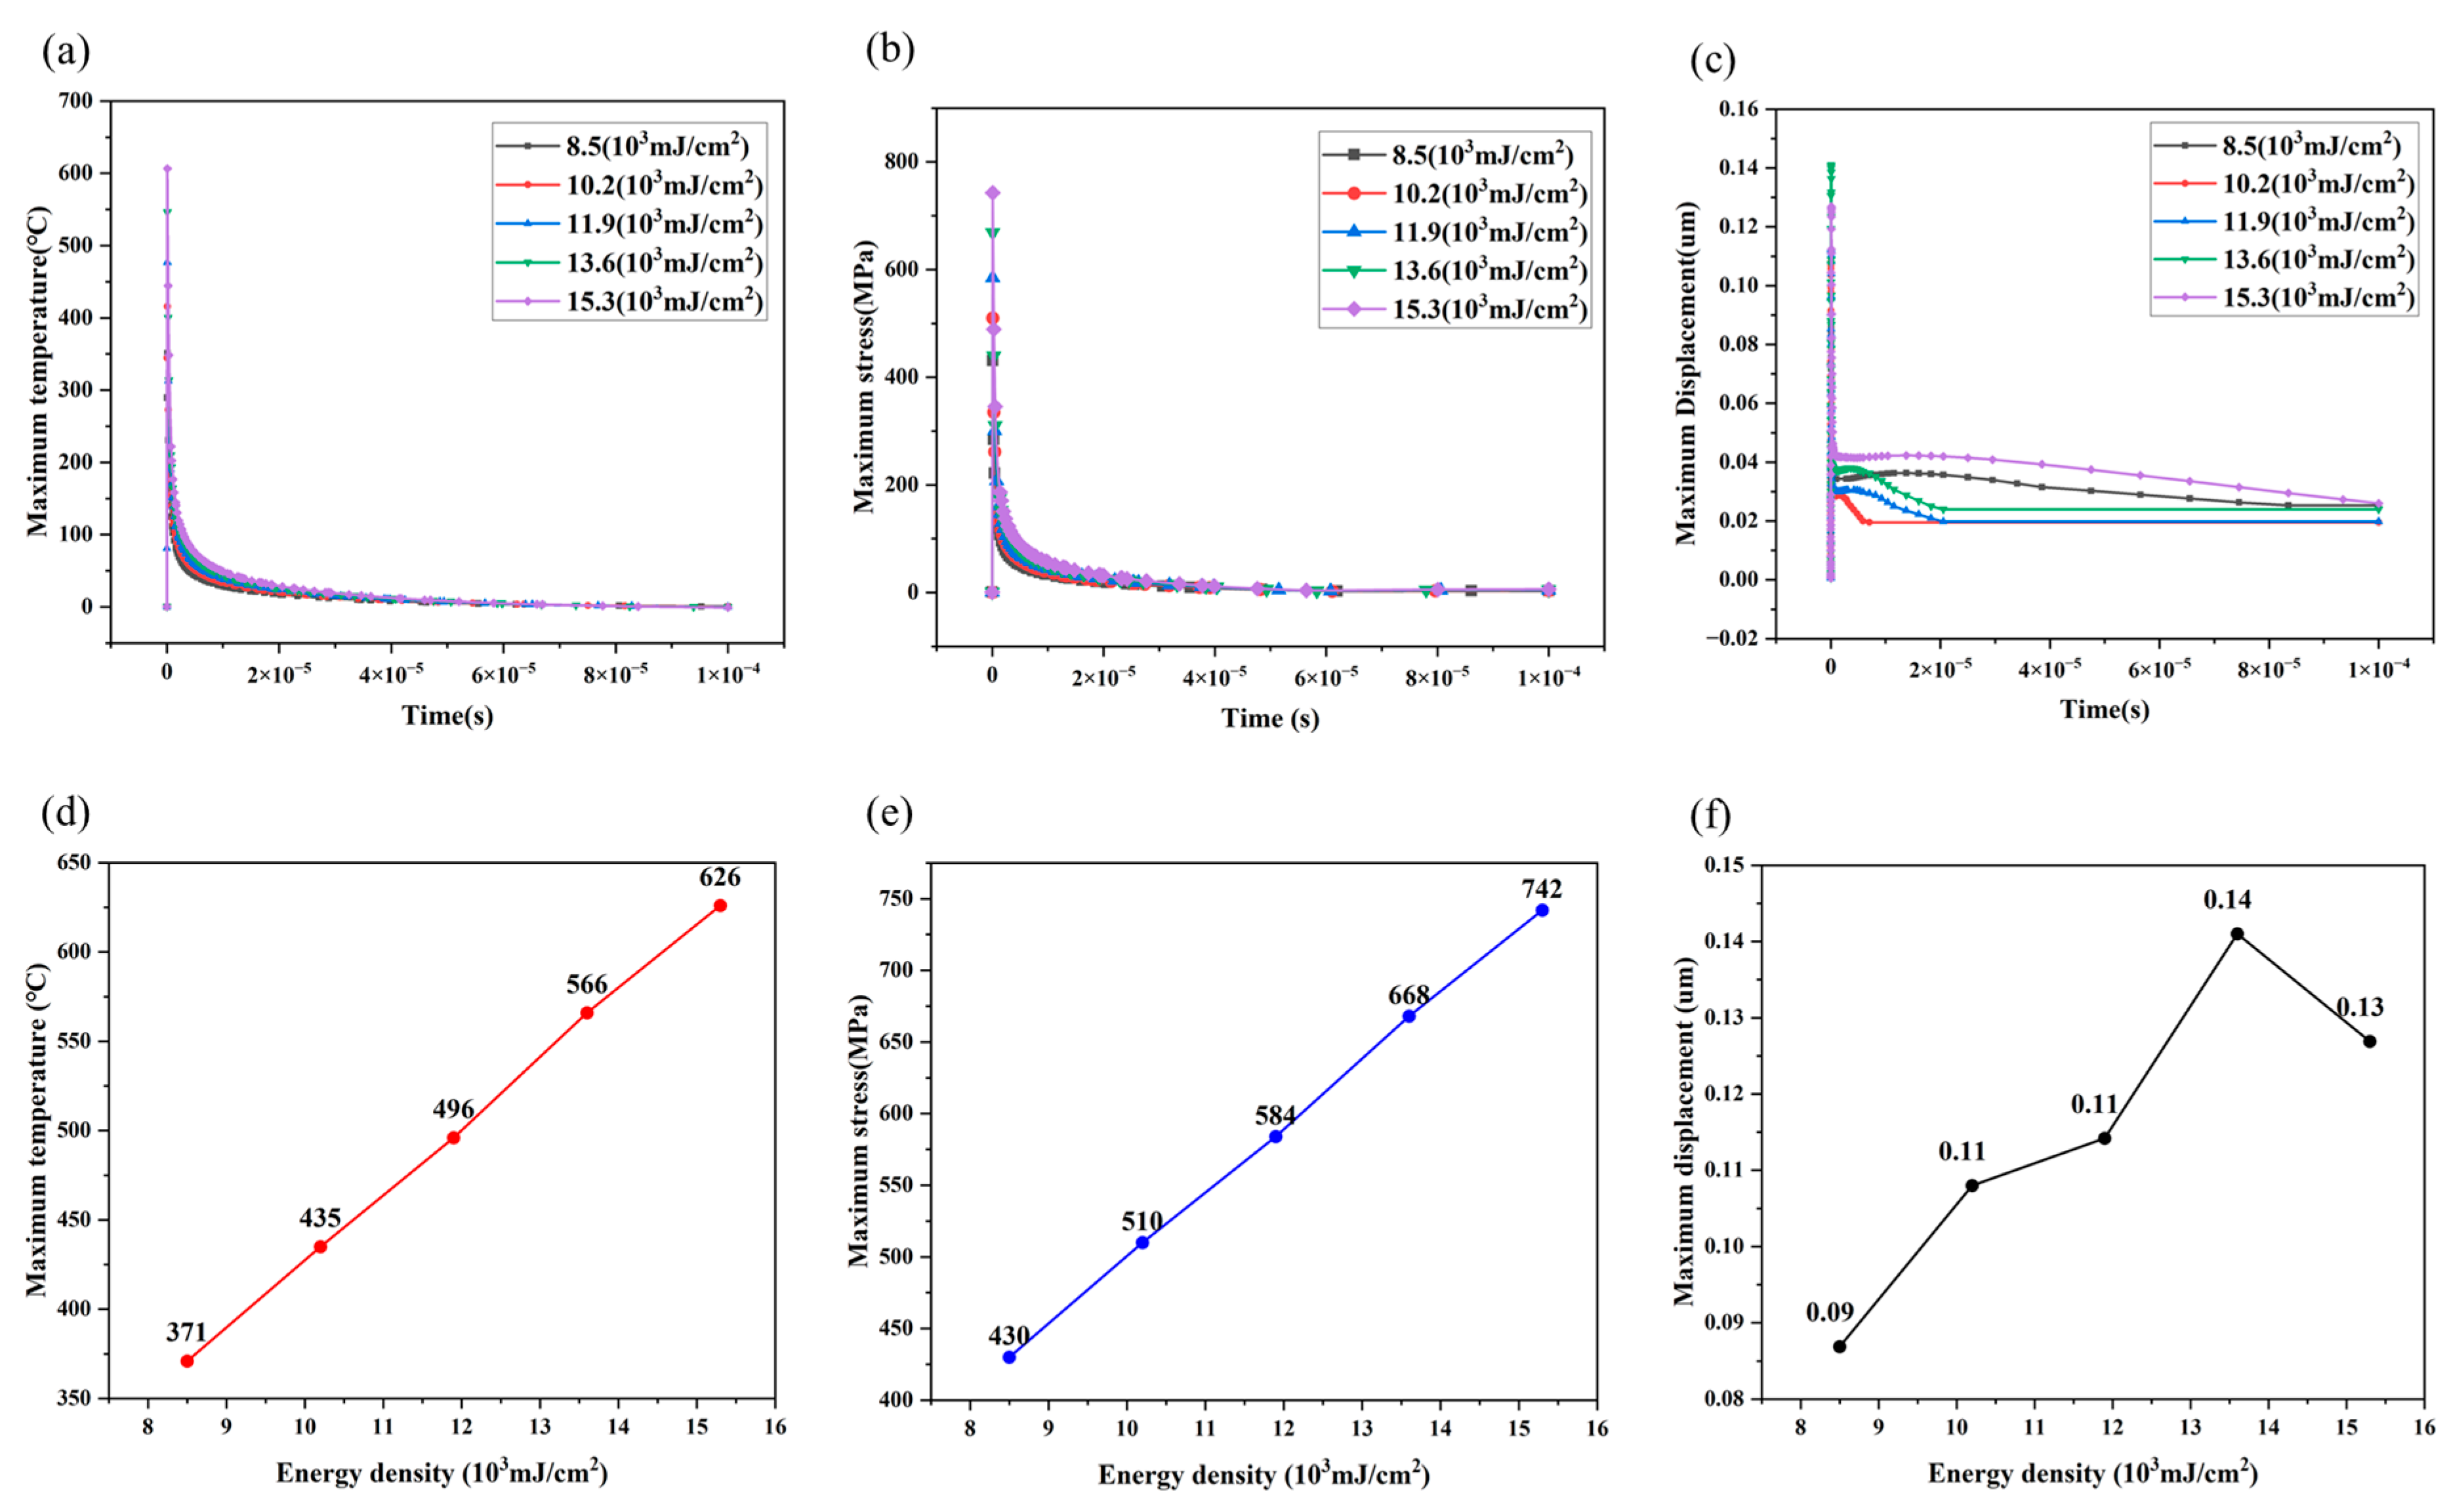
As shown in Figure 7a–f, as the single-pulse laser energy density increases from approximately 8.5 × 10 3 mJ/cm2 to 1.53 × 10 4 mJ/cm2, the amount of photothermal energy absorbed by the material surface significantly increases. Heat transfer causes the maximum temperature of the chromium coating to rise linearly from 430 °C to 742 °C. The internal stress generated by thermal expansion overlaps with the instantaneous pressure wave induced by the laser pulse, resulting in a maximum stress in the chromium coating that increases from 430 MPa to 742 MPa. The synergistic effect of the two stresses not only exacerbates the material’s transient deformation but also causes the chromium coating to undergo expansion displacement, with its peak increasing from 0.0869 µm to 0.141 µm as the energy density increases. When the laser energy density exceeds approximately 1.19 × 10 4 mJ/cm2, the increase in displacement begins to flatten out, and a sudden increase occurs at approximately 1.36 × 10 4 mJ/cm2, followed by a slight decrease at 1.53 × 10 4 mJ/cm2. This phenomenon is closely related to the complex and brittle properties of the Cr layer material. Under high stress, the Cr layer forms microcracks, which continue to expand with subsequent pulse exposure. These cracks consume a significant amount of laser input energy during expansion. They are accompanied by stress relief, thereby reducing the actual impact of cleaning and removing the contaminated layer. When the energy density is within the range of approximately 1.02 × 10 4 1.19 × 10 4 mJ/cm2, optimal cleaning performance can be achieved while avoiding the negative impact of excessive cracking on cleaning quality.
Using the optimal energy density of 1.02 × 10 4 mJ/cm2, six pulse laser cleaning treatments were performed on a single region. As shown in Figure 8a–e, a significant shift in the surface temperature baseline is observed, with thermal energy accumulating continuously. However, the corresponding thermal stress peak values exhibit a decreasing trend with each successive treatment. This is primarily due to the coupled effects of two factors: on one hand, as the baseline temperature continues to rise, the instantaneous temperature gradient caused by a single pulse decreases, leading to a gradual weakening of thermal stress; on the other hand, the shock pressure generated by the pulsed laser and the thermal stress are not aligned in the vertical direction, causing them to cancel each other out, thereby weakening the cumulative effect of instantaneous shock vibrations. Factors such as material softening, interface relaxation, and geometric changes in the interface at high temperatures collectively promote the ablation mechanism, significantly enhancing ablation efficiency. In summary, during multiple pulse heating processes, although the temperature continued to increase, the stress peak in a single area decreased, while the ablation effect was significantly improved. The stress distribution differs significantly across the three layers. The Cr layer is in the middle and bears the most significant stress. Due to the brittle and complex characteristics of Cr material, when Cr bears an instantaneous extreme load in a small area, cracks will form in the chrome-plated layer.
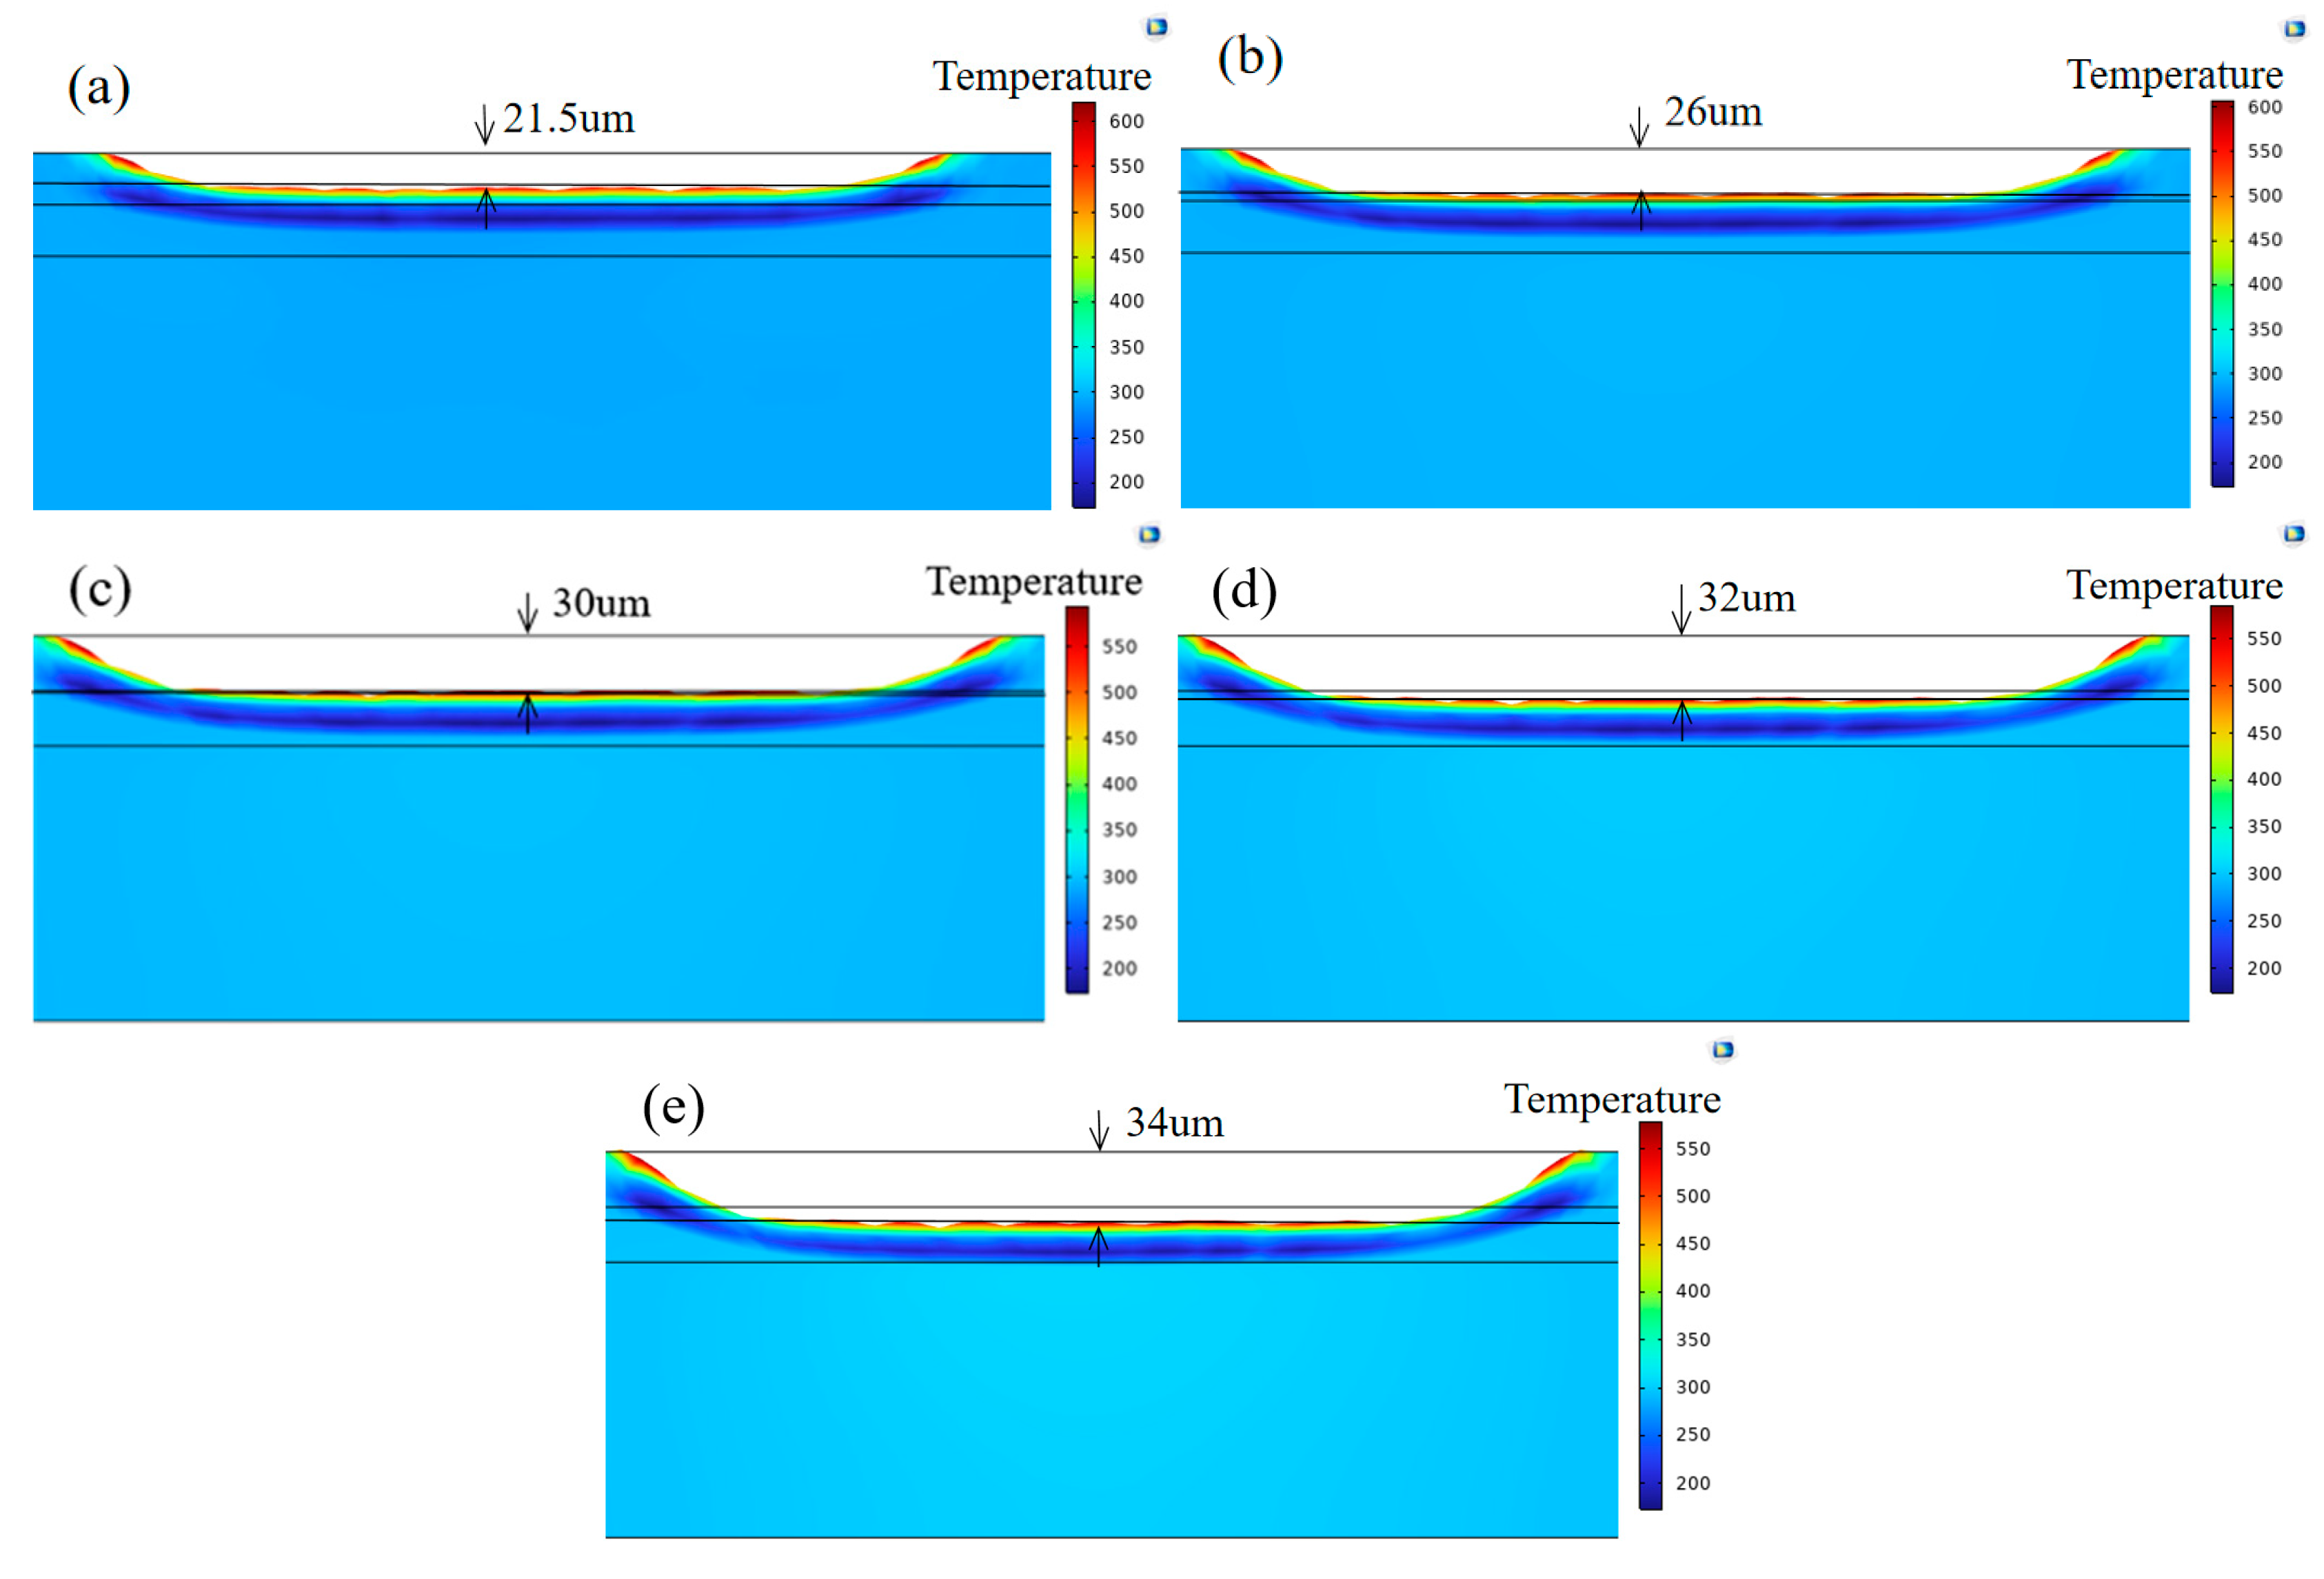
As shown in Figure 9a–e, the ablation depth produced by a flat-top pulsed laser on the material surface increases gradually with increasing energy density. Due to the uniform energy distribution of the flat-top spot, the bottom surface of the crater remains well-smoothed. At the same time, the heat-affected zone is larger, resulting in greater heat absorption by the material. As the laser energy density increases from low to high, the temperature field of the sulphide layer is increasingly influenced by the laser, with energy continuously accumulating in the longitudinal ablation depth direction: when the energy density reaches 1.02 × 10 4 mJ/cm2, the simulation results show that the sulphide layer is effectively removed; When the energy density is increased to 1.19 × 10 4 mJ/cm2, the ablation depth increases to approximately 30 μm, and the chromium coating begins to show damage. When the energy density is increased to 1.53 × 10 4 mJ/cm2, the chromium coating exhibits significant ablation damage.
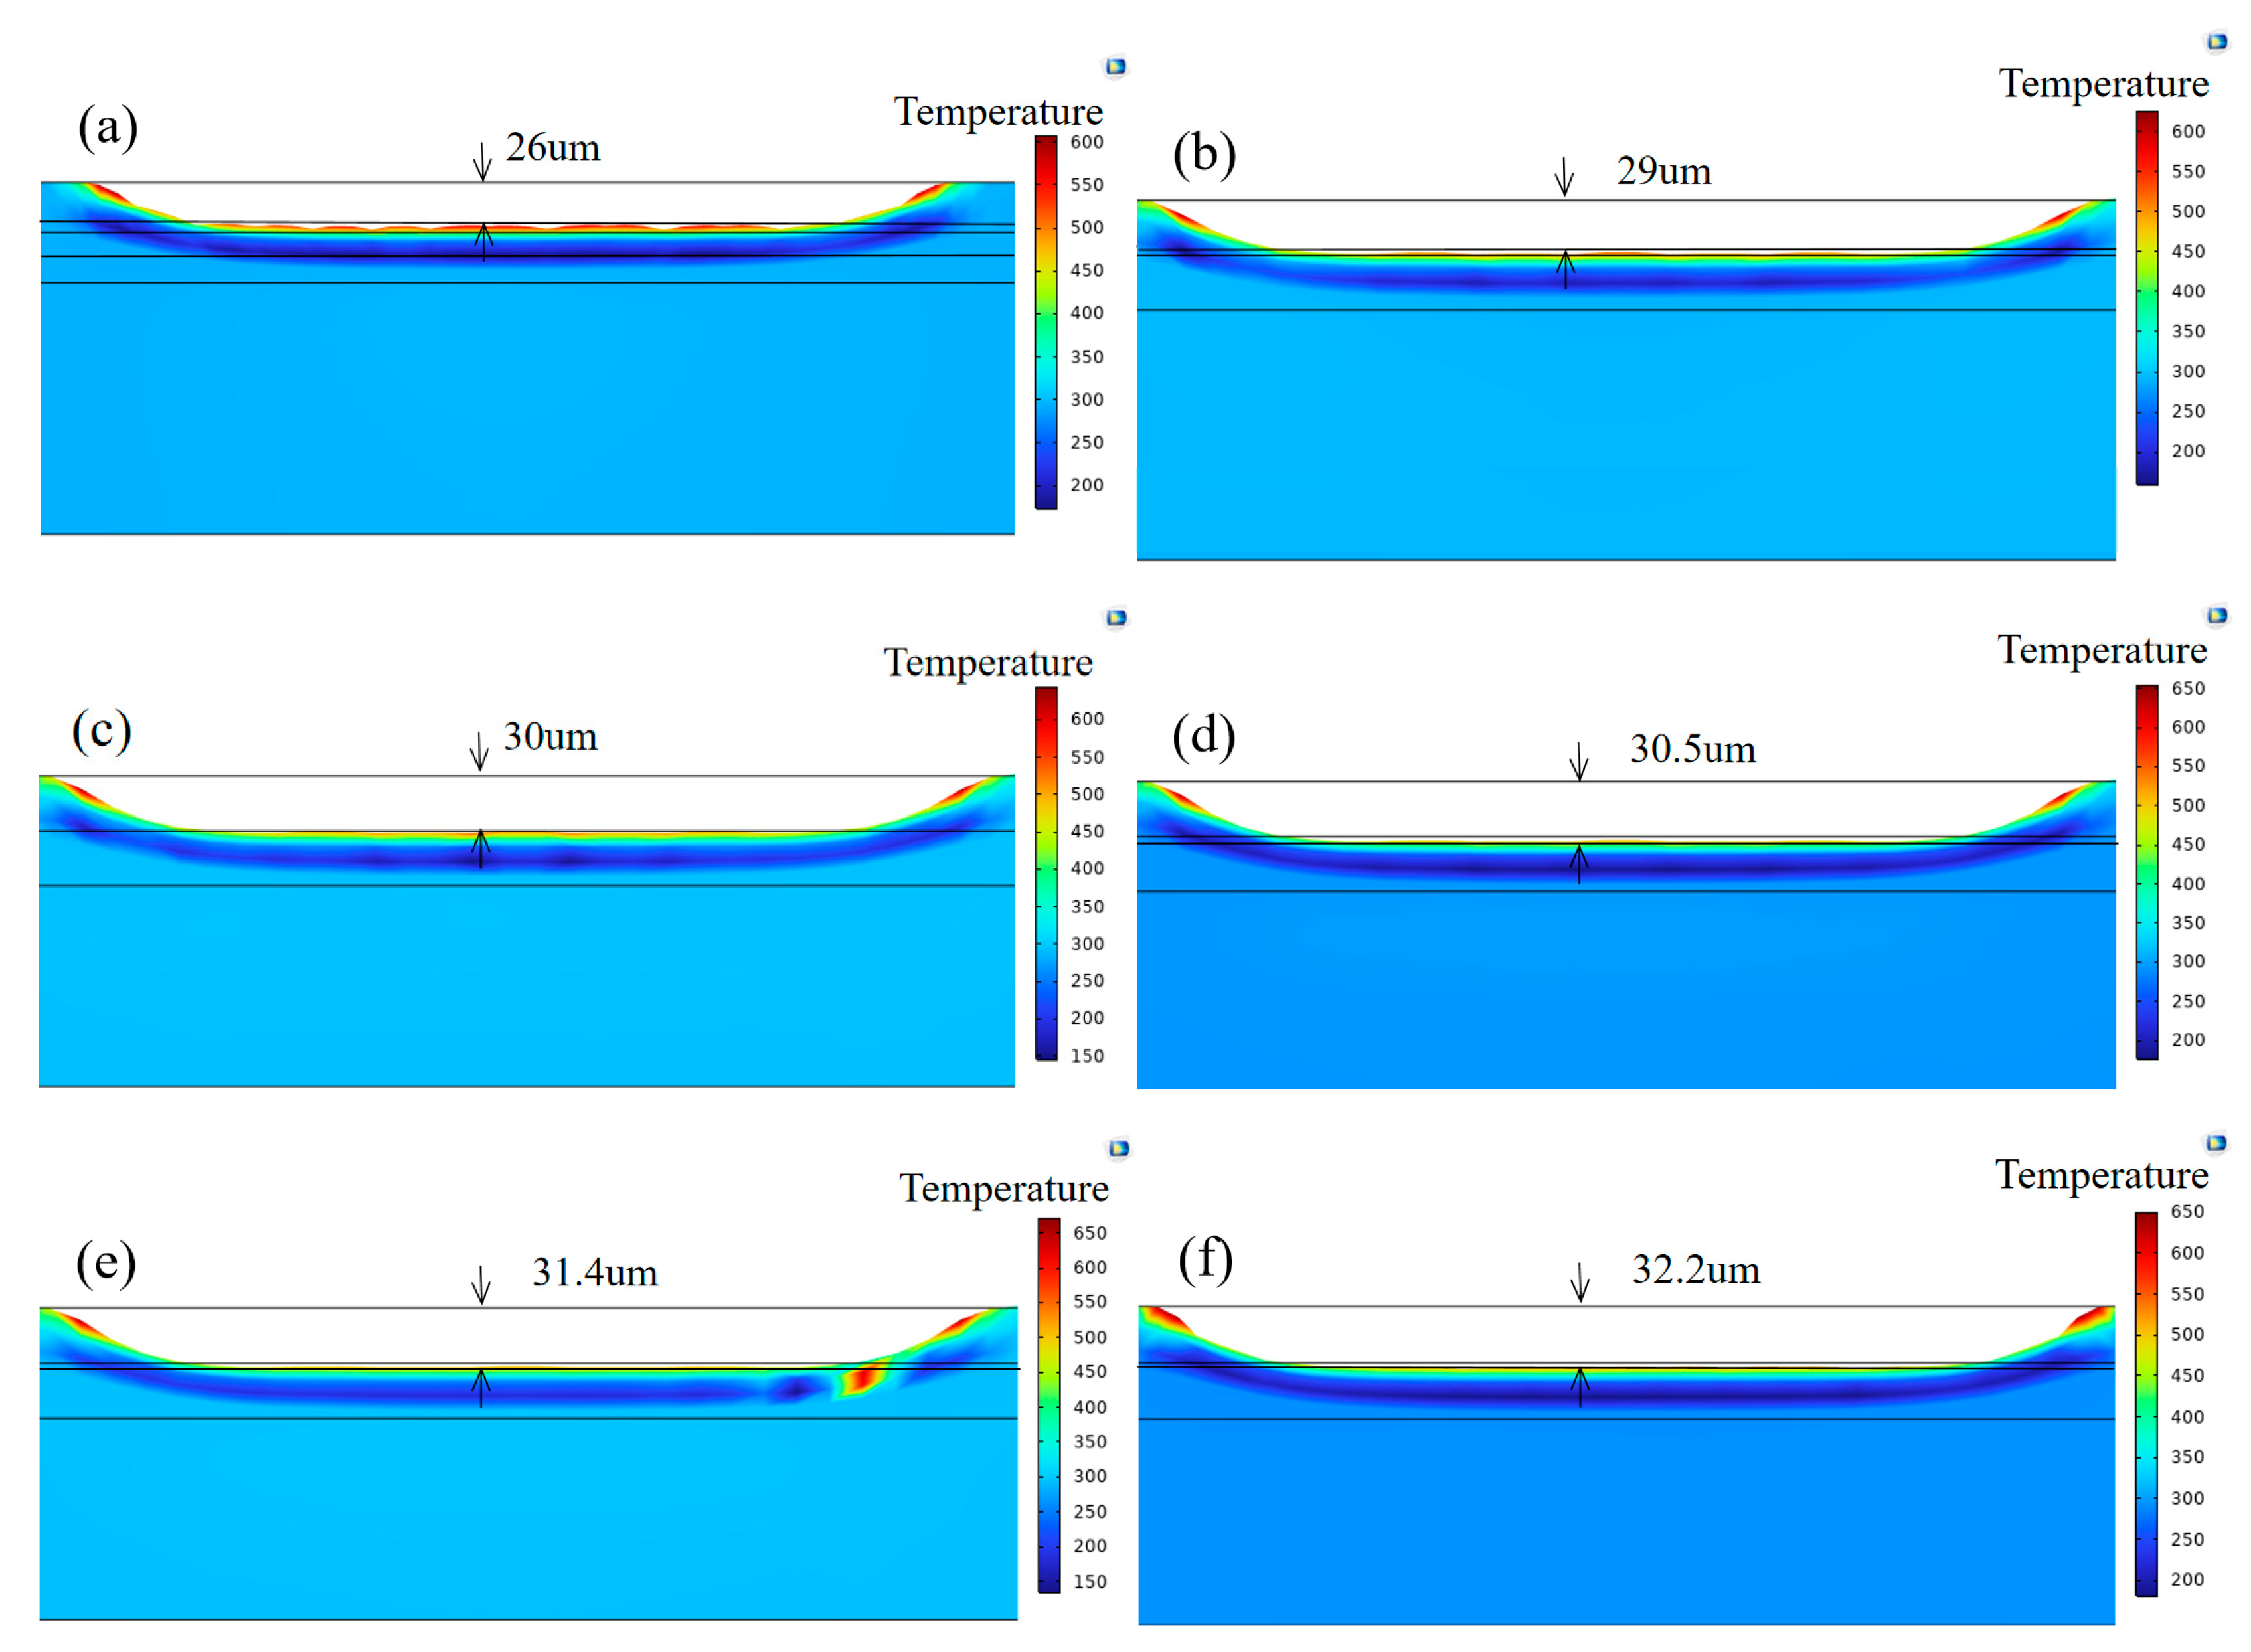
Figure 10a–f shows the ablation depth at a laser energy density of 1.02 × 10 4 mJ/cm2 under different pulse repetition rates. As the pulse repetition rate increases, the thermal accumulation effect causes the initial temperature before each laser exposure to rise continuously, resulting in a decrease in the absolute value of the thermal gradient, which in turn leads to a gradual increase in the depth of the heated region; during the thermal–mechanical coupling process, more regions reach the plastic yield temperature, and the accumulated plastic deformation causes the residual stress field to continuously expand downward and outward, gradually increasing the affected area. The ablation depth after a single pulse is approximately 26 μm, increasing to 32.2 μm by the sixth pulse. The energy from the first three pulses is primarily absorbed by the surface sulphide layer, achieving thermal degradation and peeling, with the third pulse nearly removing the layer down to the rubber layer bottom; from the fourth pulse onwards, after the sulphide layer was destroyed, laser energy was more extensively deposited in the Cr coating and steel substrate, leading to further heat accumulation and penetration downward, exacerbating heating and plastic damage to the underlying metal.
When the single-pulse energy increases from 8.5 × 10 3 to 1.53 × 10 4 mJ/cm2, surface heat absorption and thermomechanical response significantly enhance, with noticeable increases in Cr layer temperature and stress. High stress induces microcracks in the Cr layer and dissipates laser energy, thereby weakening the cleaning impact effect; simulations indicate that the optimal range for balancing cleaning and protection is between 1.02 × 10 4 and 1.19 × 10 4 mJ/cm2. When using multiple pulses at 1.02 × 10 4 mJ/cm2, the temperature baseline accumulates while the single thermal stress decreases, with the ablation depth increasing from approximately 26 μm to 32.2 μm. The first three pulses primarily achieve thermal degradation and peeling of sulphides. In contrast, after the fourth pulse, more energy is deposited into the coating and substrate, leading to metal heating and plastic damage. A flat-top spot pattern facilitates a smooth pit bottom surface, but excessively high energy can cause chromium layer ablation. A balance must be struck between improving cleaning efficiency and avoiding substrate damage.

3.2. Microstructure

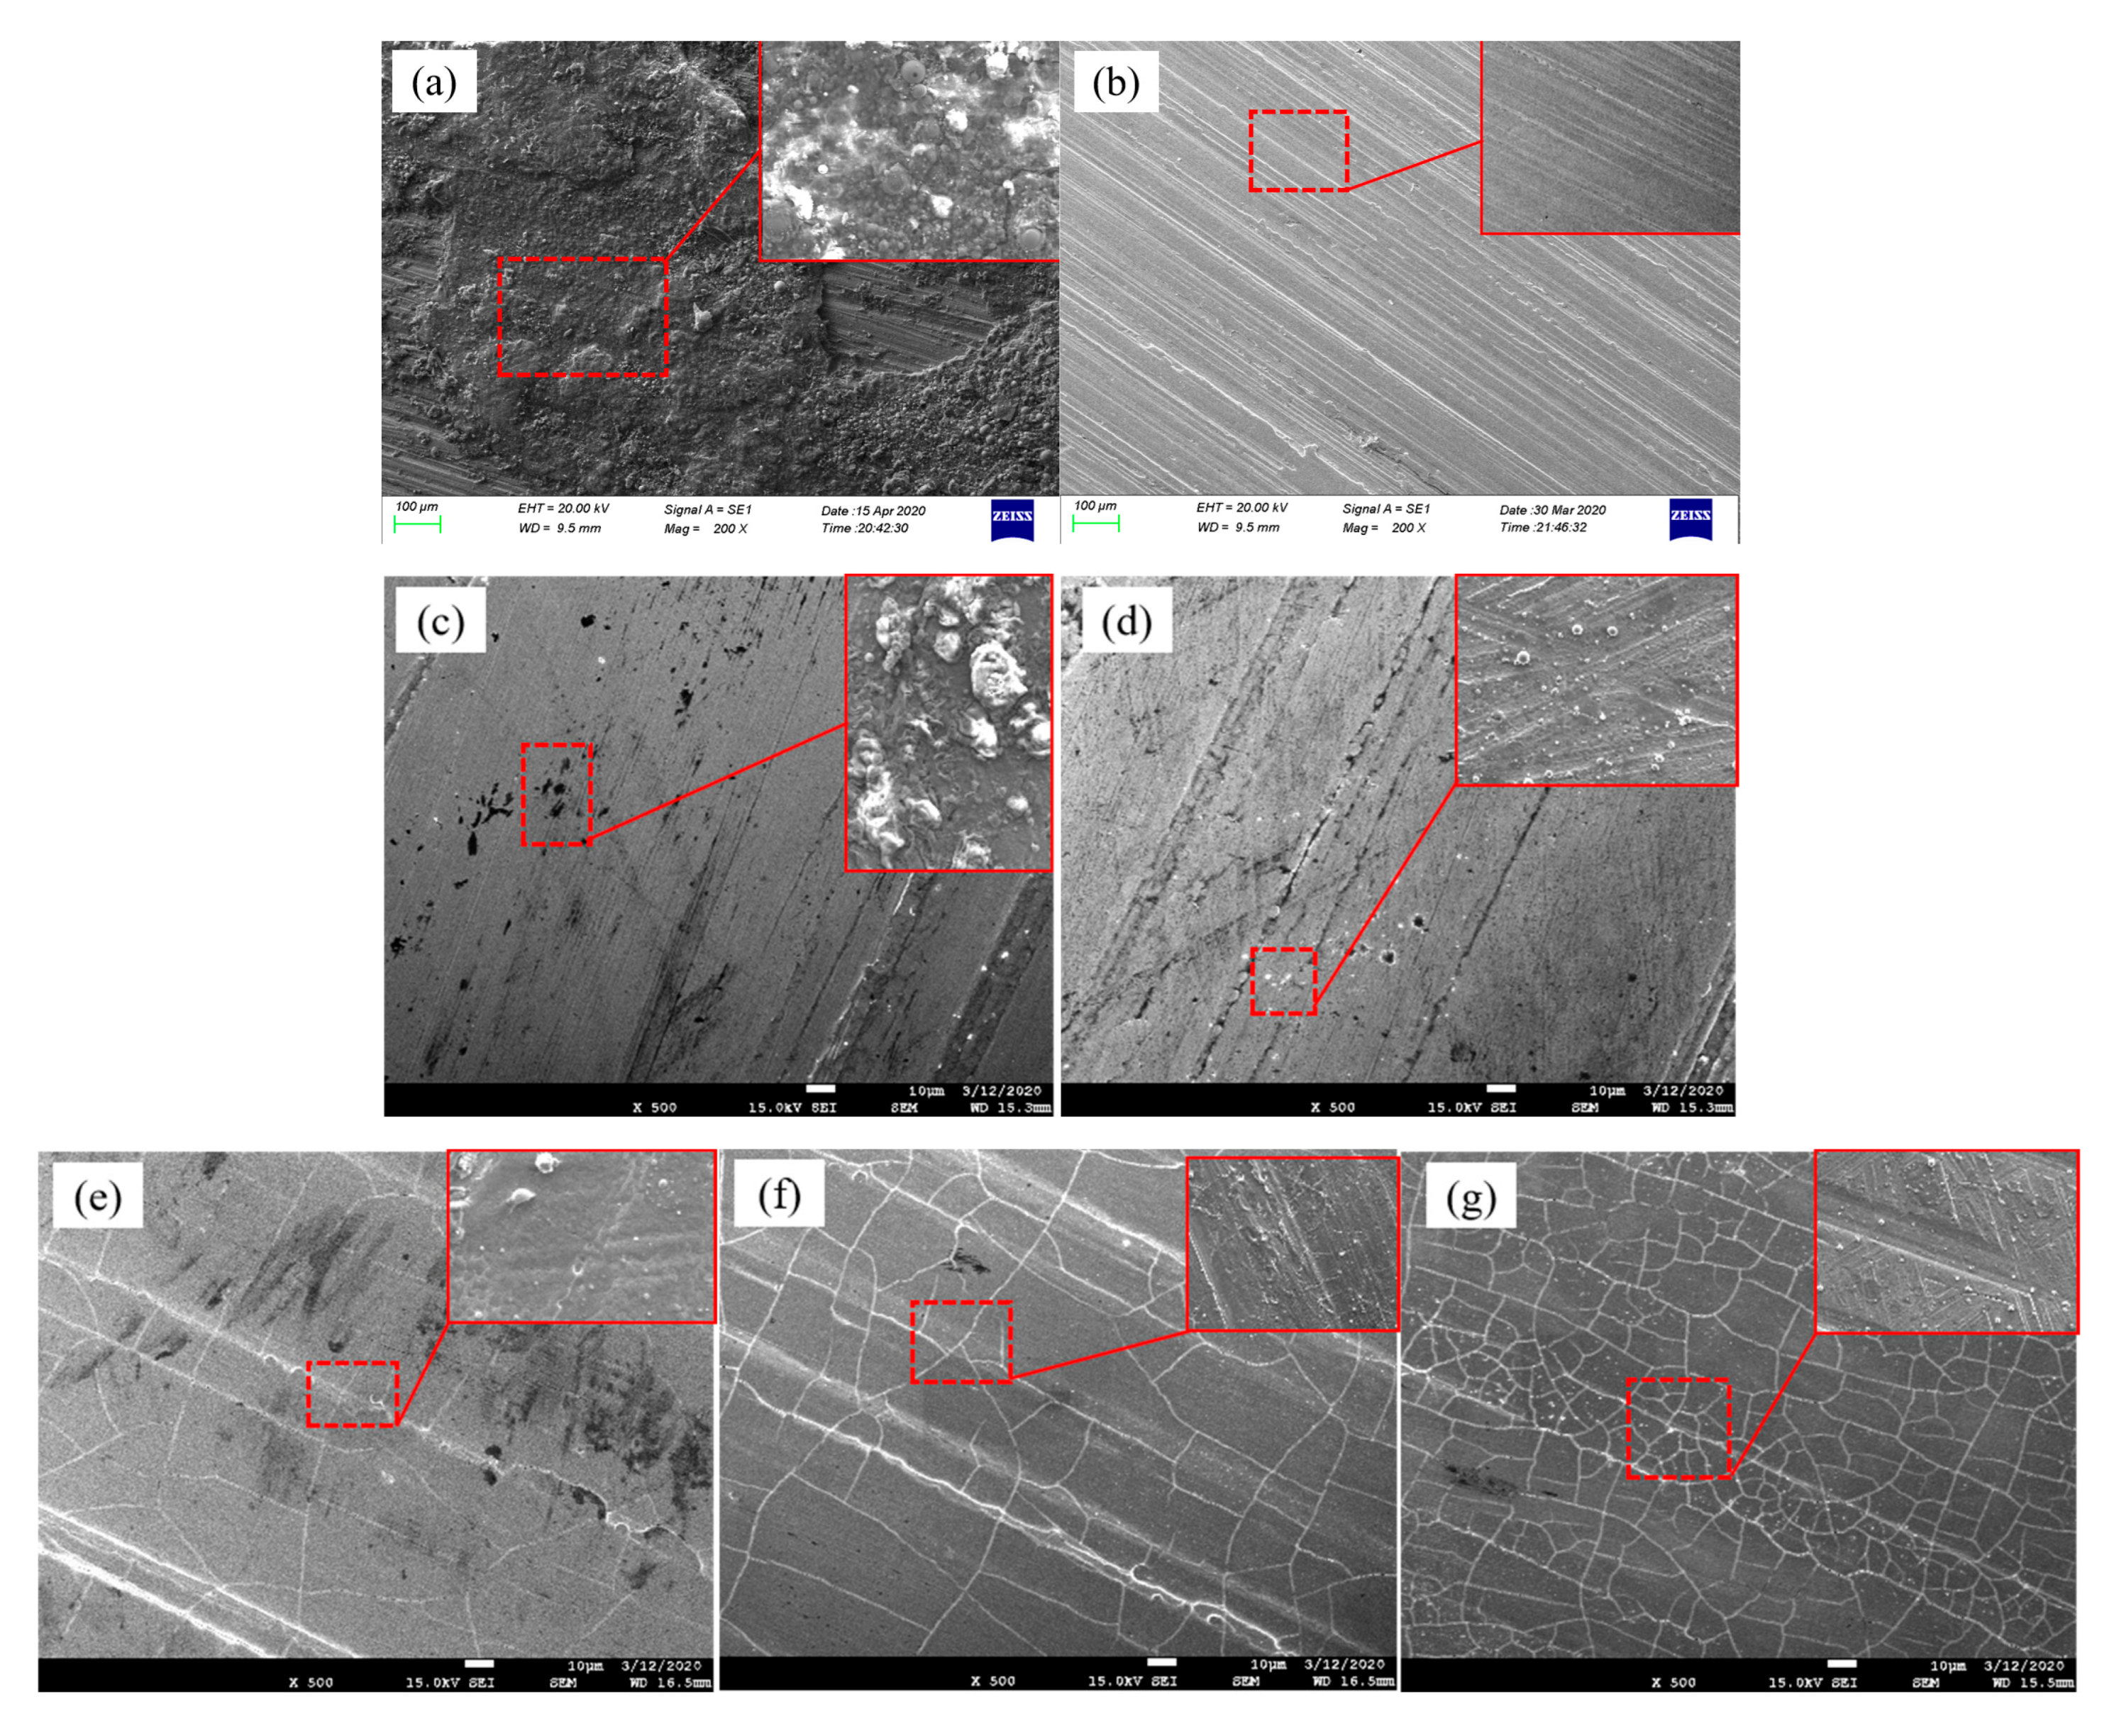
Microscopic morphology characterisation was performed using a Japanese JSM-7610F high-resolution Schottky field emission scanning electron microscope (SEM). Prior to cleaning, the surface of the tyre mould was relatively rough, with numerous block-like sulphide structures and cracks. This was due to the surface temperature of the tyre mould reaching 160 °C after production, followed by rapid cooling under natural conditions, resulting in structural changes caused by thermal expansion and contraction. When a pulsed laser is applied to the surface of the mould to be cleaned, the light energy is converted into thermal energy, causing the sulphur compounds on the steel surface to decompose upon heating. Figure 11a and Figure 12a show the microstructure before cleaning, while Figure 11b and Figure 12b depict the microstructure of the original sample, which exhibits a large number of small sulphur deposits adhering to the tyre mould surface. Figure 11c–g and Figure 12c–g illustrate the microstructure after laser cleaning under different energy densities and varying numbers of pulse applications.
As shown in Figure 11a–g, when the energy density is 8.5 × 10 3 mJ/cm2, the cleaning effect is significant, but there is still a considerable amount of sulphide residue; when increased to 1.02 × 10 4 mJ/cm2, the sulphide is nearly completely removed, with the substrate exposed and no macroscopic damage observed, demonstrating optimal cleaning efficiency; further increasing to 1.19 × 10 4 mJ/cm2, the laser begins to cause local ablation of the chromium layer, with microcracks and small melted depressions appearing in the stress concentration zone at the interface; when the energy density reaches 1.36 × 10 4 mJ/cm2, the number and size of cracks increase rapidly, forming a dense crack network, with the melted area and depth expanding simultaneously; at 1.53 × 10 4 mJ/cm2, the crack propagation becomes most severe, with through cracks and large-area melted pits appearing on the coating surface. This phenomenon is primarily attributed to thermal–mechanical stresses caused by the mismatch in thermal expansion coefficients between the Q235 steel substrate and the chromium layer, the instantaneous high-pressure effect of the pulsed laser shock wave, and the cumulative thermal effects of multiple pulses weakening the coating’s yield strength. The synergistic interaction of these three factors causes the interface stress intensity factor to exceed the critical fracture toughness of the chromium layer, leading to crack initiation and accelerated melting and ablation as temperature increases.
Figure 12a–g show that under the action of 2–3 pulse lasers, the sulphide layer is completely stripped away, leaving the substrate surface smooth and clean with no visible microdamage. By the fourth pulse, the baseline temperature increases due to pulse superposition, resulting in a thermal expansion mismatch and stress concentration at the interface. The stress intensity factor exceeds the fracture toughness of the chrome plating layer, causing micron-sized cracks to form in the stress concentration zone, accompanied by local melting and recrystallisation to form small droplets. When the number of impacts increased to 5–6 times, the cumulative thermal effect and high-frequency shock waves worked together to significantly weaken the coating’s yield strength, accelerate crack propagation, and form a continuous microcrack array through the interconnection of crack networks. The depth and volume of the melt zone increased synchronously, exhibiting a typical crack–melt composite damage morphology. The above experimental results were consistent with numerical simulations, verifying the validity of the simulation model.
An energy density of 8.5 × 10 3 mJ/cm2 can partially remove sulphides, while 1.02 × 10 4 mJ/cm2 is optimal—achieving near-complete removal without damage. Increasing the energy density to 1.19 × 10 4 1.53 × 10 4 mJ/cm2 causes the chromium layer to evolve from microcracks to through-thickness cracks, accompanied by molten pits. The thermal expansion mismatch between Q235 and chromium, shock waves, and thermal accumulation causes this damage. Two to three pulses can remove sulphides; microcracks start to appear from the fourth pulse onward, and after five to six pulses, the cracks interconnect and melting damage occurs, which is consistent with the simulation results.

3.3. Element Distribution

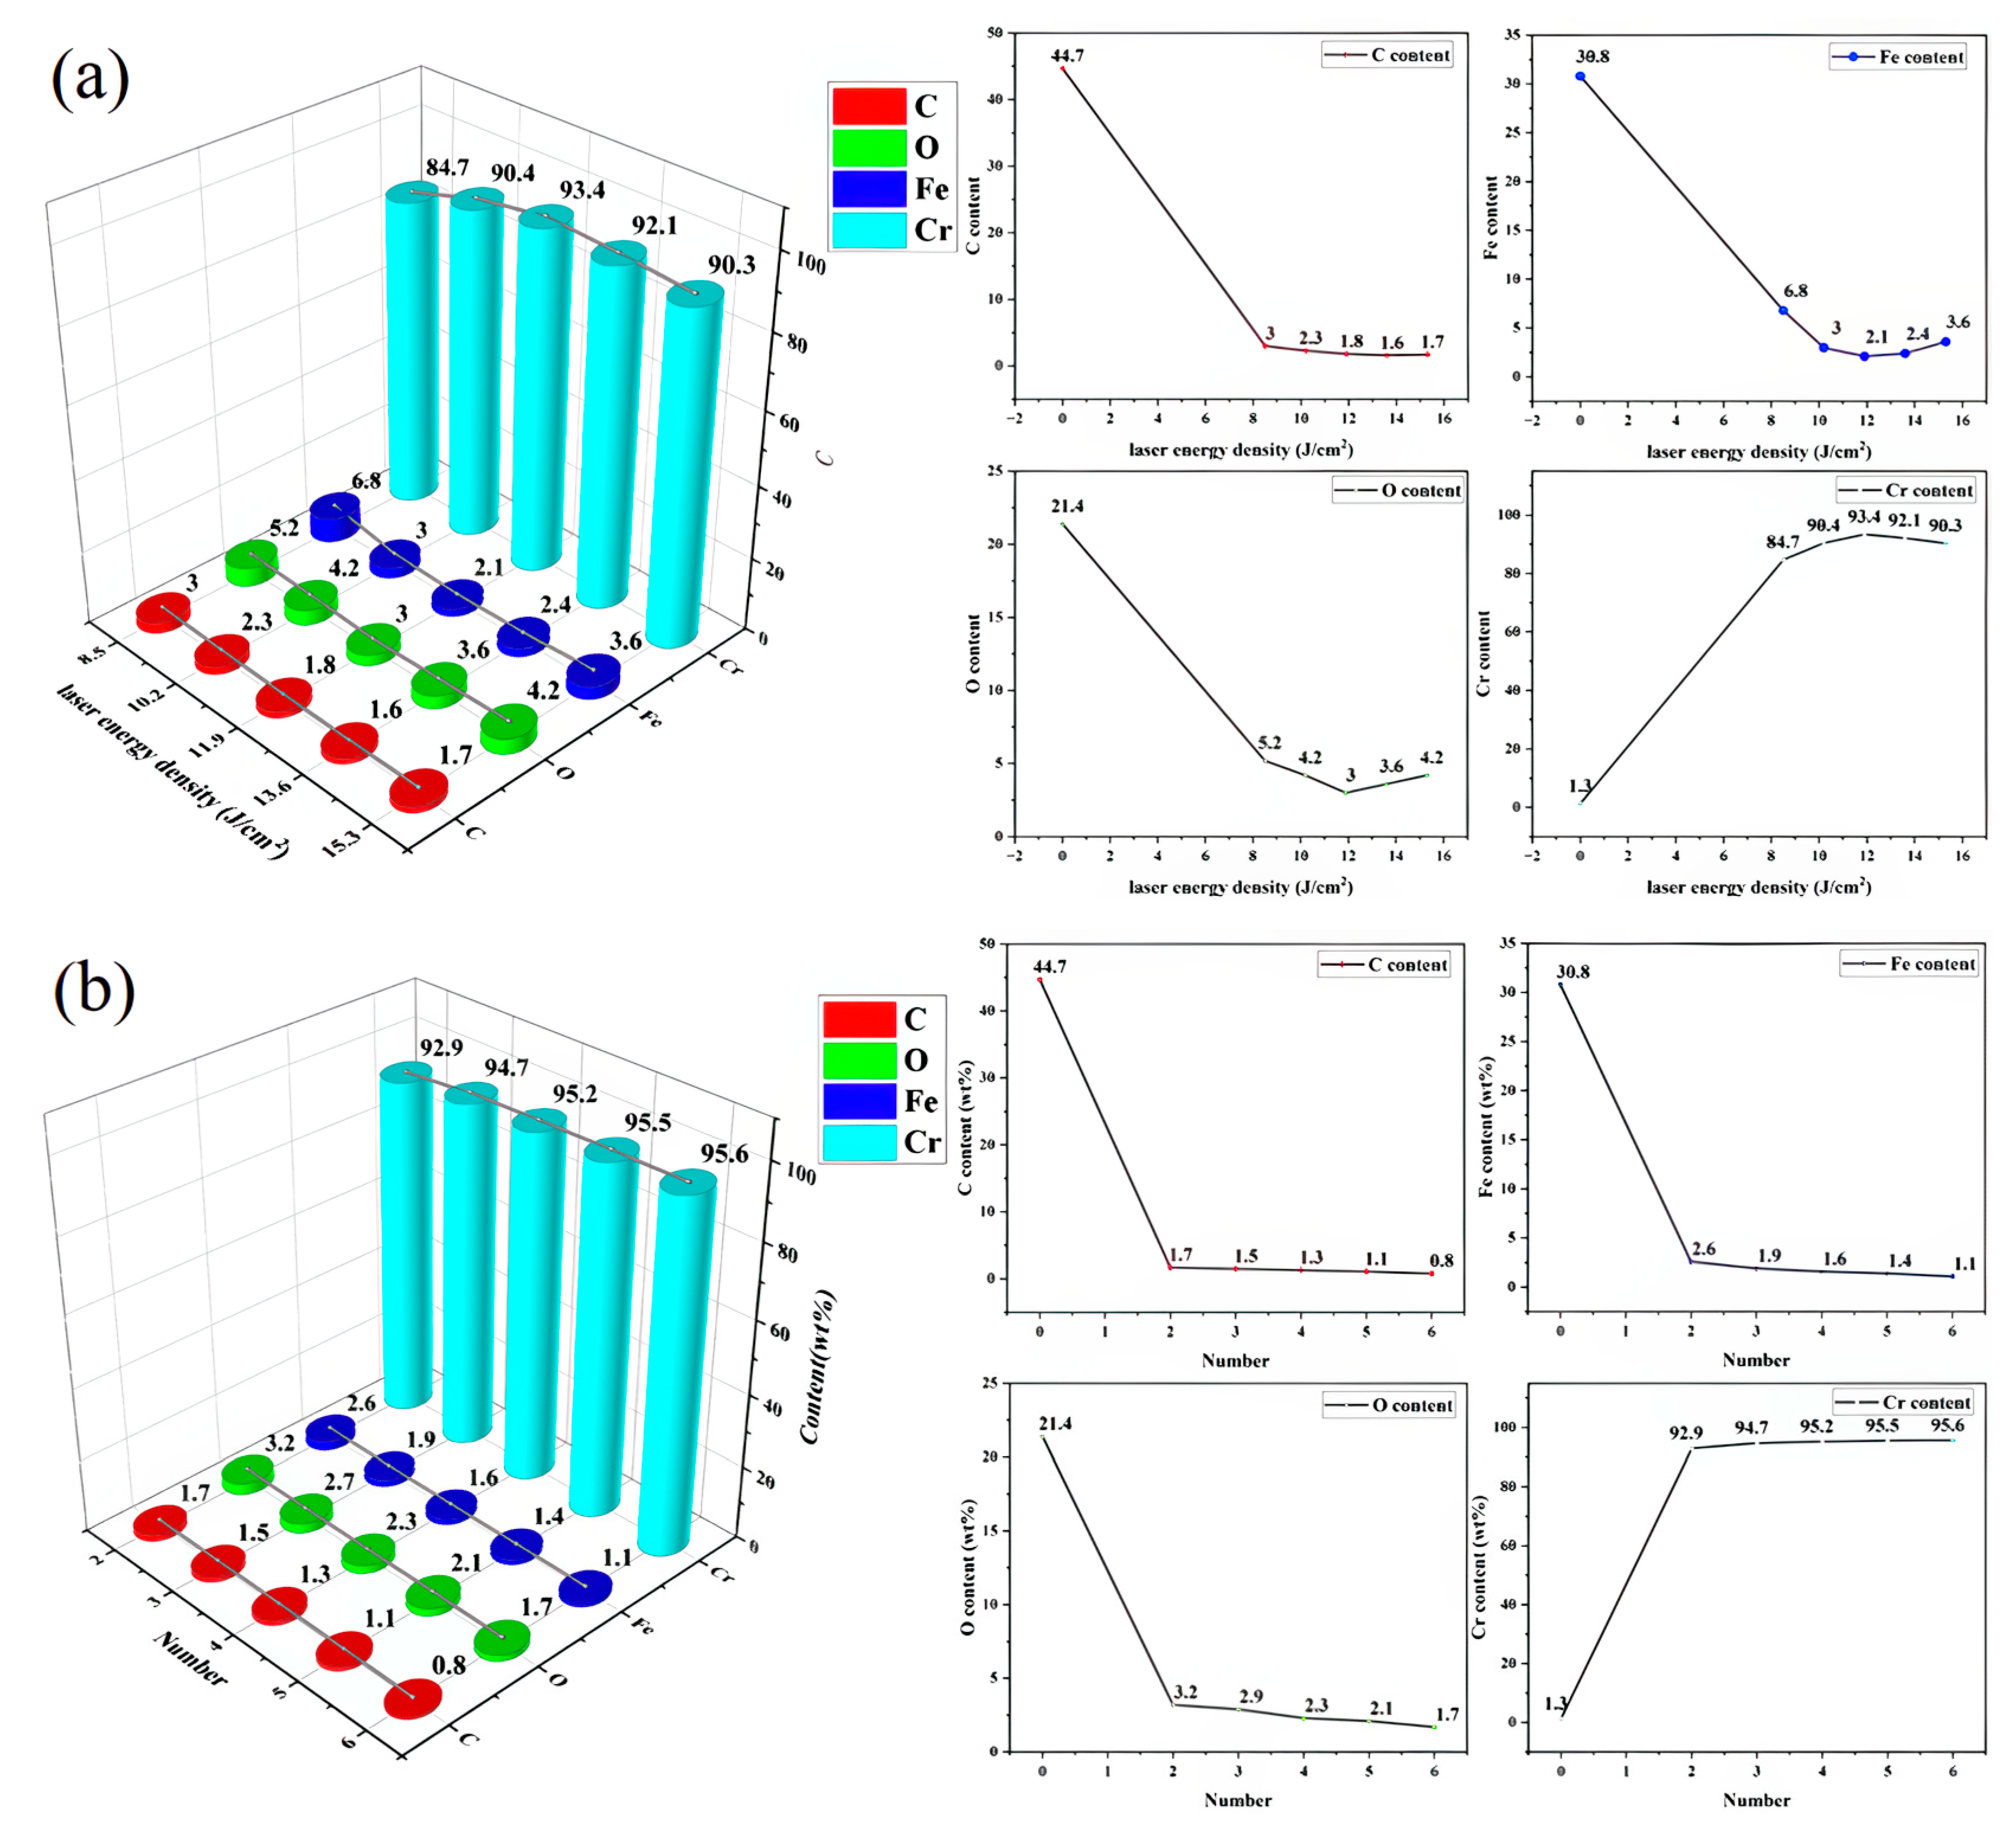
To further analyse the effect of laser cleaning on the removal of sulphur compounds from the surface of tyre moulds, a Japanese JSM-7910F high-resolution Schottky field emission scanning electron microscope (SEM) was used for surface element analysis. The cleaning effectiveness was determined by comparing the content of chromium, iron, oxygen, and carbon under different cleaning parameters. The elemental content of chromium, iron, oxygen, and carbon in the untreated samples is shown in Figure 13a, with elemental mass percentages of 1.3%, 30.8%, 21.4%, and 44.7%, respectively. The original sample is shown in Figure 13b, with elemental mass percentages of 98.39%, 0.27%, and 1.34%, respectively.
Figure 13c–g show the surface elemental composition after cleaning at different laser energy densities. When the energy density is increased to 1.02 × 10 4 mJ/cm2, the mass percentage of chromium on the surface significantly increases to 90.4%. In contrast, the mass percentages of iron, oxygen, and carbon remain at 3.0%, 4.2%, and 2.3%, respectively, clearly demonstrating the efficient removal of the sulphurised layer by the laser-induced ablation thermal stripping mechanism while controlling the exposure of the substrate. Further increasing the energy density causes the mass percentage of chromium to rise slightly before beginning to decrease. In contrast, the mass percentages of iron and oxygen gradually increase, leading to the destruction of the chromium coating and exposing the mould steel, thereby causing damage to the substrate structure. Based on the analysis results in Section 2.2, it is evident that at a laser energy density of 1.19 × 10 4 mJ/cm2, the sulphurised layer is completely removed, and the laser begins to cause local ablation of the chromium layer, with microcracks and minor melted depressions appearing in the stress concentration zone at the interface. Therefore, the optimal laser cleaning energy density is set at 1.02 × 10 4 mJ/cm2, which ensures the complete removal of the sulphurised layer while maximising the integrity of the chromium coating and substrate.
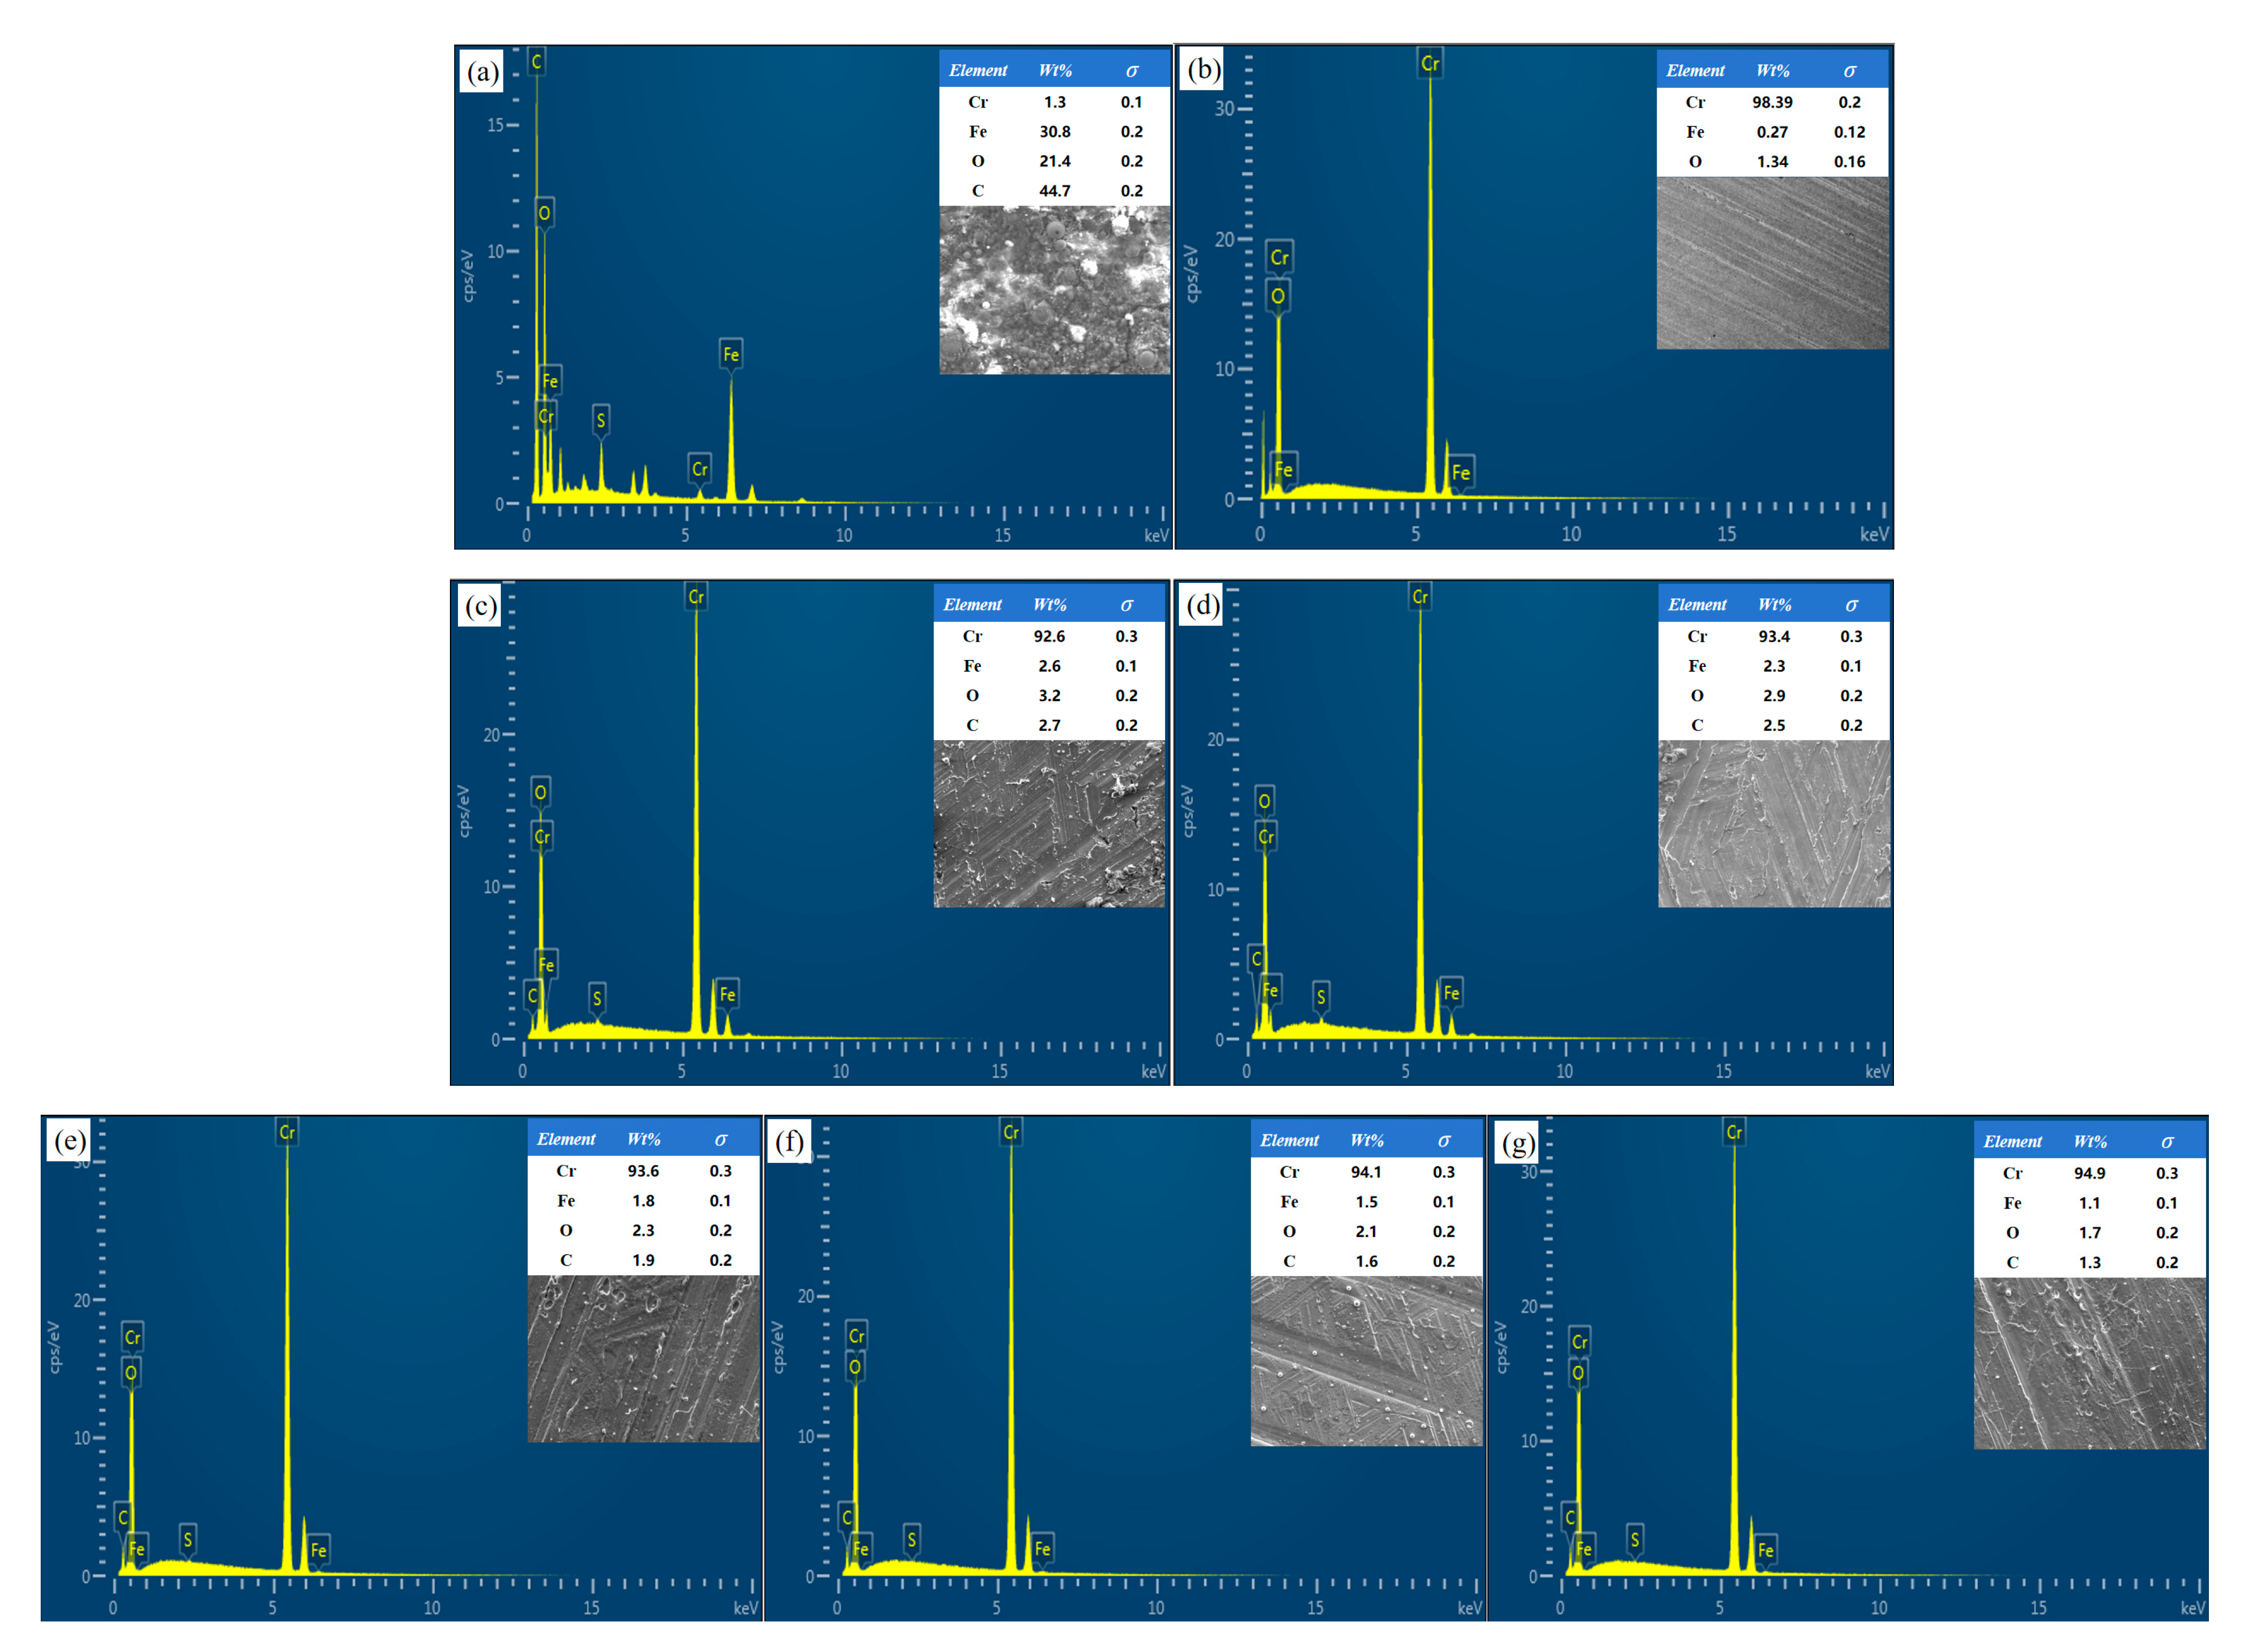
Figure 14a–f show the surface element content at the optimal energy density of 1.02 × 10 4 mJ/cm2 under different laser exposure frequencies. As the laser exposure frequency increases from two to six times, the mass percentage of chromium steadily increases from 92.6% to 94.9%. While the mass percentages of iron, oxygen, and carbon decrease from 2.6%, 3.2%, and 2.7% to 1.1%, 1.7%, and 1.3%, respectively. Based on the analysis results in Section 2.2, it is evident that two to three pulses are sufficient to completely remove the sulphide layer, leaving the substrate surface smooth and undamaged; the fourth pulse induced micrometre-scale cracks at the chromium plating interface due to thermal superposition and thermal expansion mismatch; after 5–6 pulses, the crack network interconnected, and the melted zone deepened and expanded, exhibiting typical crack–melt composite damage morphology. Multiple pulse lasers can efficiently remove sulphide from the mould surface at an optimal energy density, verifying the superiority of laser cleaning for sulphide removal. However, excessive pulse counts may damage the chromium plating layer due to thermal accumulation and stress concentration.
Based on the above analysis, as the laser energy density increases, the overall changes in iron and oxygen elements exhibit a trend of first decreasing and then increasing, while the chromium elements correspondingly first increase and then decrease. Carbon elements gradually decrease, as shown in Figure 15a. At a laser energy density of 1.02 × 10 4 1.19 × 10 4 mJ/cm2, the mass percentage of chromium is highest, while the mass percentages of iron and oxygen are lowest. Analysis indicates that at this energy density, sulphides have been largely removed, and the chromium coating remains intact. As the laser energy density increases, the mass percentage of chromium decreases, while the mass percentages of iron and oxygen increase. This is analysed as being due to the destruction of the chromium coating, exposing the substrate, with the laser acting on the substrate surface, causing ablation and oxidation. As the number of pulse laser applications increases, the overall changes in iron, oxygen, and carbon show a gradual decreasing trend. In contrast, the chromium content correspondingly increases, as shown in Figure 15b. As the number of pulse applications increases, the cleaning effect on the tyre mould surface improves accordingly.

3.4. Chromium Coating Thickness Analysis

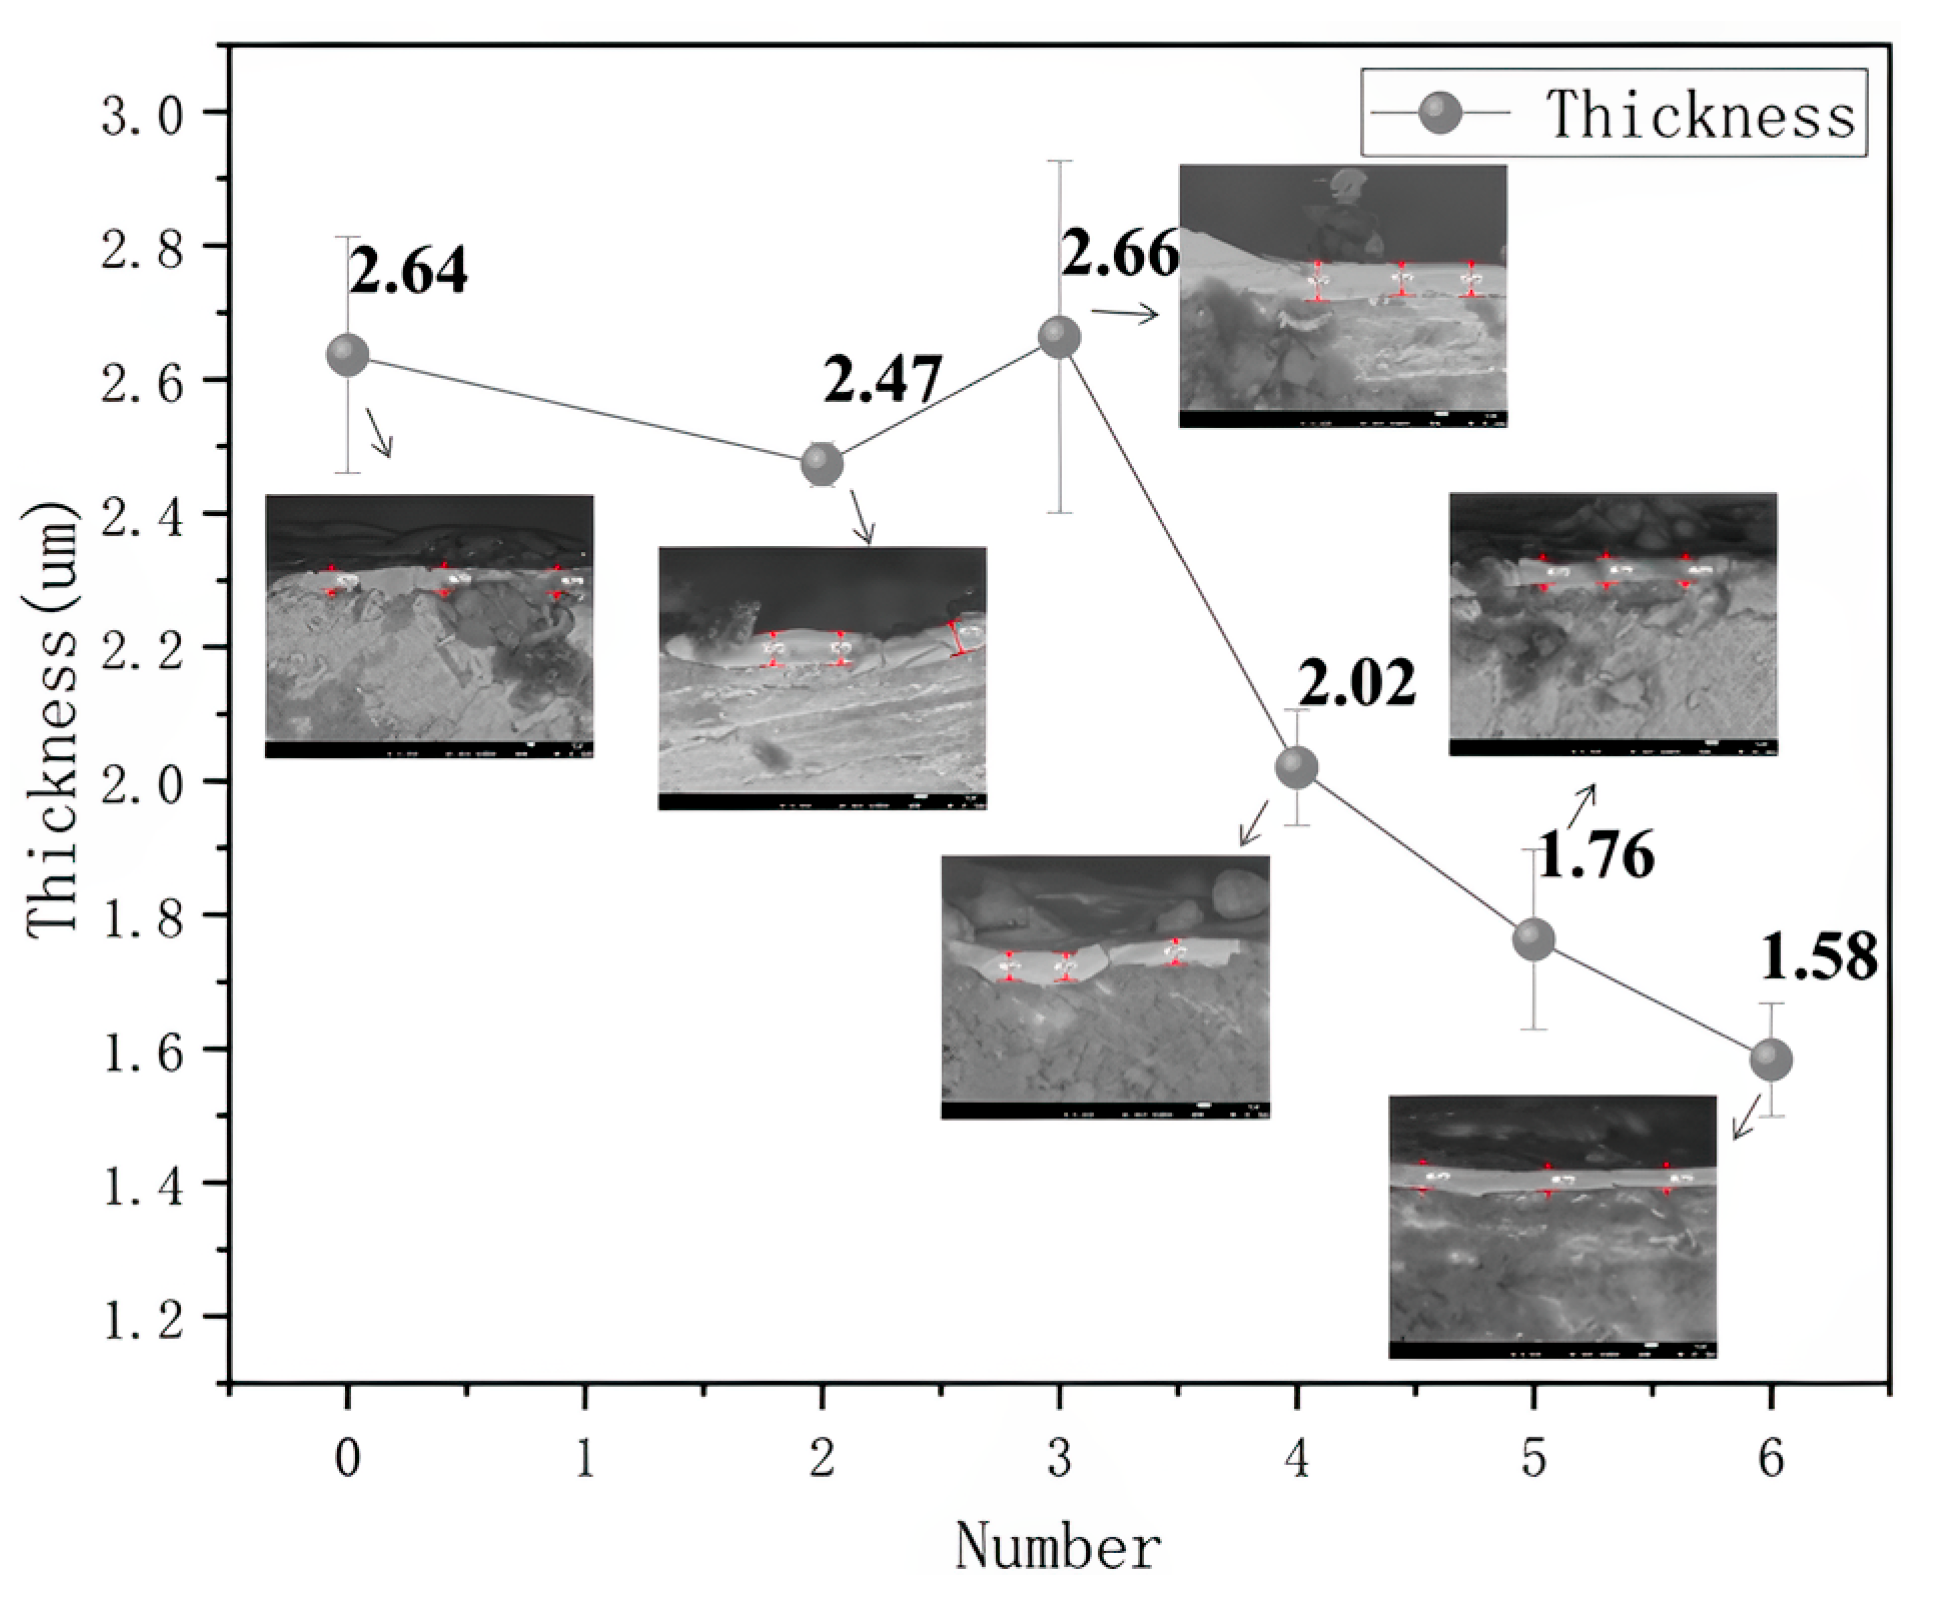
At the optimal energy density ( 1.02 × 10 4 mJ/cm2), after 0, 2, 3, 4, 5, and 6 laser cleaning cycles on the chromium coating, as shown in Figure 16: In the first two scans, the laser energy was primarily absorbed by surface sulphides and efficiently removed, with thermal accumulation insufficient to damage the underlying chromium layer, resulting in a slight decrease in coating thickness from 2.64 μm to 2.47 μm; the third measurement of 2.66 μm is likely due to measurement fluctuations caused by local recrystallisation. Starting from the fourth scan, the thermal accumulation caused by multiple pulse overlaps led to the local temperature exceeding the melting and vaporisation threshold of chromium, accompanied by thermal–mechanical coupling. This resulted in plastic deformation and microcracks, triggering melting and peeling, which caused the cross-sectional thickness to suddenly drop to 2.02 μm. Subsequently, the thickness continued to decrease to 1.76 μm and 1.58 μm in the fifth and sixth measurements. To ensure the integrity of the coating, it is recommended that the number of cleaning cycles does not exceed three.

3.5. Removal Mechanism Analysis

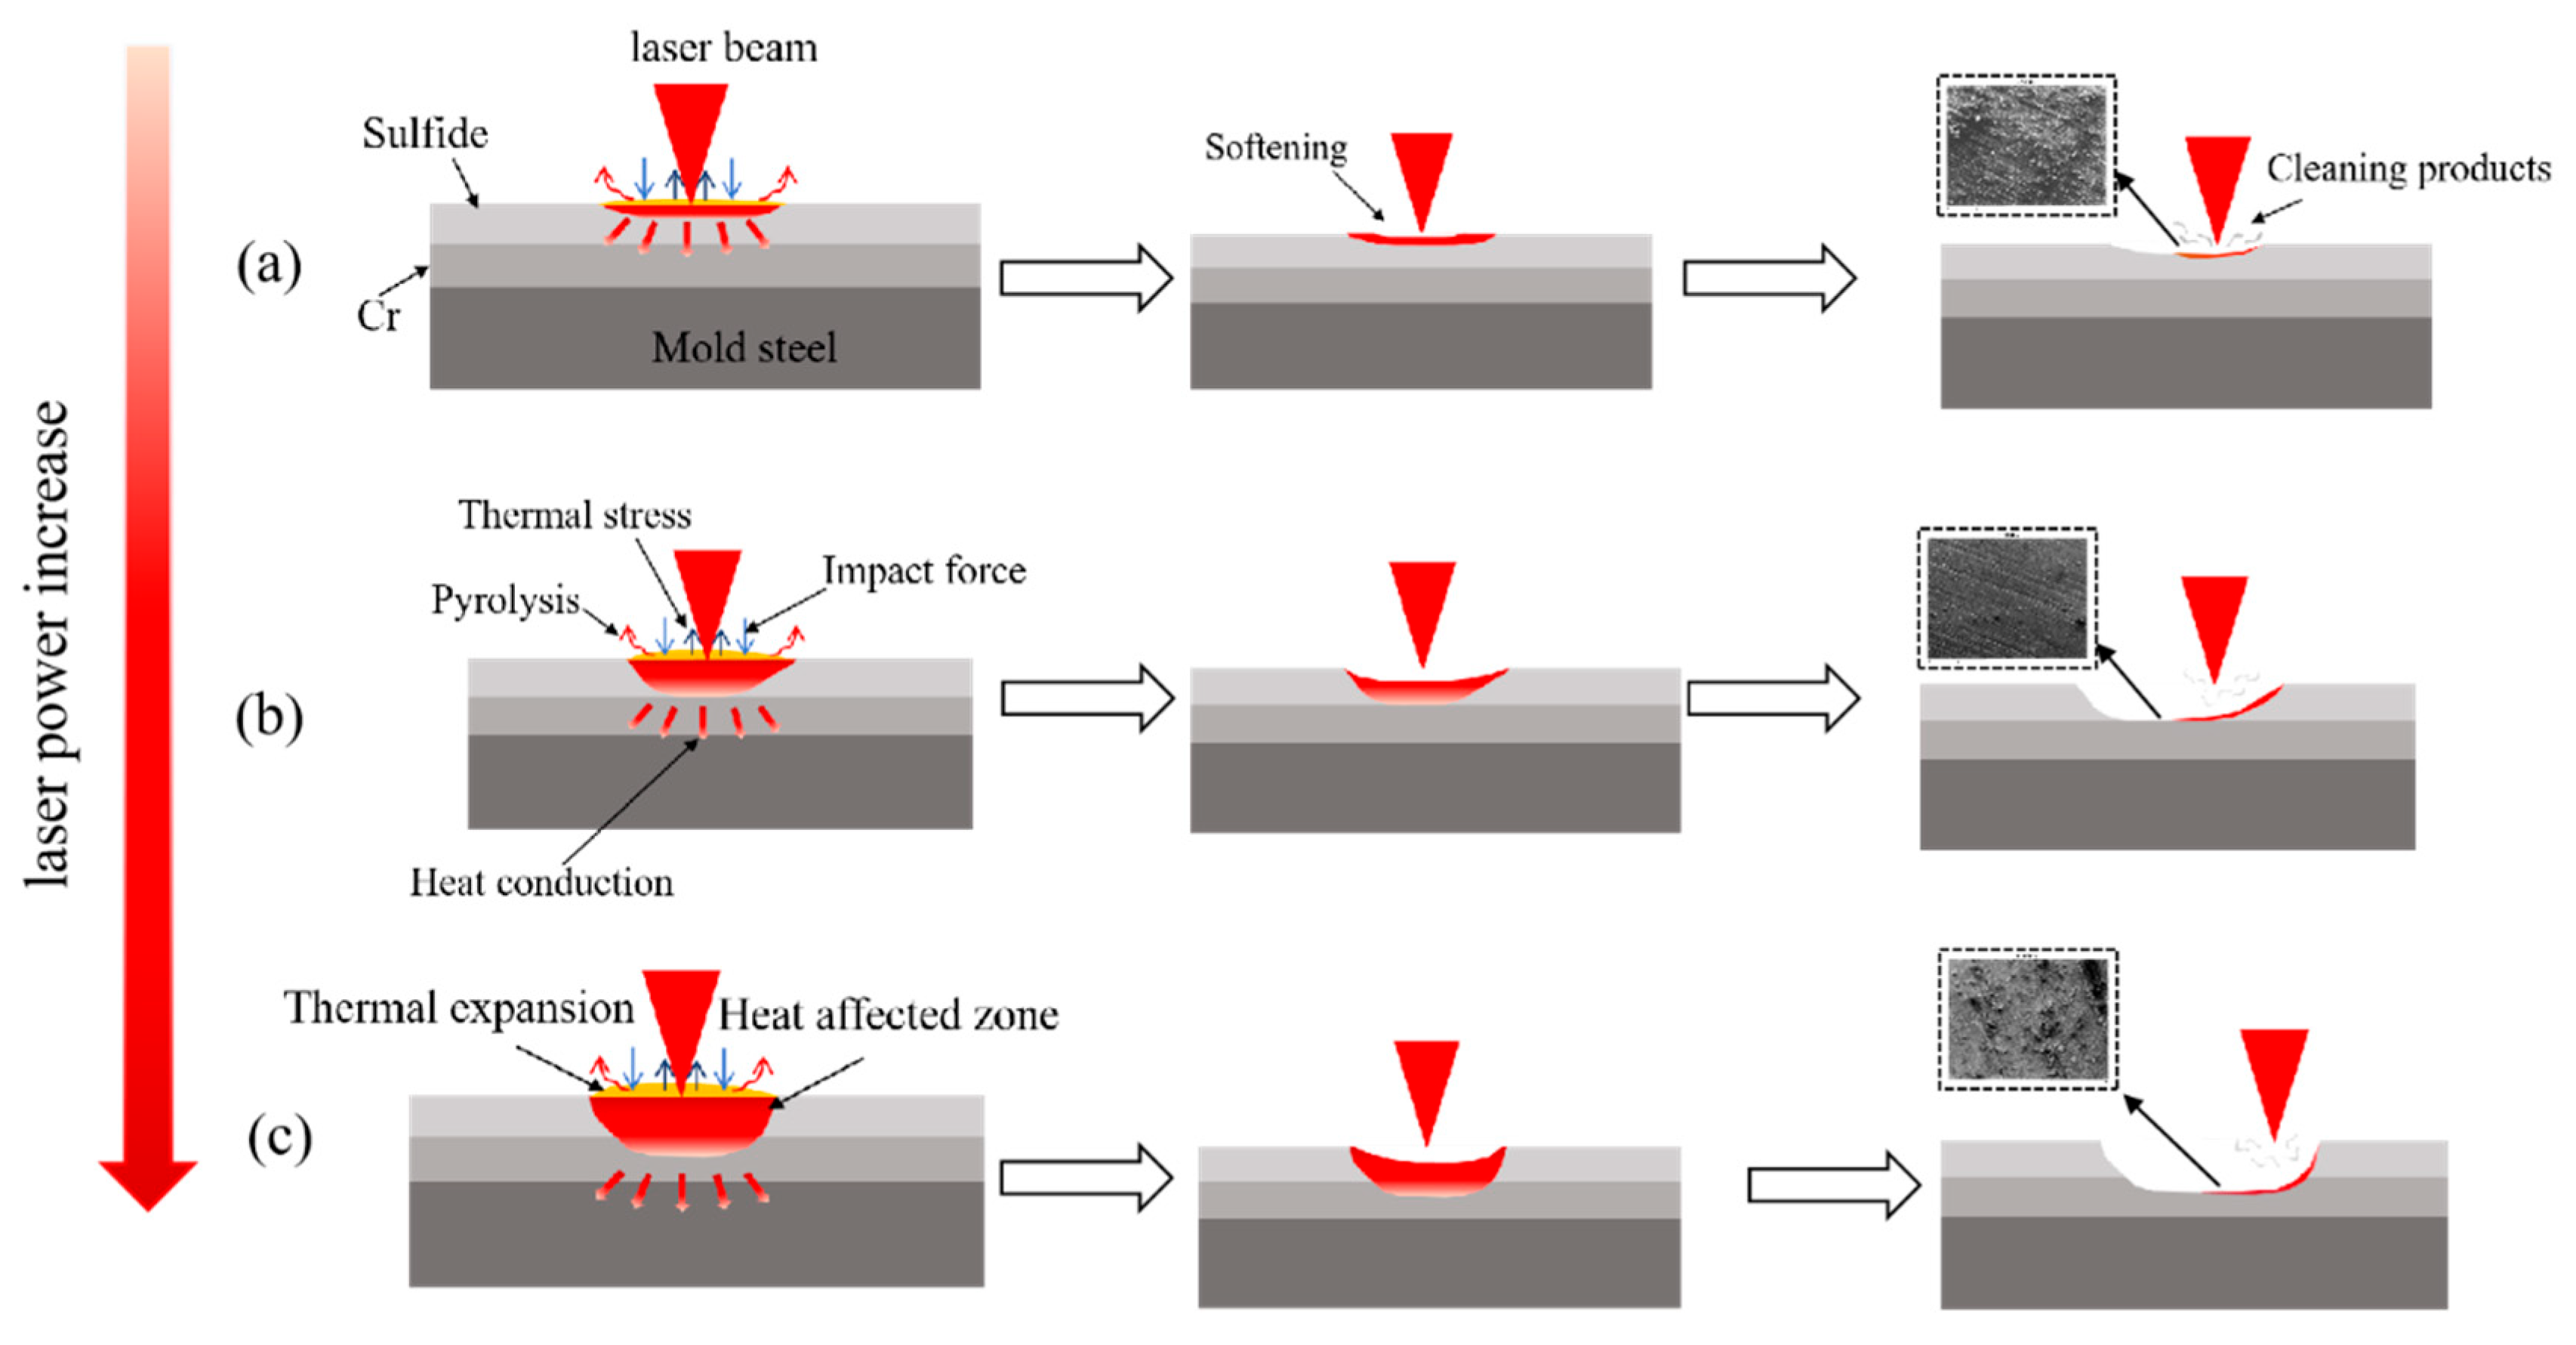
When laser light is directed at the surface of a workpiece, the light energy is rapidly converted into thermal energy, causing a significant increase in surface temperature. Under the influence of thermal stress, this leads to pronounced thermal expansion and thermal ablation effects. Based on macroscopic observations of the laser cleaning process for tyre mould sulphides, combined with the microscopic morphological characteristics of the sample surface, the multiple removal mechanisms involved in the cleaning process can be further analysed. Under lower laser power density conditions, the sulphurised layer absorbs energy and rapidly heats up, causing thermal expansion on the surface of the sulphurised layer. As the temperature continues to rise, the sulphurised layer begins to soften. When the surface temperature reaches the thermal decomposition temperature of the sulphurised layer, a thermal decomposition reaction occurs. However, due to the limited absorbed energy, only minor thermal decomposition peeling occurs, leaving shallow micro-pits on the surface, as shown in Figure 17a. As the laser energy density increases, the sulphide layer absorbs more energy, and the temperature continues to rise until the sulphide on the surface is completely degraded and peeled off, leaving the substrate surface smooth, as shown in Figure 17b. When the laser energy density is further increased, after the cleaning process is completed, the substrate undergoes excessive melting due to the thermal accumulation effect. The molten layer is reshaped under the combined effects of laser impact force and its surface tension. It rapidly solidifies as the temperature drops sharply, forming a disordered remelted structure, as shown in Figure 17c. It can be seen that the core mechanism of laser cleaning of sulphur compounds on the surface of steel moulds lies in the thermal decomposition process triggered by energy absorption. However, at high energy densities, it is also necessary to prevent surface damage caused by the remelting and recrystallisation of the substrate.

4. Conclusions

(1)
The COMSOL thermal–mechanical coupling model established is highly consistent with experimental results, precisely defining the energy density and pulse frequency process window for laser cleaning of Cr-plated moulds. This provides critical theoretical and practical guidance for optimising cleaning processes, extending mould lifespan, and enhancing tyre production quality.
(2)
Within this energy density range, sulphides can be completely removed (EDS analysis shows Cr content increased to over 90%, with significant decreases in C and O), and the surface microstructure is smooth with no cracks or melt pits. Below 8.5 × 10 3 mJ/cm2, cleaning is incomplete, while above 1.19 × 10 4 mJ/cm2, thermal stress and excessive melting cause cracks and ablation in the Cr coating.
(3)
At 1.02 × 10 4 mJ/cm2, only two to three pulses are required to achieve efficient cleaning (smooth surface, EDS element levels restored to original levels); more than three pulses result in increased thermal accumulation (simulated stress up to 742 MPa), causing microcracks in the Cr layer accompanied by local melting. After the fourth pulse, the coating thickness suddenly decreases from 2.6 μm to 2.0 μm and further thins to 1.6 μm after the fifth and sixth pulses.
(4)
Laser photothermal conversion causes the sulphide layer to pyrolyse, vaporise, and expand instantaneously. The pulse shock wave synergistically overcomes the adsorption force to achieve peeling. Under optimal parameters, the thermal expansion and thermal stress generated by the shock wave are insufficient to damage the Cr layer. However, when the energy density or pulse count is too high, the thermal stress combined with the shock pressure exceeds the fracture toughness of the Cr layer, leading to crack initiation, propagation, and local melting and ablation.
(5)
The thermal expansion stress shown in Figure 7 and Figure 8 is shear. Due to the significant differences in thermal properties (thermal expansion coefficient, elastic modulus, thermal conductivity, etc.) between the contaminant layer and the substrate, thermal expansion mismatch occurs when they are heated simultaneously, resulting in stress within the two materials and at their interface.

Author Contributions

Y.R.: writing—original draft preparation, funding acquisition; J.L.: funding acquisition, supervision; Y.X.: formal analysis, methodology; L.W.: project administration, investigation; X.M.: conceptualization, investigation; Y.Z.: resources, validation; X.Y.: validation, formal analysis; L.L.: writing—review and editing, data curation; W.C.: supervision, writing—review and editing. All authors have read and agreed to the published version of the manuscript.

Funding

This research was funded by the National Natural Science Foundation of the People’s Republic of China (Project Number: 52175473); the Shandong Province Science and Technology-based Small and Medium-sized Enterprise Innovation Capacity Enhancement Project (Project Number: 2023TSGC0617).

Institutional Review Board Statement

Not applicable.

Informed Consent Statement

Not applicable.

Data Availability Statement

The original contributions presented in the study are included in the article, further inquiries can be directed to the corresponding author.

Conflicts of Interest

Authors Yuan Ren, Yongmei Zhu, Xingwei Yao, and Li Lin were employed by the Shandong Qiangyuan Laser of SDIIT Ltd. The remaining authors declare that the research was conducted in the absence of any commercial or financial relationships that could be construed as a potential conflict of interest.

References

  1. D’Avico, L.; Beltrami, R.; Pargoletti, E.; Trasatti, S.; Cappelletti, G. Insight into the Release Agents/PVD Coatings Interaction for Plastic Mold Technology. Coatings 2020, 10, 281. [Google Scholar] [CrossRef]
  2. Hanulikova, B.; Shejbalova, D.; Dvorak, Z. Infrared analysis of fouling during EPDM curing studied on molds made of steel and aluminium alloys. Rubber Chem. Technol. 2018, 91, 390–400. [Google Scholar] [CrossRef]
  3. Zhang, X.; Liu, Z.; Wang, X.; Xu, X.; Wu, Y.; Wu, D. Comparative study of anti-sticking properties of coatings for tire molds. Coatings 2022, 12, 1740. [Google Scholar] [CrossRef]
  4. Fragassa, C.; Ippoliti, M. Technology Assessment of Tire Mould Cleaning Systems and Quality Finishing. Int. J. Qual. Res. 2016, 10, 523–546. [Google Scholar]
  5. Vítězslav, M.; David, H.; Dalimil, P. Industrial use of dry ice blasting in surface cleaning. J. Clean. Prod. 2021, 329, 129630. [Google Scholar] [CrossRef]
  6. Tai, X.; Liu, C.; Chen, W.; Mai, Y.; Zhang, L.; Wu, X.; Jie, X. Electroplated wear and corrosion–resistant Co-Mo/CeO2 composite coatings for reducing mold fouling application. J. Solid State Electrochem. 2023, 27, 679–694. [Google Scholar] [CrossRef]
  7. Zhou, Z.; Sun, W.; Wu, J.; Chen, H.; Zhang, F.; Wang, S. The Fundamental Mechanisms of Laser Cleaning Technology and Its Typical Applications in Industry. Processes 2023, 11, 1445. [Google Scholar] [CrossRef]
  8. Deng, J.; Zhao, G.; Lei, J.; Zhong, L.; Lei, Z. Research Progress and Challenges in Laser-Controlled Cleaning of Aluminum Alloy Surfaces. Materials 2022, 15, 5469. [Google Scholar] [CrossRef]
  9. Lu, Y.; Yang, L.; Wang, M.; Wang, Y. Simulation of nanosecond laser cleaning the paint based on the thermal stress. Optik 2021, 227, 165589. [Google Scholar] [CrossRef]
  10. Li, Z.; Zheng, W.; Wang, S.; Wang, Y.; Pan, Y. Progress of laser cleaning technology from the perspective of Chinese patents. Front. Mech. Eng. 2024, 19, 44. [Google Scholar] [CrossRef]
  11. Zhu, G.; Xu, Z.; Jin, Y.; Chen, X.; Yang, L. Mechanism and application of laser cleaning: A review. Opt. Lasers Eng. 2022, 157. [Google Scholar] [CrossRef]
  12. Kong, D.J.; Feng, A.X.; Zhang, Y.K.; Lu, J.Z.; Tang, C.P. Experiment study on CO2 laser cleaning rubber sulfuring mould. ICO20 Lasers Laser Technol. 2005, 6028, 371–376. [Google Scholar]
  13. Ye, Y.; Jia, B.; Chen, J.; Jiang, Y.; Tang, H.; Wang, H.; Luan, X.; Liao, W.; Zhang, C.; Yao, C. Laser cleaning of the contaminations on the surface of tire mould. Int. J. Mod. Phys. B 2017, 31, 1744100. [Google Scholar] [CrossRef]
  14. Jia, X.; Zhang, Y.; Chen, Y.; Wang, H.; Zhu, G.; Zhu, X. Laser cleaning of slots of chrome-plated die. Opt. Laser Technol. 2019, 119, 105659. [Google Scholar] [CrossRef]
  15. Cai, Y.; Song, X.; Chen, C.; Yang, J.; Gao, J.; Zhang, K. Effect of energy distribution on laser cleaning quality of 30Cr3 ultra-high strength steel. J. Mater. Res. Technol. 2024, 30, 4868–4880. [Google Scholar] [CrossRef]
  16. Jiang, J.; Zhai, H.; Gong, P.; Zhang, W.; He, X.; Ma, X.; Wang, B. In-situ study on the tensile behavior of Cr-coated zircaloy for accident tolerant fuel claddings. Surf. Coat. Technol. 2020, 394, 125747. [Google Scholar] [CrossRef]
  17. Lu, J.; Liu, H.; Chen, Z.; Liao, X. Experimental investigation into the post-fire mechanical properties of hot-rolled and cold-formed steels. J. Constr. Steel Res. 2016, 121, 291–310. [Google Scholar] [CrossRef]
  18. He, C.; Yang, C.; Yang, H.; Wang, J.; Liu, J.; Deng, L.; Fang, L.; Li, C. Effect of Different Laser Parameters on Surface Physical Characteristics and Corrosion Resistance of 20 Steel in Laser Cleaning. Appl. Sci. 2024, 14, 2058. [Google Scholar] [CrossRef]
  19. Harish, D.V.N.; Bharatish, A.; Murthy, H.N.; Anand, B.; Subramanya, K.N. Investigation of thermal residual stresses during laser ablation of tantalum carbide coated graphite substrates using micro-Raman spectroscopy and COMSOL multiphysics. Ceram. Int. 2020, 47, 3498–3513. [Google Scholar] [CrossRef]
  20. Zhou, H.; Zhou, H.; Zhao, Z.; Li, K.; Yin, J. Numerical Simulation and Verification of Laser-Polishing Free Surface of S136D Die Steel. Metals 2021, 11, 400. [Google Scholar] [CrossRef]
  21. Hu, P.; Yao, L.; Zhang, M.; Nie, Z.; Ji, E.; Lue, Q.; He, Z. Femtosecond laser micro-milling dental glass ceramics: An experimental analysis and COMSOL finite element simulation. Ceram. Int. 2020, 46, 22146–22153. [Google Scholar] [CrossRef]
  22. Zhang, G.; Hua, X.; Huang, Y.; Zhang, Y.; Li, F.; Shen, C.; Cheng, J. Investigation on mechanism of oxide removal and plasma behavior during laser cleaning on aluminum alloy. Appl. Surf. Sci. 2020, 506, 144666. [Google Scholar] [CrossRef]
  23. Raddadi, M.; Mohamed, M.S.; Mahdy, A.M.S.; EIBary, A.A.; Lotfy, K. Pulsed laser heating-induced generalized thermo-acoustic-elastic waves with two-temperature theory. Arch. Appl. Mech. 2024, 95, 3. [Google Scholar] [CrossRef]
  24. Tayel, M.I. Thermoelastic Response Induced by Volumetric Absorption of Uniform Laser Radiation in a Half-Space. Coatings 2020, 10, 228. [Google Scholar] [CrossRef]
  25. Zhao, W.; Gu, Y.; Yang, Z.; Zhang, Z. Thermoelastic Vibration of Nickel Film Irradiated by Femtosecond Laser: Molecular Dynamics Study. Coatings 2024, 15, 1. [Google Scholar] [CrossRef]
  26. Dong, H.; Li, J.; Li, Y.; Zhang, W.; Jin, G. Thermal stress analysis of laser cleaning of aluminum alloy oxide film. Appl. Opt. 2023, 62, 7805–7811. [Google Scholar] [CrossRef] [PubMed]
  27. Ranjbar-Nouri, Z.; Matthews, D.; Bolt, H.; De-Rooij, M. Insights in the wettability of hard chromium coated steel for cold rolling applications. Results Eng. 2024, 23, 102815. [Google Scholar] [CrossRef]
  28. Che, L.; Yanling, G. Flat-Top Line-Shaped Beam Shaping and System Design. Sensors 2022, 22, 4199. [Google Scholar]
  29. Fabbro, R.; Fournier, J.; Ballard, P.; Devaux, D.; Virmont, J. Physical study of laser-produced plasma in confined geometry. J. Appl. Phys. 1990, 68, 775–784. [Google Scholar] [CrossRef]
Figure 1. The microstructure and elemental composition of the uncleaned surface of the steel tyre mould (a) SEM surface morphology; (b) EDS energy spectrum; (c) coating thickness.
Coatings 15 00978 g001
Figure 2. Cleaning system and scanning path diagram: (a) laser cleaning system; (b) scanning path.
Coatings 15 00978 g002
Figure 3. Laser cleaning geometry and mesh model.
Coatings 15 00978 g003
Figure 4. Boundary condition diagram.
Coatings 15 00978 g004
Figure 5. Energy distribution of the light spot. (a) Spatial distribution of laser energy; (b) Spatial distribution of shock waves.
Coatings 15 00978 g005
Figure 6. Pulse function diagram.
Coatings 15 00978 g006
Figure 7. Cr coating change curves: (a) temperature change curve over time; (b) stress change curve over time; (c) displacement change curve over time; (d) temperature change curve with energy density; (e) stress change curve with energy density; (f) displacement change curve with energy density.
Coatings 15 00978 g007
Figure 8. Change curves under multiple pulse actions: (a) temperature change curve of Cr coating; (b) stress change curve of Cr coating; (c) displacement change curve of Cr coating; (d) sulphide stress change curve; (e) stress change curve of mould steel.
Coatings 15 00978 g008
Figure 9. Ablation depth at different energy densities: (a) 8.5 × 10 3 mJ/cm2; (b) 1.02 × 10 4 mJ/cm2; (c) 1.19 × 10 4 mJ/cm2; (d) 1.36 × 10 4 mJ/cm2; (e) 1.53 × 10 4 mJ/cm2.
Coatings 15 00978 g009
Figure 10. Material deformation under different pulse numbers: (a) 1 pulse; (b) 2 pulses; (c) 3 pulses; (d) 4 pulses; (e) 5 pulses; (f) 6 pulses.
Coatings 15 00978 g010
Figure 11. Microstructural morphology at different laser energy densities: (a) before cleaning; (b) original sample; (c) 8.5 × 10 3 mJ/cm2; (d) 1.02 × 10 4 mJ/cm2; (e) 1.19 × 10 4 mJ/cm2; (f) 1.36 × 10 4 mJ/cm2; (g) 1.53 × 10 4 mJ/cm2.
Coatings 15 00978 g011
Figure 12. Different pulse counts: (a) uncleaned; (b) original sample; (c) 2 pulses; (d) 3 pulses; (e) 4 pulses; (f) 5 pulses; (g) 6 pulses.
Coatings 15 00978 g012
Figure 13. Energy spectrum analysis at different laser energy densities: (a) before cleaning; (b) original sample; (c) 8.5 × 10 3 mJ/cm2; (d) 1.02 × 10 4 mJ/cm2; (e) 1.19 × 10 4 mJ/cm2; (f) 1.36 × 10 4 mJ/cm2; (g) 1.53 × 10 4 mJ/cm2.
Coatings 15 00978 g013
Figure 14. Energy spectrum analysis under different pulse laser exposure times: (a) before cleaning; (b) original sample; (c) 2 pulses; (d) 3 pulses; (e) 4 pulses; (f) 5 pulses; (g) 6 pulses.
Coatings 15 00978 g014
Figure 15. Trends in elemental content. (a) Different energy densities. (b) Different pulse application frequencies.
Coatings 15 00978 g015
Figure 16. Chromium coating thickness detection diagram.
Coatings 15 00978 g016
Figure 17. Removal mechanism distribution diagram. (a) low fluence; (b) appropriate fluenee; (c) high fluence.
Coatings 15 00978 g017
Table 1. Chemical composition of steel moulds.
ElementCSiMnPSCrFe
Content/wt%0.14–0.22≤0.30.3–0.650.0450.050.15–0.35Bal.
Table 2. Main technical parameters of flat-top pulsed lasers.
ParameterValue
Wavelength/nm1064
Average power/W≤500
Pulse Width/ns≤500
Frequency/kHz≤500
Scan Speed/mm·s−1≤20,000
Spot Diameter/um130
Table 3. Laser process parameters.
ParameterValue
Energy density/103 mJ·cm−28.5, 10.2, 11.9, 13.6, 15.3
Pulse Width/ns100
Frequency/kHz10
Pulse count1, 2, 3, 4, 5, 6
Table 4. Material properties.
ParameterValue
Density ρ R / ( kg · m 3 ) 957 + 1.31 × T 5.15 × 10 3 × T 2 + 4.5 × 10 6 × T 3 ,   273 K T 473 K ;  
790 + 2.97 × T 6.88 × 10 3 × T 2 + 4 × 10 6 × T 3 ,   473 K T
Specific heat capacity c / ( J · k g 1 · K 1 ) 82.03 + 7.55 × T ,   80 K T 185 K ;  
536,131.735 5774.02 × T 1 + 15.59 × T 2 ,   185 K T 195 K ;  
4.89 × 10 6 7.05 × 10 4 × T 1 + 3.4 × 10 2 × T 2 0.55 × T 3 ,   195 K T 210 K ;  
2.84 × 10 4 3.25 × 10 2 × T 1 + 1.29 × T 2 1.67 × 10 3 × T 3 ,   210 K T 300 K ;  
1.91 × 10 6 K T
Thermal conductivity coefficient κ / ( W · m 1 · K 1 ) 4.76 × 10 2 + 6.84 × 10 4 × T ,   60 K 190 K ;  
0.77 5.7 × 10 3 × T 1 + 1.67 × 1 0 5 × T 2 1.59 × 10 8 × T 3 ,   190 K T 300 K ;  
0.13 K T
Decomposition temperature T b / K 740 K
Laser absorption rate α 0.25
Surface emissivity ε 0.7
Stefan–Boltzmann constant ρ / ( W · m 2 · K 4 ) 5.67 × 10 8
Coefficient of thermal expansion γ / K 5.4 × 10 4 + 2 × 10 7 × T ,   300 K T 550 K ;  
1.25 × 10 3 8 × 10 7 × T + 5 × 10 10 × T 2 ,   550 K T 700 K ;  
5 × 10 6 ,   700 K T
Young’s modulus E R / ( Pa ) 0.06 [ GPa ]
Poisonby 0.8
Density ρ C / ( k g · m 3 ) 7850
Young’s modulus E C / ( P a ) 205 [ G P a ]
h 10 W / ( m 2 · K )
Disclaimer/Publisher’s Note: The statements, opinions and data contained in all publications are solely those of the individual author(s) and contributor(s) and not of MDPI and/or the editor(s). MDPI and/or the editor(s) disclaim responsibility for any injury to people or property resulting from any ideas, methods, instructions or products referred to in the content.