1. Introduction
The aero-engine, regarded as the “heart” of an aircraft, provides the necessary propulsion for flight. The efficiency of the engine is highly dependent on the turbine inlet gas temperature. Higher temperatures generally lead to improved turbine efficiency. In recent years, with increasing demands for enhanced engine performance, the thrust-to-weight ratio and compressor pressure ratio of aero-engines have risen significantly, pushing the turbine inlet temperature beyond 2000 K. As a critical hot-section component, turbine blades rely on advanced cooling technologies to ensure safe and reliable operation. Modern turbine blades typically employ an integrated cooling approach, combining external film cooling with internal multi-passage cooling to reduce blade temperature. Hollow turbine blades have undergone significant advancements in cooling techniques, evolving from simple convection cooling to more sophisticated methods, such as impingement cooling, film cooling, and integrated cooling systems. The internal cooling passages have become increasingly complex and refined.
Although the internal cooling channels of hollow blades operate at lower temperatures compared to the blade external surfaces, the walls of these cooling passages can still reach temperatures as high as several hundred degrees Celsius due to engine operating conditions and the gradual heating of the cooling air [
1,
2]. Under the combined effects of high-temperature cooling air and fine particulate erosion, traditional nickel-based superalloy blades may experience severe oxidation, corrosion, and erosion, which significantly impact the service life of turbine cooling blades. To ensure the mechanical properties and strength of gas turbine hollow blades under high-temperature service conditions, it is necessary to prepare high-temperature protective coatings on the surface of the internal gas flow channels within the blades. Aluminide coatings are widely applied to turbine blades because of their simple preparation process, low cost, and mature technology [
3,
4]. Considering the intricate geometry, narrowness, and elongated pathways of internal cooling channels, chemical vapor deposition (CVD) has become a key method for depositing aluminide coatings in complex cooling passages compared to traditional pack cementation, physical vapor deposition (PVD), and plasma spraying (PS) techniques.
CVD technology, as an advanced, mature, and highly efficient material preparation method, has been widely applied in modern thin-film materials, such as powder materials, novel crystalline materials, optoelectronic materials, and refined metals [
5,
6]. CVD primarily involves the deposition reaction of precursors on substrates, though the underlying principles vary for different material types [
7,
8]. Since the 1980s, the United States has initiated research on thermal barrier coating processes and technologies for cooling channels [
9], mastering aluminide coating technology [
10] and its preparation methods [
11,
12] for cooling channels. Researchers Li et al. [
13] and Zhang et al. [
14] conducted CVD experiments to prepare internal aluminide coatings on cooling channel walls, investigating the surface morphology, elemental composition, and oxidation/corrosion resistance of the coatings in hollow blade cavities. Cui et al. [
15] found that slower process gas flow rates resulted in greater average coating thickness but also increased thickness variation along the flow direction. By comparing coating thickness and elemental variations before and after heat treatment, the inner cavity exhibited thicker coatings than the outer cavity surface, while the outer cavity demonstrated better coating uniformity. The deposition quality of CVD products is determined by two critical factors, namely, the flow characteristics of the flow field and the composition of precursor components, which are determined by the reactor structure and the relevant process parameters.
Since CVD reactors for preparing aluminide coatings typically operate under negative pressure in enclosed spaces, certain parameters and the distribution of flow fields within the reactor cannot be directly observed or precisely measured with instruments. Moreover, it is time-consuming and inefficient to identify optimal process parameters through CVD experiments. CFD simulation has become an important tool for the design and improvement of CVD reaction chambers, significantly reducing the development cost and cycle time for new CVD reactor configurations. A considerable number of researchers worldwide have incorporated computational fluid dynamics (CFD) into CVD experimental studies [
16,
17,
18,
19]. Some have focused on using CFD to simulate changes in physical field distributions within reactors, with the results applied to optimize CVD processes [
20,
21].
Suraya et al. [
22] employed CFD to numerically simulate gas flow processes in two CVD reactors for carbon nanotube-coated carbon fiber production, and structural design improvements were provided by comparing results. Alejandro et al. [
23] conducted CFD-based numerical solutions for coupled steady-state laminar flow and heat transfer of reaction precursors to predict carbon nanotube deposition rates in CVD reactors by optimizing overall process parameters. Mostafa et al. [
24] investigated fluid dynamics and heat transfer within CVD reactors. They analyzed the effects of temperature, gas flow velocity, and precursor vapor composition on the catalytic growth of multi-walled carbon nanotubes, thereby identifying optimal precursor flow ranges to optimize experimental operating conditions. Praryush et al. [
25] simulated temperature fields, velocity profiles, and concentration distributions within reactors to examine natural convection’s influence on heat transfer and endothermic benzene decomposition, ultimately optimizing CVD processes to achieve uniform carbon nanofiber growth.
Studies have demonstrated that multiple factors, including CVD reactor geometry, internal pressure, reaction temperature, precursor flow rate, and elemental composition, directly influence the chemical reaction process within cooling channels, as well as the thickness and surface characteristics of coating products on channel walls.
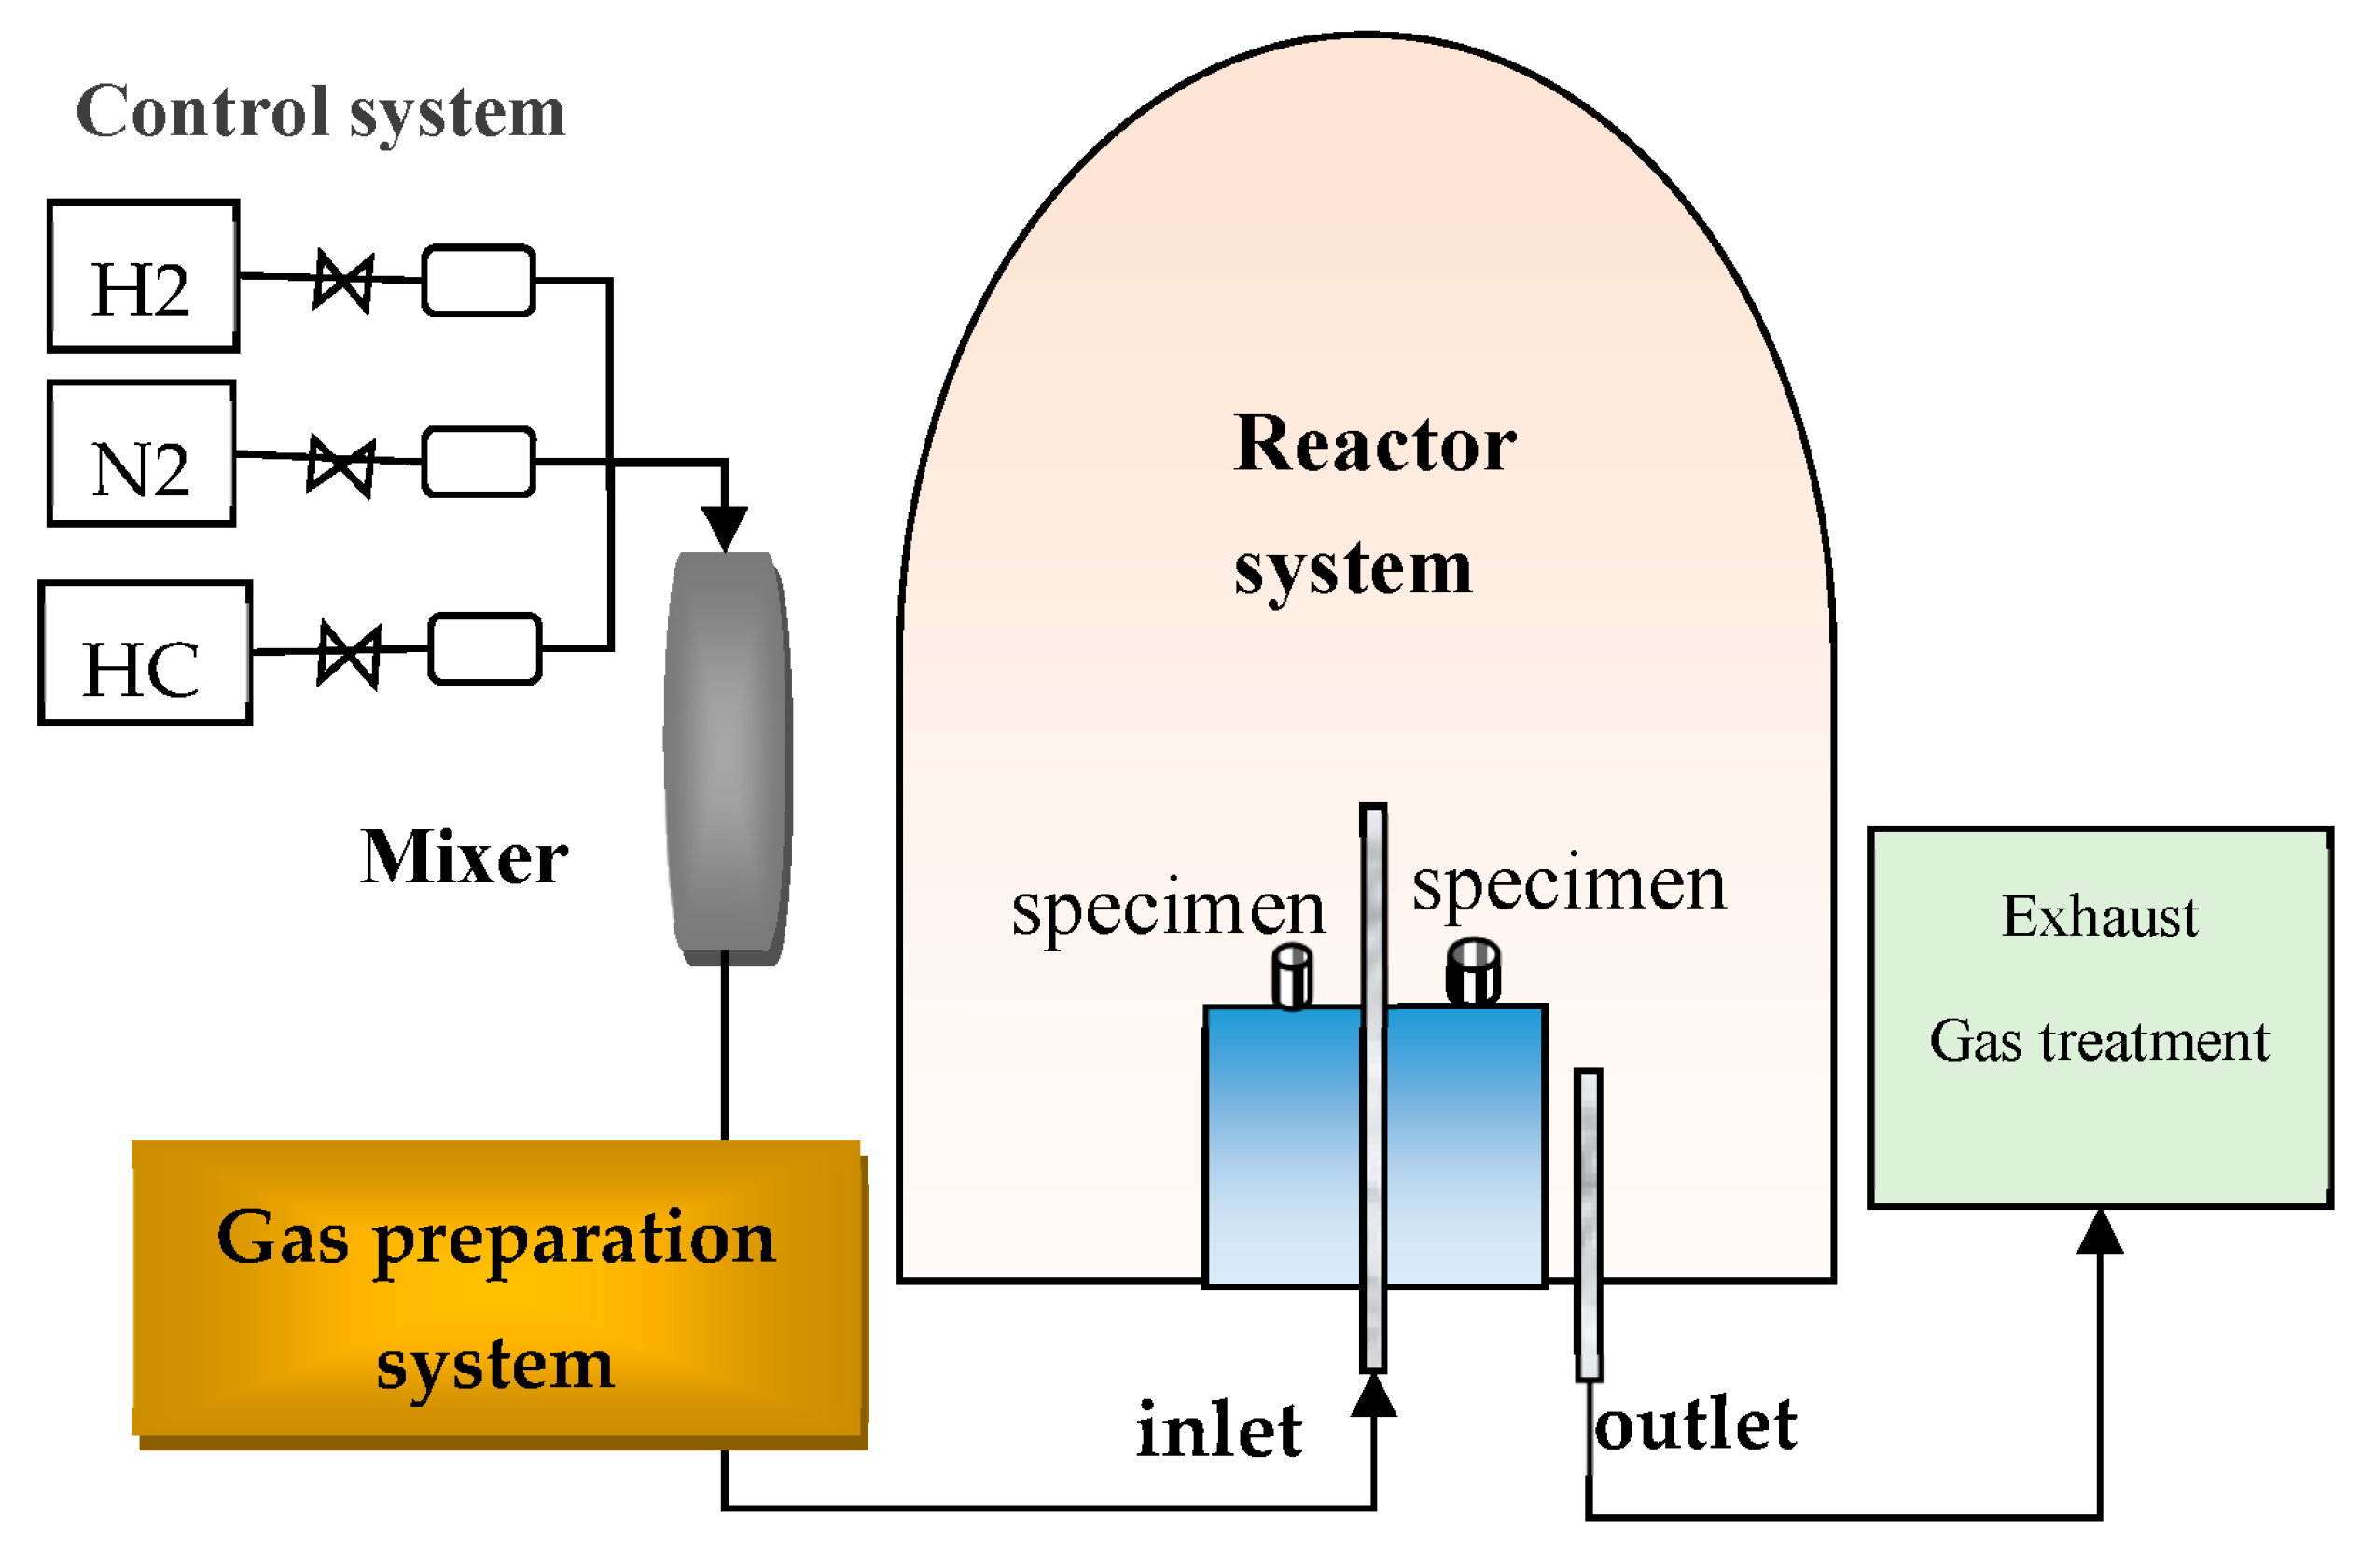
This work focuses on the influence of the structural configuration of CVD reactors and process parameters on the chemical reactions involved in aluminide deposition. A computational fluid dynamics simulation is conducted to simulate the chemical reaction process of aluminide coating formation within CVD reactors. The effects of outlet position, gas inlet velocity, reaction temperature, and pressure on aluminide coating formation are analyzed with the aim of guiding the optimization of CVD preparation processes.
This work mainly introduces a simulation of the chemical vapor deposition process by the simulation method and conducts a preliminary analysis of the influence of the CVD reactor structure and process parameters. The types of structural models studied are few and simple, and the obtained flow field and sample surface deposition distribution effect are not ideal. It only provides a guiding idea for CVD equipment optimization, and further validation and optimization of the model are needed to improve the deposition quality and efficiency.
3. Analysis of Flow Field
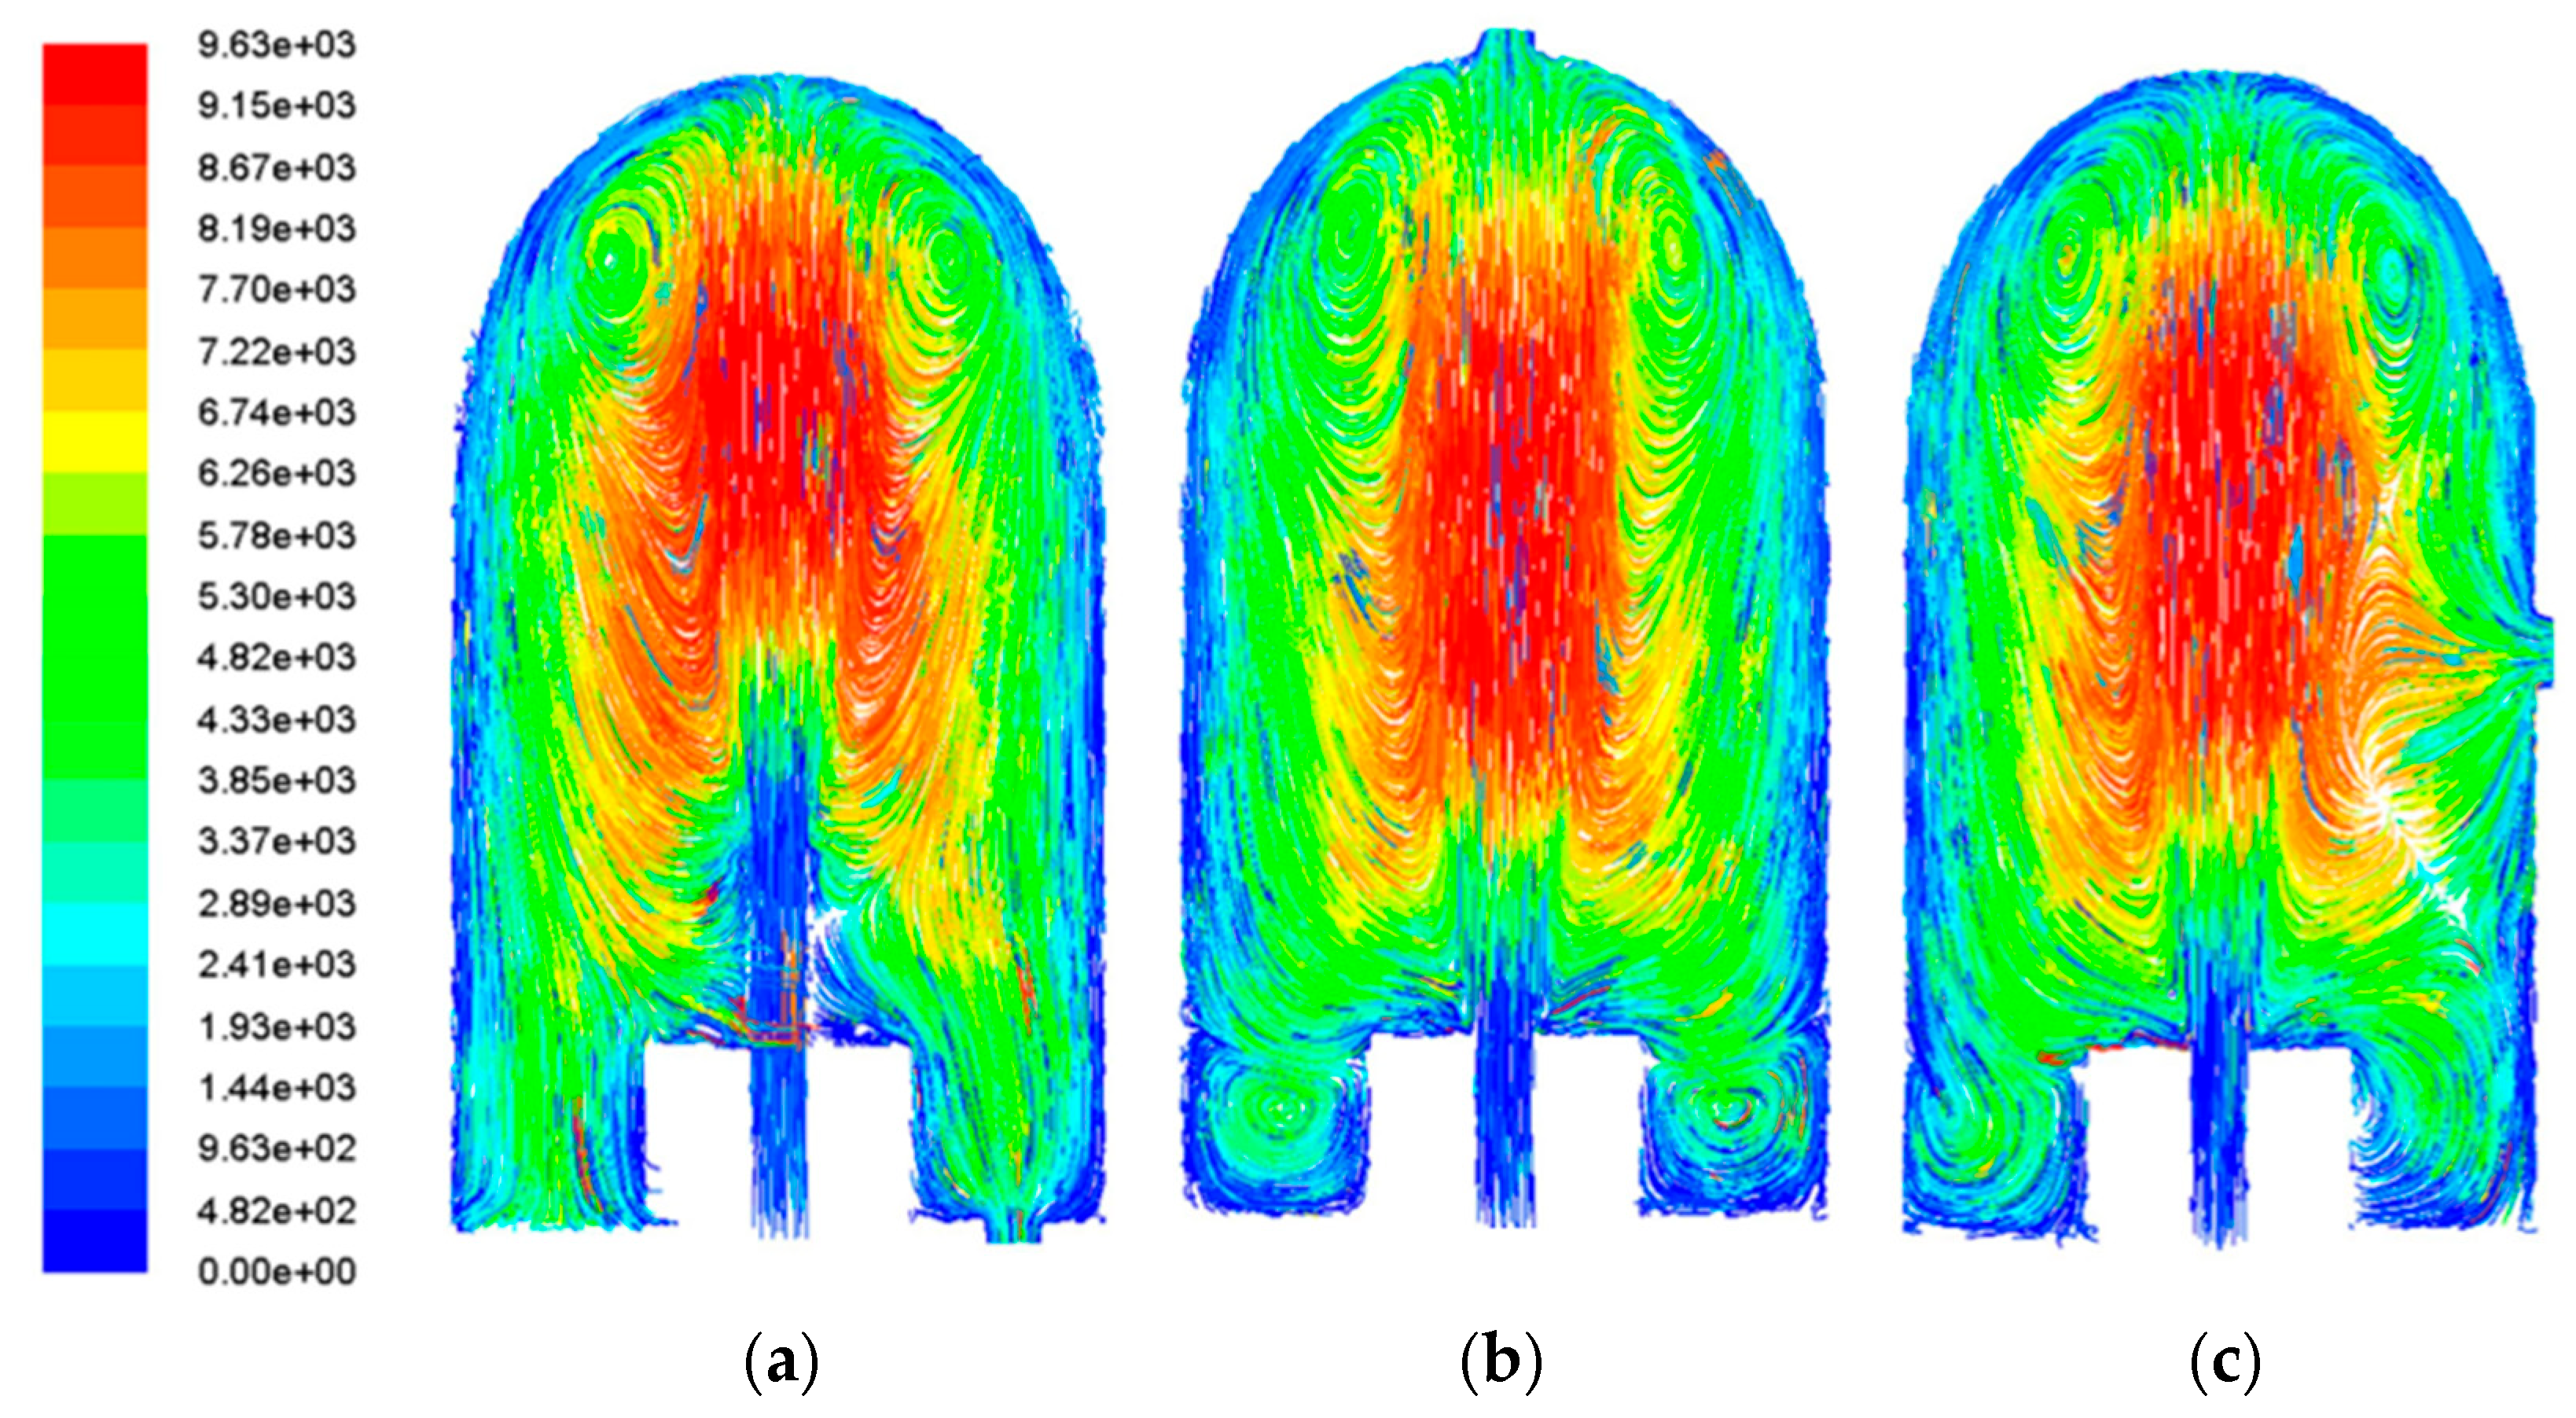
This section compares the gas particle trajectory diagrams and flow field velocity distributions of three different CVD reactor configurations, as illustrated in
Figure 3 and
Figure 4. In Model A, the incoming gas gradually decelerates along the vertical direction (Y-axis) after entering through the inlet. Except for localized high-velocity zones in the central region and top edges, the flow remains relatively slow throughout most areas. The particle trajectory diagram indicates stable flow conditions with only two vortex regions near the top and no significant vortices observed in the bottom region.
Model B demonstrates markedly different behavior: a portion of the gas flows directly toward the outlet at high velocity without sufficient deceleration in the central region, while the remaining flow maintains low velocities. The trajectory diagram reveals extensive vortex formation in these low-velocity zones. The effective deposition area is limited to the high-velocity central region, which not only reduces equipment utilization per deposition experiment but may also cause coating non-uniformity or failed deposition reactions due to excessive flow velocities. Additionally, another gas portion forms large-scale vortices in both side regions of the reactor, creating significant flow non-uniformity. As these areas are proximate to the sample, the resulting flow instability adversely affects deposition quality.
Model C exhibits gas flow entering through the inlet and exiting via the mid-right outlet. While localized high-velocity regions exist in the central and top areas, most of the reactor maintains low flow velocities. However, the particle trajectory diagram shows that the close proximity between the inlet and outlet causes flow disturbances in the central and top regions, generating vortices of varying intensity at the top, middle, and bottom sections of the flow field.
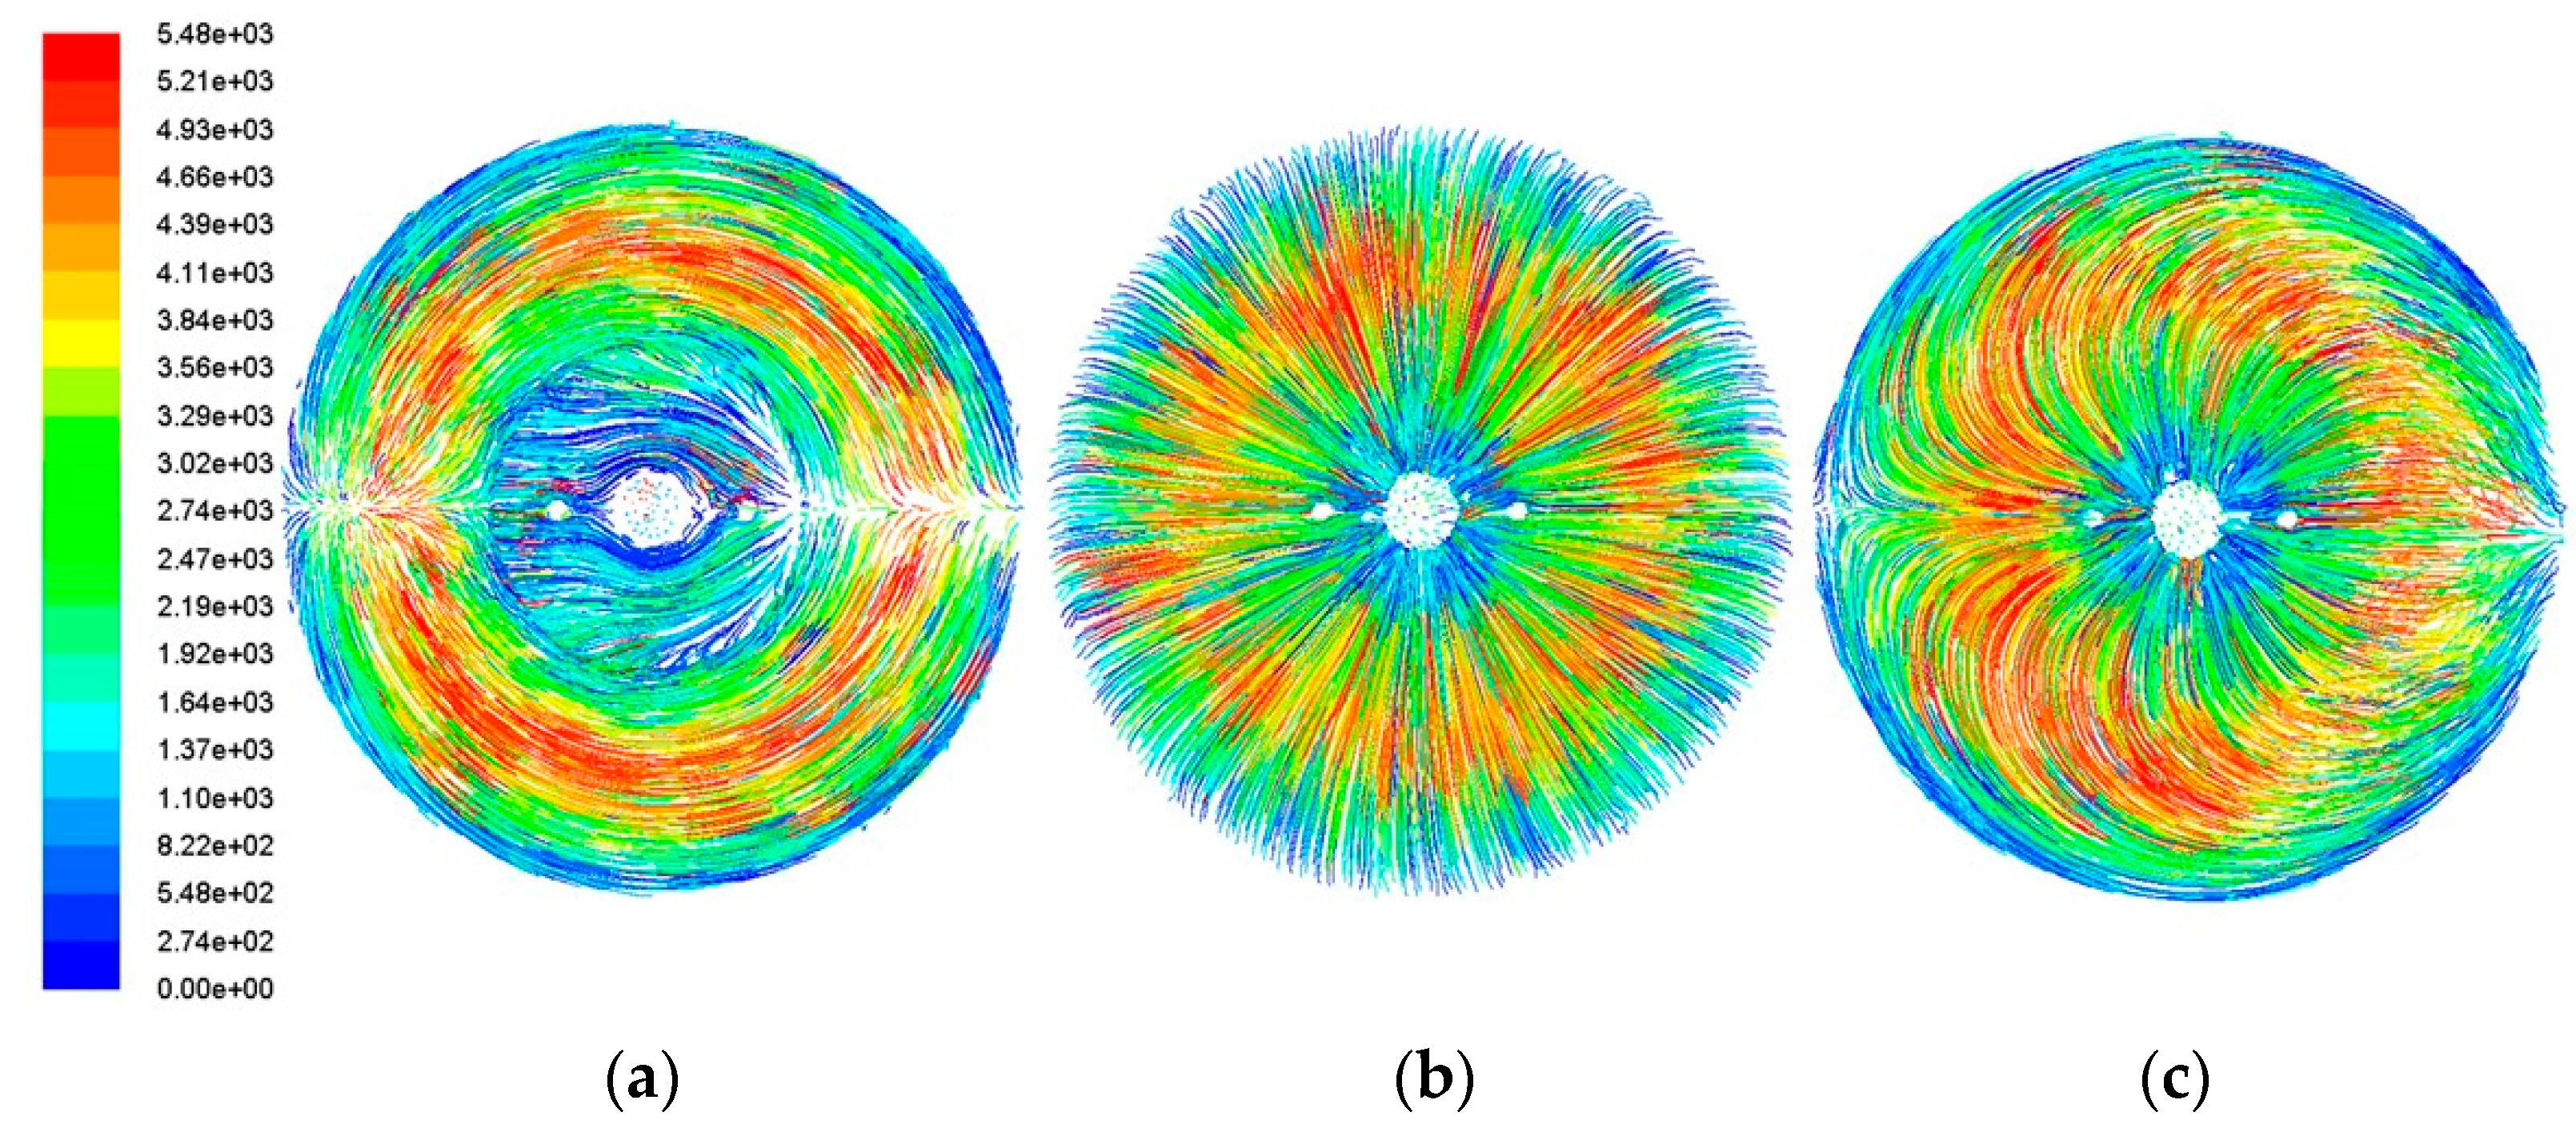
The horizontal cross-sectional particle trajectory diagrams in
Figure 5 reveal distinct flow patterns among the three models. It can be observed that, in Model A, the central gas exhibits a relatively slow velocity variation while the outer particle trajectories form concentric rings. Within these ring-shaped trajectories, the particle velocity changes from the inner to the outer regions—initially slow, then accelerating, before decelerating again. In Model 2, the particle trajectories in this cross-section generally radiate outward. The velocity profile shows an initial increase from the inner to the outer regions, followed by a subsequent decrease. Model 3 displays an overall lotus-shaped trajectory pattern. Gas particles move upward and downward, originating from the model’s center and terminating at the far-right boundary.
A comparison of the results from the three structures reveals that Model A exhibits a significantly larger stable deposition zone and relatively minor flow velocity variations around the specimen compared to the other two models. These characteristics are more conducive to forming a uniform aluminide coating on the structural surface. Subsequent research will focus on investigating the factors influencing chemical vapor deposition on the specimen surface based on Model A.
4. Analysis of Chemical Reactions on the Specimen Surface
4.1. Inlet Velocity Effect
The inlet flow velocity plays a critical role in determining the quantity of reactants passing through the reactor per unit time and significantly influences the aluminide deposition process. This study examines chemical reaction rates on specimen surfaces at varying initial inlet velocities.
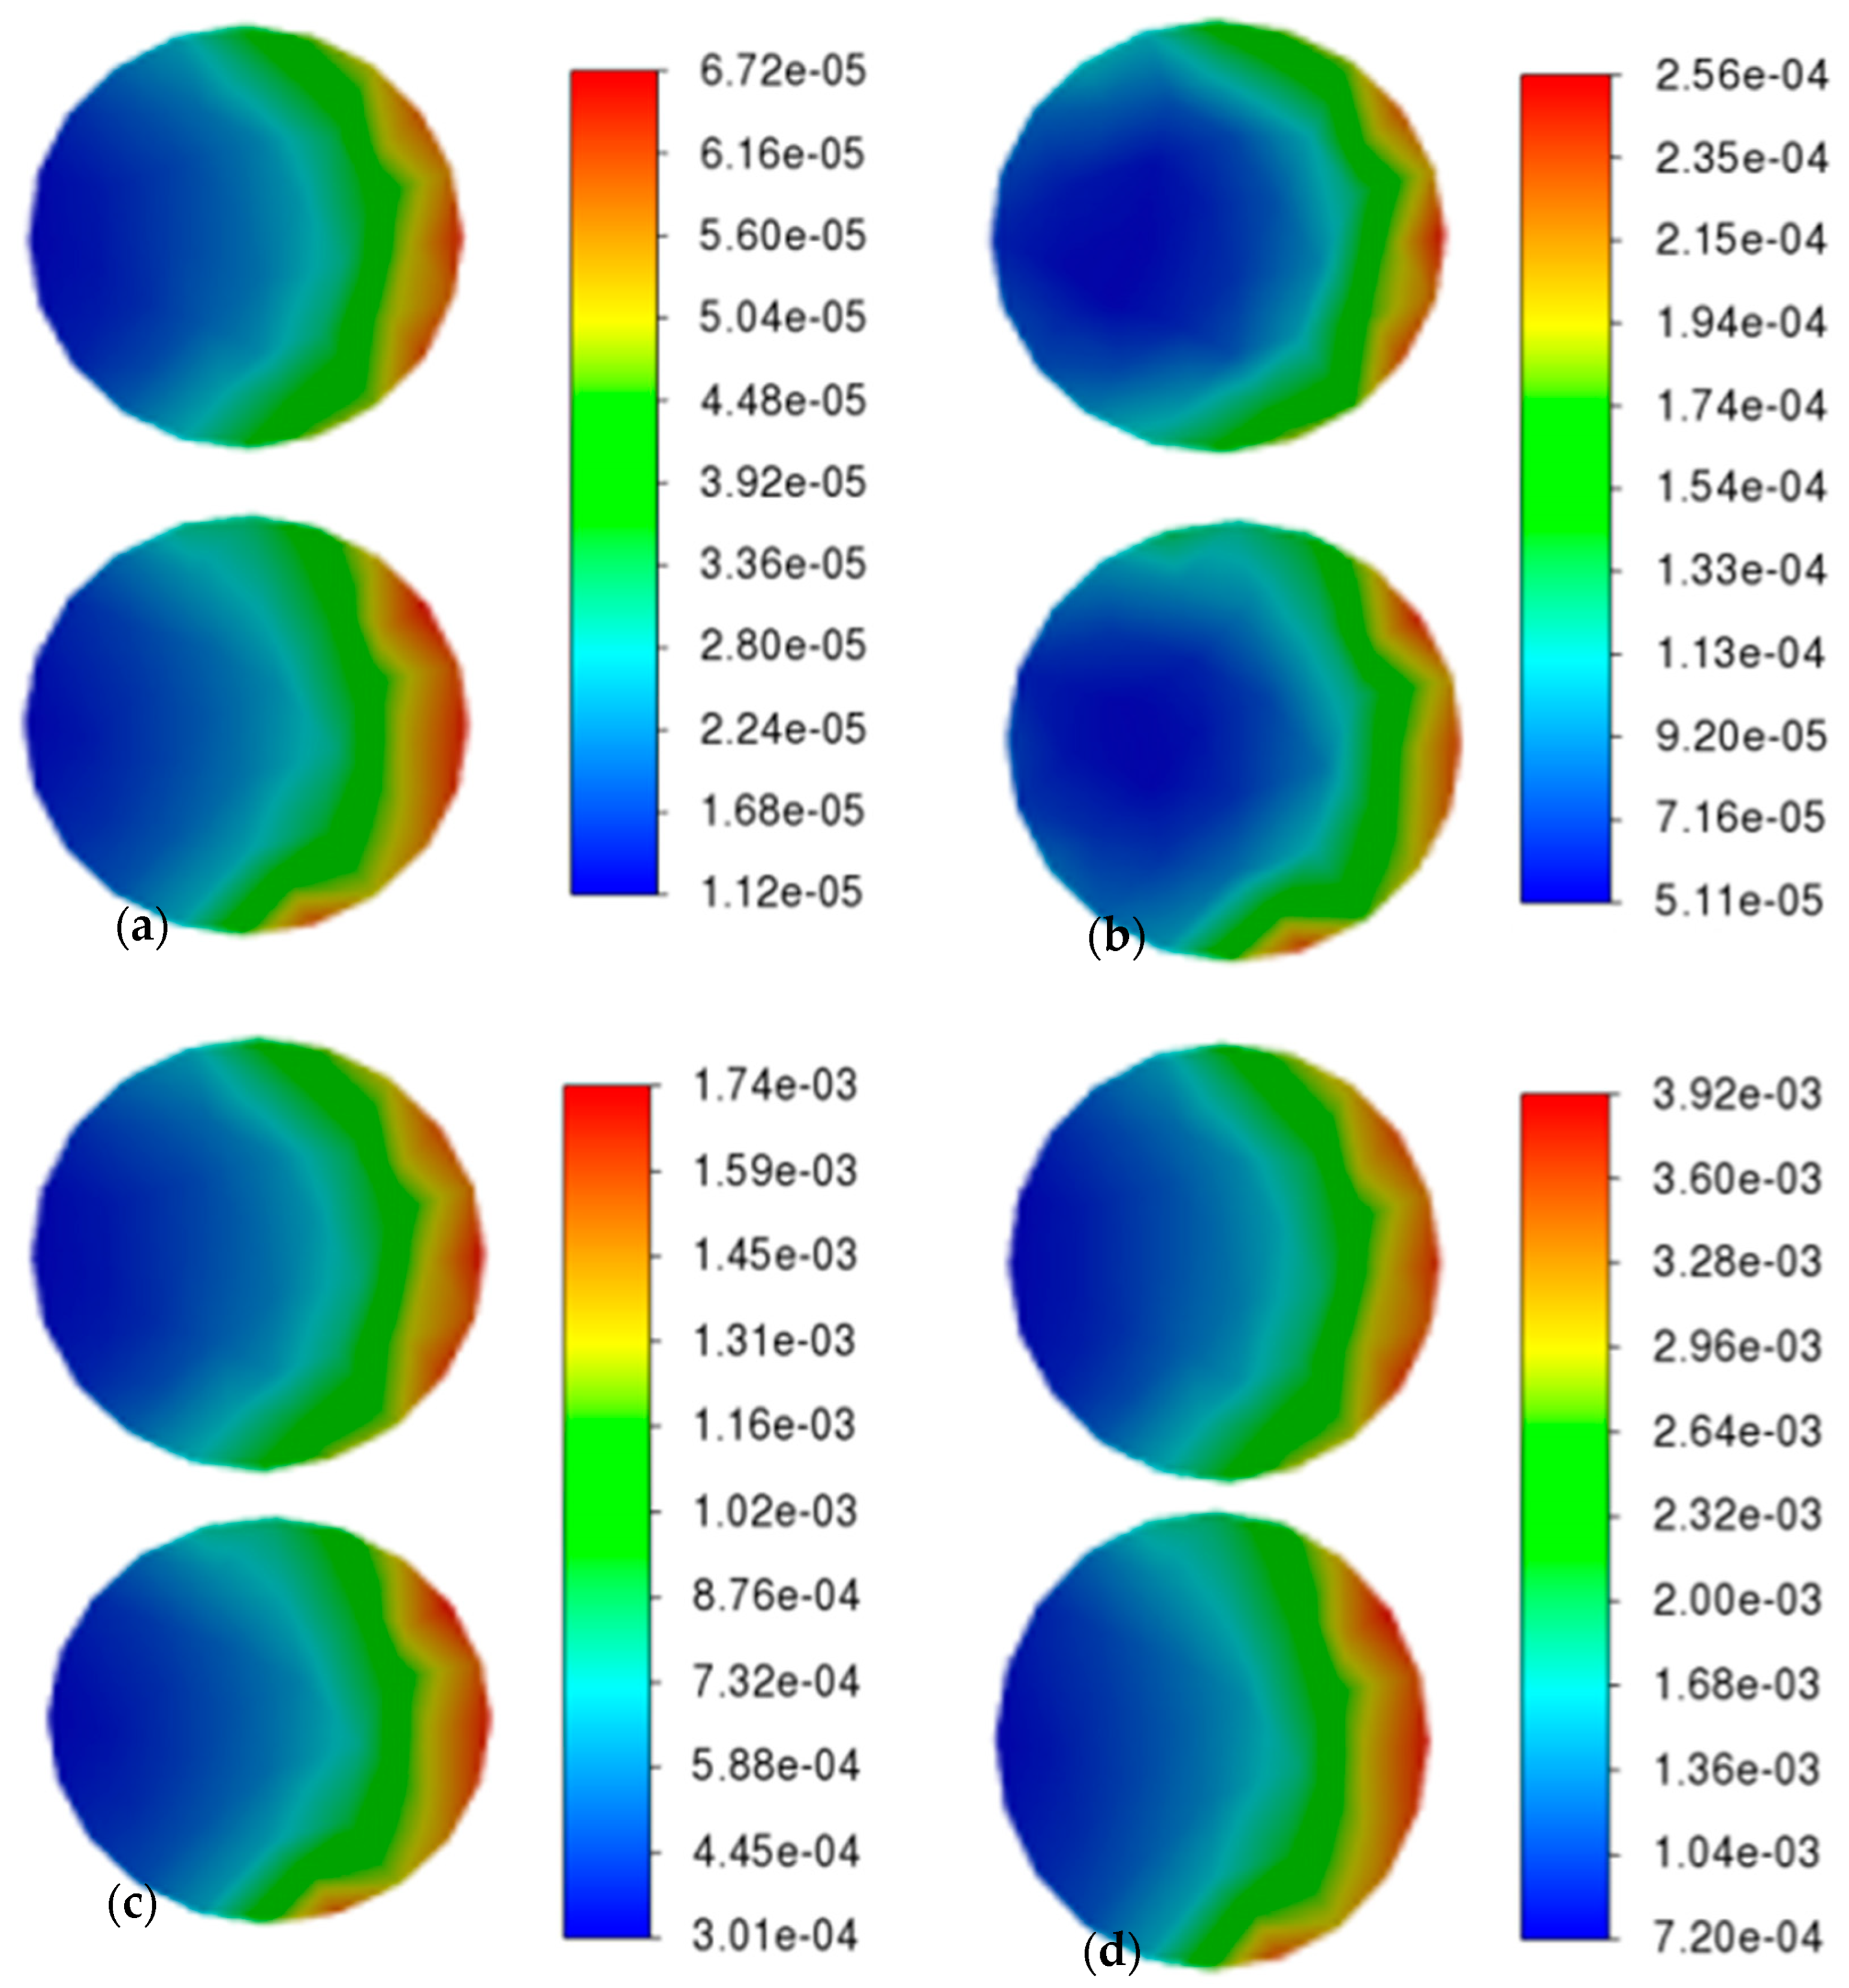
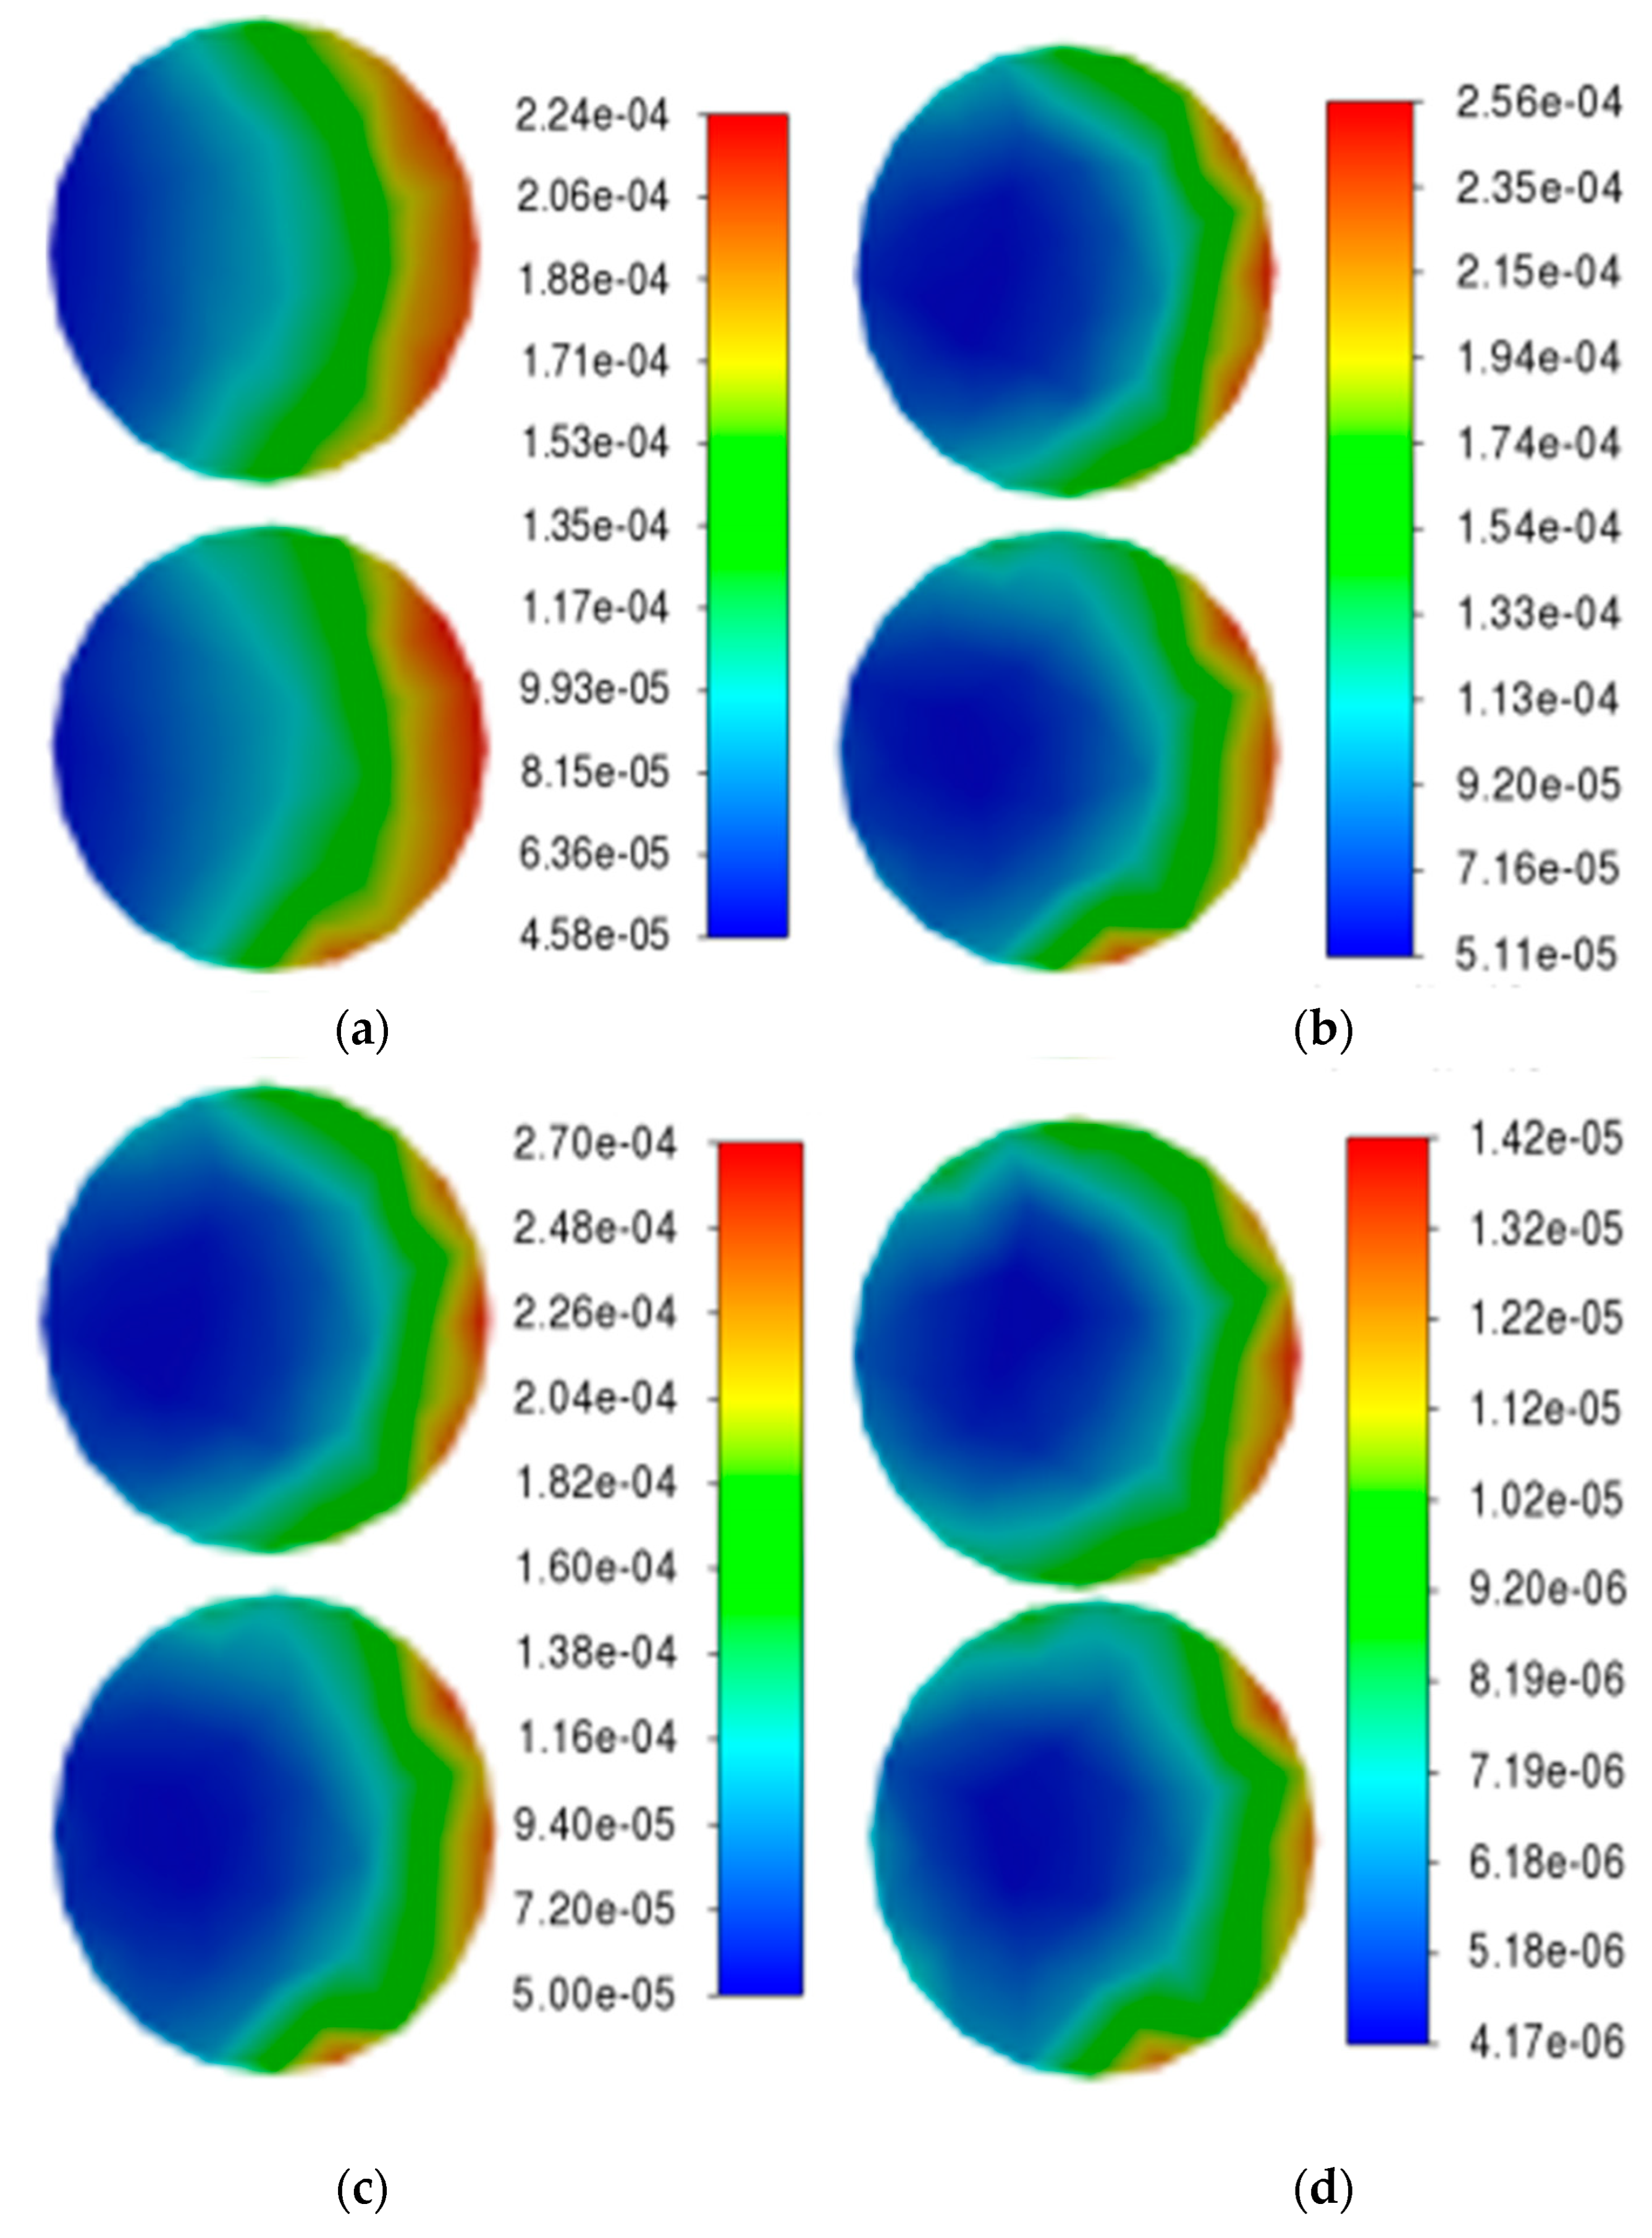
The variation in the reaction rate on the specimen surface with the inflow velocity (0.0065 m/s, 0.065 m/s, 0.65 m/s, 6.5 m/s) is demonstrated in
Figure 6. The two specimens on the left and right sides of the reactor are arranged vertically. As can be observed from the figure, the distribution of chemical reaction rates on the specimen surfaces is non-uniform. The edge region of the specimen closer to the outlet exhibits significantly higher reaction rates, whereas areas farther from the outlet demonstrate lower rates. With increasing inlet velocity, both the maximum and minimum reaction rates show notable enhancement.
Based on the research conducted by Zhang et al. [
27], this paper selects the empirical average flow velocity at the inlet Vi and analyzes the effect of inlet velocity on the chemical deposition reaction rate.
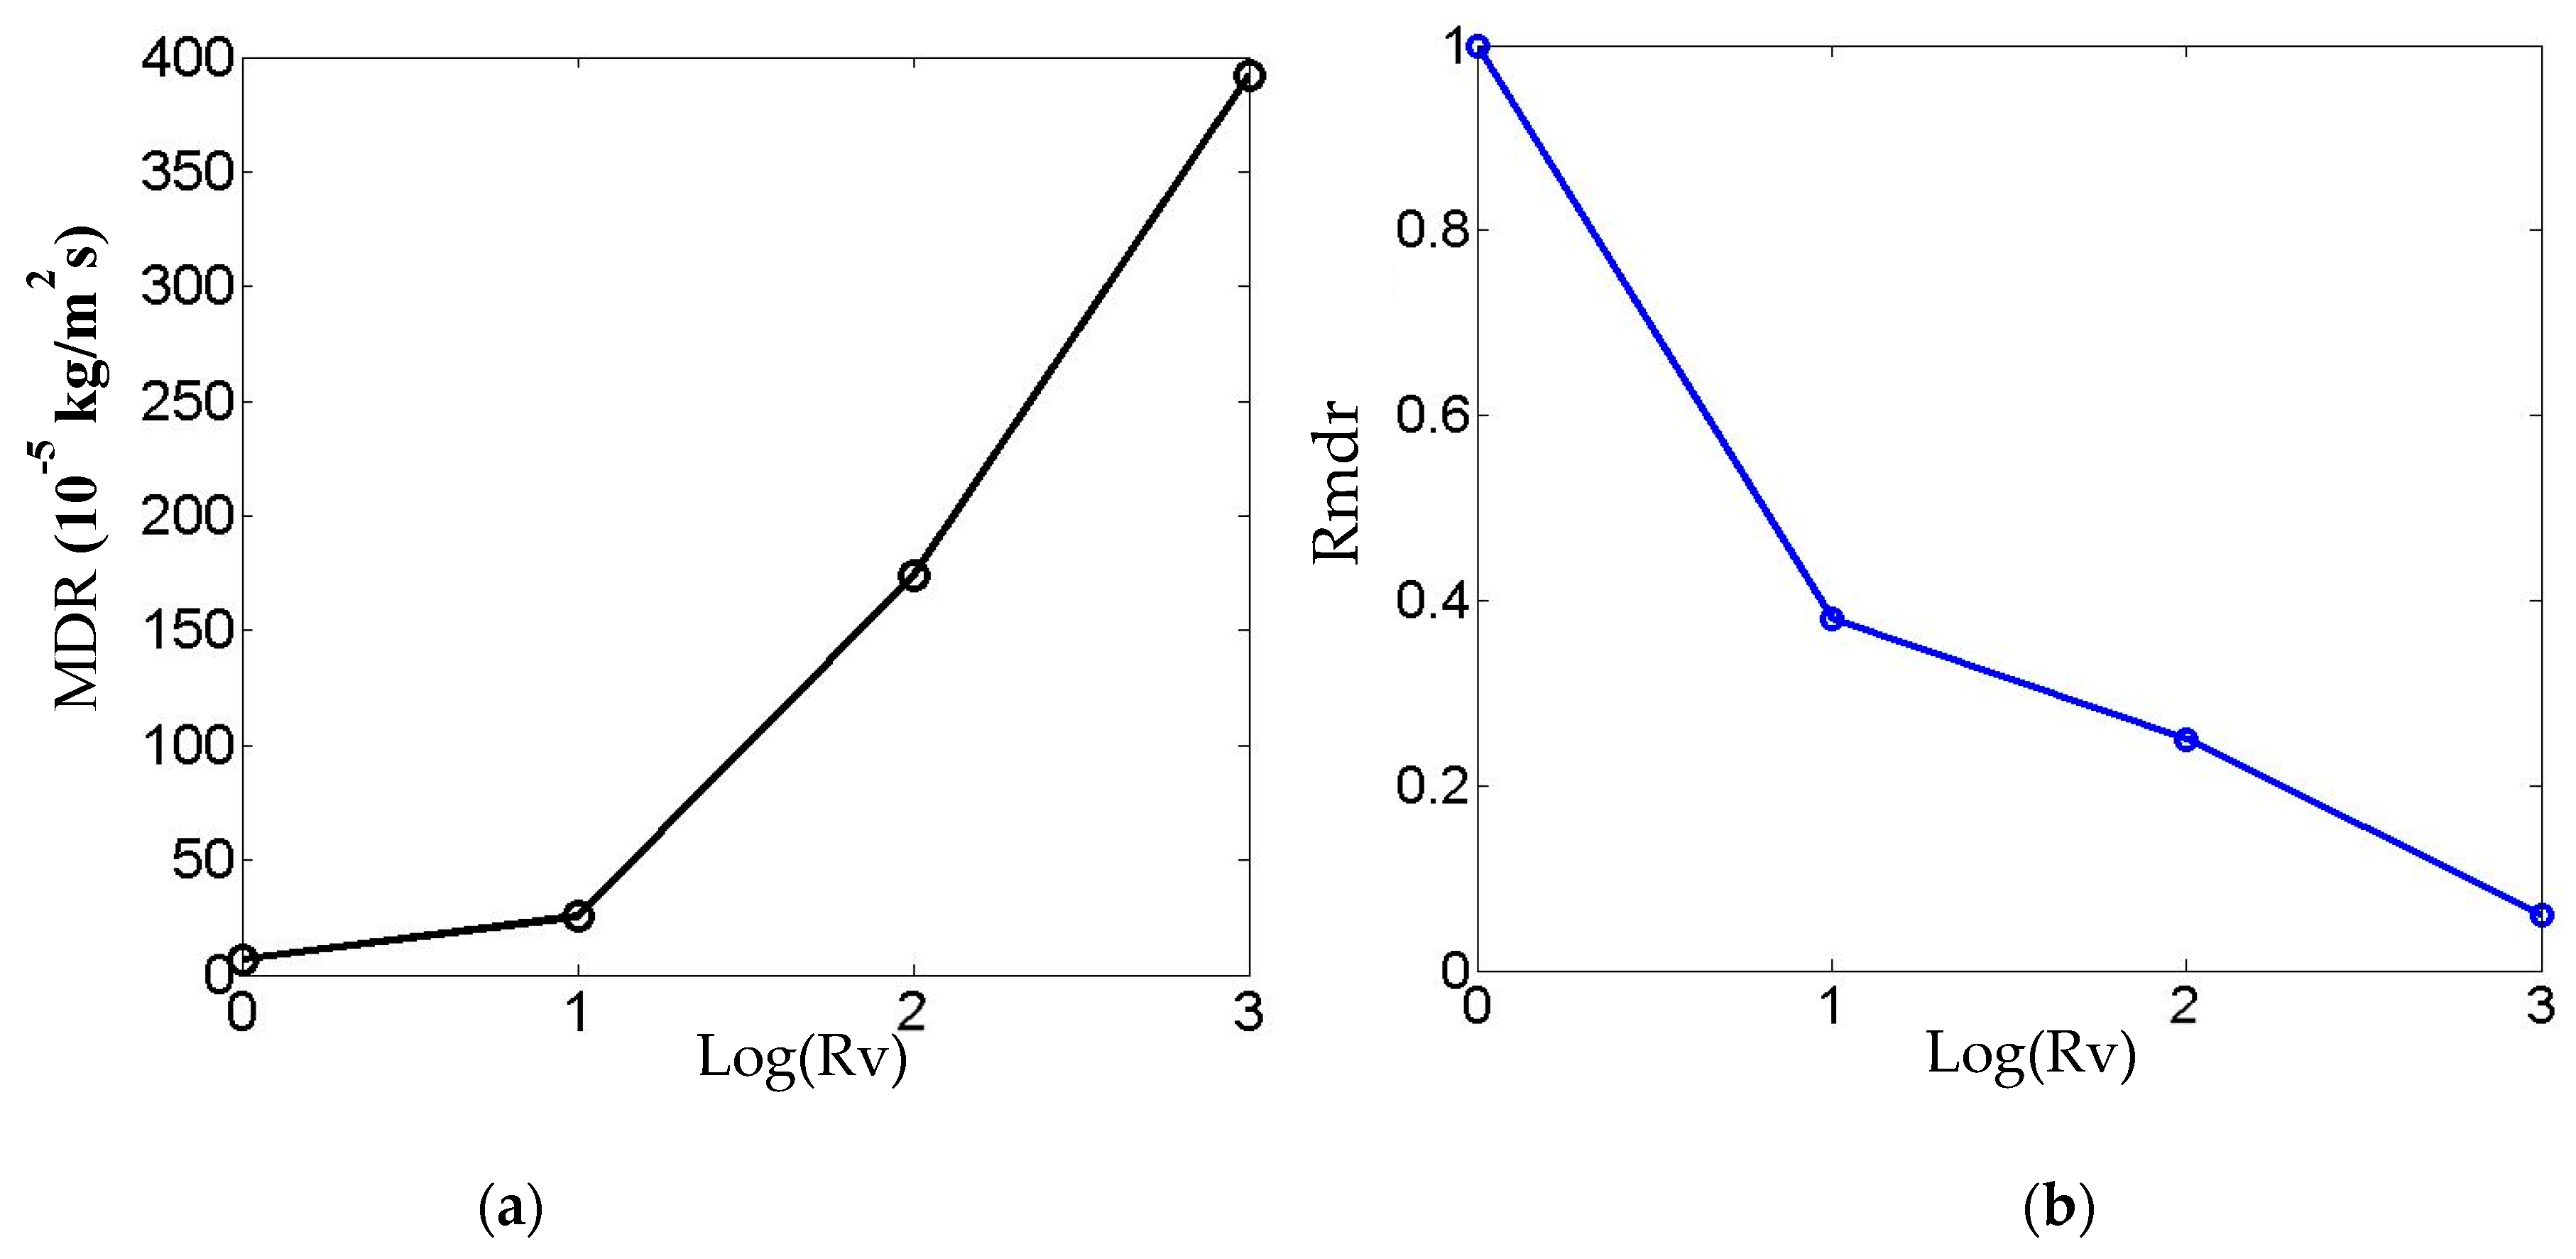
Figure 7a shows that the maximum deposition rate (MDR) on the sample surface increases with the inlet velocity.
Figure 7b shows the relative value of the maximum deposition rate compared to that obtained from the minimum inlet velocity Vimin = 0.0065 m/s. The horizontal coordinate represents the logarithmic value of the dimensionless inlet velocity ratio Rv = Vi/Vimin, and the vertical coordinates demonstrate the relative maximum deposition rate value Rmdr representing the maximum deposition rate at each inlet velocity divided by the one at Vimin = 0.0065 m/s. As illustrated in
Figure 7b, while increasing the inlet flow rate enhances the absolute deposition rate, the relative deposition rate exhibits a declining trend. Considering both material utilization efficiency and the surface chemical reaction rate of the specimen, an inlet velocity of 0.065 m/s is selected as the standard flow velocity for subsequent comparative analysis under other experimental conditions.
4.2. Temperature Influence
As one of the most critical parameters governing coating deposition, reaction temperature significantly influences the formation rate of aluminide coatings on specimen surfaces. This study investigates temperature effects under fixed conditions of 0.065 m/s inlet velocity and standard atmospheric pressure, with ten temperature gradients (653 K, 853 K, 1053 K, 1153 K, 1203 K, 1253 K, 1278 K, 1303 K, 1353 K, and 1453 K) systematically selected to evaluate thermal impacts.
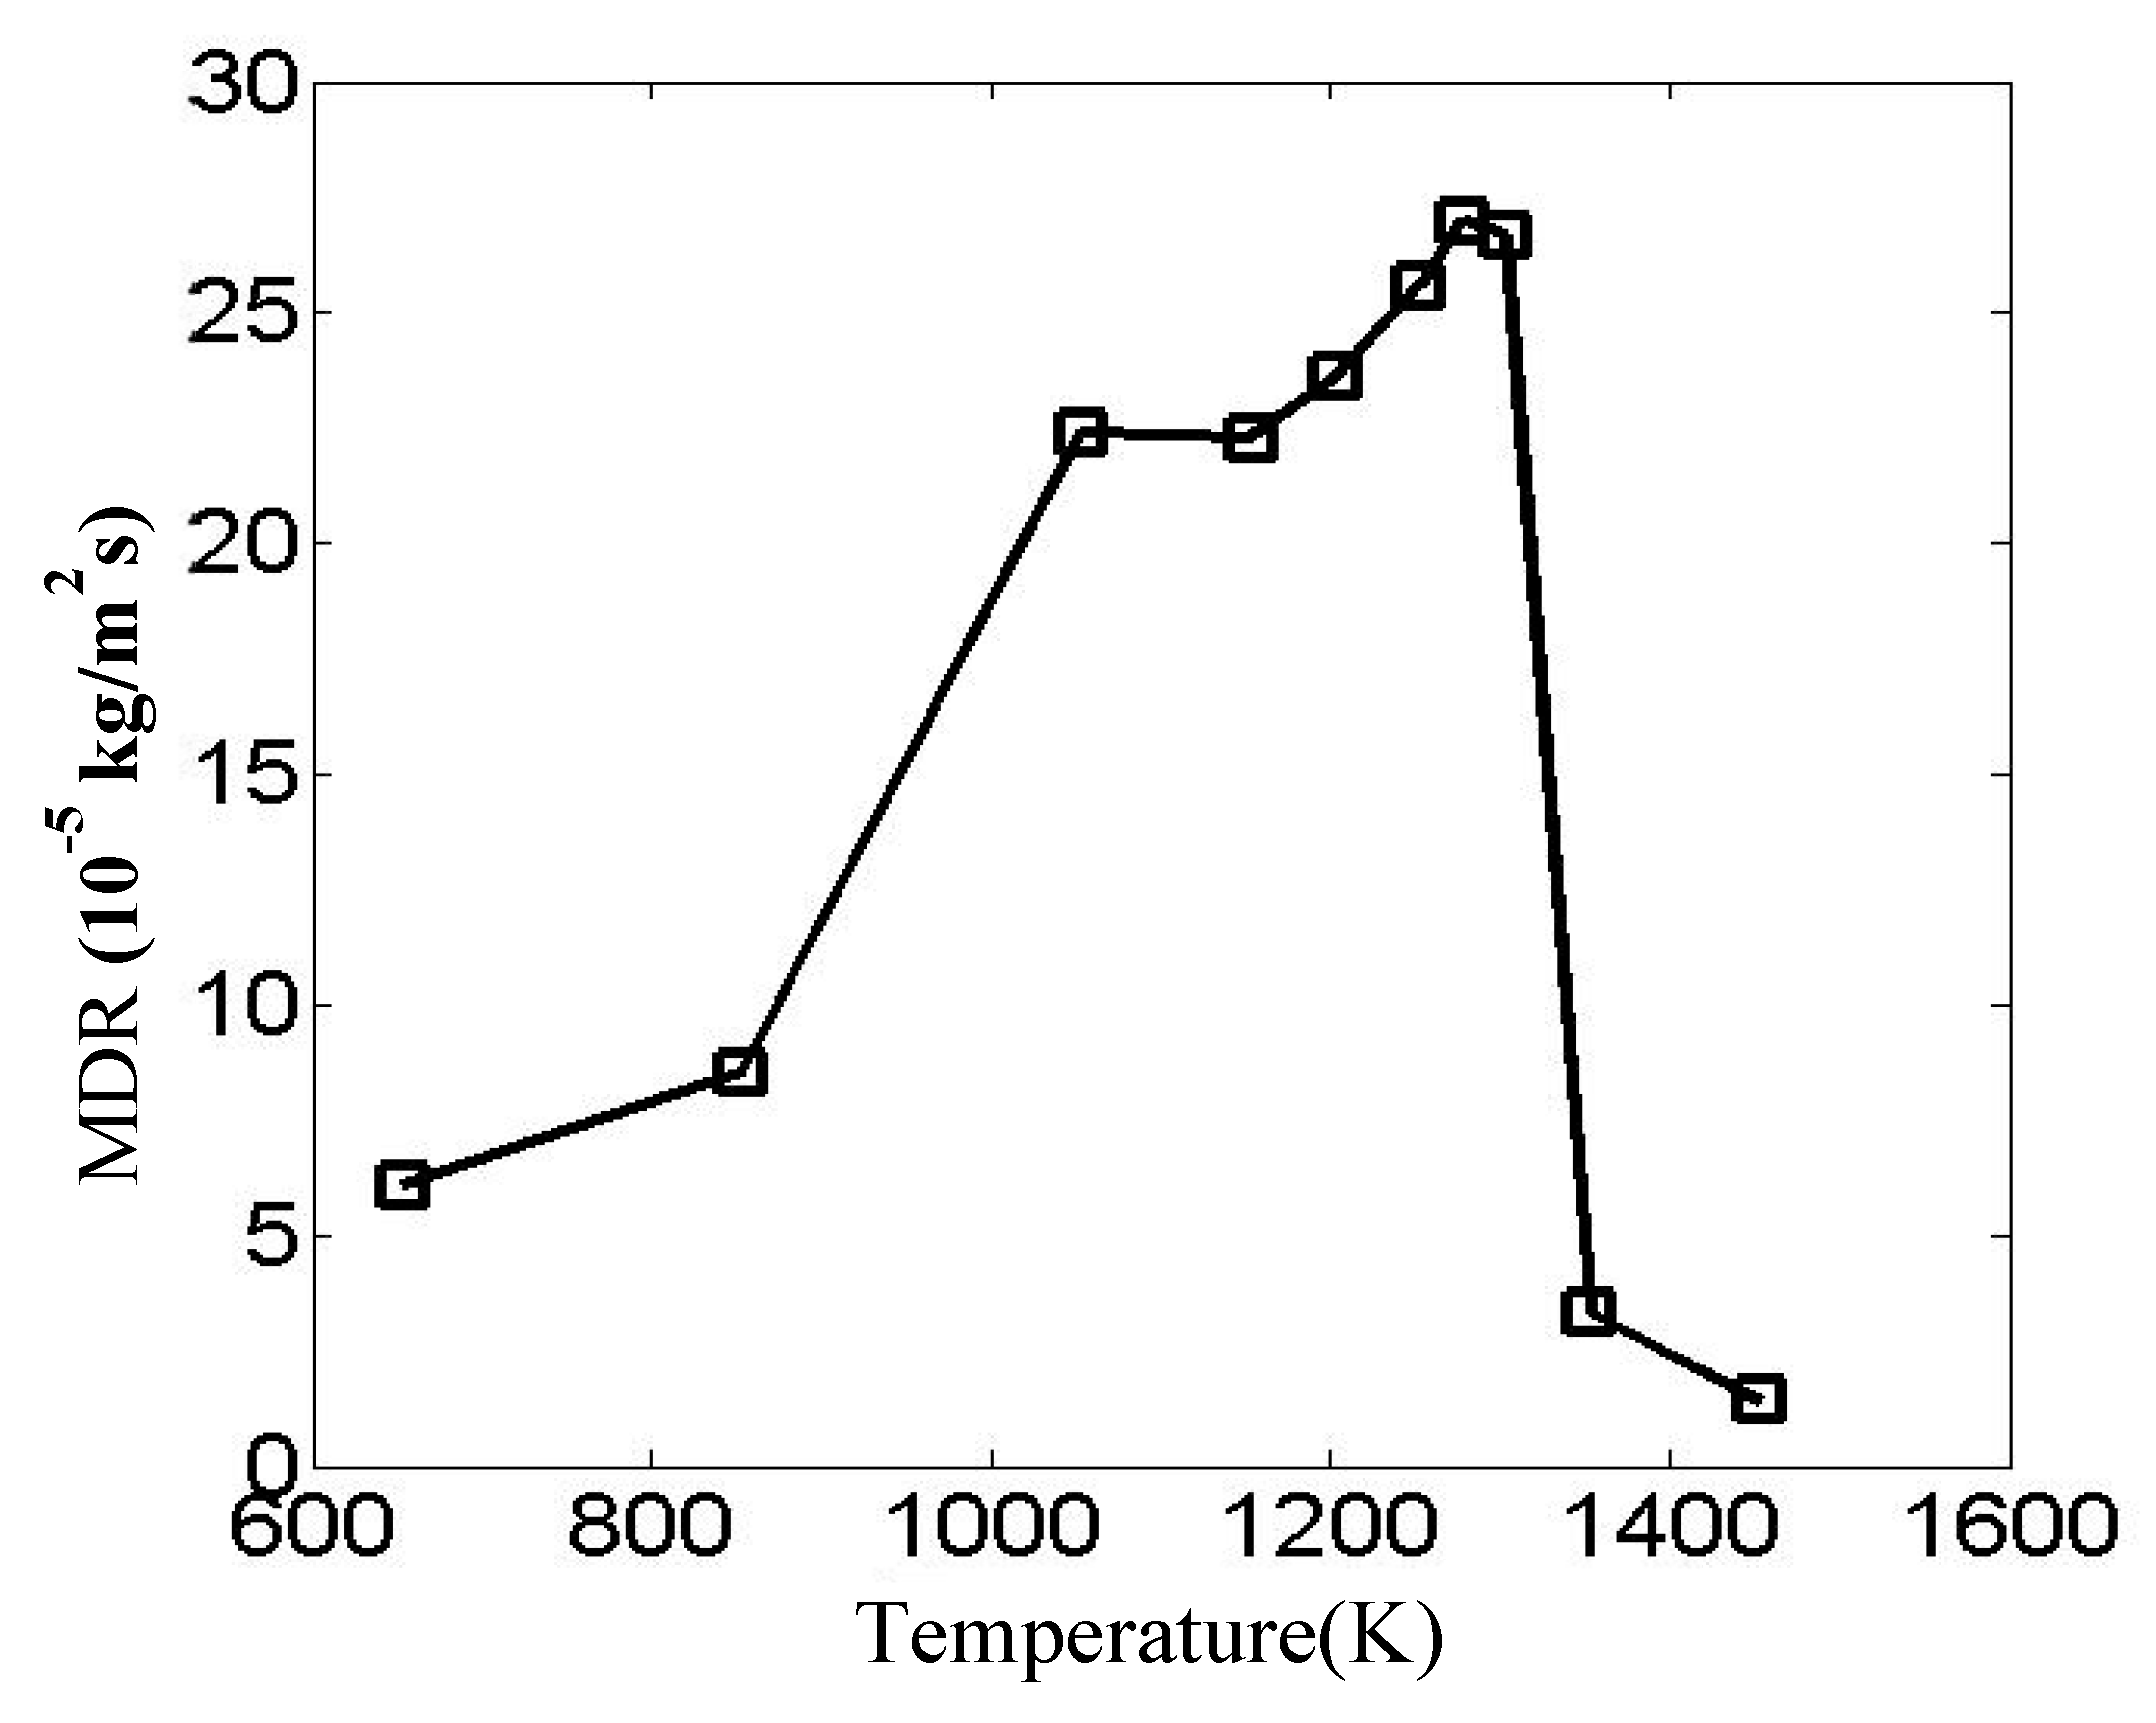
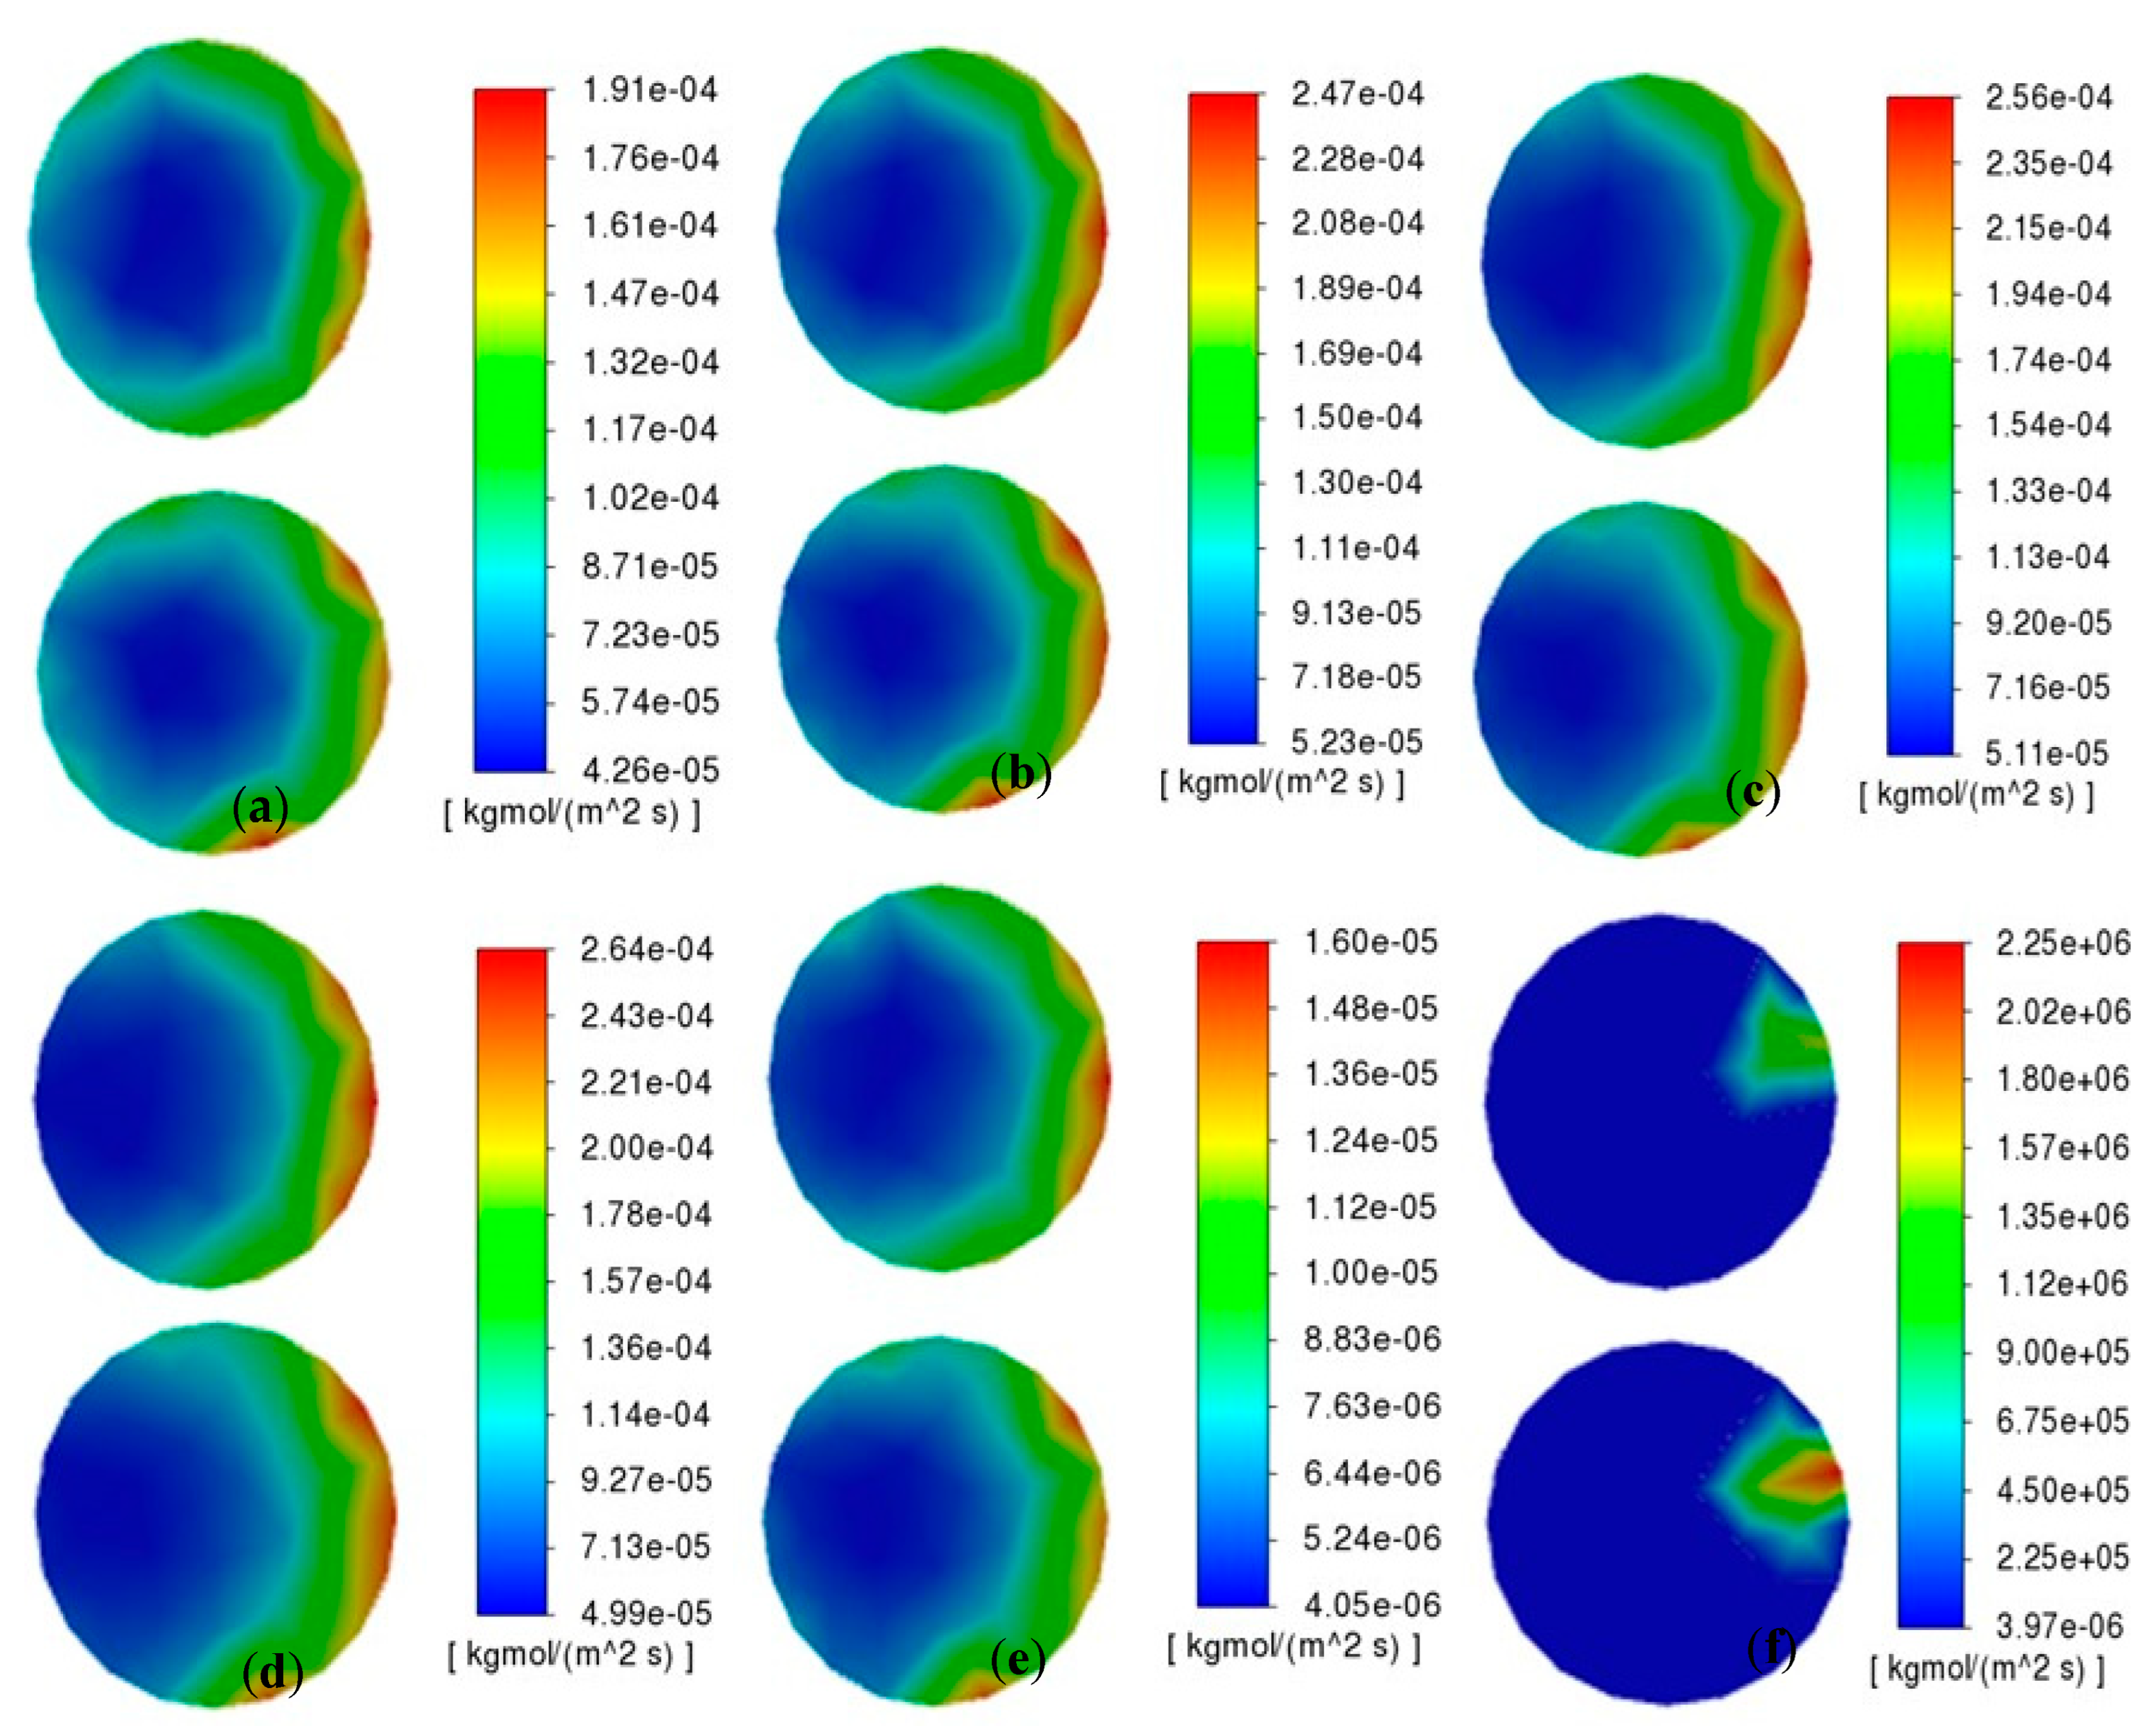
The numerical design adopts a non-linear temperature interval strategy. Progressively denser gradients near the empirical optimal temperature (1253 K) are used to enhance resolution for a comparative analysis of critical temperature ranges. The maximum reaction rates under various temperatures are compared in
Figure 8 and the reaction rate on the sample surfaces are shown in
Figure 9. It is shown that the coating deposition kinetics exhibit strong temperature dependence: lower temperatures (653–1053 K) result in sluggish reaction rates due to insufficient thermal activation energy, while the 1153–1303 K range demonstrates near-optimal chemical reaction behavior. Within the temperature range of 1053 K to 1303 K, the maximum reaction rates on the specimen surface remain relatively stable. Notably, temperatures exceeding 1303 K trigger a rapid decrease, likely attributable to precursor depletion or heterogeneous nucleation phenomena. At lower temperatures, the thermal energy is insufficient to facilitate widespread deposition reactions. Conversely, at elevated temperatures, the deposition rate becomes governed by surface chemical kinetics processes, including chemisorption, chemical reactions, surface migration, lattice reconstruction, and chemical desorption. The accelerated chemical desorption and corrosive effects of reaction byproducts lead to reduced deposition rates with increasing temperature.
Within the optimal temperature range of 1153 K to 1303 K, where maximum reaction rates maintain relatively high values, the temperature dependence of the reaction rates becomes more moderate. In this range, the maximum reaction rate shows a gradual increase with temperature. This stable operational regime provides favorable conditions for consistent coating deposition, as the competing effects of enhanced reaction kinetics and increased desorption/byproduct formation reach a favorable balance. The observed behavior suggests that precise temperature control within this optimal range is crucial for achieving both high deposition rates and uniform coating quality in industrial applications.
4.3. Pressure Influence
The influence of pressure on chemical reaction rates primarily depends on the number of gas molecules involved in the reaction process, which determines the number of reaction steps in the gas phase. In a gas-phase reaction, an increase in the number of gas molecules among the reactants enhances the probability of molecular collisions, thereby accelerating the reaction rate, whereas a decrease in molecular count slows it down. When pressure increases, the average distance between gas molecules decreases, facilitating more frequent encounters between highly reactive molecules and consequently increasing the reaction rate. Conversely, reduced pressure increases intermolecular distances, lowering collision probabilities and slowing reaction kinetics.
Unlike gas-phase reactions, pressure exerts a much weaker influence on liquid- or solid-phase reactions because the molecules in condensed phases are already in close proximity. Thus, pressure variations primarily affect phase transition-related changes rather than reaction kinetics. Since the reactions that occur in CVD reactors predominantly involve gaseous species, a detailed investigation of pressure effects on reaction rates is essential.
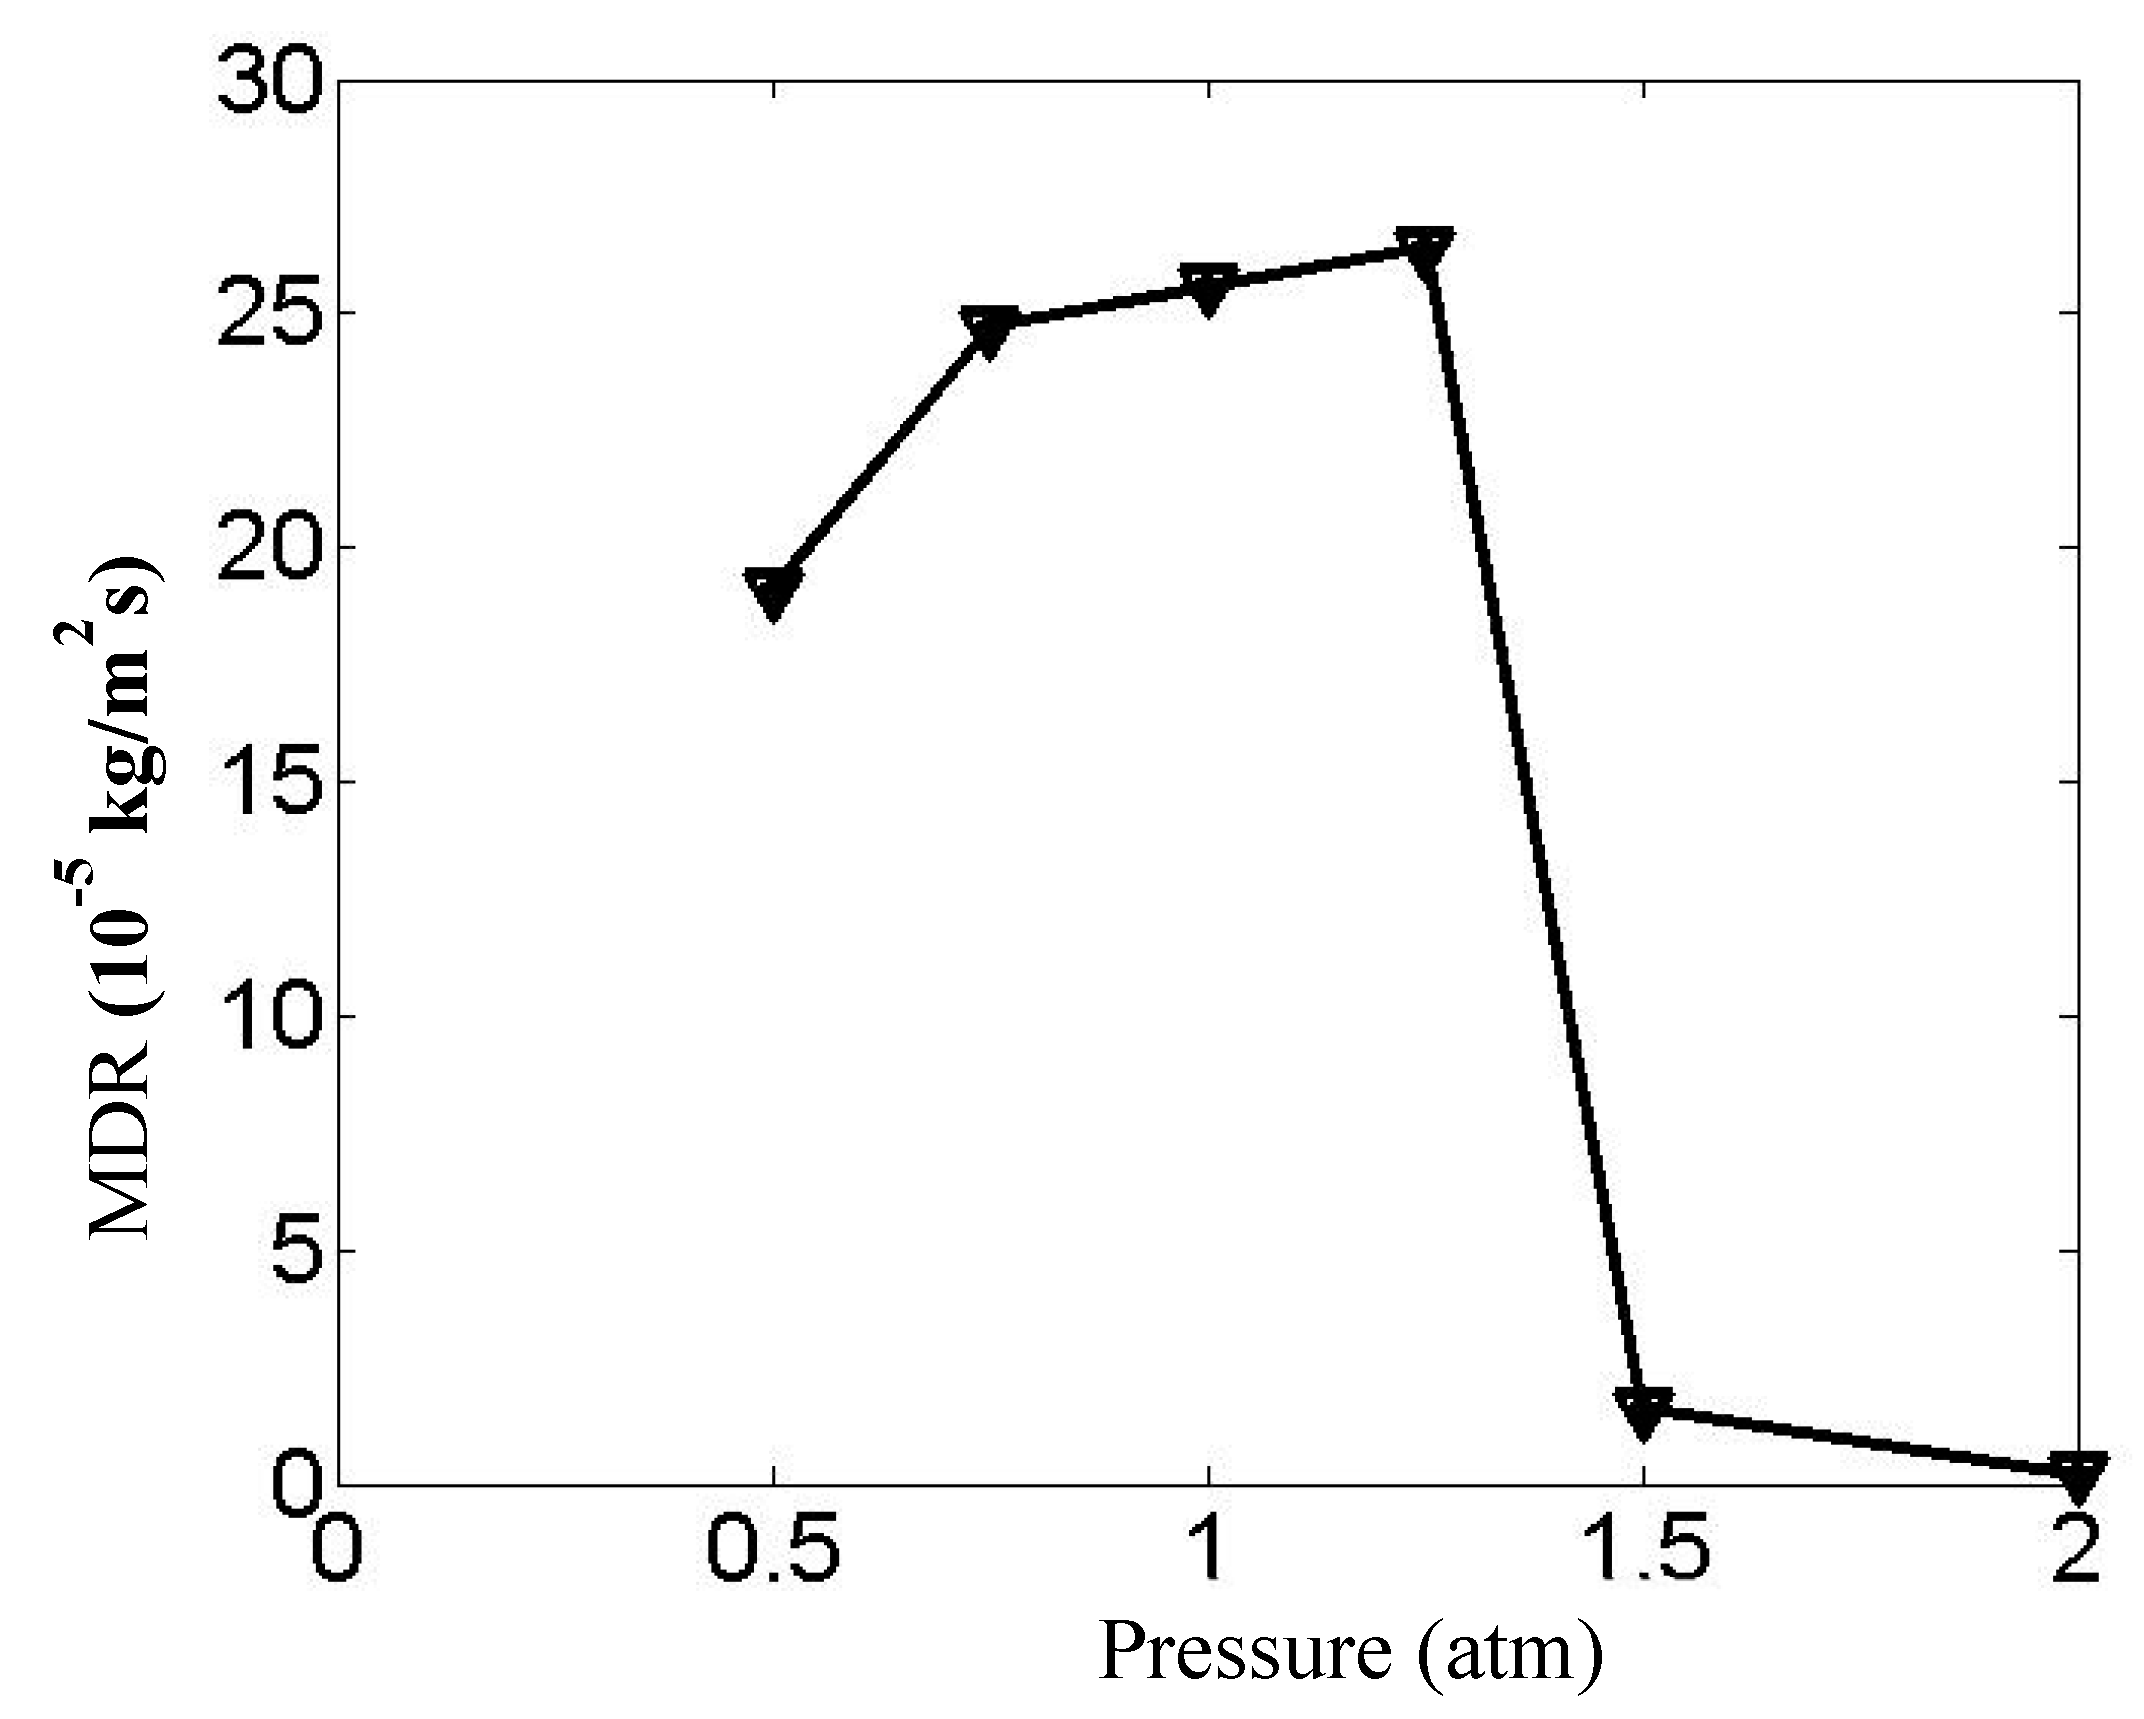
In this study, the impact of reactor pressure on deposition rates is examined across a range of pressures: 0.5, 0.75, 1, 1.25, 1.5, and 2 times standard atmospheric pressure (1 atm). The results reveal how pressure variations influence the deposition efficiency on the specimen surfaces, providing insights into optimizing CVD processes for enhanced coating uniformity and efficiency. The findings highlight the critical balance between pressure-induced collision frequency and potential limitations, such as gas-phase saturation or diffusion constraints at higher pressures.
As illustrated in
Figure 10 and
Figure 11, the chemical reaction rate on the specimen surface initially increases and subsequently decreases with rising pressure, exhibiting a distinct peak behavior. Notably, under high-pressure conditions (2 times standard atmosphere), the reactive area becomes concentrated in localized boundary regions with significantly diminished reaction rates. The contour maps and statistical data from
Figure 10 and
Figure 11 reveal that when pressure increases from 5/4 atm to 3/2 atm, the maximum deposition rates experience a substantial reduction. This phenomenon can be attributed to competing molecular-scale effects: while reduced intermolecular distances and enhanced collision frequency occur under elevated pressure, the concomitant molecular crowding decreases the average impact energy per collision. Furthermore, the reaction becomes constrained by the potential energy barrier—a quantum mechanical threshold that requires reactants to overcome a higher activation energy for successful chemical transformation. This process is increasingly difficult under high-pressure conditions.
The line chart analysis demonstrates that the maximum deposition rates reach optimal values near standard atmospheric pressure (1 atm), establishing this range as the most favorable operational condition. Within this pressure regime, the maximum deposition rate shows gradual enhancement with increasing pressure, which agrees with the results obtained by Andrzej et al. [
28]. This pressure-dependent behavior suggests that molecular collision efficiency and energy distribution achieve an optimal equilibrium at atmospheric pressure.
Based on the comprehensive evaluation of deposition efficiency per unit time, this study conclusively identifies standard atmospheric pressure as the optimized condition for reactor operation. The findings provide critical guidance for industrial CVD processes. This systematic analysis underscores the importance of pressure control in CVD applications, particularly for reactions where gas-phase kinetics dominate the deposition mechanism. This study bridges fundamental reaction dynamics with practical process optimization, offering guidelines for pressure selection in industrial-scale coating production.
