Article

Effect of Different N2 Partial Pressures on the Corrosion Properties and Conductivity of NbNx Coated Titanium Bipolar Plates for PEMFCs

1
College of Materials Science and Technology, Nanjing University of Aeronautics and Astronautics, Nanjing 211106, China
2
Jiangsu JlTRl Surface Engineering Technology Research Institute Co., Ltd., Taizhou 225300, China
3
School of Intelligent Manufacturing and Information, Jiangsu Shipping College, Nantong 226010, China
*
Author to whom correspondence should be addressed.
Coatings 2025, 15(8), 973; https://doi.org/10.3390/coatings15080973
Submission received: 30 July 2025 / Revised: 15 August 2025 / Accepted: 18 August 2025 / Published: 20 August 2025

Abstract

Metal nitride coatings have been considered as a promising approach to improve the performance of metal bipolar plates for proton exchange membrane fuel cells (PEMFCs). In this study, NbNx coatings with three different ratios of N2/Ar (1:2, 1:1 and 3:1) were prepared on TC4 alloy substrates using the double glow plasma alloying technology. The NbNx coatings are homogeneous and dense, and the phase of the coating transforms from hexagonal β-Nb2N to δ′-NbN phase as the nitrogen content increases. All coatings demonstrate high protective efficiency, with the coating (N2/Ar ratio of 3:1) displaying the lowest current density of 8.92 × 10⁻⁶ A/cm2 at a working voltage of 0.6 V. The EIS results also show that this coating has the best corrosion resistance. Notably, it also presents the lowest interfacial contact resistance of 7.29 mΩ·cm2 at 1.5 MPa and good hydrophobicity. More importantly, this study provides a new idea and method for corrosion-resistant coatings of metal bipolar plates for PEMFC applications.

1. Introduction

The proton exchange membrane fuel cell (PEMFC) is a power generation device that efficiently converts chemical energy (hydrogen and oxygen) into electrical energy. PEMFCs are valued for their simple structure, high specific power and energy, and lack of emissions, and thus possess great potential for development in the transportation industries [1,2,3,4]. Among the crucial elements of a fuel cell stack, the bipolar plate stands out as a key component, representing approximately 80% of the total weight and 45% of the stack cost, and performing functions such as distributing fuel and oxidant to the anode and cathode, transferring current between cells, and separating individual cells in the stack [5,6,7]. At present, bipolar plate materials are mainly composed of graphite, polymers and conductive metals, among which titanium alloy can better meet the demands of bipolar plate materials due to its low specific weight, good chemical stability, superior manufacturability and so on [8,9]. However, titanium alloys may be prone to corrosion, due to the fact that titanium alloys may generate low-conductivity oxides on the Ti-alloy surfaces when exposed to acidic operating environments [10,11]. Consequently, it is a viable solution to pick a suitable coating for the protection of Ti metal from exposure to corrosive species.
Transition metal nitrides are often used for protective coatings because of their excellent mechanical properties, superior chemical stability and good electrical conductivity, such as in the mechanical and optical field, and are also regarded as promising materials for commercial coatings of bipolar plates [12,13]. Li et al. [14] deposited TiN films on Ti substrates using a multi-arc ion plating technique, resulting in significantly enhanced corrosion resistance and favorable electrical conductivity. Pan’s study [1] investigated the application of CrN coatings on Fe-Cr alloy through multi-arc ion plating technology, presenting high chemical stability and better corrosion resistance in the simulated working environments. Alishahi et al. [15] applied DC reactive magnetron sputtering to produce Ta/TaN multilayer coatings on 316L stainless steel, leading to a significant enhancement in the corrosion resistance of the substrate as determined by potentiodynamic polarization analysis. Within the field of metal nitride coatings, niobium nitride (NbN) has recently attracted great interest due to its relatively low resistivity and superior chemical stability [16,17,18]. Sun et al. [19] fabricated NbN coatings on Ti bipolar plate using magnetron sputtering, which showed a low corrosion density and low interface contact resistance. Daudt et al. [20] produced NbN coatings on titanium sheets by reactive magnetron sputtering to decrease titanium surface oxidation and improve the electrochemical performance. It can be concluded that the NbN coating is efficient in improving the synergy between corrosion resistance and electrical conductivity.
The preparation of NbN coatings using physical vapor deposition (PVD) techniques has been widely studied, but recently, the double glow plasma alloying (DGP) technology has also gained considerable attention because of its high adhesion strength and preparation efficiency. Yi et al. [21] used the DGP technique to deposit NbN coatings on TA15 alloy. The results showed that the pre-diffusion surface-modified layer had high bonding strength and load capacity. Shen et al. [22] also investigated the characterization, corrosion and surface conductivity properties of NbN/Nb coatings prepared on Ti bipolar plates using DGP technology. More importantly, NbN has many different phases in the Nb-N system, including β-Nb2N, γ-Nb3N4, δ-NbN, ε-NbN, δ′-NbN and mixed phases, which are mainly influenced by the pressure of N2 during the deposition process [23,24]. Therefore, it can be concluded that high-quality NbN coatings with better bonding strength can be prepared using the DGP technology. However, limited research has explored the effect of nitrogen content on the fabrication of NbN coatings on titanium alloy bipolar plates through the double glow plasma alloying technique. In addition, the hardness of the coating plays an important role in the long-term operation of bipolar plates. However, published papers have focused more on corrosion performance and less on the hardness of NbN coatings with different nitrogen contents.
Therefore, this work investigated the effect of varying nitrogen levels on the comprehensive performance of NbNx coatings in bipolar plates. The NbNx coatings with different nitrogen contents were prepared on TC4 alloy substrates via the double glow plasma alloying technique. The analysis included assessments of the microstructure, nano-hardness, corrosion resistance, and surface conductivity characteristics of the distinct NbNx coatings. Furthermore, the study aimed to introduce a novel design approach to facilitate the expanded utilization of bipolar plates in fuel cell applications.

2. Experiments

2.1. Coating Deposition

NbNx coatings with different nitrogen contents were deposited onto TC4 (Ti-6Al-4V) alloy substrates via the double glow plasma alloying (DGP) technology. A pure Nb (99.95 wt%) target served as the source electrode, while TC4 alloy plate functioned as the workpiece electrode. Initially, a Nb pre-diffusion layer was generated in pure Ar atmosphere for 2 h, followed by the introduction of N2 for 6 h. Detailed parameters and renamed samples are presented in Table 1.

2.2. Coating Characterization

Microscopic analysis of NbNx coatings was conducted using scanning electron microscopy (SEM; S-480, Hitachi, Tokyo, Japan) with an EDS attachment. The microstructure of the coatings was evaluated by using X-ray diffraction (XRD; Empyrean, Malvern Panalytical, Shanghai, China) equipped with Cu Kα radiation, with scanning angles of 10–90° and a scanning speed of 0.1°/s.
The hardness and elastic modulus of the TC4 substrate and NbNx coatings were tested by using a nanoindentation device (Hysitron TI980, Bruker, Billerica, MA, USA). The loading rate was 5 mN/s, the maximum load was 50 mN, and the load holding time was 15 seconds. Each sample was tested five times.
The hydrophobicity of the coatings was assessed by measuring water contact angle using a water angle meter (SL200B, Solon Tech., Shanghai, China) to evaluate the hydrophobicity of the coatings. The interfacial contact resistance (ICR) between coatings and TC4 alloy was tested using a contact resistance meter (FT-341SJB, Ningbo Rooko Instrument Co., Ltd., Ningbo, China) under an applied load range of 0–1.5 MPa.

2.3. Electrochemical Measurements

Electrochemical testing of three different NbNx coatings and substrates was carried out in a solution comprising 0.5 mol/L H2SO4 and 2 mg/L HF at 70 °C utilizing a Zennium E4 electrochemical workstation (Zahner, Kronach, Germany). The tests were performed with three electrodes: the working electrode (samples), counter electrode (Pt) and reference electrode (saturated calomel electrode, SCE). The potentiodynamic polarization tests were conducted at a scan rate of 1 mV/s and a test voltage range of OCP value ± 0.5 V. Potentiostatic polarization tests were implemented using voltage values of 0.6 V to simulate a bipolar plate cathodic environment. The frequency range for the electrochemical impedance spectroscopy (EIS) measurements was set from 105 Hz to 10−2 Hz.

3. Results and Discussion

3.1. Microstructure and Characterization

Figure 1 illustrates the microscopic morphology of various NbNx coatings along with their corresponding EDS analysis. The coatings display a smooth and homogeneous surface, characteristic of the cell-like appearance commonly observed in coatings prepared by the DGP technology. With increasing nitrogen content, the color of the coating transitioned to a darker golden yellow hue, and the nitrogen content in Samples S1, S2 and S3 progressively rose, measuring 55.73 at%, 61.10 at% and 62.41 at%, respectively. The cross-sectional SEM photographs reveal that the deposited coatings with thicknesses of approximately 6.8, 7.8 and 9.1 μm, respectively, exhibited a consistent and compact structure devoid of any discernible pores or holes, which was tightly bonded to the TC4 alloy substrate.
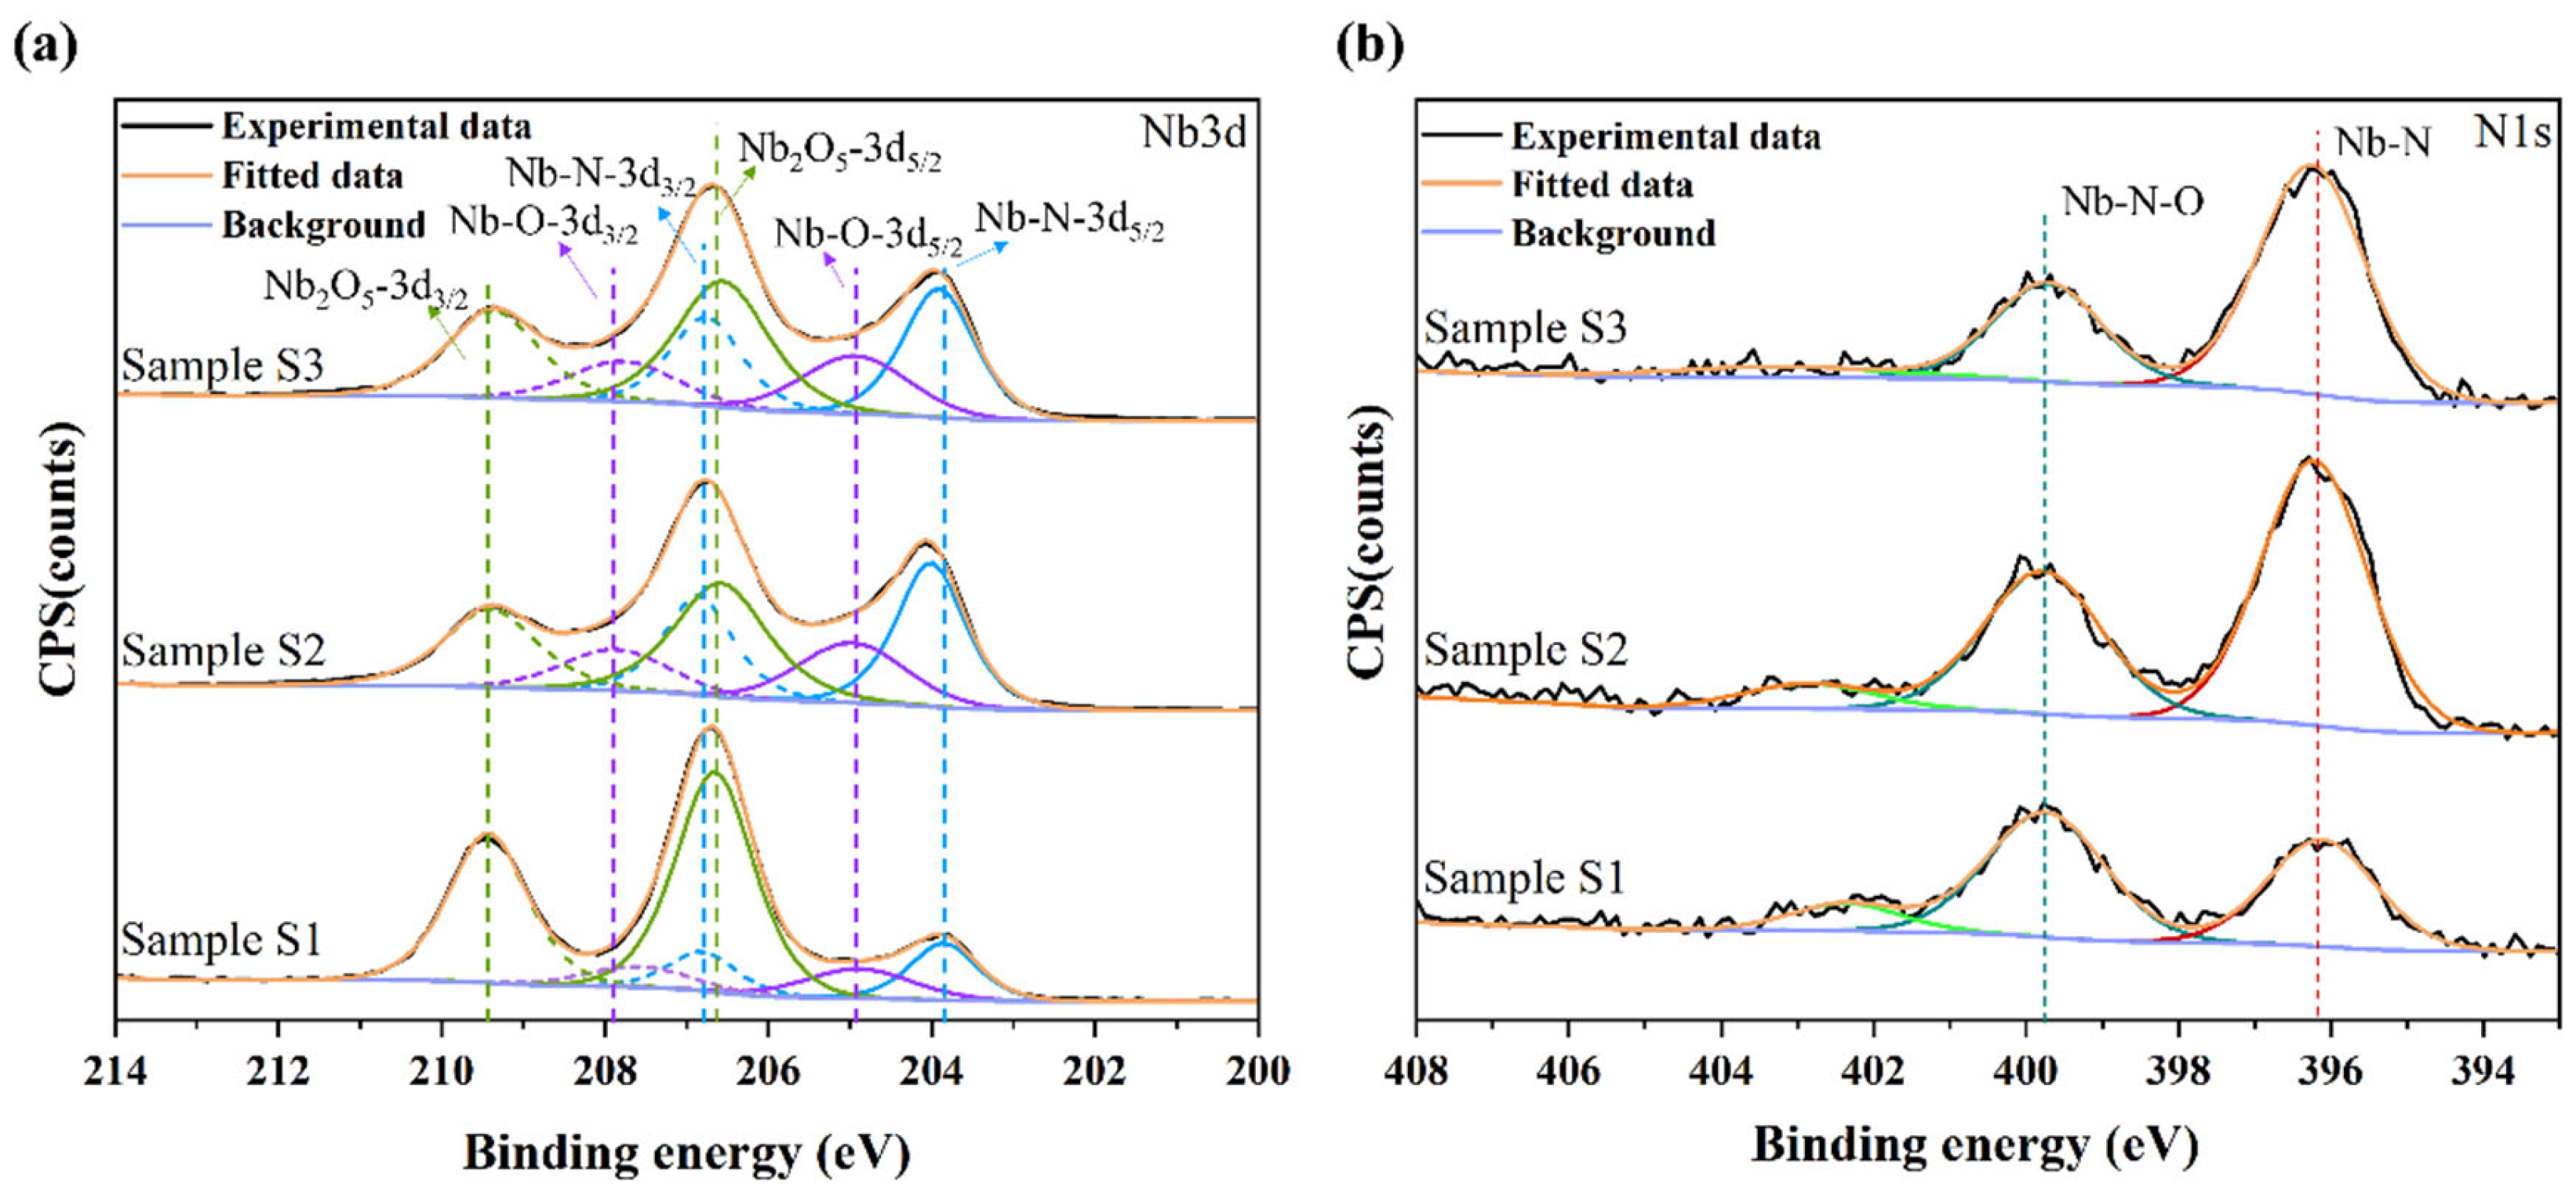
Figure 2 shows the XPS patterns of different NbNx coatings. Figure 2a shows the fitting results for the Nb 3d peak. The peaks at 204.9 eV and 207.7 eV are considered to be Nb-N peaks [21]. The peaks at 203.9 eV and 206.7 eV are Nb-O peaks, and the peaks at 206.6 eV and 209.3 eV are Nb2O5 peaks. This is the result of partial oxidation of the NbN coating when exposed to air [19]. For the N1s peaks, the NbN peak at 396.3 eV and the NbNO peak at 399.8 eV can be observed [25]. This could be relevant to the presence of molecular nitrogen. Niobium oxynitride may be the phase located between the outermost Nb2O5 layer and the intact NbN thin film. As the N2/Ar ratio increases, the peak corresponding to NbN is enhanced. However, it is difficult to distinguish the specific NbN phase, and further analysis using XRD or other tests is required.
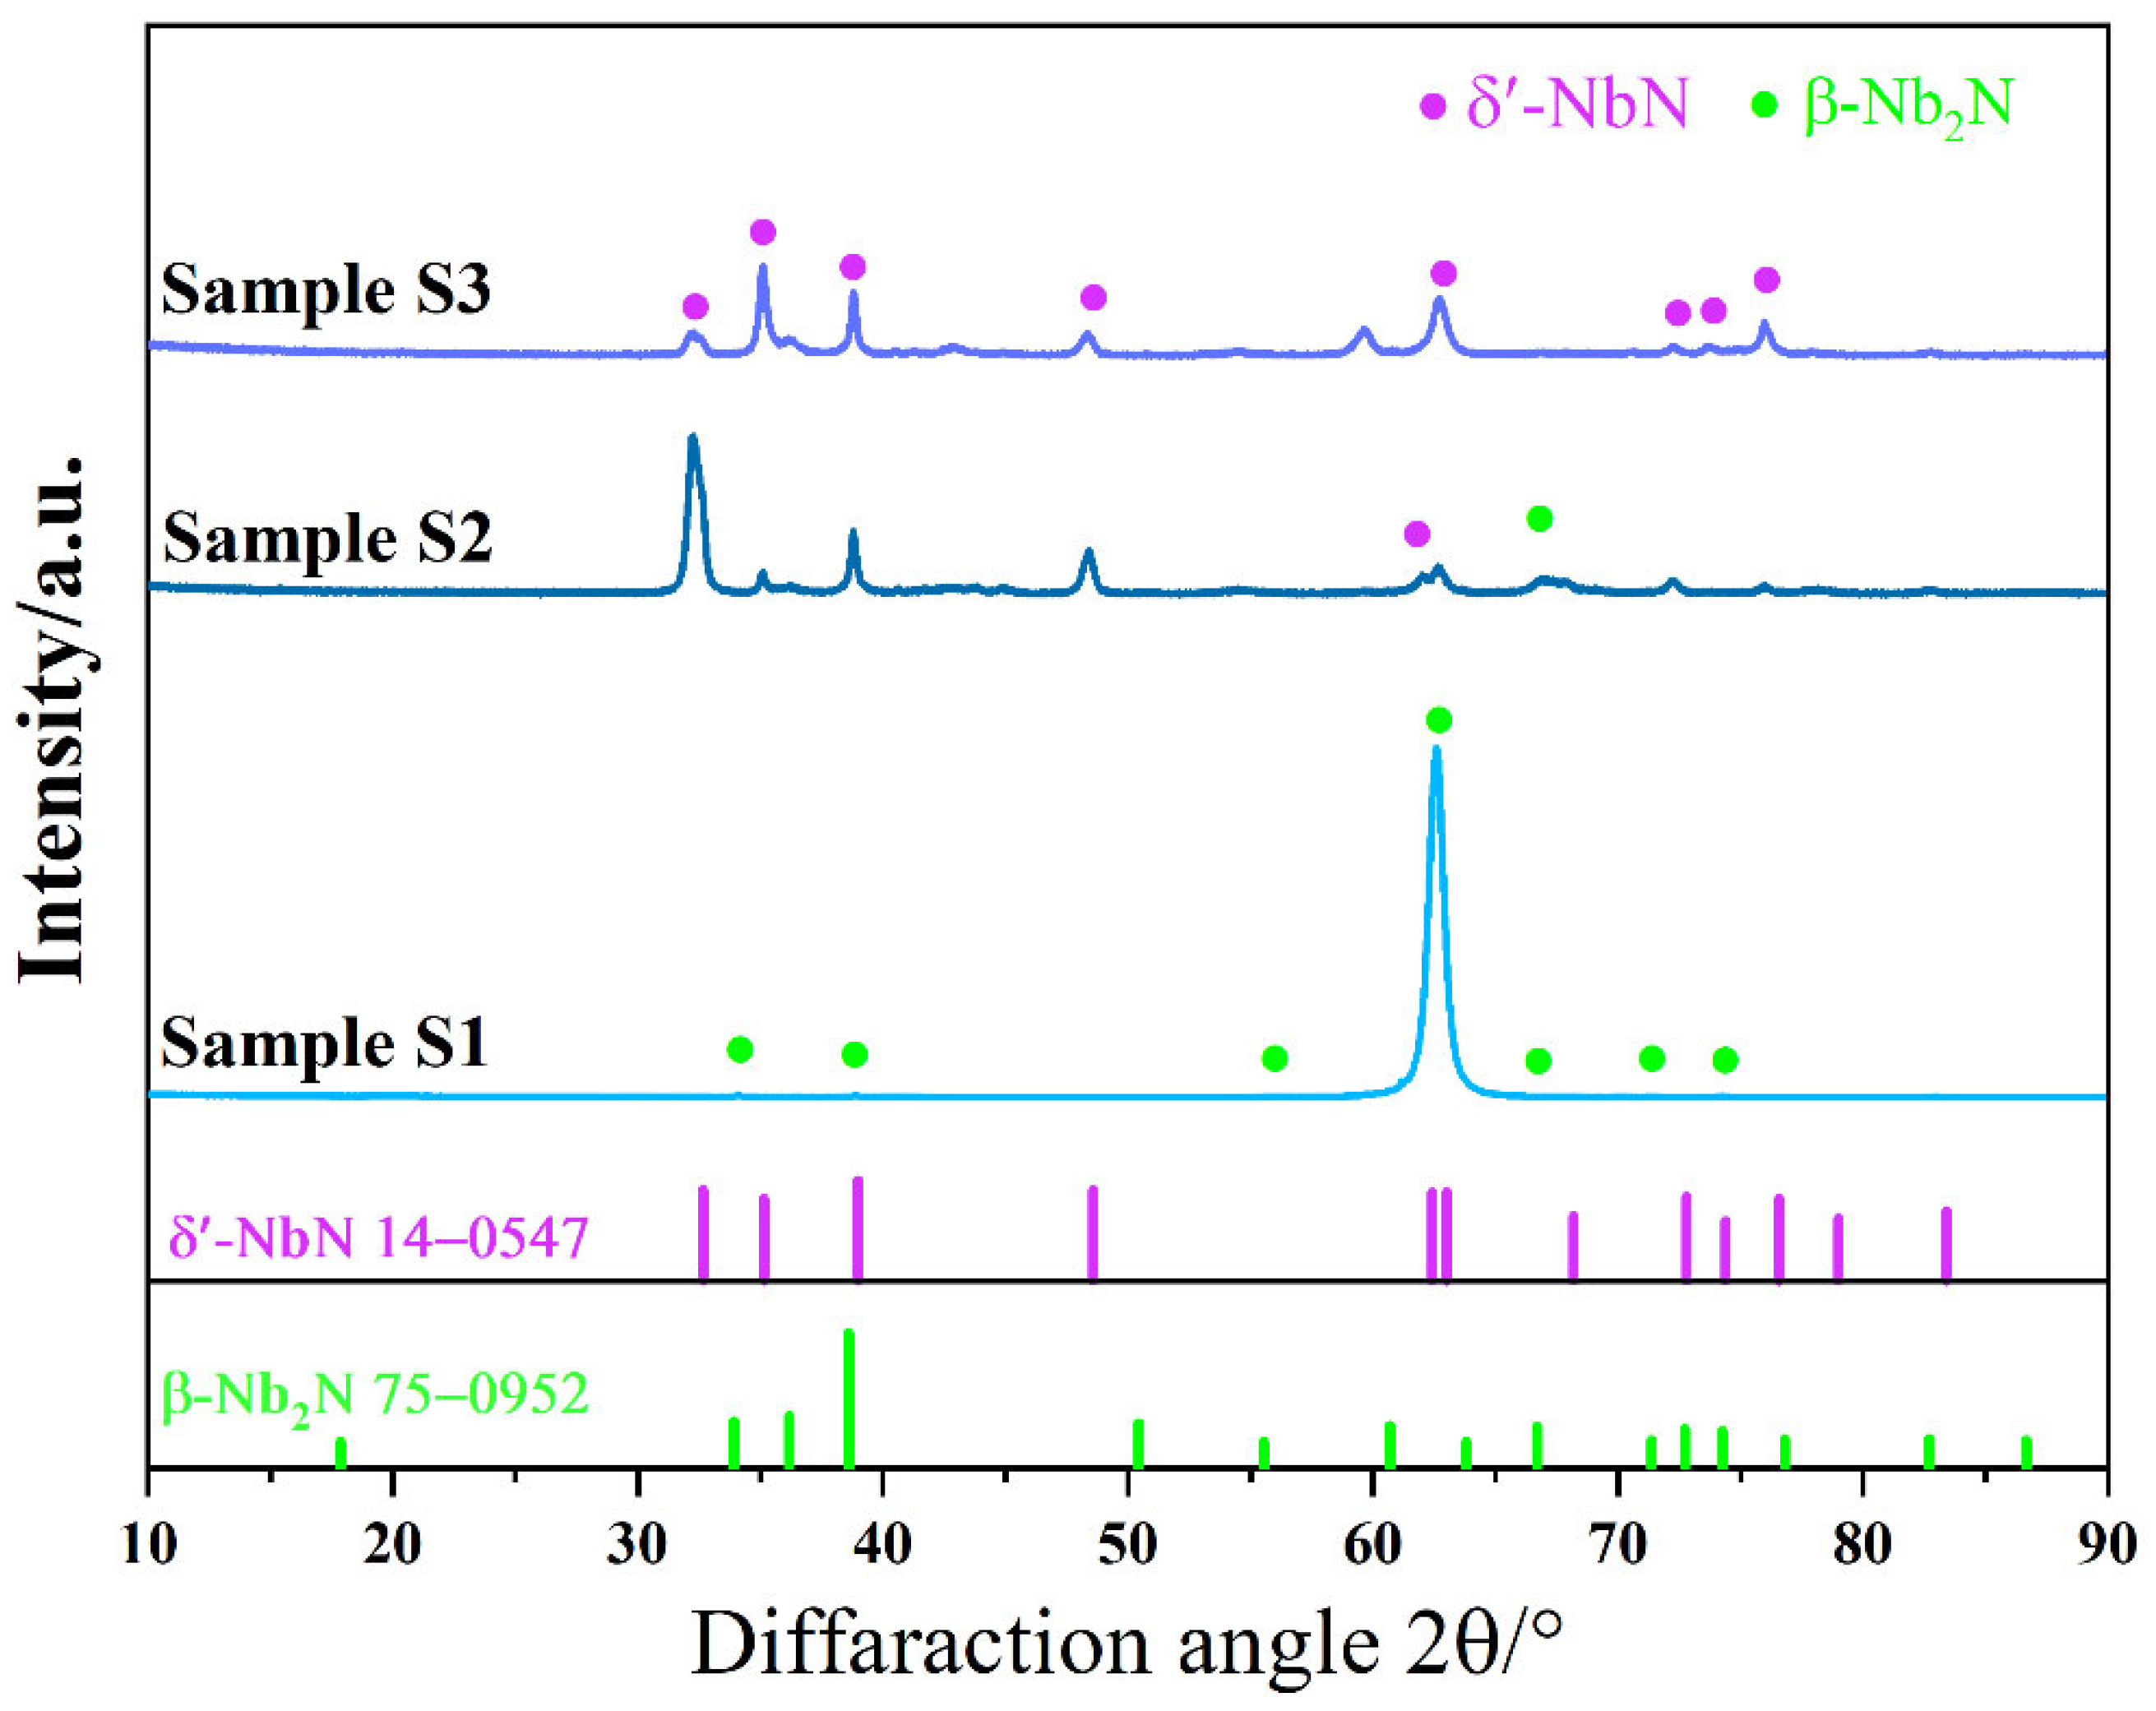
In order to further analyze the physical structure of the coatings, XRD tests were performed on different NbNx coatings. As we all know, the NbN phase is mainly influenced by the preparation approaches and deposition parameters [19,24]. Figure 3 reveals that the phase of the coating is greatly affected by the nitrogen content. At a lower N2 content, Sample S1 only produced one apparent peak with a very high intensity at 62.57 °, which can be proved to be the (111) peak of the β-Nb2N phase (hexagonal, PDF 75-0952) [3]. As the ratio of N2 and Ar increased to 1:1, Sample S2 was composed of a mixed phase of hexagonal δ′-NbN (PDF 14-0547) and hexagonal β-Nb2N. δ′-NbN and ε-NbN can be regarded as the same phase in some papers [26]. Sample S3 was dominated by the hexagonal δ′-NbN phase at the N2/Ar ratio of 3:1. The increased nitrogen content introduced during the deposition process enhanced collision probability, thereby promoting more chemical reactions on the substrate surface. The elevated nitrogen partial pressure promoted the coating phase transformed from β-Nb2N phase to δ′-NbN phase, which is similar to the results of [26,27]. At the same time, the XRD results also suggest that the nitrogen content of different preparation methods has a unique effect on the composition of the NbN phase. The phase of the NbNx coating not only directly affects the physical properties of the coating, but also influences its mechanical properties. The Nb-N group, as a nitrided phase, generally has good corrosion resistance. However, compared with cubic δ-NbN phase, hexagonal β-Nb2N and δ′-NbN phases are more covalent, and thus may have relatively lower conductivity and higher hardness [28,29].
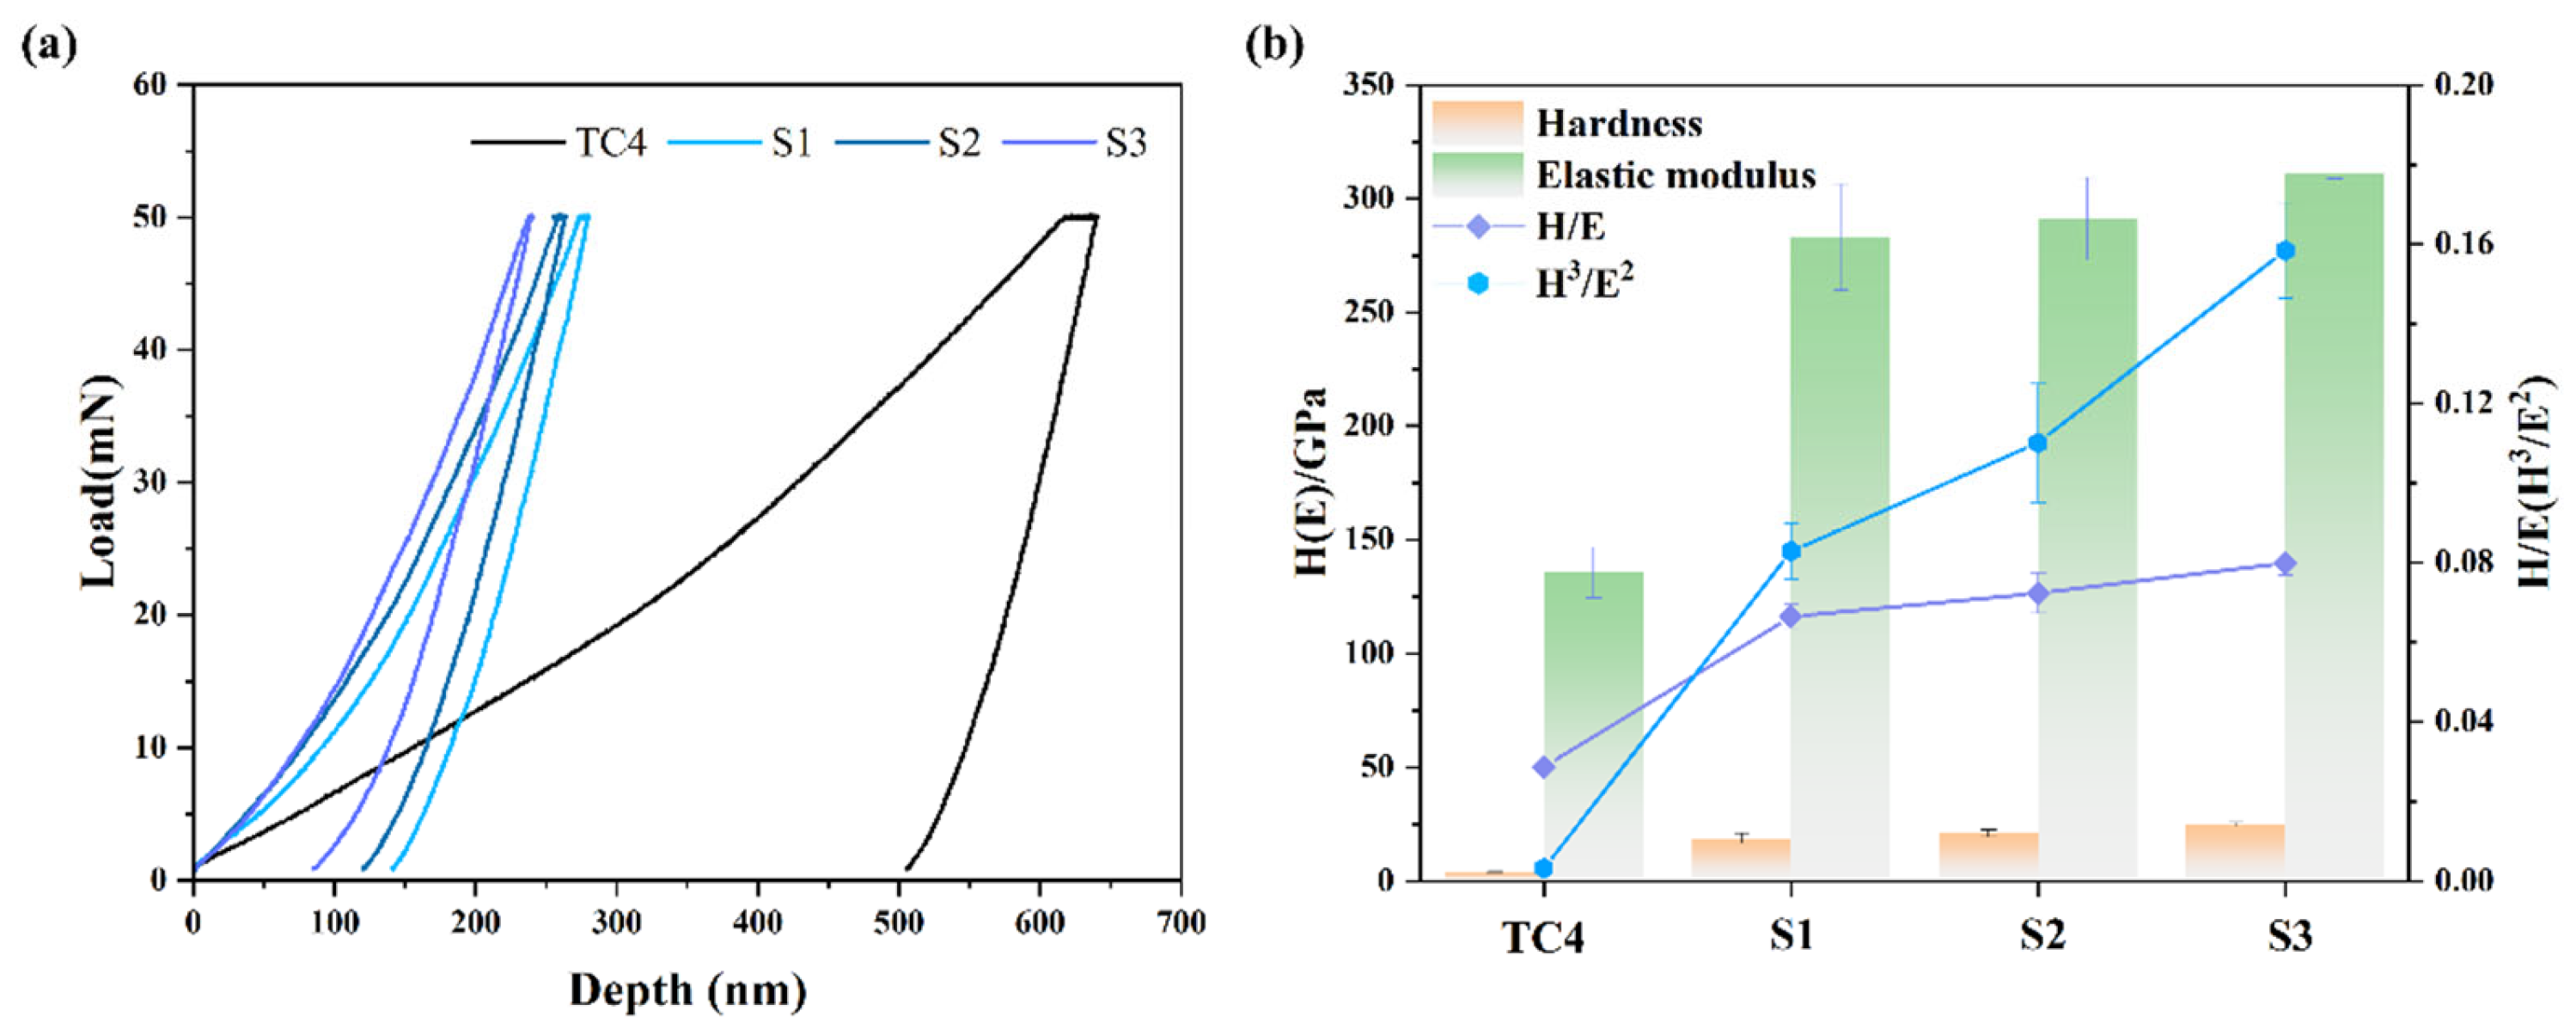
The stability and long-term application of fuel cells are closely related to the wear and corrosion of the bipolar plate surface. Corrosion products and solid particles generated by the long-term reaction between the electrolyte and the bipolar plate can cause surface scratches and wear [30]. Hardness (H) is an essential indicator for evaluating the wear resistance of coatings [31]; in general, samples with higher hardness values have higher wear resistance. Figure 4 shows the nanoindentation results for the substrate and coatings. The hardness values of TC4 and Samples S1, S2, S3 are 3.89, 18.79, 21.05 and 24.85 GPa, respectively, and the elastic modulus (E) values are 135.59, 283.05, 291.08 and 311.25 GPa, respectively. The hardness values of Samples S1, S2 and S3 increased by 3.8, 4.4 and 5.4 times compared to the TC4 alloy. It can be observed that the hardness of the coatings increased with the increase in nitrogen content, and Sample S3 had the highest hardness value. The H/E value has typically been regarded as an indicator of fracture toughness in previous research [32], with higher values indicating greater toughness. The H3/E2 value can indicate load-bearing capacity, with coatings having higher values capable of withstanding greater loads. Therefore, we can infer that samples with high H/E and H3/E2 values exhibit superior wear resistance. As shown in Figure 4b, the H/E values of TC4 and the Samples S1, S2, S3 were 0.0287, 0.0664, 0.0723 and 0.0798, respectively, while the H3/E2 values were 0.0032, 0.0828, 0.1100 and 0.1584, respectively. The H/E and H3/E2 values of the coatings increased with increasing nitrogen content, and Sample S3 with δ′-NbN phase had the highest value, indicating that S3 has the best load-bearing capacity and wear resistance. This results in fewer diffusion channels (e.g., wear pits, scratches) for corrosive ions and extends the service life of the bipolar plate.

3.2. Corrosion Resistance

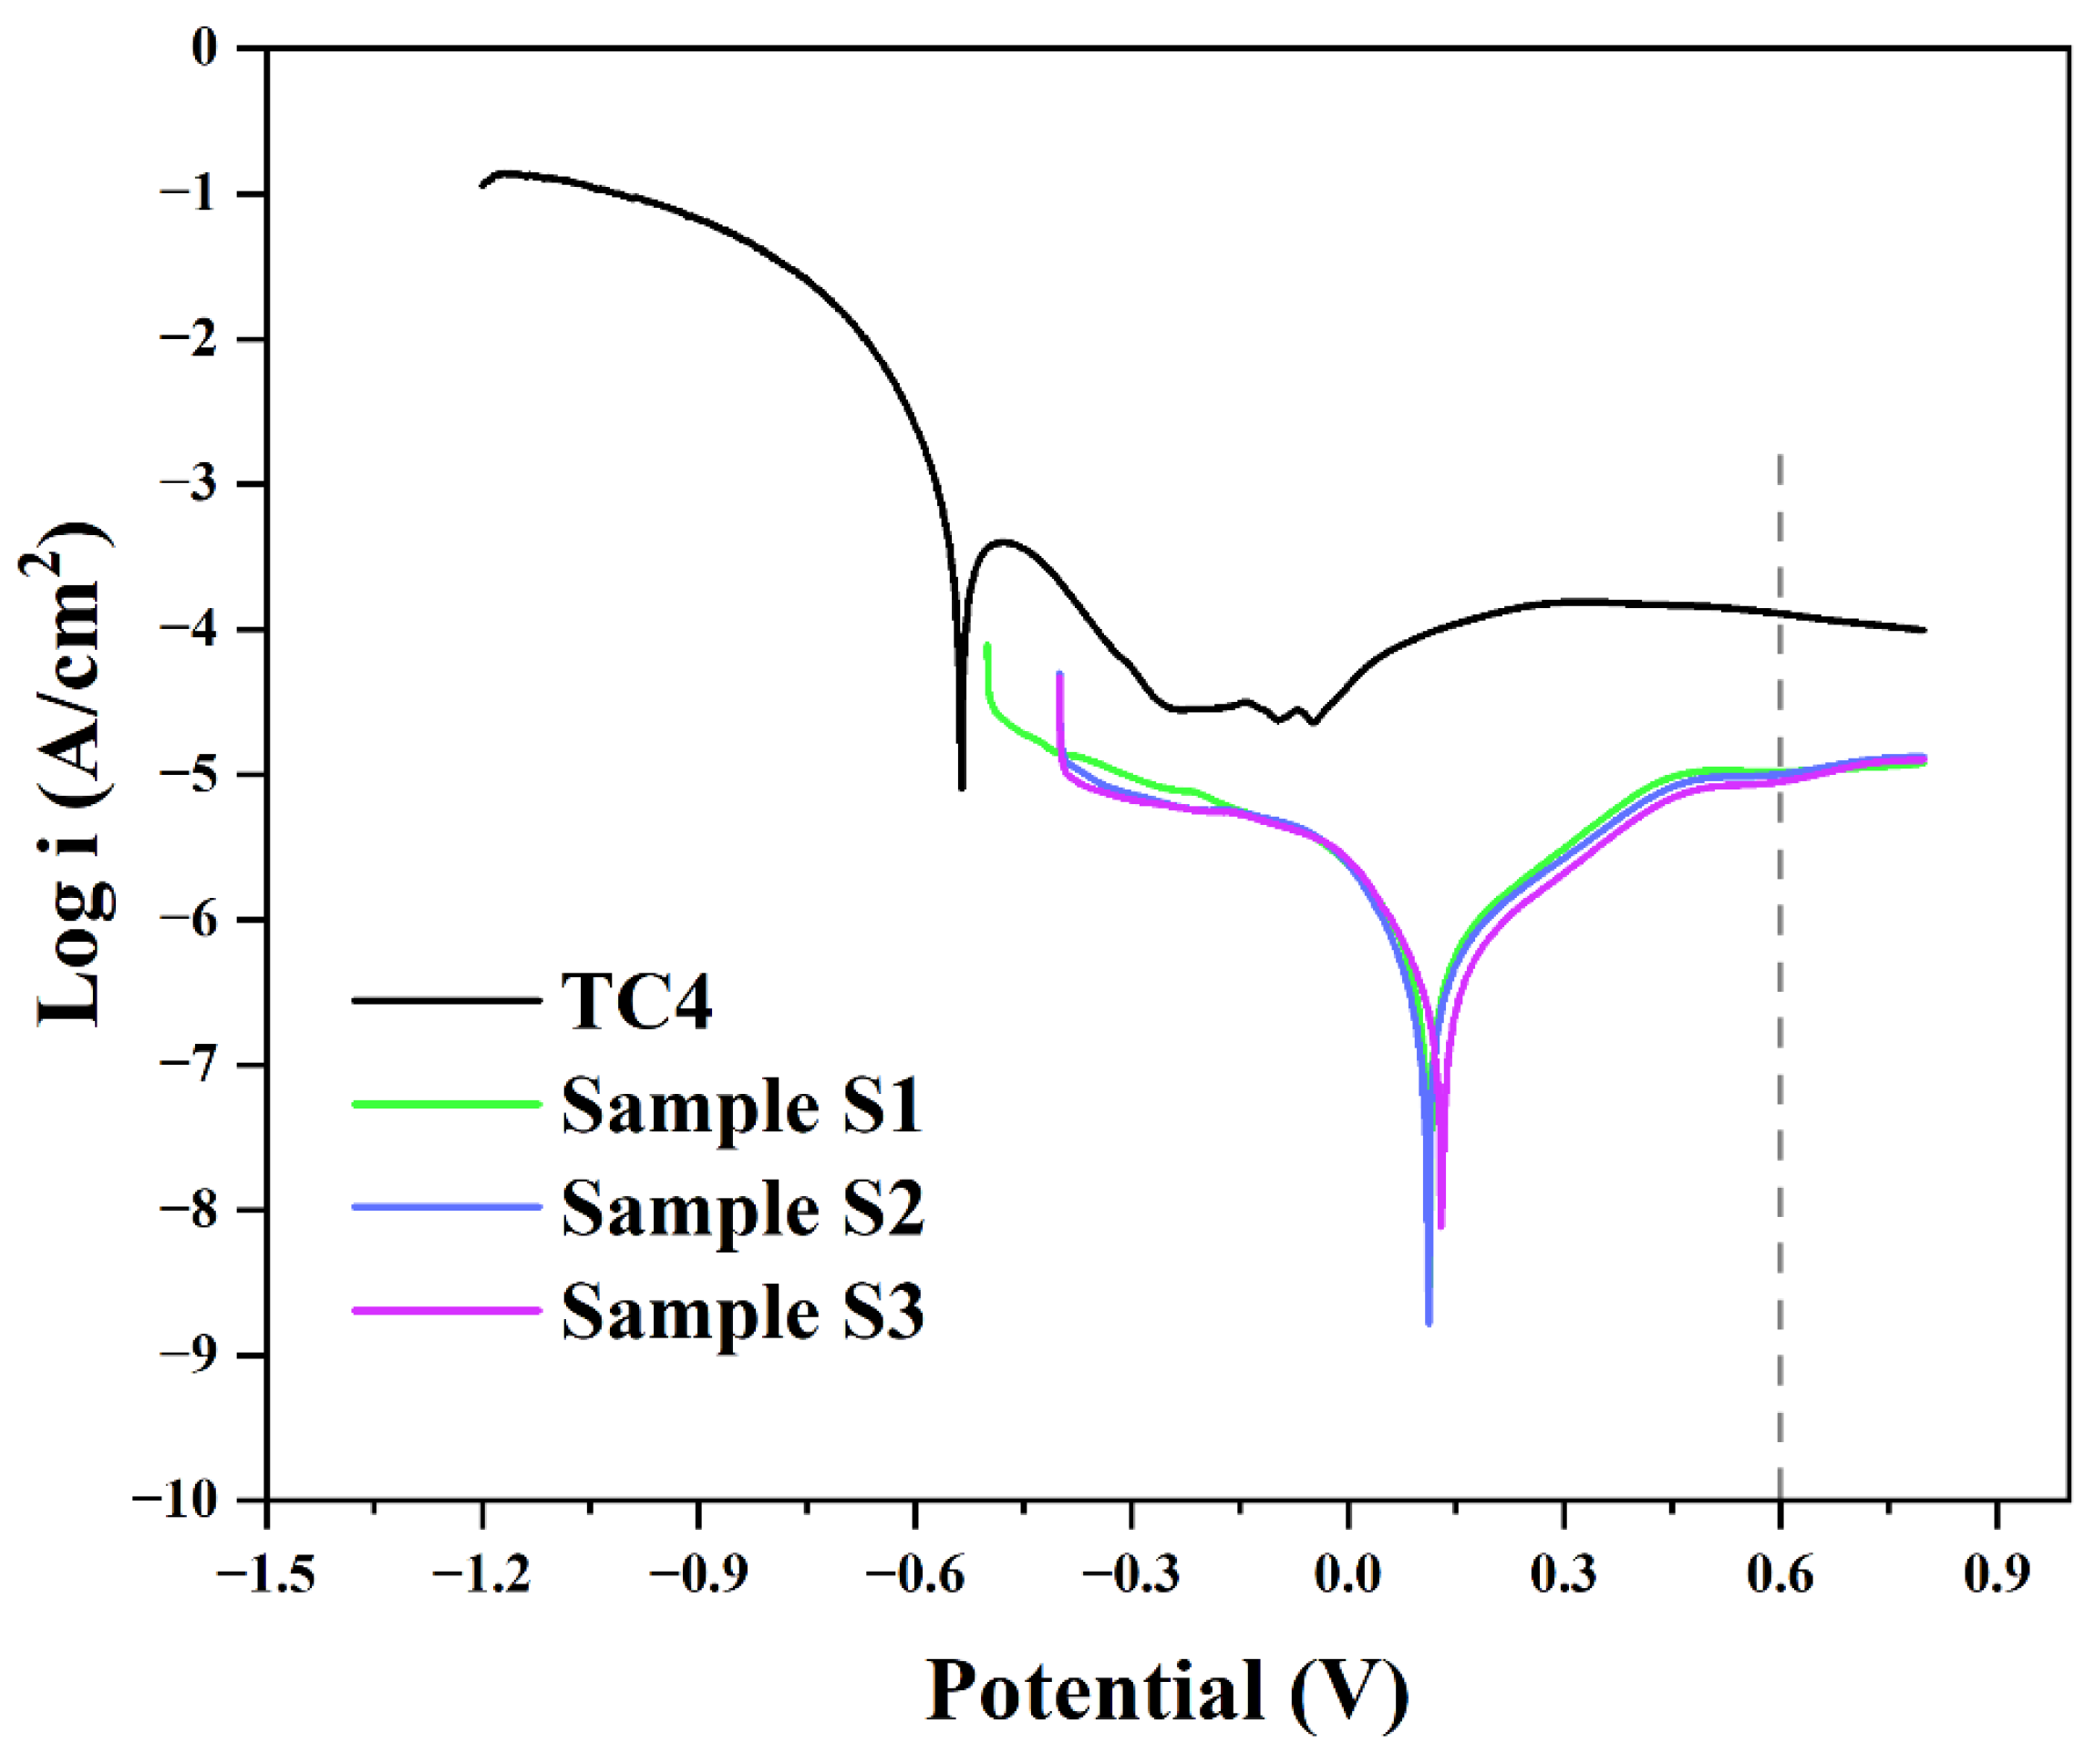
The samples were maintained under open circuit potential (OCP) conditions. A stable OCP value was obtained after the electrolyte and the samples reached equilibrium, as presented in Table 2, and then the potentiodynamic polarization tests were initiated. It is seen that the OCP values increased from −0.67 V for bare TC4 substrate to 0.14 V, 0.17 V and 0.18 V for sample S1, S2 and S3. A higher OCP value correlates with higher inertness [33], indicating coated samples have excellent electrochemical stability and corrosion resistance compared to bare Ti substrate. Figure 5 shows the potentiodynamic polarization curves for TC4 substrate and NbNx coatings under different N2 pressures in simulated PEMFC bipolar plate environments at 70 °C, and Table 2 summarizes the polarization data of the NbNx coatings and Ti alloy for comparison. The corrosion potential (Ecorr) values also show a trend similar to that for the OCP; while the corrosion current density (Icorr) value shows an opposite trend, the different NbNx coatings have similar values and are all close to two orders of magnitude smaller than that of the TC4 substrate. Since the plasma alloying process is also based on physical vapor deposition, the occurrence of defects such as pinholes in the coating is hardly avoidable. The location of these defects may lead to the appearance of corrosion products, thus degrading the corrosion resistance of the coating [22]. Thus, the index of Pi was adopted to measure the protective efficiency of the coatings, with its value derived from the polarization curve via the following formula [34]:
P i % = 100 × 1 i c o r r i c o r r 0
where Pi represents the protective efficiency, and icorr and i c o r r 0 represent the corrosion current density of coated and bare TC4 alloy. The values of Pi in Table 2 are all above 96%, which reveals that the different NbNx coatings have good protection efficiency.
Moreover, at the PEMFC cathode working potential of 0.6 V, all the coated samples showed more negative current density values than that of the Ti alloy, and Sample S3 had the lowest value of 8.92 × 10⁻⁶ A/cm2. More positive Ecorr means the coating needs more energy to begin the corrosion process, while lower Icorr means increased corrosion resistance [35]. The Icorr value of the coating decreased by two orders of magnitude compared with that of the substrate. Sample S3 had the highest Ecorr value of 0.131 V and the lowest Icorr value of 4.81 × 10⁻⁶ A/cm2, so the NbNx coating exhibited superior protective properties compared to the TC4 substrate. However, there was no substantial variance in corrosion resistance among the various NbNx coatings based on the polarization test results, and it can be inferred that all coatings enhance the corrosion resistance of the TC4 substrate, with Sample S3 demonstrating slightly enhanced corrosion resistance.
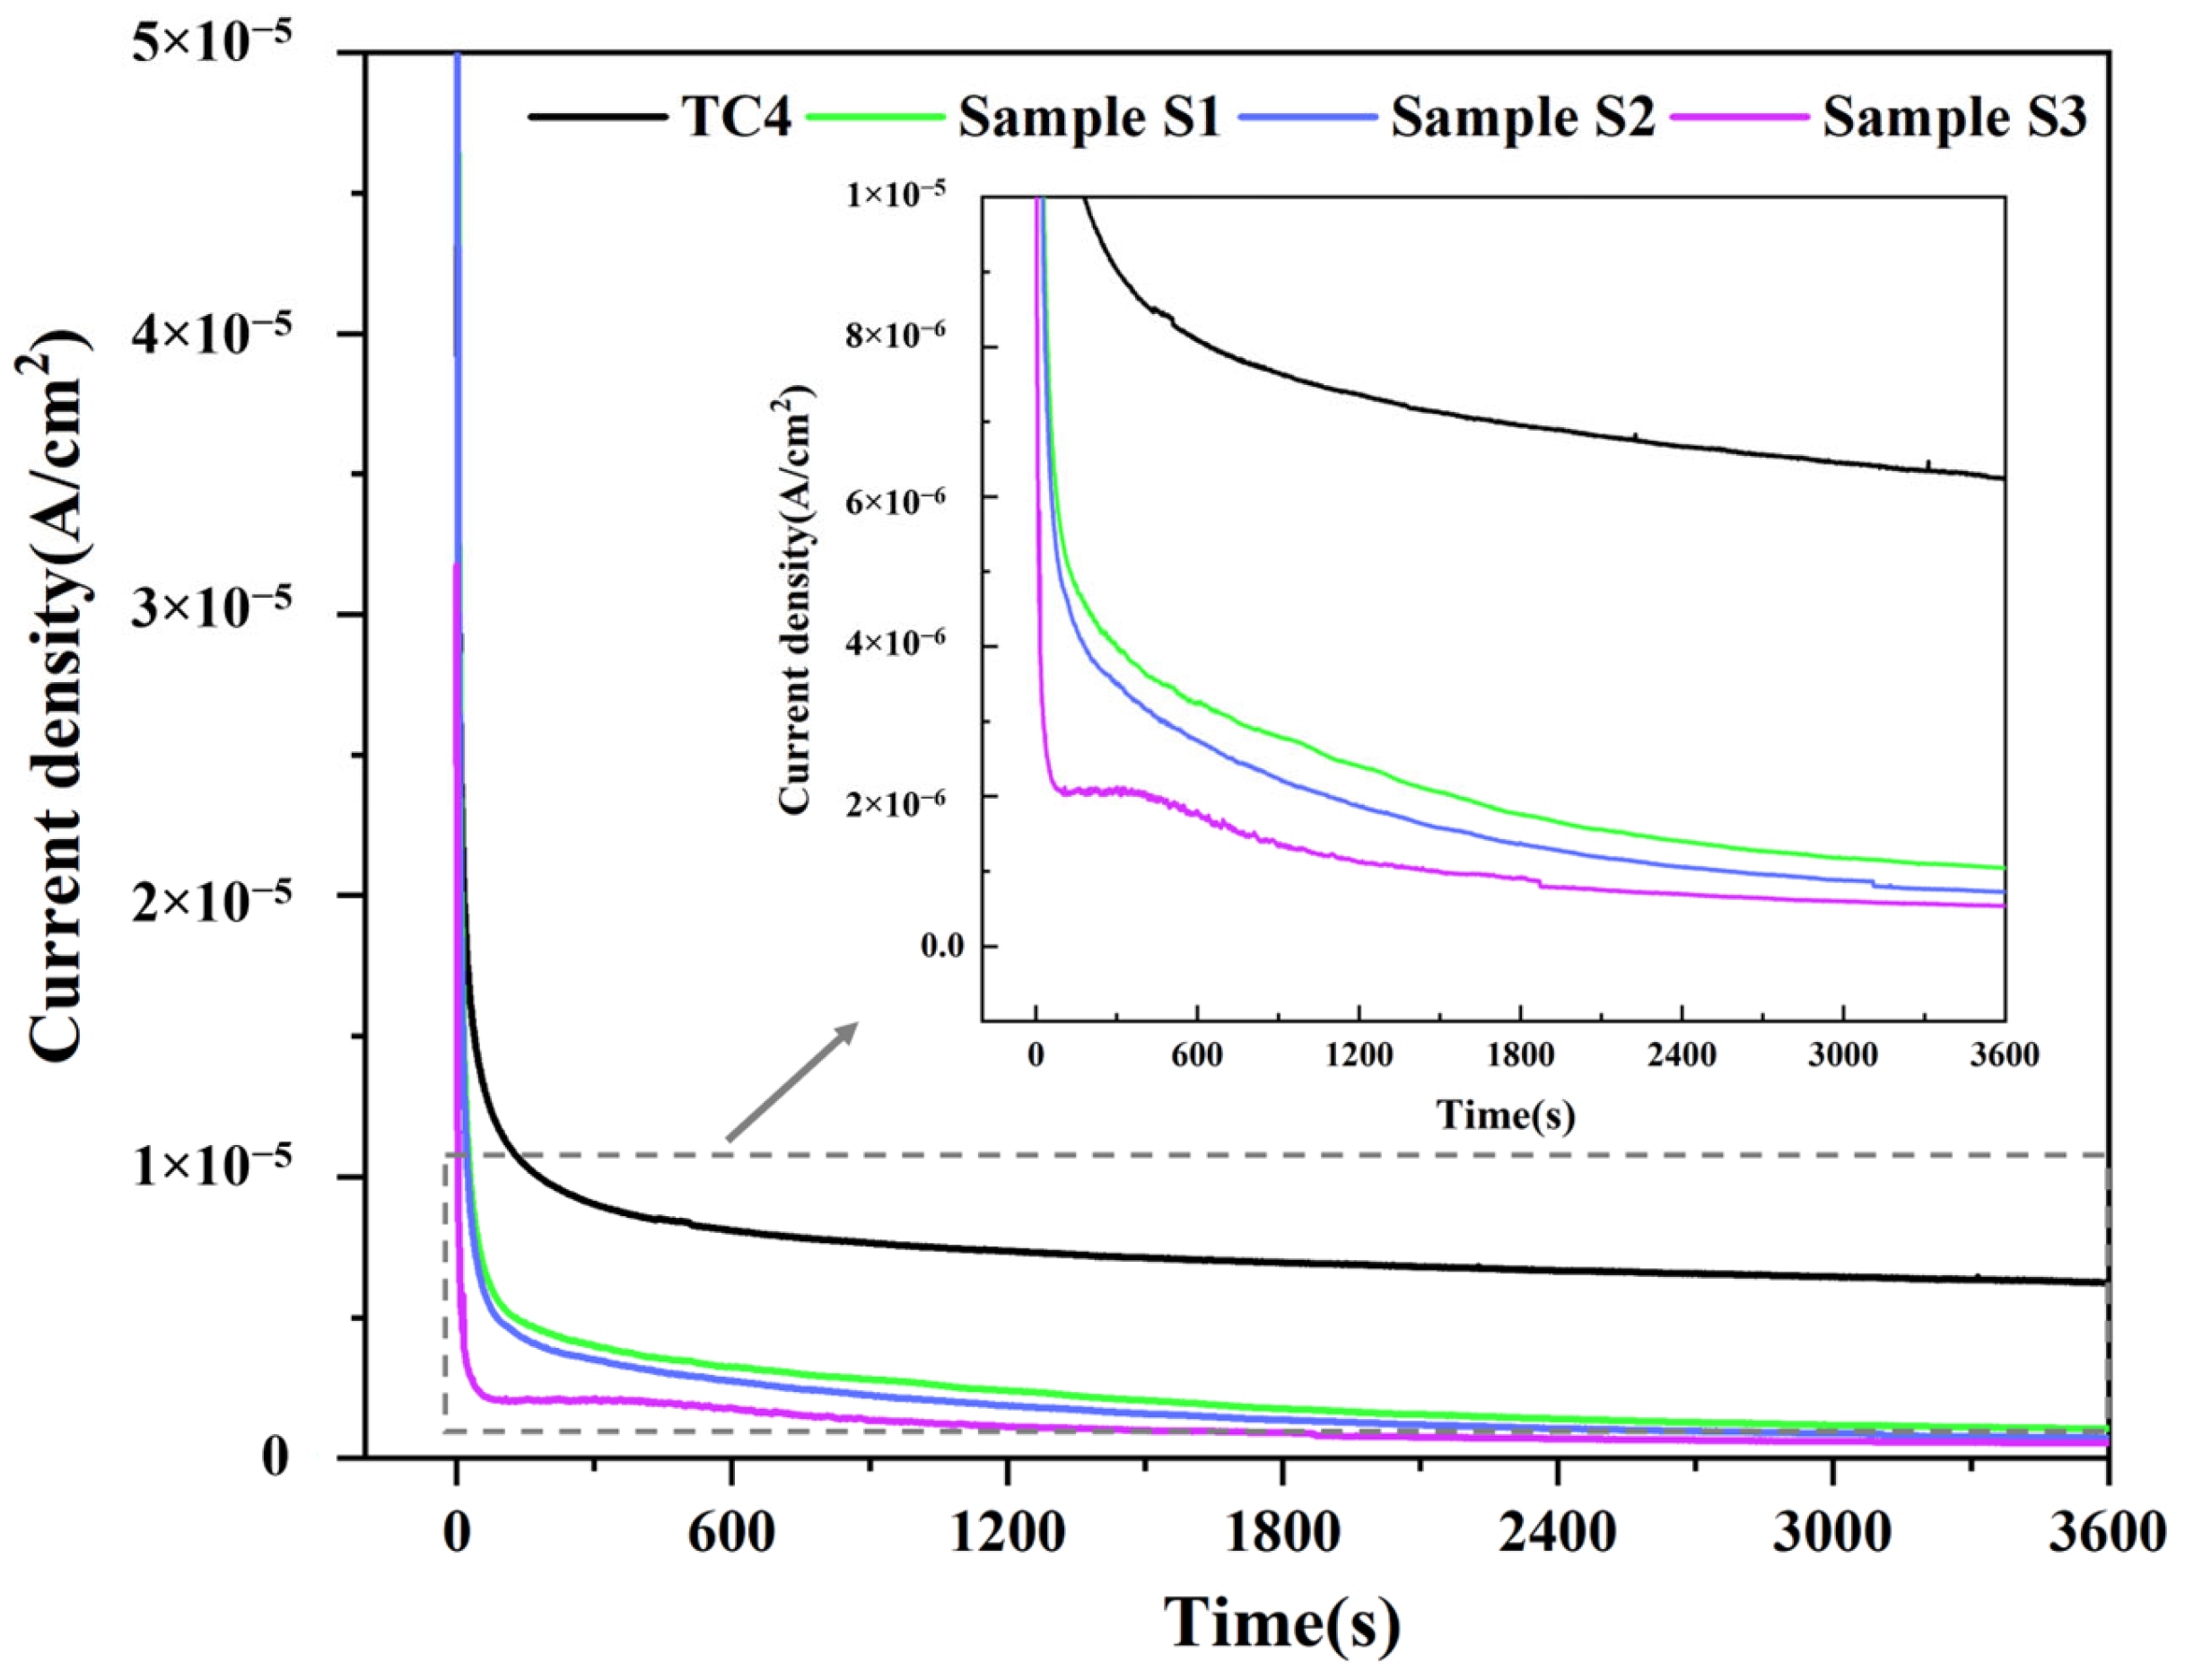
To assess the durability of different NbNx coatings in operational conditions, potentiostatic polarization tests were carried out for 1 h in a simulated PEMFC cathode environment (+0.6 V, 70 °C). The polarization curve is shown in Figure 6. Initially, the current density of all samples decreased sharply during the test, potentially attributed to the development of a passivation layer on the NbNx coating’s surface, and then was maintained at a relatively stable value [16]. At the end of the test, the current densities of TC4 and Samples S1, S2, and S3 were 6.2, 1.04, 0.72 and 0.54 μA/cm2, respectively. Sample S3 exhibited the lowest corrosion current density of all the coatings, indicating excellent passivation performance, enhanced corrosion protection and satisfaction of the U.S. DOE requirement (icorr < 1.0 μA/cm2).
The surface morphology after the polarization test also showed the same results, as shown in the Figure 7. A clear break-up of the passivation film can be observed in the SEM morphology of the TC4 substrate, which is probably attributable to the corrosive dissolution of the TiO2 film in the acidic solution [34,36]. In addition, no obvious corrosion signs such as coating flaking or corrosion pits were found on any of the coating surfaces, which indicates that all the NbNx coatings, especially Sample S3, had better stability and corrosion resistance compared with the Ti substrate.
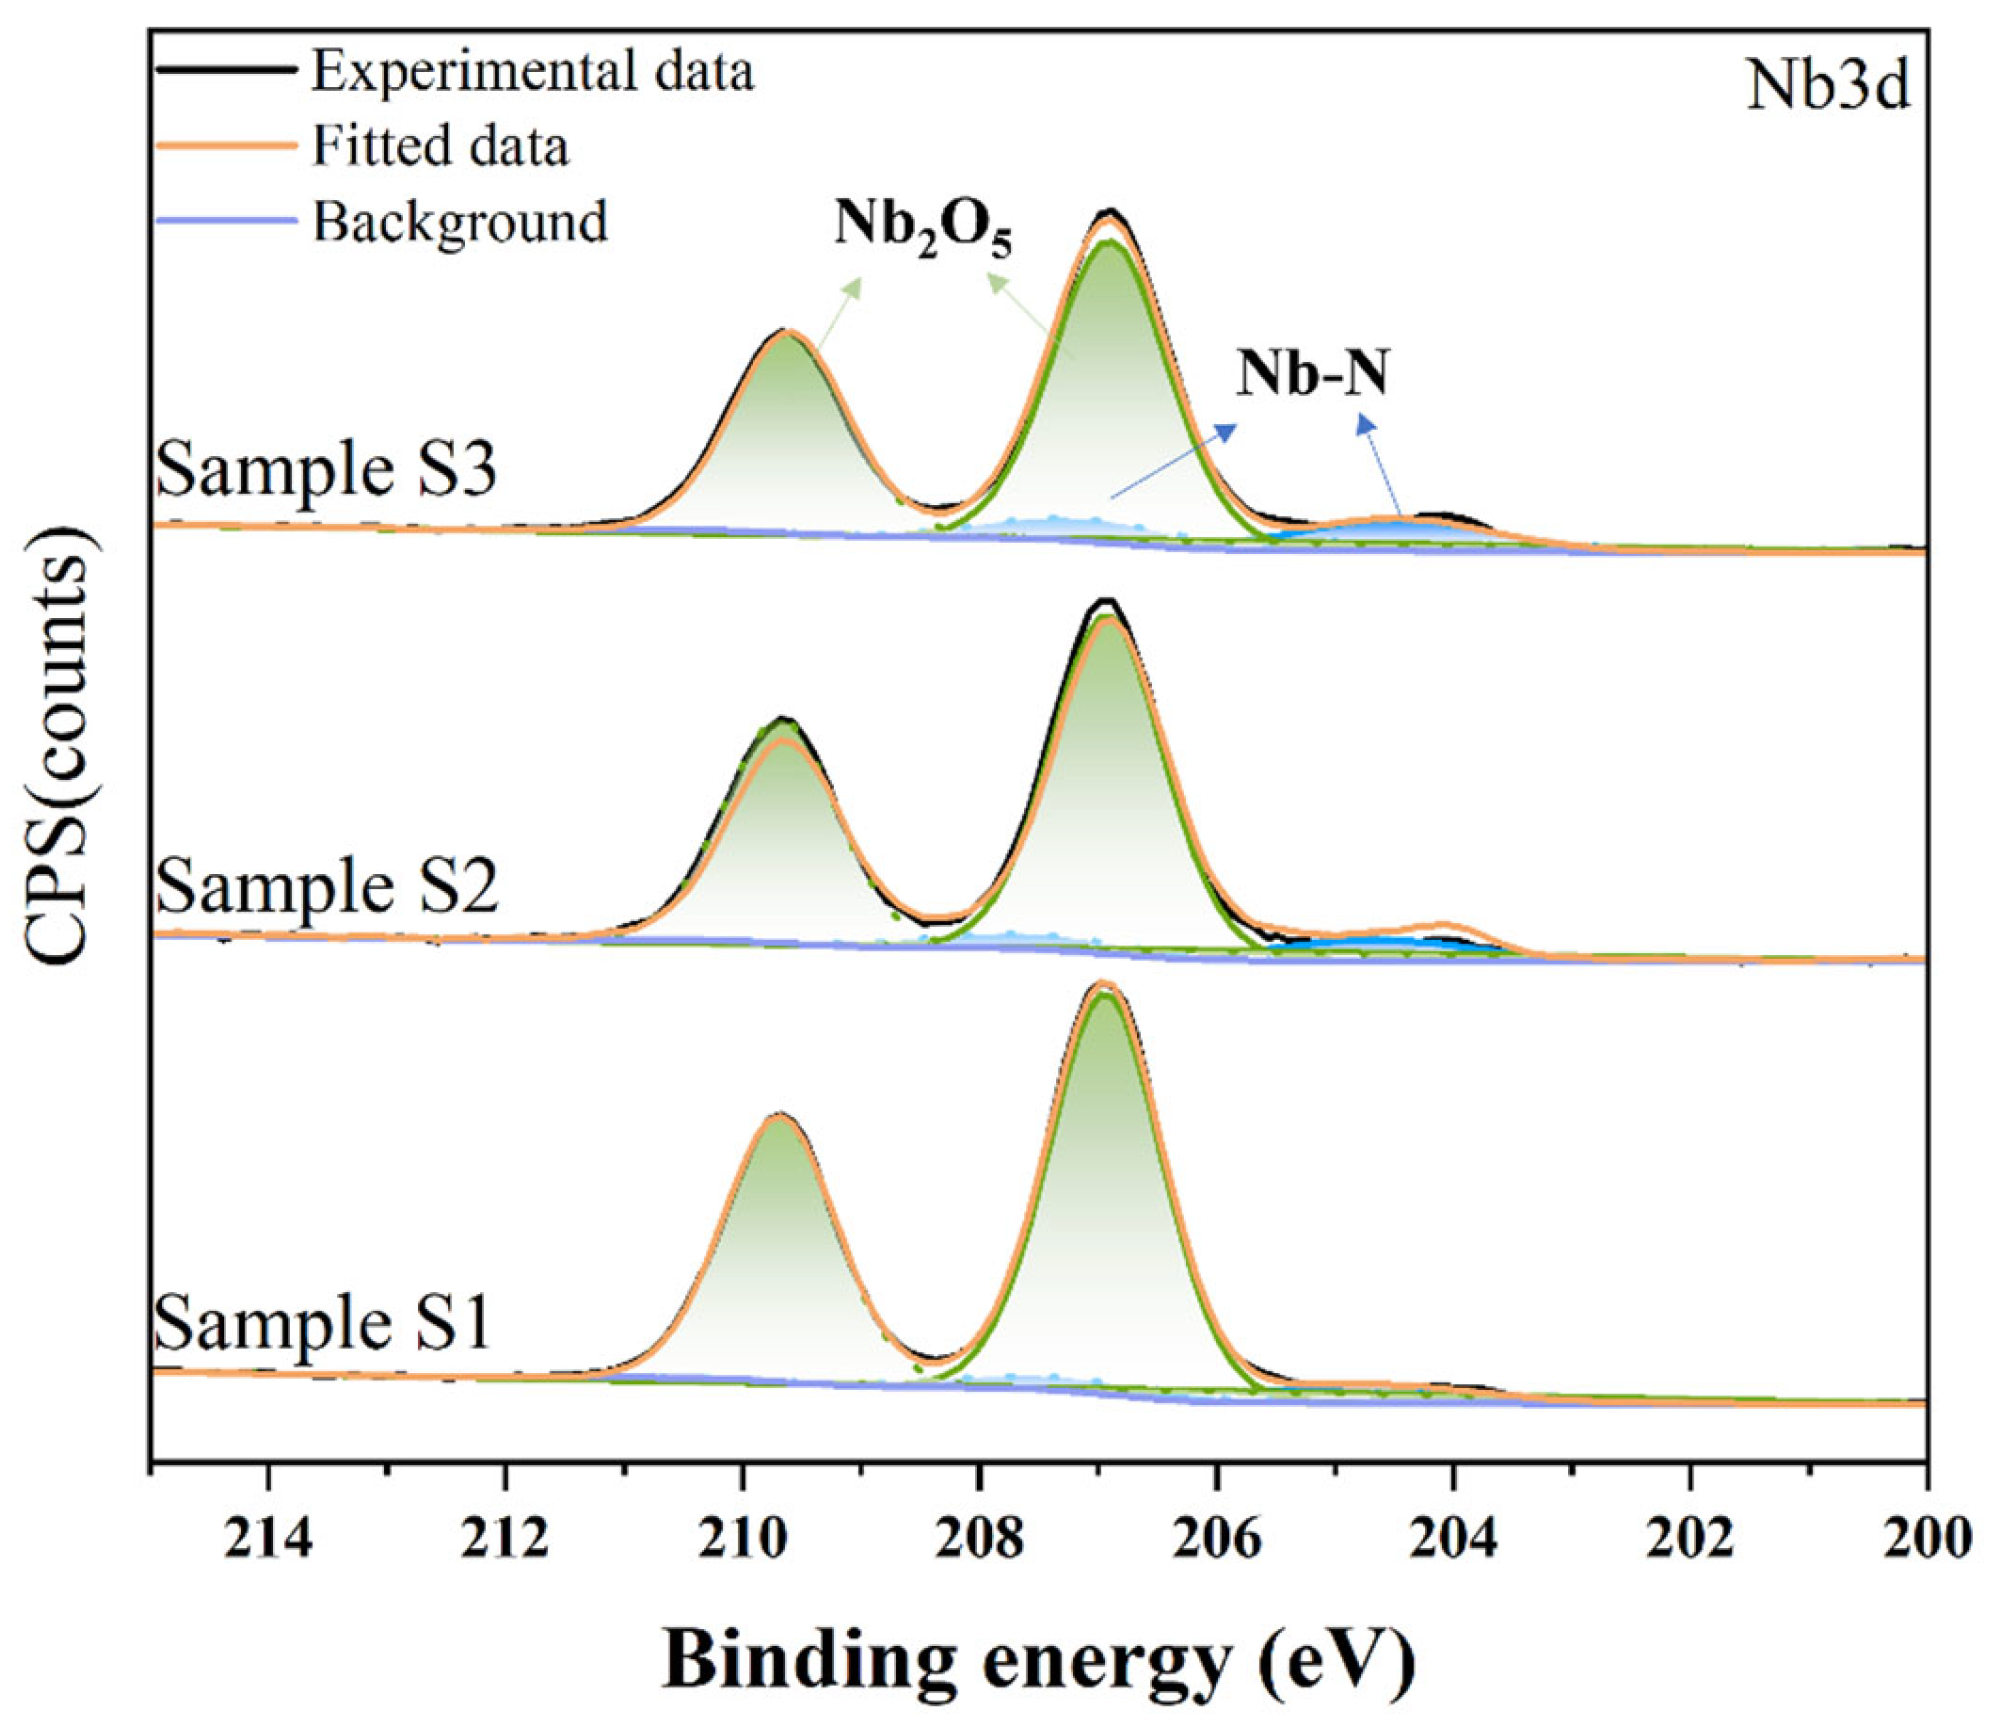
After the potentiostatic polarization test, XPS was used to test the surface element state of the coating corrosion area. Figure 8 clearly shows the Nb2O5 peaks at 206.94 and 209.68 eV and several NbN peaks, indicating that the coating elements were mainly metal oxides. The Nb2O5 passivation film can inhibit the corrosion of solution ions. As shown in Figure 6, the current density was relatively low. As the nitrogen content increased, the area occupied by the NbN peak also increased, from 7.97 % and 9.80 % to 14.74 %, which may be because Sample S3 had higher thermal stability. This is consistent with the results shown in Figure 7, where the NbNx coating surface remains dense and smooth, while the TC4 substrate surface has cracked and peeled off.
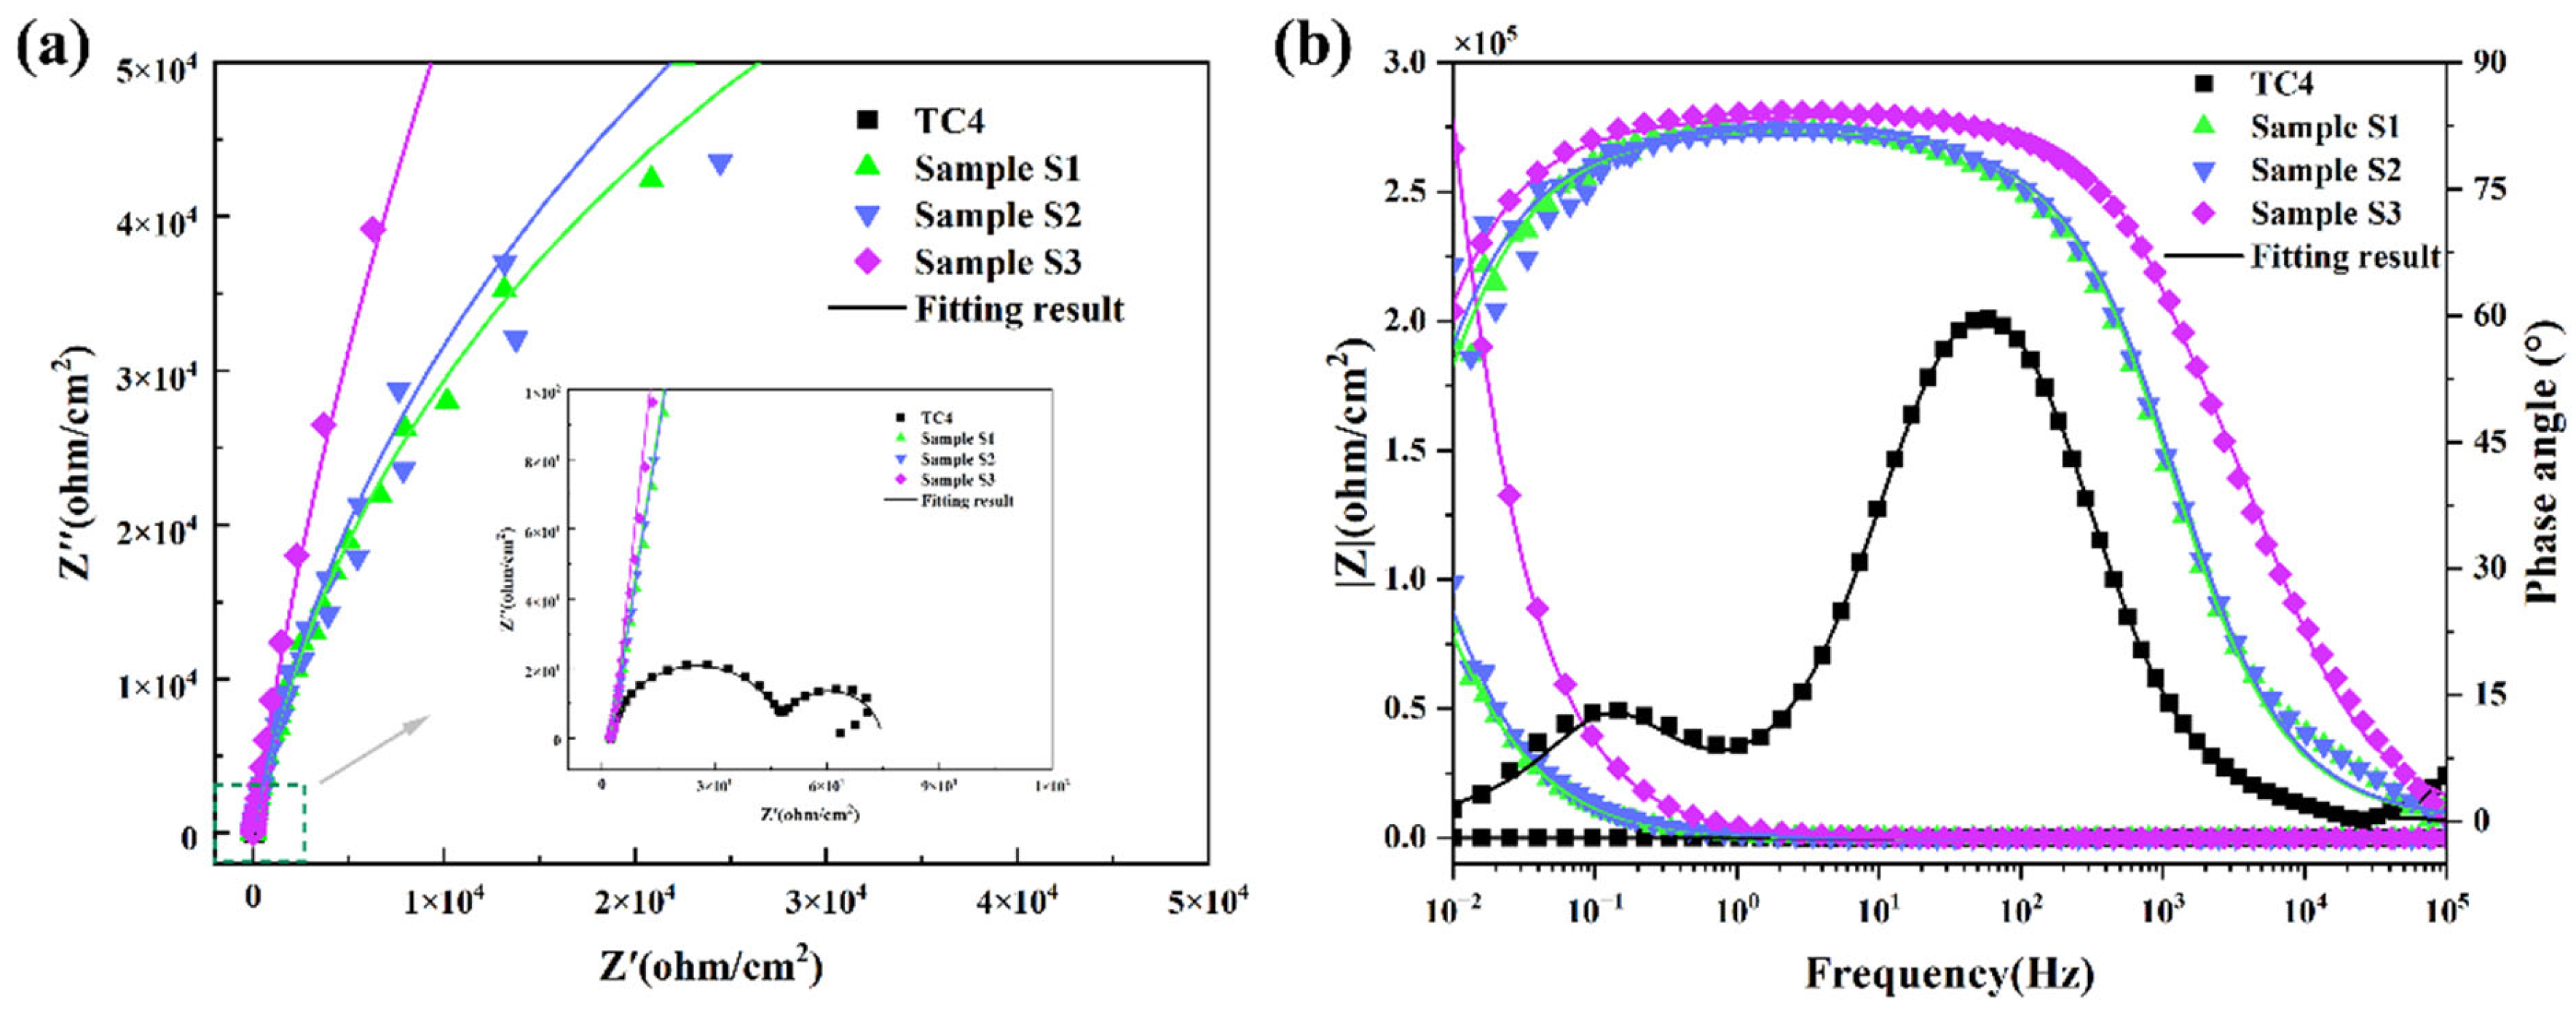
Figure 9 shows Nyquist and Bode plots for the TC4 substrate and the NbNx coatings under different N2 partial pressures. From the Nyquist curves (Figure 9a), all the NbNx coatings have significantly larger capacitive semicircle diameters than the titanium substrate, with the largest radius in Sample S3, indicating a larger capacitive reactance [37], and the TC4 alloy has two obvious capacitive loops (as seen in the local enlarged view). The frequency–phase angle plots (Figure 9b) reveal a plateau across a broad frequency range with a phase angle approaching 90 °, which indicates that all the NbNx coatings have higher chemical stability [38]. In the frequency–|Z| curves (Figure 9b), the values of the impedance modulus at a frequency of 10−2 are in the following order: Sample S3 > S2 > S1 > bare Ti substrate, which indicates that S3 has superior corrosion resistance [39]. Additionally, the Bode plots revealed a single time constant for the NbNx coatings, for which an equivalent circuit with one time constant was employed for simulating the EIS data (Figure 10b). In contrast, the titanium alloy substrate exhibited two distinct time constants (Figure 10a). The values for the fitted circuit elements are presented in Table 3. In the circuit model, Rs signifies the solution resistance, and Rp represents the resistance of the outer fractured passivation film, which was primarily affected by the continuous corrosion of the passivation film on the titanium alloy during the EIS test. The constant-phase element (CPE), related to the double-layer capacitance, serves as a replacement for pure capacitance owing to the inhomogeneity of the electrode surface [40], and the impedance of CPE can be mathematically expressed as
Z C P E = Q j w n 1
where Q is the admittance magnitude of CPE, j is an imaginary unit, and w is the angular frequency. The factor n represents the CPE exponent; when n = 1, CPE can be equated to a pure capacitance, usually 0 < n < 1. The closer the value is to 0, the higher the inhomogeneity of the sample surface. Generally, Rct stands for the charge transfer resistance, and it indicates the ability to prevent metallic ion dissolution, so larger values indicate better corrosion resistance [41,42]. From Table 3, the Rct values of all NbNx coating samples are much larger than that of the TC4 substrate, exceeding it by five orders of magnitude, and Sample S3 has the highest Rct value of 7.37 × 10⁵ Ω/cm2, so it can be assumed that S3 has the best corrosion resistance.
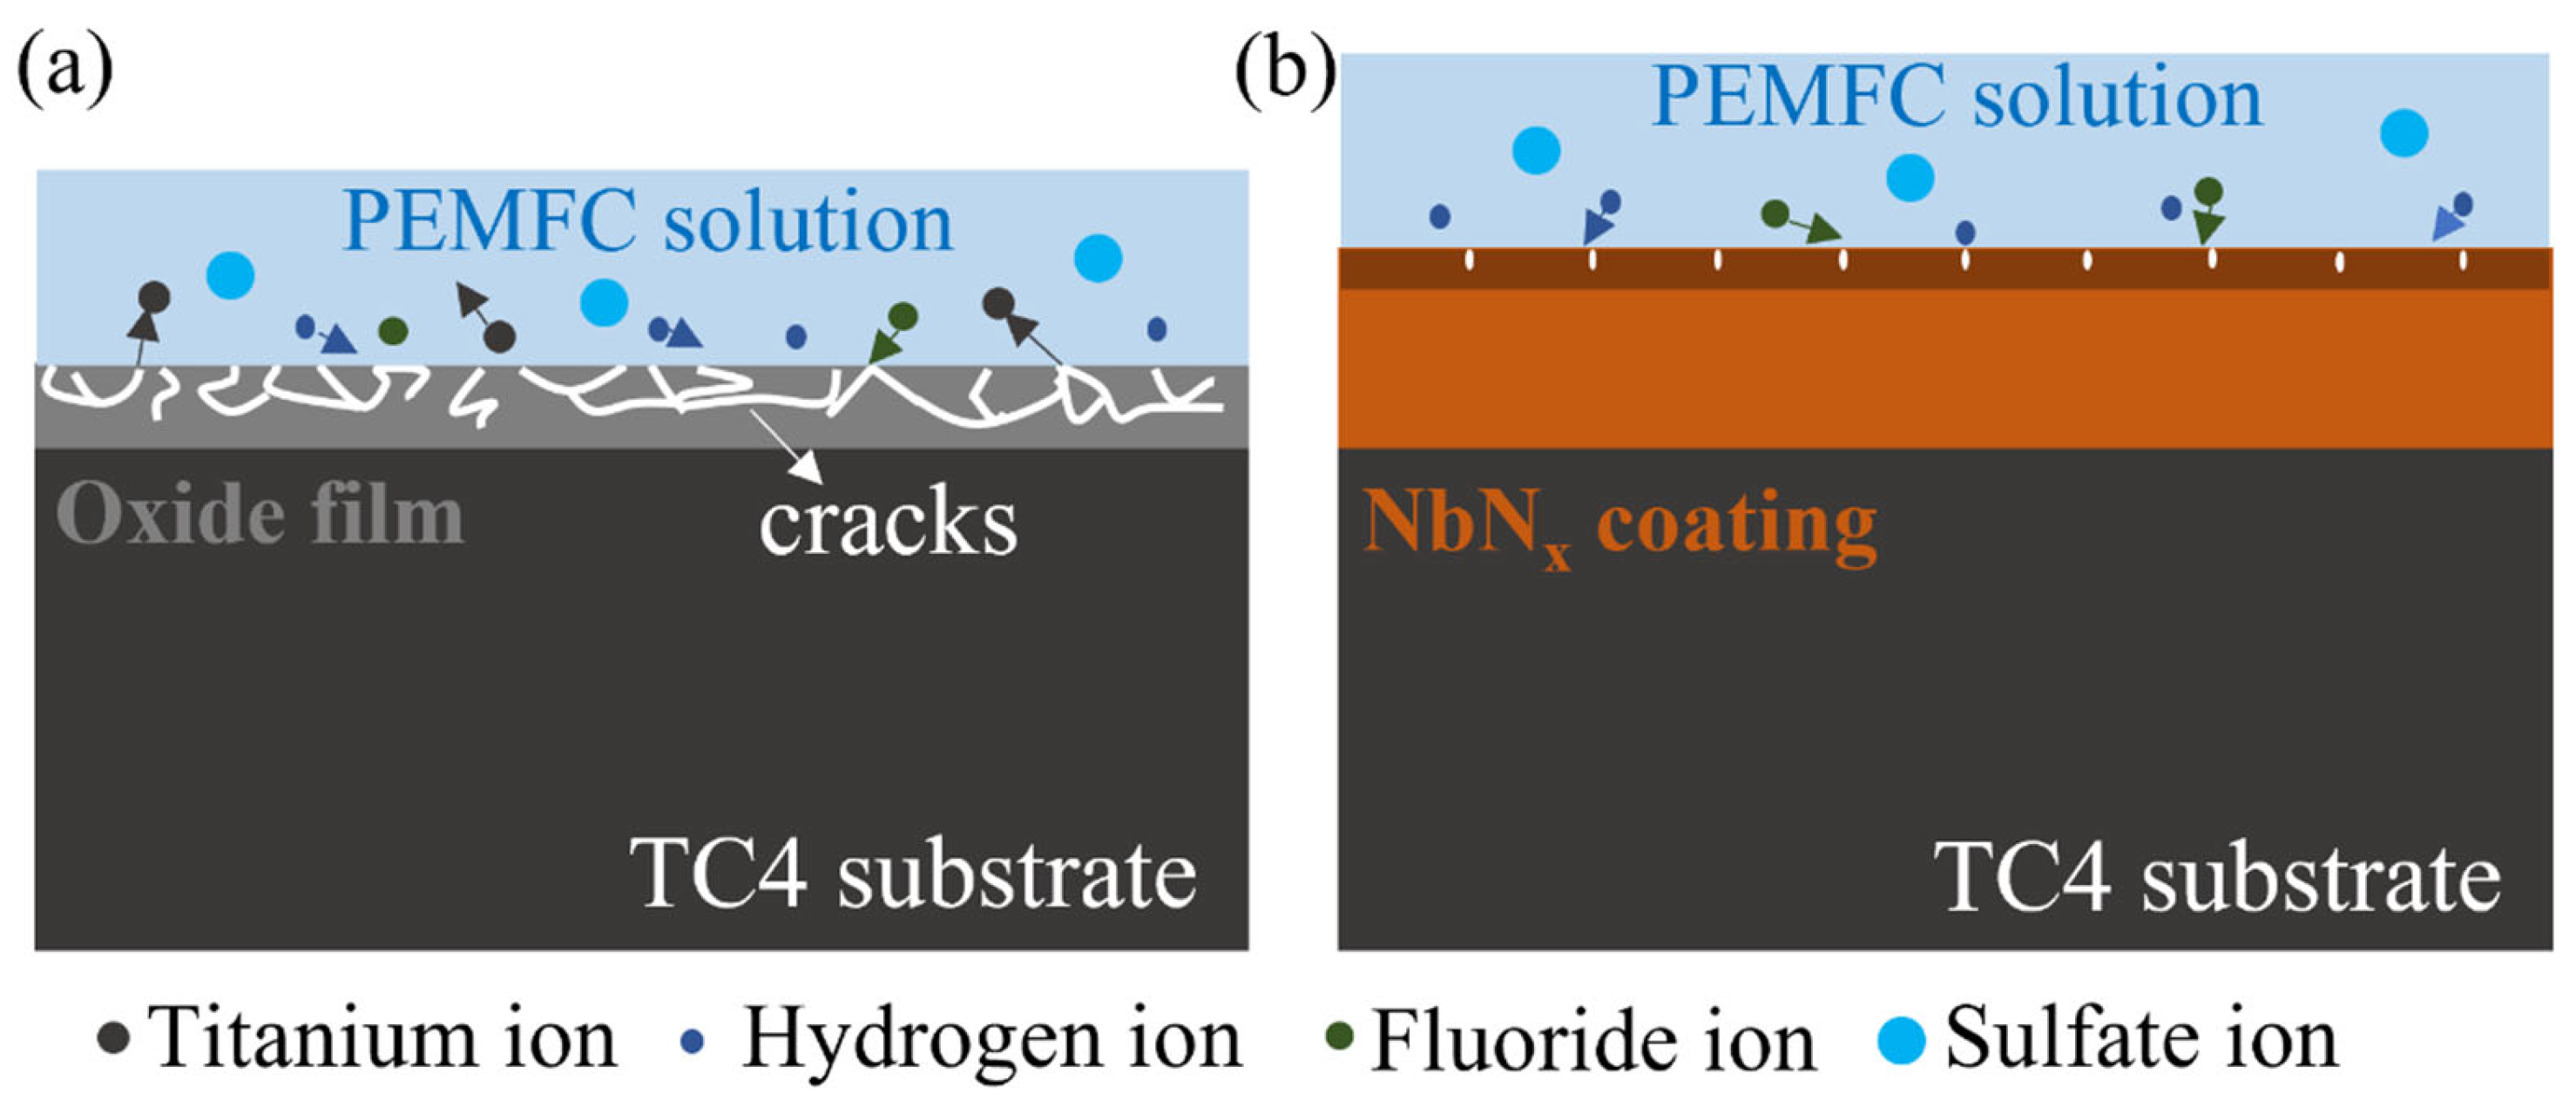
The oxide film on the surface of titanium alloys is the main reason for their excellent corrosion resistance in normal environments; however, the oxide film can easily rupture in simulated working environments, providing a diffusion channel for corrosive ions to erode and cause continuous corrosion (Figure 11a). This can be clearly demonstrated by the surface morphology of TC4 alloy after constant potential polarization (Figure 7(a1,a2)). As shown in Figure 11b, the metal oxides formed by passivation of the NbNx coatings can improve the corrosion resistance of titanium bipolar plates under high and fluctuating potentials; the non-existence of corrosion pits and flaking on the coated surface (Figure 7) attests to the very low corrosion rate. However, the passivation layer may dissolve under long-term continuous corrosion, which can be described as [19]
2 N b N + 5 H 2 O = N b 2 O 5 + 10 H + + N 2
N b 2 O 5 + 10 H + + 14 F = 2 N b F 7 2 + 5 H 2 O
The equilibrium between the formation and dissolution of the oxide layer dominates the corrosion resistance and stability of the NbNx coatings. At the working potential of 0.6 V, the potentiostatic polarization current densities of the NbNx coatings stabilized at a very low value, and the coatings showed superior corrosion resistance and electrochemical stability. However, at higher operating voltages, the oxide film on the surface of the NbNx coating may undergo more severe dissolution [43].

3.3. ICR and Hydrophobicity

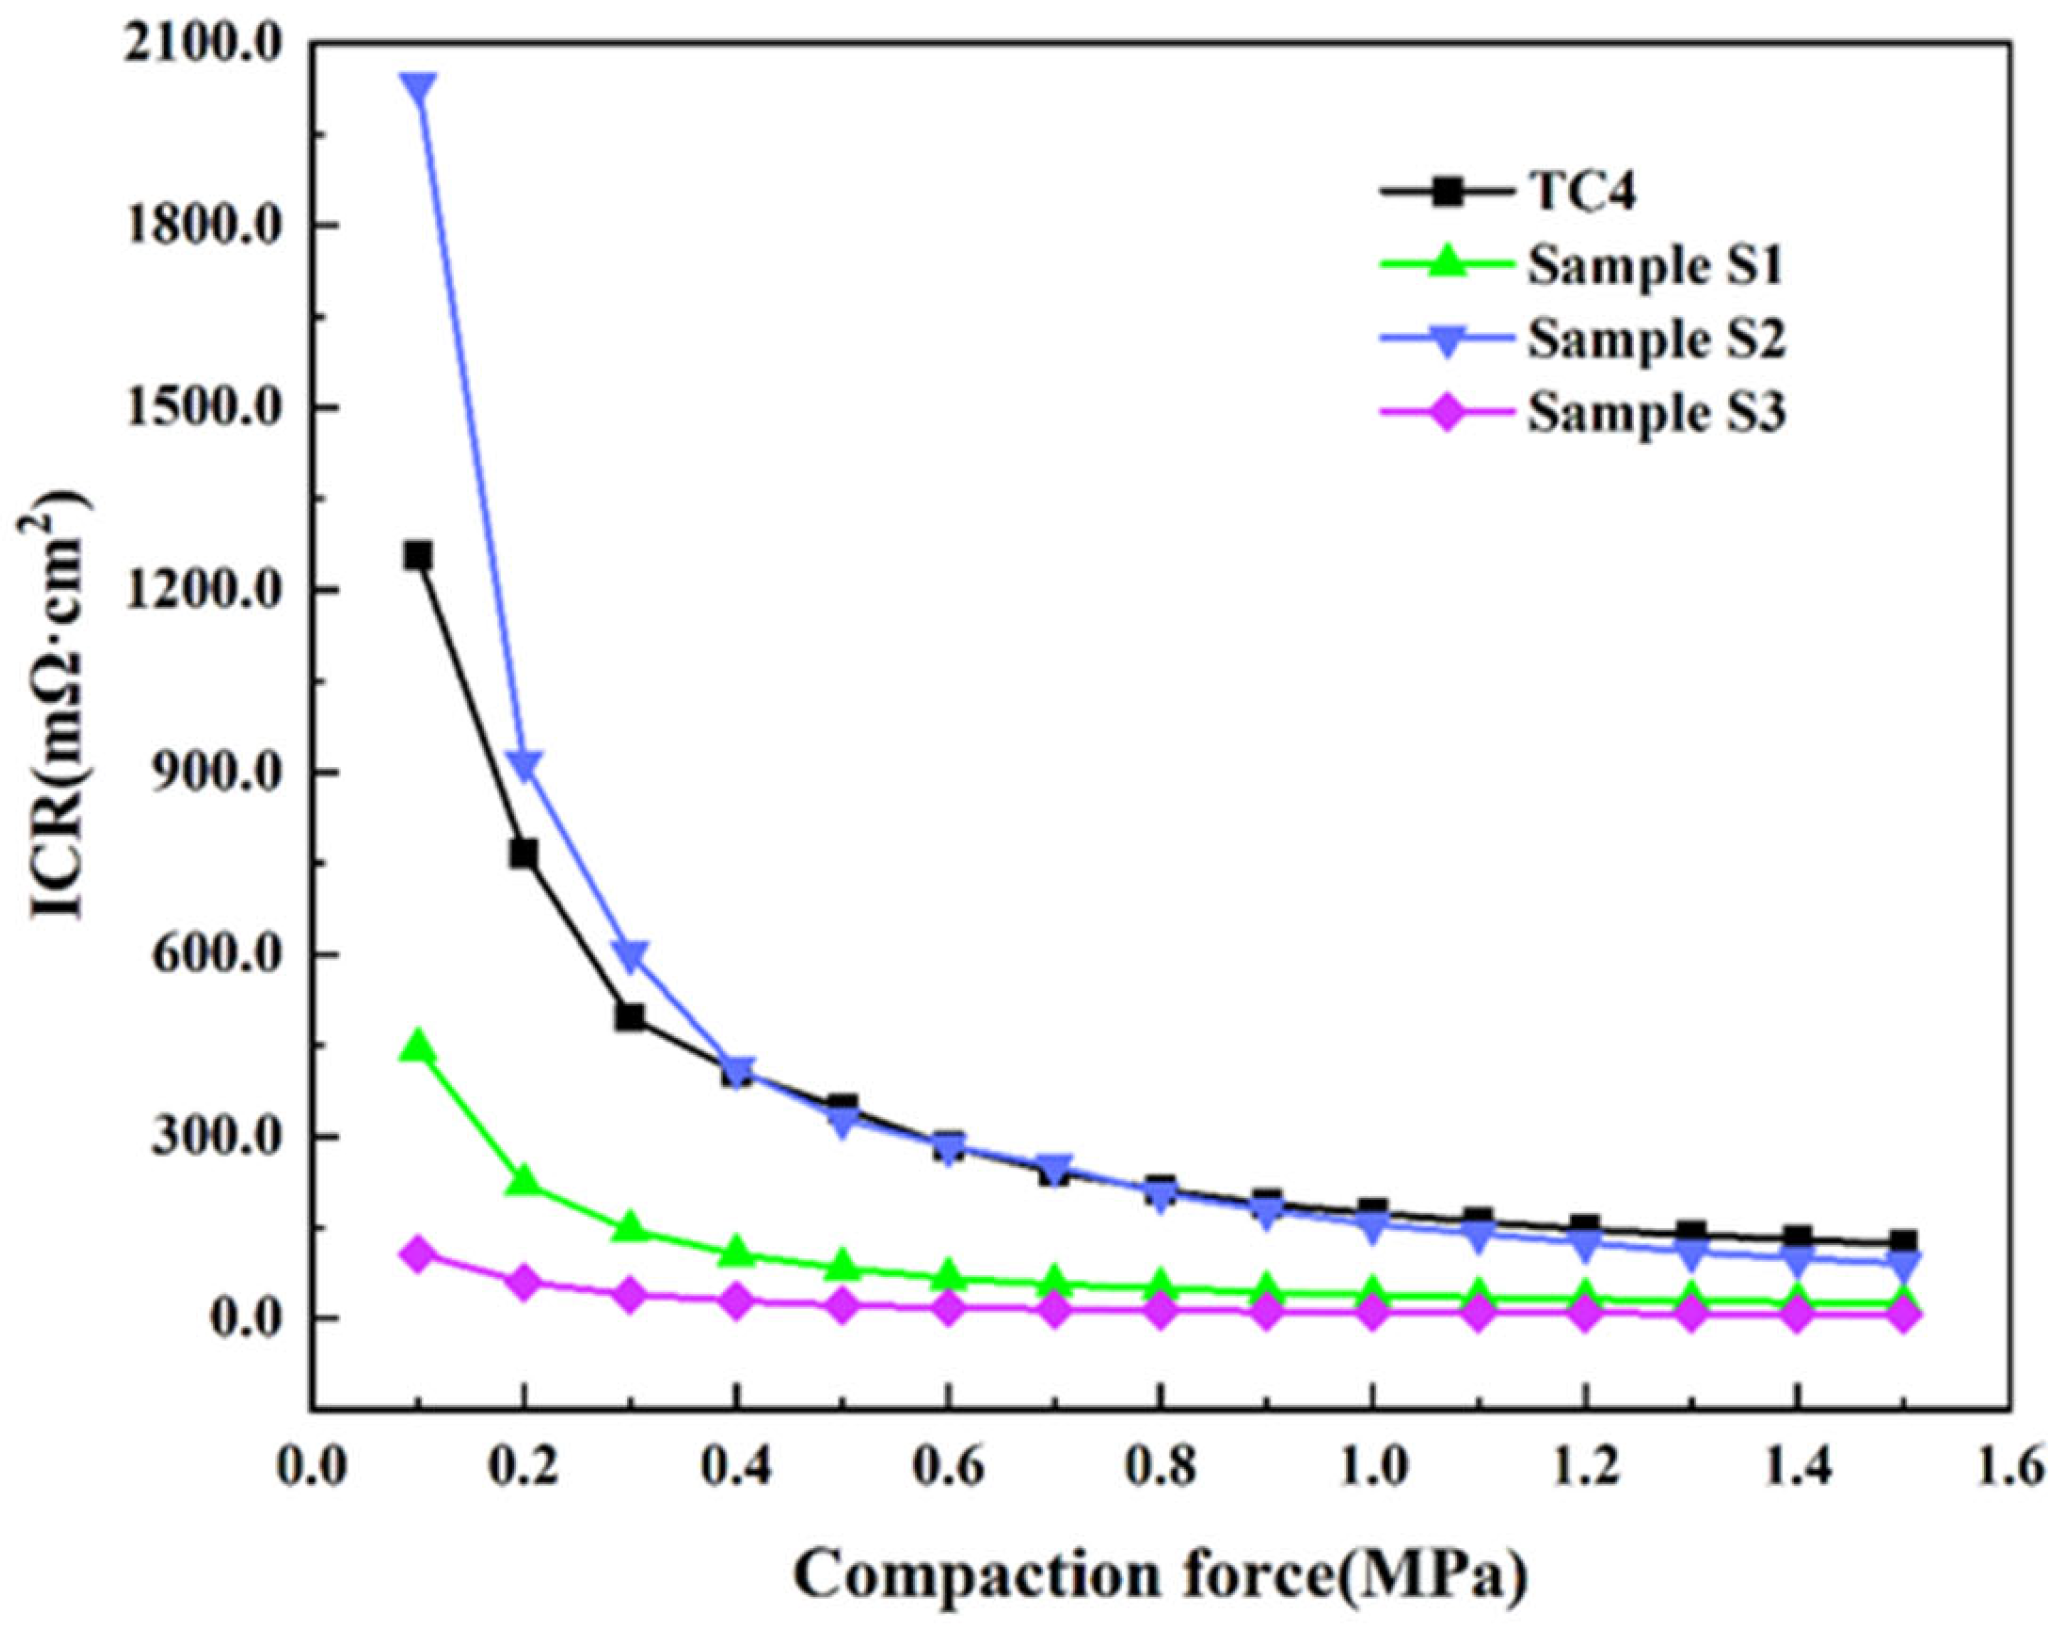
The interfacial contact resistance between the bipolar plate and gas diffusion layer is of great importance in maintaining the high performance of PEMFCs. The ICR values of the TC4 alloy and NbNx coatings were measured as shown in Figure 12. The ICR values of the NbNx coatings and the substrate followed the same trend, which quickly decreased and gradually stabilized at a value with the increase in pressure. This is mainly because of the larger effective contact area between the carbon paper and the tested samples during the test process [44]. It is common for PEMFC stacks to be assembled with a force of about 1.5 MPa, at which the ICR value of the Ti substrate was 122.34 mΩ·cm2, and the value of Sample S1, S2, and S3 was 24.93, 90.69 and 7.29 mΩ·cm2, respectively. Compared with the TC4 substrate, the ICR values of Samples S1, S2 and S3 decreased by 79.62%, 25.87% and 94.04%, respectively. The higher ICR values for titanium alloys than for NbNx coatings are mainly due to the formation of a surface oxide film [45]. The phase of S2 is a mixture of β-Nb2N and δ′-NbN, which reduces the electron conduction efficiency of the coating, so the ICR value is relatively low, while S1 and S3 have more similar and lower ICR values. Sample S3 satisfies the DOE’s target value (< 10 mΩ·cm2) at the compaction force of 1.5 MPa, which indicates that the coating enhances the electrical conductivity of the bare Ti substrate.
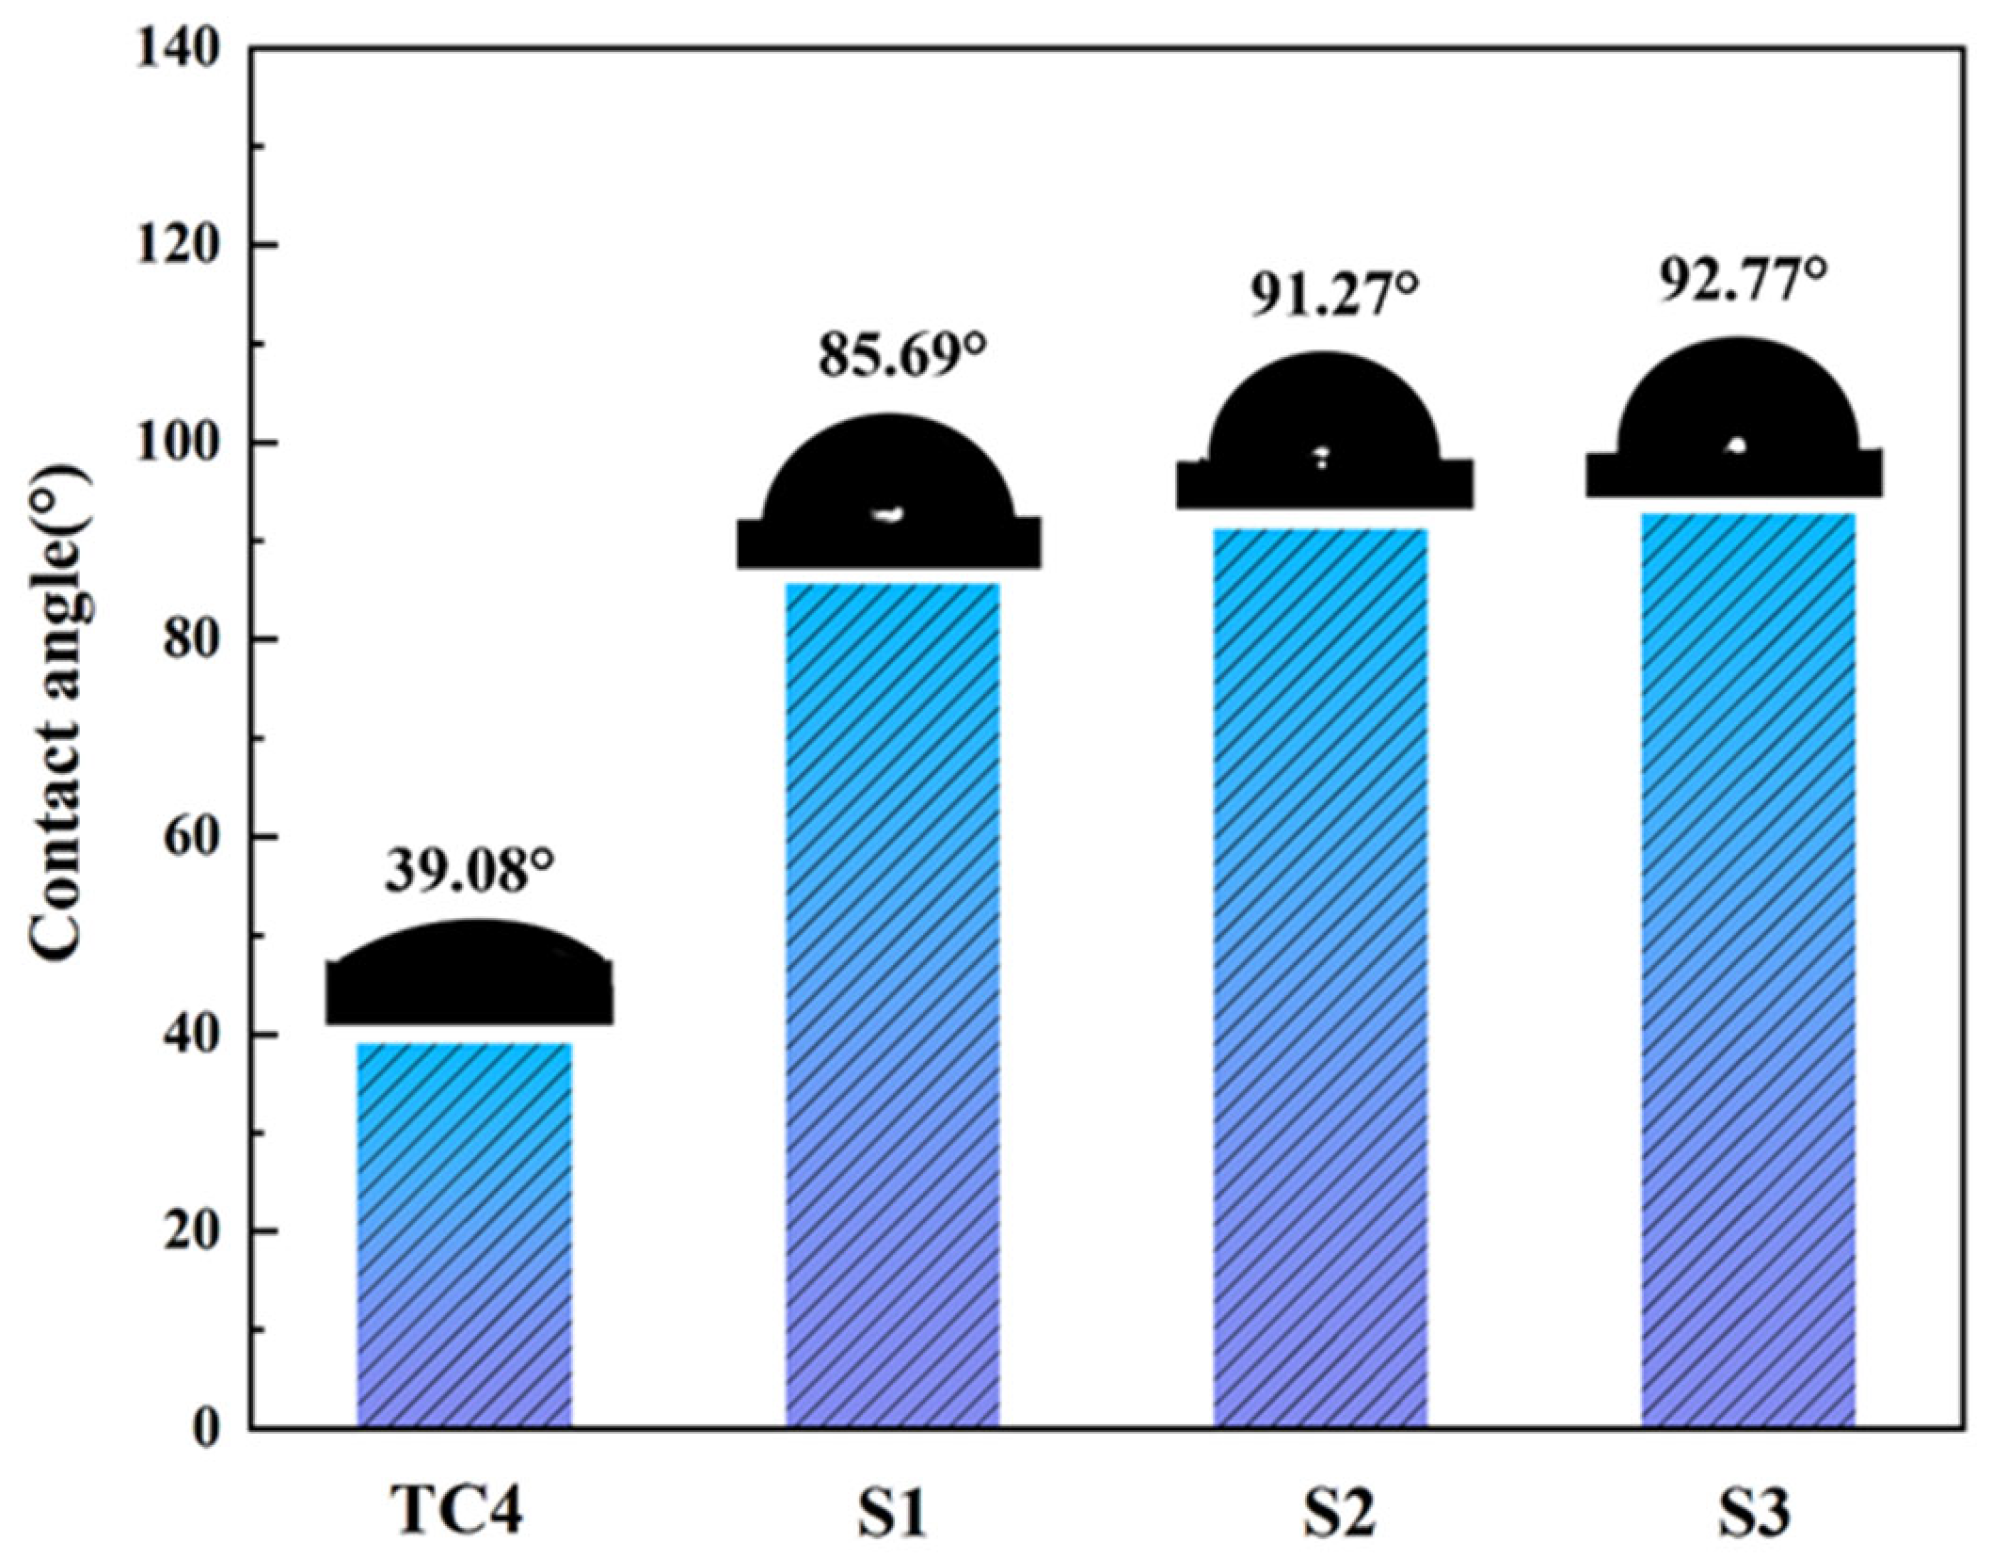
The hydrophobicity of the bipolar plates is vital for water management in fuel cells, as we know that water in a normal operating environment mainly comes from the redox reaction of oxygen and hydrogen. If the wettability of the bipolar plates is greater, then water will accumulate on the bipolar plates, thus impeding the flow of reactive gases and accelerating the corrosion of the metal bipolar plates [46]. Figure 13 presents the water contact angle of the TC4 substrate and the NbNx coatings. A substantial contact angle indicates greater hydrophobicity and lower wettability. The contact angles measured for the TC4 substrate and Samples S1, S2 and S3 were 39.08°, 85.69°, 91.27° and 92.77°, respectively; the value for Sample S3 was three times that for the TC4 alloy. Notably, there was no discernible variance in hydrophobicity between NbNx coatings with distinct phases. The lower hydrophobicity of the titanium alloy is mainly due to the formation of a surface oxide film with a higher electronegativity of oxygen than that of nitrogen and niobium, which results in a greater tendency to the generation of water. The higher hydrophobicity of the NbN coating means that there is a smaller area of contact with the electrolyte, thereby decreasing the corrosion rate of the metal bipolar plate.

4. Conclusions

In this study, three NbNx coatings with varying N2/Ar ratios were effectively prepared on TC4 alloy substrate by using the double glow plasma alloying technique. The primary conclusions obtained were as follows:
(1) The NbNx coatings were homogeneous and dense, and bonded firmly with the substrate. The phase of the coatings transformed from the β- Nb2N phase to δ′-NbN phase with the increase in N2/Ar ratio. The hardness value of the NbNx coating gradually increased, and the coating’s load-bearing capacity improved with the increase in nitrogen content.
(2) The potentiodynamic polarization test showed that the coatings had lower Icorr, the value of Icorr for Sample S3 was only 8.92 × 10⁻⁶ A/cm2 under the working voltage of 0.6V, and its protection efficiency was more than 96%. The potentiostatic polarization test showed that S3 had the lowest Icorr value of 0.54 μA/cm2, and there were no obvious corrosion scars on the surface of the coating. The EIS test showed that S3 had a larger impedance modulus and fitted Rct value. It can be speculated that a coating with the δ′-NbN phase can substantially enhance the corrosion resistance of the substrate.
(3) The NbNx coatings had good conductivity and better hydrophobicity than the titanium substrate.

Author Contributions

Conceptualization, S.L. and P.Z.; Methodology, B.D.; Investigation, B.D.; Resources, P.Z.; Data curation, Y.H. and D.C.; Writing—original draft, B.D., D.C. and M.Z.; Writing—review and editing, K.Y. and F.D.; funding acquisition, F.D. All authors have read and agreed to the published version of the manuscript.

Funding

This research was funded by the Natural Science Foundation of the Jiangsu Higher Education Institutions of China, grant number 23KJB430012.

Institutional Review Board Statement

Not applicable.

Informed Consent Statement

Not applicable.

Data Availability Statement

Data will be made available on request.

Conflicts of Interest

Author Kai Yang was employed by the company Jiangsu JlTRl Surface Engineering Technology Research Institute Co., Ltd. The remaining authors declare that the research was conducted in the absence of any commercial or financial relationships that could be construed as a potential conflict of interest.

References

  1. Pan, T.; Zhang, B.; Li, J.; He, Y.; Lin, F. An investigation on corrosion protection of chromium nitride coated Fe–Cr alloy as a bipolar plate material for proton exchange membrane fuel cells. J. Power Sources 2014, 269, 81–87. [Google Scholar] [CrossRef]
  2. Antunes, R.A.; Oliveira, M.C.L.; Ett, G.; Ett, V. Corrosion of metal bipolar plates for PEM fuel cells: A review. Int. J. Hydrogen Energy 2010, 35, 3632–3647. [Google Scholar] [CrossRef]
  3. Yang, L.X.; Liu, R.J.; Wang, Y.; Liu, H.J.; Zeng, C.L.; Fu, C. Corrosion and interfacial contact resistance of nanocrystalline β-Nb2N coating on 430 FSS bipolar plates in the simulated PEMFC anode environment. Int. J. Hydrogen Energy 2021, 46, 32206–32214. [Google Scholar] [CrossRef]
  4. Kumar, A.; Ibraheem, S.; Ali, S.; Maiyalagan, T.; Javed, M.S.; Gupta, R.K.; Saad, A.; Yasin, G. Polypyrrole and Polyaniline-Based Membranes for Fuel Cell Devices: A Review. Surf. Interfaces 2022, 29, 101738. [Google Scholar] [CrossRef]
  5. Hermann, A.; Chaudhuri, T.; Spagnol, P. Bipolar plates for PEM fuel cells: A review. Int. J. Hydrogen Energy 2005, 30, 1297–1302. [Google Scholar] [CrossRef]
  6. Wang, Y.; Northwood, D. An investigation of the electrochemical properties of PVD TiN-coated SS410 in simulated PEM fuel cell environments. Int. J. Hydrogen Energy 2007, 32, 895–902. [Google Scholar] [CrossRef]
  7. Maistro, G.; Kante, S.; Nyborg, L.; Cao, Y. Low-temperature carburized high-alloyed austenitic stainless steels in PEMFC cathodic environment. Surf. Interfaces 2021, 24, 101093. [Google Scholar] [CrossRef]
  8. Asri, N.F.; Husaini, T.; Sulong, A.B.; Majlan, E.H.; Daud, W.R.W. Coating of stainless steel and titanium bipolar plates for anticorrosion in PEMFC: A review. Int. J. Hydrogen Energy 2017, 42, 9135–9148. [Google Scholar] [CrossRef]
  9. Wu, S.; Yang, W.; Yan, H.; Zuo, X.; Cao, Z.; Li, H.; Shi, M.; Chen, H. A review of modified metal bipolar plates for proton exchange membrane fuel cells. Int. J. Hydrogen Energy 2021, 46, 8672–8701. [Google Scholar] [CrossRef]
  10. Wind, J.; Späh, R.; Kaiser, W.; Böhm, G. Metallic bipolar plates for PEM fuel cells. J. Power Sources 2002, 105, 256–260. [Google Scholar] [CrossRef]
  11. Wang, H. Stainless steel as bipolar plate material for polymer electrolyte membrane fuel cells. J. Power Sources 2003, 115, 243–251. [Google Scholar] [CrossRef]
  12. Garzon-Fontecha, A.; Castillo, H.; Restrepo-Parra, E.; De La Cruz, W. The role of the nitrogen flow rate on the transport properties of CrN thin films produced by DC magnetron sputtering. Surf. Coat. Technol. 2018, 334, 98–104. [Google Scholar] [CrossRef]
  13. Pei, C.; Deng, L.; Xiang, C.; Zhang, S.; Sun, D. Effect of the varied nitrogen vacancy concentration on mechanical and electrical properties of ZrNx thin films. Thin Solid Film. 2019, 683, 57–66. [Google Scholar] [CrossRef]
  14. Li, T.; Yan, Z.; Liu, Z.; Yan, Y.; Chen, Y. Surface microstructure and performance of TiN monolayer film on titanium bipolar plate for PEMFC. Int. J. Hydrogen Energy 2021, 46, 31382–31390. [Google Scholar] [CrossRef]
  15. Alishahi, M.; Mahboubi, F.; Khoie, S.M.; Aparicio, M.; Hübner, R.; Soldera, F.; Gago, R. Electrochemical behavior of nanocrystalline Ta/TaN multilayer on 316L stainless steel: Novel bipolar plates for proton exchange membrane fuel-cells. J. Power Sources 2016, 322, 1–9. [Google Scholar] [CrossRef]
  16. Chen, J.; Zhang, S.; Li, J.; Chen, Z.; Sun, D. Effects of phase transformation on the corrosion resistance and conductivity of NbN coatings for metal bipolar plates. Surf. Coat. Technol. 2025, 497, 131800. [Google Scholar] [CrossRef]
  17. Mamun, M.; Farha, A.; Er, A.; Ufuktepe, Y.; Gu, D.; Elsayed-Ali, H.; Elmustafa, A. Nanomechanical properties of NbN films prepared by pulsed laser deposition using nanoindendation. Appl. Surf. Sci. 2012, 258, 4308–4313. [Google Scholar] [CrossRef]
  18. Gao, C.; Ran, Y.; Guo, Q.; Wang, T.; Lu, H.; Jiang, Z.; Wang, Z. Plasmonic characteristics of niobium nitride thin films modulated by assisting ions. Surf. Interfaces 2021, 24, 101024. [Google Scholar] [CrossRef]
  19. Sun, W.; Lv, Y.; Gao, J.; Feng, Q.; Jia, B.; Ma, F. Highly conductive and corrosion-resistant NbN coatings on Ti bipolar plate for proton exchange membrane water electrolysis. J. Mater. Sci. Technol. 2024, 210, 86–96. [Google Scholar] [CrossRef]
  20. Daudt, N.F.; Schneider, A.D.; Arnemann, E.R.; Scheuer, C.J.; Dorneles, L.S.; Schelp, L.F. Fabrication of NbN-Coated Porous Titanium Sheets for PEM Electrolyzers. J. Mater. Eng. Perform. 2020, 29, 5174–5183. [Google Scholar] [CrossRef]
  21. Yi, J.; Miao, Q.; Liang, W.; Ding, Z.; Qi, Y.; Lin, H.; Huang, C.; Li, Y. A study for pre-processing of Nb diffusion in Nb–N layer by double-glow plasma alloying. J. Alloy. Compd. 2020, 820, 153121. [Google Scholar] [CrossRef]
  22. Shen, H.; Wang, L. Characterization and properties of NbN–Nb bilayer formed on titanium for bipolar plates. Mater. Chem. Phys. 2022, 290, 126628. [Google Scholar] [CrossRef]
  23. Qi, Z.; Wu, Z.; Zhang, D.; Zuo, J.; Wang, Z. Microstructure, mechanical properties and oxidation behaviors of magnetron sputtered NbNx coatings. J. Alloy. Compd. 2016, 675, 22–30. [Google Scholar] [CrossRef]
  24. Cansever, N.; Danışman, M.; Kazmanlı, K. The effect of nitrogen pressure on cathodic arc deposited NbN thin films. Surf. Coat. Technol. 2008, 202, 5919–5923. [Google Scholar] [CrossRef]
  25. Alfonso, J.E.; Buitrago, J.; Torres, J.; Marco, J.F.; Santos, B. Influence of fabrication parameters on crystallization, microstructure, and surface composition of NbN thin films deposited by rf magnetron sputtering. J. Mater. Sci. 2010, 45, 5528–5533. [Google Scholar] [CrossRef]
  26. Chen, M.; Ding, J.C.; Kwon, S.-H.; Wang, Q.; Zhang, S. Corrosion resistance and conductivity of NbN-coated 316L stainless steel bipolar plates for proton exchange membrane fuel cells. Corros. Sci. 2022, 196, 110042. [Google Scholar] [CrossRef]
  27. Fenker, M.; Balzer, M.; Büchi, R.; Jehn, H.; Kappl, H.; Lee, J.-J. Deposition of NbN thin films onto high-speed steel using reactive magnetron sputtering for corrosion protective applications. Surf. Coat. Technol. 2002, 163–164, 169–175. [Google Scholar] [CrossRef]
  28. Sandu, C.; Benkahoul, M.; Parlinska-Wojtan, M.; Sanjinés, R.; Lévy, F. Morphological, structural and mechanical properties of NbN thin films deposited by reactive magnetron sputtering. Surf. Coat. Technol. 2006, 200, 6544–6548. [Google Scholar] [CrossRef]
  29. Sanjinés, R.; Benkahoul, M.; Sandu, C.S.; Schmid, P.E.; Lévy, F. Electronic States and Physical Properties of Hexagonal β-Nb2N and δ′-NbN Nitrides. Thin Solid Film. 2006, 494, 190–195. [Google Scholar] [CrossRef]
  30. Wang, T.; Cao, H.; Ma, X.; Shen, X.; Min, Y.; Xu, Q. Electrodeposited Ti3C2Tx MXene composite coating toward superior surface protection on aluminum alloy in PEMFC environments. Corros. Sci. 2024, 232, 112044. [Google Scholar] [CrossRef]
  31. Chang, C.-L.; Huang, C.-H.; Lin, C.-Y.; Yang, F.-C.; Tang, J.-F. Mechanical properties of amorphous and crystalline CrN/CrAlSiN multilayer coating fabricated using HPPMS. Surf. Interfaces 2022, 31, 102064. [Google Scholar] [CrossRef]
  32. Chen, X.; Du, Y.; Chung, Y.-W. Commentary on using H/E and H/E as proxies for fracture toughness of hard coatings. Thin Solid Film 2019, 688, 137265. [Google Scholar] [CrossRef]
  33. Johar, M.; Moradizadeh, L.; Gupta, A.; Chellehbari, Y.M.; Li, X.; Shahgaldi, S. Development of novel Nb and Ta multilayer coatings for corrosion protection of Ti-based bipolar plates for proton exchange membrane fuel cells. Corros. Sci. 2025, 245, 112707. [Google Scholar] [CrossRef]
  34. Heo, H.-S.; Kim, S.-J. Effects of PVD deposition method on electrochemical properties and interfacial contact resistance of CrN coated titanium as PEMFC bipolar plate. Trans. IMF 2023, 101, 261–268. [Google Scholar] [CrossRef]
  35. Conde, J.J.; Ferreira-Aparicio, P.; Chaparro, A.M. Anti-corrosion coating for metal surfaces based on superhydrophobic electrosprayed carbon layers. Appl. Mater. Today 2018, 13, 100–106. [Google Scholar] [CrossRef]
  36. Bocchetta, P.; Chen, L.-Y.; Tardelli, J.D.C.; dos Reis, A.C.; Almeraya-Calderón, F.; Leo, P. Passive Layers and Corrosion Resistance of Biomedical Ti-6Al-4V and β-Ti Alloys. Coatings 2021, 11, 487. [Google Scholar] [CrossRef]
  37. Liu, Q.; Ma, Q.-X.; Chen, G.-Q.; Cao, X.; Zhang, S.; Pan, J.-L.; Zhang, G.; Shi, Q.-Y. Enhanced corrosion resistance of AZ91 magnesium alloy through refinement and homogenization of surface microstructure by friction stir processing. Corros. Sci. 2018, 138, 284–296. [Google Scholar] [CrossRef]
  38. Chen, J.; Zhang, S.; Zheng, J.; Dong, Y.; Zhang, C.; Li, J.; Chen, Z.; Zhang, J.; Sun, D. Excellent anti-corrosion and conductivity of NbN coated on Ti bipolar plate by controlling N2 flow rates. J. Alloy. Compd. 2023, 976, 173033. [Google Scholar] [CrossRef]
  39. Jin, J.; Zhang, J.; Hu, M.; Li, X. Investigation of high potential corrosion protection with titanium carbonitride coating on 316L stainless steel bipolar plates. Corros. Sci. 2021, 191, 109757. [Google Scholar] [CrossRef]
  40. Jorcin, J.-B.; Orazem, M.E.; Pébère, N.; Tribollet, B. CPE analysis by local electrochemical impedance spectroscopy. Electrochim. Acta 2006, 51, 1473–1479. [Google Scholar] [CrossRef]
  41. Jin, J.; Zhao, X.; Liu, H. Durability and degradation of CrMoN coated SS316L in simulated PEMFCs environment: High potential polarization and electrochemical impedance spectroscopy (EIS). Int. J. Hydrogen Energy 2019, 44, 20293–20303. [Google Scholar] [CrossRef]
  42. Jeon, W.-S.; Kim, J.-G.; Kim, Y.-J.; Han, J.-G. Electrochemical properties of TiN coatings on 316L stainless steel separator for polymer electrolyte membrane fuel cell. Thin Solid Film. 2008, 516, 3669–3672. [Google Scholar] [CrossRef]
  43. Luo, X.; Chang, L.; Ren, C.; Ding, Y.; Zhang, J.; Zhang, D.; Yao, J.; Deng, Z.; Dong, C. Dynamic response to fluctuating input of Nb:Ti:N film modified Ti bipolar plates for proton exchange membrane water electrolyser. Corros. Sci. 2025, 249. [Google Scholar] [CrossRef]
  44. Lee, C.-H.; Lee, Y.-B.; Kim, K.-M.; Jeong, M.-G.; Lim, D.-S. Electrically conductive polymer composite coating on aluminum for PEM fuel cells bipolar plate. Renew. Energy 2013, 54, 46–50. [Google Scholar] [CrossRef]
  45. Zhang, P.; Hao, C.; Han, Y.; Du, F.; Wang, H.; Wang, X.; Sun, J. Electrochemical behavior and surface conductivity of NbC modified Ti bipolar plate for proton exchange membrane fuel cell. Surf. Coat. Technol. 2020, 397, 126064. [Google Scholar] [CrossRef]
  46. Xu, J.; Xu, S.; Munroe, P.; Xie, Z.-H. A ZrN nanocrystalline coating for polymer electrolyte membrane fuel cell metallic bipolar plates prepared by reactive sputter deposition. RSC Adv. 2015, 5, 67348–67356. [Google Scholar] [CrossRef]
Figure 1. The morphology and composition of Samples (a) S1, (b) S2 and (c) S3.
Coatings 15 00973 g001
Figure 2. XPS pattern of different NbNx coatings: (a) Nb 3d, (b) N 1s.
Coatings 15 00973 g002
Figure 3. XRD pattern of different NbNx coatings.
Coatings 15 00973 g003
Figure 4. Nano-indention results for TC4 and different NbNx coatings: (a) load–displacement curve; (b) values for H, E, H/E and H3/E2.
Coatings 15 00973 g004
Figure 5. Potentiodynamic polarization curves for TC4 substrates and different NbNx coatings in simulated environment at 70 °C.
Coatings 15 00973 g005
Figure 6. Potentiostatic polarization curves for various samples.
Coatings 15 00973 g006
Figure 7. SEM surface images of (a1,a2) TC4 and Samples (b1,b2) S1, (c1,c2) S2, (d1,d2) and S3 after potentiostatic polarization tests.
Coatings 15 00973 g007
Figure 8. XPS spectra of NbNx coatings after potentiostatic polarization tests.
Coatings 15 00973 g008
Figure 9. (a) Nyquist and (b) Bode plots for TC4 and NbNx coatings.
Coatings 15 00973 g009
Figure 10. Equivalent circuit diagrams for (a) TC4 substrate and (b) NbNx coatings.
Coatings 15 00973 g010
Figure 11. Schematic diagram of corrosion mechanism of (a) TC4 alloy and (b) NbNx coatings.
Coatings 15 00973 g011
Figure 12. ICR plots for titanium substrate and NbNx coatings.
Coatings 15 00973 g012
Figure 13. Contact angles of TC4 alloy and different NbNx coatings.
Coatings 15 00973 g013
Table 1. DGP parameters for the deposition of NbNx coatings.
Target
Voltage/V
Substrate Voltage/VWorking
Pressure/Pa
Ratio of N2/ArRenamed Samples
Nb pre-diffusion75055038//
Nb-N co-diffusion1050–1300650–7501:2S1
1:1S2
3:1S3
Table 2. OCP values and polarization data for TC4 and NbNx coatings.
SamplesOCP
(V)
Ecorr
(V)
Icorr
(A/cm2)
I0.6V
(A/cm2)
Pi
(%)
TC4−0.670−0.5361.28 × 10−41.28 × 10⁻⁴/
S10.1400.1124.14 × 10−61.05 × 10−596.77
S20.1700.1124.96 × 10−61.01 × 10−596.13
S30.1800.1314.81 × 10−68.92 × 10−696.24
Table 3. EIS parameters of bare Ti alloy and NbNx coatings.
SamplesRs
(Ω/cm2)
Rp
(Ω/cm2)
CPE2Rct
(Ω/cm2)
CPE1
C2 (μF/cm2)n2C1 (μF/cm2)n1
TC42.3926.74120.93545.558,3000.882
S12.30///166k1300.910
S22.50///203k1190.909
S32.32///737k420.924
Disclaimer/Publisher’s Note: The statements, opinions and data contained in all publications are solely those of the individual author(s) and contributor(s) and not of MDPI and/or the editor(s). MDPI and/or the editor(s) disclaim responsibility for any injury to people or property resulting from any ideas, methods, instructions or products referred to in the content.