Abstract
In the present work, the influence of technological parameters of detonation sputtering, in particular the degree of barrel filling, on the properties of chromium oxide (Cr2O3) coatings was investigated. Coatings were obtained under different sputtering conditions and analyzed comprehensively using X-ray phase analysis, optical and electron microscopy, and measurements of microhardness, porosity, and tribological characteristics. The results showed that the degree of barrel filling significantly affects the microstructure, thickness, porosity, and mechanical properties of the coatings. The sample obtained at 58% barrel filling showed the lowest porosity (0.01%), uniform distribution of chromium oxide, and the best adhesion, which makes it possible to consider this mode as optimal for the formation of wear-resistant coatings by detonation spraying.
1. Introduction
Recently, the growing potential of using Cr2O3-based ceramic coatings as wear-resistant coatings in various aerospace and automotive applications has attracted much attention to these materials [1,2,3,4]. Chromium oxide (Cr2O3) ceramic coatings are widely used as wear-, friction-, and corrosion-resistant materials on various engineering components used in aerospace, marine, chemical, paper, and pulp industries [5]. Considering the high melting point of Cr2O3, the plasma atomization method has been the most commonly used thermal atomization option for depositing these coatings. In addition, Cr2O3 coatings obtained by the plasma spray method exhibit high corrosion resistance to most acids and alkalis [6]. Due to the high melting point of Cr2O3, plasma spraying has long remained one of the most used methods for obtaining such coatings. The coatings formed by plasma spraying show excellent corrosion resistance in aggressive environments, including most acids and alkalis [7]. However, in recent years, increasing attention has been paid to detonation spraying as a promising alternative capable of forming coatings with high density, strong adhesion, and low porosity due to the high kinetic energy of the particles and the minimal thermal load on the substrate [8,9]. These characteristics make this method particularly attractive for creating wear-resistant coatings with improved mechanical and tribological properties. While most previous studies have focused on the influence of parameters such as temperature, pressure, powder chemical composition, and spraying distance, the influence of the degree of barrel filling in the detonation spraying process remains poorly studied. Meanwhile, this parameter plays an important role in the formation of the structure and properties of the coating. Its optimization is particularly relevant for strategically important areas, such as the defense and energy industries, where the strength and reliability of coatings are crucial. In view of the above, the aim of this work is to study the influence of the degree of barrel filling during detonation spraying on the microstructure, hardness, adhesion, and tribological characteristics of chromium oxide (Cr2O3) coatings in order to determine the optimal conditions for their formation.
2. Materials and Methods
Cr2O3 powder with particle diameters ranging from 15 to 45 μm (Figure 1) was used as a pulverized material. The powder has a splintered shape. The coatings were applied to AISI 316L steel specimens by detonation explosion on a CCDS2000 (LIH SB RAS, Novosibirsk, Russia) detonation unit (computer-controlled detonation spray). Figure 2 [10] shows a schematic diagram of the CCDS2000 detonation unit. The coating is applied using a detonation gun whose barrel is filled with an explosive gas mixture. A measured portion of powder is added to the barrel, and detonation is initiated by an electric spark. The detonation products heat the powder particles to their melting point and throw them at high velocity onto a part mounted in front of the gun barrel. Upon impact, micro-welding occurs, and the powder is firmly bonded (at the molecular level) to the surface of the part. After each shot, the barrel is cleaned with nitrogen to remove any detonation residue. The required thickness is increased by a successive series of shots, during which the object can be moved using a manipulator [11,12]. Different volumes of combustible gas were used to fill the barrel to obtain the Cr2O3-based coating. The maximum filling rate of the CCDS2000 barrel is 73%, which ensures stable combustion and the formation of coatings with a controlled microstructure. The atomization modes are shown in Table 1.
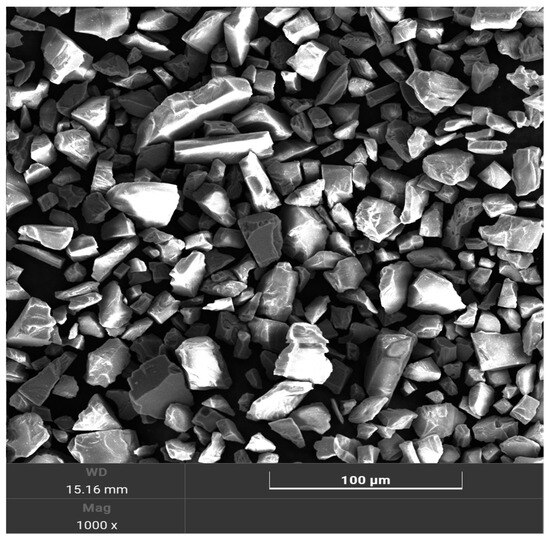
Figure 1.
SEM image of Cr2O3 powder morphology.
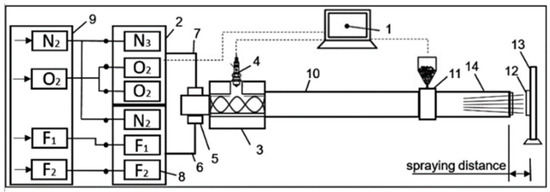
Figure 2.
Schematic diagram of the computer-installed detonation setup using CCDS2000: 1—control computer; 2—gas distributor; 3—mixing and ignition chamber; 4—spark plug; 5—barrel valve; 6—fuel line; 7—oxygen line; 8—gas valves; 9—gas supply assembly; 10—indicated part of the barrel; 11—powder dispenser; 12—blank cartridge; 13—manipulator; 14—muzzle part of the barrel [10].

Table 1.
Technological modes of spraying aluminum oxide coatings.
The specimens were fabricated in the form of rectangular plates with dimensions of 30 × 30 × 15 mm. Before coating, the surface of the specimens was carefully prepared. For this purpose, they were sanded with sandpaper with successive changes from 120 to 2500 to achieve the required smoothness and to remove oxide films and contaminants. The chemical composition of the 316L substrate is shown in Table 2.
Table 2.
Chemical composition of 316L.
After obtaining the coatings, X-ray diffraction analysis was performed on an X’pertPro diffractometer (Philips Corporation, Amsterdam, The Netherlands). Diffraction patterns were recorded using Cu-Kα radiation (λ = 2.2897 Å) at a voltage of 40 kV and a current of 30 mA. Measurements were taken over a 2θ range from 20° to 100°, and for the experiments, the step width and exposure time were set to 0.05° and 1 s for each step. The diffraction patterns were decoded using HighScore software (version 3.0e). The cross-sectional microhardness of the samples was measured by the Vickers method according to DIN EN ISO 14577-1 [13] on a Fischerscope HM2000 micrometer (Helmut Fischer, HM2000, Sindelfingen, Germany) at an indenter load of P = 300 mN and an exposure time of 15 s. Microphotographs of the coating surface were obtained using an optical microscope (Olympus Corporation, OLYMPUS BX53M, Tokyo, Japan). The surface roughness (Ra) of the coatings was estimated using the SSR300+ model. The Ra value, which is the arithmetic mean of profile deviations, was chosen as the main parameter for the evaluation of coating surface roughness.
Tribological tests for sliding friction were carried out on a TRB3 tribometer according to the standard “ball–disk” technique (international standards ASTM G 133-95 and ASTM G99). The experimental setup is shown in Figure 2. A 6.0 mm diameter ball made of 100Cr6-coated steel was used as a counterbody, with a load of 10 N and a linear velocity of 3 cm/s; the radius of the wear curve was 2 mm, and the friction path was 100 m.
The adhesion strength was tested in accordance with ASTM E4 and ISO 7500-1 [14] standards, which regulate the calibration and verification procedures for testing equipment, ensuring the reliability and reproducibility of the results. The tests were performed on a WDW-100 (Beijing United Test Co., Ltd., Beijing, China) computerized universal testing machine with a maximum force of 100 kN, designed for tensile, compression, and bending tests of various metallic and non-metallic materials. To evaluate the adhesion strength, samples with a coating in the form of cylinders with a diameter of 25 mm were used, which were glued to a steel support using high-strength epoxy adhesive. The tests were conducted in pull-off mode at a constant loading rate of 1 mm/min. Adhesion strength was calculated as the ratio of the maximum load to the bonding area.
3. Results
Figure 3 shows the X-ray diffractogram patterns of Cr2O3 coatings obtained at different barrel-filling volumes (63%, 58%, 53%). It can be seen that the main phase in the sample is Cr2O3, which is confirmed by the coincidence of its characteristic diffraction peaks with reference data from the ICDD database. The main peaks of Cr2O3 have the highest intensity, indicating its predominance in the coating composition. In most cases, the main phase in such coatings is α-Cr2O3 (corundum structure), which is due to the high thermodynamic stability of this compound at a wide range of temperatures and pressures [14,15]. According to thermodynamic data, Cr2O3 has the minimum Gibbs energy of formation among all chromium oxides (ΔG°x < 0), which contributes to its preferential formation during the oxidation of metallic chromium in oxidizing medium [16]. The processes occurring during plasma or thermal spraying are accompanied by high temperatures and the presence of oxygen, which provides intensive oxidation of Cr particles and the formation of a stable Cr2O3 phase. Thus, Cr2O3 is naturally fixed as the main phase in the obtained coating, as evidenced by the intense reflections in the X-ray diffraction patterns [17]. In addition, additional peaks corresponding to metallic chromium (Cr) are observed in the diffractogram, but their intensity is much lower, indicating its insignificant content.
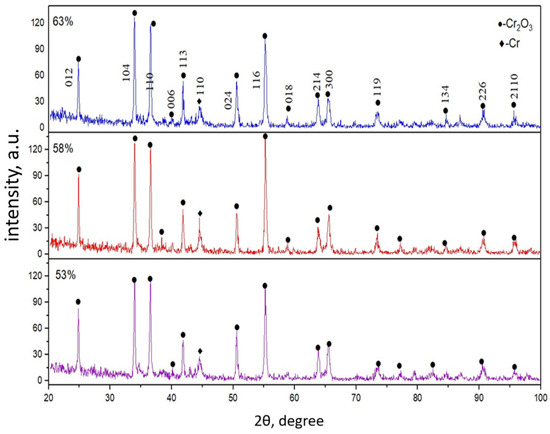
Figure 3.
Results of the X-ray phase analysis.
Table 3 shows the data on the phase composition of the coatings analyzed using the POWDERCELL full-profile analysis program (version 2.4). Experimental and calculated diffractograms were compared graphically, and the phase content in each coating, phase lattice parameters, coherent scattering regions (CSR) of the crystal, and microstress values (Δd/d × 10−3) were determined. According to the phase composition analysis (Table 3) and XRD (Figure 2), the following phases were found in the coatings: Cr2O3 and Cr. In all coatings, the crystallite size calculated using the POWDERCELL program for the Cr phase was about 27 nm, while it was different for Cr2O3 phases, as shown in Table 3. Based on the analysis of the complete X-ray profile of the Cr2O3 coatings, the percentages of the individual phases were determined. The Cr-phase contents of the A1, A2, and A3 coatings were 4.8%, 3.9%, and 4.5%, while the Cr2O3 phase contents were 95.2%, 96.1% and 95.5%, respectively.
Table 3.
X-ray phase analysis results.
Crystallographic parameters and phase identification were extracted from the ICDD PDF-2 database using the POWDERCELL full-profile analysis program (version 2.4). The detailed results are summarized in Table 4.
Table 4.
Crystallographic parameters of the phases.
Figure 4 shows the microstructures of the cross-section of A1, A2, and A3 coatings obtained at different values of the barrel filling volume (63%, 58%, 53%).
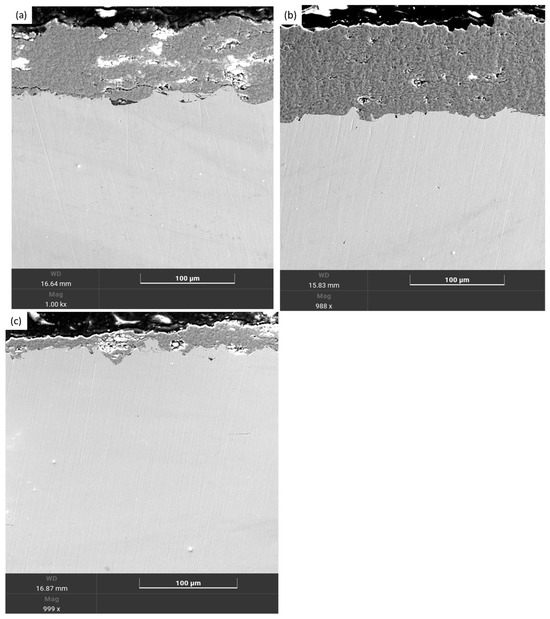
Figure 4.
SEM images of the cross-sectional morphology of Cr2O3 coatings obtained at different values of barrel-filling volume. (a) 63% (A1); (b) 58% (A2); (c) 53% (A3).
When analyzing the presented micrographs in more detail (Figure 3), differences in the thickness and porosity level of the coatings can be observed. Although the sputtering distance was 250 mm in all cases, the differences in the thickness and structure of the coatings may be related to the sputtering process parameter.
Figure 5a shows a coating with an average thickness of 39.81 μm. This may be due to a number of technological and material science factors affecting the detonation sputtering process. It can be related to the instability of the powder or gas supply, as in some cycles, there was a temporary overloading of the sputtering zone with material. This situation can lead to local accumulation of sludge, especially in the case of insufficient control of sputtering parameters in automatic or semi-automatic systems. The porosity of this sample is 0.02%. The specimen shows cracks close to the substrate. The coating in Figure 5b has a large thickness of 93.09 μm, which is higher than that of sample 1. In particular, this thickness may be due to the optimal mode of powder and gas mixture feeding, which achieves stable and uniform particle deposition on the substrate. This coating has the lowest porosity (0.01%) among all three samples. It can be seen that the number of black inclusions and voids are minimal, indicating better compaction of the coating. The coating appears dense and homogeneous with minimal defects, indicating high particle-bonding quality and optimum barrel filling for this sputtering method. The thickness of the coating shown in Figure 5c is 14.6 μm. The porosity of this sample is 0.07%, which can be attributed to the reduced particle deposition rate and insufficient kinetic energy of the powder material due to the increased barrel-filling volume.
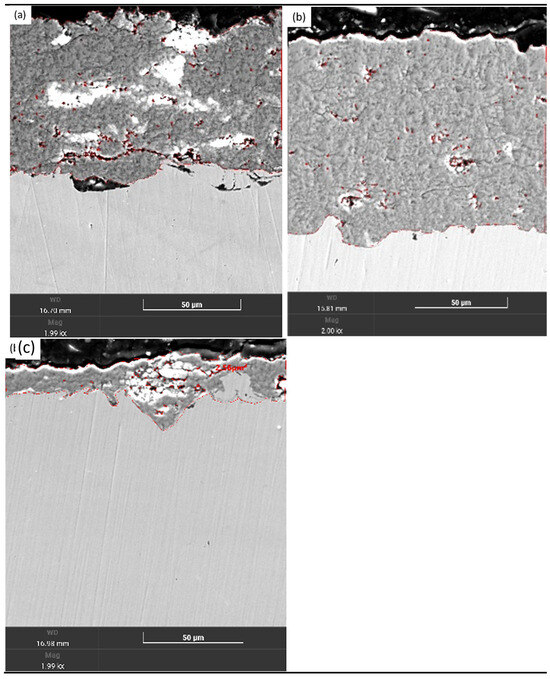
Figure 5.
SEM images of Cr2O3 cross-sections with porosity detection at different barrel-fillilng volumes. (a) 63% (A1); (b) 58% (A2); (c) 53% (A3).
The results of measuring the porosity of coatings are shown in Table 5.
Table 5.
Results of Cr2O3 coating porosity determination.
As an example, the porosity determination method is demonstrated on sample 1 (63%), as shown in Figure 5. The porosity of the Cr2O3 coating, expressed as a percentage, was calculated using the corresponding formula:
where N is the pore content, %; TA (Total Area)—total area of the coating; BA (Black Area)—total area of black areas.
SEM analysis showed that varying the barrel-filling volume during detonation sputtering has a significant effect on the formation of coatings, leading to differences in their microstructure, thickness, and porosity. The highest porosity is observed in the coating of sample A3 at 0.07%, while in sample A2, it is the lowest at 0.01%.
Figure 6 shows the distribution of elements along the cross-sectional line of the coating. Chromium is evenly distributed along the drawn line in all coatings (A1, A2, A3). However, in coating A3, compared with A2 and A1 coatings, there is a partial distribution of oxides in the areas where the pores are closer to the substrate.
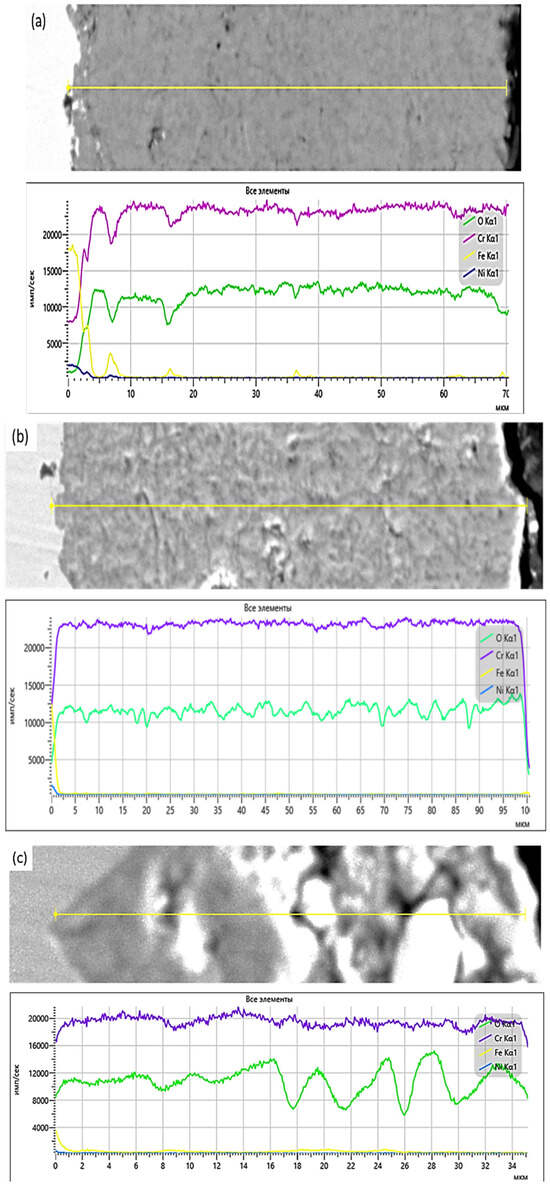
Figure 6.
Distribution of elements along the cross-sectional line of the Cr2O3 coating at different barrel-filling volumes. (a) 63% (A1); (b) 58% (A2); (c) 53% (A3).
Roughness studies (Figure 7) of the coating showed that variations in the fill volume of the barrel affected the roughness parameter (expressed in mean Ra values). The Ra values were 1.75 μm, 1.64 μm, and 1.52 μm for samples A1, A2, and A3, respectively. By varying the barrel-filling volume during the detonation spraying process, the coating surface acquired a more pronounced relief characterized by increased roughness.
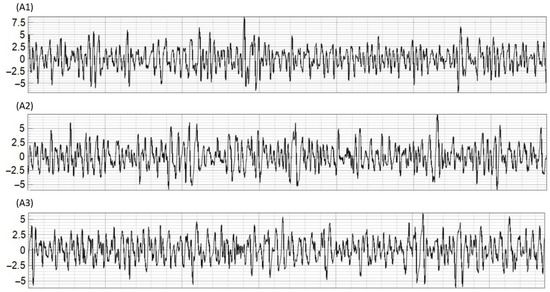
Figure 7.
Surface roughness of the Cr2O3 coating at different barrel-filling volumes: A1—63%; A2—58%; A3—53%.
Figure 8 shows a graph of the dependence of the indenter penetration depth on the applied load. The measurements were performed using the Martens method, which allows for a comprehensive assessment of the mechanical properties of coatings, including the hardness (HM) and elastic modulus (E), as well as conclusions about the nature of defects arising during the spraying process. The results show that all coatings have comparable values of elastic modulus (E), which indicates similar deformation responses of the materials under loading. However, there are significant differences in hardness: sample A2 demonstrates the highest hardness, while samples A1 and A3 have lower values. This difference may be due to a number of factors: firstly, differences in detonation spraying parameters, in particular the barrel-filling volume, which affects the velocity and temperature of the particles and, thus, the density and uniformity of the layer; secondly, the microstructural features of the formed coatings, such as grain size, the presence of pores, and the degree of compaction; thirdly, possible differences in the thermomechanical effects accompanying the spraying process, including temperature gradients, residual stresses, and phase transformations. Thus, the inclusion of Young’s modulus (E) analysis allows for a more in-depth interpretation of differences in the mechanical behavior of coatings and reveals the influence of technological parameters on the final properties of the material.
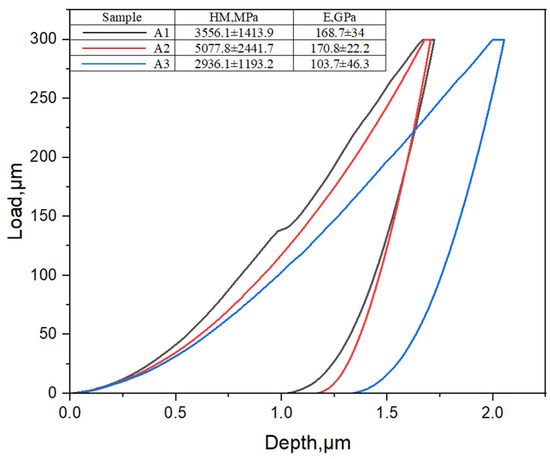
Figure 8.
Dependence of the indenter penetration depth in samples A1, A2, and A3 on the applied load.
Analysis of the results of the adhesion strength test of coatings (Figure 9), presented in the form of graphs of load versus time, allows for qualitative conclusions to be drawn about the nature of the bond between the coating and the substrate under various detonation spraying conditions. As can be seen in Figure 9, sample A1 demonstrated the highest adhesive strength, with a maximum load at failure of approximately 17 kN. It is noteworthy that despite the presence of microcracks in the coating, these did not significantly affect the resistance to delamination. This may indicate effective interphase adhesion due to the high velocity and energy of the particles, dense packing, and the possible formation of a gradient transition zone capable of redistributing stresses [18,19]. In contrast, sample A2 is characterized by significantly lower adhesion strength: failure occurred at a load of about 9 kN. This may be due to insufficient coating density, weaker interphase contact, or reduced kinetic energy of the particles, leading to the formation of weakly bonded areas and local delamination. Sample A3 reached a maximum load of about 12 kN, but failure occurred earlier—at about the 65th second of the test—which may indicate the presence of residual stresses, heterogeneity in the coating structure, or a brittle failure mechanism [20].
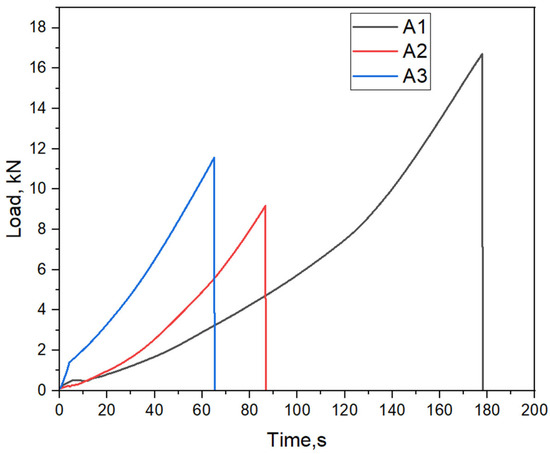
Figure 9.
Results of the adhesion strength test of the Cr2O3 coatings at different barrel-filling volumes. (A1) 63%; (A2) 58%; (A3) 53%.
The observed differences in adhesive strength are apparently due to variations in the volume of the barrel filled with the combustible mixture during detonation spraying, which affects the dynamics of the detonation process—in particular, the particle velocity, temperature, and pressure at the shock-wave front [15]. These parameters directly affect the degree of particle sintering, the morphology of the coating, and the strength of the interphase interaction. The data obtained also indicate that high adhesion strength can be achieved even in the presence of local microdefects if the technological parameters ensure intense plastic deformation, dense packing, and good adhesion to the substrate. Thus, microcracks are not always critical for adhesion, especially if they are superficial, do not penetrate deeply, do not spread throughout the contact area, and are compensated for by a strong interphase connection [21]. This highlights the importance of optimizing spraying parameters, in particular the volume of the combustible mixture and the powder feed rate, to obtain coatings with high adhesion [22].
Figure 10 shows the dependence of the friction coefficient on the traveled distance for the three tested coating samples (A1, A2, and A3) obtained at different barrel-filling volumes (68%, 58%, and 53%, respectively). As can be seen from the graph, the change in the coefficient of friction for each sample passes through two characteristic stages: the initial stage, with a gradual increase in the coefficient of friction, and the subsequent stage of stabilization, in which the coefficient of friction remains at an almost constant level.
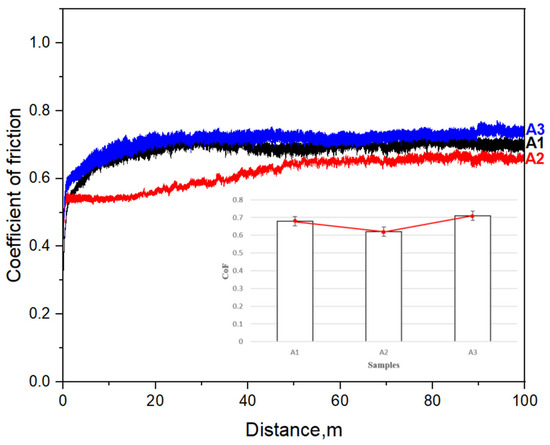
Figure 10.
Results of tribological tests of coatings: friction coefficient.
Within the first 10–15 m of travel, all three samples show an increase in the friction coefficient, which is associated with the process of surface dressing and adaptation of the contacting surfaces to the friction conditions. At this stage, there is an alignment of the microroughness components and the formation of a stable contact layer. Sample A2, obtained at an average filling volume (58%), shows the lowest stabilized coefficient of friction of about 0.62. Sample A1 (68%) is characterized by an intermediate value of about 0.68. The highest coefficient of friction (~0.75) is observed for sample A3, sputtered at the lowest fill (53%), which may indicate an increased roughness or less dense coating structure. Thus, the obtained data show that the parameters of detonation spraying, in particular the degree of filling of the chamber volume, have a significant influence on the frictional properties of the coating. The optimal combination of technological conditions contributes to the reduction in the friction coefficient and increases the stability of tribological characteristics.
At the initial stage of friction, all samples show a sharp increase in the coefficient of friction, which is due to the presence of microroughness, pores, and other defects resulting from the spraying process. These defects are partially destroyed during the first contact with the wear body, creating an unstable contact zone. The increased friction at this stage is due to the mechanical interaction between the protruding areas of the coating and the wear bodies, as well as by the possible formation of wear particles that act as abrasives. Further friction leads to leveling and compaction of the surface layer of the coating, which contributes to the transition to a stable friction regime. In the second stage, after passing about 15–20 m, the friction coefficient for all specimens reaches stationary values and remains practically unchanged until the end of the test. This indicates the completion of the adaptation processes and the formation of a stable contact layer. This layer plays a key role in stabilizing tribological characteristics, preventing further intensive surface destruction and reducing the amplitude of friction coefficient fluctuations. Comparative analysis of stabilized values of the friction coefficient shows that sample A3 shows the highest value—about 0.72—which indicates a more developed microrelief structure and increased surface roughness caused by the least optimal spraying parameters. Sample A1, obtained at intermediate filling parameters, has an intermediate coefficient of friction of about 0.67. The lowest value of the coefficient of friction was recorded for sample A2—about 0.63—which may be due to the denser, more homogeneous, and smoother coating structure, which contributes to the reduction in the friction force.
The obtained results allow us to conclude that the technological parameters of spraying have a significant influence on the tribological properties of coatings. The formation of a stable and dense contact layer provides resistance to wear and reduces the coefficient of friction, while a defective or rough surface increases friction resistance. Thus, the A2 specimen can be considered optimal in terms of wear resistance and friction characteristics.
4. Conclusions
In this work, a comprehensive study of the influence of a technological parameter—the degree of barrel filling—on the structure and properties of chromium oxide (Cr2O3) coatings obtained by detonation sputtering was carried out. The use of modern analysis methods, such as optical and scanning electron microscopy, X-ray phase analysis, as well as measurements of microhardness, porosity, and tribological characteristics, made it possible to characterize in depth the obtained coatings.
The results showed that an increase in the degree of barrel filling is accompanied by changes in coating thickness, porosity, microstructure, and phase composition. The most stable and reproducible characteristics were obtained at a degree of filling of 58%, which allowed for the formation of a coating with the lowest porosity (0.01%), high microhardness, and a uniform distribution of chromium oxide particles. In addition, it was in this mode that the best adhesion of the coating to the substrate was achieved, as well as good tribological characteristics, which is especially important in applications with increased loads and wear.
Thus, the degree of barrel filling is a critical parameter that has a complex influence on coating properties. Optimization of this parameter makes it possible to significantly improve the quality of sprayed coatings, which makes detonation spraying a promising technology for creating wear-resistant, corrosion-resistant, and heat-resistant coatings. The results obtained may be useful for further improvements in the technology of chromium oxide coating deposition and for the expansion of their application in mechanical engineering, power engineering, aerospace, and other industries.
Author Contributions
B.R. and D.K.: formal analysis, supervision, writing—review and editing; A.M.: investigation, methodology; Y.T.: resources, data curation. All authors have read and agreed to the published version of the manuscript.
Funding
This study was funded by the Committee of Science of the Ministry of Science and Higher Education of the Republic of Kazakhstan (grant NO. BR24992870).
Institutional Review Board Statement
Not applicable.
Informed Consent Statement
Not applicable.
Data Availability Statement
Data are contained within this article.
Conflicts of Interest
The authors declare no conflicts of interest.
References
- Ahn, H.-S.; Kwon, O.-K. Tribological Behavior of Plasma-Sprayed Chromium Oxide Coating. Wear 1999, 225–229, 814–824. [Google Scholar] [CrossRef]
- Wang, Y.; Jin, Y.; Wen, S. The Analysis of the Friction and Wear Mechanisms of Plasma-Sprayed Ceramic Coatings at 450 °C. Wear 1988, 128, 265–276. [Google Scholar] [CrossRef]
- Kitsunai, H.; Hokkirigawa, K.; Tsumaki, N.; Kato, K. Transitions of Microscopic Wear Mechanism for Cr2O3 Ceramic Coatings during Repeated Sliding Observed in a Scanning Électron Microscope Tribosystem. Wear 1991, 151, 279–289. [Google Scholar] [CrossRef]
- Yinglong, W. Friction and Wear Performances of Detonation-Gun- and Plasma-Sprayed Ceramic and Cermet Hard Coatings under Dry Friction. Wear 1993, 161, 69–78. [Google Scholar] [CrossRef]
- Cellard, A.; Garnier, V.; Fantozzi, G.; Baret, G.; Fort, P. Wear Resistance of Chromium Oxide Nanostructured Coatings. Ceram. Int. 2009, 35, 913–916. [Google Scholar] [CrossRef]
- Zamani, P.; Valefi, Z. Microstructure, Phase Composition and Mechanical Properties of Plasma Sprayed Al2O3, Cr2O3 and Cr2O3-Al2O3 Composite Coatings. Surf. Coat. Technol. 2017, 316, 138–145. [Google Scholar] [CrossRef]
- Goyal, K.; Singh, D.; Singh, H.; Singh, C. High Temperature Corrosion Behaviour of ZrO2 Reinforced Cr2O3 Composite Coatings in Molten Salt Environment. Anti-Corros. Methods Mater. 2023, 70, 189–196. [Google Scholar] [CrossRef]
- Yang, X.; Zeng, J.; Zhang, H.; Wang, J.; Sun, J.; Dong, S.; Jiang, J.; Deng, L.; Zhou, X.; Cao, X. Correlation between Microstructure, Chemical Components and Tribological Properties of Plasma-Sprayed Cr2O3-Based Coatings. Ceram. Int. 2018, 44, 10154–10168. [Google Scholar] [CrossRef]
- Fauchais, P.; Rat, V.; Coudert, J.-F.; Etchart-Salas, R.; Montavon, G. Operating Parameters for Suspension and Solution Plasma-Spray Coatings. Surf. Coat. Technol. 2008, 202, 4309–4317. [Google Scholar] [CrossRef]
- Rakhadilov, B.K.; Buitkenov, D.B.; Rakhadilov, M.K. Tribological Properties of Al2O3Coatings Obtained by Detonation. IOP Conf. Ser. Mater. Sci. Eng. 2021, 1079, 052035. [Google Scholar] [CrossRef]
- Kantay, N.; Rakhadilov, B.; Kurbanbekov, S.; Yeskermessov, D.; Yerbolatova, G.; Apsezhanova, A. Influence of Detonation-Spraying Parameters on the Phase Composition and Tribological Properties of Al2O3 Coatings. Coatings 2021, 11, 793. [Google Scholar] [CrossRef]
- Ulianitsky, V.; Shtertser, A.; Zlobin, S.; Smurov, I. Computer-Controlled Detonation Spraying: From Process Fundamentals Toward Advanced Applications. J. Therm. Spray Technol. 2011, 20, 791–801. [Google Scholar] [CrossRef]
- ISO14577-1; Metallic Materials—Instrumented Indentation Test for Hardness and Materials Parameters. International Organization for Standardization: Geneva, Switzerland, 2002.
- ISO 7500-1; Metallic Materials—Calibration and Verification of Static Uniaxial Testing Machines—Part 1: Tension/Compression Testing Machines - Calibration and Verification of the Force-Measuring Syste. International Organization for Standardization: Geneva, Switzerland, 2018.
- Pawlowski, L. The Science and Engineering of Thermal Spray Coatings; John Wiley & Sons: Hoboken, NJ, USA, 2008; ISBN 978-0-470-75407-8. [Google Scholar]
- Fauchais, P.; Vardelle, A.; Dussoubs, B. Quo Vadis Thermal Spraying? J. Therm. Spray Technol. 2001, 10, 44–66. [Google Scholar] [CrossRef]
- Kubaschewski, O.; Slough, W. Recent Progress in Metallurgical Thermochemistry. Prog. Mater. Sci. 1969, 14, 3–54. [Google Scholar] [CrossRef]
- Lima, R.S.; Marple, B.R. Thermal Spray Coatings Engineered from Nanostructured Ceramic Agglomerated Powders for Structural, Thermal Barrier and Biomedical Applications: A Review. J. Therm. Spray Technol. 2007, 16, 40–63. [Google Scholar] [CrossRef]
- Ulyanitsky, V.Y.; Nenashev, M.V.; Kalashnikov, V.V. Experience of Research and Application of Detonation Coating Technology. Izv. Samara Sci. Cent. Russ. Acad. Sci. 2010, 12, 569–575. [Google Scholar]
- Hazir, E.; Koc, K.H.; Baray, S.A.; Esnaf, S. Improvement of adhesion strength for wood-based material coating process using design of experiment methodology. Eur. J. Wood Wood Prod. 2020, 78, 301–312. [Google Scholar] [CrossRef]
- Thermal Sprayed Coatings Used Against Corrosion and Corrosive Wear. In Advanced Plasma Spray Applications; InTech: London, UK, 2012; ISBN 978-953-51-0349-3.
- Sirota, V.V.; Savotchenko, S.E.; Strokova, V.V.; Bondarenko, D.O.; Podgorny, D.S. Influence of the technological conditions of detonation coatings application on their phase composition. Nanobuild 2024, 16, 404–414. [Google Scholar] [CrossRef]


Disclaimer/Publisher’s Note: The statements, opinions and data contained in all publications are solely those of the individual author(s) and contributor(s) and not of MDPI and/or the editor(s). MDPI and/or the editor(s) disclaim responsibility for any injury to people or property resulting from any ideas, methods, instructions or products referred to in the content. |
© 2025 by the authors. Licensee MDPI, Basel, Switzerland. This article is an open access article distributed under the terms and conditions of the Creative Commons Attribution (CC BY) license (https://creativecommons.org/licenses/by/4.0/).